
Anomalous Dynamics in Macromolecular Liquids


Department of Chemistry and Biochemistry, Institute for Fundamental Science and Material Science Institute, University of Oregon, Eugene, OR 97403, USA
Polymers 2022, 14(5), 856; https://0-doi-org.brum.beds.ac.uk/10.3390/polym14050856
Submission received: 25 December 2021
/
Revised: 6 February 2022
/
Accepted: 18 February 2022
/
Published: 22 February 2022
(This article belongs to the Special Issue Theory and Simulation of Polymer Dynamics)
Abstract
:Macromolecular liquids display short-time anomalous behaviors in disagreement with conventional single-molecule mean-field theories. In this study, we analyze the behavior of the simplest but most realistic macromolecular system that displays anomalous dynamics, i.e., a melt of short homopolymer chains, starting from molecular dynamics simulation trajectories. Our study sheds some light on the microscopic molecular mechanisms responsible for the observed anomalous behavior. The relevance of the correlation hole, a unique property of polymer liquids, in relation to the observed subdiffusive dynamics, naturally emerges from the analysis of the van Hove distribution functions and other properties.
1. Introduction
The dynamics of synthetic and natural macromolecular fluids (e.g., polymer melts [1], proteins [2,3,4,5], DNAs [6,7,8], and cellular microfilaments [9]) is described conventionally by mean-field theories of single-molecule motion. The underlying assumption in these approaches is that the relaxation of the surrounding fluid occurs on a different timescale compared to the dynamics of the tagged molecule. When this hypothesis holds, it is possible to derive a single-chain equation of motion by projecting, through Mori–Zwanzig techniques [10], the dynamics of the entire fluid onto a set of slow relevant variables (here, the coordinates of the tagged chain). The single-chain equation of motion is a generalized Langevin equation that, in the limit of completely flexible polymers and when the memory function is discarded, reduces to the popular Rouse equation of motion for the dynamics of unentangled polymer melts [11,12,13]. The Rouse model provides a simple description of chain dynamics for long polymer chains (the degree of polymerization is assumed to go to infinity), while predicting the scaling exponents of chain dynamics in remarkable agreement with experiments [1,14]. To introduce a more realistic description of the polymer chains, the Rouse model has been modified by adopting intramolecular chain distributions that include local semiflexibility [15], which accounts for the complex nature of local energy barriers [16,17], and monomer-dependent friction coefficients [18,19]. Furthermore, monomer fluctuations that are harmonic in a body-centered description of the dynamics, are intrinsically anharmonic in the lab reference system of a Rouse-like description due to the coupling of internal fluctuations with the molecular rotational and translational dynamic [20,21]. Summarizing, the simple mean-field formalism of the Rouse model provides a useful general description of the polymer dynamics, which one can improve by including a more realistic molecular description than the typical chain of beads connected by harmonic springs. Nevertheless, the fundamental hypothesis of the separation of timescales that motivates the Rouse formalism, i.e., a Langevin equation in the lab-frame for the monomer (beads) coordinates, becomes questionable when describing systems where the “solute” and the “solvent” relax on the same timescale [22].
The hypothesis of the separation of timescales for the dynamics of one polymer chain with respect to its surroundings, which is the fundamental hypothesis in the Mori–Zwanzig projection operator method, holds for macromolecular systems in dilute solutions of small-molecule solvents, where the slowest timescale of relaxation is reduced by the small size of the solvent molecules. However, its validity may require further scrutiny for concentrated polymer solutions [22], melts [14,23,24], blends [25,26], and particles in crowded cellular environments [27,28]. For these systems, experimental and computational data show discrepancies with the theoretical predictions, which are conventionally termed “anomalous dynamics”. In this work, we investigate the microscopic physical picture behind anomalous dynamics and relate this picture to a theoretical model, i.e., an extended Rouse equation, for a subensemble of slowly moving, interacting chains undergoing cooperative dynamics, where “solute” and “solvent” relax on the same timescale [29,30,31]. We focus on the simplest realistic macromolecular fluid that exhibits this general behavior, i.e., a melt of short homopolymer chains well above its glass transition. From the analysis of molecular dynamics (MD) simulations of unentangled polyethylene (PE) melts, we propose an intuitive physical explanation for the observed anomalous dynamics.
2. Materials and Methods
We analyzed united atom MD simulation trajectories of unentangled, linear polyethylene (PE) melts with an increasing number of units (N = 10, 16, 30, 44, 66, and 96), using data from the literature [25,26,32], and from our own simulations [33,34,35,36], where the entanglement molecular weight Ne = 130. MD simulations were performed in the canonical ensemble in a cubic box with periodic boundary conditions in the three dimensions. More details on the simulations are available in the referenced papers [25,26,33,34,35,36]. Here, we present the results for two systems: N = 30 at density and temperature T = 400 K, and N = 96 at density and temperature T = 448 K. Both follow intramolecular Gaussian chain statistics. The first represents a system far from the entanglement crossover and the second a system close to it. All the samples and the chain lengths we studied display similar behavior so that the results of this analysis are general and pertinent to polymer melts. Note that polymer melts with different monomeric architectures show anomalous dynamics consistent with the results presented here [37].
3. Results
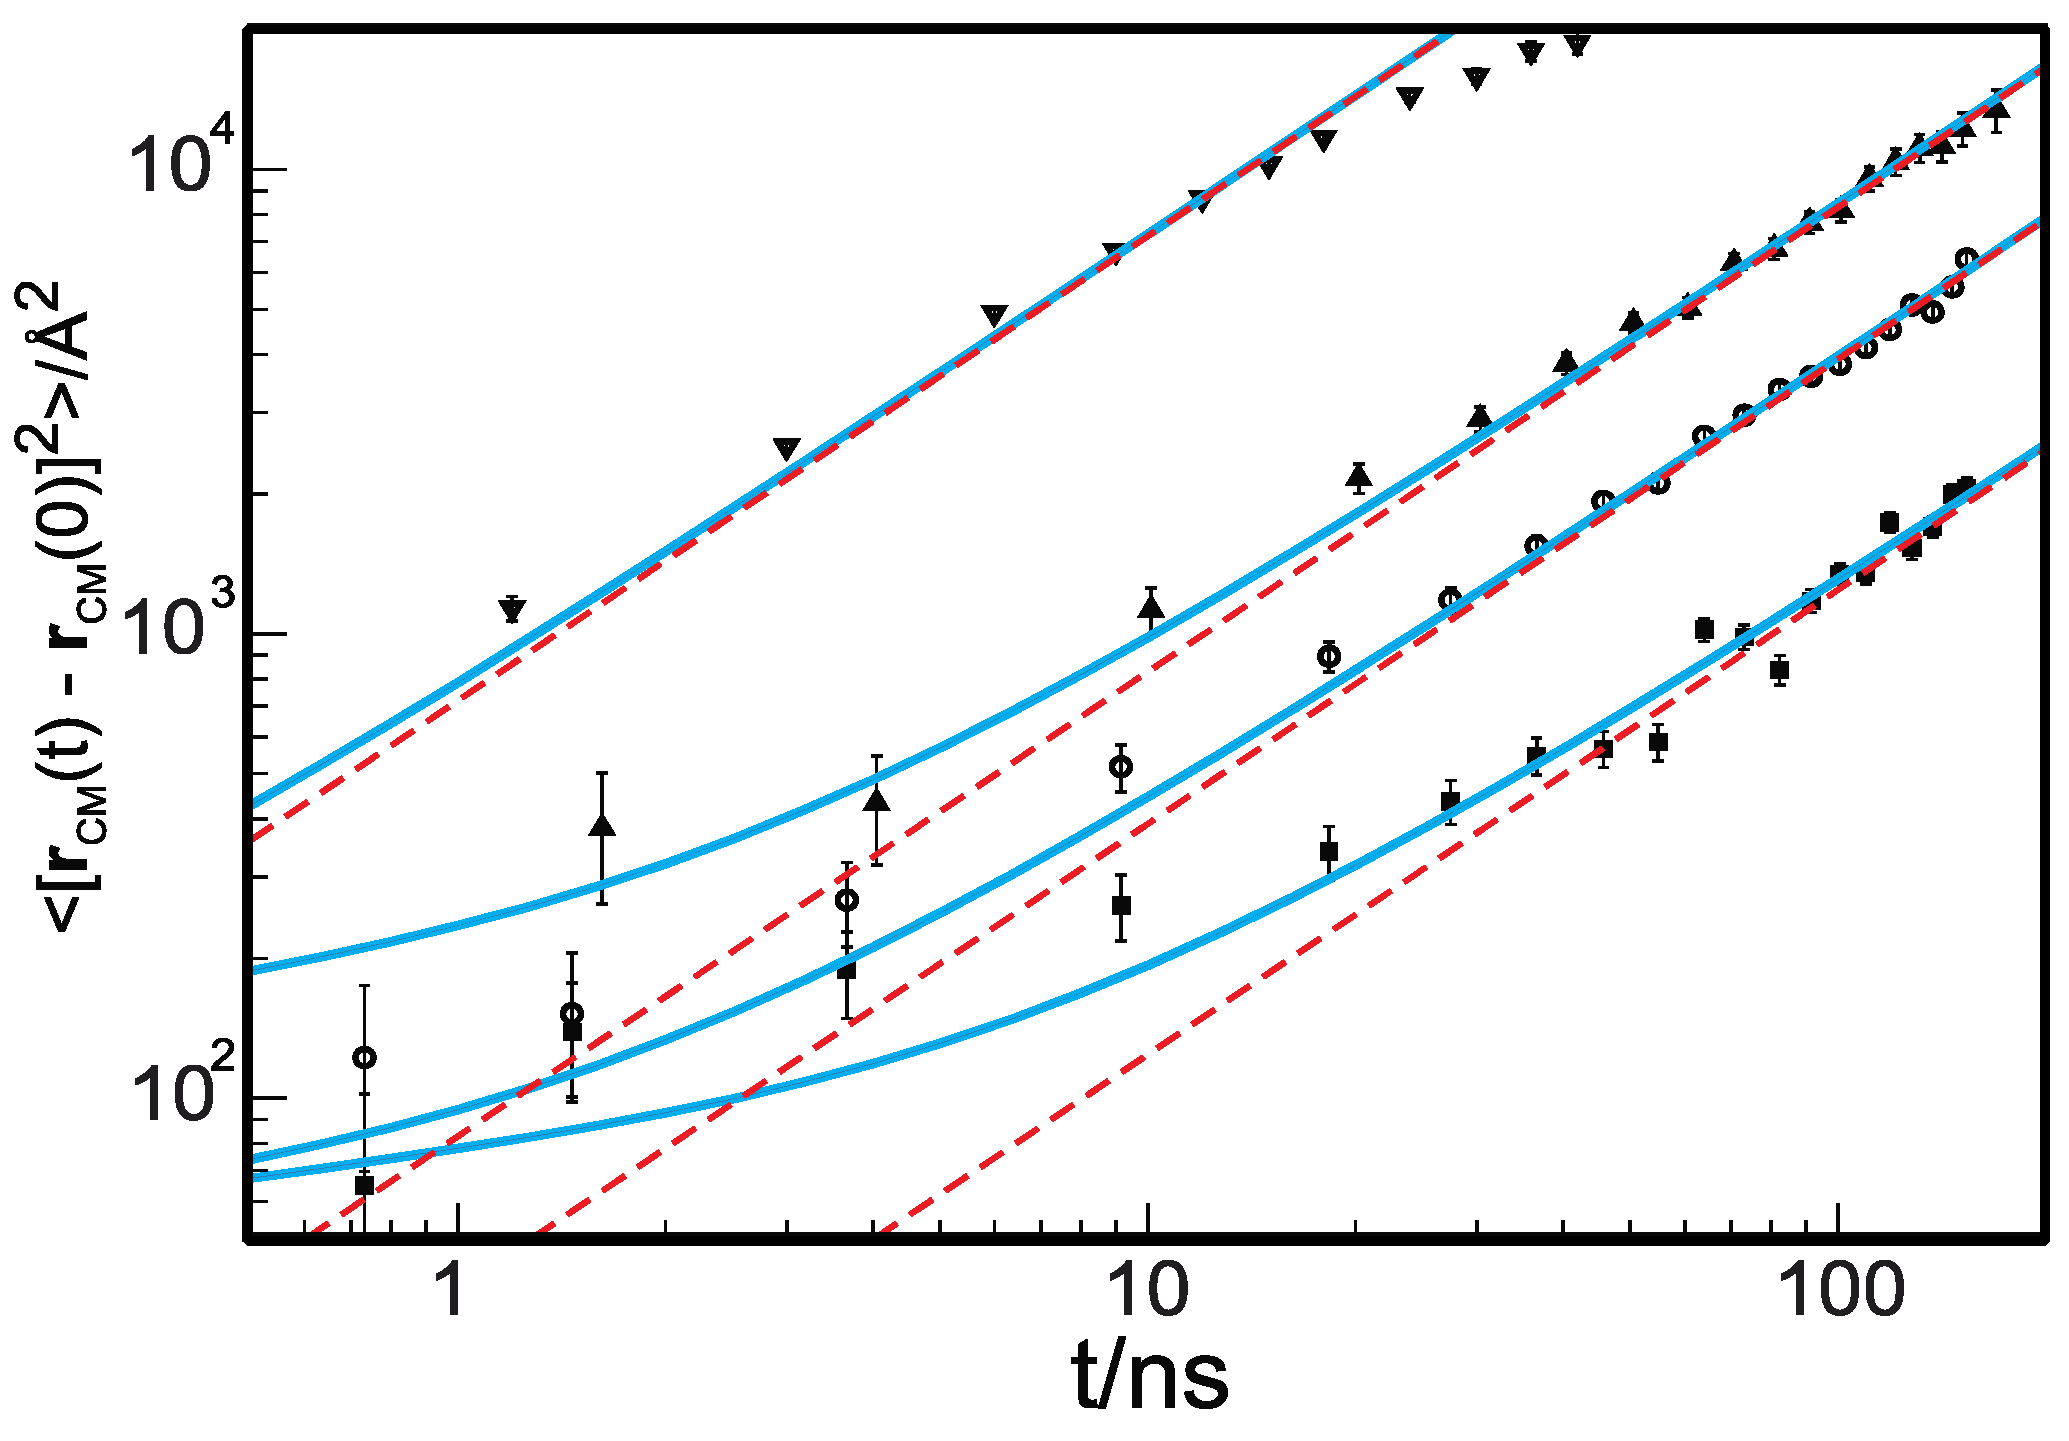
The single-chain Rouse equation correctly predicts the scaling with the degree of polymerization, , of the diffusion coefficient, , and shear viscosity [1,14]. However, the Rouse equation does not describe the anomalous dynamics observed in the short-time regime [14,23,38] when one samples the dynamics at time intervals , where is the longest intramolecular relaxation time. Thus, the longest Rouse time is the time a molecule requires to diffuse a distance comparable to its dimension, . The radius of gyration, , is defined for long chains (obeying Gaussian statistics) as , and l is the statistical segment length. The Rouse equation is compatible with a freely jointed chain representation [1], where for and [39]. Experimentally observed anomalous dynamical behavior in unentangled polymer melts includes (i) subdiffusive center-of-mass (c.o.m.) dynamics, (ii) anomalous segmental diffusion, and (iii) stretched exponential decay of local and global normal modes of motion. Figure 1 displays the mean-squared displacement of the center of mass of polyethylene, measured at , density , and with an increasing degree of polymerization, , and , measured by neutron spin echo (NSE) [40,41]. The symbols represent the experimental data, and the red dashed lines are the Rouse diffusive c.o.m. dynamics. Clearly, NSE experiments show that the dynamics at times shorter than the Rouse longest relaxation time are subdiffusive.
The direct observation of the center-of-mass trajectories from MD simulations, sampled for , shows that every single polymer’s c.o.m. undergoes transient periods of small-amplitude motion followed by periods of large-amplitude displacements (see an example in Figure 2). At any instant, molecules are partitioned between mobile and less mobile sub-populations, but the identity of the molecules assigned to either group changes in time. These features recall the anomalous dynamics observed in undercooled “fragile” glass-forming liquids. Thus, we apply the conventional analysis of anomalous dynamics for undercooled liquids to the trajectories from the polymer melt simulations. Note that the temperatures in the canonical simulations are higher than the glass transition temperature of linear polyethylene () [42].
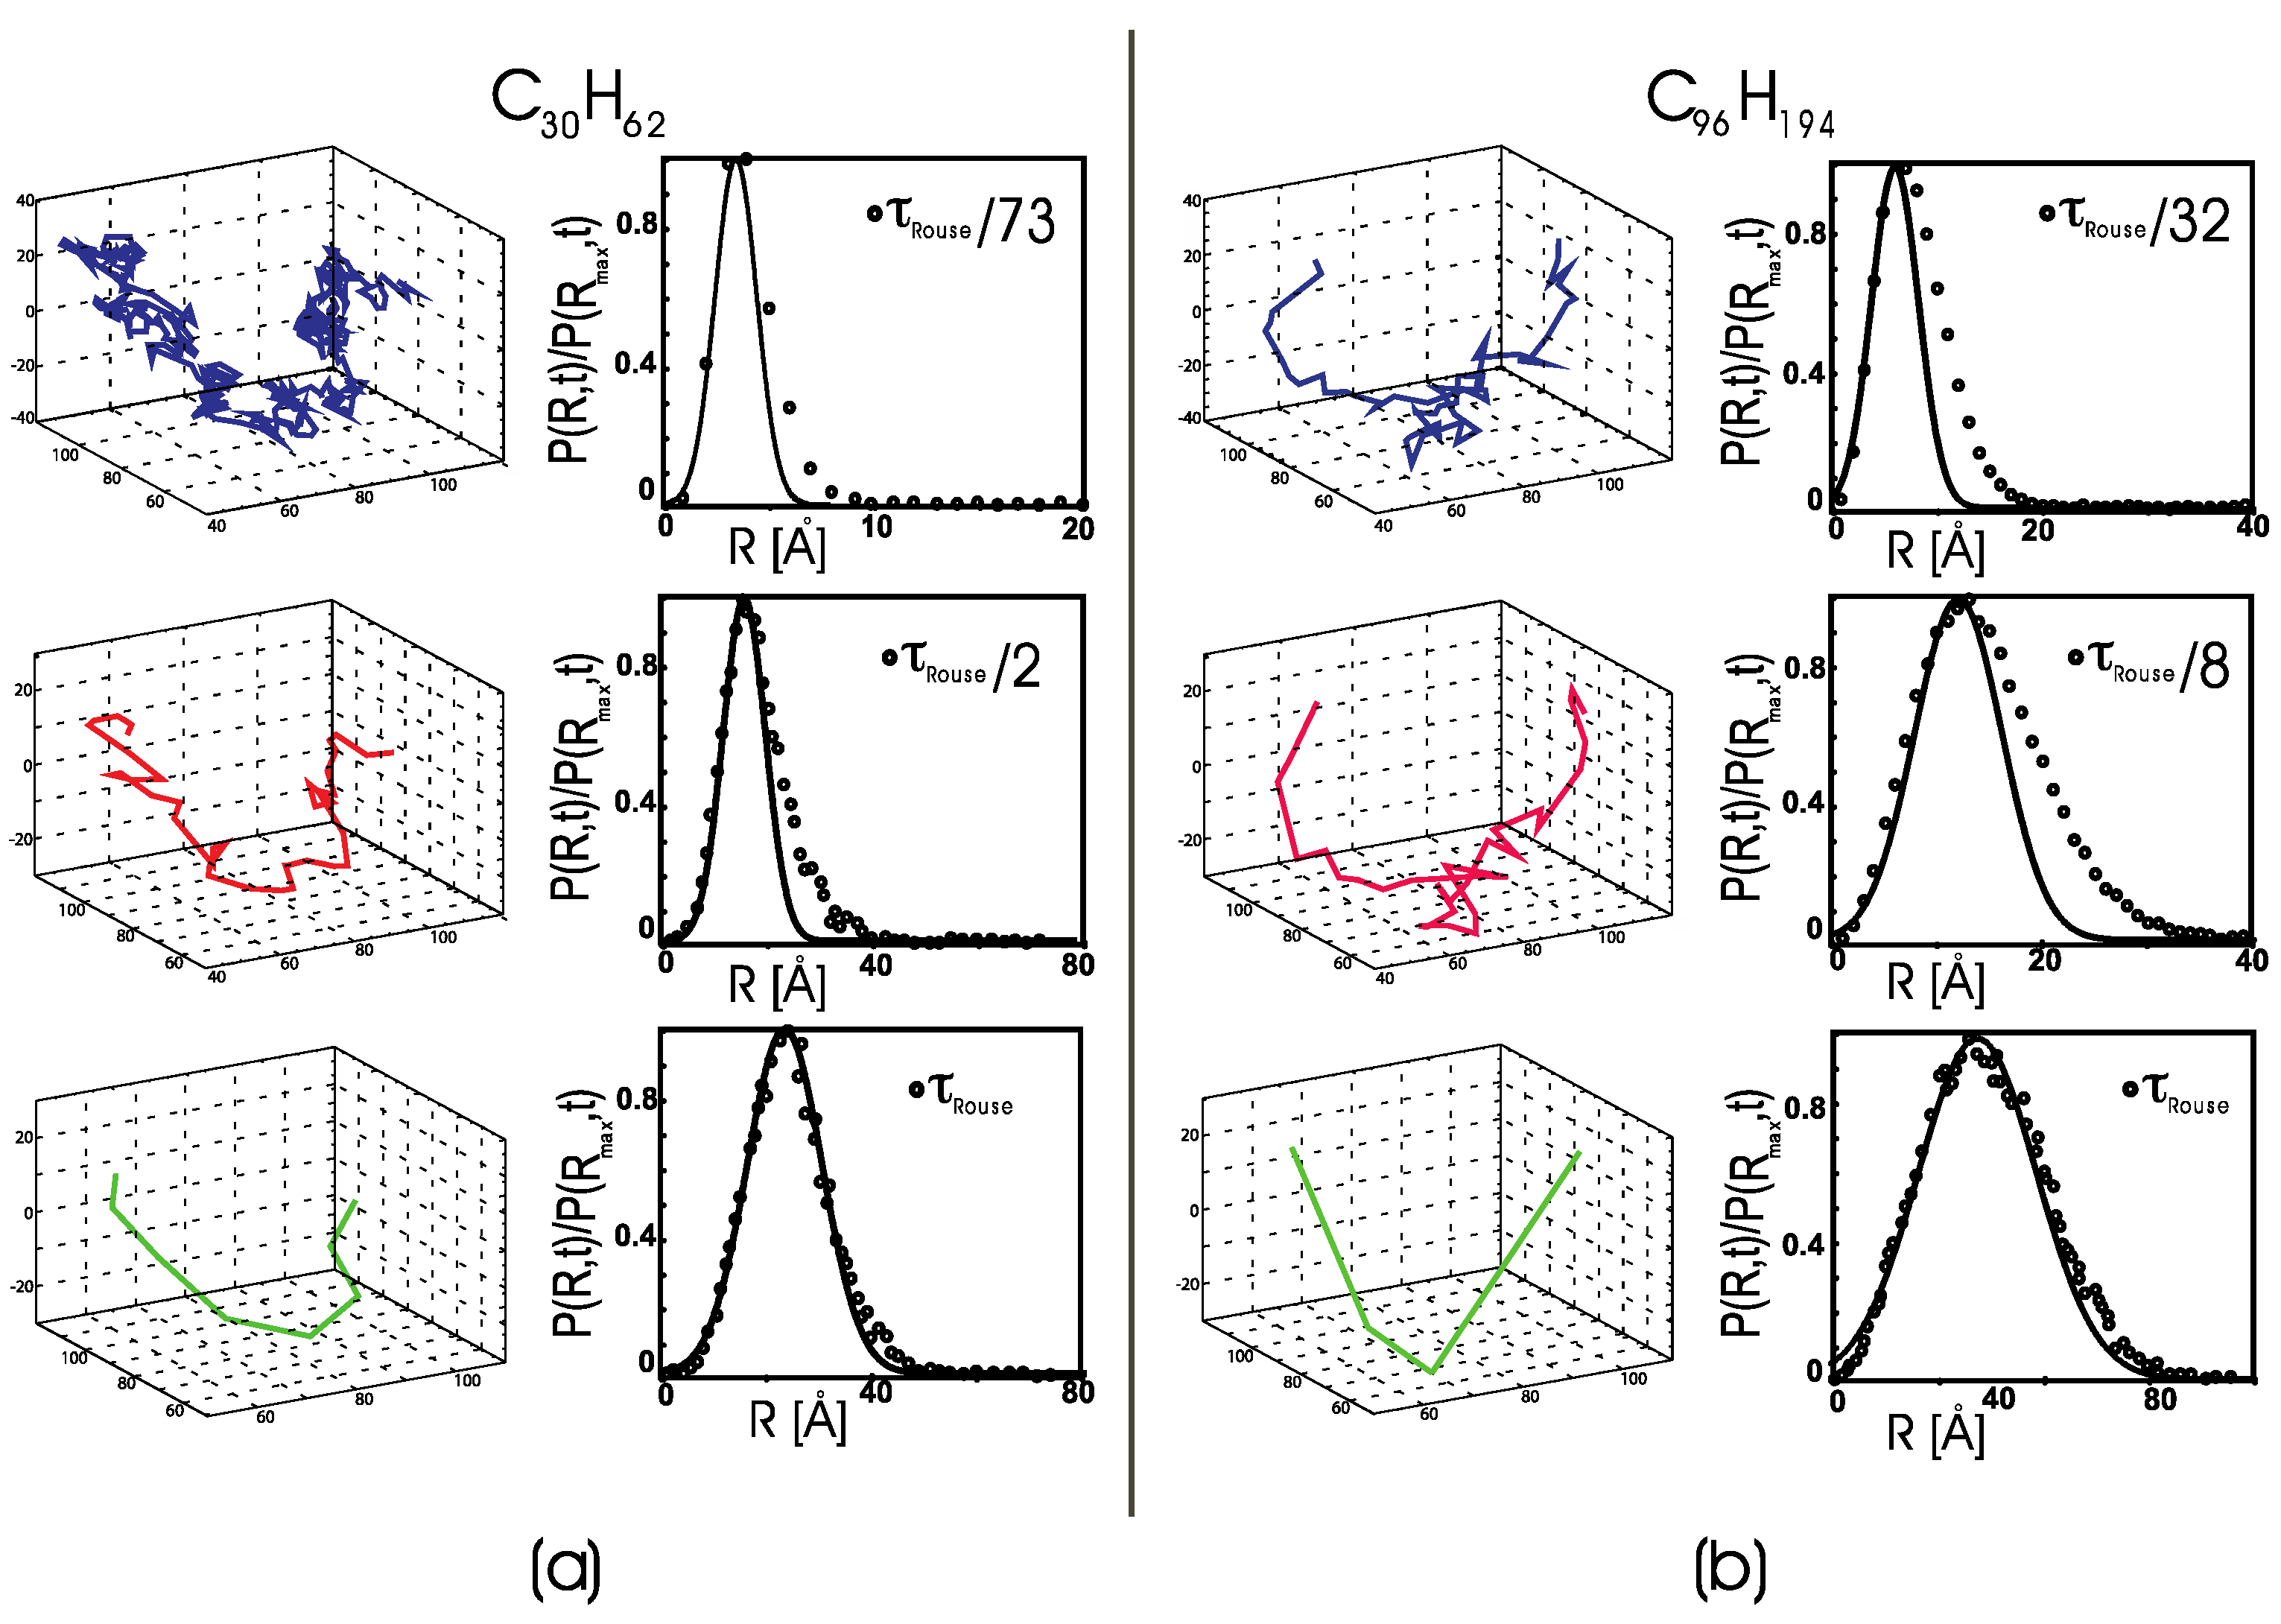
To quantitatively characterize the heterogeneous dynamics as a function of the length of the time interval, we calculated the distribution of the center-of-mass displacement for each molecule i, , at a given time interval , where, for convenience, we set . The displacement distributions should follow a single-mode Gaussian function if the center-of-mass dynamics were purely diffusive (i.e., a Brownian motion). Figure 2a compares for a melt of C30H62 chains to a sample chain’s center-of-mass trajectory, where both are analyzed at the same fixed time interval.
We start from a time interval much shorter than and then we increase the time interval until we reach the longest Rouse relaxation time (from top to bottom in the figure).
When is small and corresponding to a fraction of (here, ), the motion of the molecule’s c.o.m. alternates from fluctuations in a limited spatial region, i.e., the so-called “caged” dynamics, to large, directional displacements. For larger time intervals with , the trajectory is still dynamically heterogeneous, with alternating periods of confined and free dynamics. The corresponding distributions, P(R,t), show a non-Gaussian tail in the large-displacement region due to fast dynamical processes, which is the second signature of heterogeneous dynamics. At ( for C30H62), the distribution becomes Gaussian, and the c.o.m. motion becomes diffusive. Accordingly, the dynamical heterogeneities are averaged out at this time interval, and the c.o.m. trajectory follows a Brownian motion.
Figure 2b displays a similar behavior for the C96H194 sample. The normalized probability distribution shows that some molecules undergo a slow diffusive motion, represented by a Gaussian distribution when sampled at a short time interval. In contrast, others undergo a fast large-displacement diffusion, corresponding to the tail in the weighted probability distribution. The nature of the slow diffusive motion becomes clear when one compares the distributions sampled at increasing time intervals. At (bottom panels), the polymer c.o.m. trajectory becomes diffusive, and the distribution of displacements is well represented by a Gaussian function. Note that the anomalous dynamics trajectory follows a three-dimensional path, which appears to be different from a Lévy flight (not a heavy-tailed distribution). The trajectory suggests a complex free energy landscape with several minima, where the molecule tends to localize (small displacement), and which are separated by energy barriers that the molecule overcomes, thereby undergoing large displacements. This description agrees with the probability distribution, , where one observes at least two populations, one with molecules undergoing slow dynamics and a tail with molecules undergoing fast dynamic. At the given time interval of sampling, the logarithm of the probability distribution, , gives the normalized free energy as a function of the chain displacement. Thus, the population of chains that undergo large displacements is smaller and energetically less favorable than the population undergoing a slow diffusion. Further analysis of the energetics is reported towards the end of this manuscript, where we show how rare, large-scale displacements correlate with energetically unfavorable chain stretching for the C96H194 sample.
Note that the trajectories reported here for one chain represent the dynamics of all the polymers in the simulation box and are similar for all the simulated systems. We observe that, while the polymers are partitioned into slow- and fast-diffusing molecules when sampled at short time intervals, for a time interval , the population becomes uniform, and the system becomes ergodic. The features detected in this analysis are in accord with the mechanisms of anomalous dynamics observed in undercooled “fragile” glass-forming liquids [43,44]. However, our fragile systems are not undercooled. The presence of these dynamical anomalies seems to be related to the competition between chain connectivity and intermolecular excluded volume interactions, which induces frustration and an anomalous slowing down of global dynamics even far from the glass transition. The competition between these two effects is unique to polymer melts and polymers in concentrated solutions, and is the physical origin of the “correlation hole” in the structure of polymer melts [45,46].
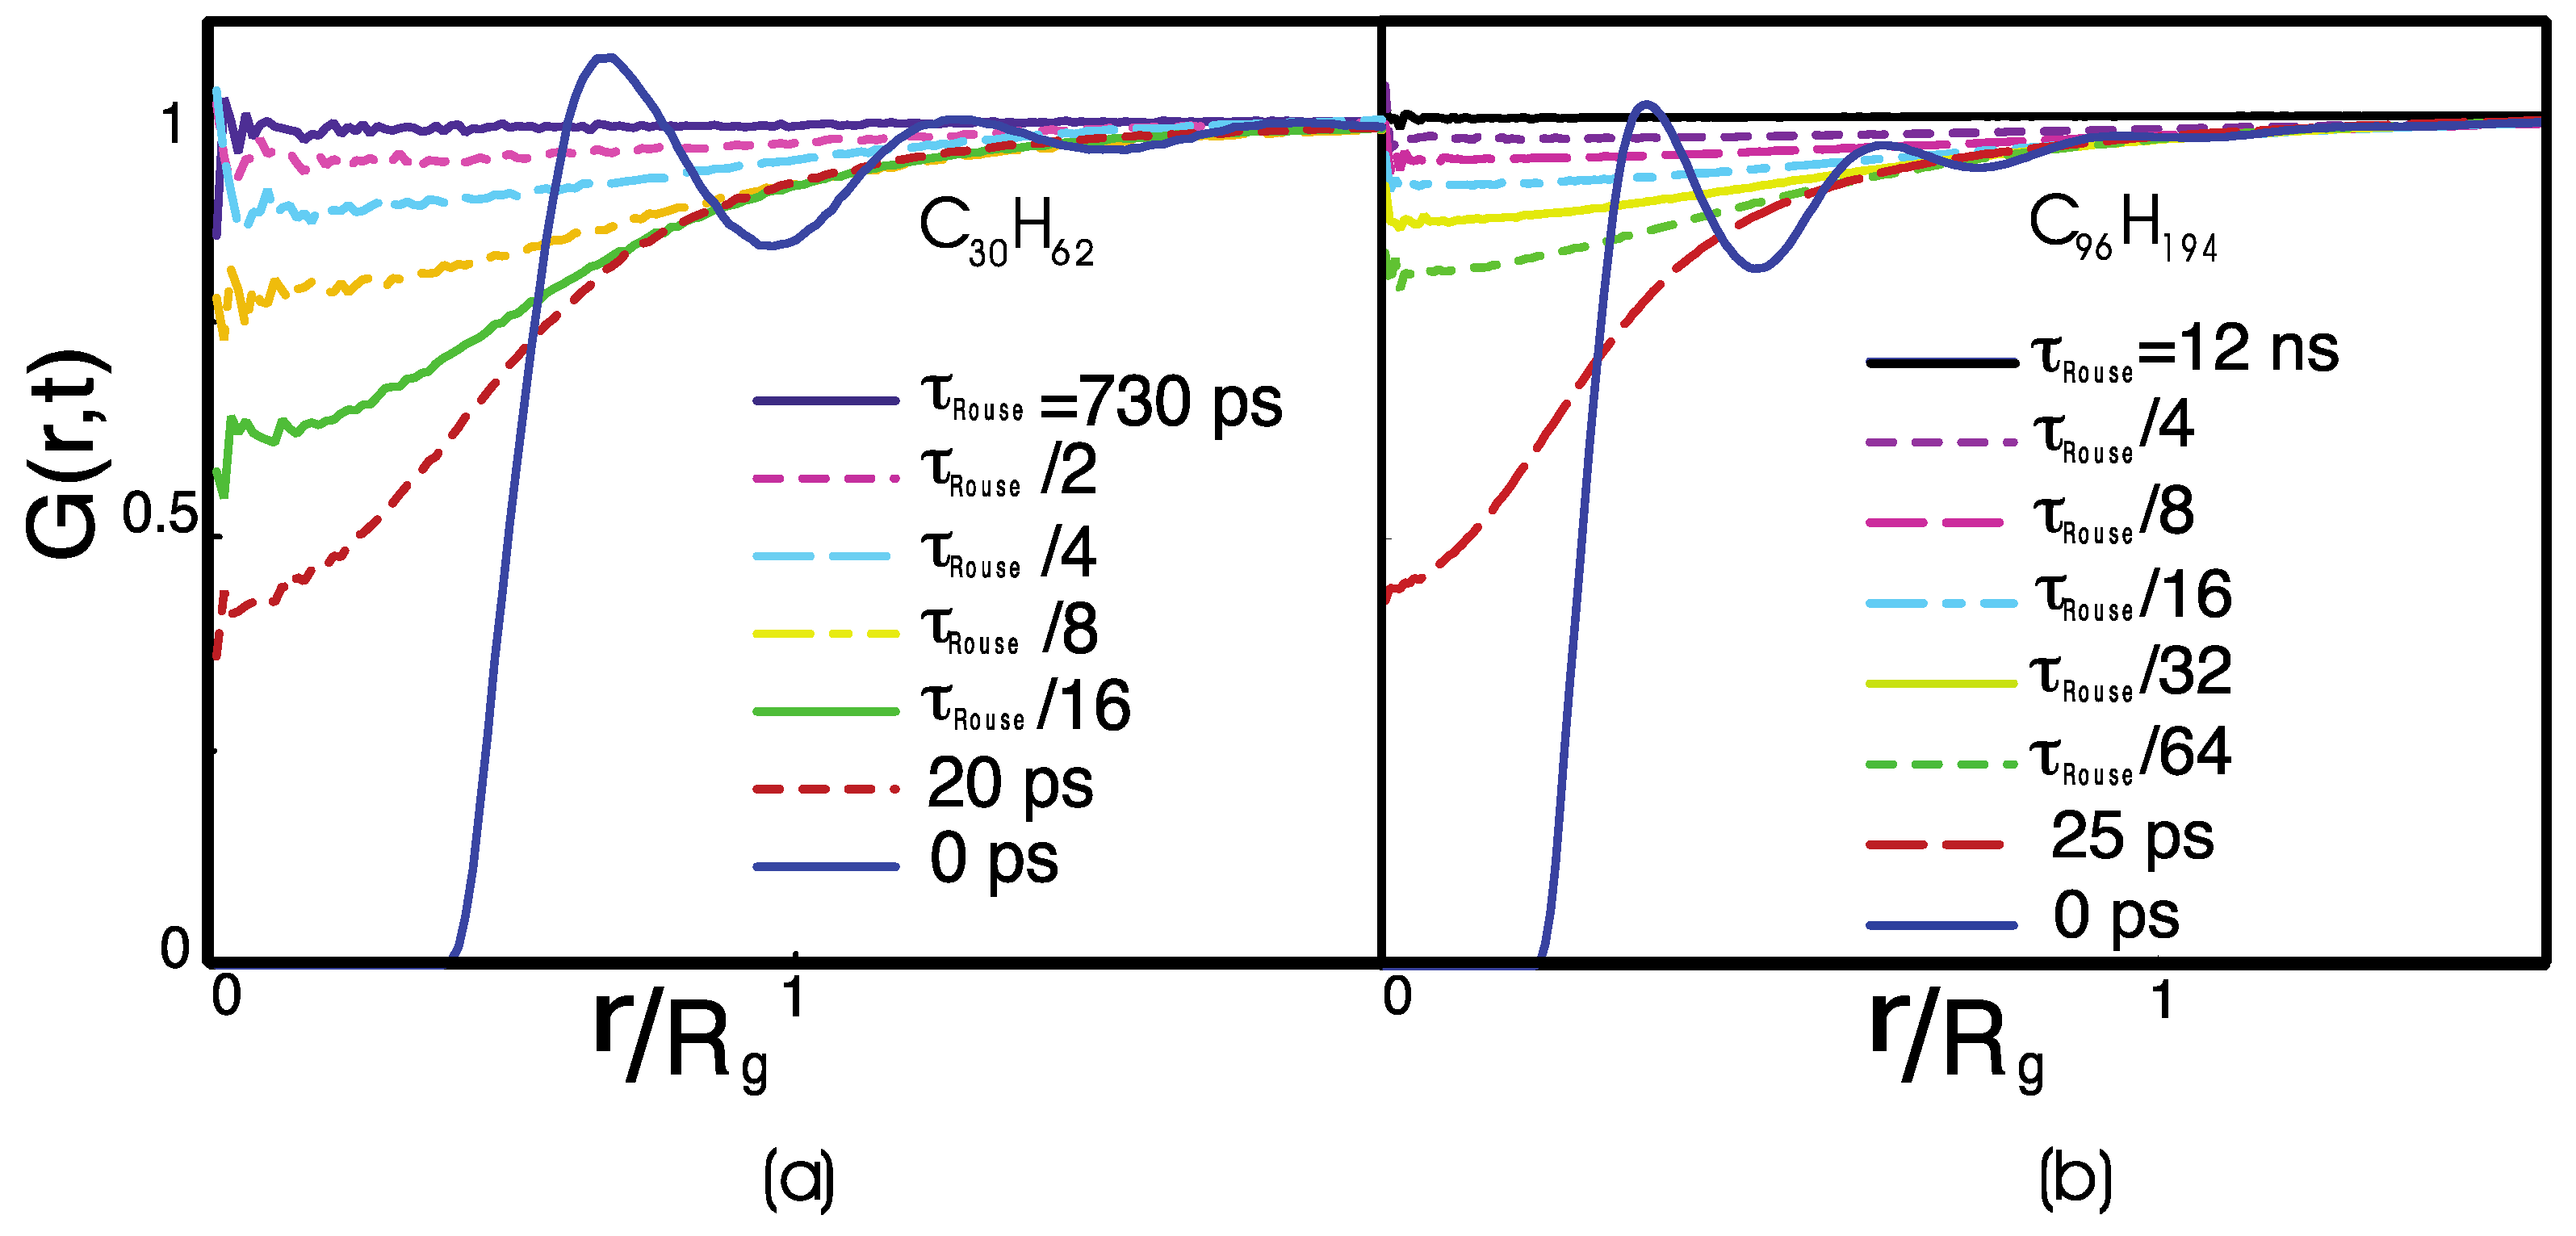
Figure 3 displays the van Hove distribution function, which at time is the equilibrium radial distribution function, [10]. At equilibrium, the probability of finding two monomers belonging to different chains at a distance becomes 100% successful only at a distance larger than the polymer radius of gyration. In the meantime, the probability of finding another polymer at a distance smaller than is finite, i.e., it is not zero. These observations indicate that polymers interpenetrate inside the “correlation hole,” which is the spherical volume defined by the polymer radius of gyration, . In that volume, there are statistically interpenetrating chains, where in the monomer density. Thus, each polymer is in contact with other polymers at any time in the simulation.
is the time needed for a chain to escape from its correlation hole, completely renewing its local contacts. It is also the characteristic relaxation time of the dynamical heterogeneities (Figure 1). Note that a time of the order of is also needed to equilibrate a polymer simulation. The related length scale of corresponds to the average size of the dynamical heterogeneities (~0.8 nm for C30H62 and ~1.6 nm for C96H194).
In Figure 3, the monomer van Hove distribution function shows two different characteristic times of relaxation. The first defines the time necessary for the fluid to lose the memory of its initial configuration on the local scale, corresponding to an intermolecular distance , and to a short relaxation, ~20 ps, which is needed for the loss of the fine monomeric structure. This process is identical for C30H62 and for C96H194, and it is molecular weight-independent. In fact, on the local scale, the monomer dynamics depend on the chain stiffness and the local monomer density. Still, it is independent of the polymer length unless the chain’s length is short and comparable to the persistence length. The monomer relaxation, however, is sensitive to the specific chemical structure of the monomer, i.e., the local conformational energy barriers. Its timescale depends on the chemical structure of the monomer [15,47]. On the global scale of , i.e., of the correlation hole, the van Hove function decays on a timescale comparable to . Thus, this second timescale is dependent. The decay is bounded by an intermolecular distance of the order of the correlation hole, .
The effective, time-dependent intermolecular mean force potential associated with the van Hove function is defined as . This potential couples the single-chain dynamics with the motion of the chains surrounding the “tagged” chain inside the correlation hole. The motion of two molecules can be considered to be uncorrelated only when their dynamics are sampled at a distance larger than the range of the potential, , i.e., the correlation hole, or on a time interval . Because is also the longest intramolecular relaxation time, this simple analysis suggests that there is no separation of timescales between the relaxation of a given macromolecule and the relaxation of its surroundings. Thus, the leading hypothesis that justifies the derivation of the generalized Langevin equation, and the Rouse equation, from the Hamiltonian of the melt by Mori–Zwanzig projection operator is not fulfilled in the case of isotropic, uniform, one-component liquids, including polymer melts.
Thus, the dynamics of a given chain is coupled through a time-dependent potential of mean force to the motion of its surrounding matrix in the timescale . This observation explains the inability of the mean-field Rouse equation to correctly predict the dynamics in the timescale shorter than the time necessary for the coupling potential to decay to zero. Therefore, the following natural step is the derivation from the Liouville equation of the dynamics of a group of interacting chains, where the motion is coupled by the time-dependent potential of mean force just observed. If one follows these steps and solves the Langevin equation for a group of interacting polymers, one can derive a set of coupled Rouse-like equations that predict anomalous dynamics [29,30,31]. In this model, which we called the cooperative dynamics generalized Langevin equation (CD-GLE), there is one free parameter, , which is optimized by direct comparison with data of c.o.m. mean-squared displacement. When the theory is compared with data of mean-squared displacement from simulations or from experiments, one finds that the optimal number of correlated chains obeys the predicted scaling of , which is in agreement with the simple analysis just presented. For example, for the data in Figure 1, one finds that for , , , and [41].
Finally, we analyze the mechanism that leads to the interchanging between slow- and fast-diffusing center-of-mass motion. We see that the fast cooperative dynamics involve long-range unidirectional center-of-mass displacements that are correlated with the appearance of intramolecular polymer configurations having a high percentage of trans (stretched) conformations (~ of bonds in the chain, as shown below). Thus, we calculate the square end-to-end distance for the average conformation assumed by each molecule during a given time interval .
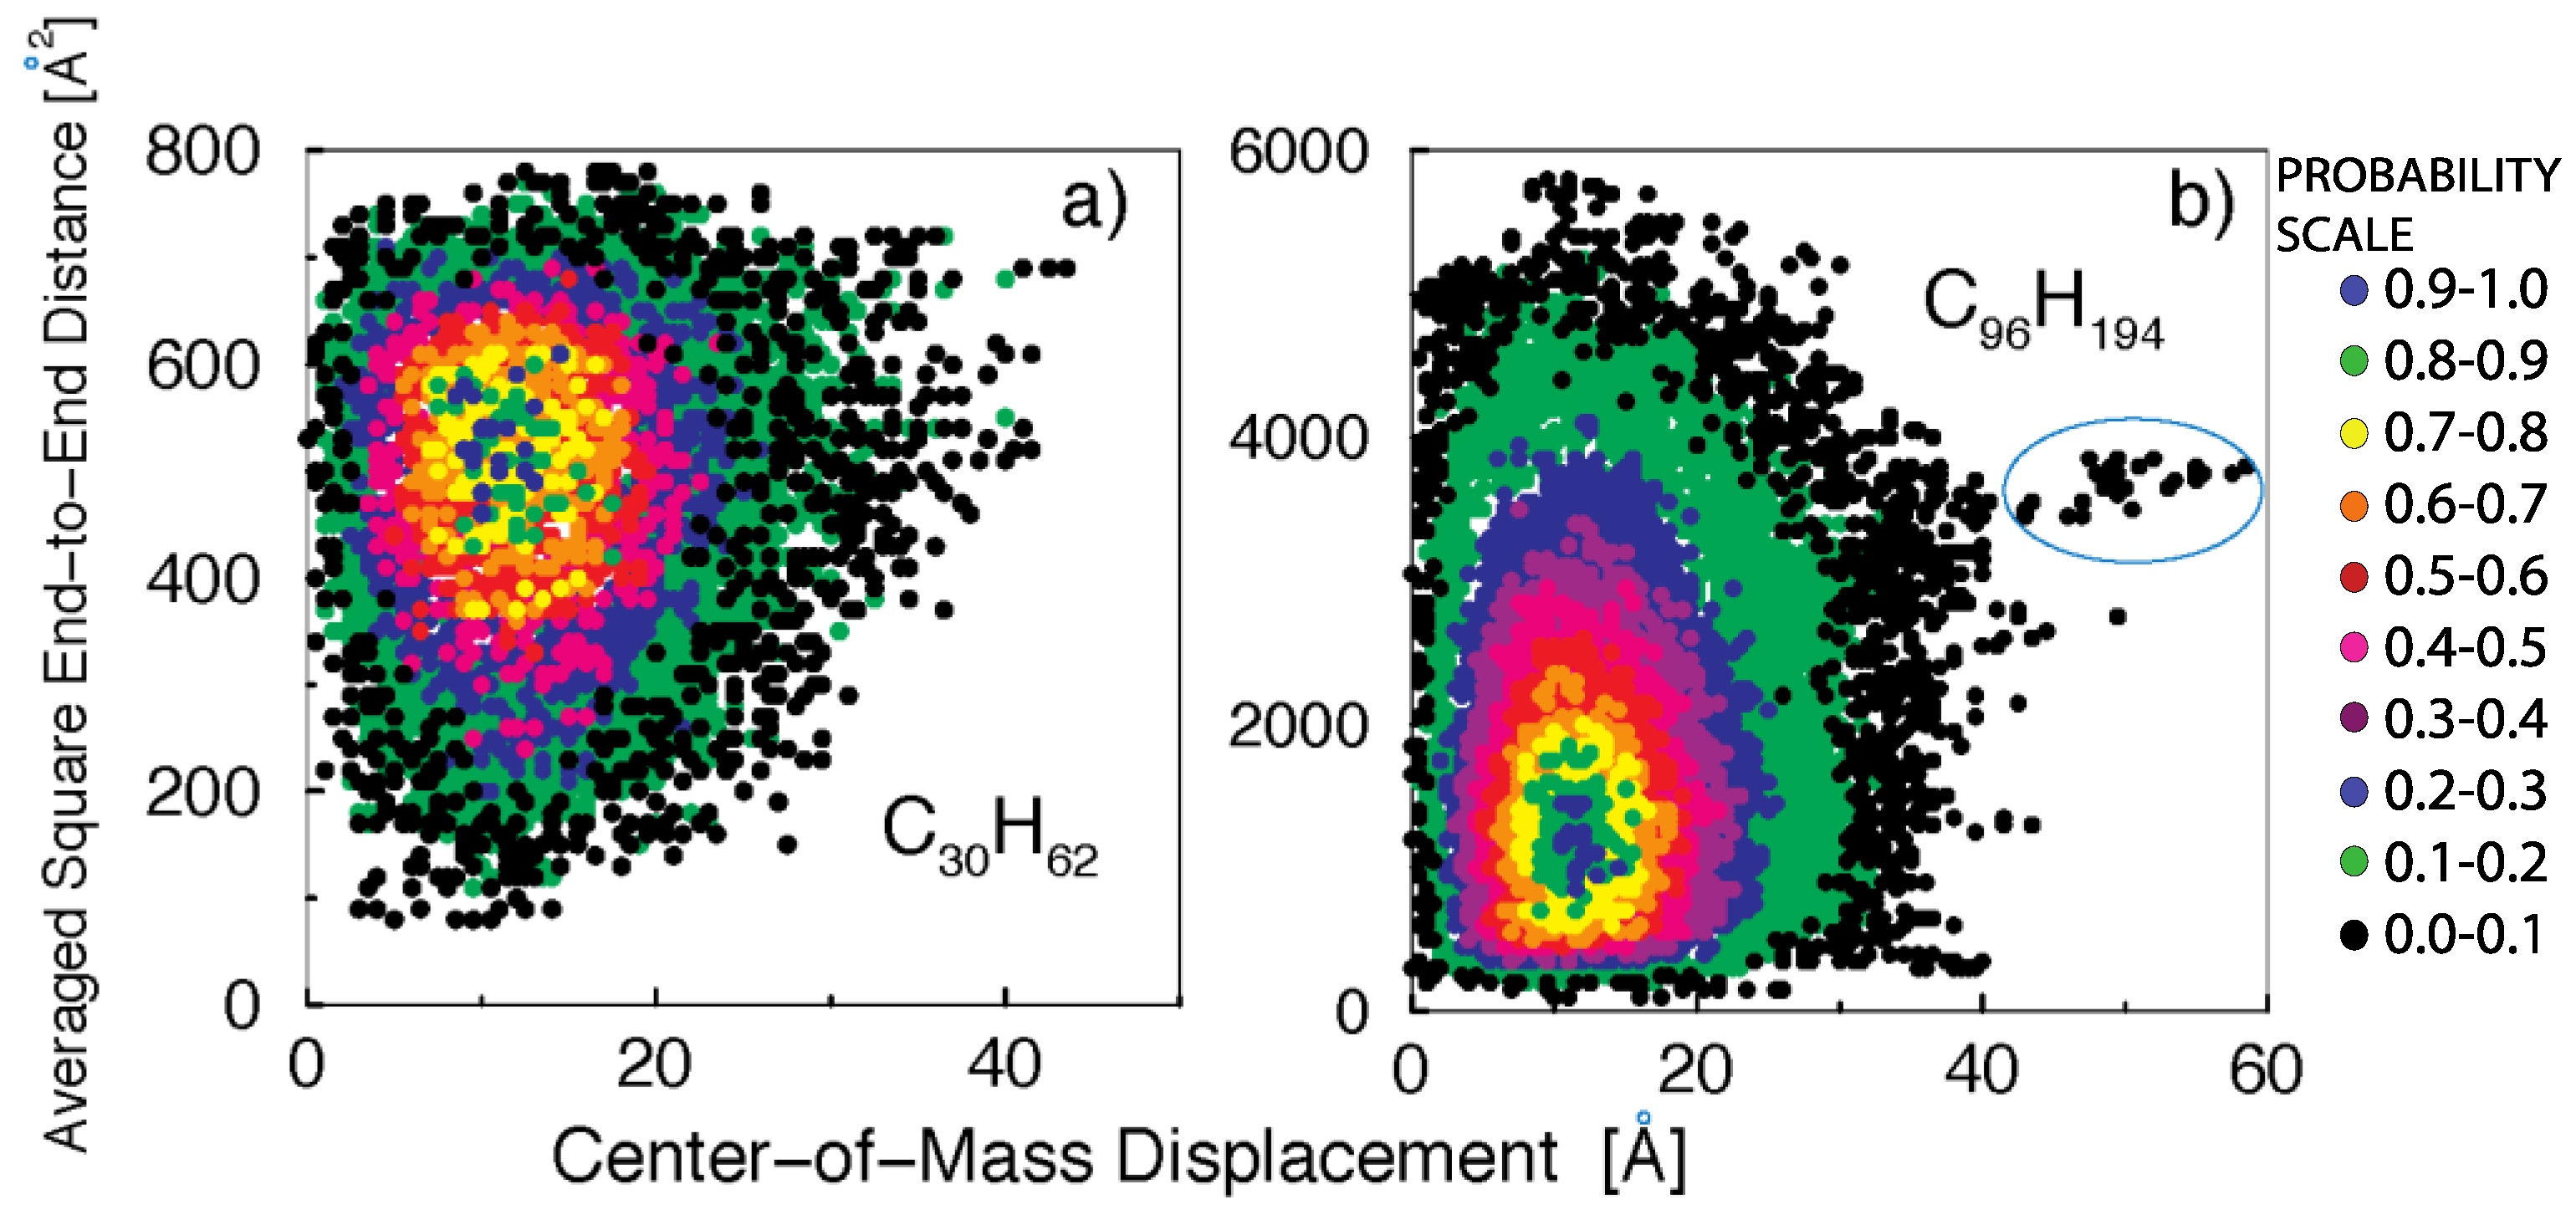
In Figure 4, we plot the joint distribution of center-of-mass displacements and the averaged square end-to-end distances for the time interval that maximizes the contribution due to fast dynamical processes, as determined from Figure 2 (/2 for C30H62 and /8 for C96H194). The different colors represent the contours of the three-dimensional normalized distribution function. The melt of short polymer chains (Figure 4a) clearly shows that fast dynamical relaxation is correlated with the appearance of persistent all-trans configurations. This correlation cannot be explained by the Rouse model, where center-of-mass diffusion and internal dynamics (stretching) are rigorously uncoupled when the friction is uniform along the chain (non-uniform friction is known to couple rotation and translation dynamics with internal fluctuations).
In the C30H62 sample (Figure 4a), the mean-squared end-to-end distance is , while a fully extended chain would have . The persistent stretched configurations, , correspond to of chain stretching. For the C96H194 (Figure 4b), where , the stretched configurations with correspond to of chain stretching.
Completely stretched configurations are entropically unfavorable and become less probable with increasing polymer lengths. In fact, for C96H194 the appearance of stretched configurations becomes a rare event, as exemplified by the isolated group of dots encircled in Figure 4b, which parts from the main distribution. This observation highlights the presence of microscopic mechanisms of dynamical relaxation in polymer melts that become increasingly suppressed with the increasing polymer molecular weight.
An analysis of the molecules undergoing fast diffusion shows that they follow cooperative mechanisms of motion, both inter- and intramolecular in character. Large-scale intramolecular displacements involve a string-like motion of monomers comprising the polymer chain, which corresponds to local chain stretching, as shown in Figure 4. Fast intermolecular cooperative dynamics can occur in one of two ways: (i) a single polymer undergoes a large displacement to a nearest-neighbor position, while a second polymer immediately replaces its initial position with the two chains following each other (a mechanism analogous to the one observed in undercooled colloidal fluids); or (ii) neighboring polymer chains may also diffuse by stretching and moving together, following parallel trajectories to final neighbor positions (a new mechanism pertaining to polymer fluids). Given that fast motion occurs via the partial stretching of the chains, which is entropically unfavorable, the pairing of two chains facilitates intermolecular packing, increasing the entropy of the surrounding chains by freeing the free volume in a mechanism that is reminiscent of a depletion effect.
At higher molecular weights, the effect of entanglement takes place, where the dynamics present scaling exponents different from the unentangled dynamics [1]. Still, in the motion occurring “inside the tube,” one can detect the same anomalous chain dynamics observed in unentangled chains with a subdiffusive c.o.m. motion. The application of a theory for many chains interacting through a time-dependent potential of mean force where entanglements are present shows a remarkable agreement with the relaxation of the dynamic structure factor, as measured by experiments of the neutron spin echo [48,49,50].
4. Conclusions
The microscopic analysis of simulation trajectories presented here supports the concept that the observed anomalous dynamics of a single chain in a polymer melt is related to the presence of interacting and interpenetrating chains inside the chain’s correlation hole. The distinct part of the van Hove function shows that intermolecular contributions are relevant in the global single-chain dynamics in polymer melts because of the mean-force potential. This observation suggests that single-chain models, such as the Rouse model, may be limited when describing chain dynamics in the range of timescales and length scales where the intermolecular potential of mean force is active (). In fact, the range and timescale of the time-dependent intermolecular potential of mean force define a region in space and time where the onset of dynamical heterogeneities is detected. We also observe novel mechanisms of fast intermolecular cooperative dynamics that involve chain stretching and, thus, are specific to polymer melts. These mechanisms are coupled to entropy-sensitive, conformational transitions from coiled to stretched polymer configurations.
The observed separation of timescales between slow- and fast-relaxing domains in the short time regime justifies the projection of the dynamics of the fluid onto the coordinates of a group of slow, interacting molecules, obtaining, in this way, a set of coupled equations of motion for the region of slowly rearranging dynamics that reproduce well the observed anomalous dynamics [49,50]. The analysis presented here formally connects the observed anomalous dynamics to microscopic mechanisms of heterogeneous dynamics and provides a consistent picture of the physical phenomena underlying the observed anomalous, slow center-of-mass diffusion in polymer melts.
Funding
We acknowledge support from the National Science Foundation under grants CHE-2133464 and CHE-1665466. Acknowledgment is made to the donors of The American Chemical Society Petroleum Research Fund for support of this research, under grant GR-58648.
Institutional Review Board Statement
Not applicable.
Informed Consent Statement
Not applicable.
Data Availability Statement
Conflicts of Interest
The authors declare no conflict of interest. The funders had no role in the design of the study; in the collection, analyses, or interpretation of data; in the writing of the manuscript, or in the decision to publish the results.
References
- Doi, M.; Edwards, S.F. The Theory of Polymer Dynamics; Clarendon Press—Oxford University Press: New York, NY, USA, 1988. [Google Scholar]
- Beyerle, E.R.; Guenza, M.G. Kinetics analysis of ubiquitin local fluctuations with Markov state modeling of the LE4PD normal modes. J. Chem. Phys. 2019, 151, 164119. [Google Scholar] [CrossRef] [PubMed]
- Copperman, J.; Guenza, M.G. Coarse-Grained Langevin Equation for Protein Dynamics: Global Anisotropy and a Mode Approach to Local Complexity. J. Phys. Chem. B 2014, 119, 9195–9211. [Google Scholar] [CrossRef] [PubMed]
- Copperman, J.; Dinpajooh, M.; Beyerle, E.R.; Guenza, M.G. Universality and Specificity in Protein Fluctuation Dynamics. Phys. Rev. Lett. 2017, 119, 158101. [Google Scholar] [CrossRef] [PubMed] [Green Version]
- Kostov, K.S.; Freed, K.F. Long-Time Dynamics of Met-Enkephalin: Comparison of Theory with Brownian Dynamics Simulations. Biophys. J. 1999, 76, 149–163. [Google Scholar] [CrossRef] [Green Version]
- Lin, S.-C.; Schurr, J.M. Dynamic light-scattering studies of internal motions in DNA. I. Applicability of the Rouse-Zimm model. Biopolymers 1978, 17, 425–461. [Google Scholar] [CrossRef]
- Socol, M.; Wang, R.; Jost, D.; Carrivain, P.; Vaillant, C.; Le Cam, E.; Dahirel, V.; Normand, C.; Bystricky, K.; Victor, J.-M.; et al. Rouse model with transient intramolecular contacts on a timescale of seconds recapitulates folding and fluctuation of yeast chromosomes. Nucleic Acids Res. 2019, 47, 6195–6207. [Google Scholar] [CrossRef] [Green Version]
- Rolls, E.; Togashi, Y.; Erban, R. Varying the Resolution of the Rouse Model on Temporal and Spatial Scales: Application to Multiscale Modeling of DNA Dynamics. Multiscale Model. Simul. 2017, 15, 1672–1693. [Google Scholar] [CrossRef]
- Knowles, M.K.; Guenza, M.; Capaldi, R.A.; Marcus, A.H. Cytoskeletal-assisted dynamics of the mitochondrial reticulum in living cells. Proc. Natl. Acad. Sci. USA 2002, 99, 14772–14777. [Google Scholar] [CrossRef] [Green Version]
- Hansen, J.P.; McDonald, I.R. Theory of Simple Liquids; Academic Press: Amsterdam, The Netherlands, 2003. [Google Scholar]
- Schweizer, K.S. Microscopic theory of the dynamics of polymeric liquids: General formulation of a mode–mode-coupling approach. J. Chem. Phys. 1989, 91, 5802–5821. [Google Scholar] [CrossRef]
- Schweizer, K.S. Mode-coupling theory of the dynamics of polymer liquids: Qualitative predictions for flexible chain and ring melts. J. Chem. Phys. 1989, 91, 5822–5839. [Google Scholar] [CrossRef]
- Schweizer, K.S.; Fuchs, M.; Szamel, G.; Guenza, M.; Tang, H. Polymer-mode-coupling theory of the slow dynamics of entangled macromolecular fluids. Macromol. Theory Simul. 1997, 6, 1037–1117. [Google Scholar] [CrossRef] [Green Version]
- Paul, W.; Smith, G.D.; Yoon, D.Y.; Farago, B.; Rathgeber, S.; Zirkel, A.; Willner, L.; Richter, D. Chain Motion in an Unentangled Polyethylene Melt: A Critical Test of the Rouse Model by Molecular Dynamics Simulations and Neutron Spin Echo Spectroscopy. Phys. Rev. Lett. 1998, 80, 2346–2349. [Google Scholar] [CrossRef]
- Bixon, M.; Zwanzig, R. Optimized Rouse–Zimm theory for stiff polymers. J. Chem. Phys. 1978, 68, 1896–1902. [Google Scholar] [CrossRef]
- Copperman, J.; Guenza, M. Predicting protein dynamics from structural ensembles. J. Chem. Phys. 2015, 143, 243131. [Google Scholar] [CrossRef] [PubMed] [Green Version]
- Beyerle, E.R.; Guenza, M.G. Comparison between slow anisotropic LE4PD fluctuations and the principal component analysis modes of ubiquitin. J. Chem. Phys. 2021, 154, 124111. [Google Scholar] [CrossRef]
- Copperman, J.; Guenza, M. Mode localization in the cooperative dynamics of protein recognition. J. Chem. Phys. 2016, 145, 015101. [Google Scholar] [CrossRef] [Green Version]
- Beyerle, E.R.; Guenza, M.G. Identifying the leading dynamics of ubiquitin: A comparison between the tICA and the LE4PD slow fluctuations in amino acids’ position. J. Chem. Phys. 2021, 155, 244108. [Google Scholar] [CrossRef]
- Hall, J.; Guenza, M.G. Construction of Langevin Equations in Body-Fixed Frames, (in preparation).
- Skolnick, J.; Yaris, R. Phenomenological theory of the dynamics of polymer melts. II. Viscoelastic properties. J. Chem. Phys. 1988, 88, 1418–1442. [Google Scholar] [CrossRef]
- Douglas, J.F.; Hubbard, J.B. Semiempirical theory of relaxation: Concentrated polymer solution dynamics. Macromolecules 1991, 24, 3163–3177. [Google Scholar] [CrossRef]
- Paul, W.; Yoon, D.Y.; Smith, G.D. An optimized united atom model for simulations of polymethylene melts. J. Chem. Phys. 1995, 103, 1702–1709. [Google Scholar] [CrossRef]
- Koliński, A.; Skolnick, J.; Yaris, R. Monte Carlo studies on the long time dynamic properties of dense cubic lattice multichain systems. II. Probe polymer in a matrix of different degrees of polymerization. J. Chem. Phys. 1987, 86, 7174–7180. [Google Scholar] [CrossRef]
- Jaramillo, E.; Wu, D.T.; Grest, G.S.; Curro, J.G. Anomalous mixing behavior of polyisobutylene/polypropylene blends: Molecular dynamics simulation study. J. Chem. Phys. 2004, 120, 8883–8886. [Google Scholar] [CrossRef] [PubMed]
- Heine, D.; Wu, D.T.; Curro, J.G.; Grest, G.S. Role of intramolecular energy on polyolefin miscibility: Isotactic polypropylene/polyethylene blends. J. Chem. Phys. 2003, 118, 914–924. [Google Scholar] [CrossRef]
- Wu, X.-L.; Libchaber, A. Particle Diffusion in a Quasi-Two-Dimensional Bacterial Bath. Phys. Rev. Lett. 2000, 84, 3017–3020. [Google Scholar] [CrossRef] [PubMed] [Green Version]
- Caspi, A.; Granek, R.; Elbaum, M. Enhanced Diffusion in Active Intracellular Transport. Phys. Rev. Lett. 2000, 85, 5655–5658. [Google Scholar] [CrossRef] [PubMed]
- Guenza, M. Cooperative Dynamics in Unentangled Polymer Fluids. Phys. Rev. Lett. 2001, 88, 025901. [Google Scholar] [CrossRef] [PubMed] [Green Version]
- Guenza, M. Many chain correlated dynamics in polymer fluids. J. Chem. Phys. 1999, 110, 7574–7588. [Google Scholar] [CrossRef]
- Guenza, M. Intermolecular Effects in the Center-of-Mass Dynamics of Unentangled Polymer Fluids. Macromolecules 2002, 35, 2714–2722. [Google Scholar] [CrossRef] [Green Version]
- Mondello, M.; Grest, G.S. Viscosity calculations ofn-alkanes by equilibrium molecular dynamics. J. Chem. Phys. 1997, 106, 9327–9336. [Google Scholar] [CrossRef]
- Dinpajooh, M.; Guenza, M.G. On the Density Dependence of the Integral Equation Coarse-Graining Effective Potential. J. Phys. Chem. B 2017, 122, 3426–3440. [Google Scholar] [CrossRef]
- Dinpajooh, M.; Guenza, M. Thermodynamic consistency in the structure-based integral equation coarse-grained method. Polymer 2017, 117, 282–286. [Google Scholar] [CrossRef] [Green Version]
- Dinpajooh, M.; Guenza, M.G. Coarse-graining simulation approaches for polymer melts: The effect of potential range on computational efficiency. Soft Matter 2018, 14, 7126–7144. [Google Scholar] [CrossRef] [PubMed] [Green Version]
- Dinpajooh, M.; Guenza, M.G. Can pure polymer liquids be represented at two different resolutions simultaneously? J. Chem. Phys. 2019, 151, 061102. [Google Scholar] [CrossRef]
- Sambriski, E.J.; Yatsenko, G.; A Nemirovskaya, M.; Guenza, M.G. Bridging length scales in polymer melt relaxation for macromolecules with specific local structures. J. Phys. Condens. Matter 2007, 19. [Google Scholar] [CrossRef]
- Kopf, A.; Dünweg, B.; Paul, W. Dynamics of polymer “isotope” mixtures: Molecular dynamics simulation and Rouse model analysis. J. Chem. Phys. 1997, 107, 6945–6955. [Google Scholar] [CrossRef]
- Yamakawa, H. Modern Theory of Polymer Solutions; Harper & Row: New York, NY, USA, 1971. [Google Scholar]
- Smith, G.; Paul, W.; Monkenbusch, M.; Richter, D. A comparison of neutron scattering studies and computer simulations of polymer melts. Chem. Phys. 2000, 261, 61–74. [Google Scholar] [CrossRef]
- Zamponi, M.; Wischnewski, A.; Monkenbusch, M.; Willner, L.; Richter, D.; Falus, P.; Farago, B.; Guenza, M. Cooperative Dynamics in Homopolymer Melts: A Comparison of Theoretical Predictions with Neutron Spin Echo Experiments. J. Phys. Chem. B 2008, 112, 16220–16229. [Google Scholar] [CrossRef]
- Gaur, U.; Wunderlich, B. The Glass Transition Temperature of Polyethylene. Macromolecules 1980, 13, 445–446. [Google Scholar] [CrossRef]
- Weeks, E.R.; Crocker, J.C.; Levitt, A.C.; Schofield, A.; Weitz, D.A. Three-Dimensional Direct Imaging of Structural Relaxation Near the Colloidal Glass Transition. Science 2000, 287, 627–631. [Google Scholar] [CrossRef] [Green Version]
- Bennemann, C.; Donati, C.; Baschnagel, J.; Glotzer, S.C. Growing range of correlated motion in a polymer melt on cooling towards the glass transition. Nature 1999, 399, 246–249. [Google Scholar] [CrossRef]
- de Gennes, P.-G. Scaling Concepts in Polymer Physics; Cornell University Press: Ithaca, NY, USA, 1979. [Google Scholar]
- Schweizer, K.S.; Curro, J.G. PRISM Theory of the Structure, Thermodynamics, and Phase Transitions of Polymer Liquids and Alloys; Springer: Berlin/Heidelberg, Germany, 2006; pp. 319–377. [Google Scholar] [CrossRef]
- Guenza, M.G. Theoretical models for bridging timescales in polymer dynamics. J. Physics Condens. Matter 2007, 20. [Google Scholar] [CrossRef]
- Guenza, M.G. Localization of chain dynamics in entangled polymer melts. Phys. Rev. E 2014, 89, 052603. [Google Scholar] [CrossRef] [PubMed]
- Zamponi, M.; Kruteva, M.; Monkenbusch, M.; Willner, L.; Wischnewski, A.; Hoffmann, I.; Richter, D. Cooperative Chain Dynamics of Tracer Chains in Highly Entangled Polyethylene Melts. Phys. Rev. Lett. 2021, 126, 187801. [Google Scholar] [CrossRef] [PubMed]
- Kruteva, M.; Zamponi, M.; Hoffmann, I.; Allgaier, J.; Monkenbusch, M.; Richter, D. Non-Gaussian and Cooperative Dynamics of Entanglement Strands in Polymer Melts. Macromolecules 2021. [Google Scholar] [CrossRef]
Figure 1.
Mean-squared displacement of the center of mass of PE chains with an increasing degree of polymerization. Symbols are from neutron spin echo experiments for N = 36 (down triangles), 106 (up triangles), 192 (open circles), and 377 (filled squares). The light-blue lines are the predictions of the theory for cooperative dynamics (CD-GLE). The red dashed lines represent diffusive dynamics, i.e., the predictions of the Rouse theory. The vertical bars are the longest Rouse relaxation time. Data are reproduced with permission from reference [41] Copyright © 2008, American Chemical Society.

Figure 2.
(a) Left panels: the MD trajectory of a single polymer’s center of mass in a melt of C30H62 polyethylene chains. The trajectory is sampled every , , and (from top to bottom), where for C30H62. Right panels: the normalized distribution of center-of-mass mean-squared displacements, sampled at the same time intervals sampled in the left panels. Lines: the best Gaussian fits of the slow part of the distributions. (b) The MD trajectory (left) and normalized distribution of center-of-mass mean-squared displacements (right) for a melt of C96H194 polyethylene chains, shown using the same convention as in Figure 1a. The trajectory is sampled every , , and (from top to bottom), where for C96H194. Lines: best Gaussian fits of the slow part of the distributions.

Figure 3.
The monomer-distinct part of the van Hove function for a melt of (a) C30H62 and (b) C96H194 polyethylene chains. In (a), the van Hove function is calculated for (from top to bottom), where for C30H62. In (b), the van Hove function is calculated for (from top to bottom), where for C96H194.
Figure 3.
The monomer-distinct part of the van Hove function for a melt of (a) C30H62 and (b) C96H194 polyethylene chains. In (a), the van Hove function is calculated for (from top to bottom), where for C30H62. In (b), the van Hove function is calculated for (from top to bottom), where for C96H194.

Figure 4.
Contour plots of the normalized joint distribution for center-of-mass displacements and averaged square end-to-end distances: (a) for a melt of C30H62 polyethylene chains during a time window ; (b) for a melt of C96H194 polyethylene chains during a time window . The encircled region highlights the presence of persistent stretched configurations that facilitate the enhanced chain displacement.

Publisher’s Note: MDPI stays neutral with regard to jurisdictional claims in published maps and institutional affiliations. |
© 2022 by the author. Licensee MDPI, Basel, Switzerland. This article is an open access article distributed under the terms and conditions of the Creative Commons Attribution (CC BY) license (https://creativecommons.org/licenses/by/4.0/).
Share and Cite
MDPI and ACS Style
Guenza, M.G. Anomalous Dynamics in Macromolecular Liquids. Polymers 2022, 14, 856. https://0-doi-org.brum.beds.ac.uk/10.3390/polym14050856
AMA Style
Guenza MG. Anomalous Dynamics in Macromolecular Liquids. Polymers. 2022; 14(5):856. https://0-doi-org.brum.beds.ac.uk/10.3390/polym14050856
Chicago/Turabian StyleGuenza, Marina G. 2022. "Anomalous Dynamics in Macromolecular Liquids" Polymers 14, no. 5: 856. https://0-doi-org.brum.beds.ac.uk/10.3390/polym14050856
Note that from the first issue of 2016, this journal uses article numbers instead of page numbers. See further details here.