
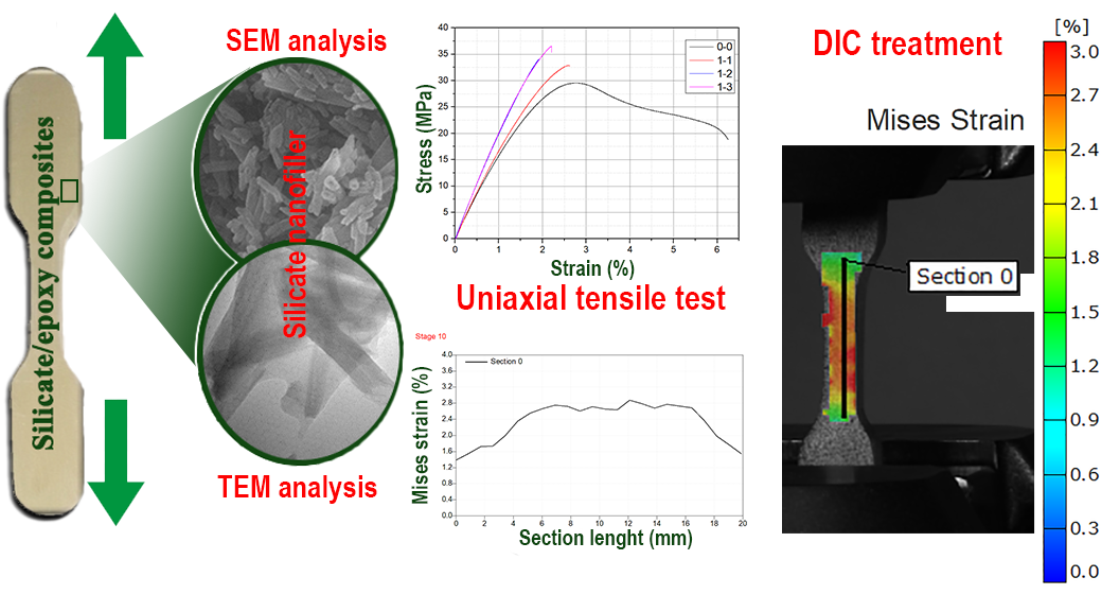
Determination of Mechanical Properties of Epoxy Composite Materials Reinforced with Silicate Nanofillers Using Digital Image Correlation (DIC)

 ,
,
Abstract
:
1. Introduction
2. Materials and Methods
3. Results
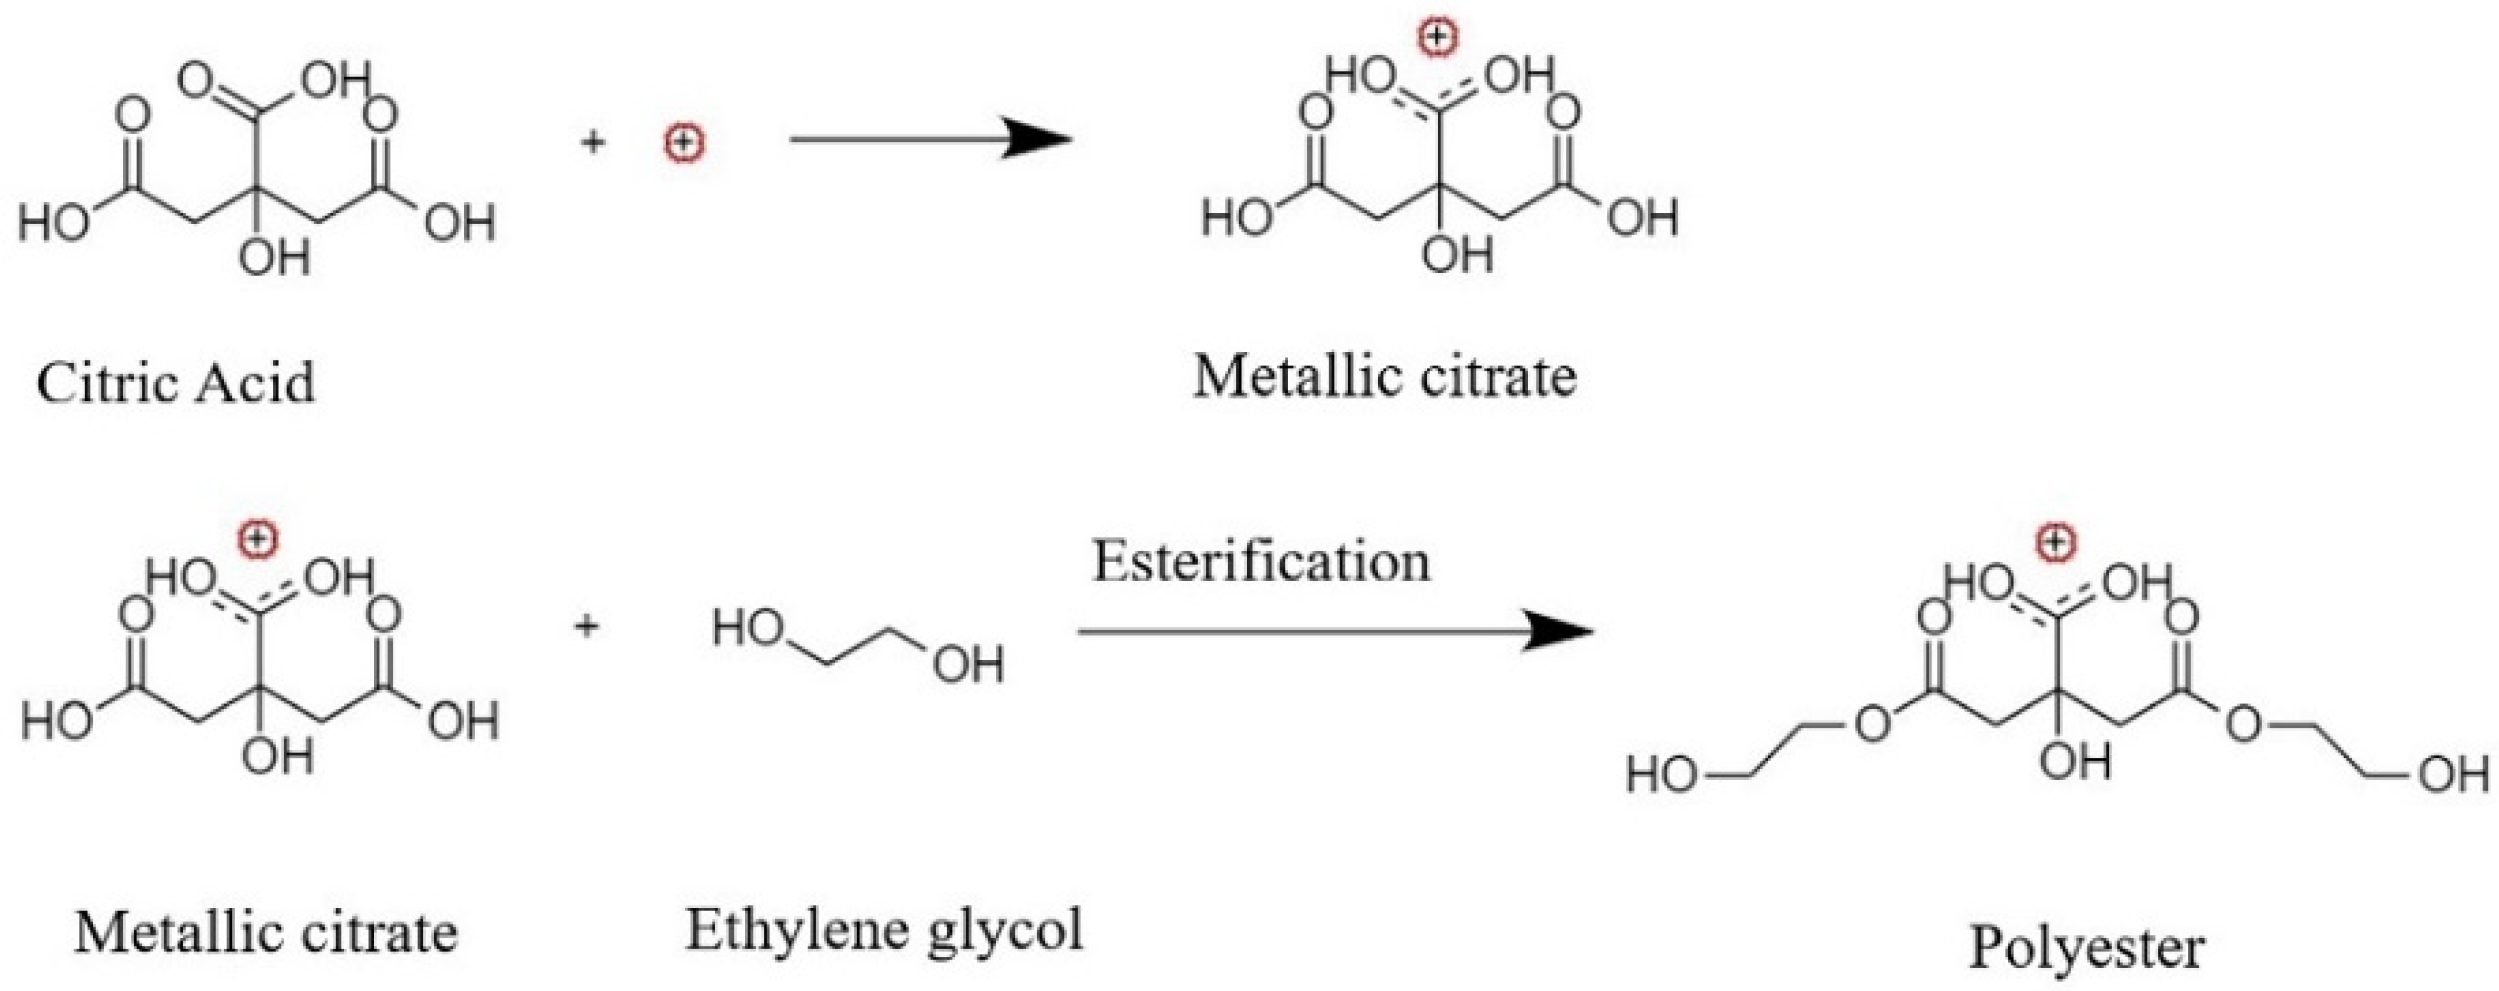
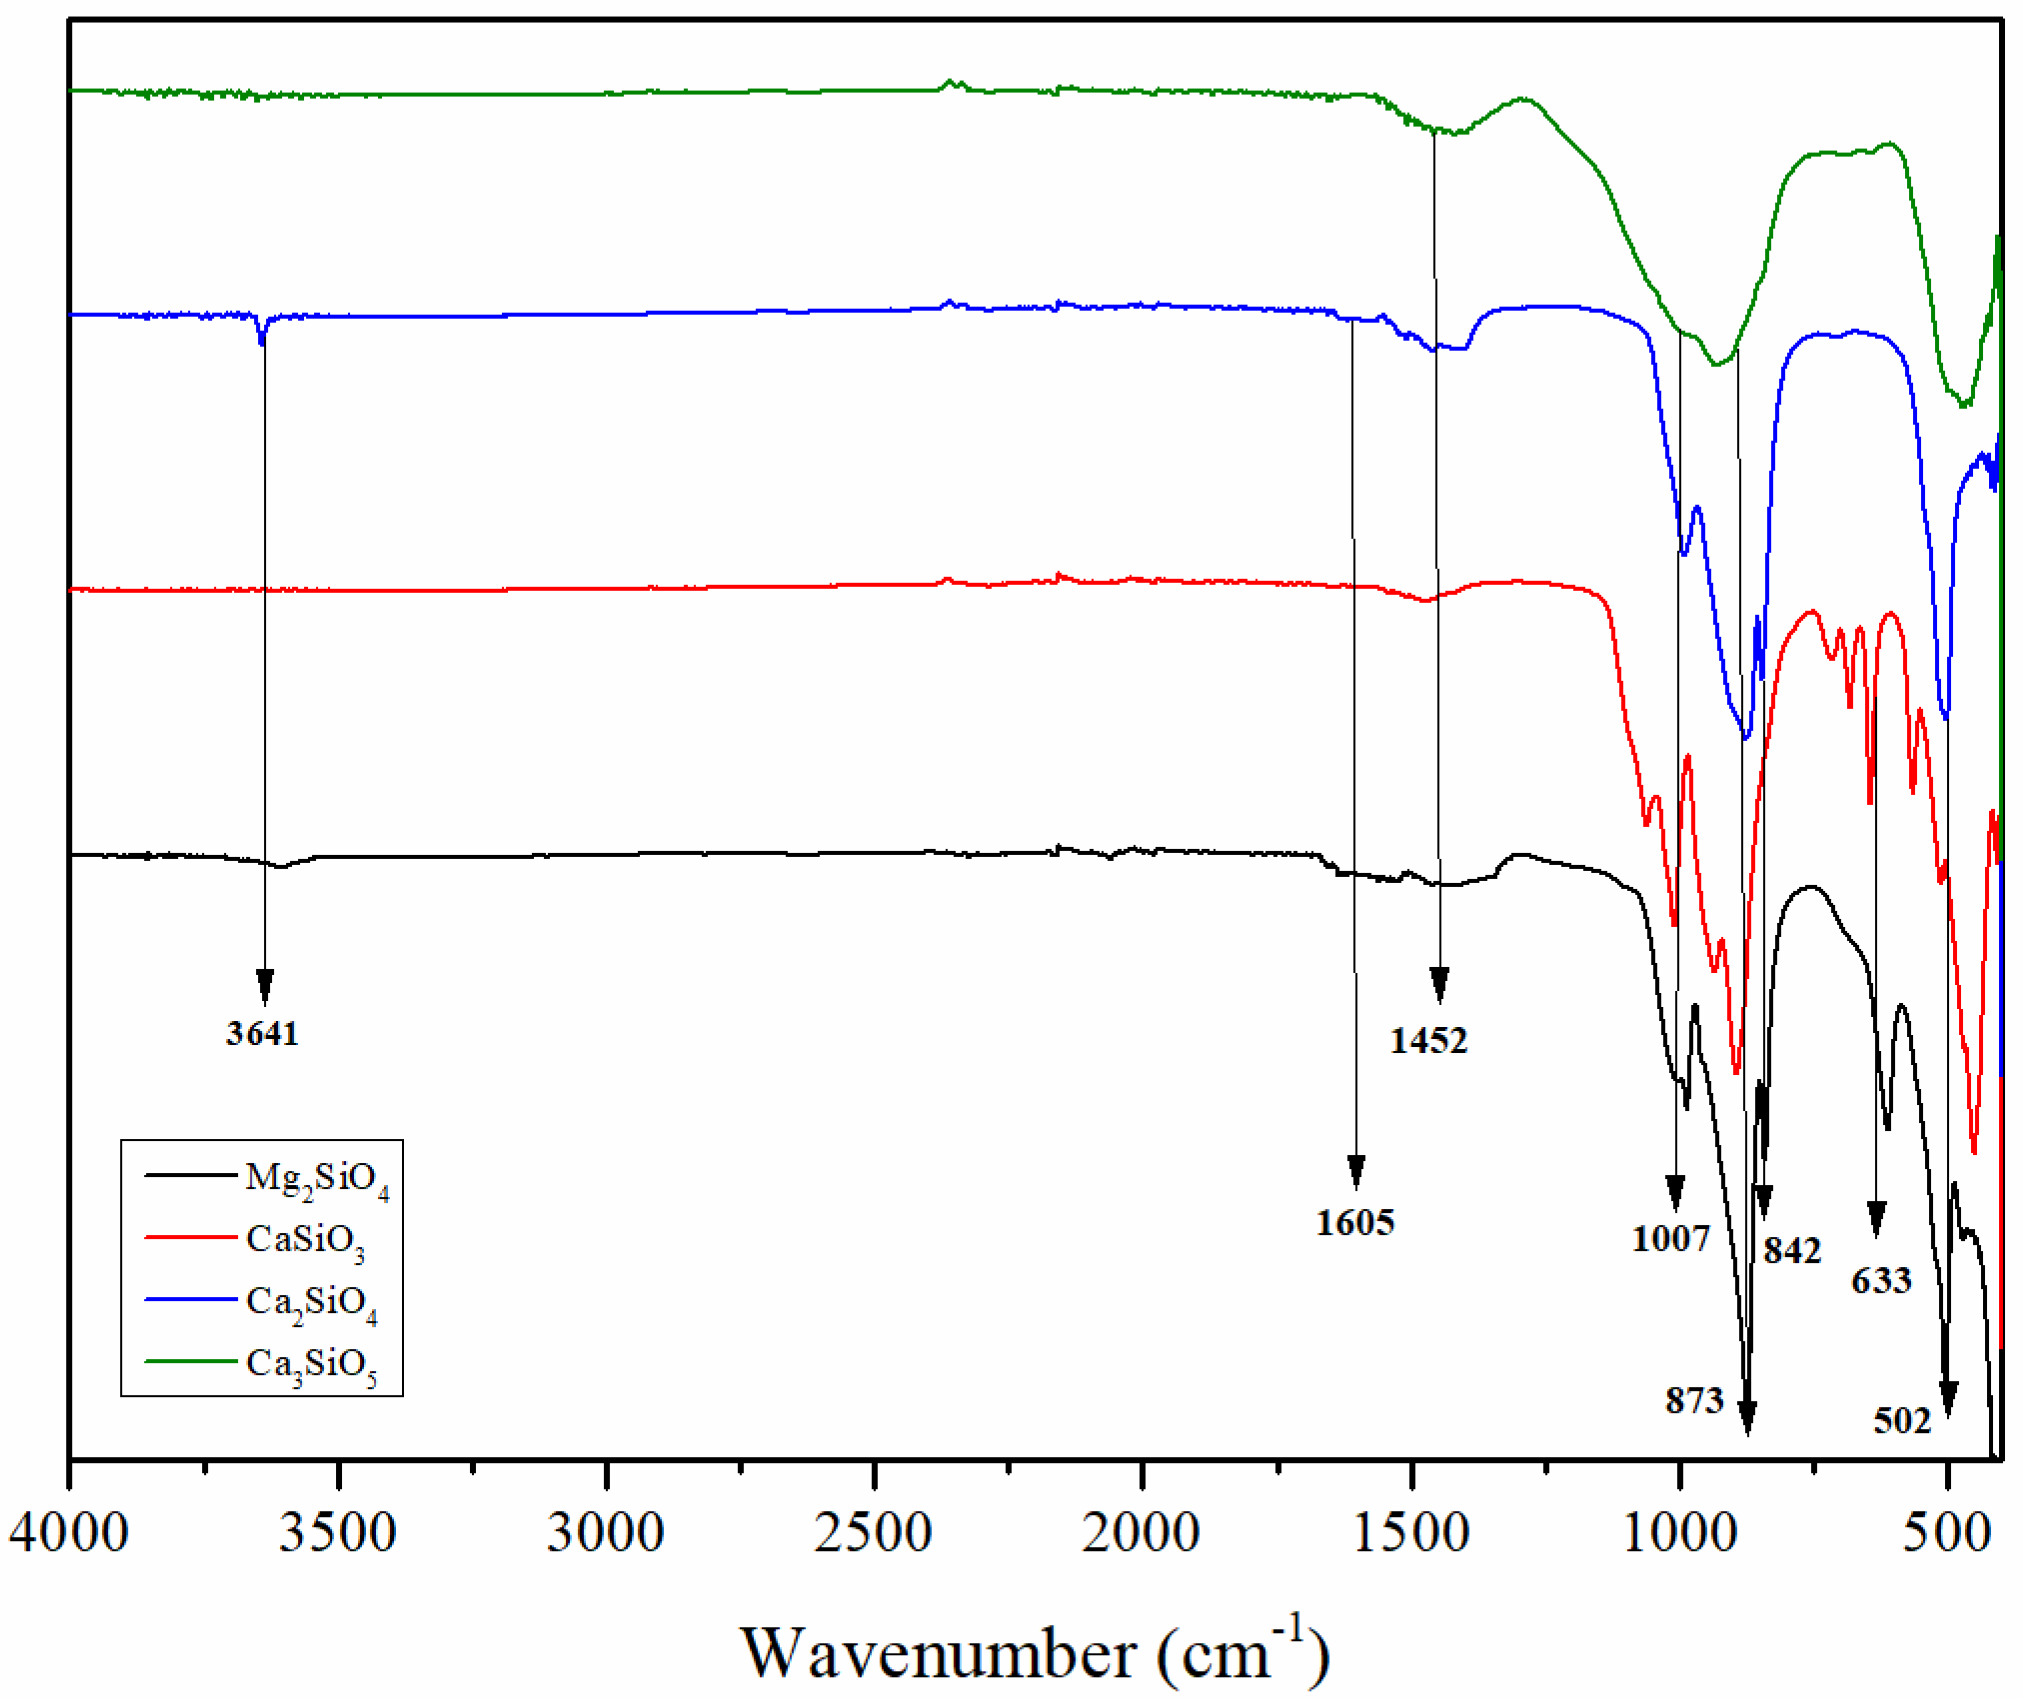
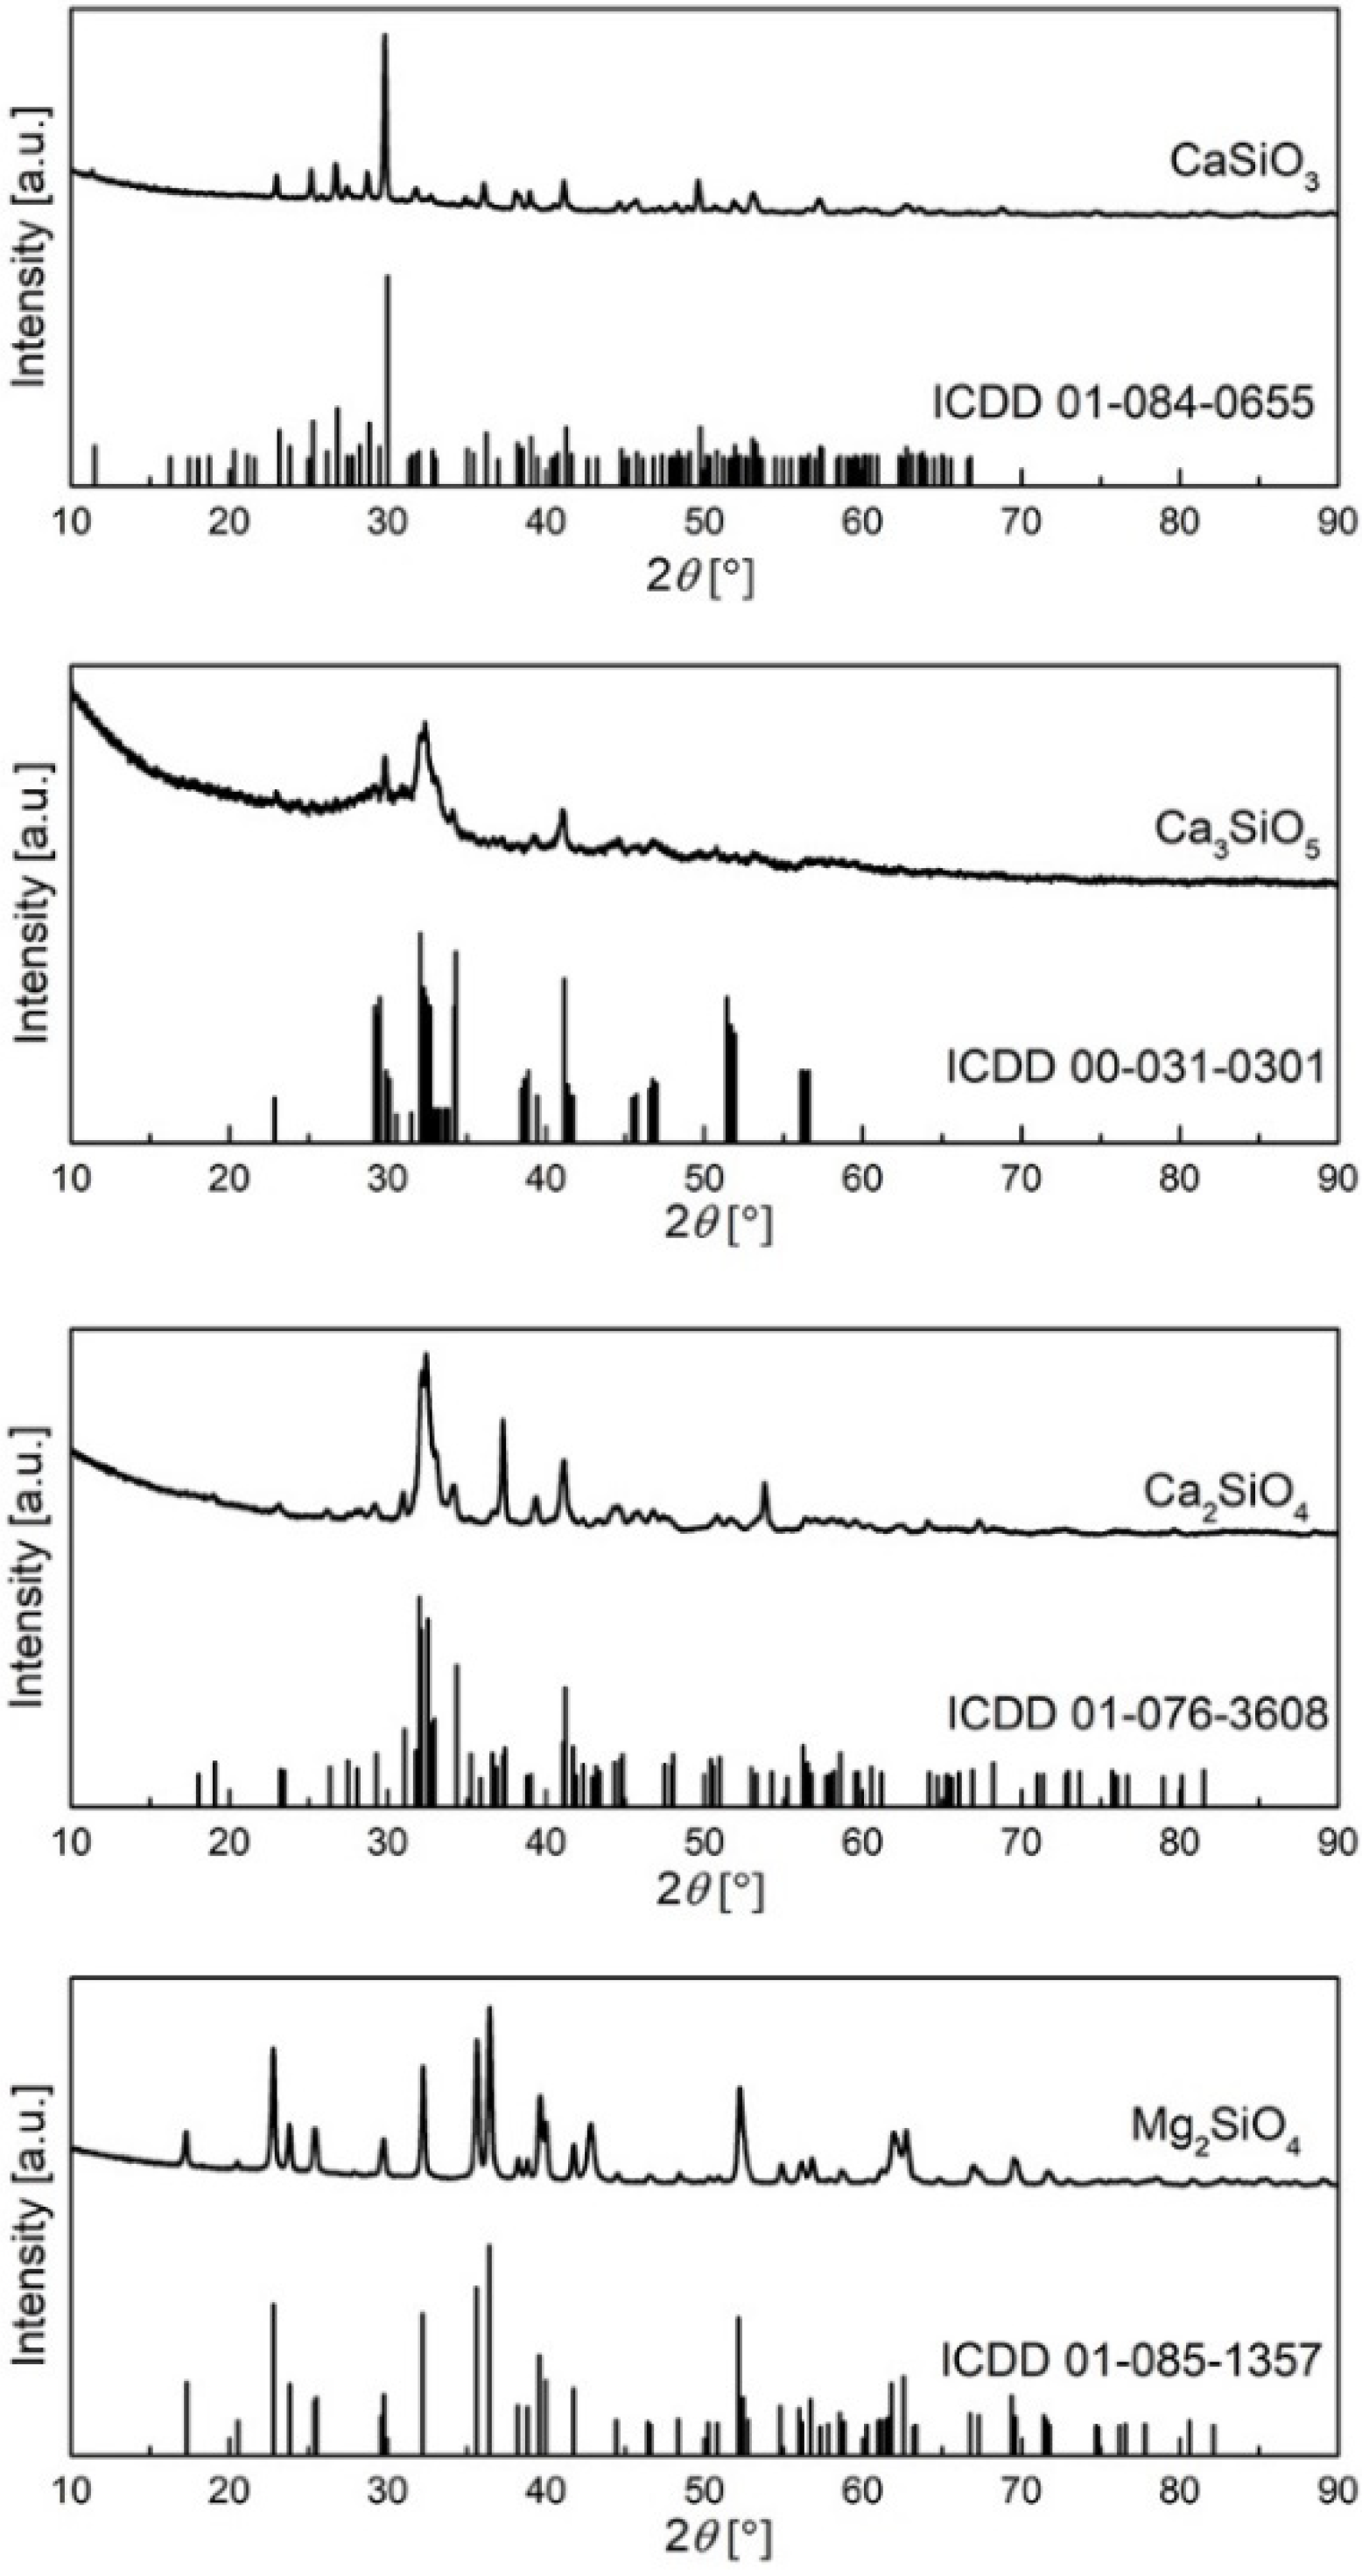
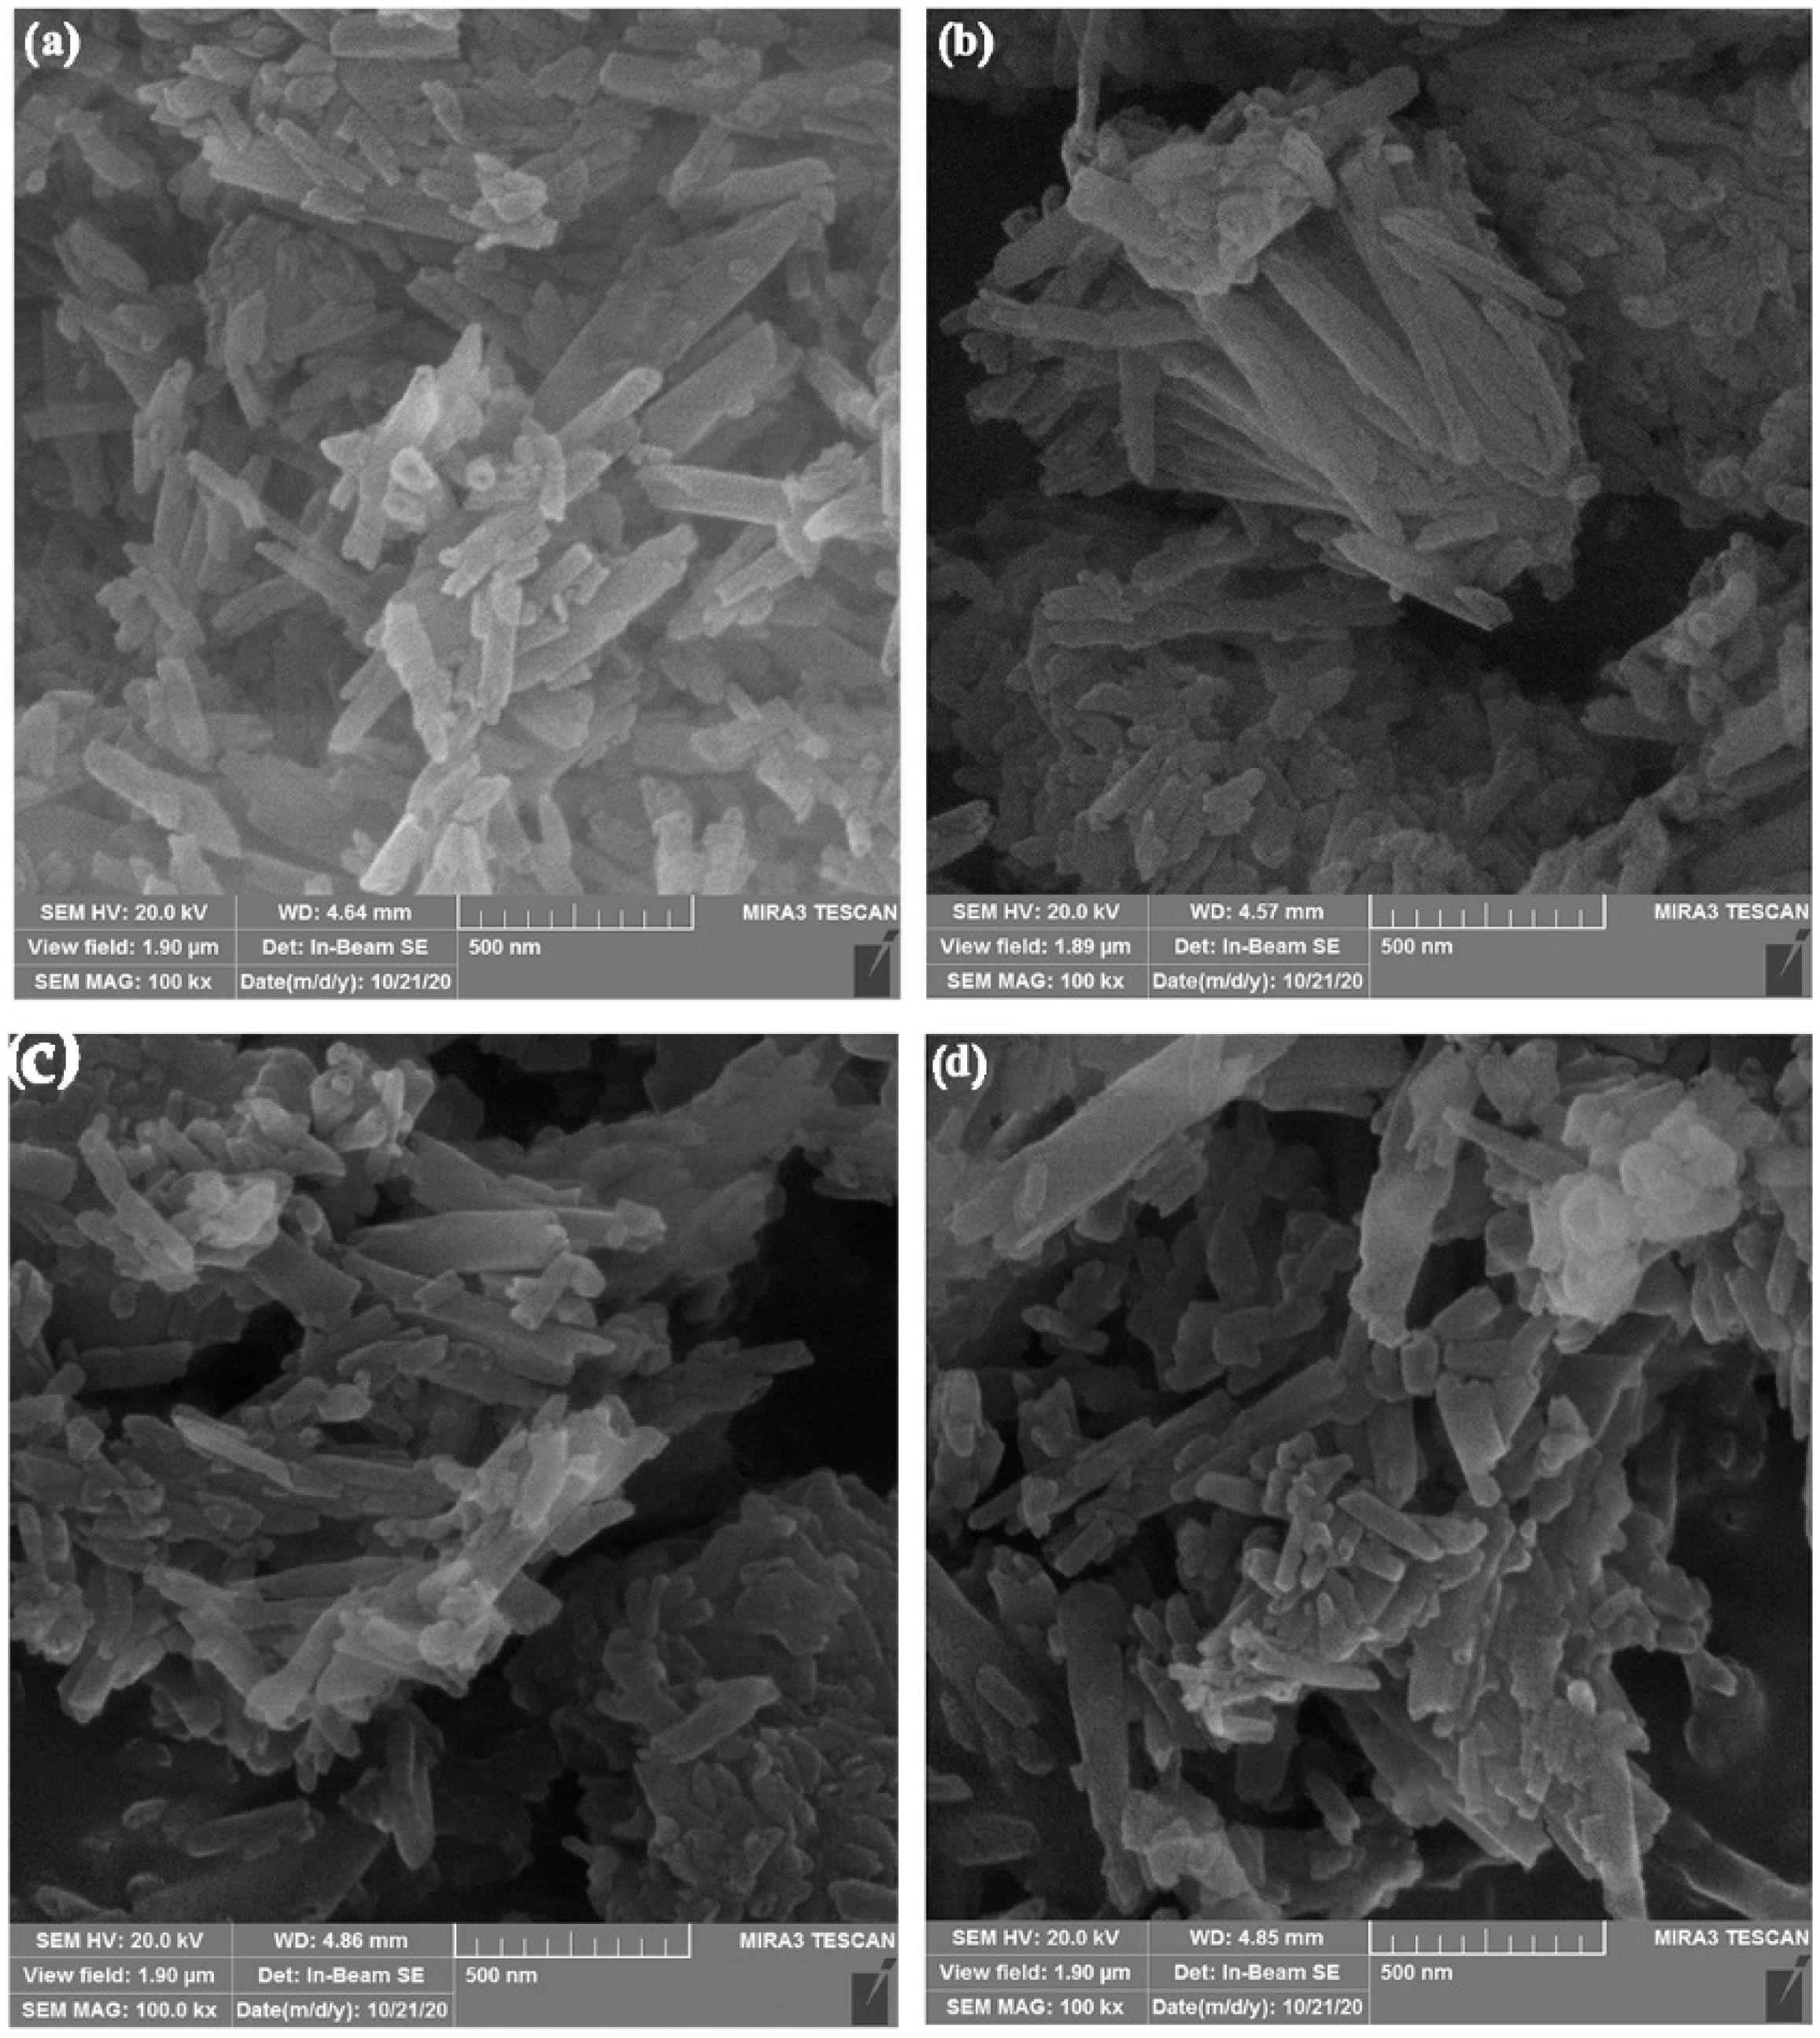
3.1. Characterization of Silicates
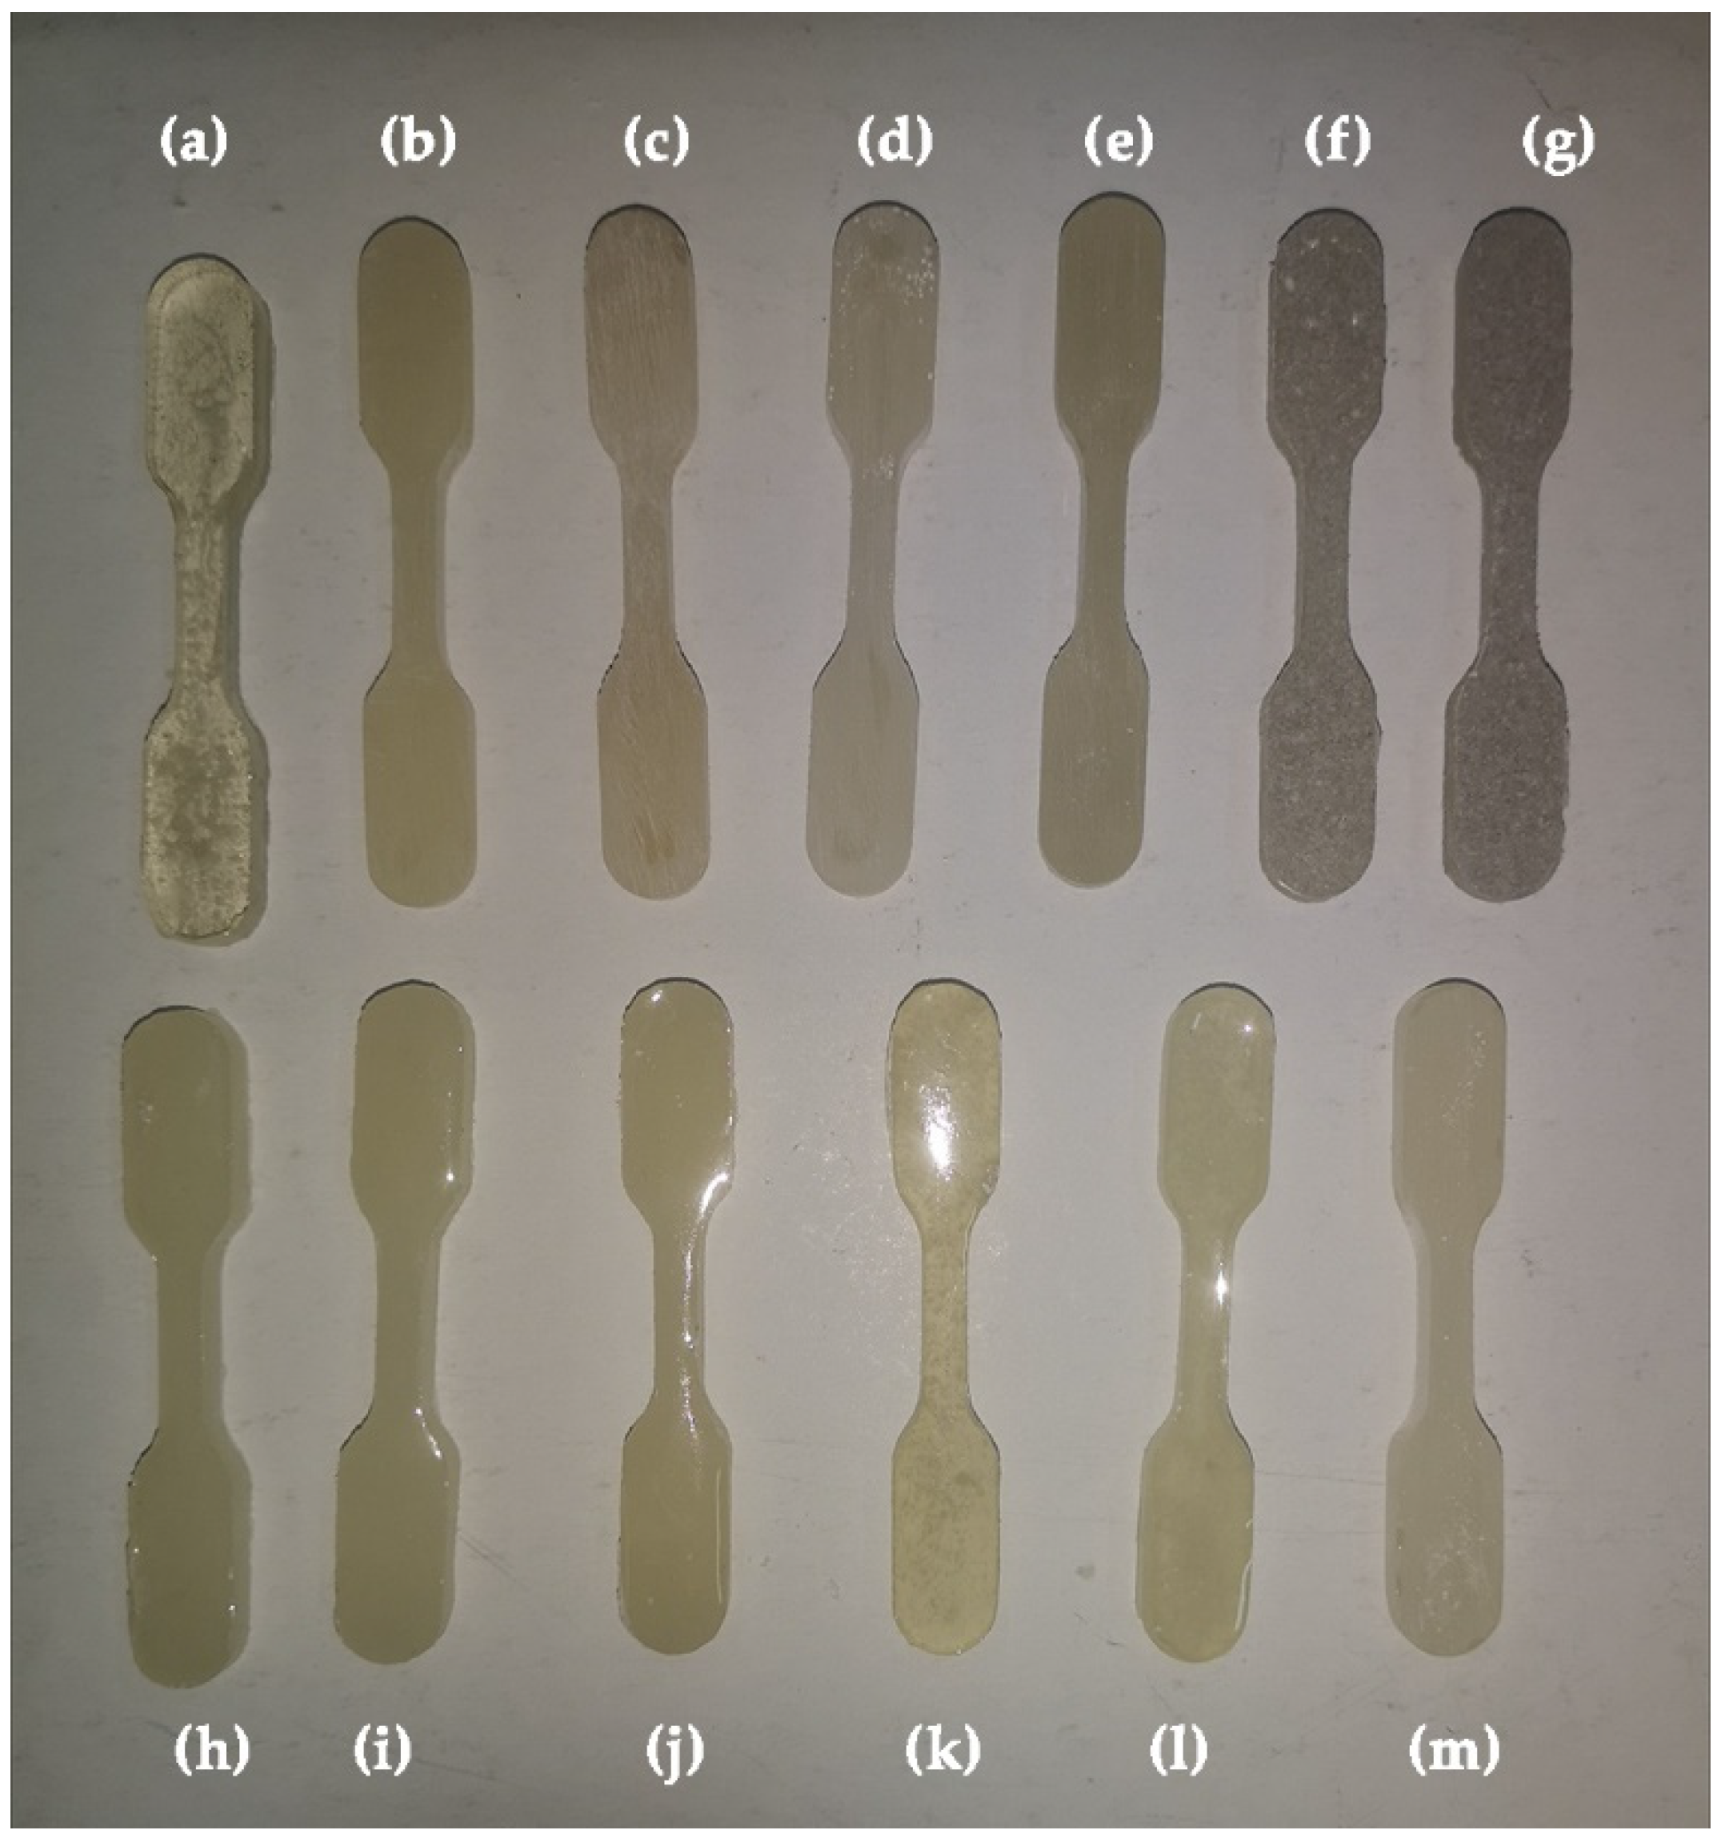
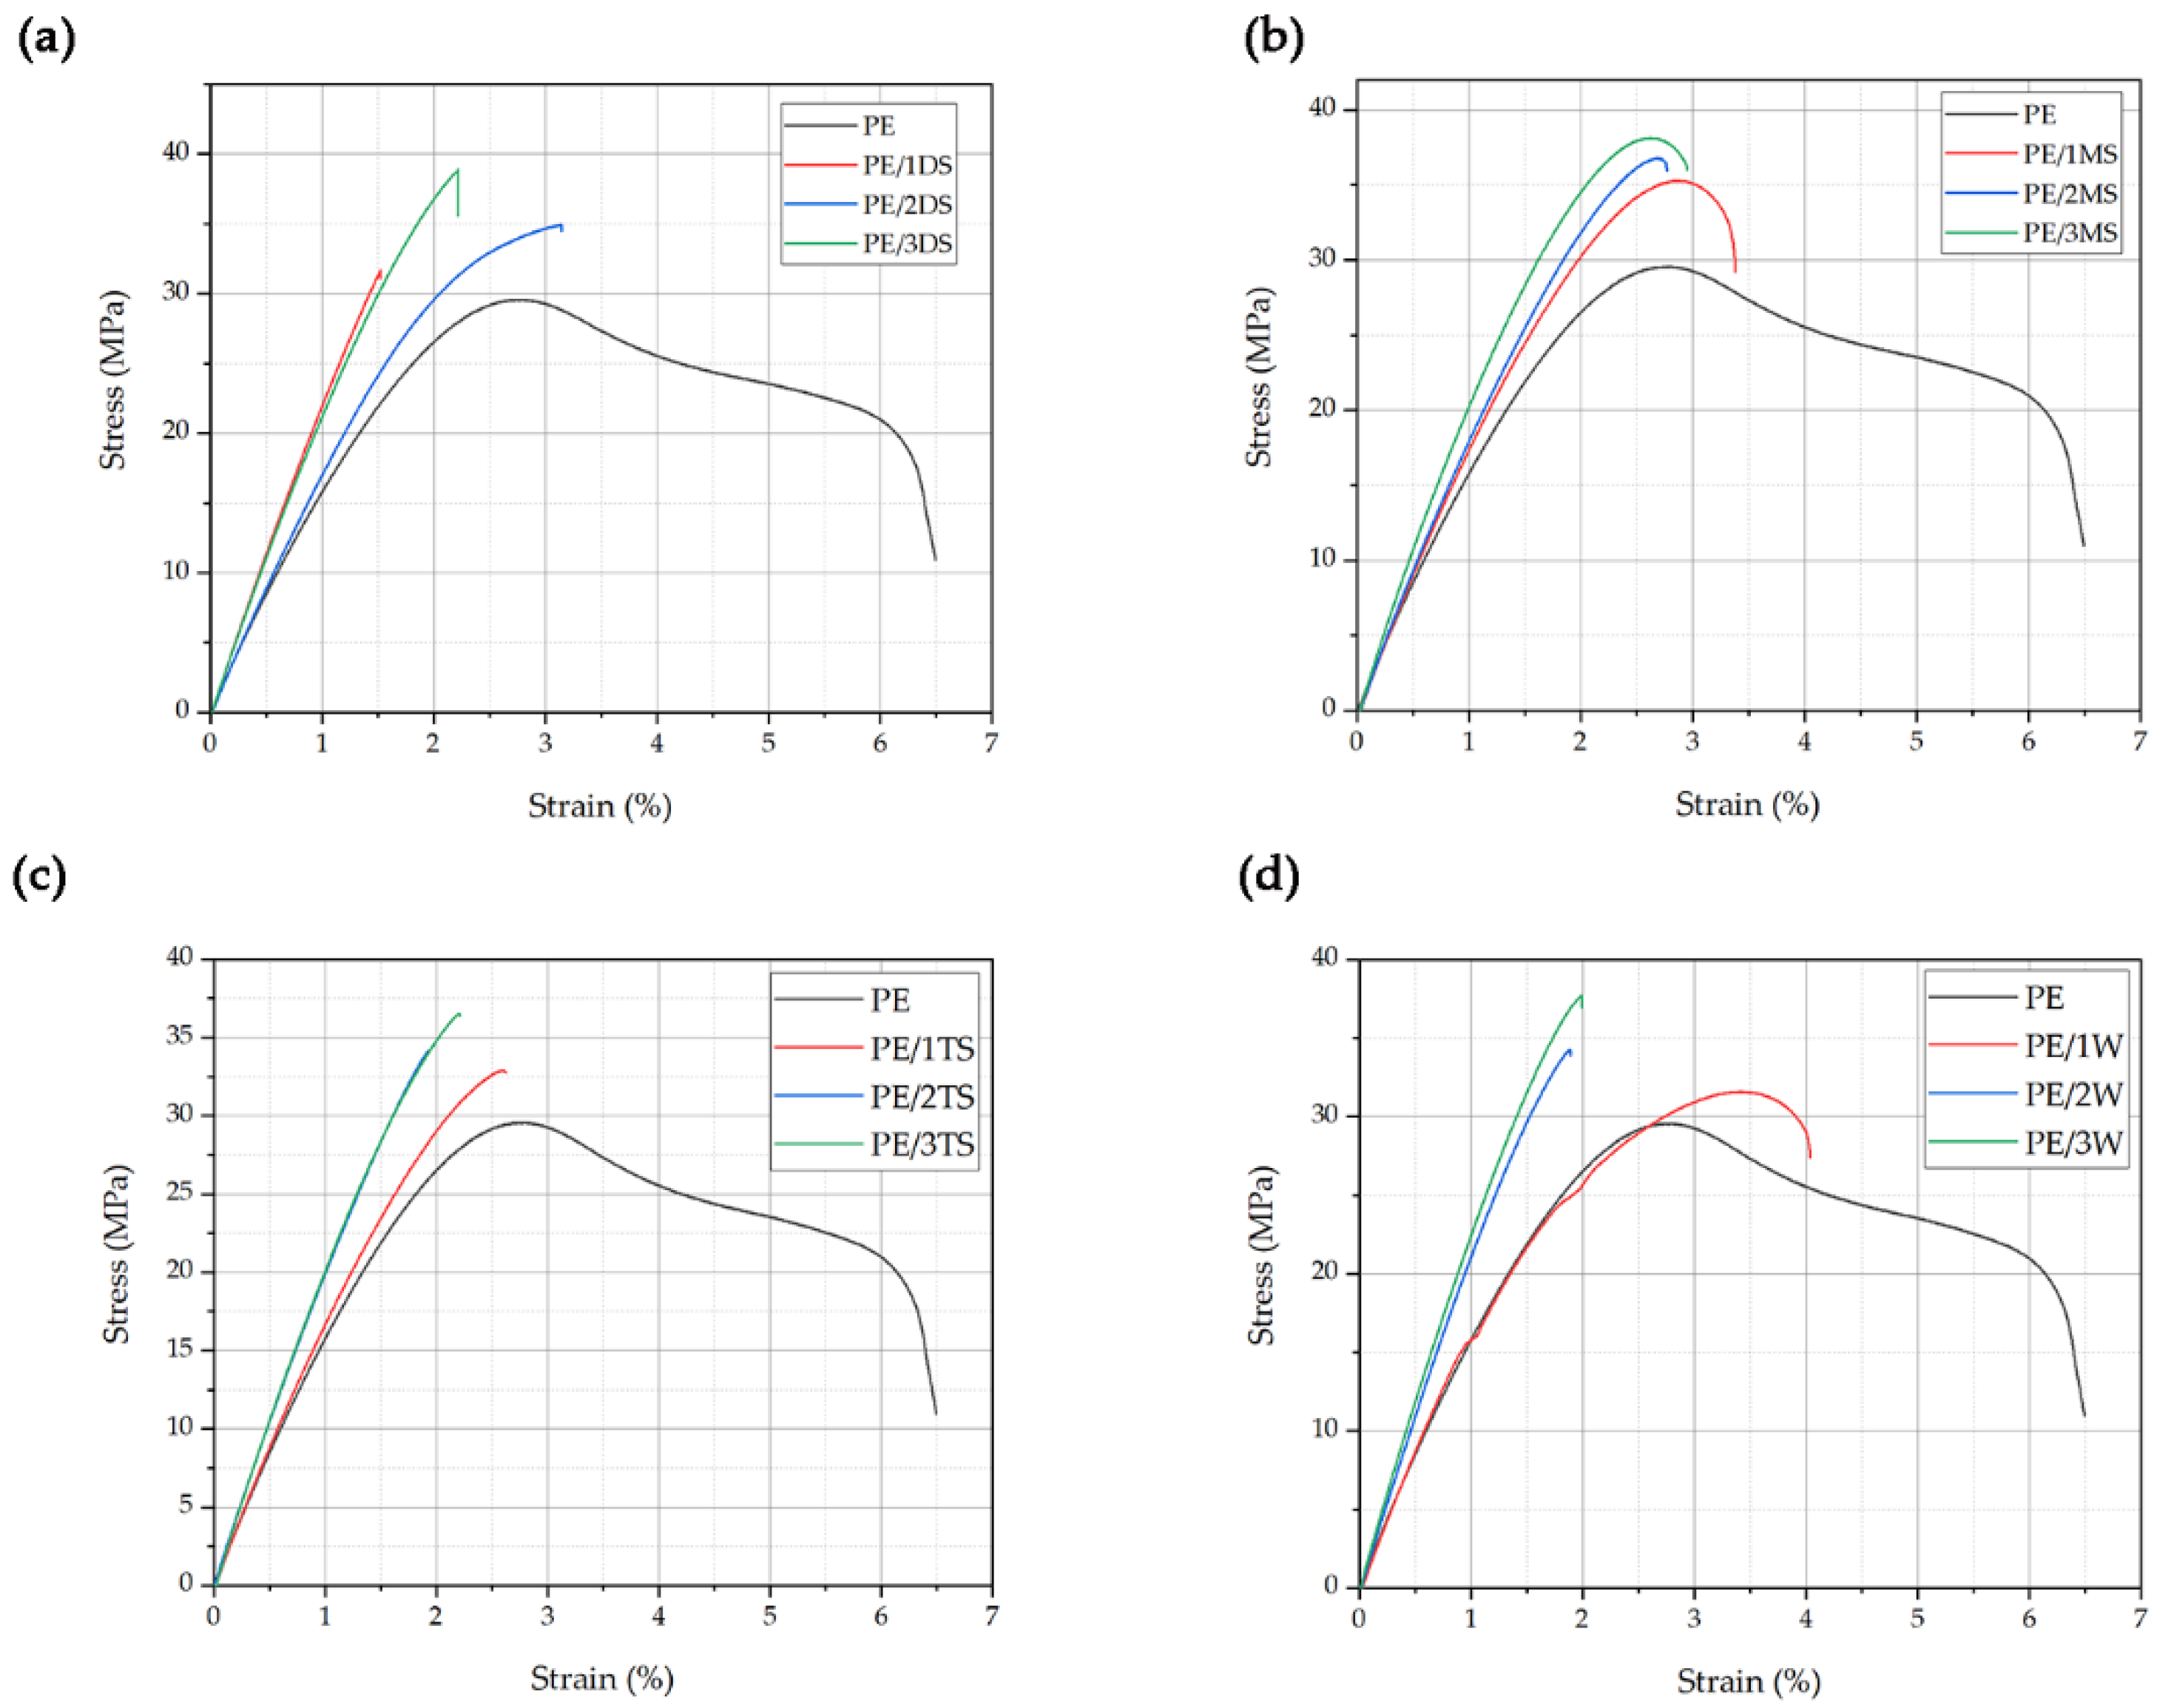
3.2. Tensile Properties of the Prepared Composite Materials
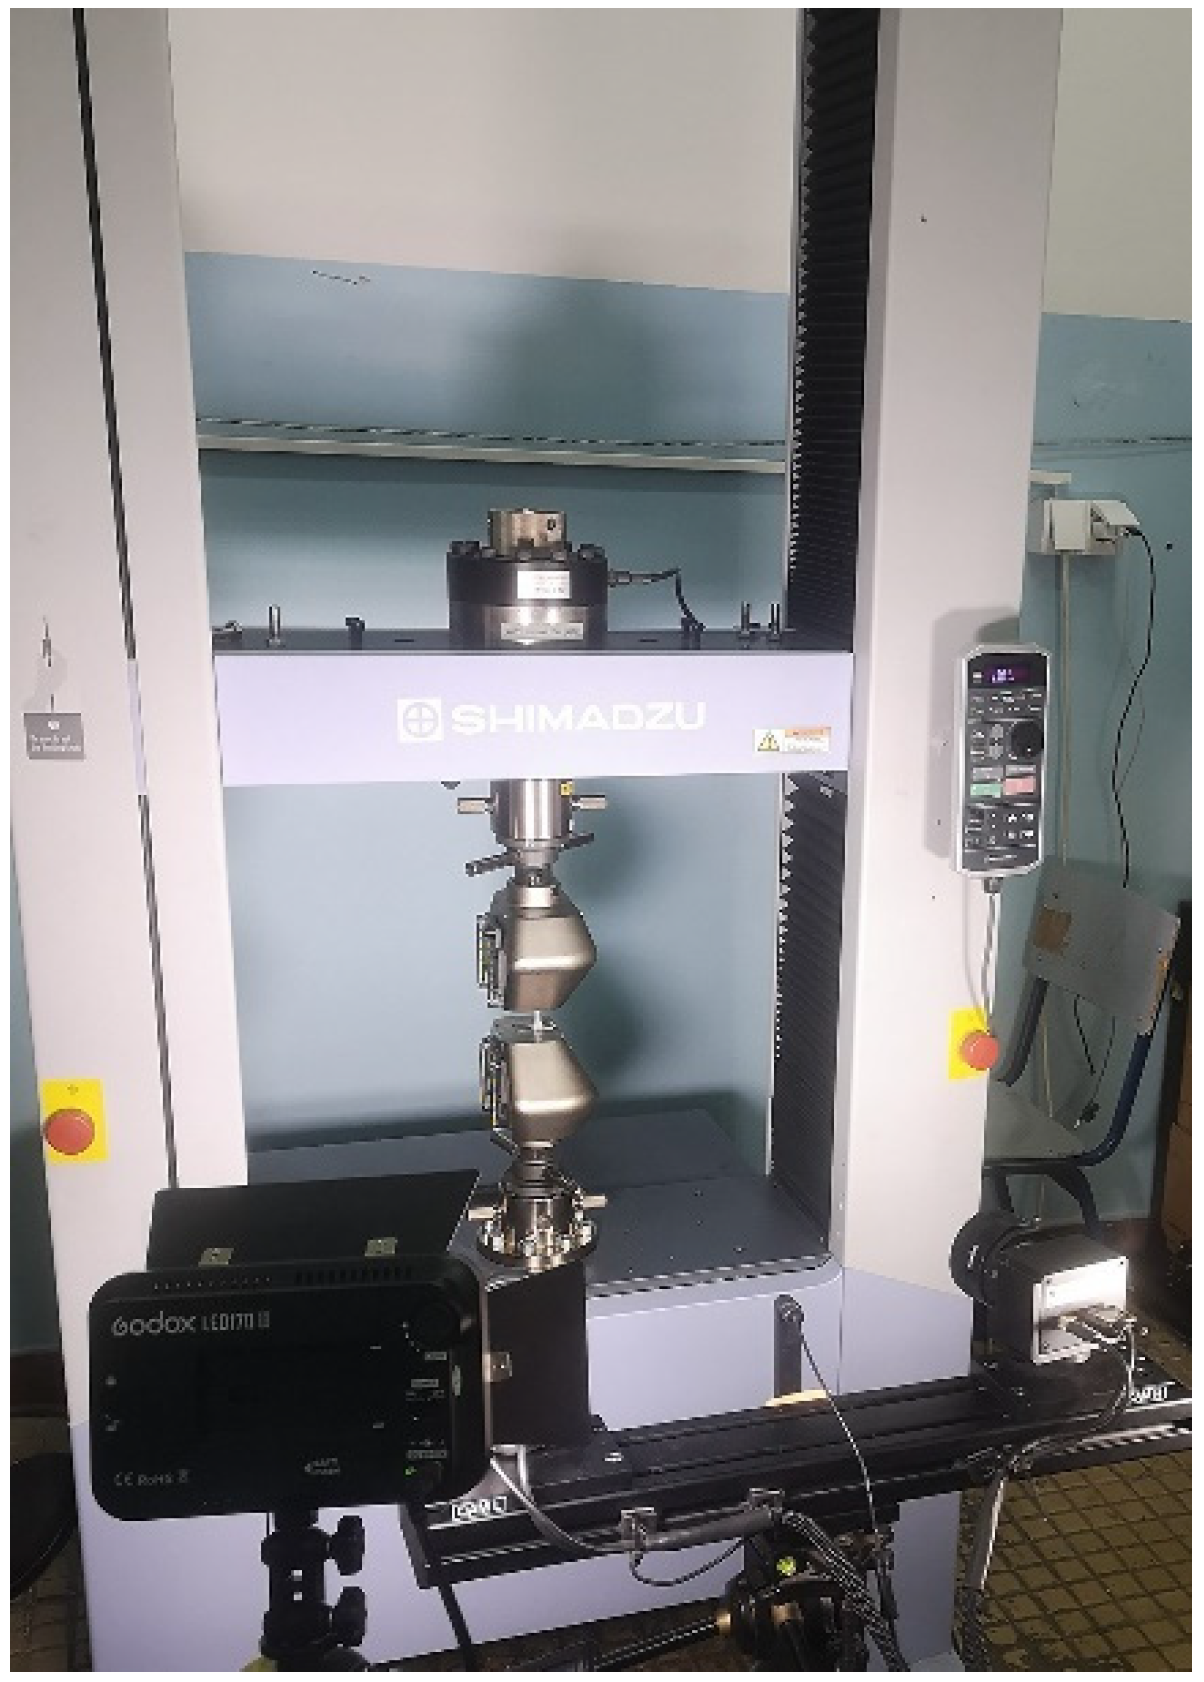
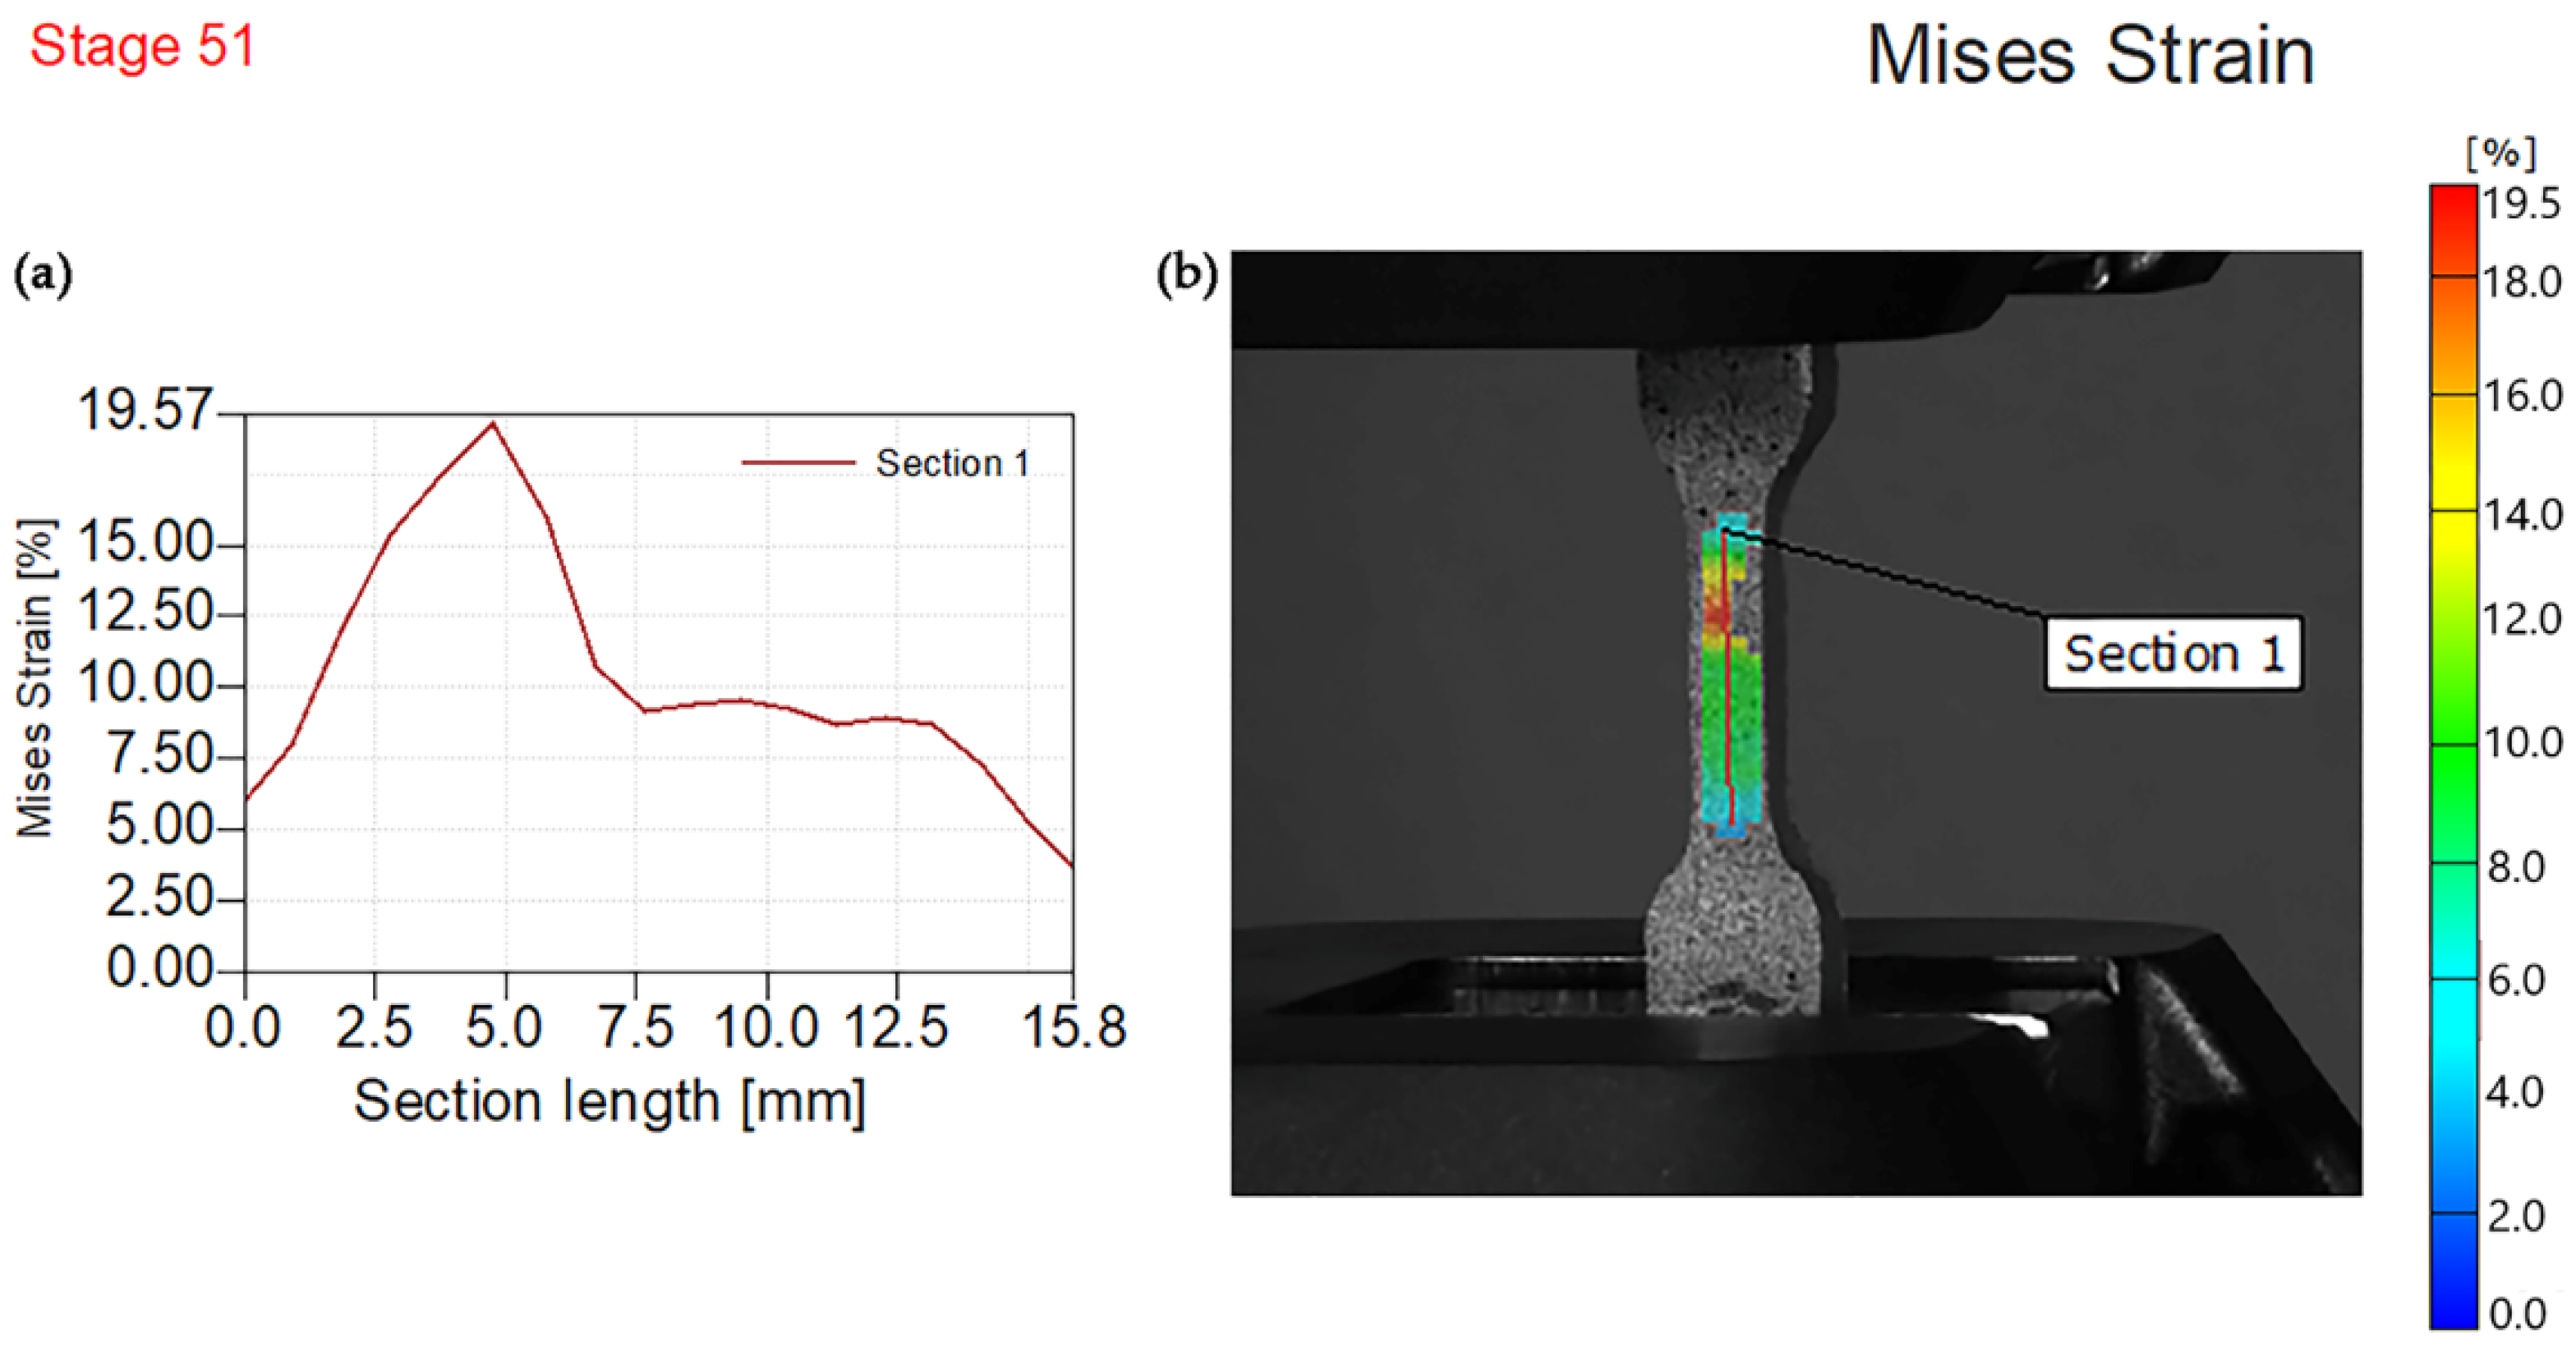
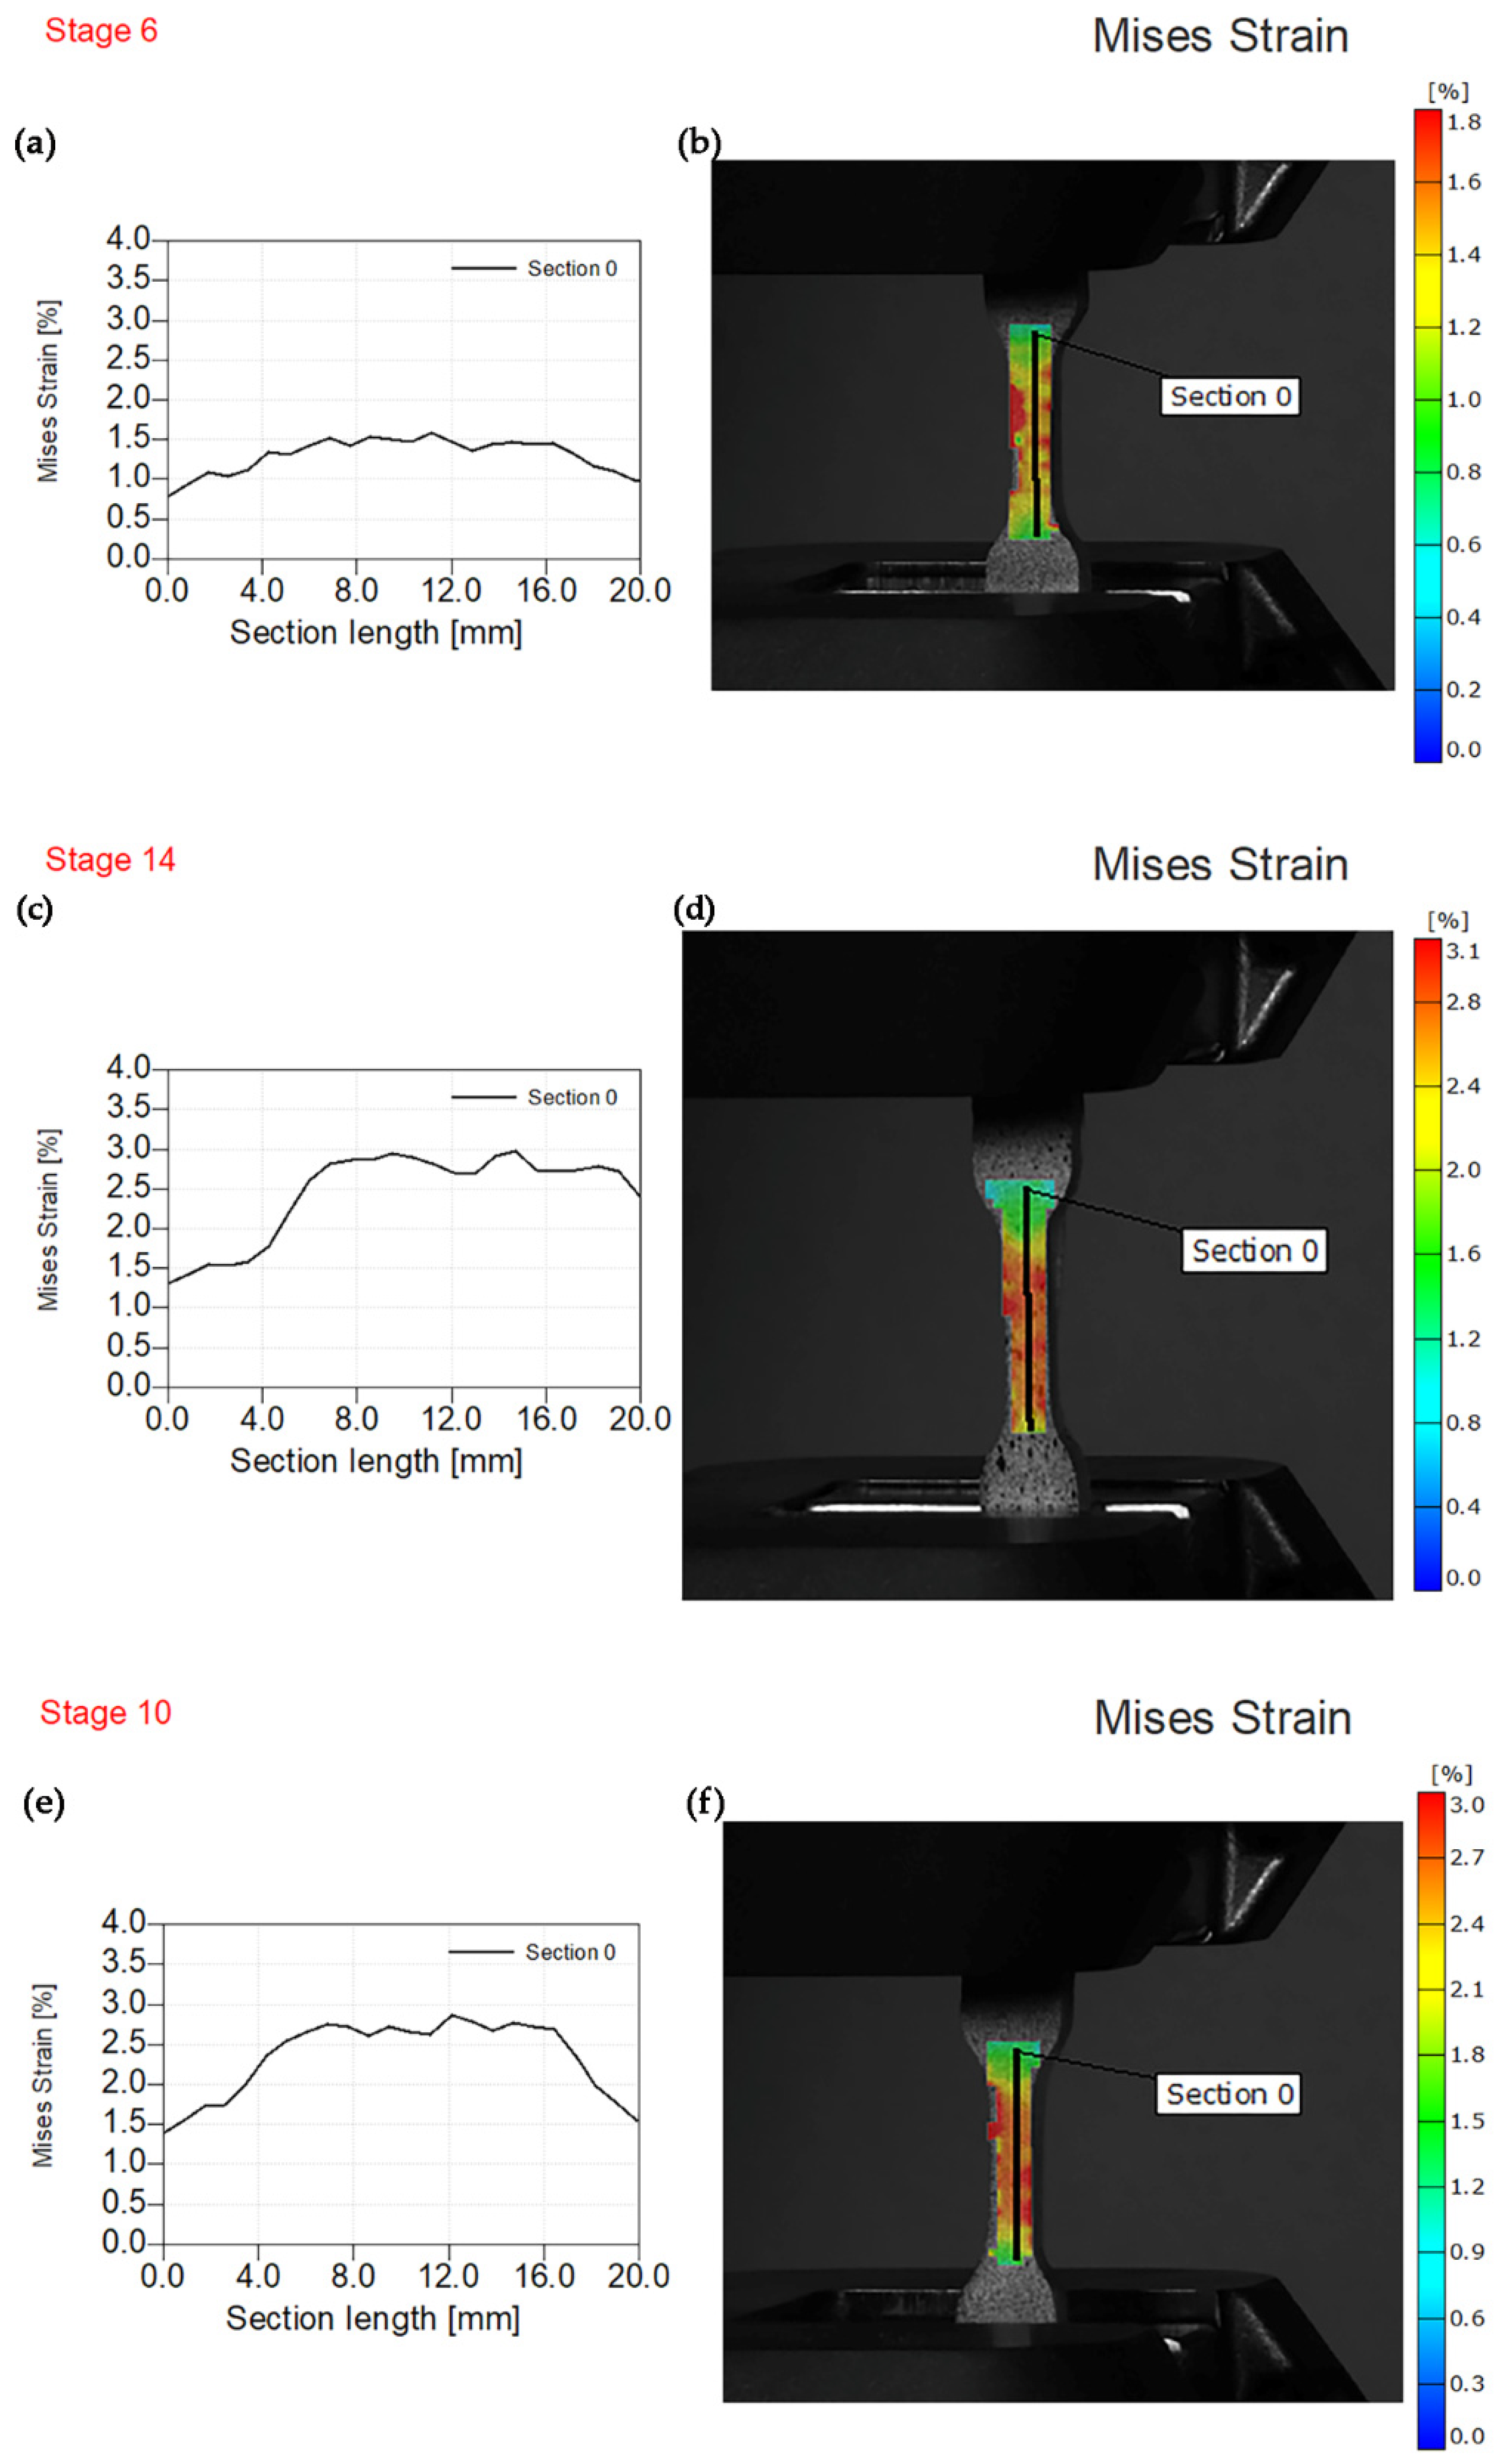
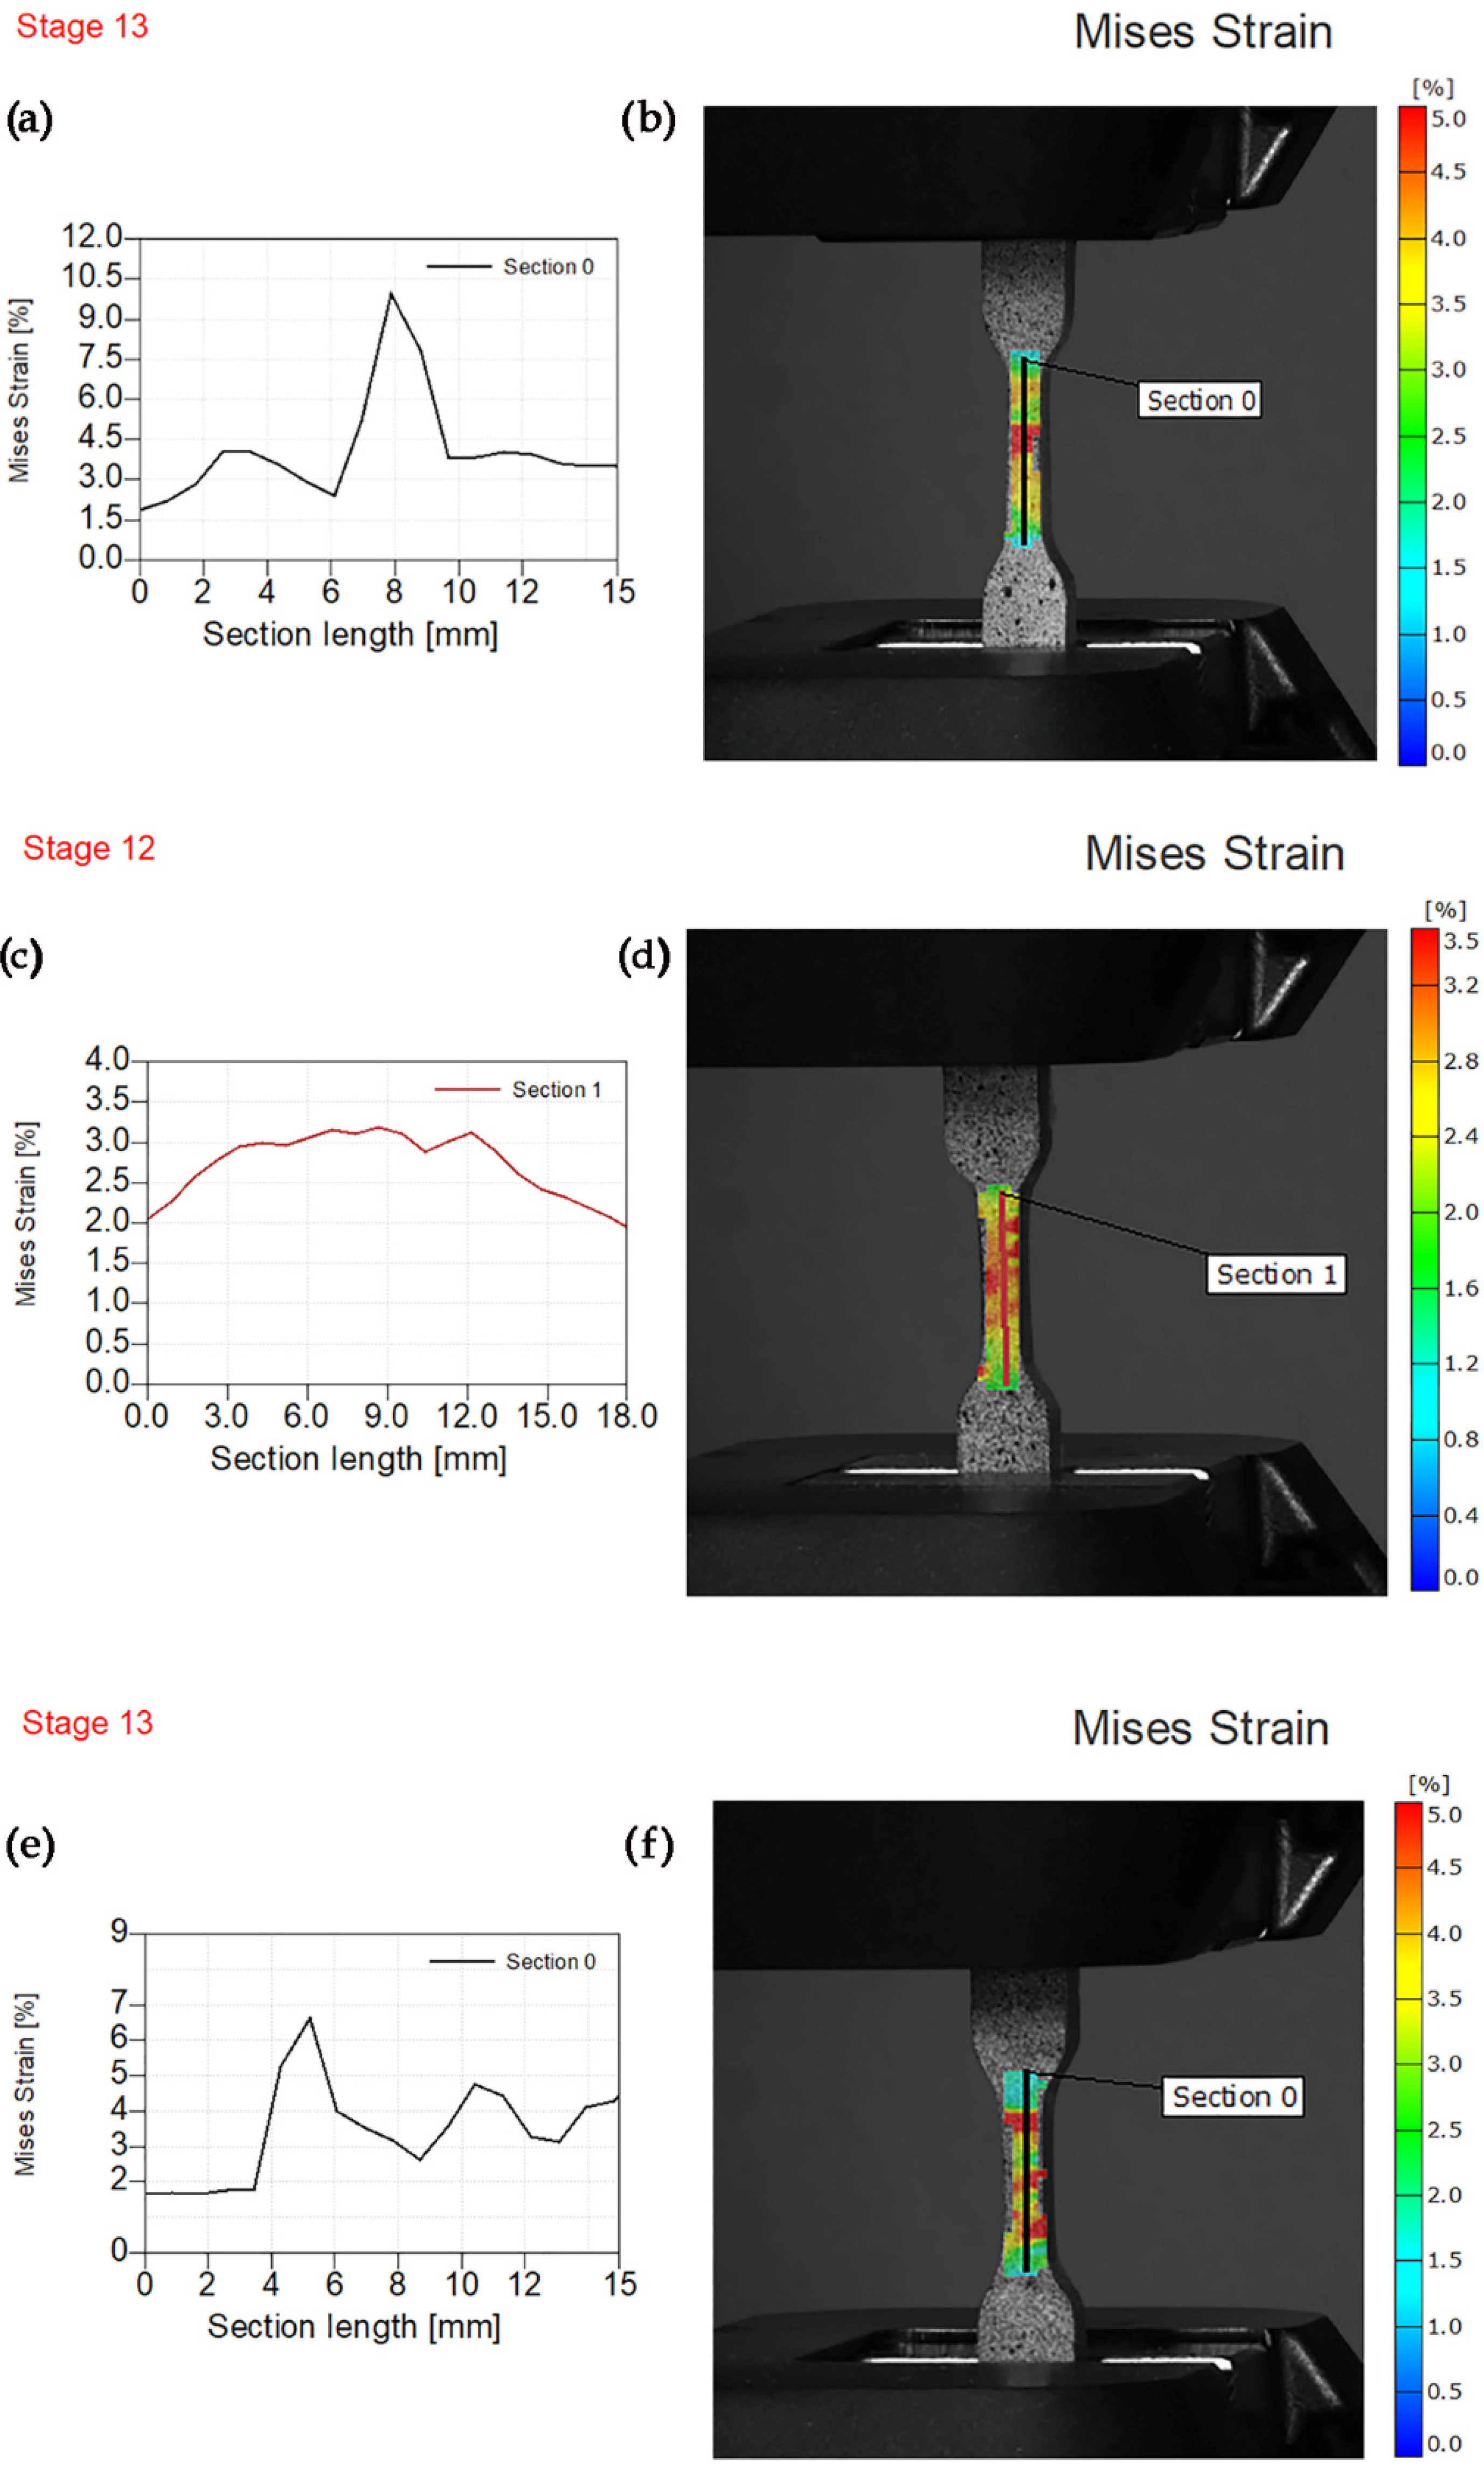
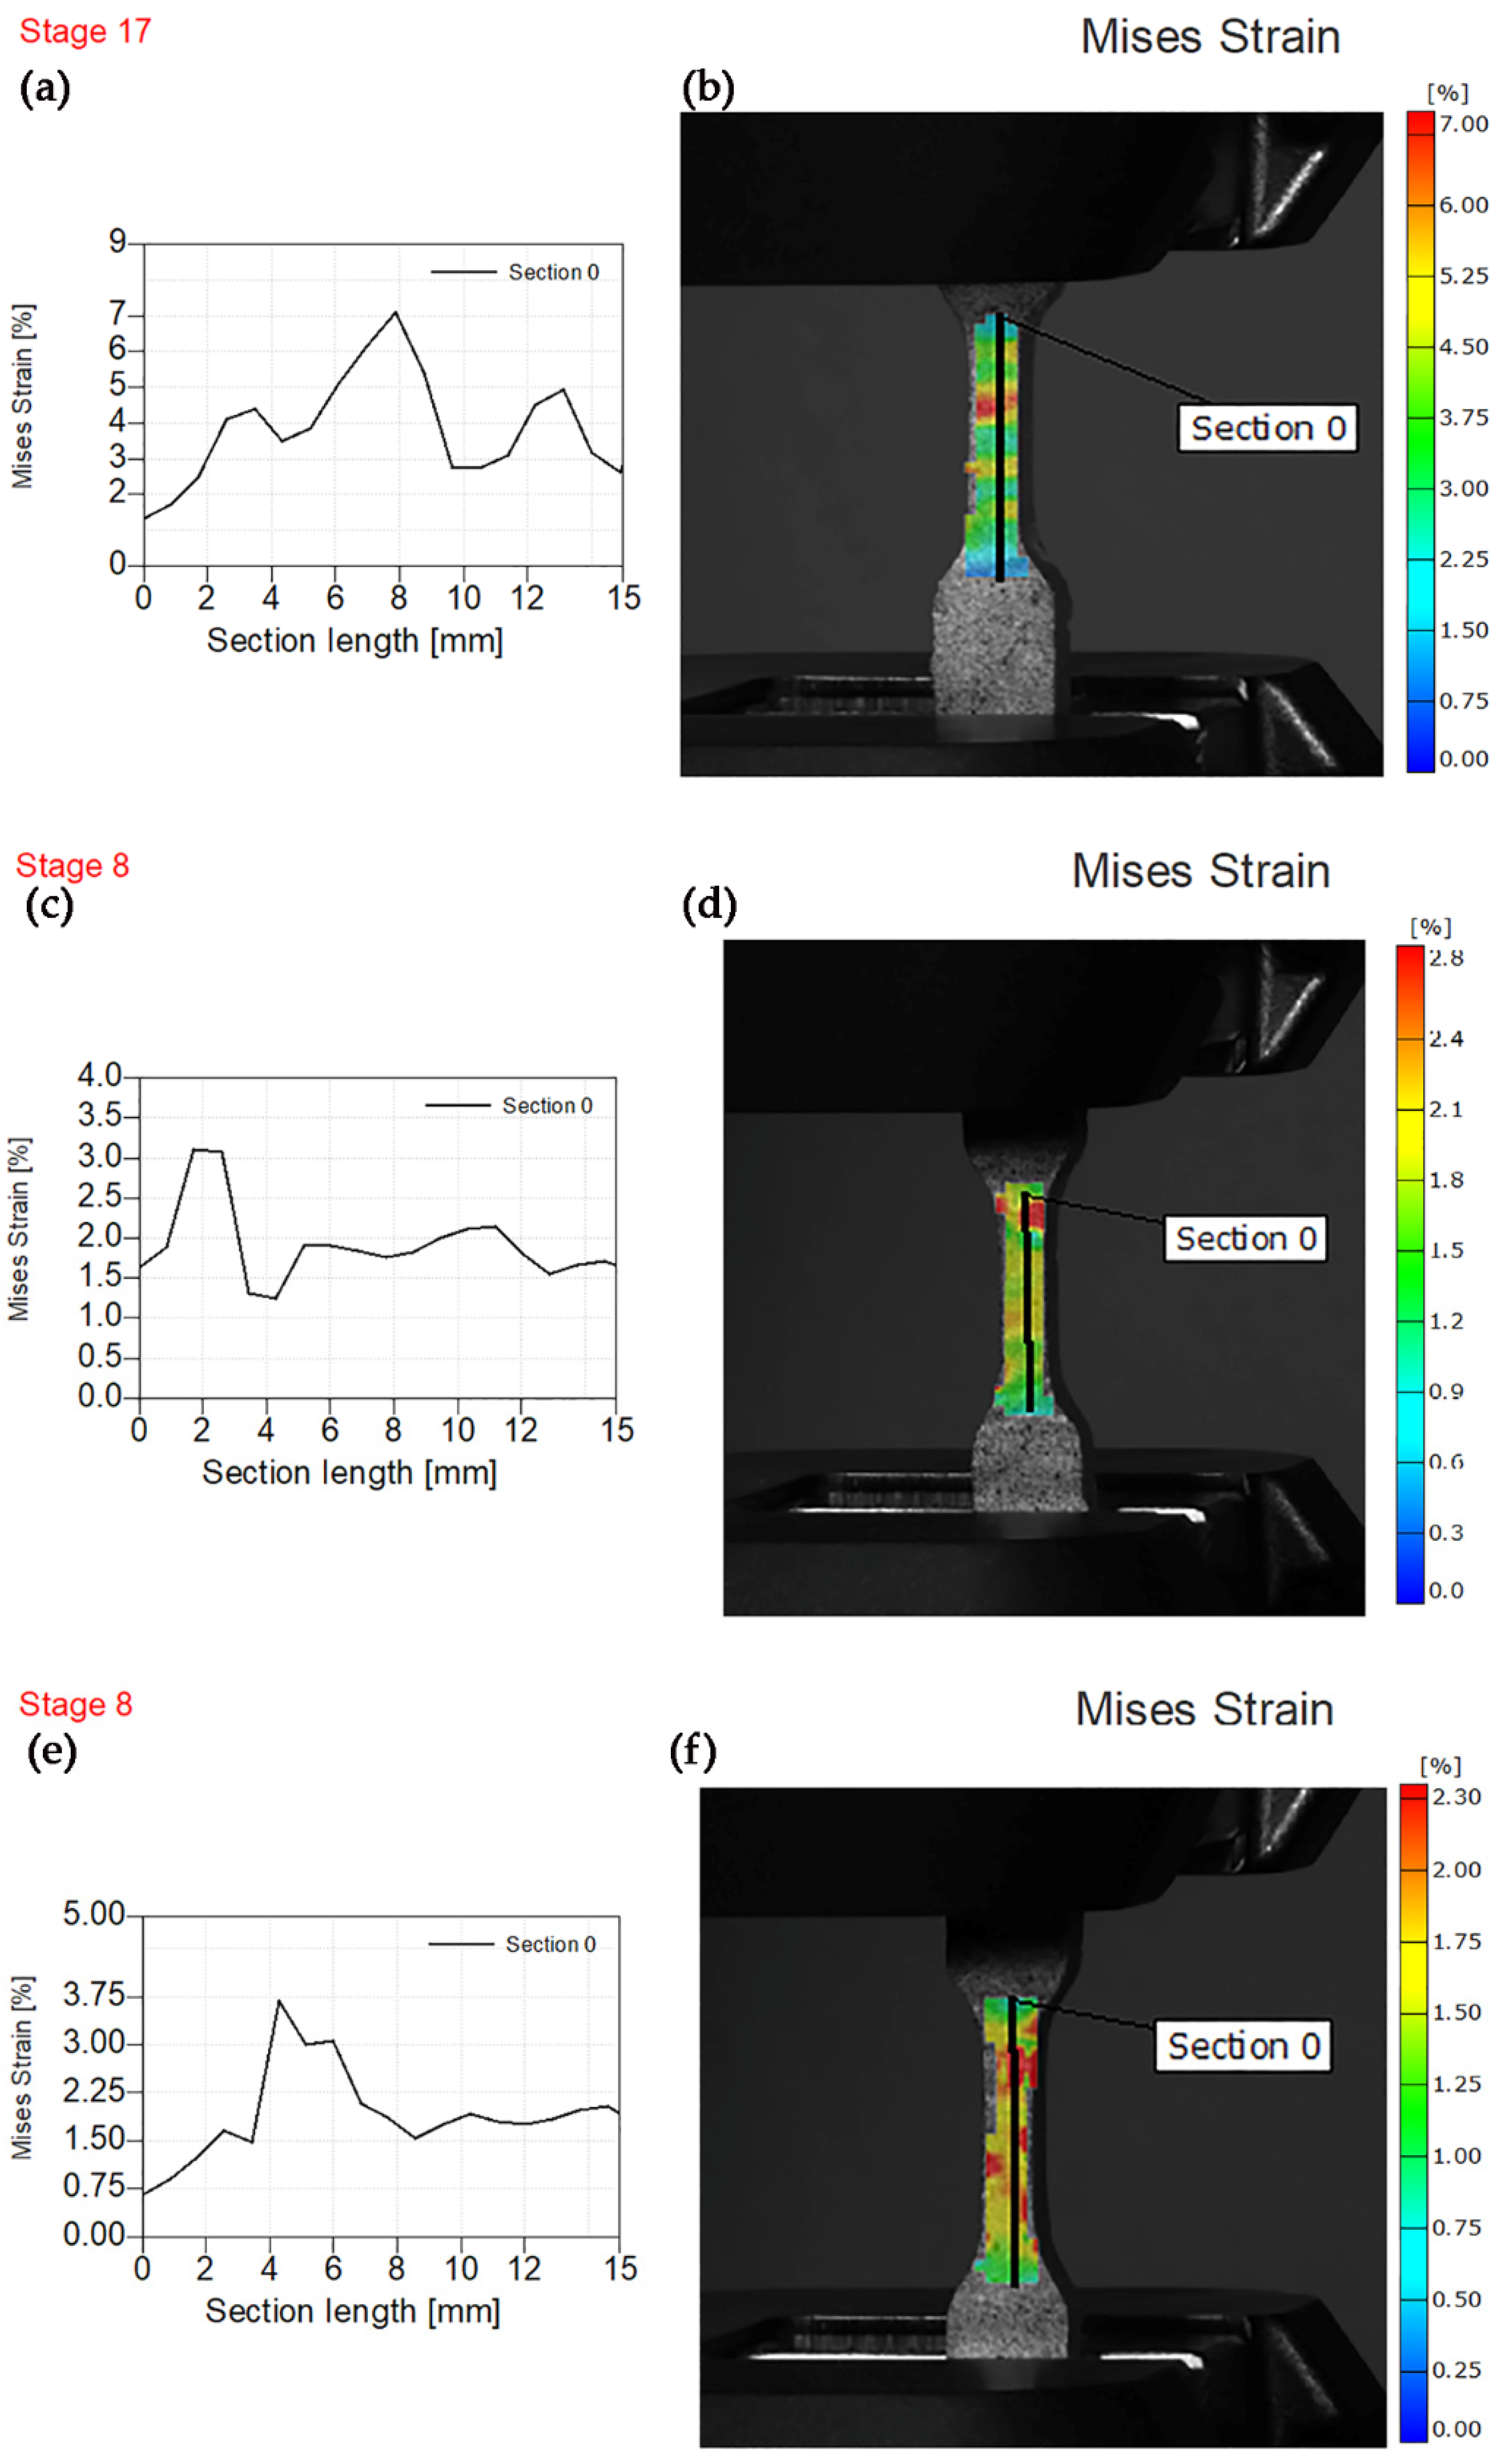
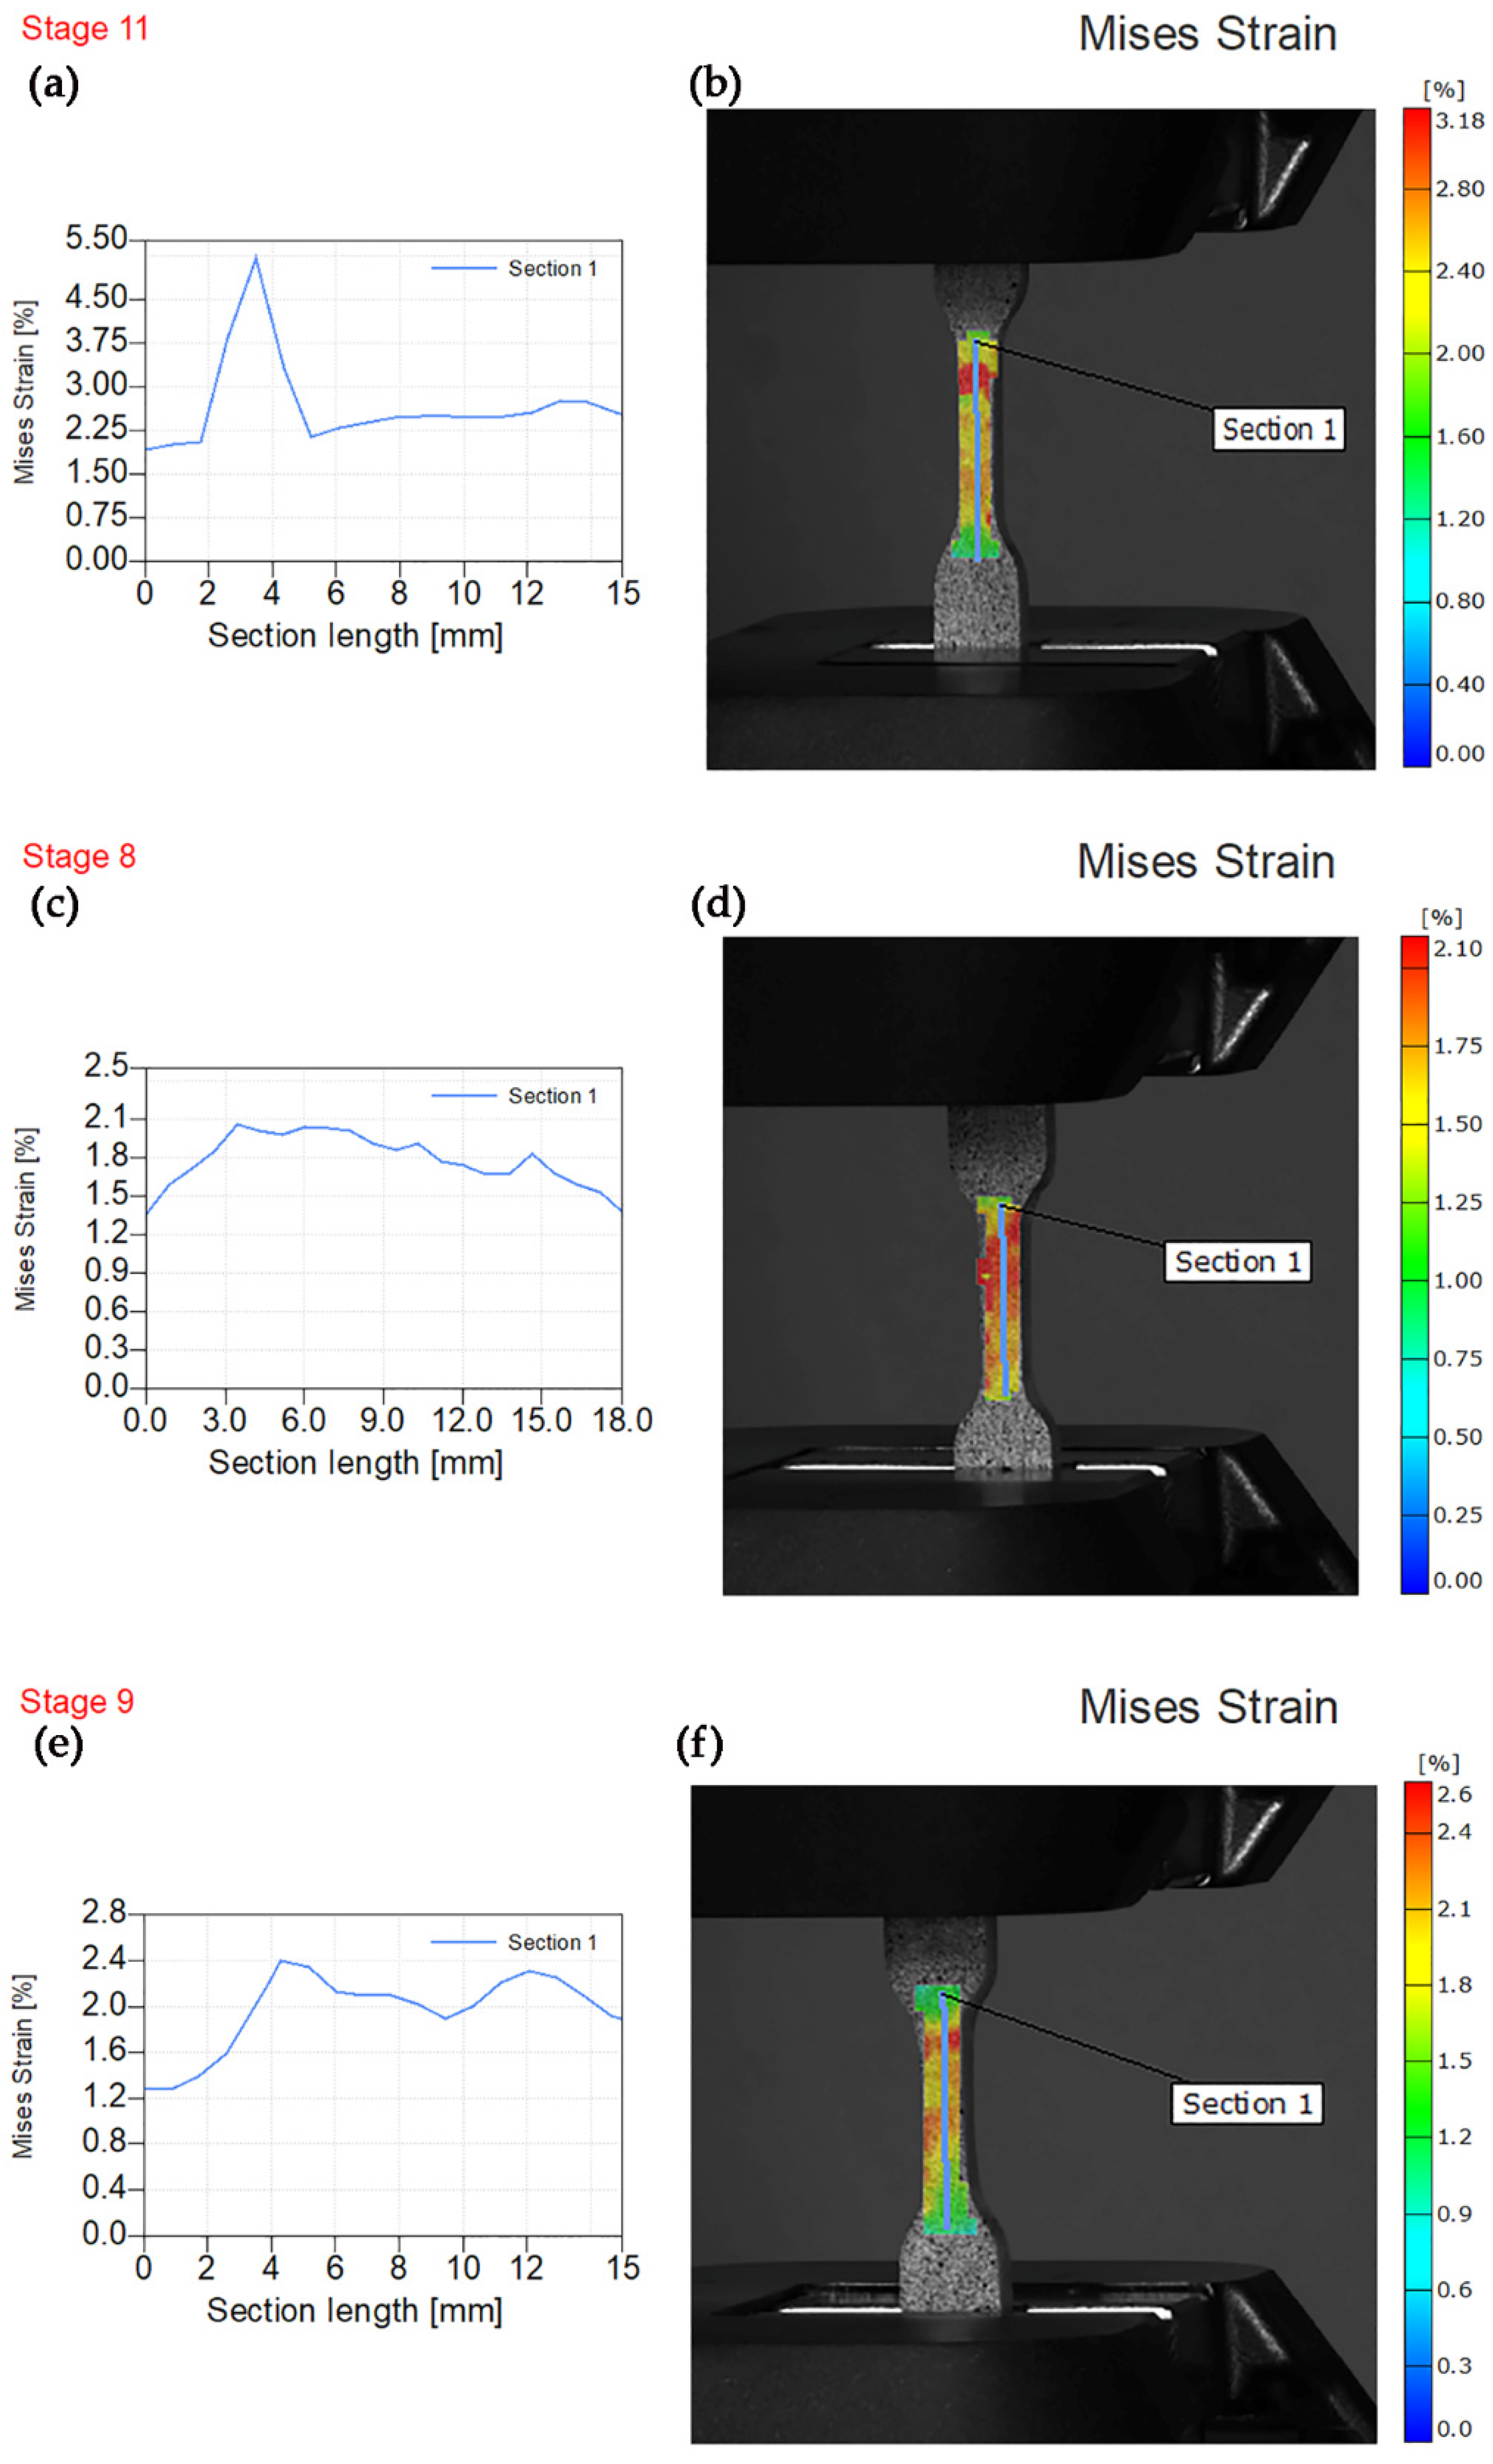
3.3. Digital Image Correlation
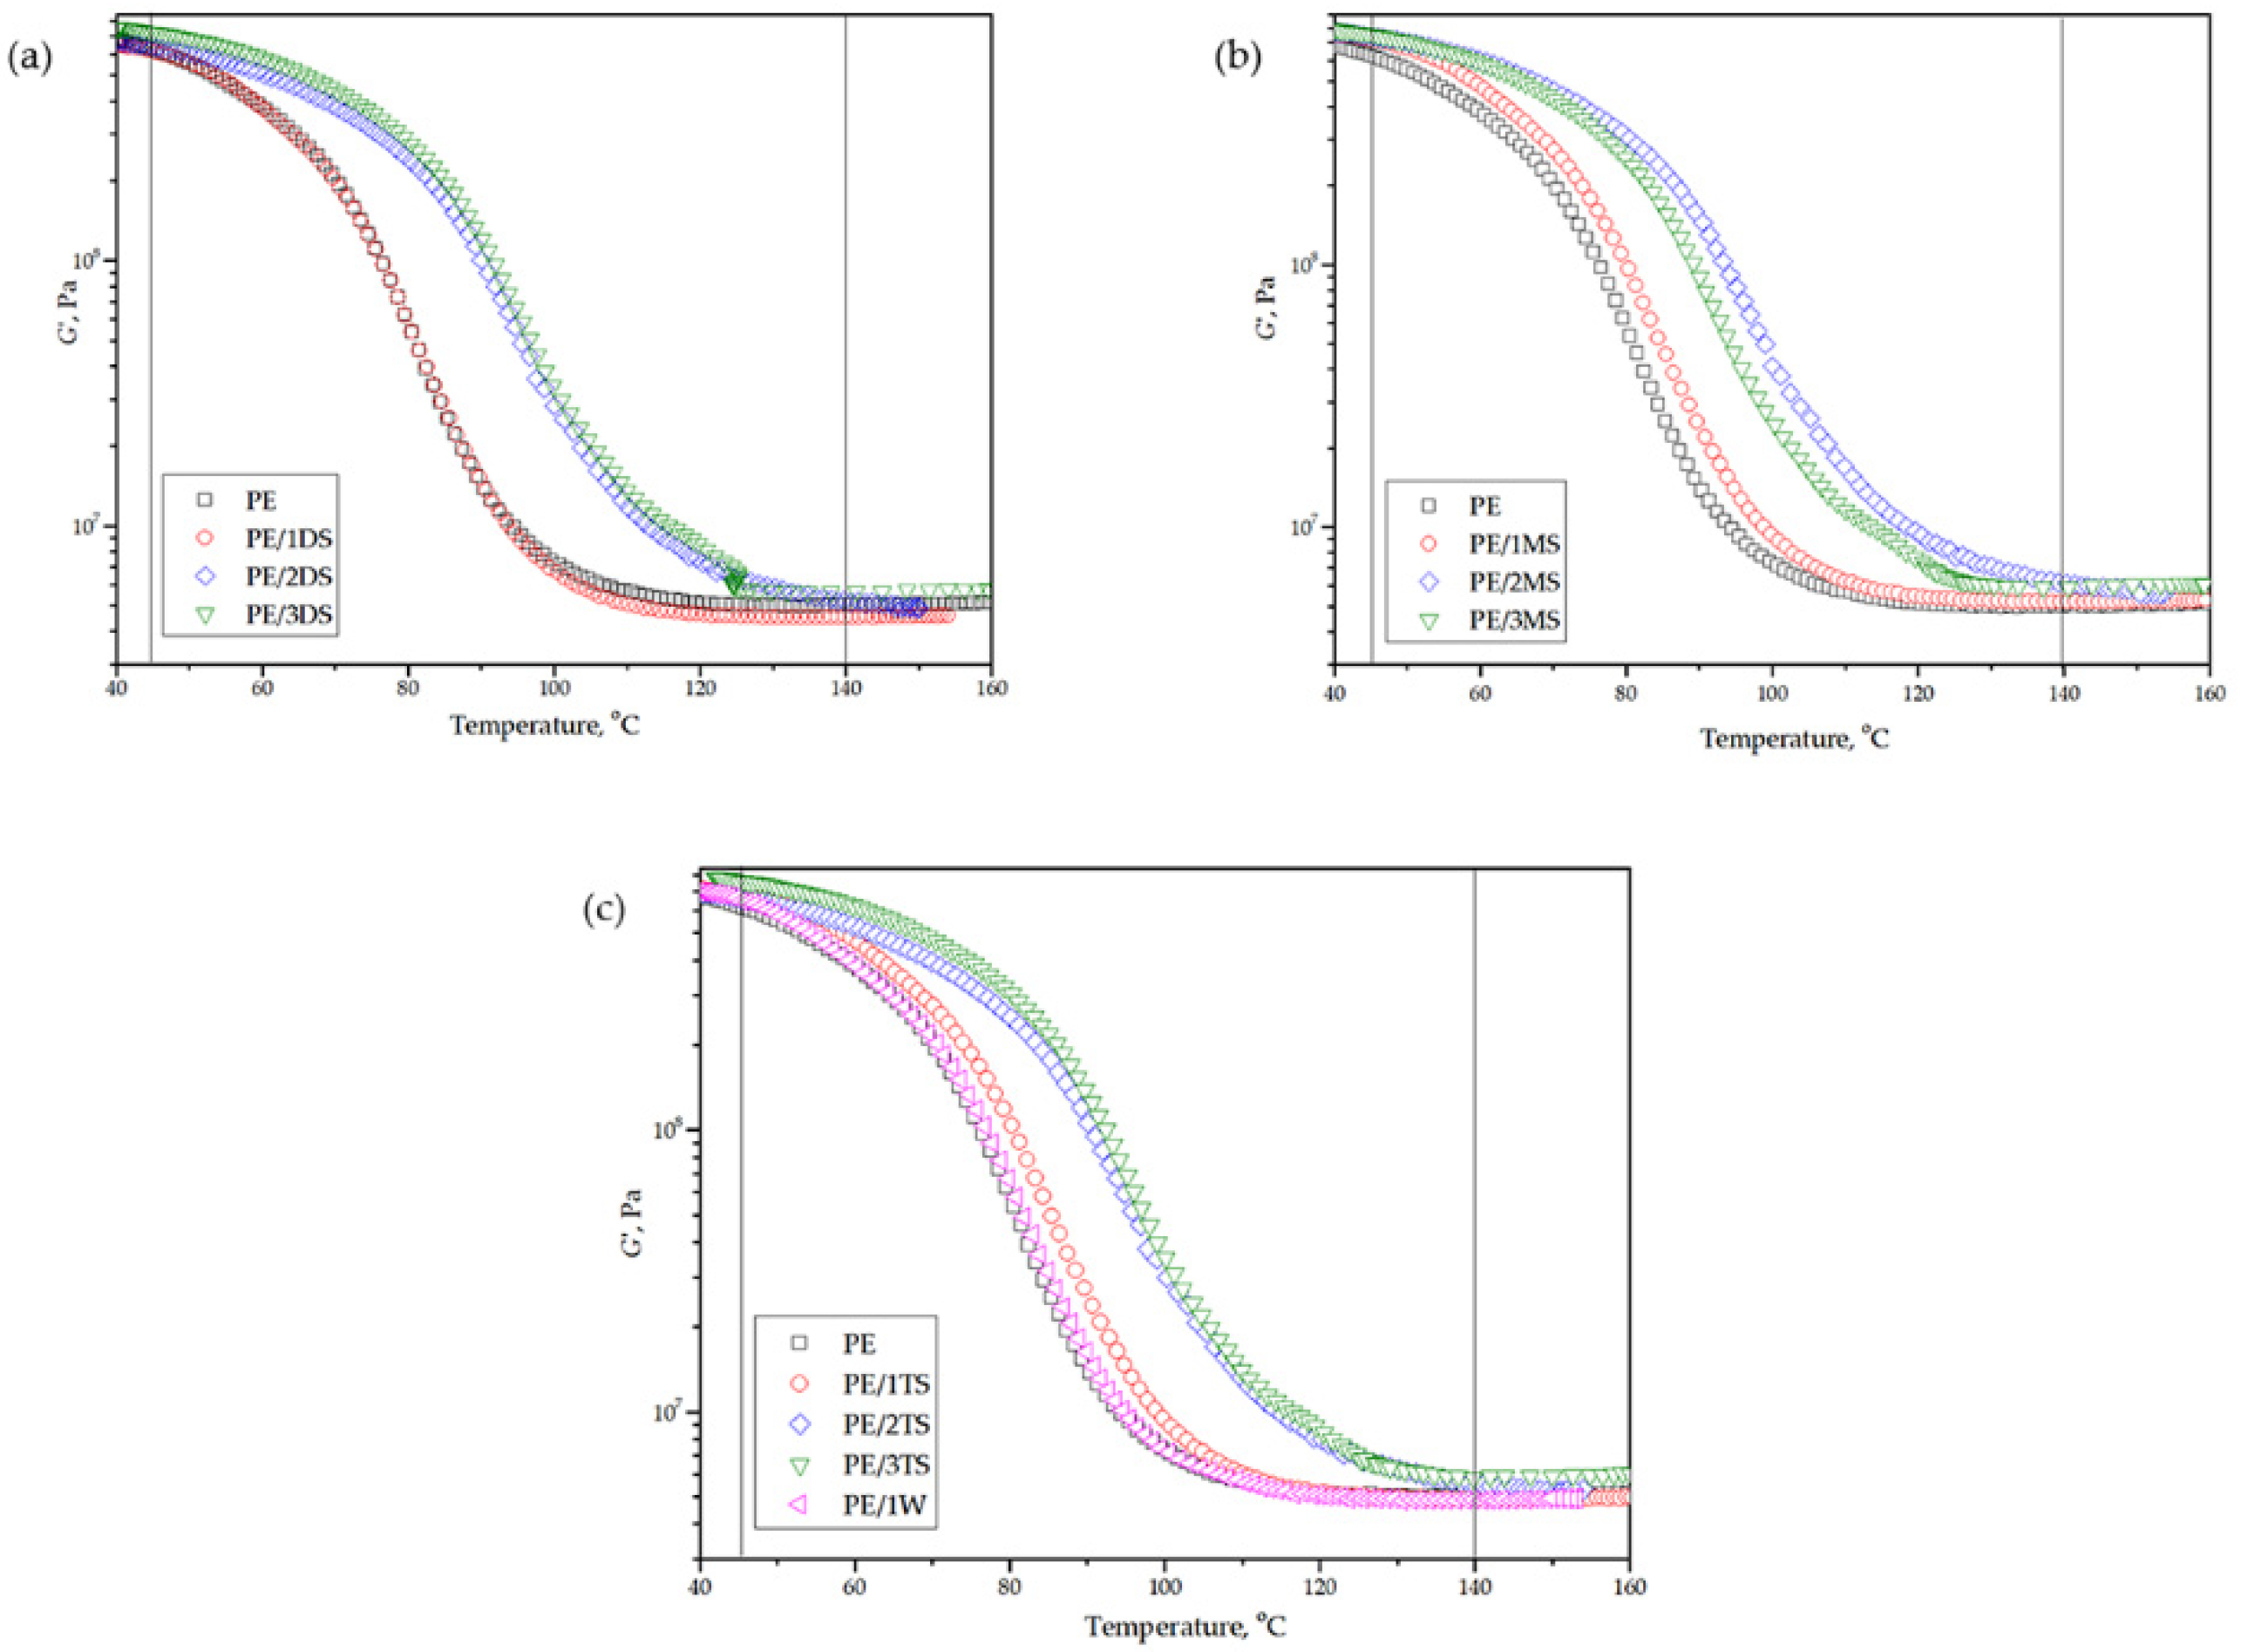
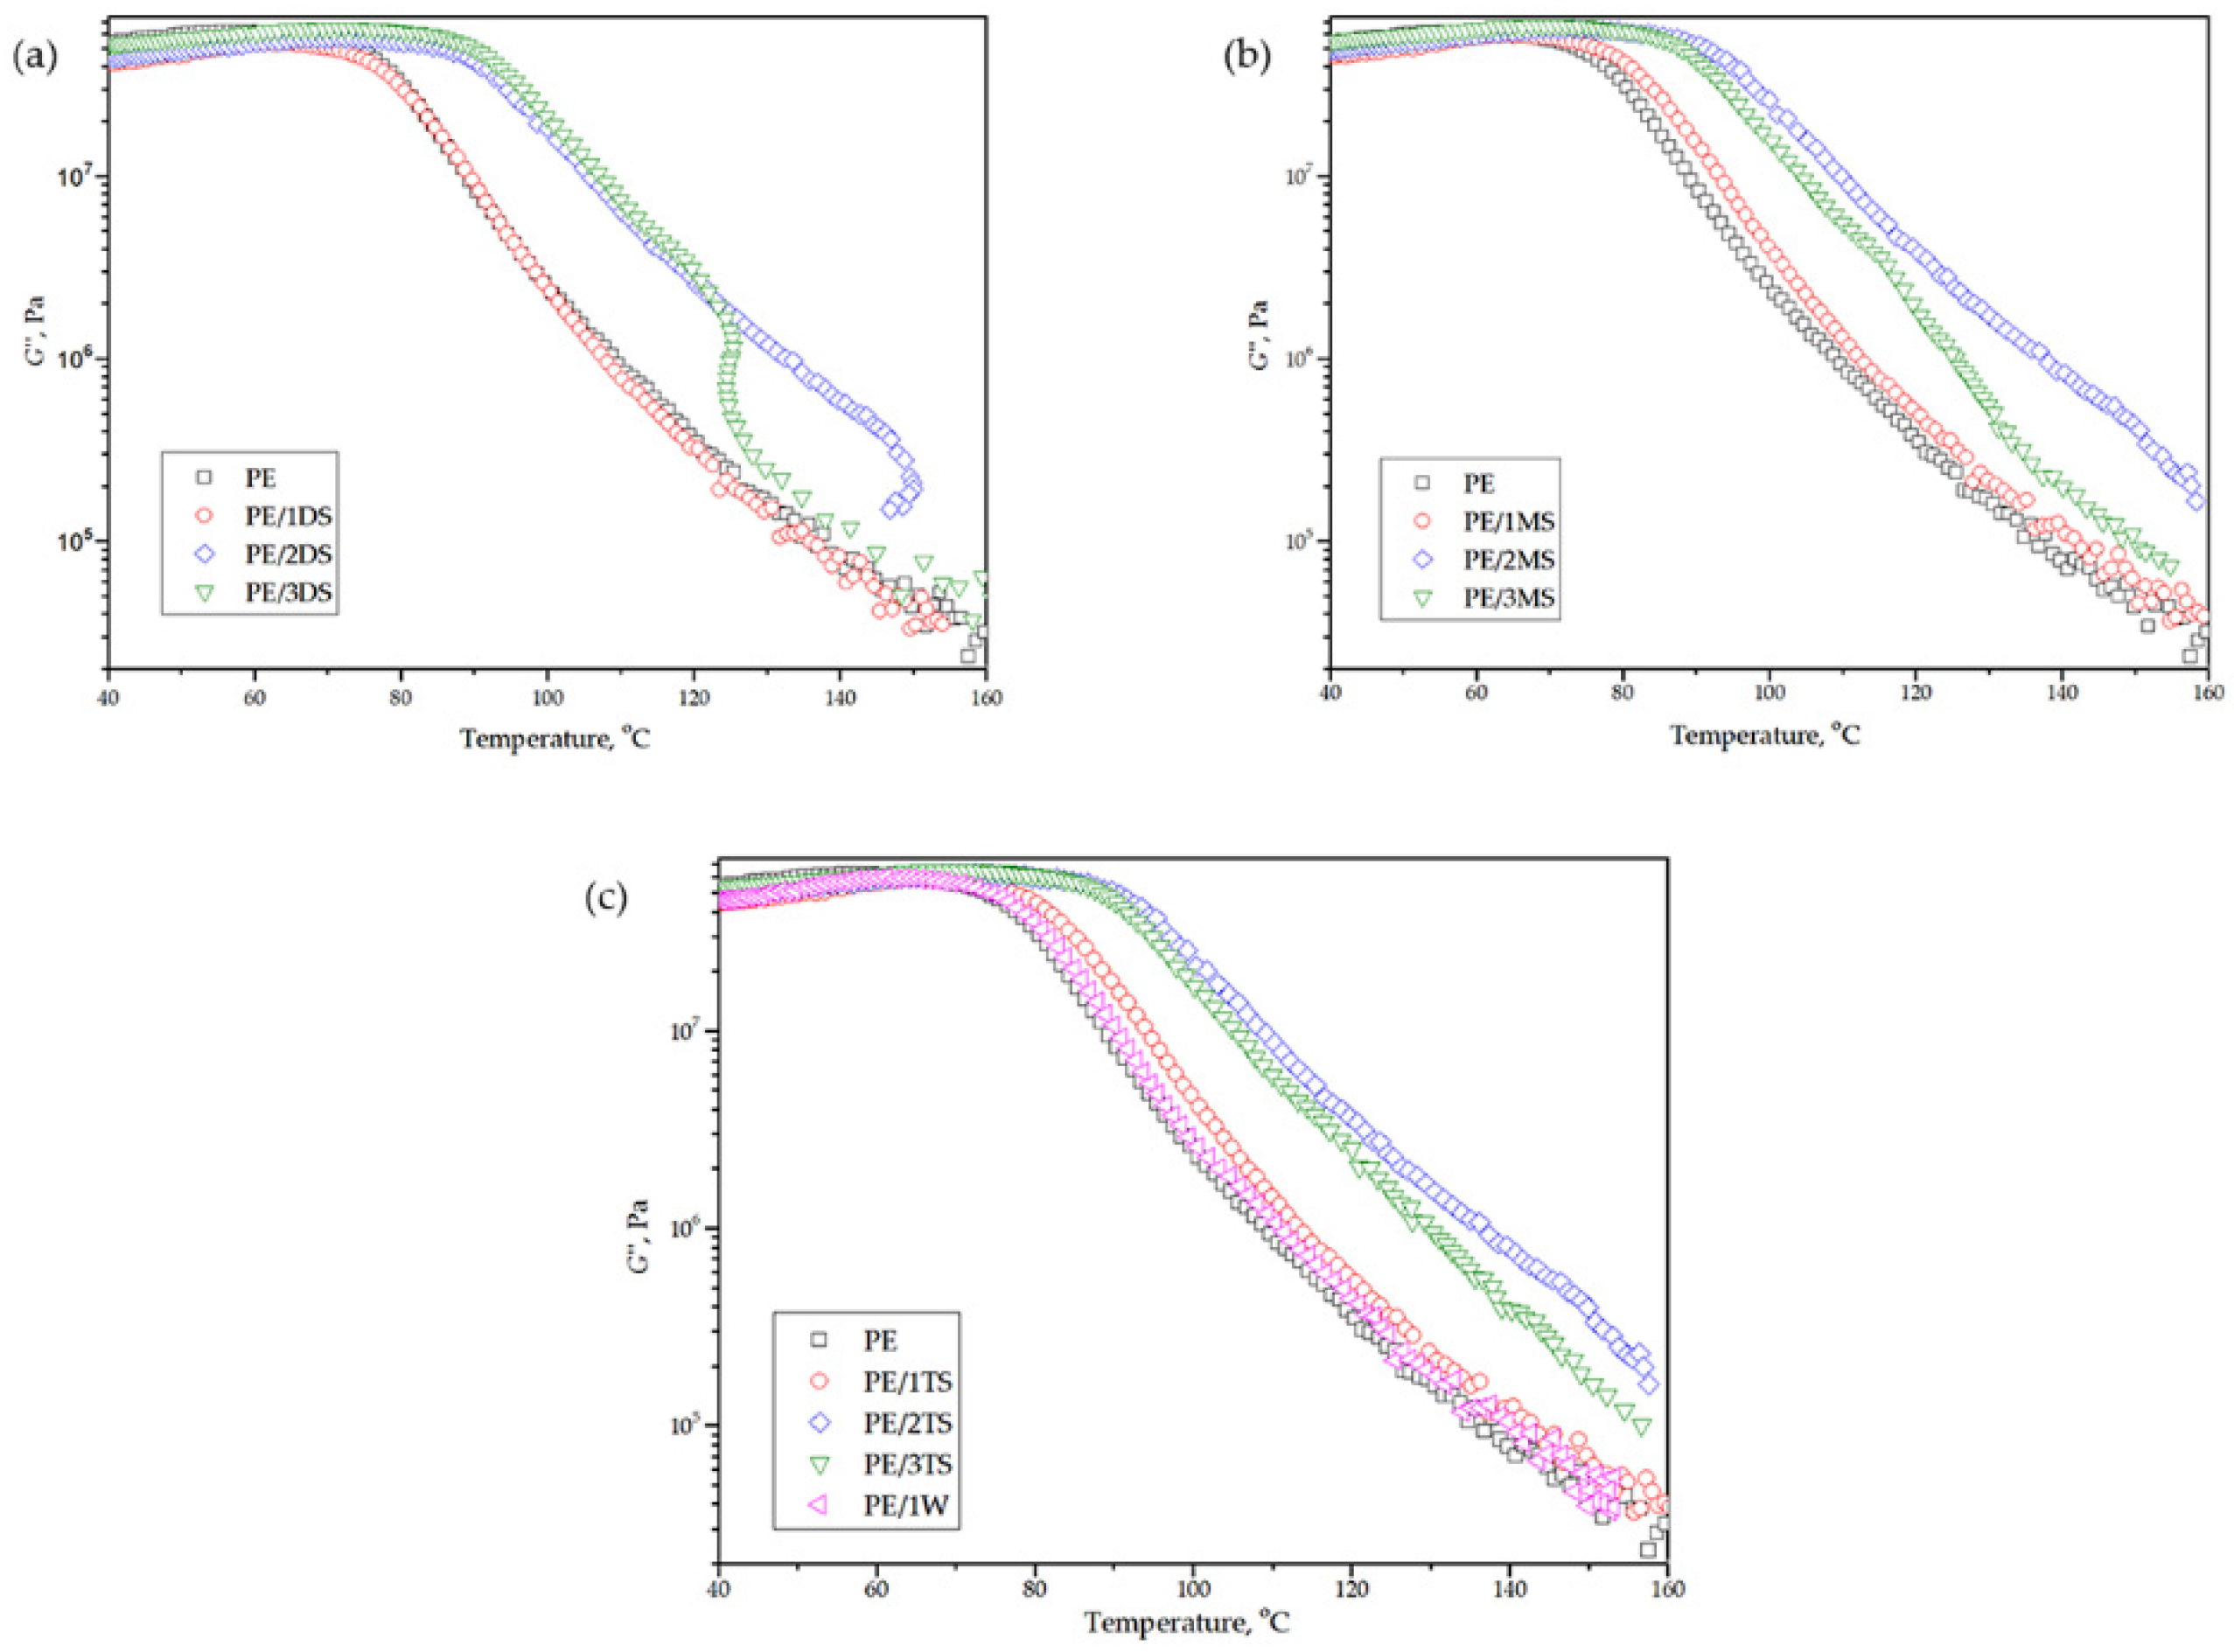
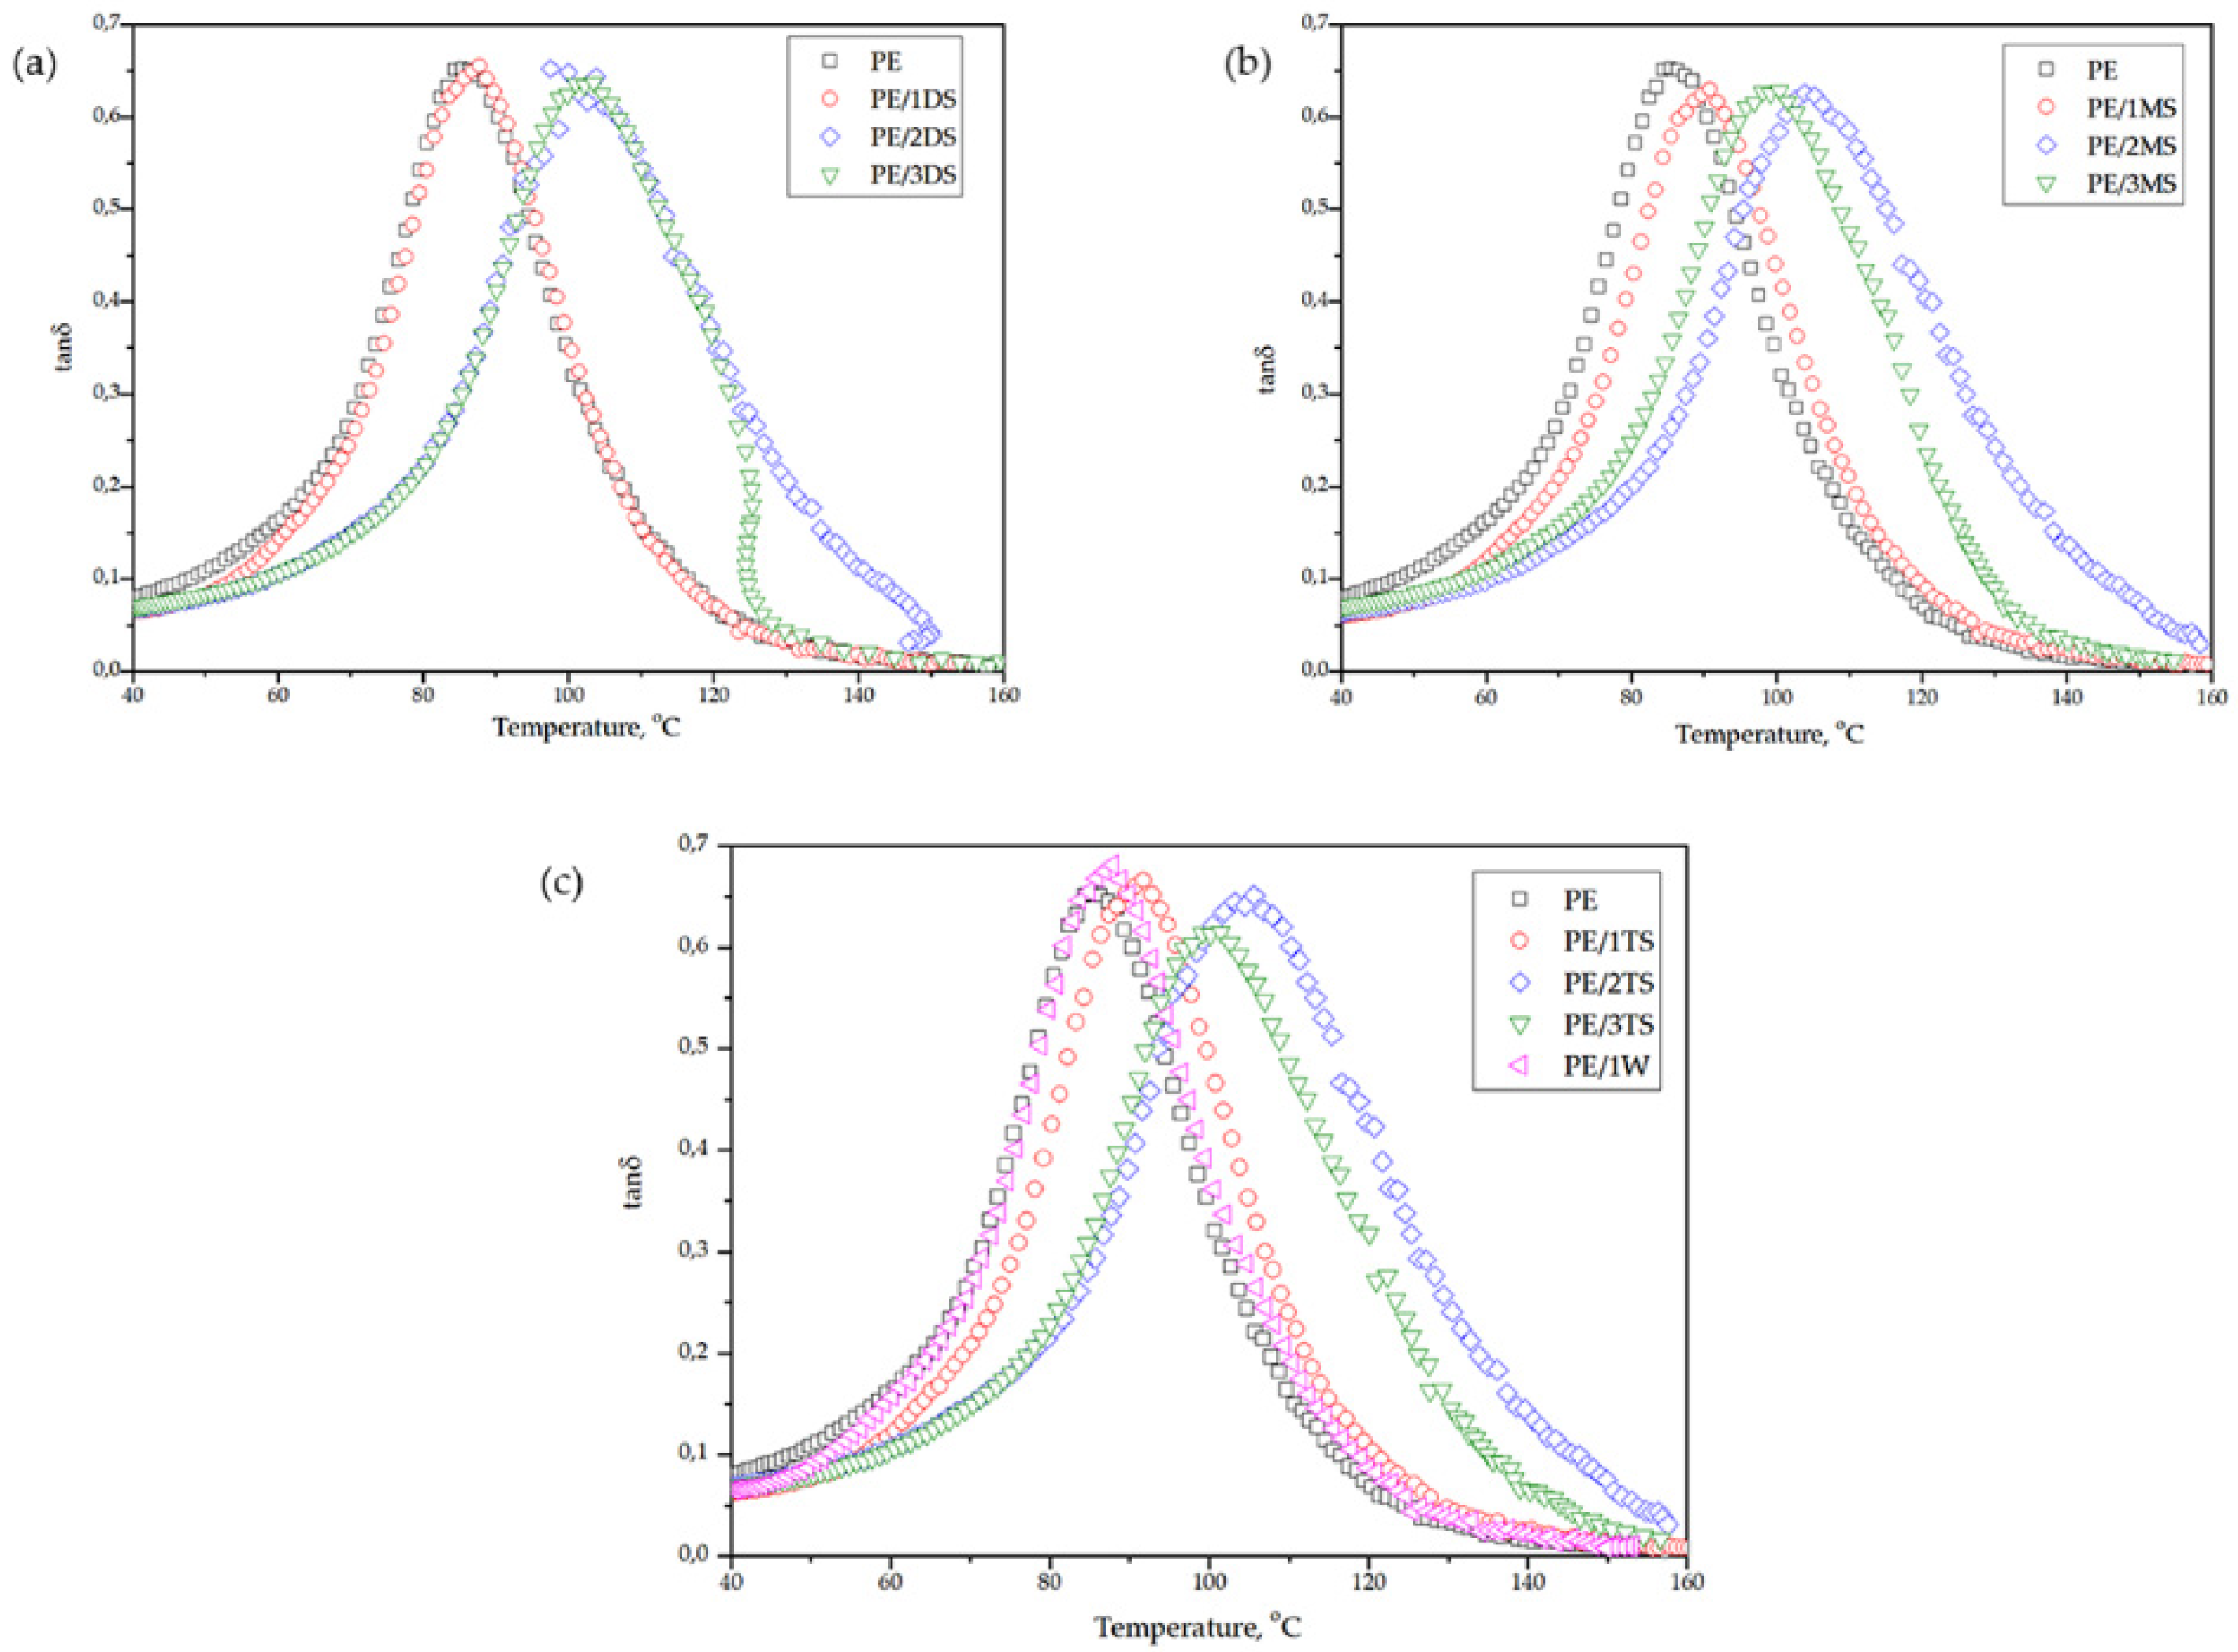
3.4. DMA Analysis
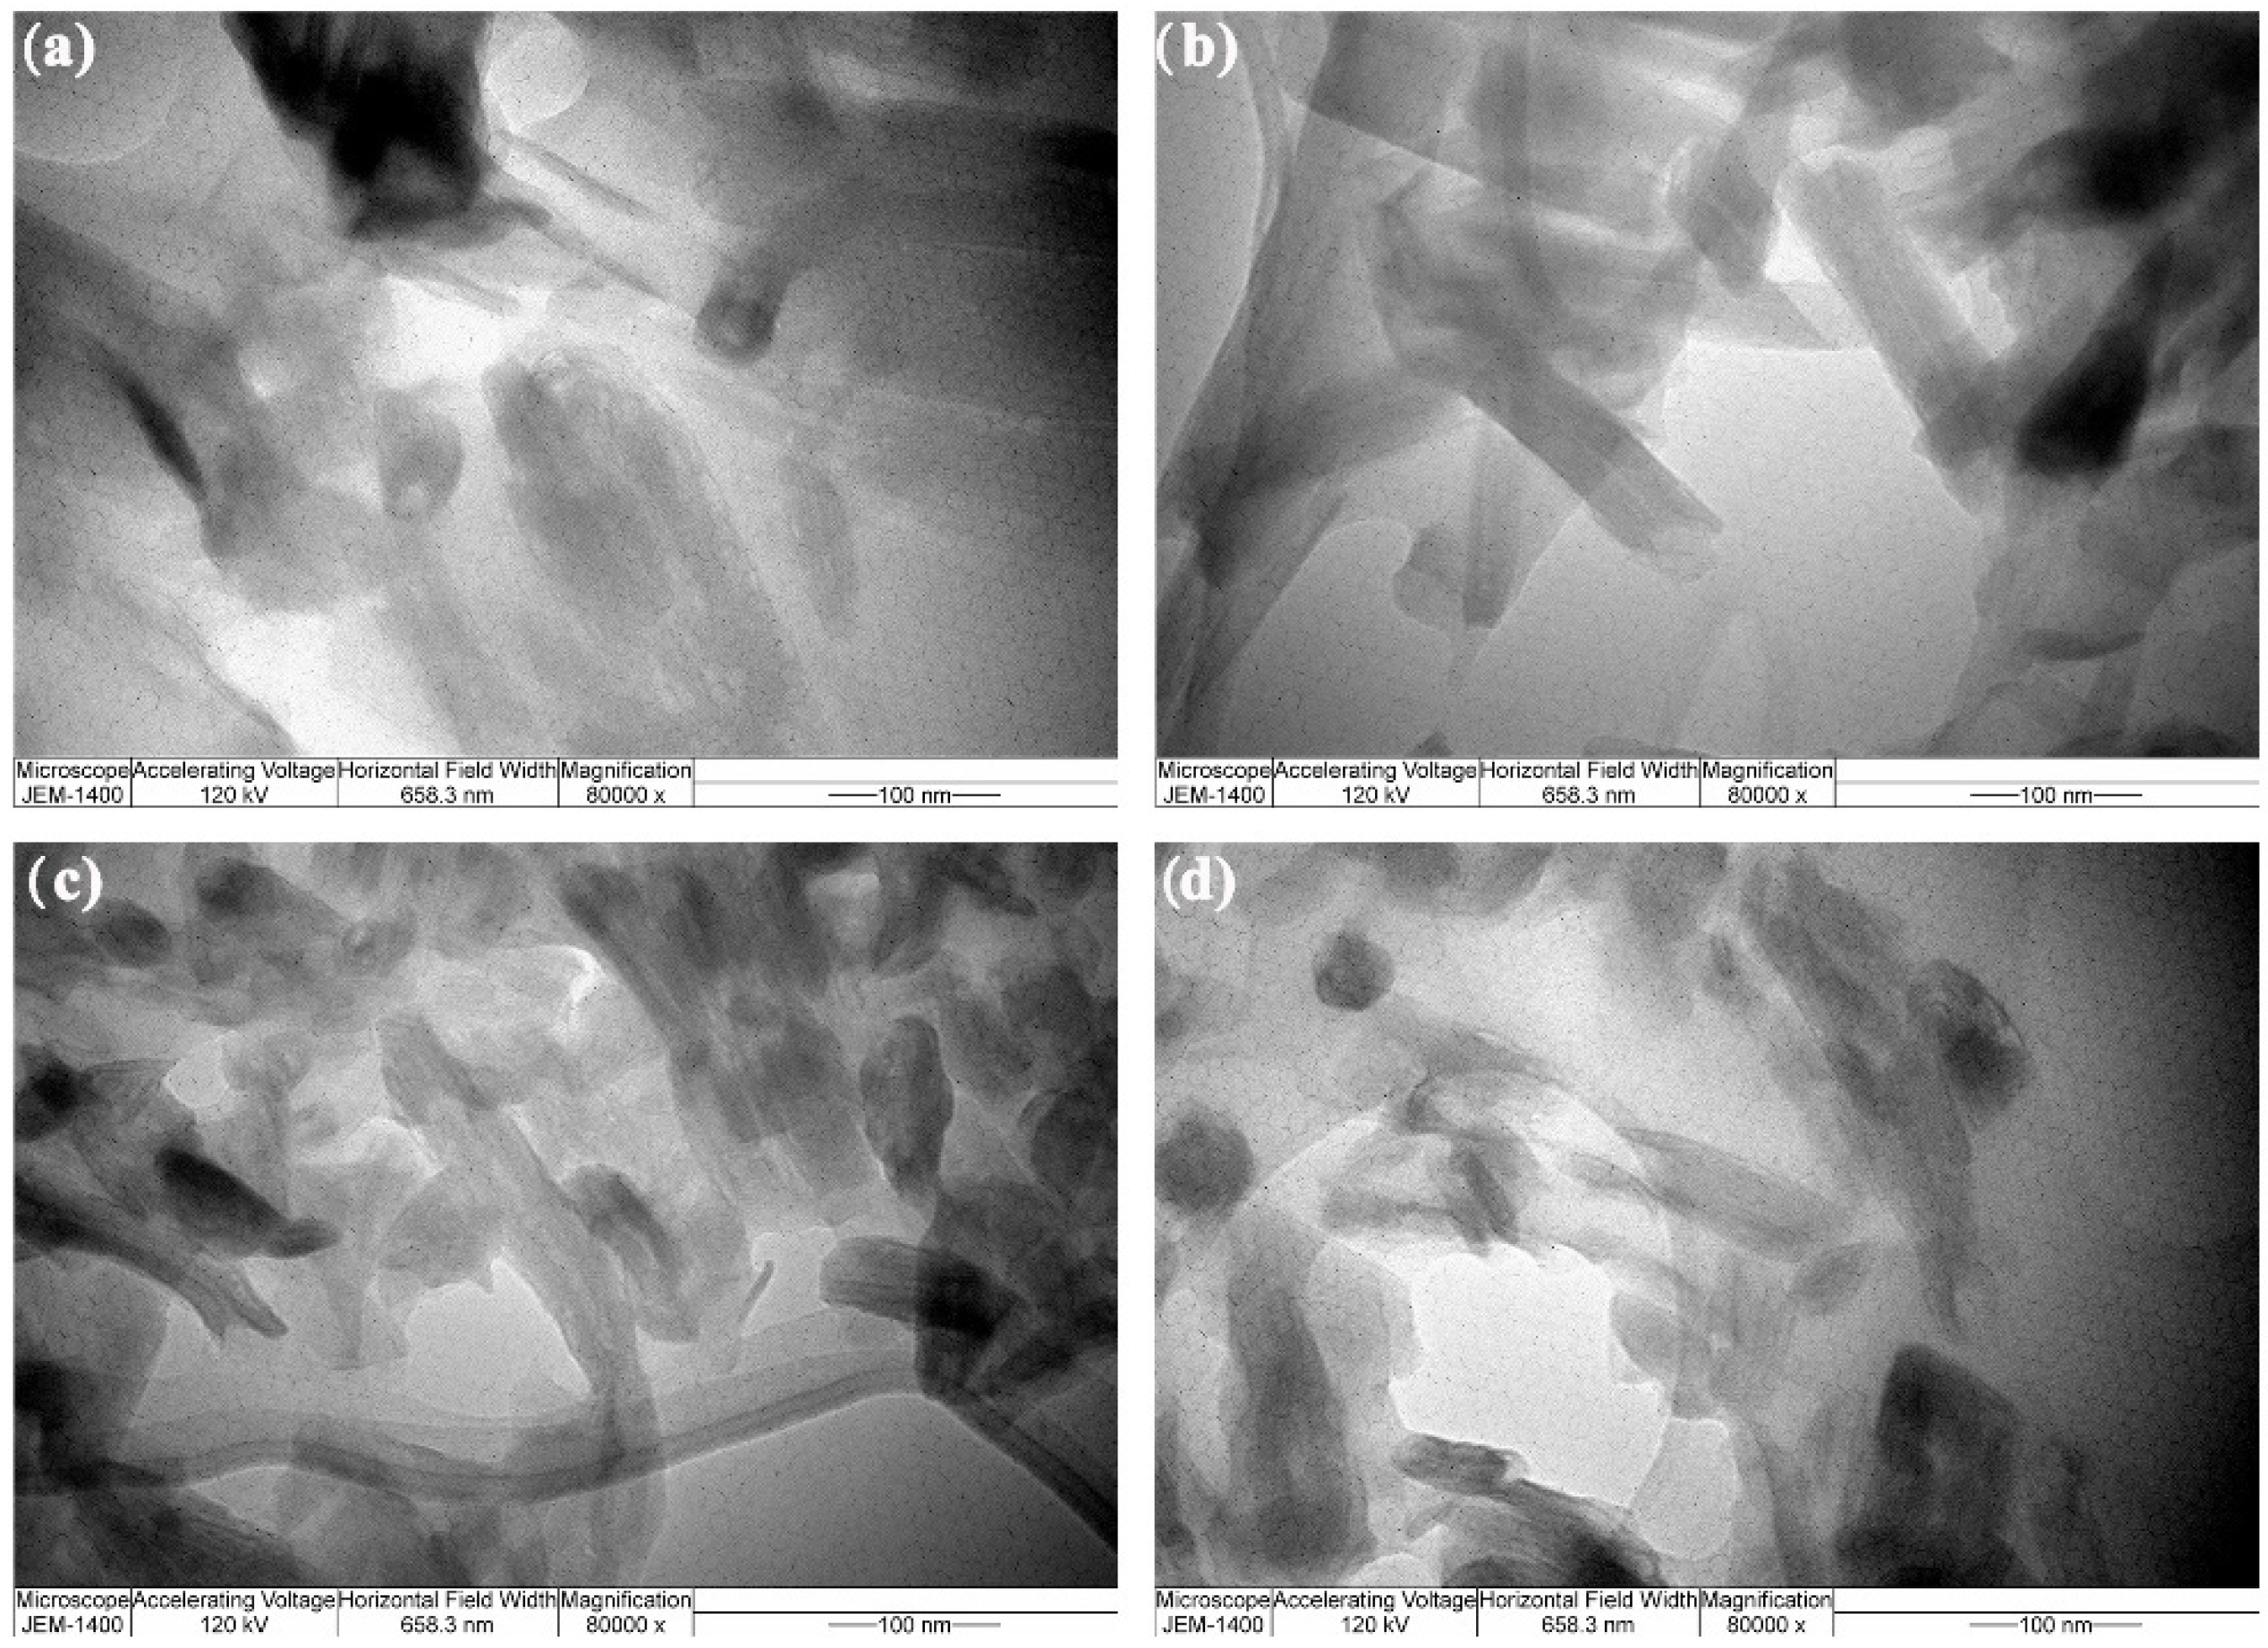
3.5. TEM Analysis
4. Discussion
5. Conclusions
Author Contributions
Funding
Institutional Review Board Statement
Informed Consent Statement
Data Availability Statement
Conflicts of Interest
References
- Ren, T.; Tang, G.; Yuan, B.; Yan, Z.; Ma, L.; Huang, X. One-Step Fabrication of Robust Superhydrophobic Coatings with Corrosion Resistance by a Self-Curing Epoxy-Resin-Based Adhesive. Surf. Coat. Technol. 2019, 380, 125086. [Google Scholar] [CrossRef]
- Chowaniec, A.; Sadowski, Ł.; Żak, A. The Chemical and Microstructural Analysis of the Adhesive Properties of Epoxy Resin Coatings Modified Using Waste Glass Powder. Appl. Surf. Sci. 2020, 504, 144373. [Google Scholar] [CrossRef]
- Zhu, Y.; Zhao, T.; Jiao, J.; Chen, Z. The Lifetime Prediction of Epoxy Resin Adhesive Based on Small-Sample Data. Eng. Fail. Anal. 2019, 102, 111–122. [Google Scholar] [CrossRef]
- Wang, Z.; Gao, X.; Wen, G.; Tian, P.; Zhong, L.; Gou, X.; Guo, Z. Robust Silicon Dioxide @ Epoxy Resin Micronanosheet Superhydrophobic Omnipotent Protective Coating for Applications. Colloids Surf. A Physicochem. Eng. Asp. 2018, 550, 9–19. [Google Scholar] [CrossRef]
- Rudawska, A.; Worzakowska, M.; Bociąga, E.; Olewnik-Kruszkowska, E. Investigation of Selected Properties of Adhesive Compositions Based on Epoxy Resins. Int. J. Adhes. Adhes. 2019, 92, 23–36. [Google Scholar] [CrossRef]
- Jelić, A.; Marinković, A.; Sekulić, M.; Dikić, S.; Ugrinović, V.; Pavlović, V.; Putić, S. Design of Halloysite Modification for Improvement of Mechanical Properties of the Epoxy Based Nanocomposites. Polym. Compos. 2021, 42, 2180–2192. [Google Scholar] [CrossRef]
- Jin, F.-L.; Ma, C.-J.; Park, S.-J. Thermal and Mechanical Interfacial Properties of Epoxy Composites Based on Functionalized Carbon Nanotubes. Mater. Sci. Eng. A 2011, 528, 8517–8522. [Google Scholar] [CrossRef]
- Boonyapookana, A.; Nagata, K.; Mutoh, Y. Fatigue Crack Growth Behavior of Silica Particulate Reinforced Epoxy Resin Composite. Compos. Sci. Technol. 2011, 71, 1124–1131. [Google Scholar] [CrossRef]
- Datsyuk, V.; Trotsenko, S.; Trakakis, G.; Boden, A.; Vyzas-Asimakopoulos, K.; Parthenios, J.; Galiotis, C.; Reich, S.; Papagelis, K. Thermal Properties Enhancement of Epoxy Resins by Incorporating Polybenzimidazole Nanofibers Filled with Graphene and Carbon Nanotubes as Reinforcing Material. Polym. Test. 2020, 82, 106317. [Google Scholar] [CrossRef]
- Sánchez-Hidalgo, R.; Yuste-Sanchez, V.; Verdejo, R.; Blanco, C.; Lopez-Manchado, M.A.; Menéndez, R. Main Structural Features of Graphene Materials Controlling the Transport Properties of Epoxy Resin-Based Composites. Eur. Polym. J. 2018, 101, 56–65. [Google Scholar] [CrossRef]
- Gao, G.; Hu, Y.; Jia, H.; Liu, P.; Du, P.; Xu, D. Acoustic and Dielectric Properties of Epoxy Resin/Hollow Glass Microsphere Composite Acoustic Materials. J. Phys. Chem. Solids 2019, 135, 109105. [Google Scholar] [CrossRef]
- Na, T.; Jiang, H.; Liu, X.; Zhao, C. Preparation and Properties of Novel Fluorinated Epoxy Resins Cured with 4-Trifluoromethyl Phenylbenzimidazole for Application in Electronic Materials. Eur. Polym. J. 2018, 100, 96–102. [Google Scholar] [CrossRef]
- Gao, N.; Liu, W.; Yan, Z.; Wang, Z. Synthesis and Properties of Transparent Cycloaliphatic Epoxy–Silicone Resins for Opto-Electronic Devices Packaging. Opt. Mater. 2013, 35, 567–575. [Google Scholar] [CrossRef]
- Song, S.; Katagi, H.; Takezawa, Y. Study on High Thermal Conductivity of Mesogenic Epoxy Resin with Spherulite Structure. Polymer 2012, 53, 4489–4492. [Google Scholar] [CrossRef]
- Pulikkalparambil, H.; Rangappa, S.M.; Siengchin, S.; Parameswaranpillai, J. (Eds.) Introduction to Epoxy Composites. In Epoxy Composites: Fabrication, Characterization and Applications; WILEY-VCH GmbH: Weinheim, Germany, 2021; pp. 1–21. ISBN 978-3-527-34678-3. [Google Scholar]
- Dąbrowska, A. Nanocarbon/Epoxy Composites: Preparation, Properties, and Applications. In Nanocarbon and Its Composites; Elsevier: Sawston, UK, 2019; pp. 421–448. [Google Scholar]
- Hadal, R.S.; Dasari, A.; Rohrmann, J.; Misra, R.D.K. Effect of Wollastonite and Talc on the Micromechanisms of Tensile Deformation in Polypropylene Composites. Mater. Sci. Eng. A 2004, 372, 296–315. [Google Scholar] [CrossRef]
- Lin, Y.; Chen, H.; Chan, C.-M.; Wu, J. High Impact Toughness Polypropylene/CaCO3 Nanocomposites and the Toughening Mechanism. Macromolecules 2008, 41, 9204–9213. [Google Scholar] [CrossRef]
- Luyt, A.S.; Dramićanin, M.D.; Antić, Ž.; Djoković, V. Morphology, Mechanical and Thermal Properties of Composites of Polypropylene and Nanostructured Wollastonite Filler. Polym. Test. 2009, 28, 348–356. [Google Scholar] [CrossRef]
- Sim, J.; Kang, Y.; Kim, B.J.; Park, Y.H.; Lee, Y.C. Preparation of Fly Ash/Epoxy Composites and Its Effects on Mechanical Properties. Polymers 2020, 12, 79. [Google Scholar] [CrossRef] [Green Version]
- Sand Chee, S.; Jawaid, M. The Effect of Bi-Functionalized MMT on Morphology, Thermal Stability, Dynamic Mechanical, and Tensile Properties of Epoxy/Organoclay Nanocomposites. Polymers 2019, 11, 2012. [Google Scholar] [CrossRef] [Green Version]
- Jelić, A.; Božić, A.; Stamenović, M.; Sekulić, M.; Porobić, S.; Dikić, S.; Putić, S. Effects of Dispersion and Particle-Matrix Interactions on Mechanical and Thermal Properties of HNT/Epoxy Nanocomposite Materials; Springer: Geweberstrasse, Switzerland, 2021; pp. 310–325. [Google Scholar]
- Gul, S.; Kausar, A.; Mehmood, M.; Muhammad, B.; Jabeen, S. Progress on Epoxy/Polyamide and Inorganic Nanofiller-Based Hybrids: Introduction, Application, and Future Potential. Polym.-Plast. Technol. Eng. 2016, 55, 1842–1862. [Google Scholar] [CrossRef]
- Bekeshev, A.; Mostovoy, A.; Tastanova, L.; Kadykova, Y.; Kalganova, S.; Lopukhova, M. Reinforcement of Epoxy Composites with Application of Finely-Ground Ochre and Electrophysical Method of the Composition Modification. Polymers 2020, 12, 1437. [Google Scholar] [CrossRef] [PubMed]
- Tolinski, M. Overview of Fillers and Fibers. In Additives for Polyolefins; Elsevier: Amsterdam, The Netherlands, 2015; pp. 71–88. [Google Scholar]
- Poh, C.L.; Mariatti, M.; Ahmad Fauzi, M.N.; Ng, C.H.; Chee, C.K.; Chuah, T.P. Tensile, Dielectric, and Thermal Properties of Epoxy Composites Filled with Silica, Mica, and Calcium Carbonate. J. Mater. Sci. Mater. Electron. 2014, 25, 2111–2119. [Google Scholar] [CrossRef]
- Astruc, A.; Joliff, E.; Chailan, J.-F.; Aragon, E.; Petter, C.O.; Sampaio, C.H. Incorporation of Kaolin Fillers into an Epoxy/Polyamidoamine Matrix for Coatings. Prog. Org. Coat. 2009, 65, 158–168. [Google Scholar] [CrossRef]
- Tiimob, B.J.; Rangari, V.K.; Jeelani, S. Effect of Reinforcement of Sustainable β-CaSiO3 Nanoparticles in Bio-Based Epoxy Resin System. J. Appl. Polym. Sci. 2014, 131, 40867. [Google Scholar] [CrossRef]
- Karle, A.H.; Nukulwar, M.R.; Tungikar, V.B. Evaluation of Mechanical and Thermal Properties of Epoxy Composites Reinforced with CaSiO3 Particulate Fillers. Mater. Today Proc. 2021, 46, 325–330. [Google Scholar] [CrossRef]
- Xian, G.; Walter, R.; Haupert, F. Comparative Study of the Mechanical and Wear Performance of Short Carbon Fibers and Mineral Particles (Wollastonite, CaSiO3) Filled Epoxy Composites. J. Polym. Sci. Part B Polym. Phys. 2006, 44, 854–863. [Google Scholar] [CrossRef]
- Abdellaoui, H.; Raji, M.; Bouhfid, R.; Qaiss, A. El kacem Investigation of the Deformation Behavior of Epoxy-Based Composite Materials. In Failure Analysis in Biocomposites, Fibre-Reinforced Composites and Hybrid Composites; Elsevier: Amsterdam, The Netherlands, 2019; pp. 29–49. [Google Scholar]
- Mitrovic, N.; Petrovic, A.; Milosevic, M.; Momcilovic, N.; Miskovic, Z.; Maneski, T.; Popovic, P. Experimental and Numerical Study of Globe Valve Housing. Hem. Ind. 2017, 71, 251–257. [Google Scholar] [CrossRef]
- Milošević, M.; Postić, S.; Mitrović, N.; Milovanović, A.; Travica, M.; Hloch, S.; Golubović, Z. Strain Measurement Setup of Compressively Loaded Mandible Model with Teeth and Comprensations. In Proceedings of the International Conference of Experimental and Numerical Investigations and New Technologies, Zlatibor, Serbia, 2–5 July 2017; CNN TECH 2018. Mitrović, N., Milošević, M., Mladenović, G., Eds.; Innovation Center of Faculty of Mechanical Engineering: Zlatibor, Serbia, 2018; p. 35. [Google Scholar]
- Jubail Chemical Industries Co. (JANA) Product Data Sheet Araldite® GY 250 Unmodified Liquid Epoxy Resin. 2021, pp. 1–2. Available online: https://www.knowde.com/stores/jubail-chemical-industries/products/araldite-gy-250/ (accessed on 12 February 2022).
- Huntsman Technical Datasheet Araldite® DY-E. Available online: https://adhesives.specialchem.com/product/a-huntsman-araldite-dy-e (accessed on 12 February 2022).
- Huntsman Technical Datasheet Aradur® 2963-1. Available online: shorturl.at/lALNV (accessed on 12 February 2022).
- Sunitha, D.V.; Manjunatha, C.; Shilpa, C.J.; Nagabhushana, H.; Sharma, S.C.; Nagabhushana, B.M.; Dhananjaya, N.; Shivakumara, C.; Chakradhar, R.P.S. CdSiO3:Pr3+ Nanophosphor: Synthesis, Characterization and Thermoluminescence Studies. Spectrochim. Acta Part A Mol. Biomol. Spectrosc. 2012, 99, 279–287. [Google Scholar] [CrossRef]
- Medić, M.M.; Brik, M.G.; Dražić, G.; Antić, Ž.M.; Lojpur, V.M.; Dramićanin, M.D. Deep-Red Emitting Mn4+ Doped Mg2TiO4 Nanoparticles. J. Phys. Chem. C 2015, 119, 724–730. [Google Scholar] [CrossRef]
- Lee, H.; Hong, M.; Bae, S.; Lee, H.; Park, E.; Kim, K. A Novel Approach to Preparing Nano-Size Co3O4-Coated Ni Powder by the Pechini Method for MCFC Cathodes. J. Mater. Chem. 2003, 13, 2626. [Google Scholar] [CrossRef]
- Kale, K.B.; Raskar, R.Y.; Rane, V.H.; Gaikwad, A.G. Preparation and Characterization of Calcium Silicate for CO2 Sorption. Adsorpt. Sci. Technol. 2012, 30, 817–830. [Google Scholar] [CrossRef]
- Ernawati, L.; Wahyuono, R.A.; Laksono, A.D.; Ningrum, A.; Handayani, K.; Sabrina, A. Wollastonite (CaSiO3)-Based Composite Particles for Synthetic Food Dyes (Brilliant Blue) Removal in Aquatic Media: Synthesis, Characterization and Kinetic Study. IOP Conf. Ser. Mater. Sci. Eng. 2021, 1053, 012001. [Google Scholar] [CrossRef]
- Tamin, S.H.; Adnan, S.B.R.S.; Jaafar, M.H.; Mohamed, N.S. Effects of Sintering Temperature on the Structure and Electrochemical Performance of Mg2SiO4 Cathode Materials. Ionics 2018, 24, 2665–2671. [Google Scholar] [CrossRef]
- Paques-Ledent, M.T.; Tarte, P. Vibrational Studies of Olivine-Type Compounds—I. The i.r. and Raman Spectra of the Isotopic Species of Mg2SiO4. Spectrochim. Acta Part A Mol. Spectrosc. 1973, 29, 1007–1016. [Google Scholar] [CrossRef]
- Mitchell, M.B.D.; Jackson, D.; James, P.F. Preparation of Forsterite (Mg2SiO4) Powders Via an Aqueous Route Using Magnesium Salts and Silicon Tetrachloride (SiCl4). J. Sol-Gel Sci. Technol. 1999, 15, 211–219. [Google Scholar] [CrossRef]
- Shuai, C.; Mao, Z.; Han, Z.; Peng, S.; Li, Z. Fabrication and Characterization of Calcium Silicate Scaffolds for Tissue Engineering. J. Mech. Med. Biol. 2014, 14, 1450049. [Google Scholar] [CrossRef]
- Moreira, D.C.; Sphaier, L.A.; Reis, J.M.L.; Nunes, L.C.S. Determination of Young’s Modulus in Polyester-Al2O3 and Epoxy-Al2O3 Nanocomposites Using the Digital Image Correlation Method. Compos. Part A 2012, 43, 304–309. [Google Scholar] [CrossRef]
- Rusmirović, J.; Galović, J.; Kluz, M.; Perković, S.; Brzić, S.; Bogosavljević, M.; Milojković, A.; Kovačević, T. Using Potential of Filament-Wound Carbon/Glass Polymeric Composites as Rocket Motor Thermal Insulation. Polym. Polym. Compos. 2021, 29, S1541–S1554. [Google Scholar] [CrossRef]
- Mirkhalaf, M.; Yazdani Sarvestani, H.; Yang, Q.; Jakubinek, M.B.; Ashrafi, B. A Comparative Study of Nano-Fillers to Improve Toughness and Modulus of Polymer-Derived Ceramics. Sci. Rep. 2021, 11, 6951. [Google Scholar] [CrossRef]
- Zhang, W.; Dehghani-Sanij, A.A.; Blackburn, R.S. IR Study on Hydrogen Bonding in Epoxy Resin–Silica Nanocomposites. Prog. Nat. Sci. 2008, 18, 801–805. [Google Scholar] [CrossRef]
- Kornmann, X. Synthesis and Characterisation of Thermoset-Layered Silicate Nanocomposites, Luleå. 2001. Available online: shorturl.at/gnAJ2 (accessed on 12 February 2022).


| Component | Properties |
|---|---|
| Araldite GY 250 | Unmodified Liquid Epoxy Resin Epoxy value: 5.30–5.55 Eq/kg Weight per epoxide: 180–189 g/Eq Viscosity at 25 °C: 10,000–12,000 mPa s Density at 25 °C: 1.17 g/cm3 Flash point: ≥200 °C |
| Araldite DY-E | Monofunctional, aliphatic, reactive diluent for epoxy resins Epoxy index: 3.15–3.60 Eq/kg Epoxy equivalent: 278–317 g/Eq Viscosity at 25 °C: 4–12 mPa s Density at 20 °C: 0.89 g/cm3 Flash point: ~150 °C |
| Aradur 2963-1 | Modified cycloaliphatic polyamine Amine number: 325–350 mg KOH/g Viscosity at 25 °C: 30–70 mPa s Density at 25 °C: 1.00 g/cm3 Flash point: ≥108 °C |
| Sample Symbol | Nanofiller | Nanofiller Content, % |
|---|---|---|
| PE | - | - |
| PE/1DS | Ca2SiO4 | 1 |
| PR/2DS | Ca2SiO4 | 2 |
| PE/3DS | Ca2SiO4 | 3 |
| PE/1MS | Mg2SiO4 | 1 |
| PE/2MS | Mg2SiO4 | 2 |
| PE/3MS | Mg2SiO4 | 3 |
| PE/1TS | Ca3SiO5 | 1 |
| PE/2TS | Ca3SiO5 | 2 |
| PE/3TS | Ca3SiO5 | 3 |
| PE/1W | CaSiO3 | 1 |
| PE/2W | CaSiO3 | 2 |
| PE/3W | CaSiO3 | 3 |
| Mg2SiO4 | CaSiO3 | Ca2SiO4 | Ca3SiO5 | |
|---|---|---|---|---|
| ICDD | 01-085-1357 | 01-084-0655 | 01-076-3608 | 00-031-0301 |
| Crystal structure | Orthorhombic | Monoclinic | Monoclinic | Anorthic |
| Space group | Pmnb (62) | P21/a (14) | P21/n (14) | P1 (1) |
| Crystallite size, nm | 17.2 | 28.38 | 13.54 | 5.38 |
| Strain | 0.30 | 0.08 | 0.23 | 0.44 |
| Rwp | 12.63 | 9.28 | 9.28 | 6.19 |
| Rp | 6.92 | 6.37 | 5.92 | 4.46 |
| Re | 3.31 | 3.82 | 3.87 | 3.89 |
| GOF | 3.8215 | 2.4313 | 2.399 | 1.5895 |
| a (Å) | 4.7523 | 15.4529 | 5.512 | 14.08 |
| b (Å) | 10.213 | 7.3416 | 6.781 | 14.423 |
| c (Å) | 5.9819 | 7.0732 | 9.309 | 24.822 |
| Sample | Max. Stress MPa | Max. Strain % | Modulus of Elasticity GPa | Toughness kJ/m3 |
|---|---|---|---|---|
| PE | 29.6 ± 0.6 | 6.85 ± 0.15 | 1.50 ± 0.03 | 1165 ± 24 |
| PE/1DS | 31.7 ± 0.7 | 1.53 ± 0.03 | 2.21 ± 0.05 | 206 ± 5 |
| PE/2DS | 34.9 ± 0.7 | 3.15 ± 0.07 | 1.6 ± 0.03 | 573 ± 11 |
| PE/3DS | 38.9 ± 0.7 | 2.23 ± 0.04 | 2.12 ± 0.04 | 398 ± 7 |
| PE/1MS | 35.3 ± 1.0 | 3.39 ± 0.09 | 1.70 ± 0.05 | 648 ± 18 |
| PE/2MS | 36.8 ± 0.9 | 2.77 ± 0.07 | 1.8 ± 0.04 | 499 ± 12 |
| PE/3MS | 38.2 ± 0.9 | 2.96 ± 0.07 | 2.02 ± 0.05 | 600 ± 14 |
| PE/1TS | 32.9 ± 0.7 | 2.80 ± 0.06 | 1.6 ± 0.03 | 423 ± 9 |
| PE/2TS | 34.1 ± 0.6 | 2.06 ± 0.04 | 1.96 ± 0.03 | 294 ± 5 |
| PE/3TS | 36.5 ± 0.9 | 2.21 ± 0.06 | 2.04 ± 0.05 | 374 ± 9 |
| PE/1W | 31.6 ± 0.6 | 4.04 ± 0.08 | 1.44 ± 0.03 | 738 ± 14 |
| PE/2W | 34.3 ± 0.7 | 1.89 ± 0.04 | 2.14 ± 0.04 | 295 ± 6 |
| PE/3W | 37.7 ± 1 | 1.99 ± 0.05 | 2.25 ± 0.06 | 346 ± 9 |
| Sample | G’GS45°C, MPa | G’RP140C, MPa | Tg (tanδ Peak, °C) | tanδ Peak Height |
|---|---|---|---|---|
| PE | 627.99 | 5.01 | 85.4 | 0.65 |
| PE/1DS | 613.52 | 4.54 | 87.8 | 0.65 |
| PE/2DS | 640.49 | 5.22 | 103.8 | 0.63 |
| PE/3DS | 725.58 | 5.62 | 102.2 | 0.64 |
| PE/1MS | 688.42 | 4.95 | 90.8 | 0.63 |
| PE/2MS | 690.00 | 5.73 | 103.9 | 0.63 |
| PE/3MS | 750.25 | 5.91 | 99.1 | 0.62 |
| PE/1TS | 664.28 | 4.88 | 99.7 | 0.67 |
| PE/2TS | 686.22 | 5.48 | 105.6 | 0.65 |
| PE/3TS | 767.14 | 5.88 | 100.2 | 0.61 |
| PE/2W | 658.82 | 4.87 | 87.9 | 0.68 |
Publisher’s Note: MDPI stays neutral with regard to jurisdictional claims in published maps and institutional affiliations. |
© 2022 by the authors. Licensee MDPI, Basel, Switzerland. This article is an open access article distributed under the terms and conditions of the Creative Commons Attribution (CC BY) license (https://creativecommons.org/licenses/by/4.0/).
Share and Cite
Jelić, A.; Sekulić, M.; Travica, M.; Gržetić, J.; Ugrinović, V.; Marinković, A.D.; Božić, A.; Stamenović, M.; Putić, S. Determination of Mechanical Properties of Epoxy Composite Materials Reinforced with Silicate Nanofillers Using Digital Image Correlation (DIC). Polymers 2022, 14, 1255. https://0-doi-org.brum.beds.ac.uk/10.3390/polym14061255
Jelić A, Sekulić M, Travica M, Gržetić J, Ugrinović V, Marinković AD, Božić A, Stamenović M, Putić S. Determination of Mechanical Properties of Epoxy Composite Materials Reinforced with Silicate Nanofillers Using Digital Image Correlation (DIC). Polymers. 2022; 14(6):1255. https://0-doi-org.brum.beds.ac.uk/10.3390/polym14061255
Chicago/Turabian StyleJelić, Aleksandra, Milica Sekulić, Milan Travica, Jelena Gržetić, Vukašin Ugrinović, Aleksandar D. Marinković, Aleksandra Božić, Marina Stamenović, and Slaviša Putić. 2022. "Determination of Mechanical Properties of Epoxy Composite Materials Reinforced with Silicate Nanofillers Using Digital Image Correlation (DIC)" Polymers 14, no. 6: 1255. https://0-doi-org.brum.beds.ac.uk/10.3390/polym14061255