
Calcined Co(II)-Chelated Polyazomethine as Cathode Catalyst of Anion Exchange Membrane Fuel Cells

 ,
, 

Abstract
:
1. Introduction
2. Materials and Methods
2.1. Materials
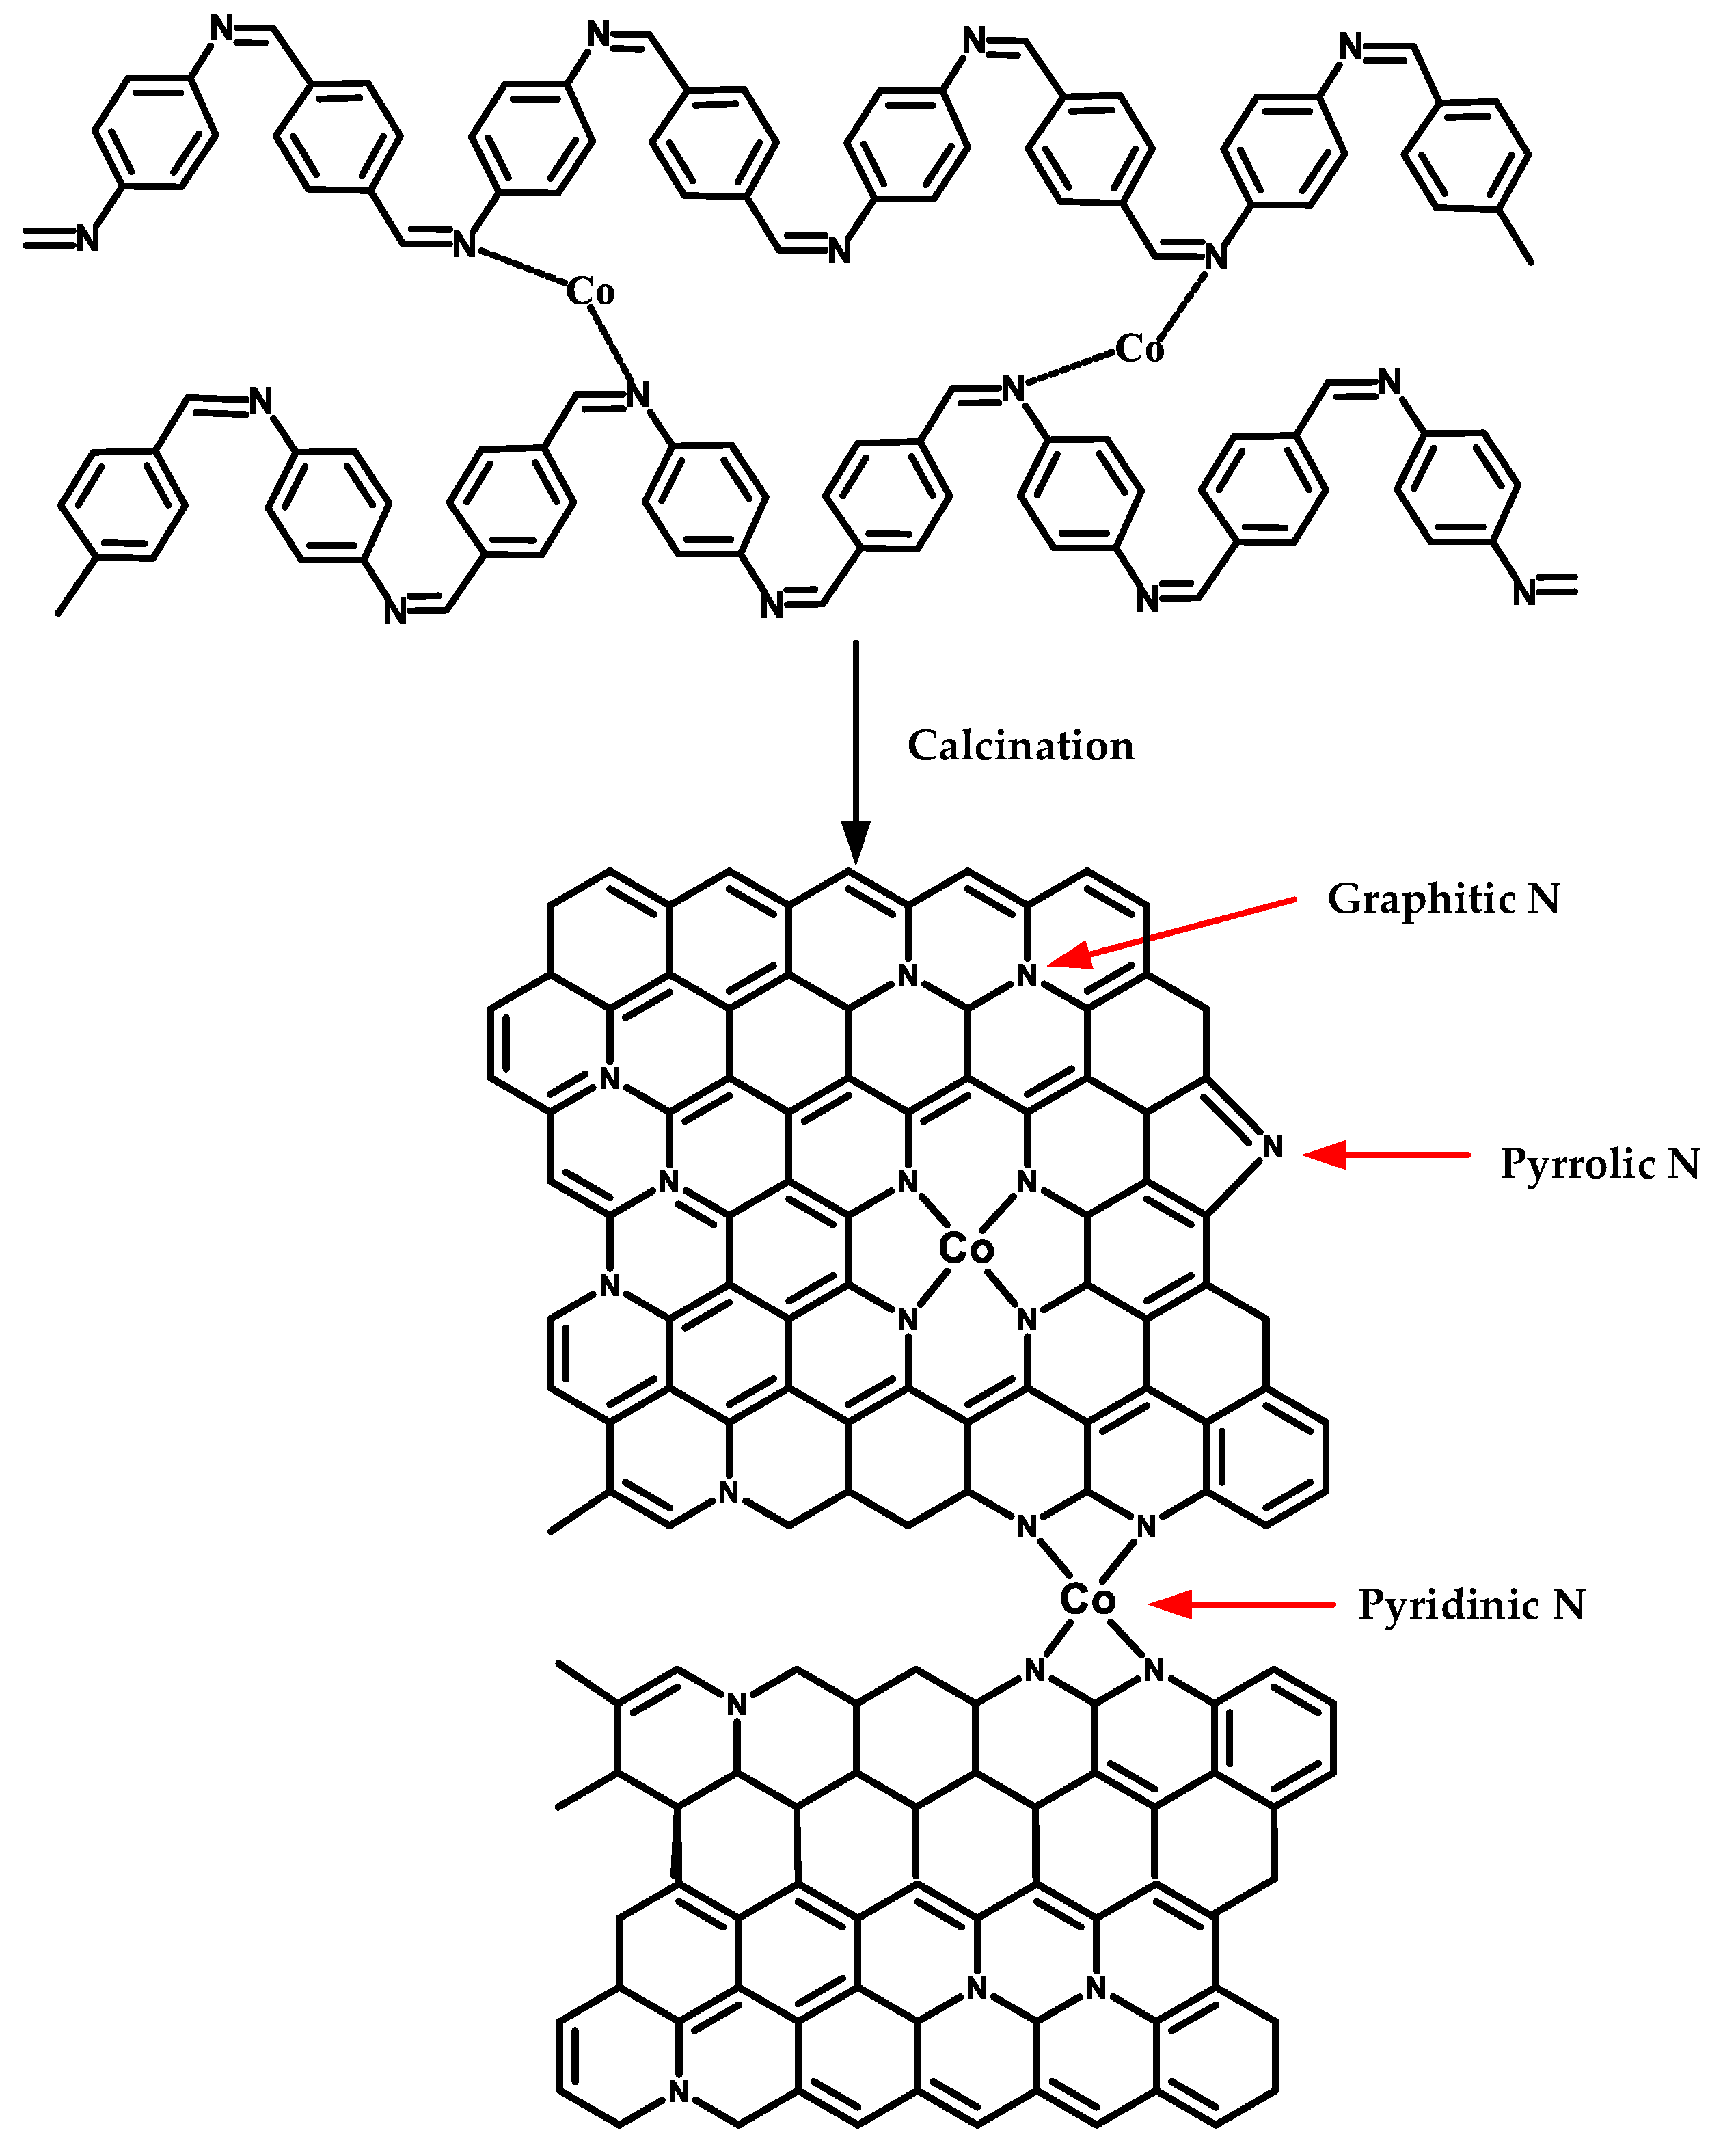
2.2. Preparation of Co-N-C Catalyst
2.3. Characterization
2.3.1. X-ray Photoelectron Spectroscopy (XPS)
2.3.2. Raman Spectroscopy
2.3.3. Wide-angle X-ray Diffraction (WXRD)
2.3.4. Scanning Electronic Microscopy (SEM)
2.3.5. Transmission Electron Microscopy (TEM)
2.3.6. Surface Area and Pore Size Measurement (BET Method)
2.4. Electrochemical Characterization
2.4.1. Current–Potential Polarization-Linear Scan Voltammetry (LSV)
2.4.2. MEA Preparation
2.4.3. Single-Cell Performance Testing
3. Results and Discussion
3.1. XPS
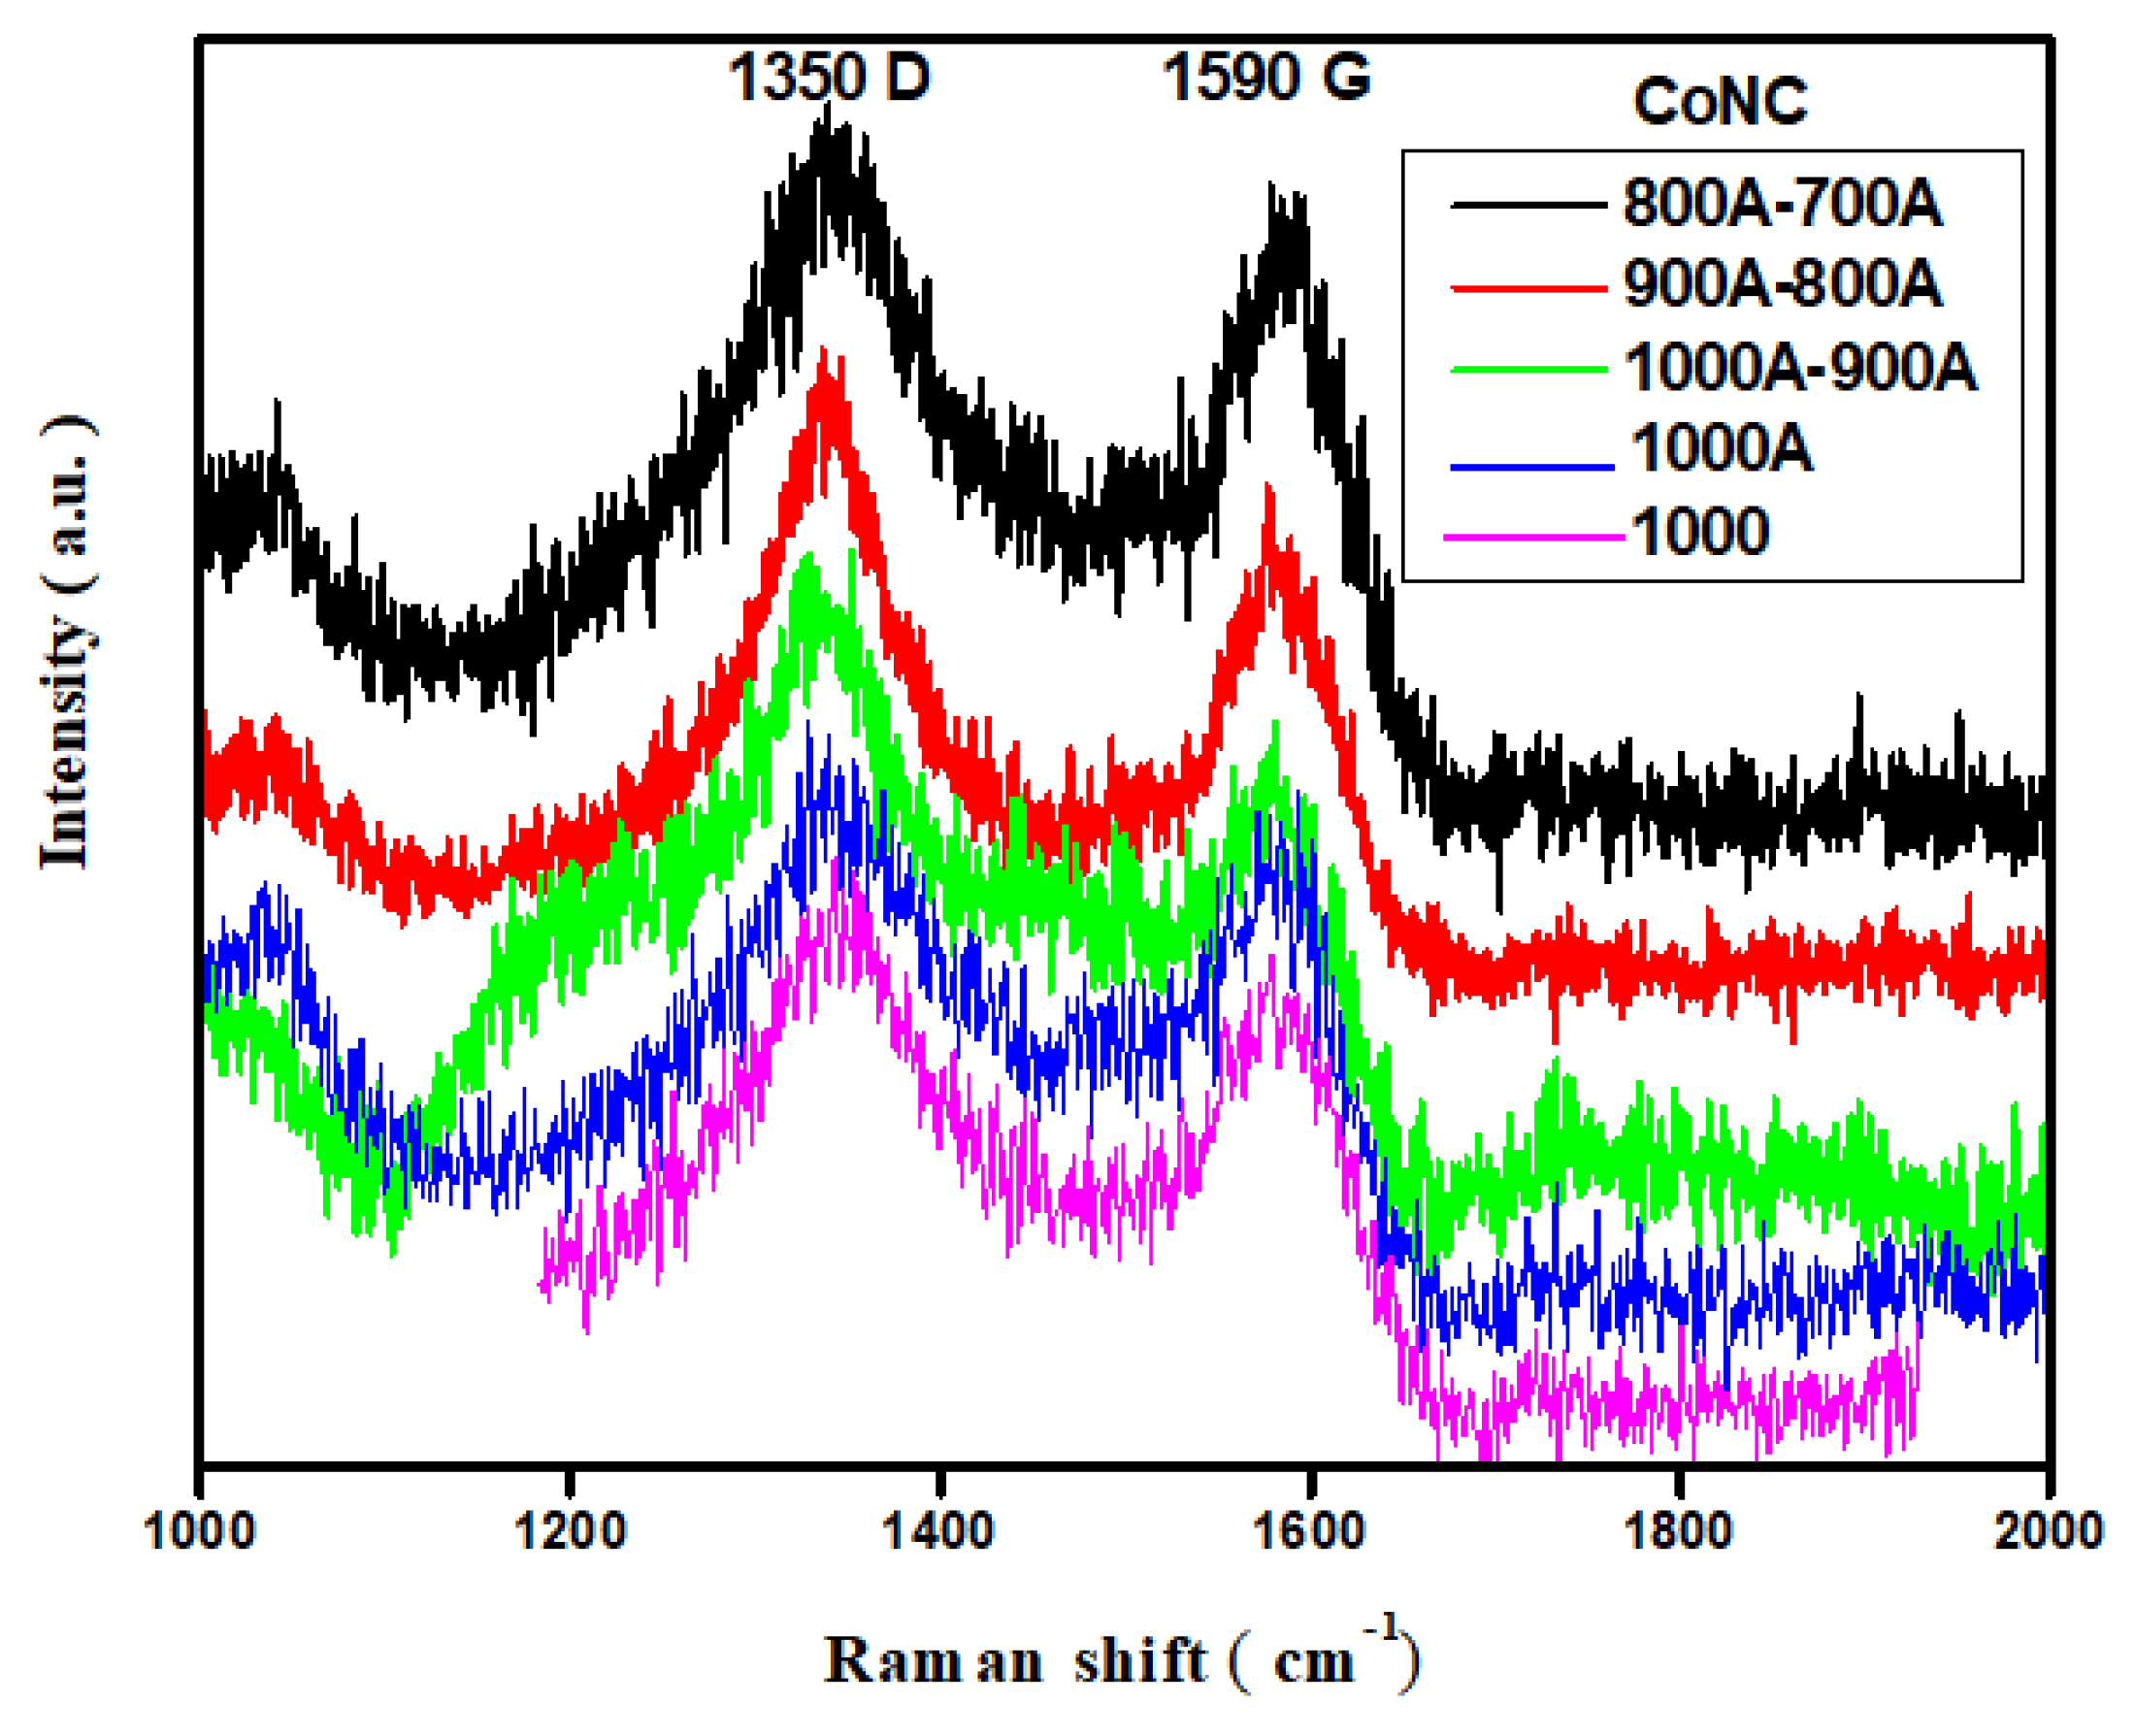
3.2. Raman Spectroscopy
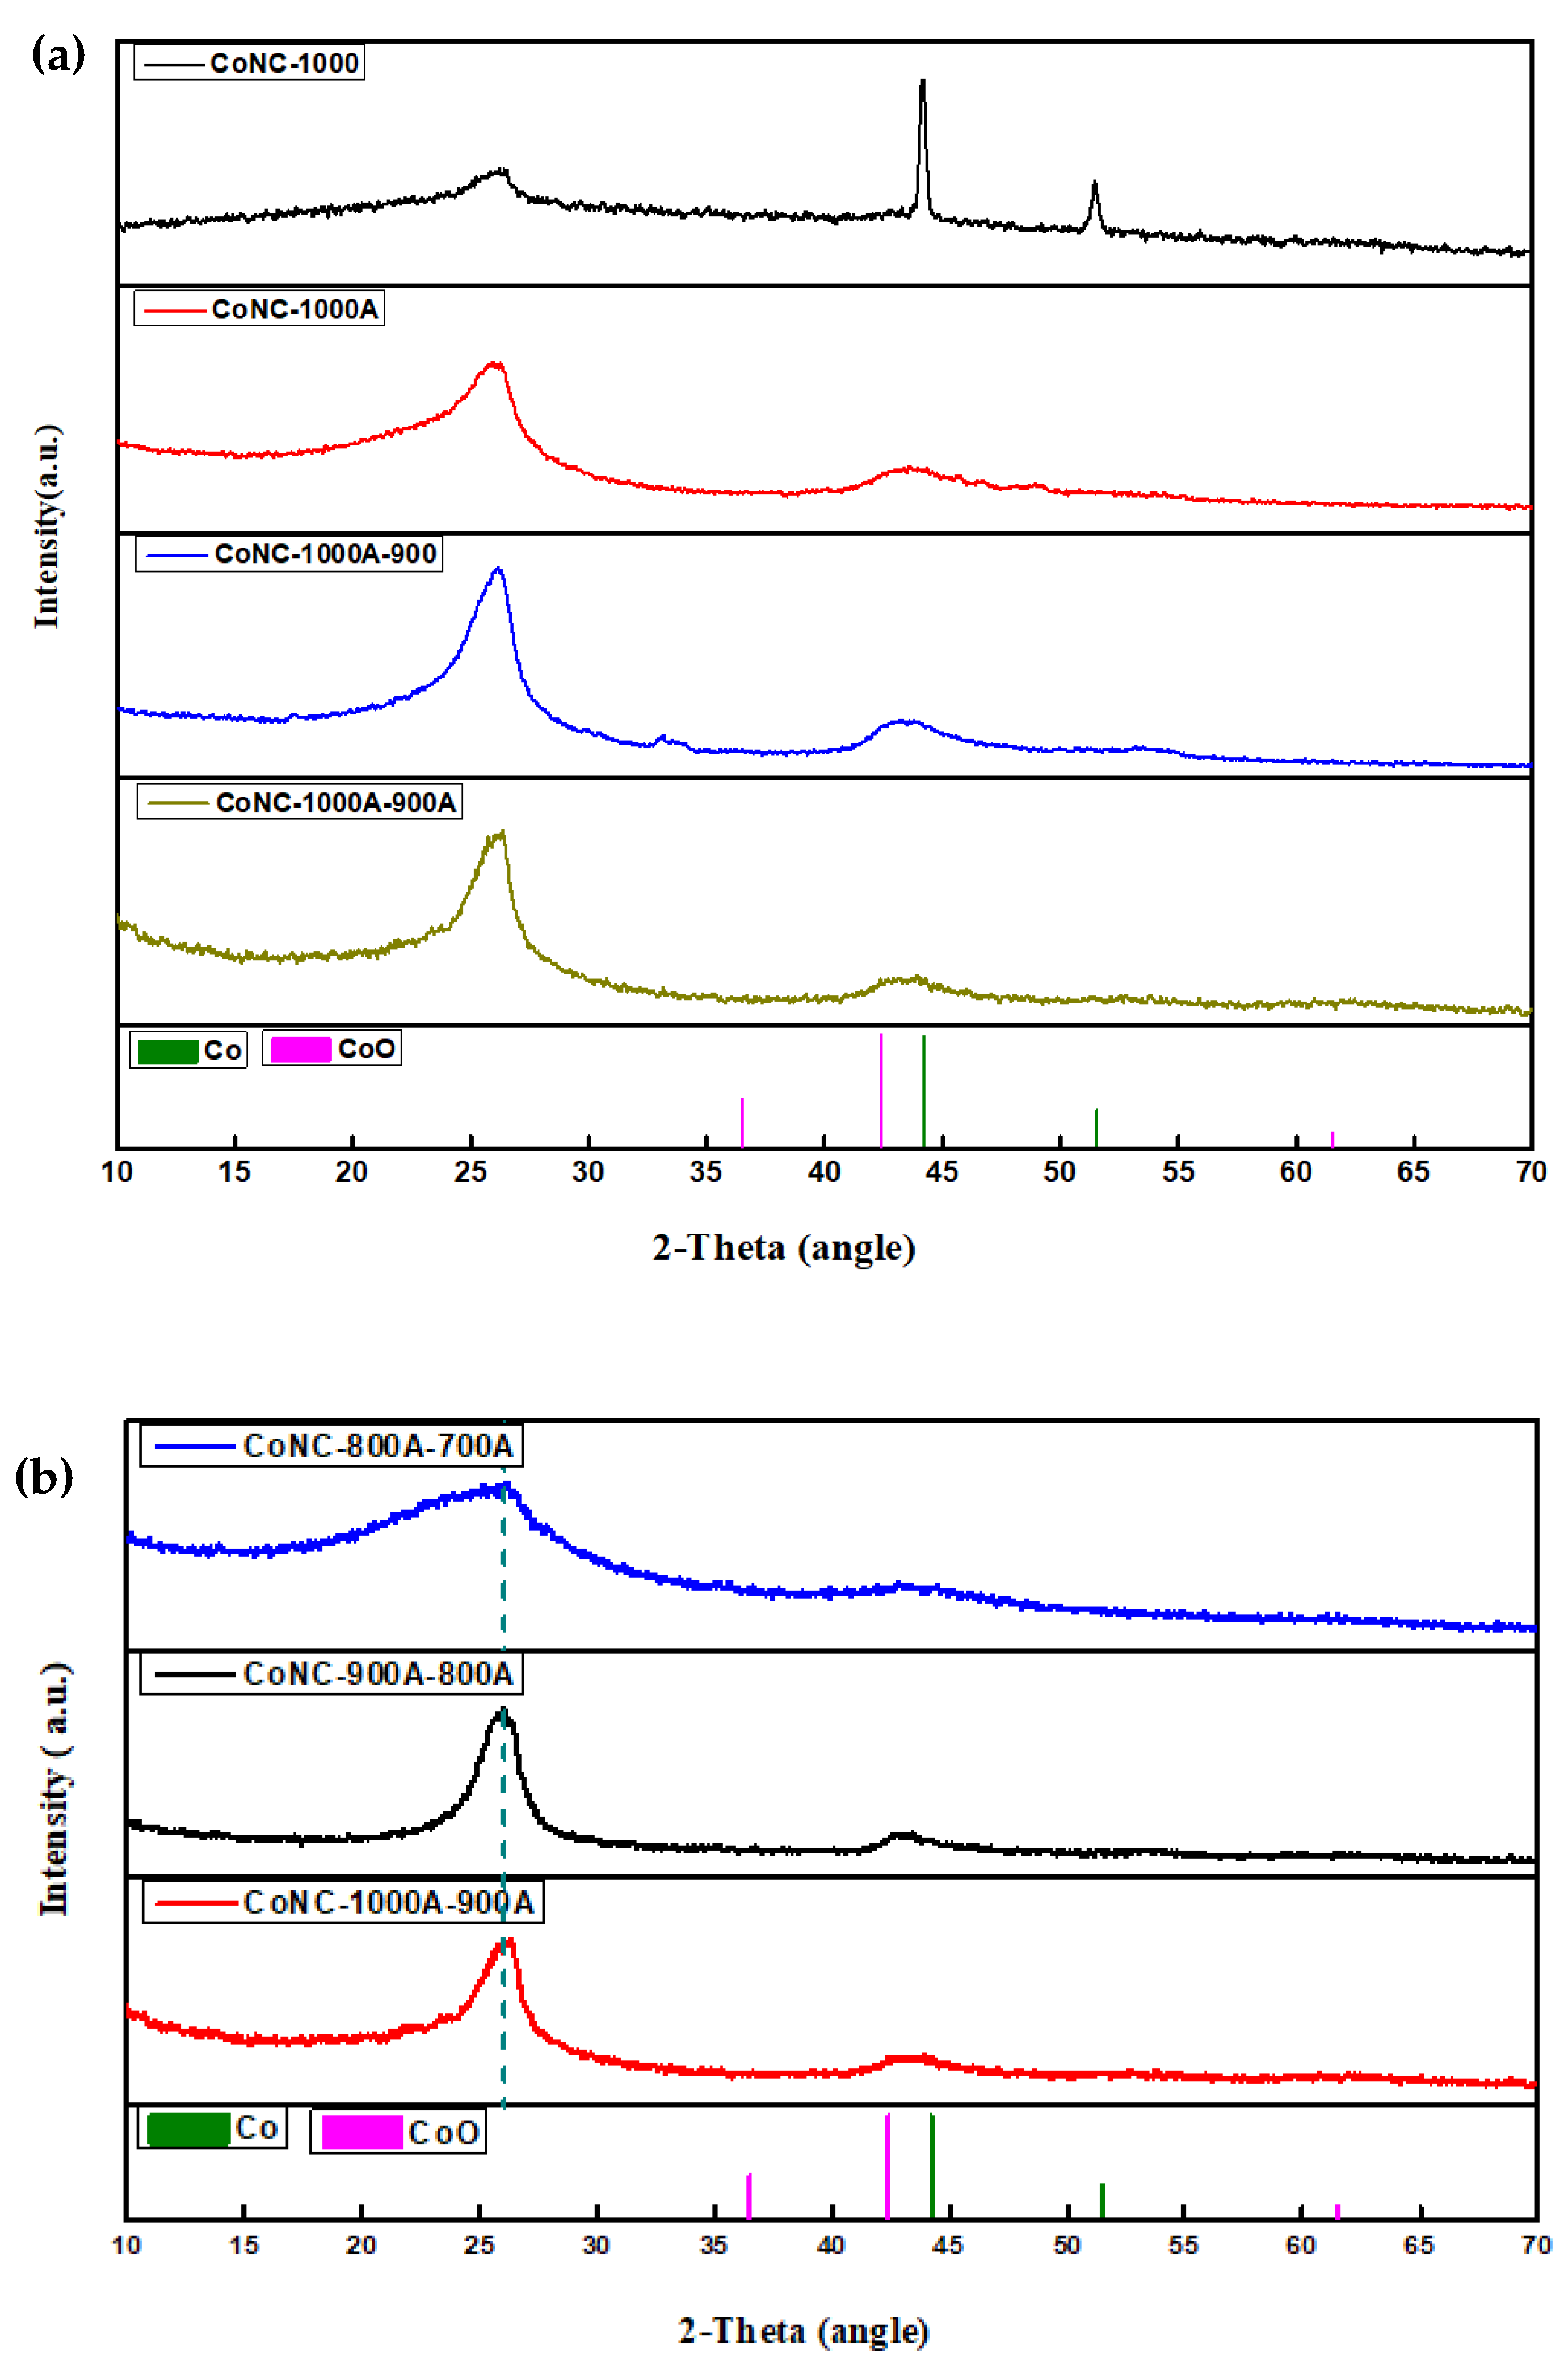
3.3. WAXD Spectroscopy
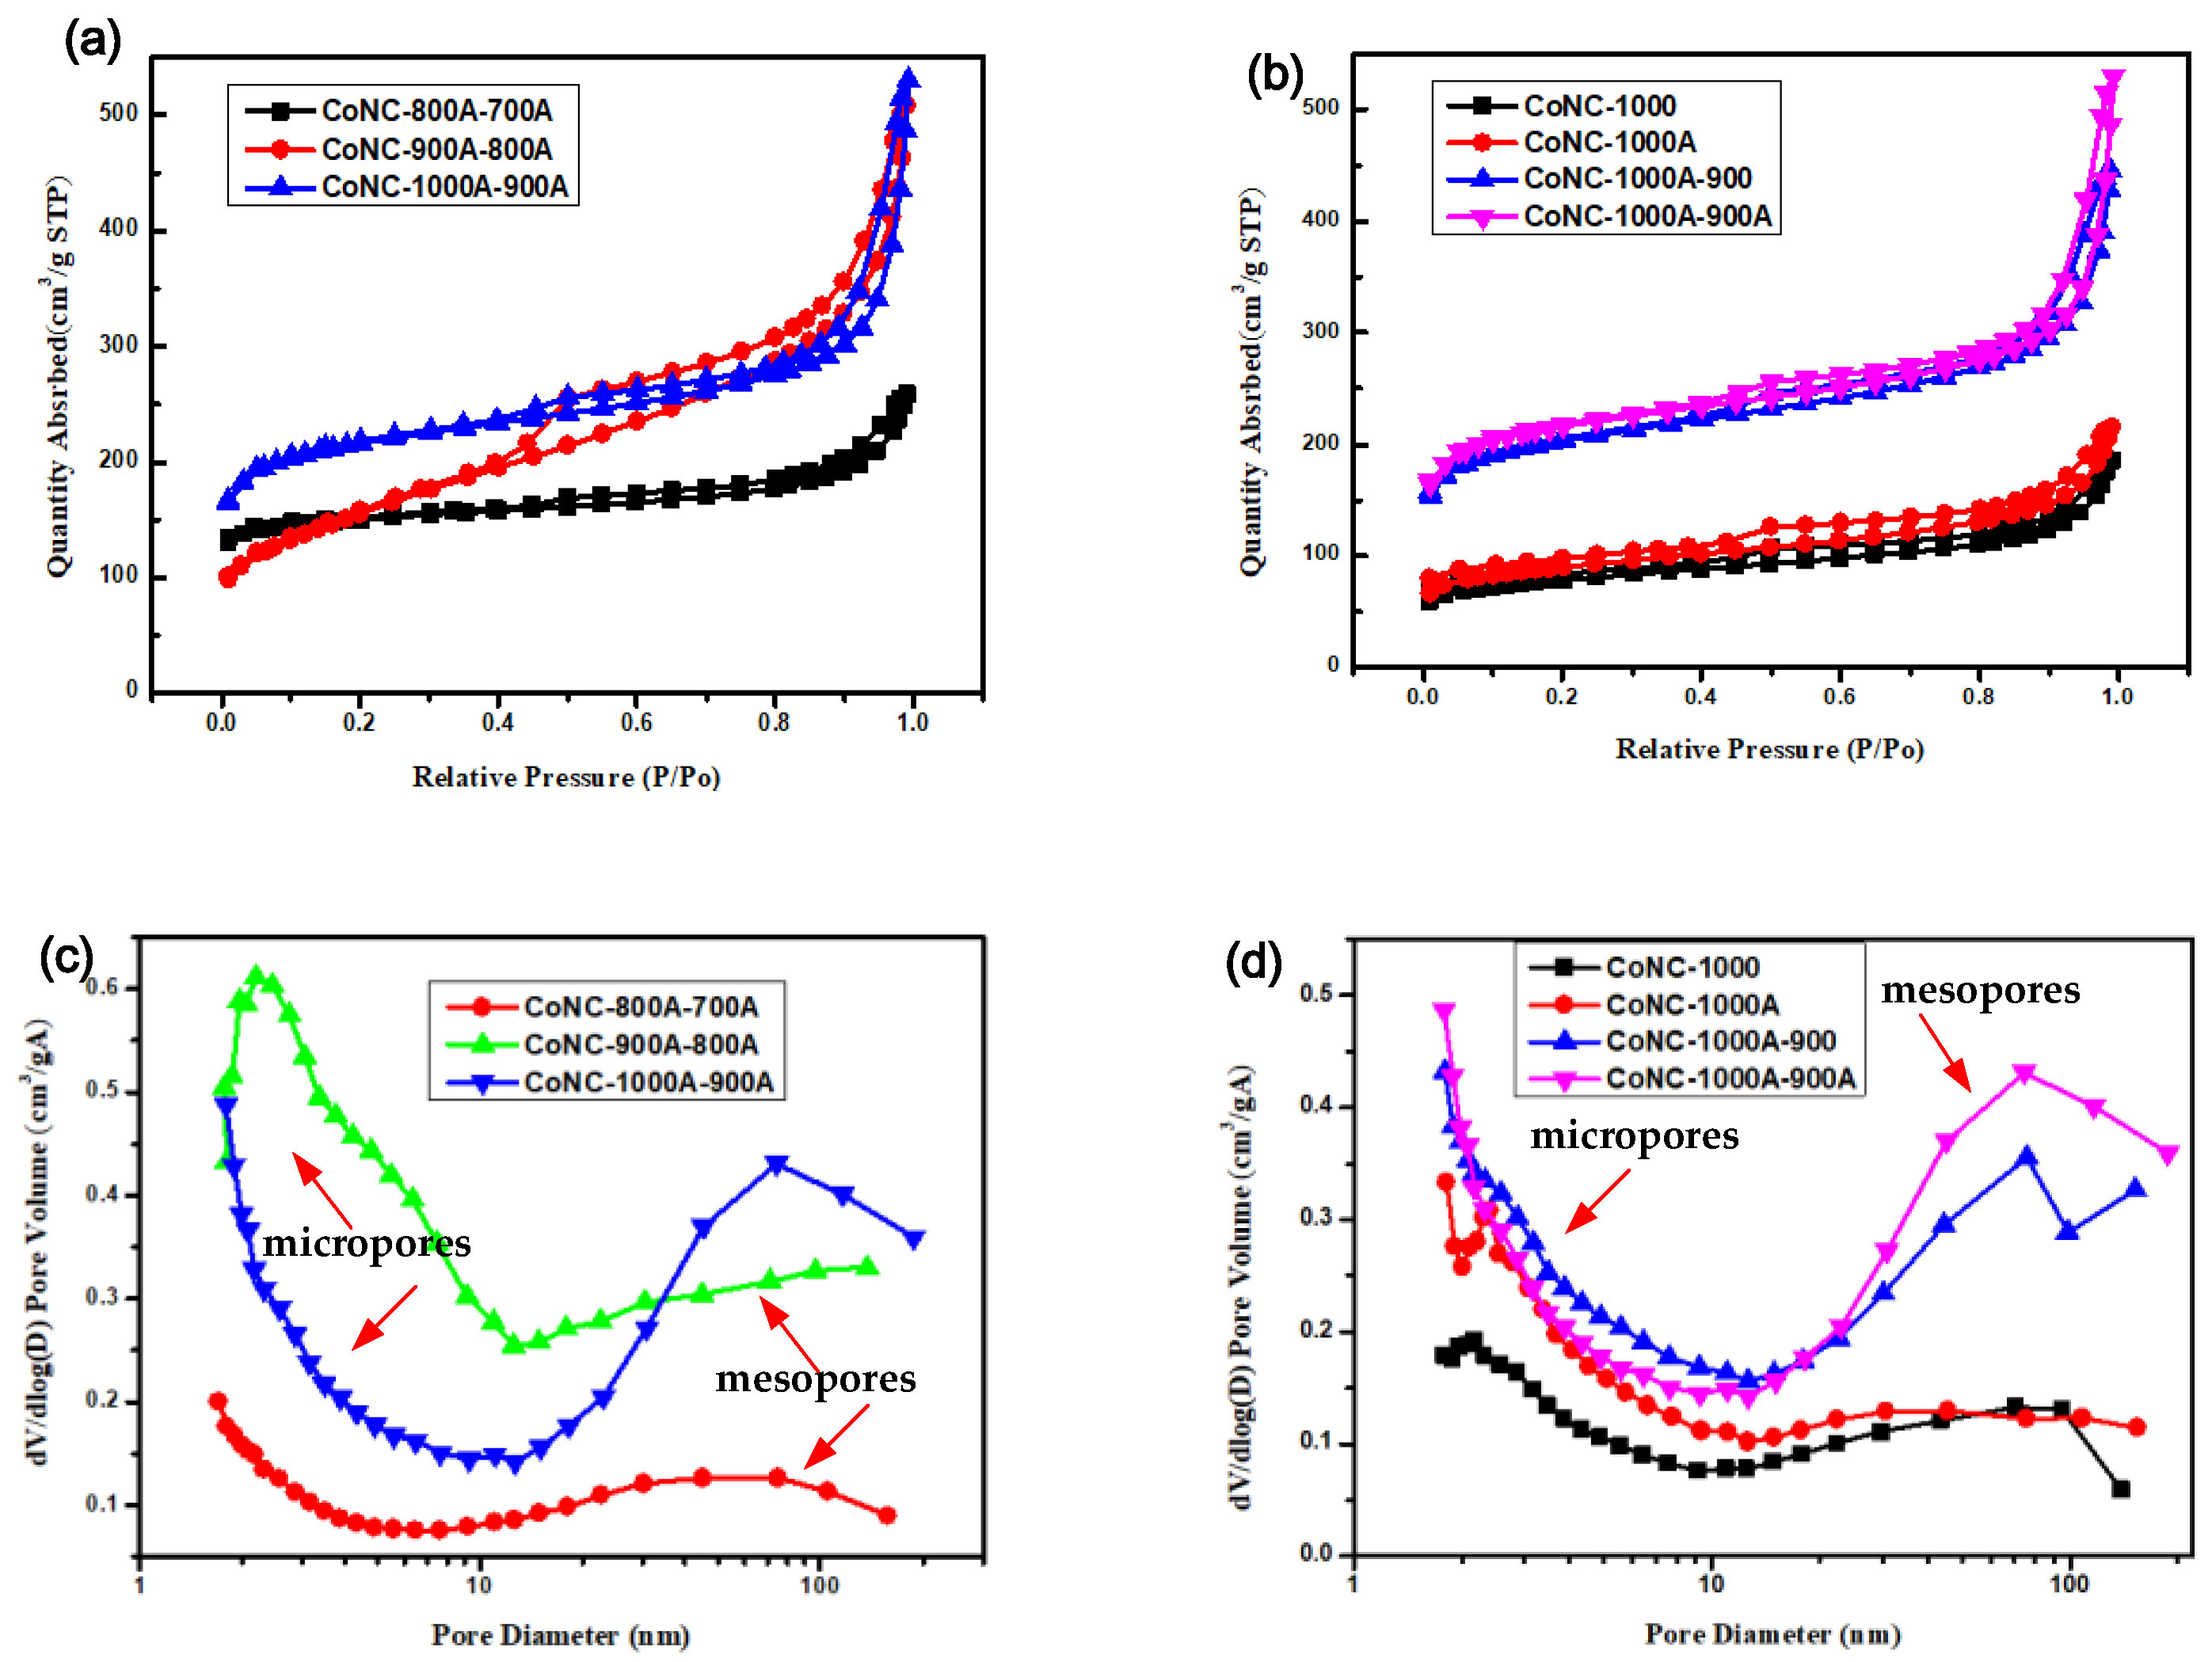
3.4. BET Surface Area and Pore Size Distribution
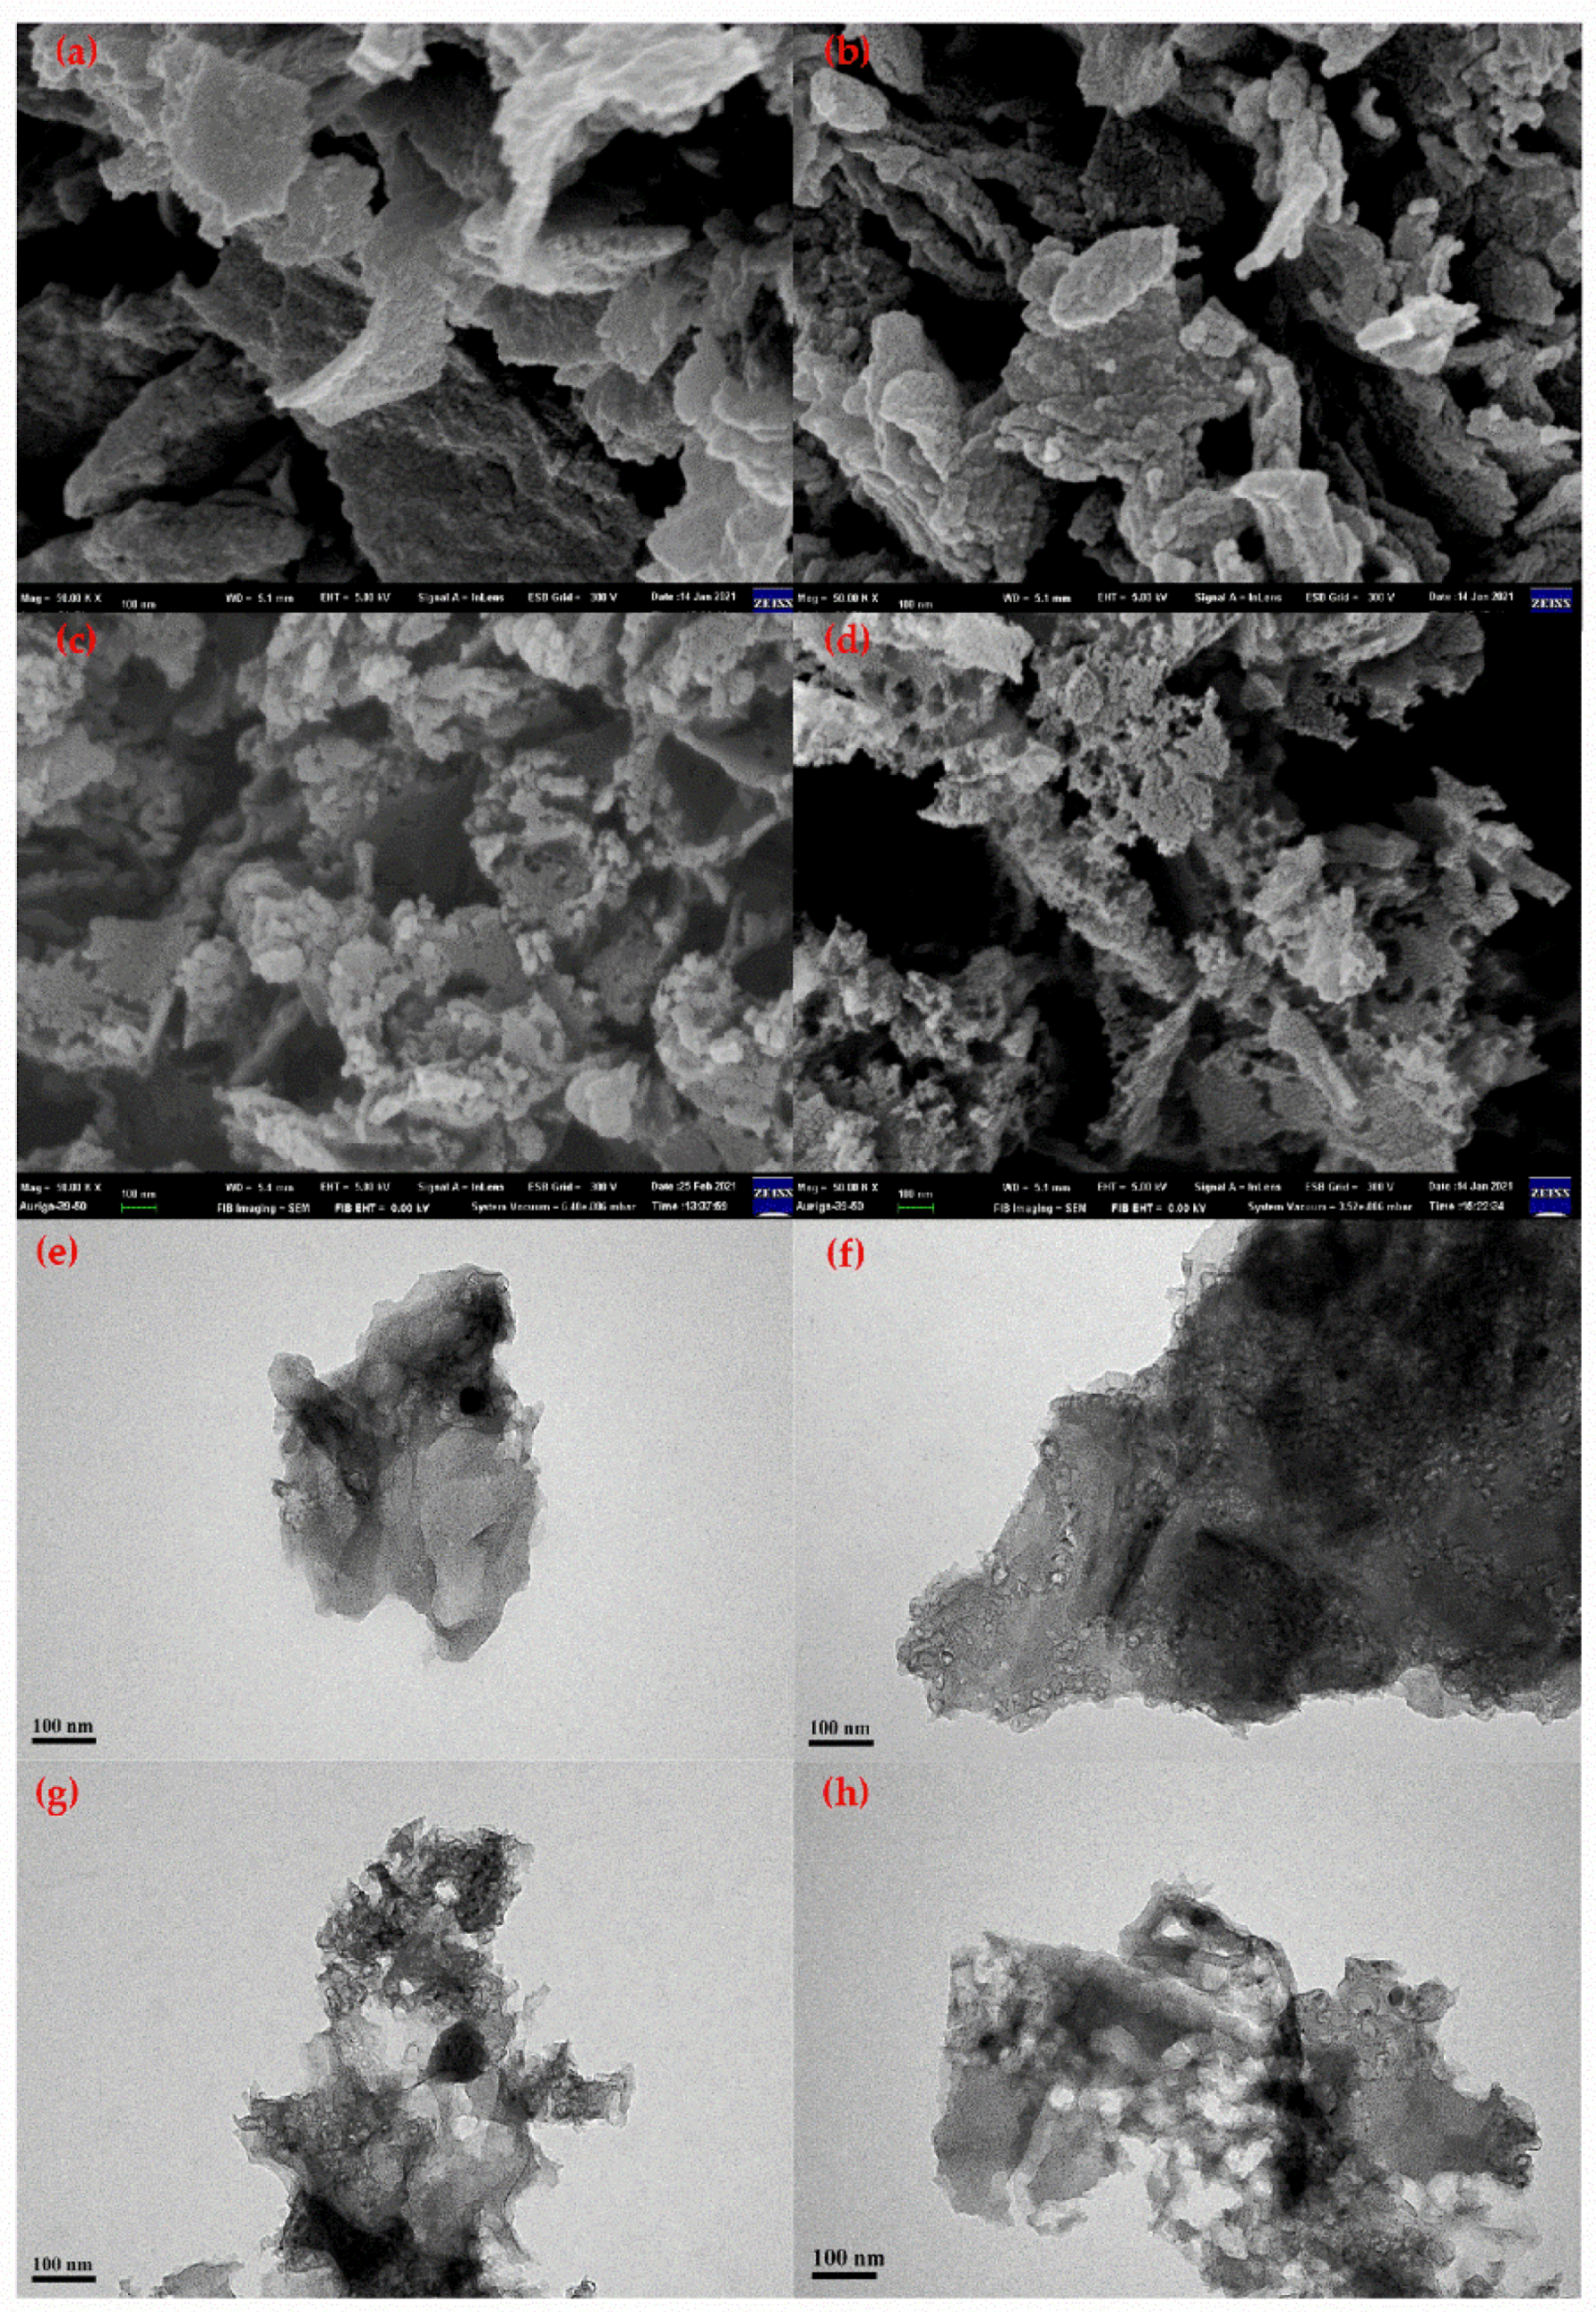
3.5. SEM and TEM Micrograph
3.6. Electrochemical Measurement
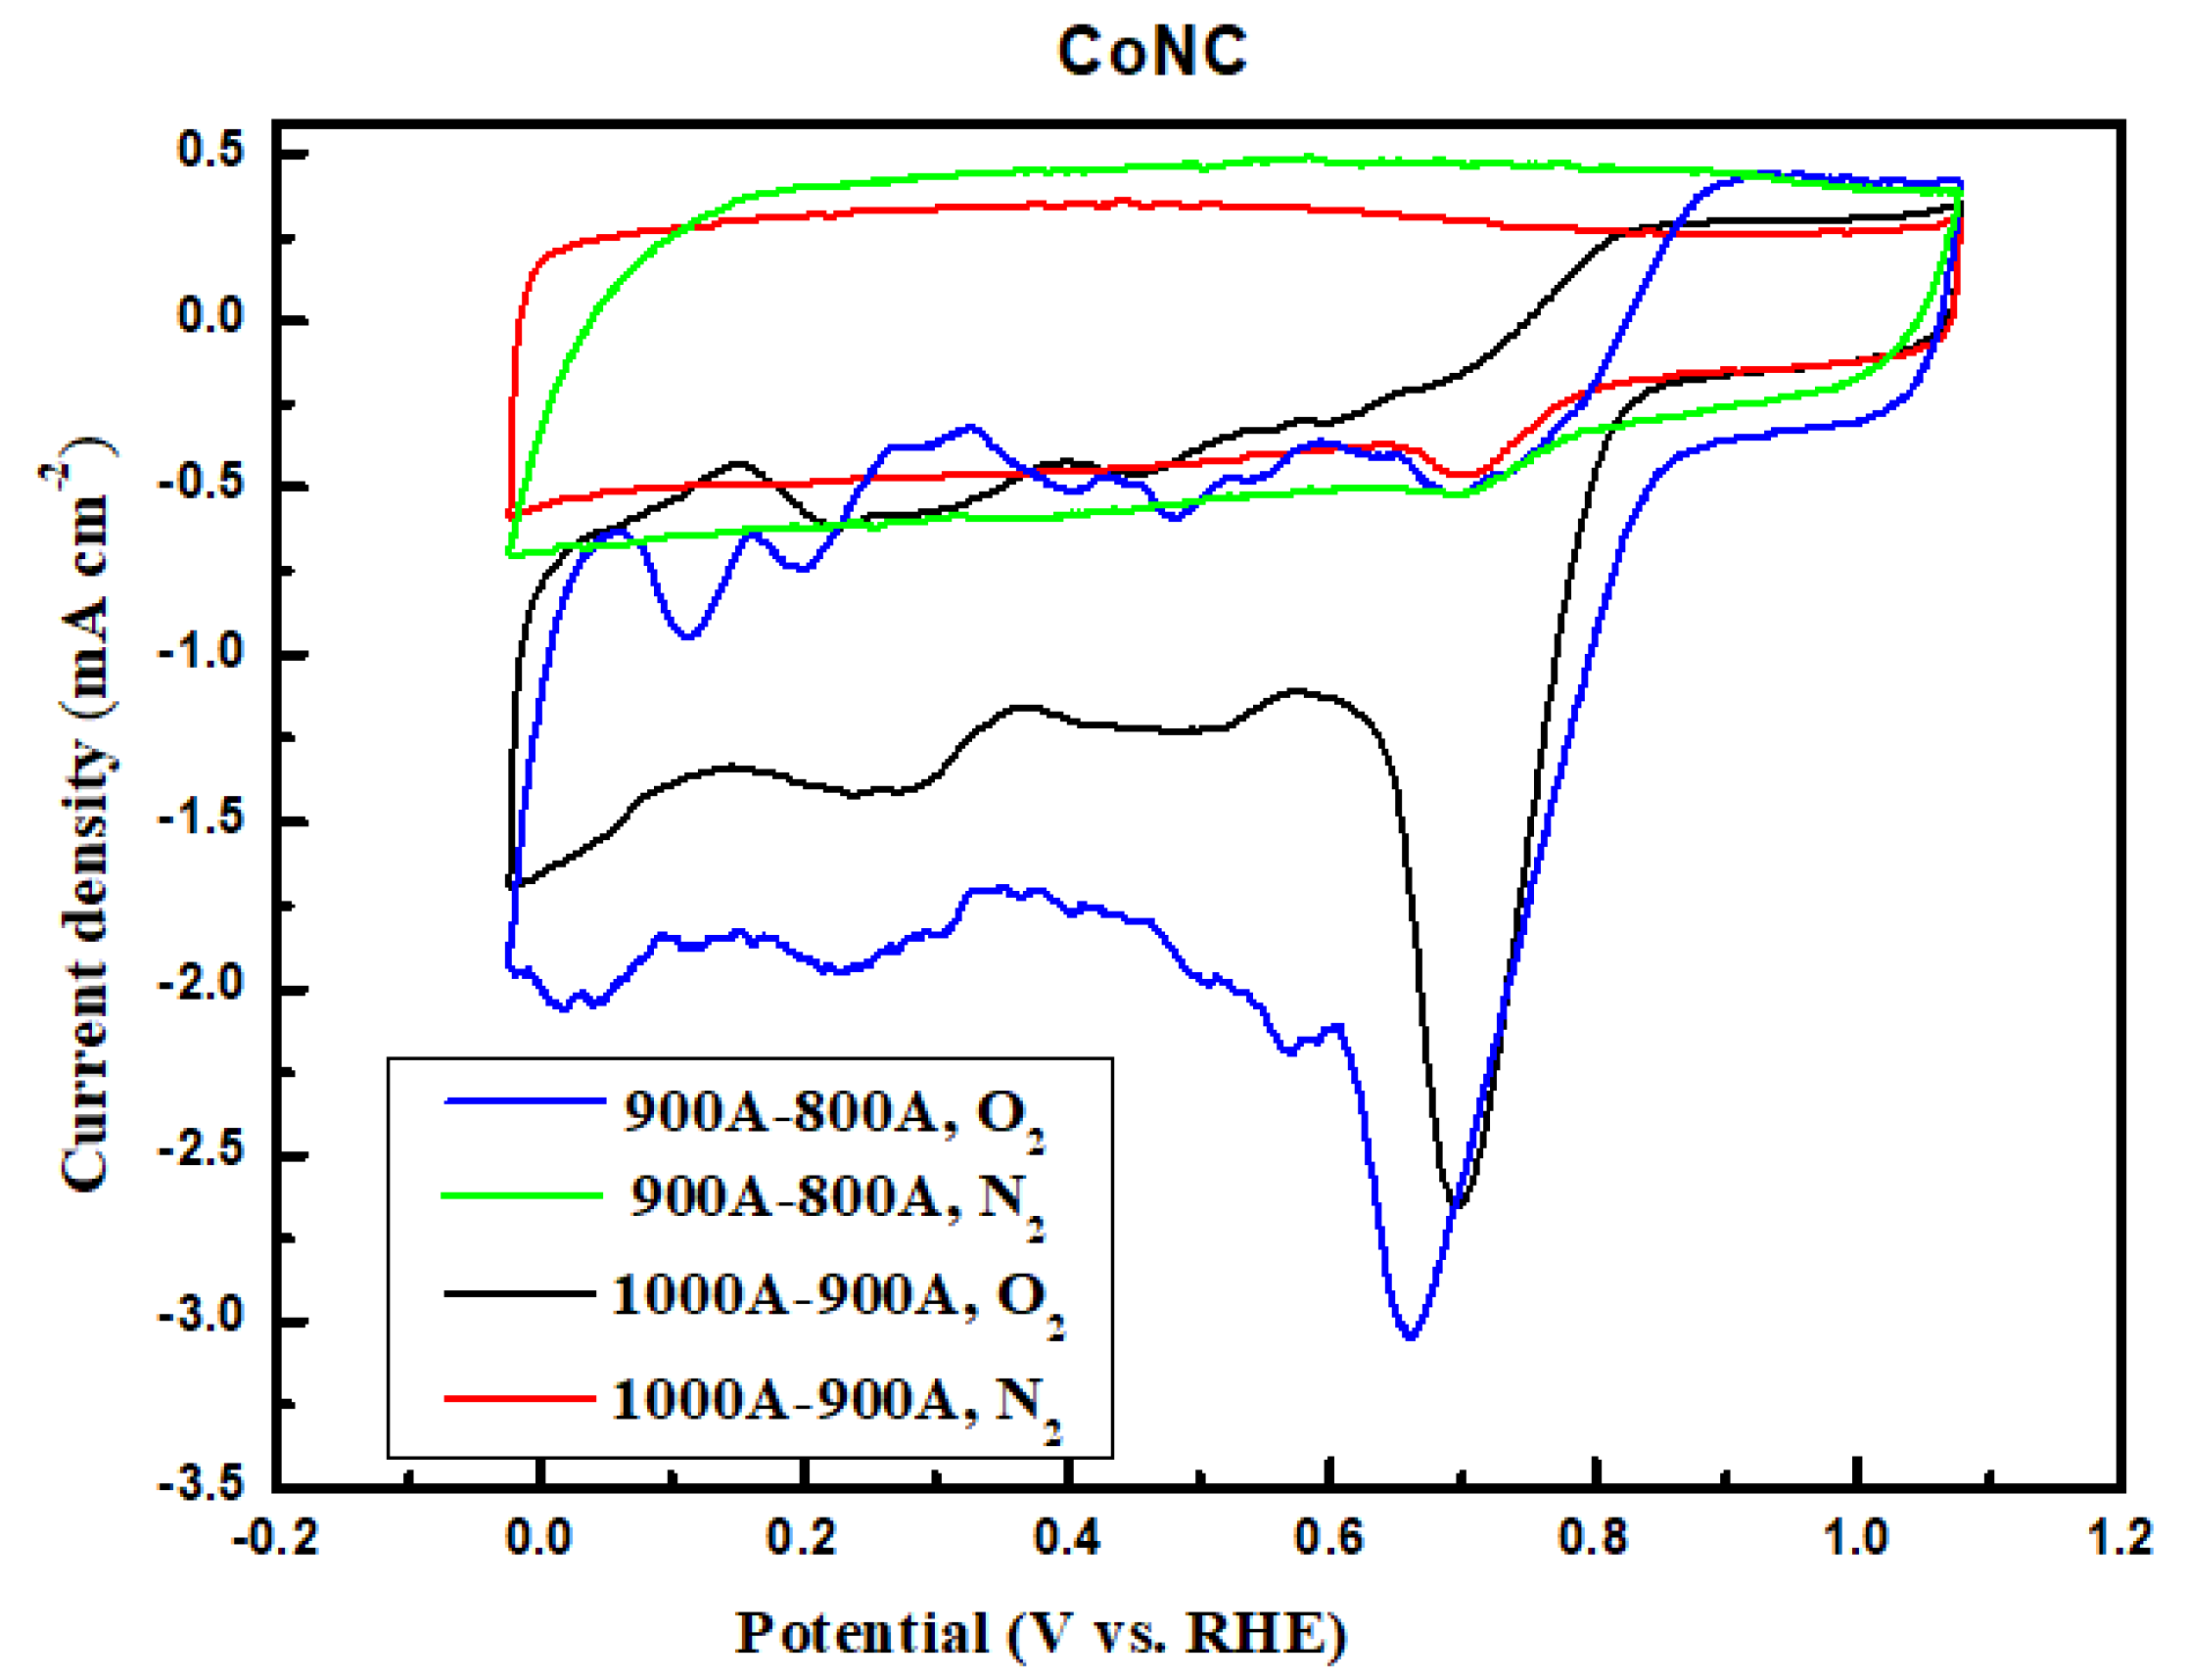
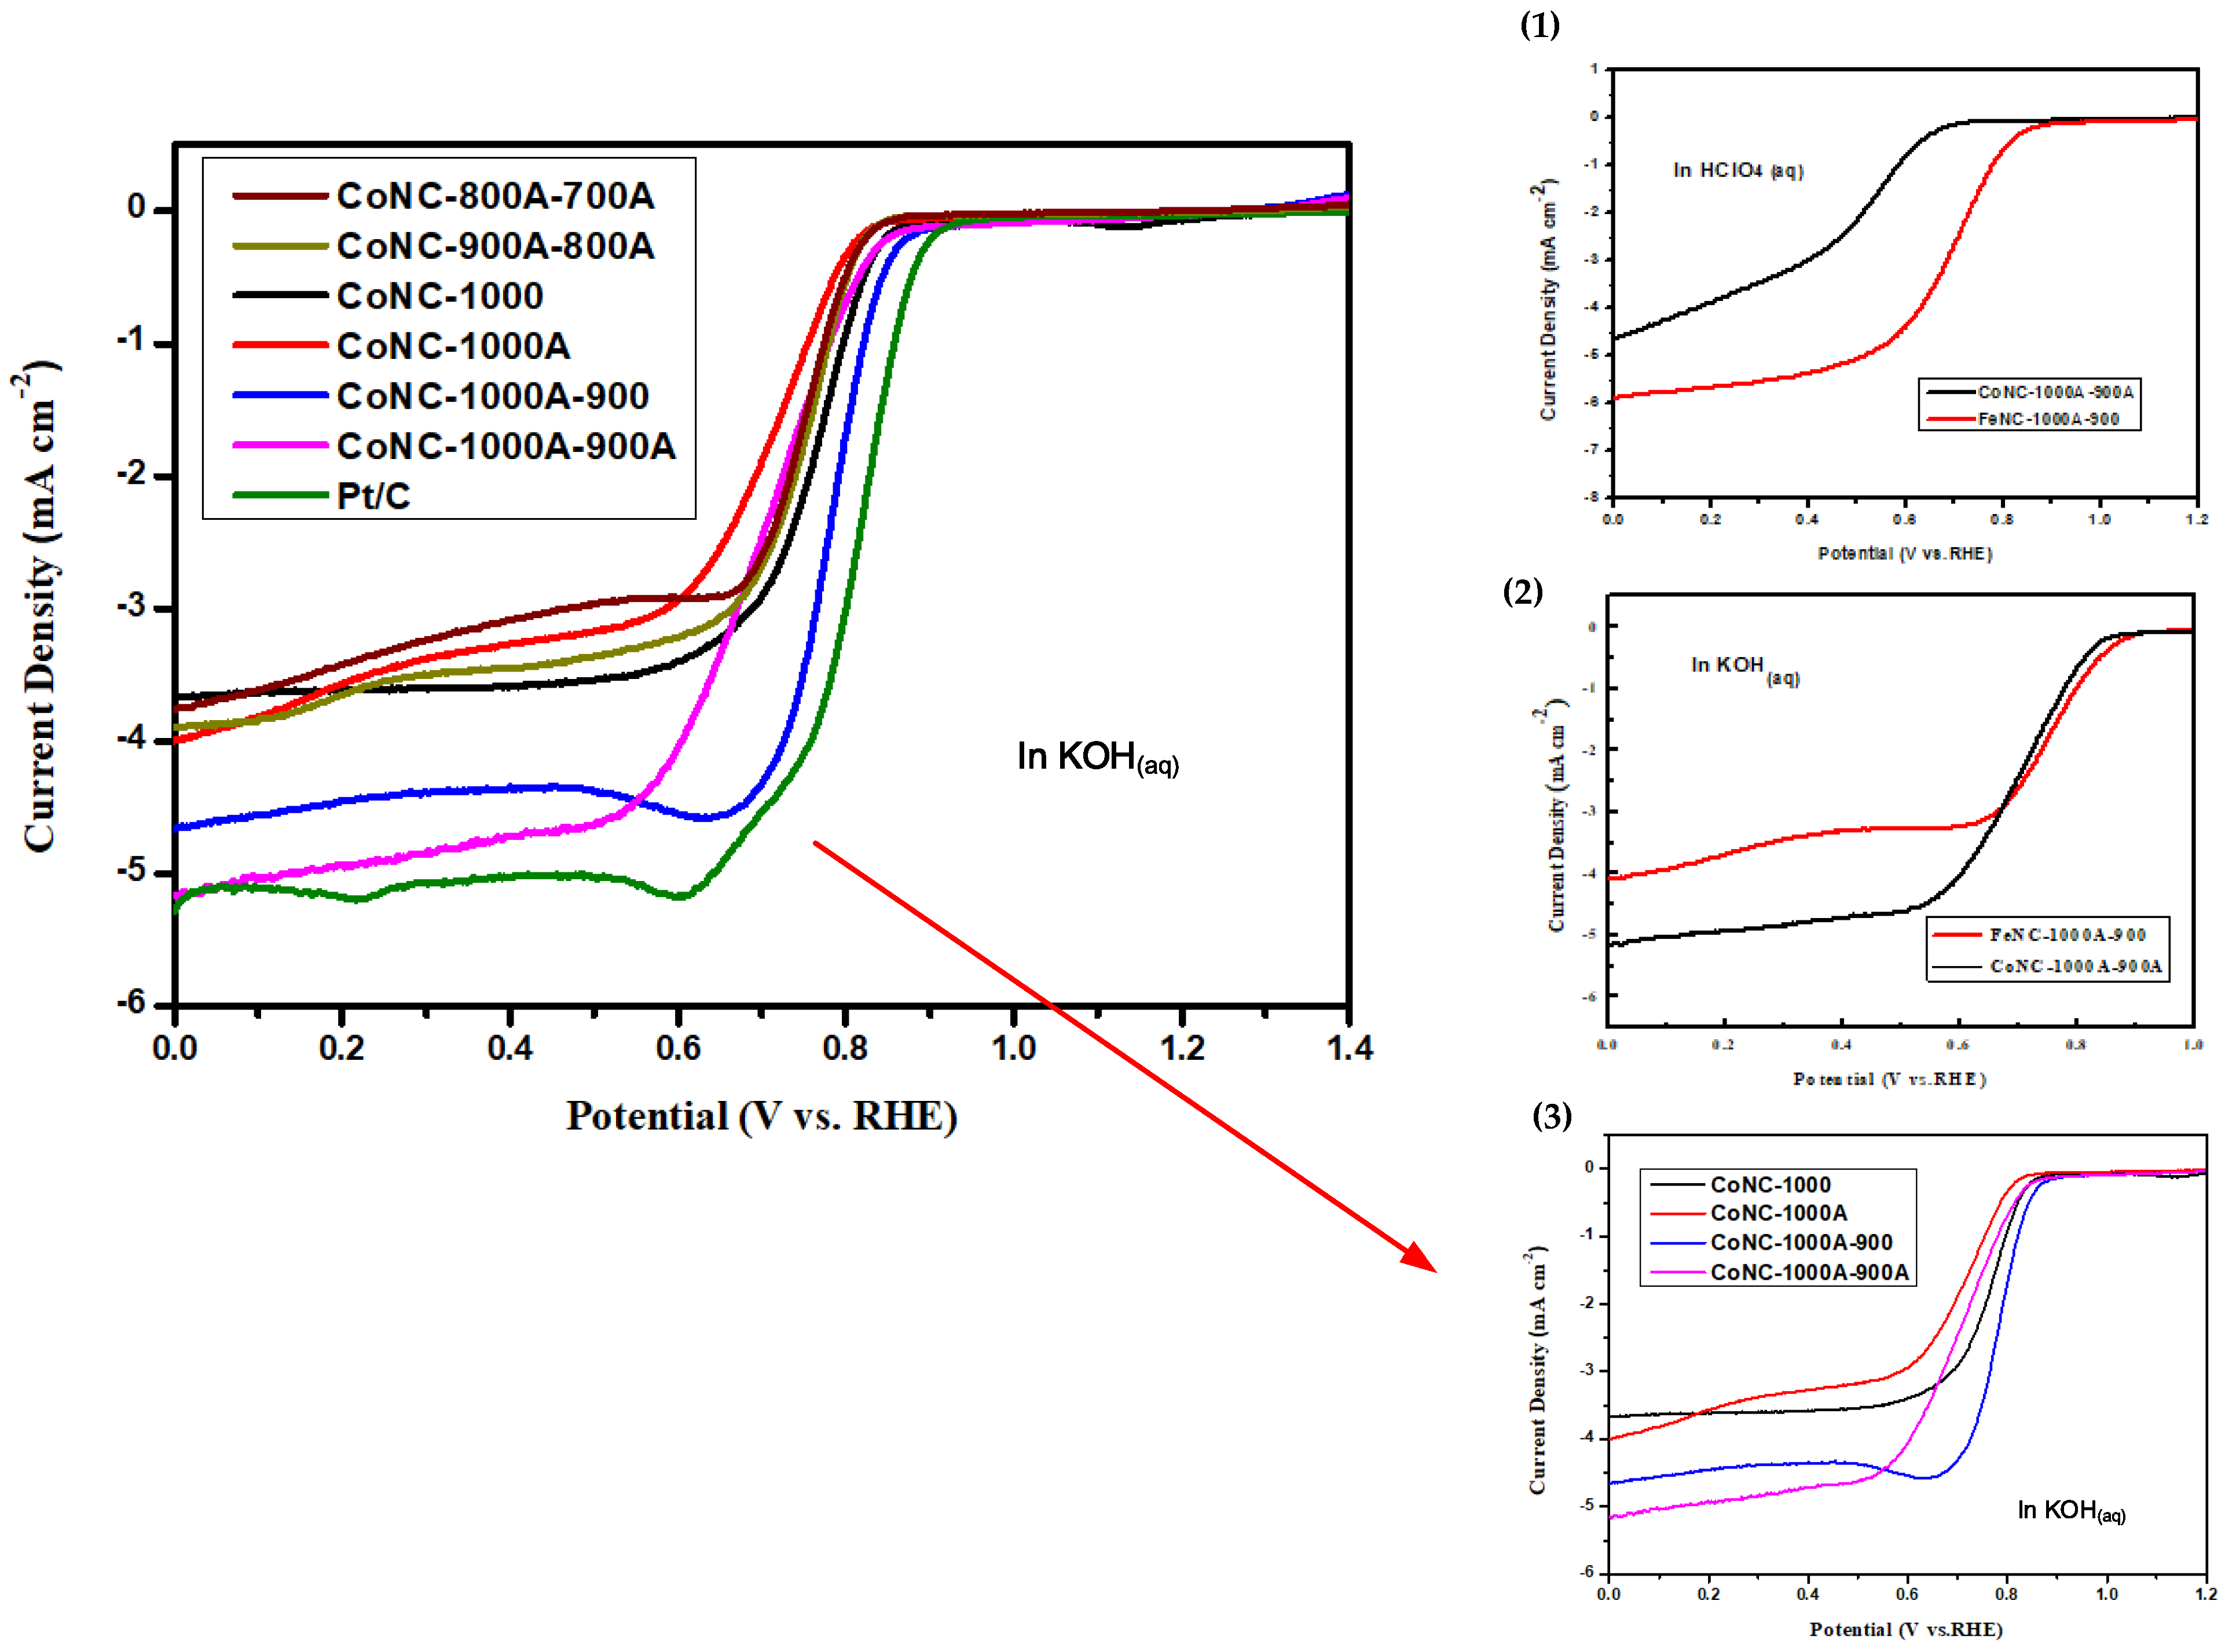
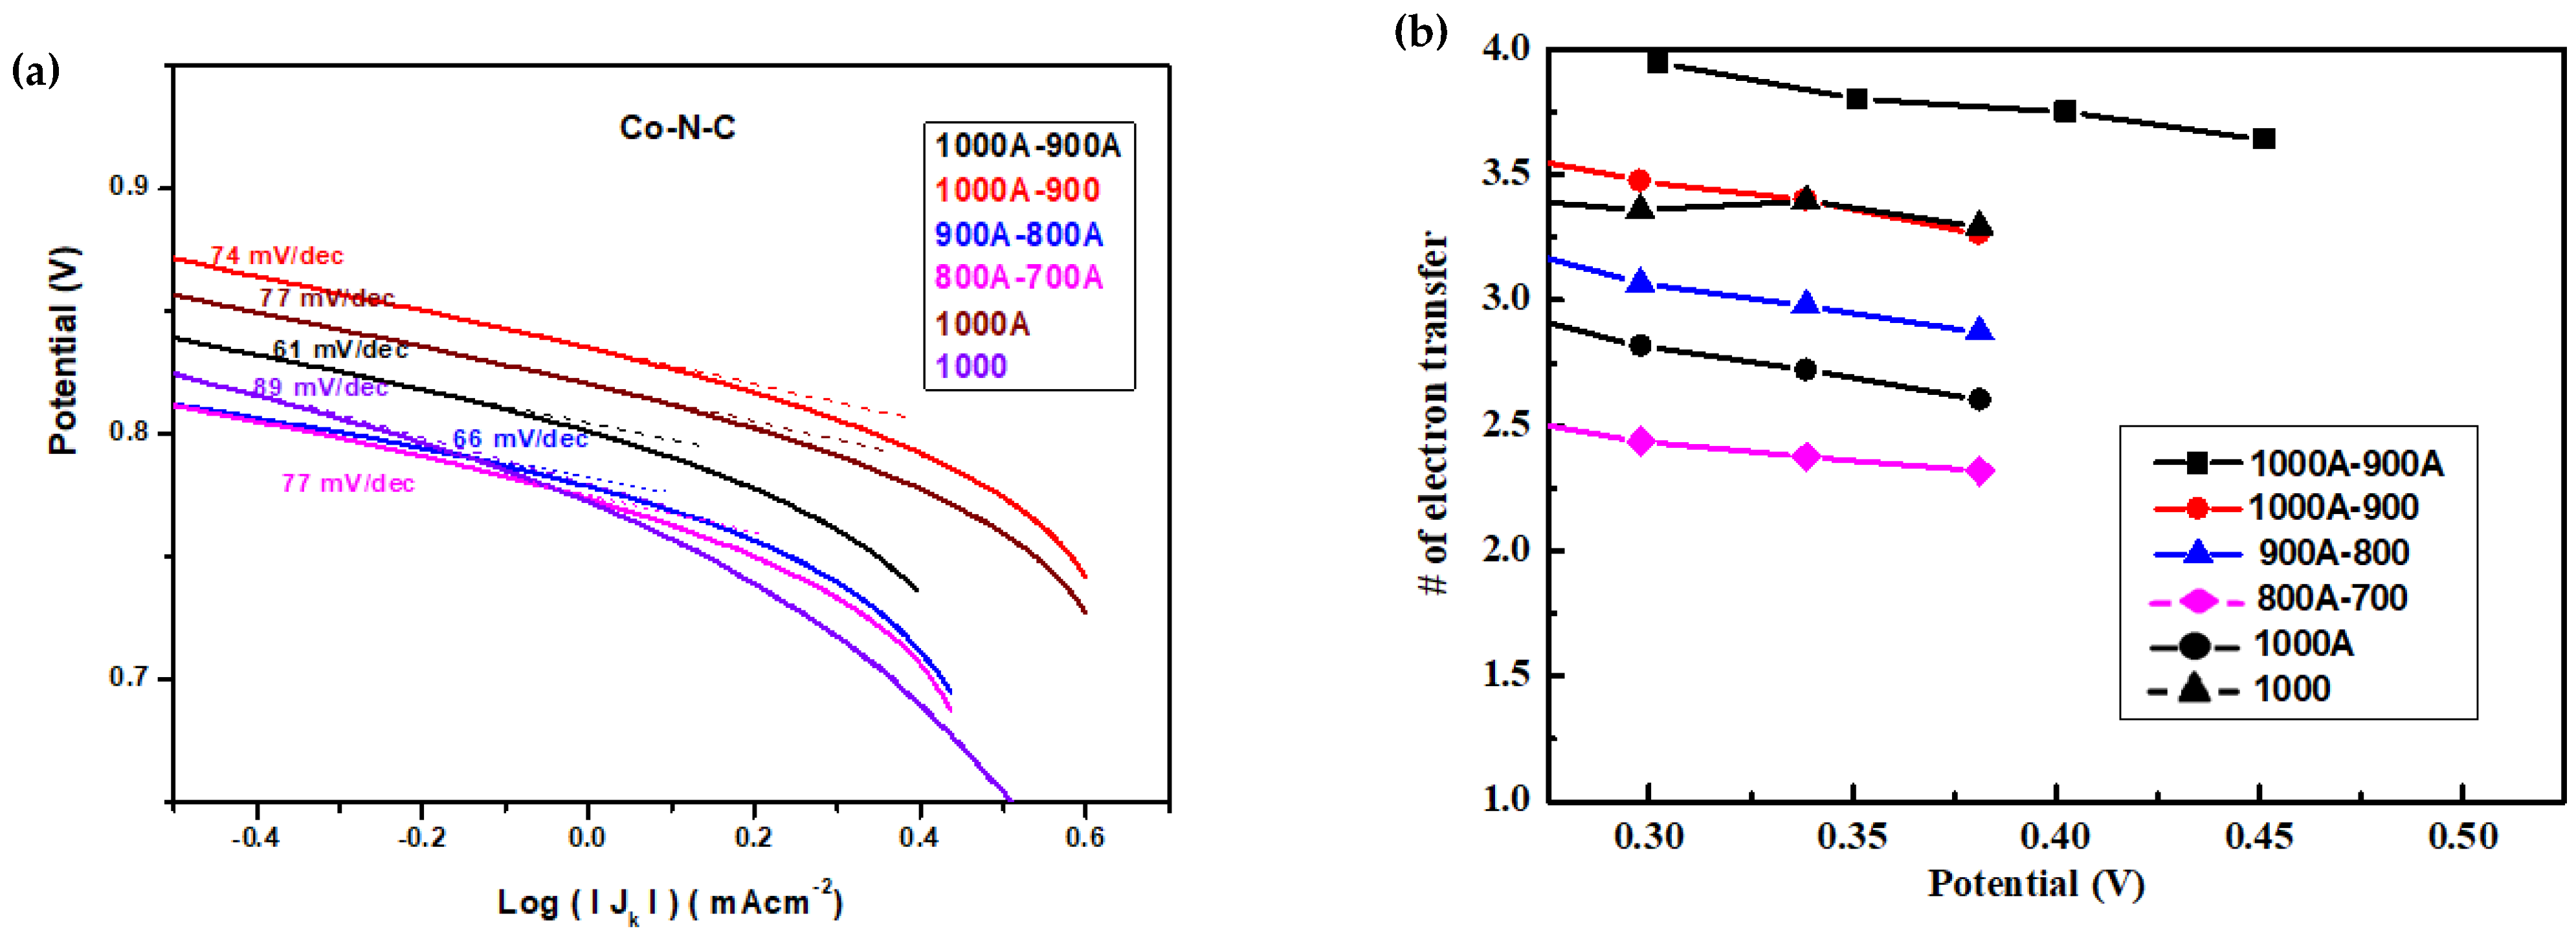
3.6.1. CV and LSV Curves
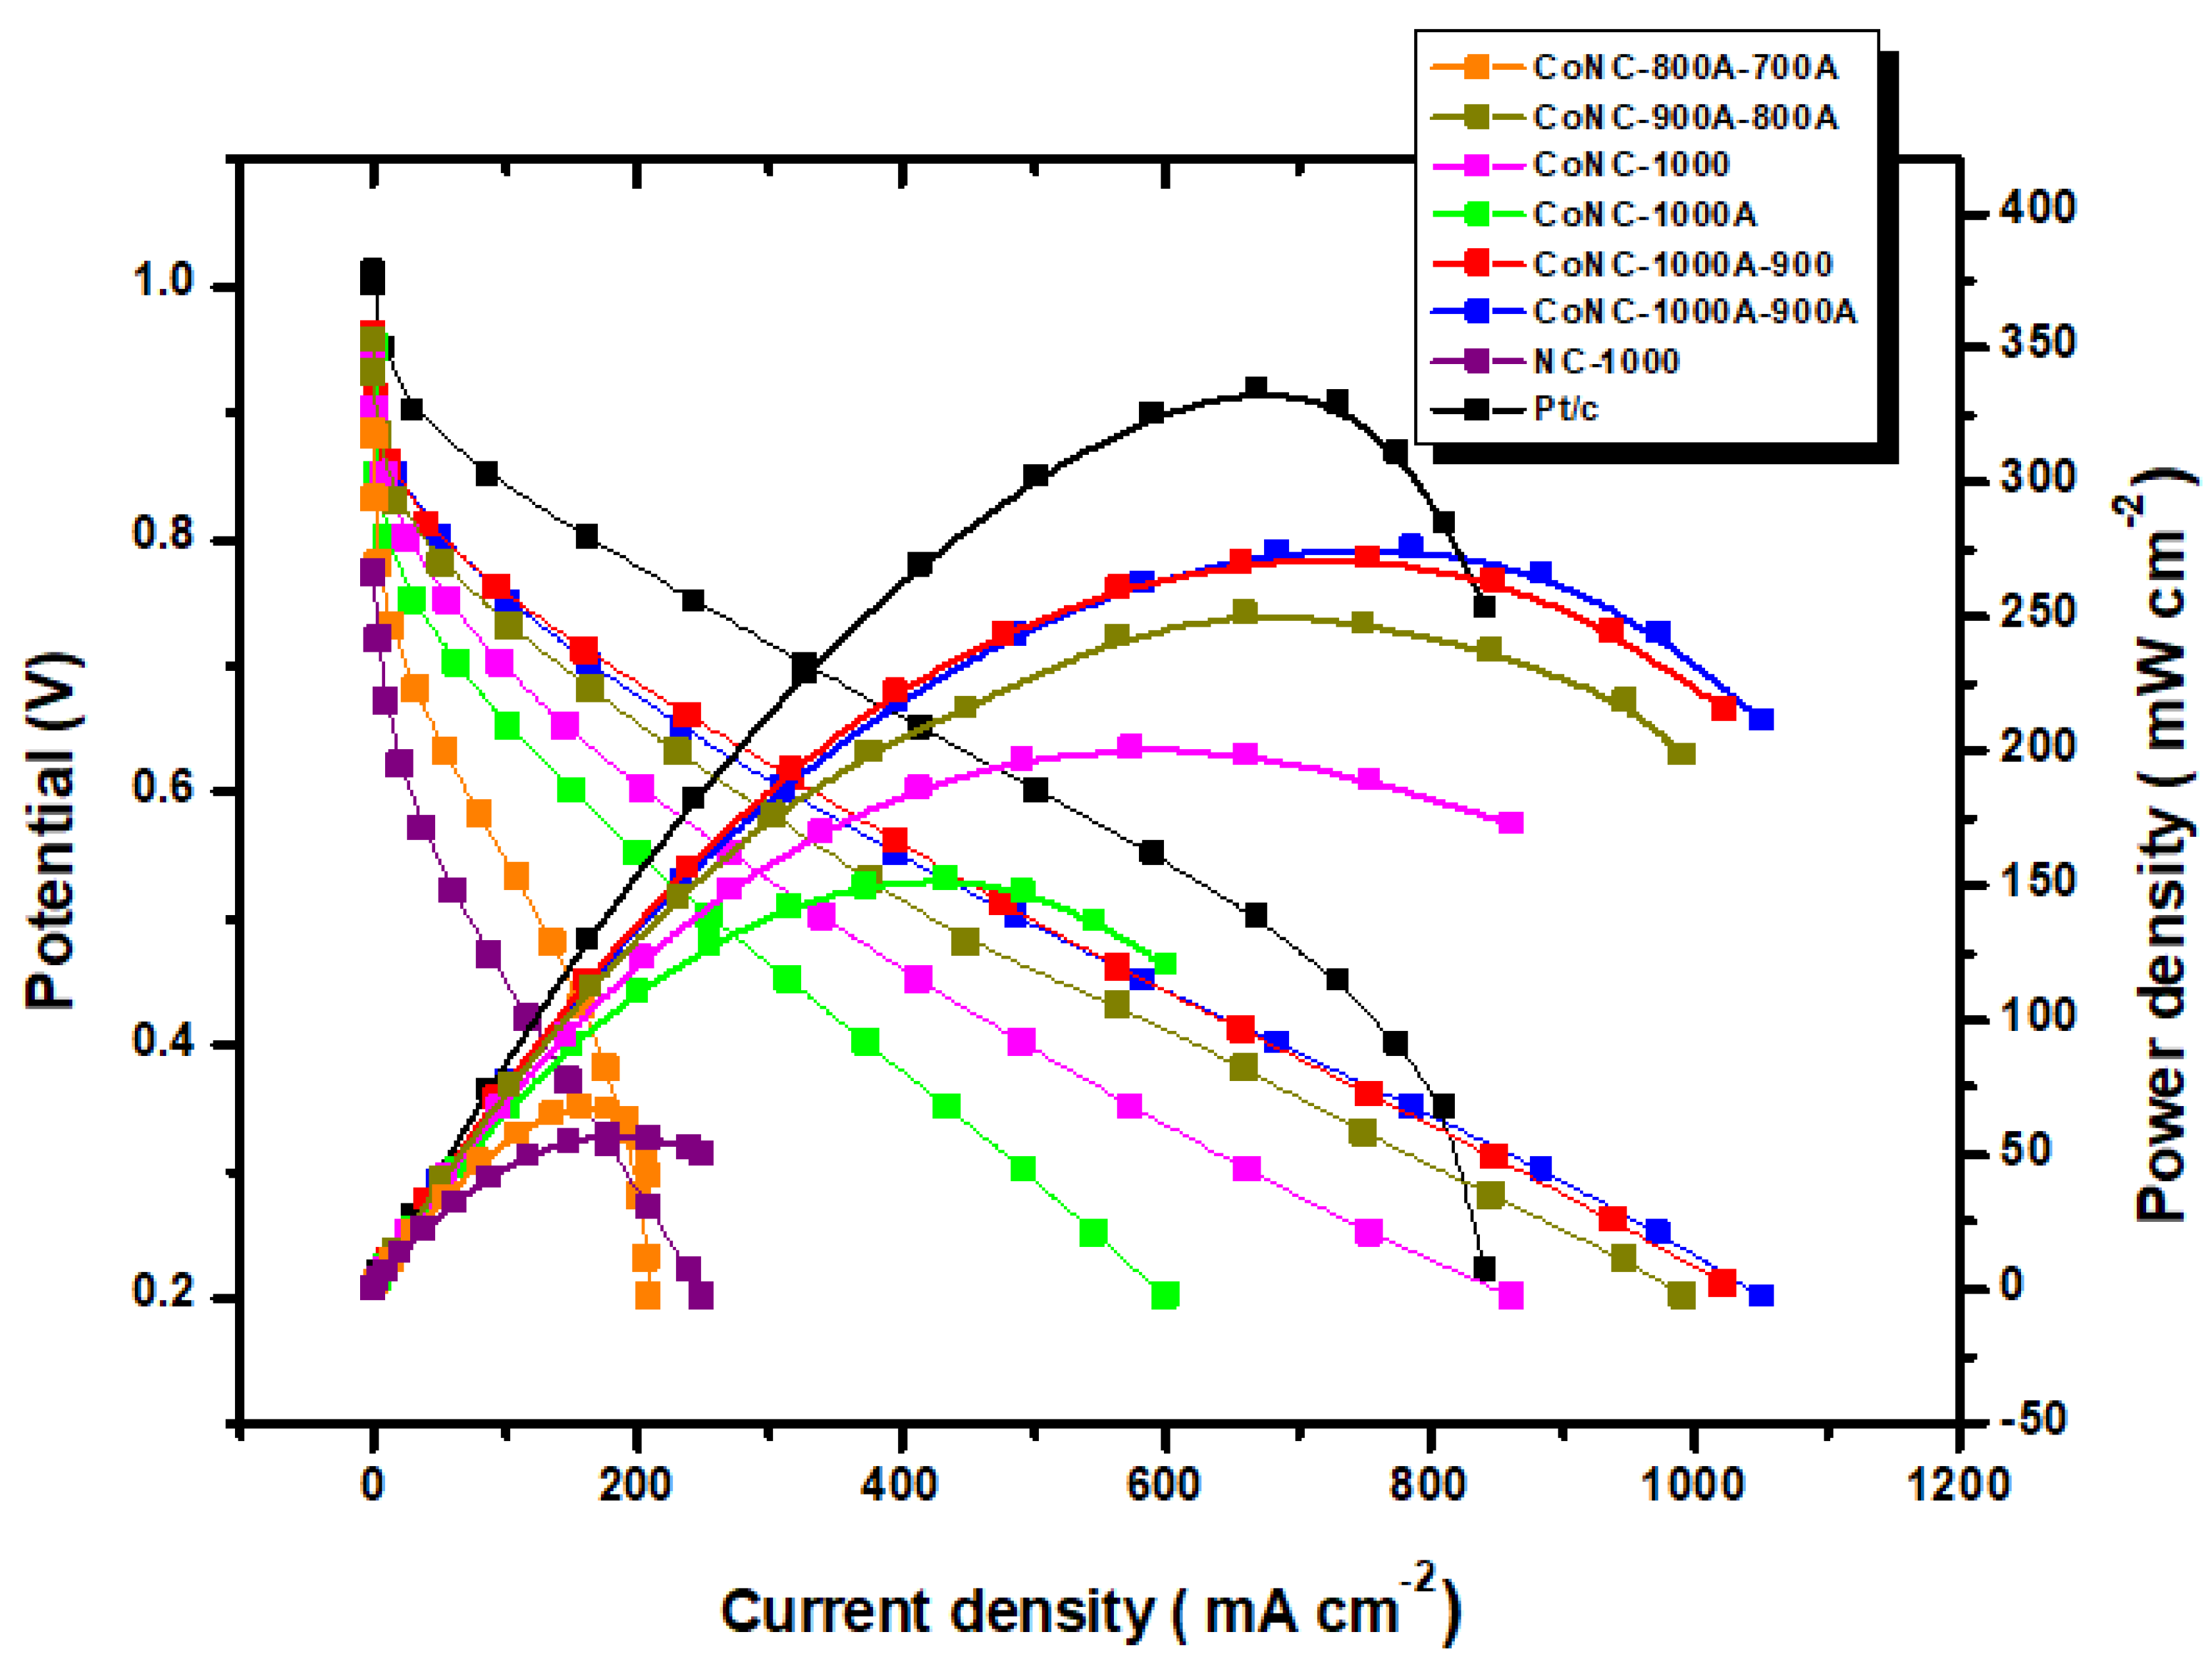
3.6.2. MEA and Single Cells
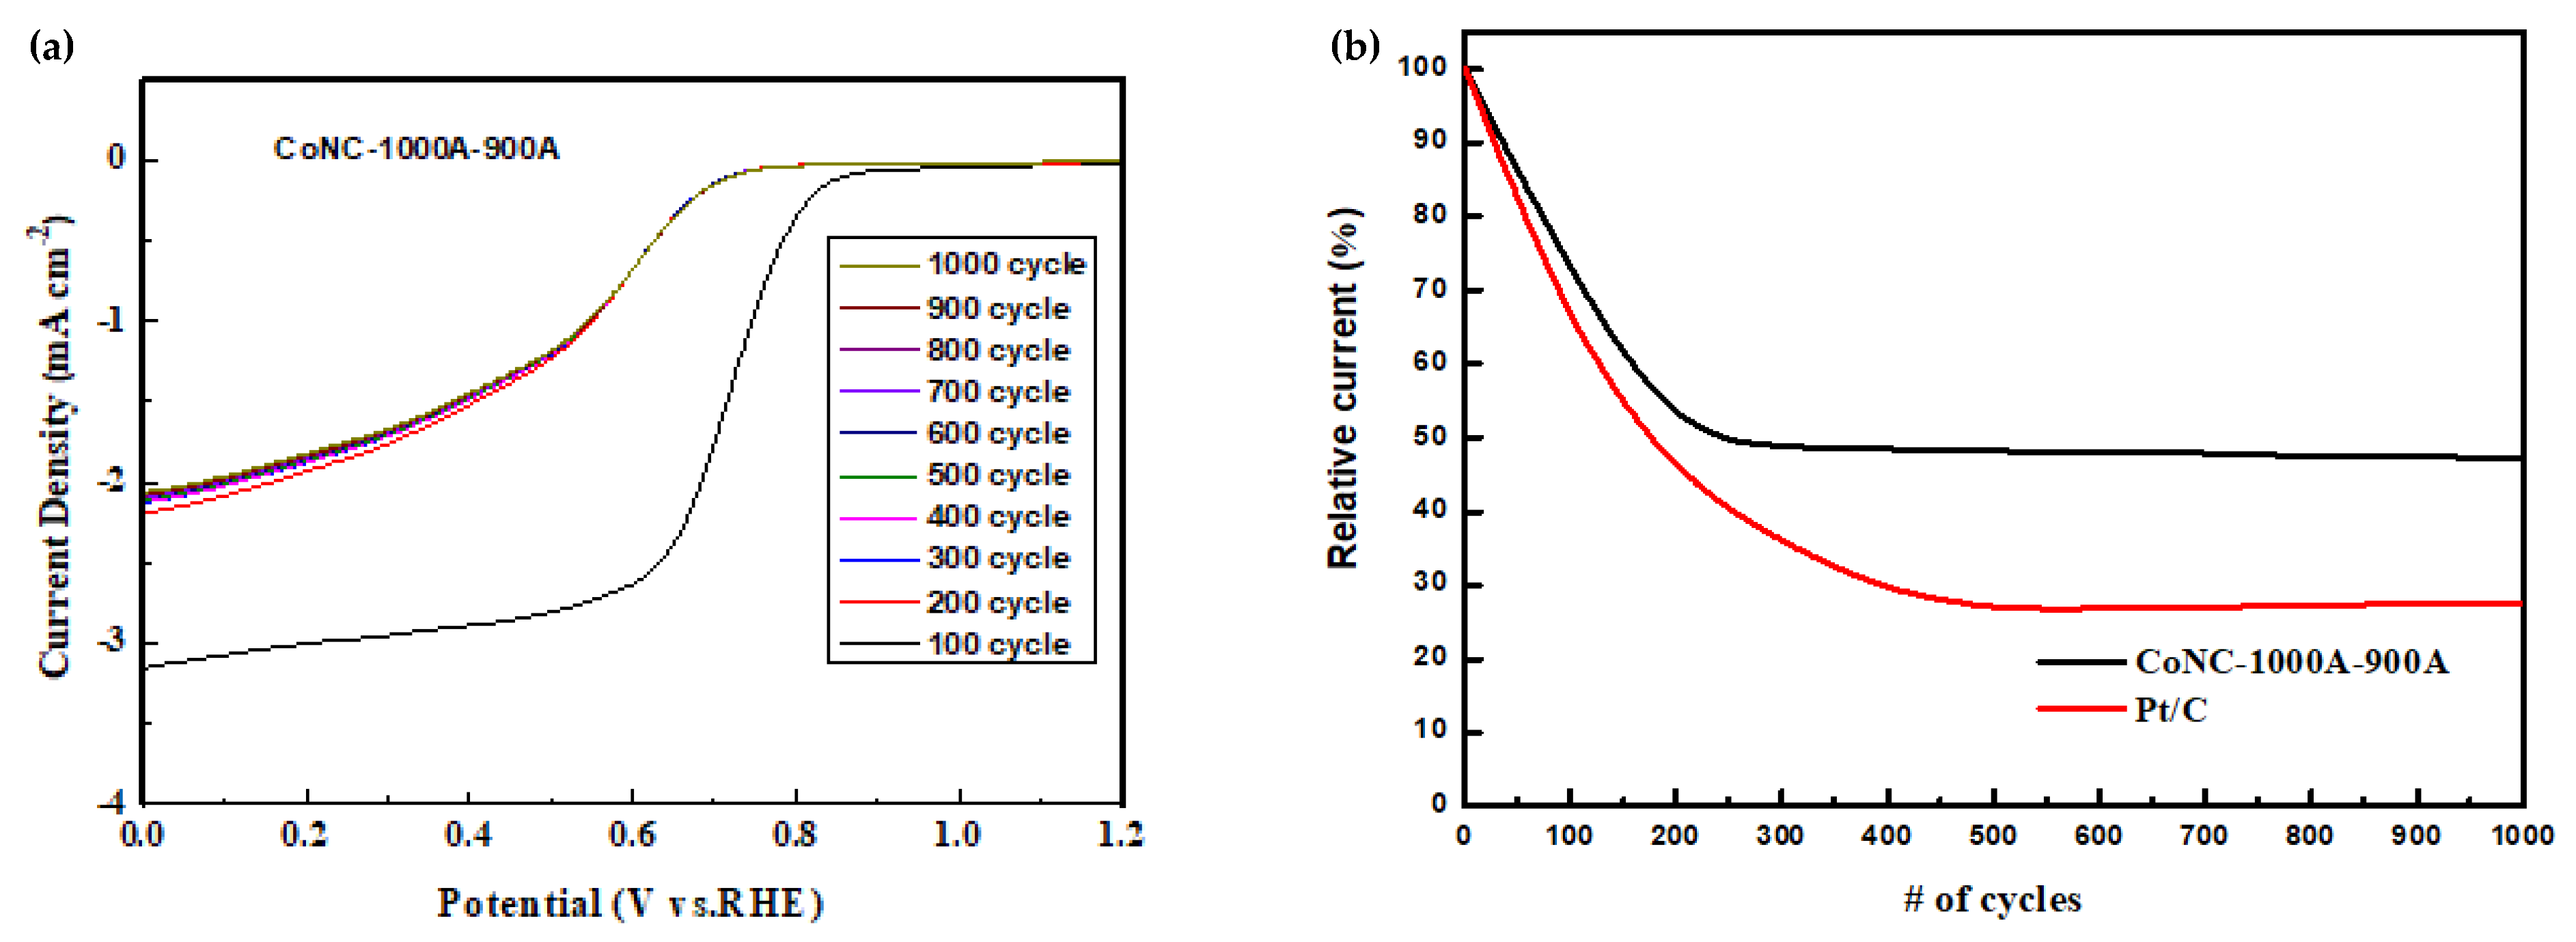
3.6.3. Durability Testing by Limited Reduction Current Density
4. Conclusions
Author Contributions
Funding
Institutional Review Board Statement
Informed Consent Statement
Data Availability Statement
Acknowledgments
Conflicts of Interest
References
- Ganesan, S.; Leonard, N.; Calabrese Barton, S. Influence of Transition Metal on Oxygen Reduction Activity of Metal-Nitrogen-Carbon Electrocatalyst. ECS Trans. 2013, 58, 1691–1699. [Google Scholar] [CrossRef]
- Tylus, U.; Jia, Q.; Strickland, K.; Ramaswamy, N.; Serov, A.; Atanassov, P.; Mukerjee, S. Elucidating Oxygen Reduction Active Sites in Pyrolyzed Metal–Nitrogen Coordinated Non-Precious-Metal Electrocatalyst Systems. J. Phys. Chem. C 2014, 118, 8999–9008. [Google Scholar] [CrossRef] [PubMed]
- Wang, Y.-Z.; Huang, W.-Y.; Hsieh, T.-H.; Jheng, L.-C.; Ho, K.-S.; Huang, S.-W.; Chao, L. FeNxC Based Catalysts Prepared by the Calcination of Iron-Ethylenediamine@Polyaniline as the Cathode-Catalyst of Proton Exchange Membrane Fuel Cell. Polymers 2019, 11, 1368. [Google Scholar] [CrossRef] [PubMed] [Green Version]
- Miao, Z.; Xia, Y.; Liang, J.; Xie, L.; Chen, S.; Li, S.; Wang, H.-L.; Hu, S.; Han, J.; Li, Q. Constructing Co–N–C Catalyst via a Double Crosslinking Hydrogel Strategy for Enhanced Oxygen Reduction Catalysis in Fuel Cells. Small 2021, 17, 2100735. [Google Scholar] [CrossRef]
- Chen, P.-W.; Li, K.; Yu, Y.-X.; Zhang, W.-D. Cobalt-doped graphitic carbon nitride photocatalysts with high activity for hydrogen evolution. Appl. Surf. Sci. 2017, 392, 608–615. [Google Scholar] [CrossRef]
- Venegas, R.; Recio, F.J.; Zuñiga, C.; Viera, M.; Oyarzún, M.-P.; Silva, N.; Neira, K.; Marco, J.F.; Zagal, J.H.; Tasca, F. Comparison of the catalytic activity for O2 reduction of Fe and Co MN4 adsorbed on graphite electrodes and on carbon nanotubes. Phys. Chem. Chem. Phys. 2017, 19, 20441–20450. [Google Scholar] [CrossRef]
- Zhang, G.; Huang, C.; Wang, X. Dispersing Molecular Cobalt in Graphitic Carbon Nitride Frameworks for Photocatalytic Water Oxidation. Small 2015, 11, 1215–1221. [Google Scholar] [CrossRef]
- Ge, X.; Sumboja, A.; Wuu, D.; An, T.; Li, B.; Goh, F.W.T.; Hor, T.S.A.; Zong, Y.; Liu, Z. Oxygen Reduction in Alkaline Media: From Mechanisms to Recent Advances of Catalysts. ACS Catal. 2015, 5, 4643–4667. [Google Scholar] [CrossRef]
- Li, J.; Jaouen, F. Structure and activity of metal-centered coordination sites in pyrolyzed metal–nitrogen–carbon catalysts for the electrochemical reduction of O2. Curr. Opin. Electrochem. 2018, 9, 198–206. [Google Scholar] [CrossRef]
- Li, T.; Chen, D.; Gu, L.; Chen, S.; Li, C.; Liao, J.; Zhou, Y.; Xu, Y.; Sun, C.; Yang, Z.; et al. Single-source precursor synthesis of nitrogen-doped porous carbon for high-performance electrocatalytic ORR application. Ceram. Int. 2019, 45, 8354–8361. [Google Scholar] [CrossRef]
- Asset, T.; Atanassov, P. Iron-Nitrogen-Carbon Catalysts for Proton Exchange Membrane Fuel Cells. Joule 2020, 4, 33–44. [Google Scholar] [CrossRef]
- Song, M.; Song, Y.; Sha, W.; Xu, B.; Guo, J.; Wu, Y. Recent Advances in Non-Precious Transition Metal/Nitrogen-doped Carbon for Oxygen Reduction Electrocatalysts in PEMFCs. Catalysts 2020, 10, 141. [Google Scholar] [CrossRef] [Green Version]
- Marshall-Roth, T.; Libretto, N.J.; Wrobel, A.T.; Anderton, K.J.; Pegis, M.L.; Ricke, N.D.; Voorhis, T.V.; Miller, J.T.; Surendranath, Y. A pyridinic Fe-N4 macrocycle models the active sites in Fe/N-doped carbon electrocatalysts. Nat. Commun. 2020, 11, 5283. [Google Scholar] [CrossRef] [PubMed]
- Lilloja, J.; Kibena-Põldsepp, E.; Sarapuu, A.; Kodali, M.; Chen, Y.; Asset, T.; Käärik, M.; Merisalu, M.; Paiste, P.; Aruväli, J.; et al. Cathode Catalysts Based on Cobalt- and Nitrogen-Doped Nanocarbon Composites for Anion Exchange Membrane Fuel Cells. ACS Appl. Energy Mater. 2020, 3, 5375–5384. [Google Scholar] [CrossRef]
- Chen, M.X.; Tong, L.; Liang, H.W. Understanding the Catalytic Sites of Metal-Nitrogen-Carbon Oxygen Reduction Electrocatalysts. Chem. A Eur. J. 2021, 27, 145–157. [Google Scholar] [CrossRef]
- Huang, W.Y.; Jheng, L.C.; Hsieh, T.H.; Ho, K.S.; Wang, Y.Z.; Gao, Y.J.; Tseng, P.H. Calcined Co(II)-Triethylenetetramine, Co(II)-Polyaniline-Thiourea as the Cathode Catalyst of Proton Exchanged Membrane Fuel Cell. Polymers 2020, 12, 3070. [Google Scholar] [CrossRef]
- Cheng, Y.W.; Huang, W.Y.; Ho, K.S.; Hsieh, T.H.; Jheng, L.C.; Kuo, Y.M. Fe, N-Doped Metal Organic Framework Prepared by the Calcination of Iron Chelated Polyimines as the Cathode-Catalyst of Proton Exchange Membrane Fuel Cells. Polymers 2021, 13, 3850. [Google Scholar] [CrossRef]
- Feng, J.; Cai, R.; Magliocca, E.; Luo, H.; Higgins, L.; Romario, G.L.F.; Liang, X.; Pedersen, A.; Xu, Z.; Guo, Z.; et al. Iron, Nitrogen Co-Doped Carbon Spheres as Low Cost, Scalable Electrocatalysts for the Oxygen Reduction Reaction. Adv. Funct. Mater. 2021, 31, 2102974. [Google Scholar] [CrossRef]
- Hsieh, T.H.; Chen, S.N.; Wang, Y.Z.; Ho, K.S.; Chuang, J.K.; Ho, L.C. Cobalt-Doped Carbon Nitride Frameworks Obtained from Calcined Aromatic Polyimines as Cathode Catalyst of Anion Exchange Membrane Fuel Cells. Membranes 2022, 12, 74. [Google Scholar]
- Wang, A.; Li, J.; Zhang, T. Heterogeneous single-atom catalysis. Nat. Rev. Chem. 2018, 2, 65–81. [Google Scholar]
- Zhang, L.; Ren, Y.; Liu, W.; Wang, A.; Zhang, T. Single-atom catalyst: A rising star for green synthesis of fine chemicals. Natl. Sci. Rev. 2018, 5, 653–672. [Google Scholar] [CrossRef] [Green Version]
- Cheng, N.; Zhang, L.; Doyle-Davis, K.; Sun, X. Single-Atom Catalysts: From Design to Application. Electrochem. Energy Rev. 2019, 2, 539–573. [Google Scholar] [CrossRef] [Green Version]
- Bai, L.; Hsu, C.-S.; Alexander, D.T.L.; Chen, H.M.; Hu, X. A Cobalt–Iron Double-Atom Catalyst for the Oxygen Evolution Reaction. J. Am. Chem. Soc. 2019, 141, 14190–14199. [Google Scholar] [CrossRef]
- Cui, L.; Cui, L.; Li, Z.; Zhang, J.; Wang, H.; Lu, S.; Xiang, Y. A copper single-atom catalyst towards efficient and durable oxygen reduction for fuel cells. J. Mater. Chem. A 2019, 7, 16690–16695. [Google Scholar] [CrossRef]
- Peng, X.; Omasta, T.J.; Magliocca, E.; Wang, L.G.; Varcoe, J.R.; Mustain, W.E. Nitrogen-doped Carbon–CoOx Nanohybrids: A Precious Metal Free Cathode that Exceeds 1.0 W cm−2 Peak Power and 100 h Life in Anion-Exchange Membrane Fuel Cells. Angew. Chem. 2019, 58, 1046–1051. [Google Scholar] [CrossRef] [PubMed] [Green Version]
- Yang, H.; Li, Z.; Kou, S.; Lu, G.; Liu, Z. A complex-sequestered strategy to fabricate Fe single-atom catalyst for efficient oxygen reduction in a broad pH-range. Appl. Catal. B Environ. 2020, 278, 119270. [Google Scholar] [CrossRef]
- Kaiser, S.K.; Chen, Z.; Faust Akl, D.; Mitchell, S.; Perez-Ramirez, J. Single-Atom Catalysts across the Periodic Table. Chem. Rev. 2020, 120, 11703–11809. [Google Scholar] [CrossRef]
- Han, J.; Bian, J.; Sun, C. Recent Advances in Single-Atom Electrocatalysts for Oxygen Reduction Reaction. Research 2020, 2020, 9512763. [Google Scholar] [CrossRef]
- Zhong, L.; Li, S. Unconventional Oxygen Reduction Reaction Mechanism and Scaling Relation on Single-Atom Catalysts. ACS Catal. 2020, 10, 4313–4318. [Google Scholar] [CrossRef]
- Zhao, C.X.; Li, B.Q.; Liu, J.N.; Zhang, Q. Intrinsic Electrocatalytic Activity Regulation of M–N–C Single-Atom Catalysts for the Oxygen Reduction Reaction. Angew. Chem. Int. Ed. 2021, 60, 4448–4463. [Google Scholar] [CrossRef]
- Freitas, W.d.S.; D’Epifanio, A.; Ficca, V.C.A.; Placidi, E.; Arciprete, F.; Mecheri, B. Tailoring active sites of iron-nitrogen-carbon catalysts for oxygen reduction in alkaline environment: Effect of nitrogen-based organic precursor and pyrolysis atmosphere. Electrochim. Acta 2021, 391, 138899. [Google Scholar] [CrossRef]
- Guo, J.; Li, B.; Zhang, Q.; Liu, Q.; Wang, Z.; Zhao, Y.; Shui, J.; Xiang, Z. Highly Accessible Atomically Dispersed Fe-N x Sites Electrocatalyst for Proton-Exchange Membrane Fuel Cell. Adv. Sci. 2021, 8, 2002249. [Google Scholar] [CrossRef] [PubMed]
- Deng, Y.; Luo, J.; Chi, B.; Tang, H.; Li, J.; Qiao, X.; Shen, Y.; Yang, Y.; Jia, C.; Rao, P.; et al. Advanced Atomically Dispersed Metal–Nitrogen–Carbon Catalysts Toward Cathodic Oxygen Reduction in PEM Fuel Cells. Adv. Energy Mater. 2021, 11, 2101222. [Google Scholar] [CrossRef]
- Zhang, A.; Zhou, M.; Liu, S.; Chai, M.; Jiang, S. Synthesis of Single-Atom Catalysts Through Top-Down Atomization Approaches. Front. Catal. 2021, 1, 11. [Google Scholar] [CrossRef]
- Liang, X.; Li, Z.; Xiao, H.; Zhang, T.; Xu, P.; Zhang, H.; Gao, Q.; Zheng, L. Two Types of Single-Atom FeN4 and FeN5 Electrocatalytic Active Centers on N-Doped Carbon Driving High Performance of the SA-Fe-NC Oxygen Reduction Reaction Catalyst. Chem. Mater. 2021, 33, 5542–5554. [Google Scholar] [CrossRef]
- Kisand, K.; Sarapuu, A.; Danilian, D.; Kikas, A.; Kisand, V.; Rähn, M.; Treshchalov, A.; Käärik, M.; Merisalu, M.; Paiste, P.; et al. Transition metal-containing nitrogen-doped nanocarbon catalysts derived from 5-methylresorcinol for anion exchange membrane fuel cell application. J. Colloid Interface Sci. 2021, 584, 263–274. [Google Scholar] [CrossRef]
- Zhang, J.; Pei, Y.; Zhu, W.; Liu, Y.; Yin, Y.; Qin, Y.; Guiver, M.D. Ionomer dispersion solvent influence on the microstructure of Co–N–C catalyst layers for anion exchange membrane fuel cell. J. Power Sources 2021, 484, 229259. [Google Scholar] [CrossRef]
- Adabi, H.; Santori, P.G.; Shakouri, A.; Peng, X.; Yassin, K.; Rasin, I.G.; Brandon, S.; Dekel, D.R.; Hassan, N.U.; Sougrati, M.-T.; et al. Understanding how single-atom site density drives the performance and durability of PGM-free Fe–N–C cathodes in anion exchange membrane fuel cells. Mater. Today Adv. 2021, 12, 100179. [Google Scholar] [CrossRef]
- Maldonado, S.; Stevenson, K.J. Influence of nitrogen doping on oxygen reduction electrocatalysis at carbon nanofiber electrodes. J. Phys. Chem. B 2005, 109, 4707–4716. [Google Scholar] [CrossRef]
- Lai, L.; Potts, J.R.; Zhan, D.; Wang, L.; Poh, C.K.; Tang, C.; Gong, H.; Shen, Z.; Lin, J.; Ruoff, R.S. Exploration of the active center structure of nitrogen-doped graphene-based catalysts for oxygen reduction reaction. Energy Environ. Sci. 2012, 5, 7936–7942. [Google Scholar] [CrossRef]
- Lin, Z.; Song, M.K.; Ding, Y.; Liu, Y.; Liu, M.; Wong, C.P. Three-dimensional nitrogen-doped carbon nanotubes/graphene structure used as a metal-free electrocatalyst for the oxygen reduction reaction. Phys. Chem. Chem. Phys. 2012, 14, 3381–3387. [Google Scholar] [CrossRef]
- Zhao, Y.; Watanabe, K.; Hashimoto, K. Self-supporting oxygen reduction electrocatalysts made from a nitrogen-rich network polymer. J. Am. Chem. Soc. 2012, 134, 19528–19531. [Google Scholar] [CrossRef] [PubMed]
- Kramm, U.I.; Dodelet, J.P. Structure of the catalytic sites in Fe/N/C-catalysts for O2-reduction in PEM fuel cells. Phys. Chem. Chem. Phys. 2012, 14, 11673–11688. [Google Scholar] [CrossRef] [PubMed]
- Olson, T.S.; Pylypenko, S.; Fulghum, J.E.; Atanassov, P. Bifunctional Oxygen Reduction Reaction Mechanism on Non-Platinum Catalysts Derived from Pyrolyzed Porphyrins. J. Electrochem. Soc. 2010, 157, B54. [Google Scholar] [CrossRef]
- Pariiska, O.; Mazur, D.; Cherchenko, K.; Kurys, Y.; Koshechko, V.; Pokhodenko, V. Efficient Co-N-C electrocatalysts for oxygen reduction derived from deep eutectic solvents. Electrochim. Acta 2022, 413, 140132. [Google Scholar] [CrossRef]
- Sgarbi, R.; Kumar, K.; Jaouen, F.; Zitolo, A.; Ticianelli, E.A.; Maillard, F. Oxygen reduction reaction mechanism and kinetics on M-NxCy and M@N-C active sites present in model M-N-C catalysts under alkaline and acidic conditions. J. Solid State Electrochem. 2019, 25, 45–56. [Google Scholar] [CrossRef]
- Gollasch, M.; Müller-Hülstede, J.; Schmies, H.; Schonvogel, D.; Wagner, P.; Dyck, A.; Wark, M. Elucidating Synergistic Effects of Different Metal Ratios in Bimetallic Fe/Co-N-C Catalysts for Oxygen Reduction Reaction. Catalysts 2021, 11, 841. [Google Scholar] [CrossRef]
- Yang, L.; Cheng, D.; Xu, H.; Zeng, X.; Wan, X.; Shui, J.; Xiang, Z.; Cao, D. Unveiling the high-activity origin of single-atom iron catalysts for oxygen reduction reaction. Proc. Natl. Acad. Sci. USA 2018, 115, 6626–6631. [Google Scholar] [CrossRef] [Green Version]
- Zhang, J.; Zhu, W.; Pei, Y.; Liu, Y.; Qin, Y.; Zhang, X.; Wang, Q.; Yin, Y.; Guiver, M.D. Hierarchically Porous Co–N–C Cathode Catalyst Layers for Anion Exchange Membrane Fuel Cells. ChemSusChem 2019, 12, 4165–4169. [Google Scholar] [CrossRef]
- Putri, Y.M.T.A.; Jiwanti, P.K.; Irkham; Gunlazuardi, J.; Einaga, Y.; Ivandini, T.A. Nickel–Cobalt Modified Boron-Doped Diamond as an Electrode for a Urea/H2O2 Fuel Cell. Bull. Chem. Soc. Jpn. 2021, 94, 2922–2928. [Google Scholar] [CrossRef]
- Hu, Z.; Xiao, Q.; Xiao, D.; Wang, Z.; Gui, F.; Lei, Y.; Ni, J.; Yang, D.; Zhang, C.; Ming, P. Synthesis of Anti-poisoning Spinel Mn–Co–C as Cathode Catalysts for Low-Temperature Anion Exchange Membrane Direct Ammonia Fuel Cells. ACS Appl. Mater. Interfaces 2021, 13, 53945–53954. [Google Scholar] [CrossRef] [PubMed]
- Kruusenberg, I.; Ramani, D.; Ratso, S.; Joost, U.; Saar, R.; Rauwel, P.; Kannan, A.M.; Tammeveski, K. Cobalt-Nitrogen Co-doped Carbon Nanotube Cathode Catalyst for Alkaline Membrane Fuel Cells. ChemElectroChem 2016, 3, 1455–1465. [Google Scholar] [CrossRef]


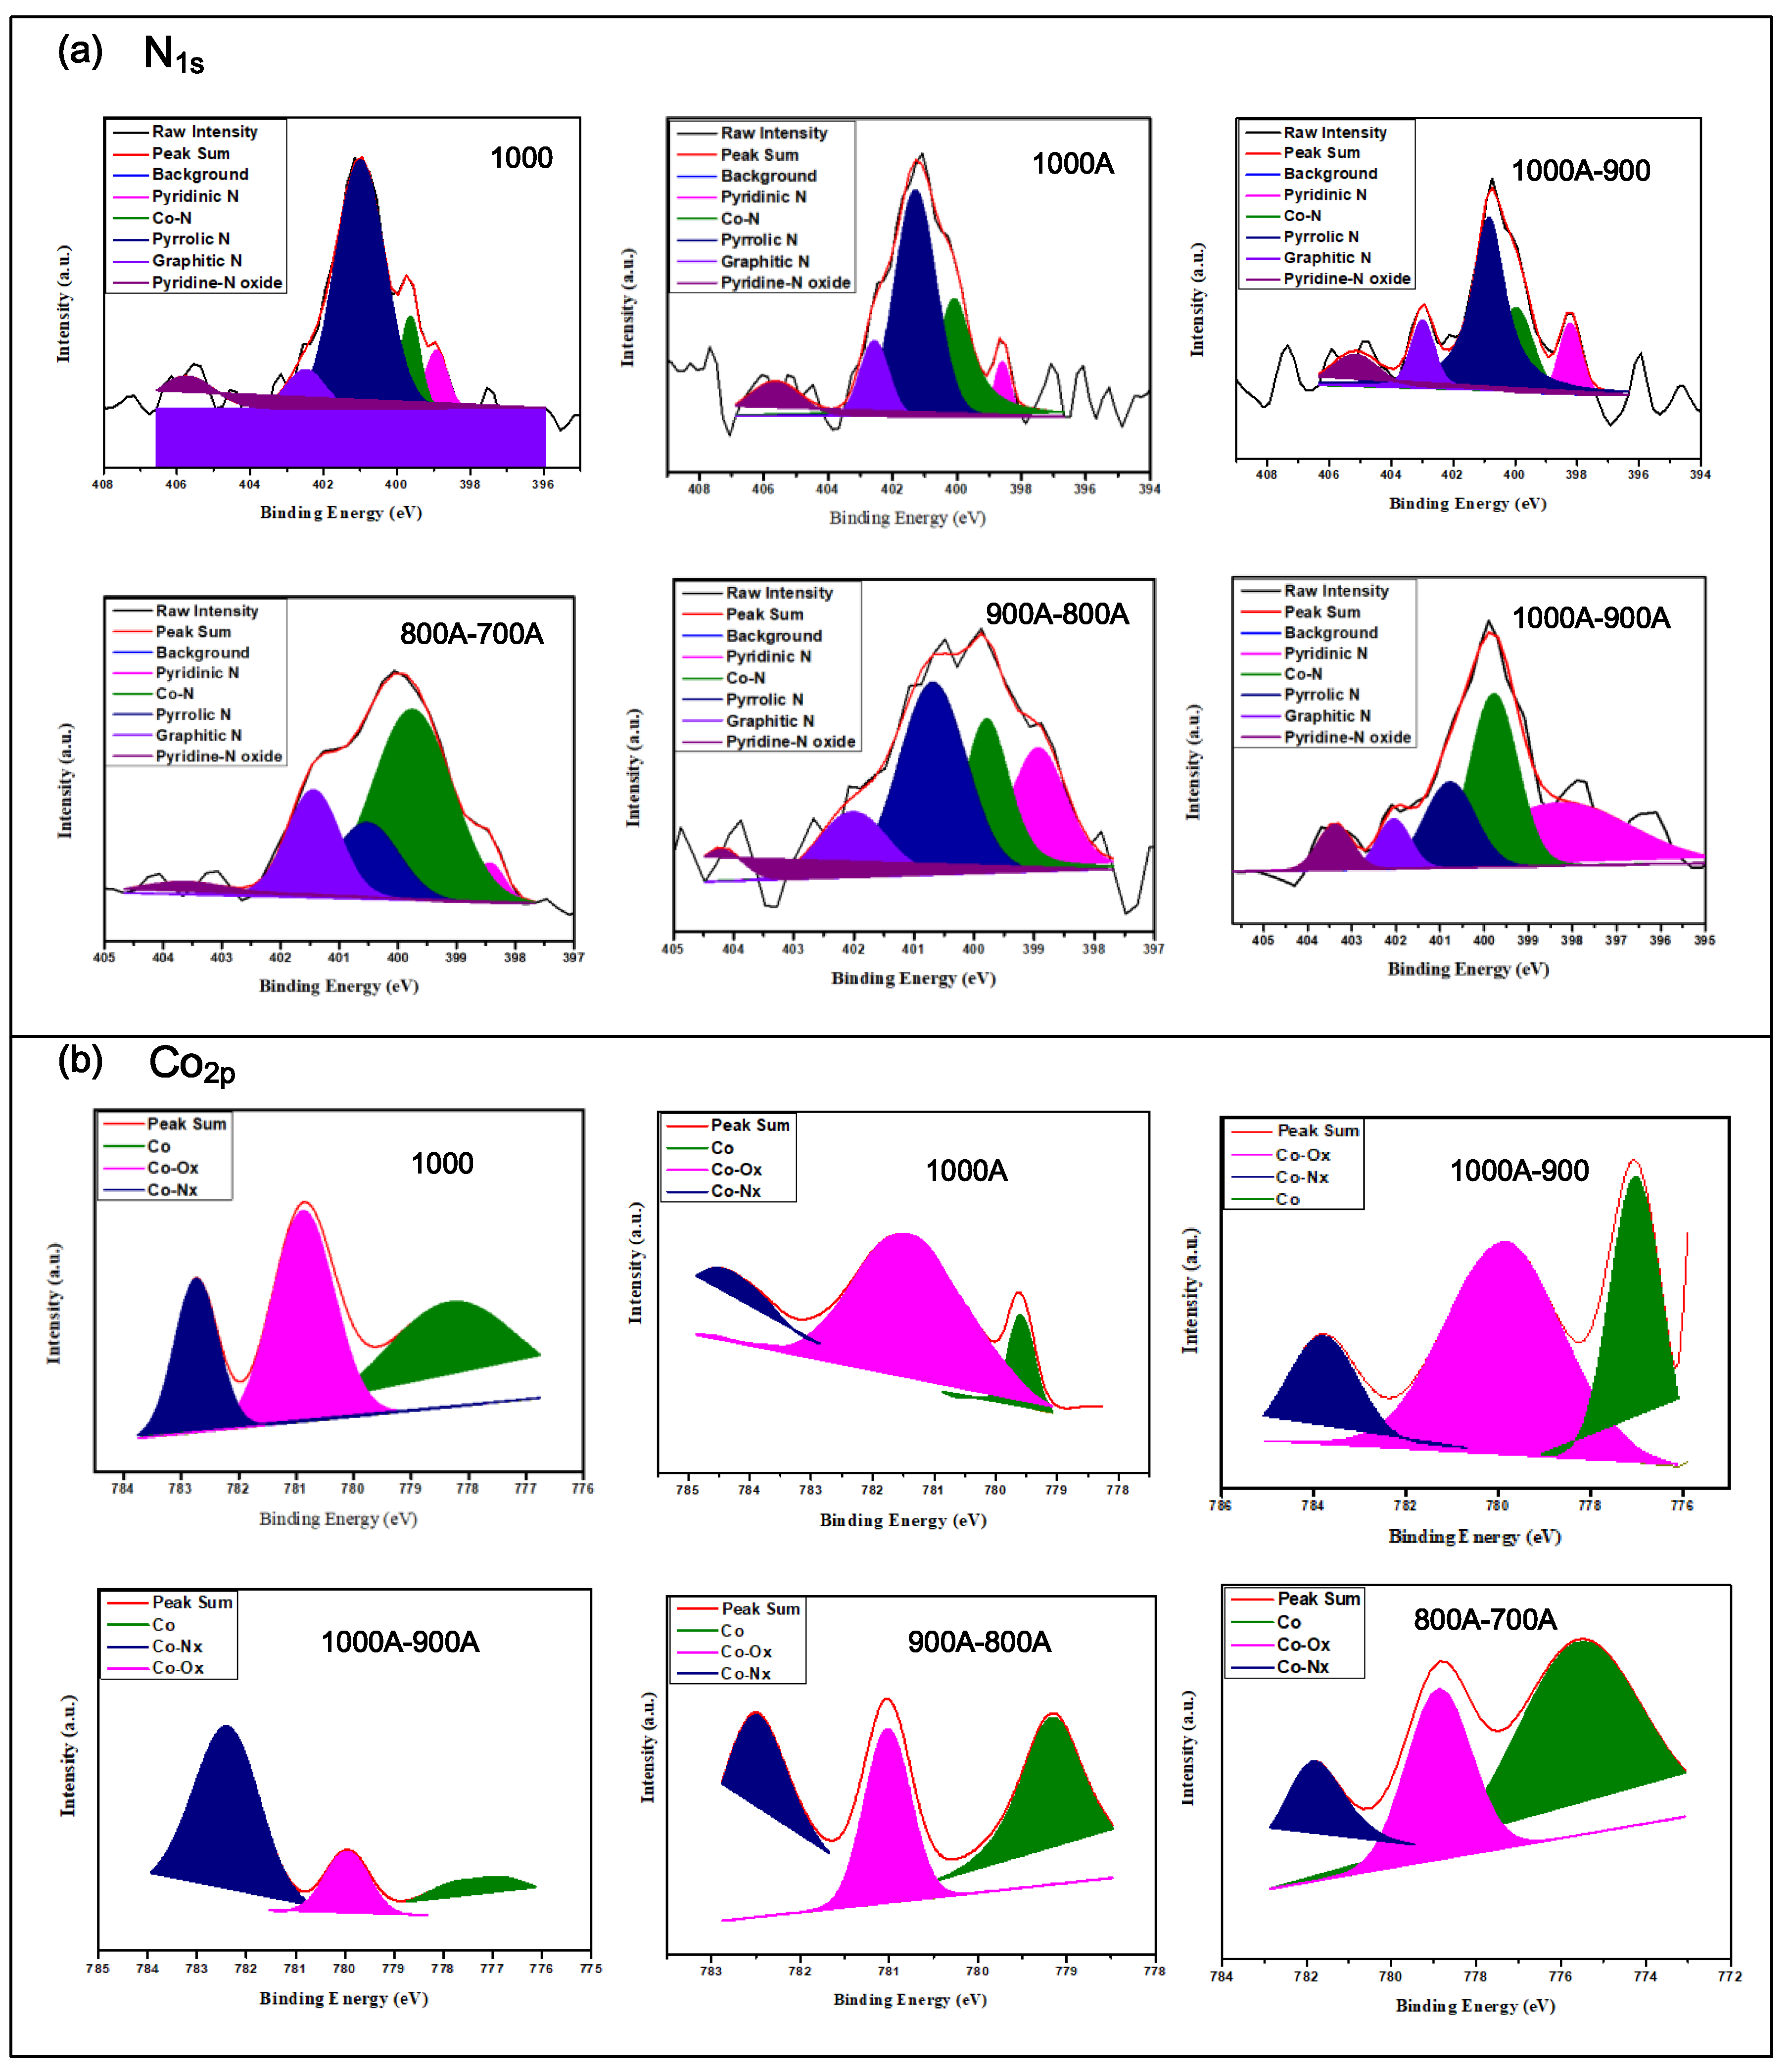
| CoNC-Catalyst | N1s (at%) | ||||
|---|---|---|---|---|---|
| Pyridinic N | Co-N | Pyrrolic N | Graphitic N | Pyridine-N oxide | |
| 1000 | 6.6% | 9.7% | 66.2% | 7.8% | 9.7% |
| 1000A | 4.2% | 30.2% | 46.9% | 10.4% | 8.3% |
| 1000A-900 | 9.76% | 18.05% | 52.7% | 10.71% | 8.78% |
| 1000A-900A | 35.97% | 33.82% | 17.48% | 6.51% | 6.22% |
| 900A-800A | 22.15 | 24.62 | 36.80 | 12.46 | 3.97 |
| 800A-700A | 1.31 | 16.60 | 75.09 | 5.94 | 1.06 |
| Co-N-C-Catalyst | ID/IG a | BET Surface Area (m2 g−1) | Pore Diameter b |
|---|---|---|---|
| 1000 | 1.07 | 253.25 | 4.53 |
| 1000A | 1.08 | 290.73 | 4.58 |
| 1000A-900 | - | 646.85 | 4.28 |
| 1000A-900A | 1.12 | 680.94 | 4.82 |
| 900A-800A | 1.14 | 461.47 | 5.74 |
| 800A-700A | 1.08 | 547.39 | 3.46 |
| CoNC-Catalyst | Onset Potential (V) a | Half-Wave Voltage (V) a | Tafel Slope (mVdec−1) b | # of Exchange Electrons c | Pmax (mWcm−2) d |
|---|---|---|---|---|---|
| 1000 | 1.37 | 0.76 | 89 | 3.38 | 200 |
| 1000A | 1.28 | 0.92 | 77 | 2.75 | 150 |
| 1000A-900 | 1.26 | 0.70 | 74 | 3.49 | 270 |
| 1000A-900A | 1.28 | 0.78 | 61 | 3.79 | 275 |
| 900A-800A | 1.25 | 0.74 | 66 | 3.13 | 250 |
| 800A-700A | 1.19 | 0.74 | 77 | 2.48 | 66 |
Publisher’s Note: MDPI stays neutral with regard to jurisdictional claims in published maps and institutional affiliations. |
© 2022 by the authors. Licensee MDPI, Basel, Switzerland. This article is an open access article distributed under the terms and conditions of the Creative Commons Attribution (CC BY) license (https://creativecommons.org/licenses/by/4.0/).
Share and Cite
Cheng, Y.-W.; Hsieh, T.-H.; Huang, Y.-C.; Tseng, P.-H.; Wang, Y.-Z.; Ho, K.-S.; Huang, Y.-J. Calcined Co(II)-Chelated Polyazomethine as Cathode Catalyst of Anion Exchange Membrane Fuel Cells. Polymers 2022, 14, 1784. https://0-doi-org.brum.beds.ac.uk/10.3390/polym14091784
Cheng Y-W, Hsieh T-H, Huang Y-C, Tseng P-H, Wang Y-Z, Ho K-S, Huang Y-J. Calcined Co(II)-Chelated Polyazomethine as Cathode Catalyst of Anion Exchange Membrane Fuel Cells. Polymers. 2022; 14(9):1784. https://0-doi-org.brum.beds.ac.uk/10.3390/polym14091784
Chicago/Turabian StyleCheng, Yu-Wei, Tar-Hwa Hsieh, Yu-Chang Huang, Po-Hao Tseng, Yen-Zen Wang, Ko-Shan Ho, and Yue-Jie Huang. 2022. "Calcined Co(II)-Chelated Polyazomethine as Cathode Catalyst of Anion Exchange Membrane Fuel Cells" Polymers 14, no. 9: 1784. https://0-doi-org.brum.beds.ac.uk/10.3390/polym14091784