
Structural Behavior of RC Beams Containing Unreinforced Drilled Openings with and without CFRP Strengthening

 , ,
, , 
 and
and
Abstract
:
1. Introduction
2. Experimental Study
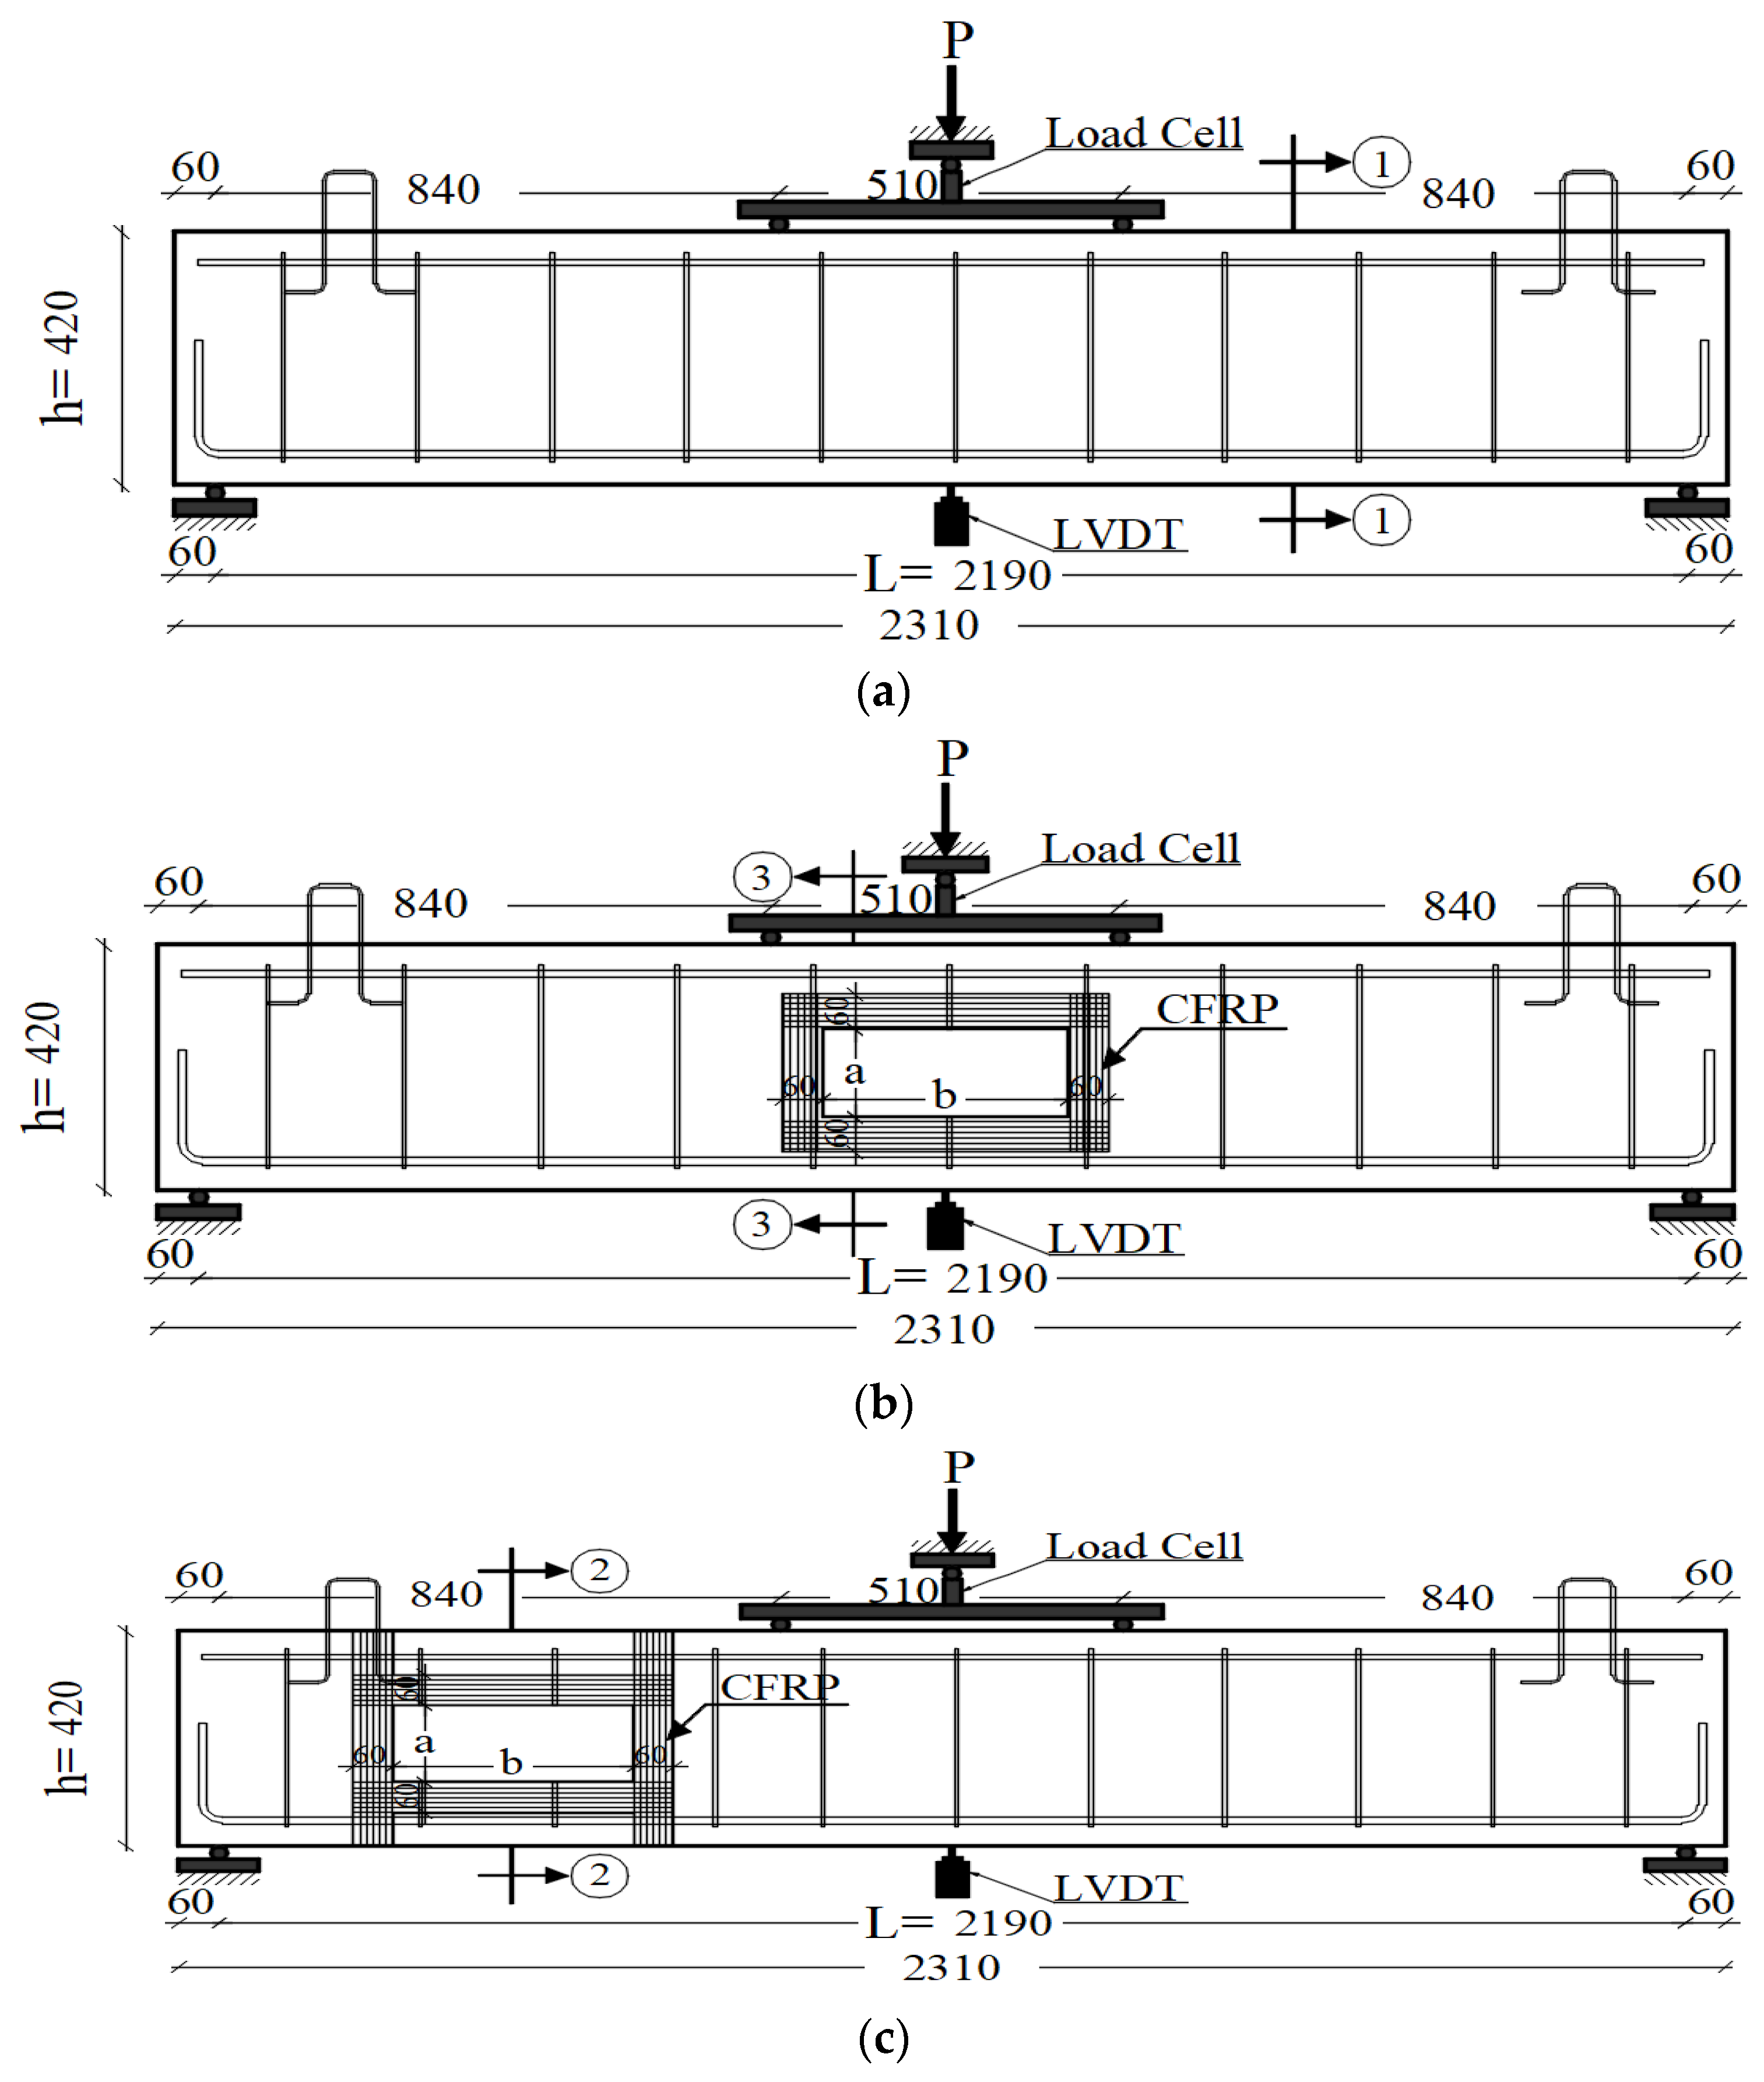
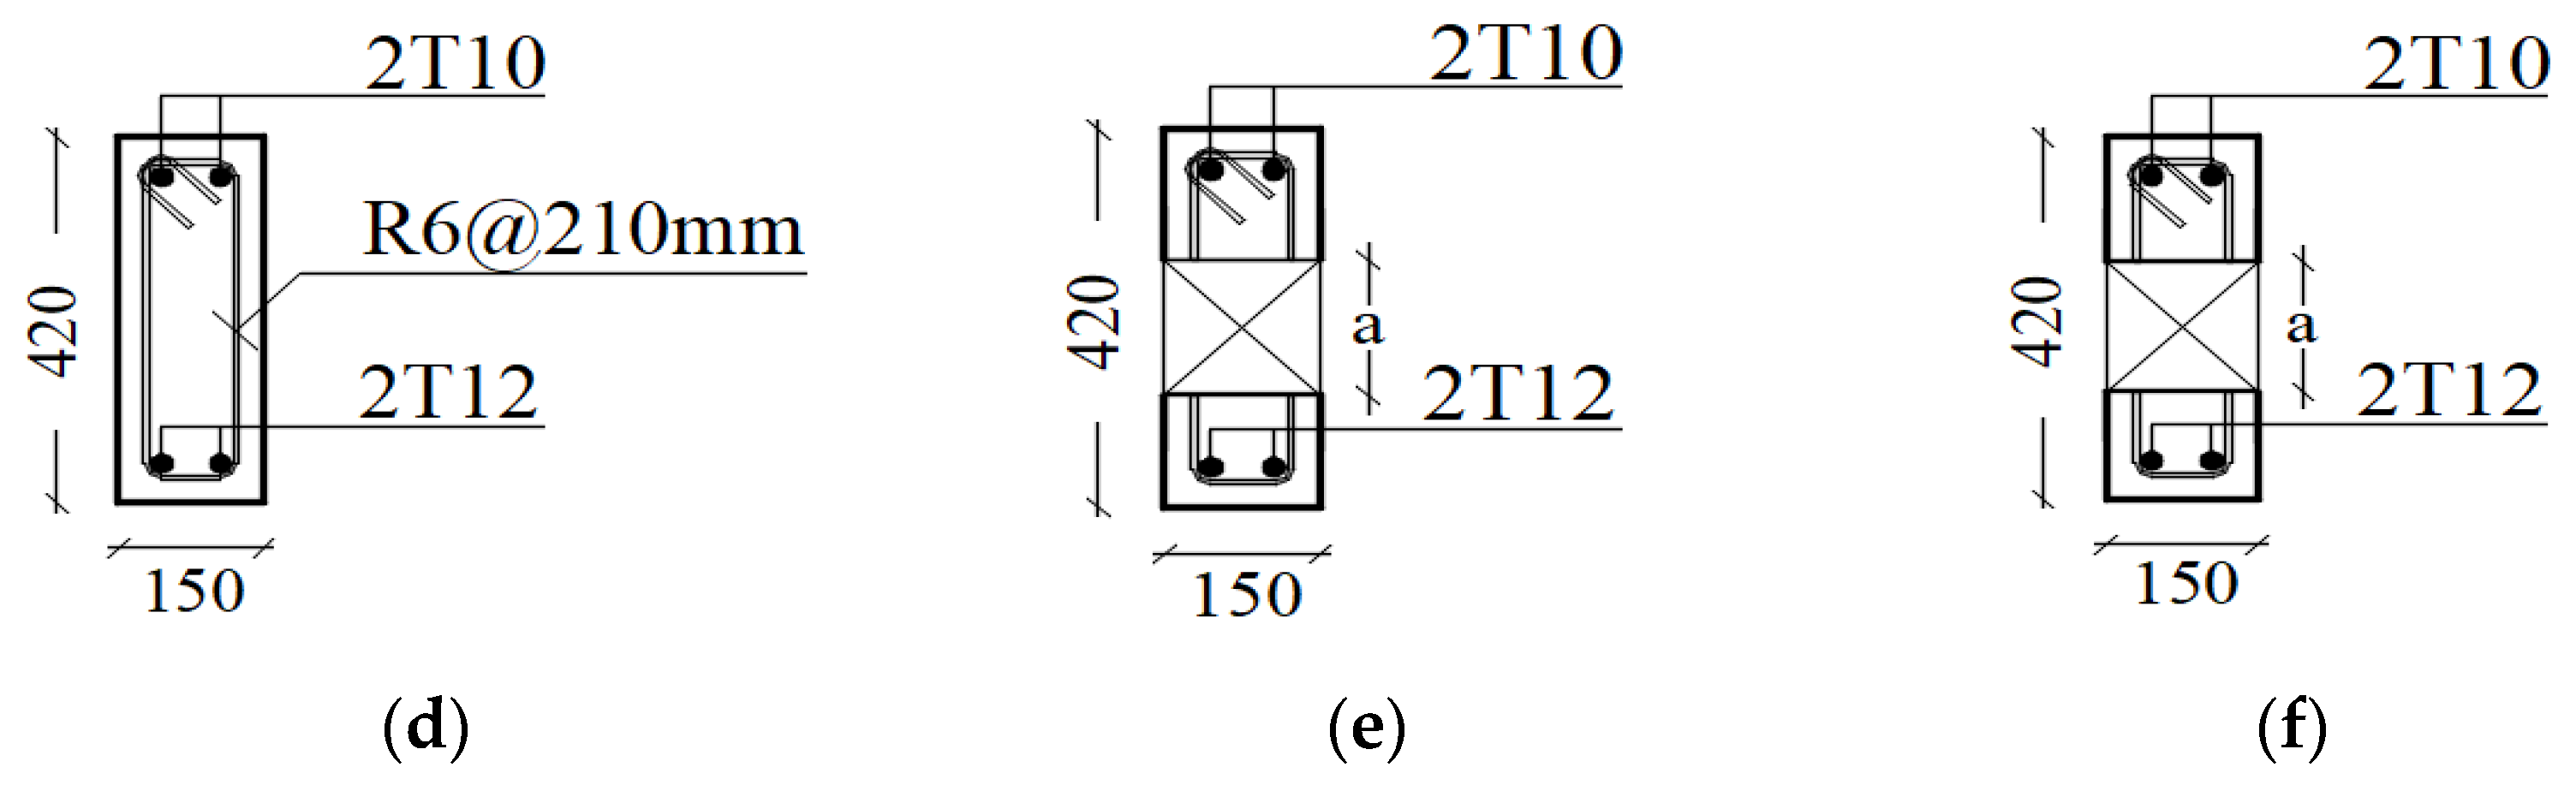
2.1. Experimental Program
2.2. Material Properties
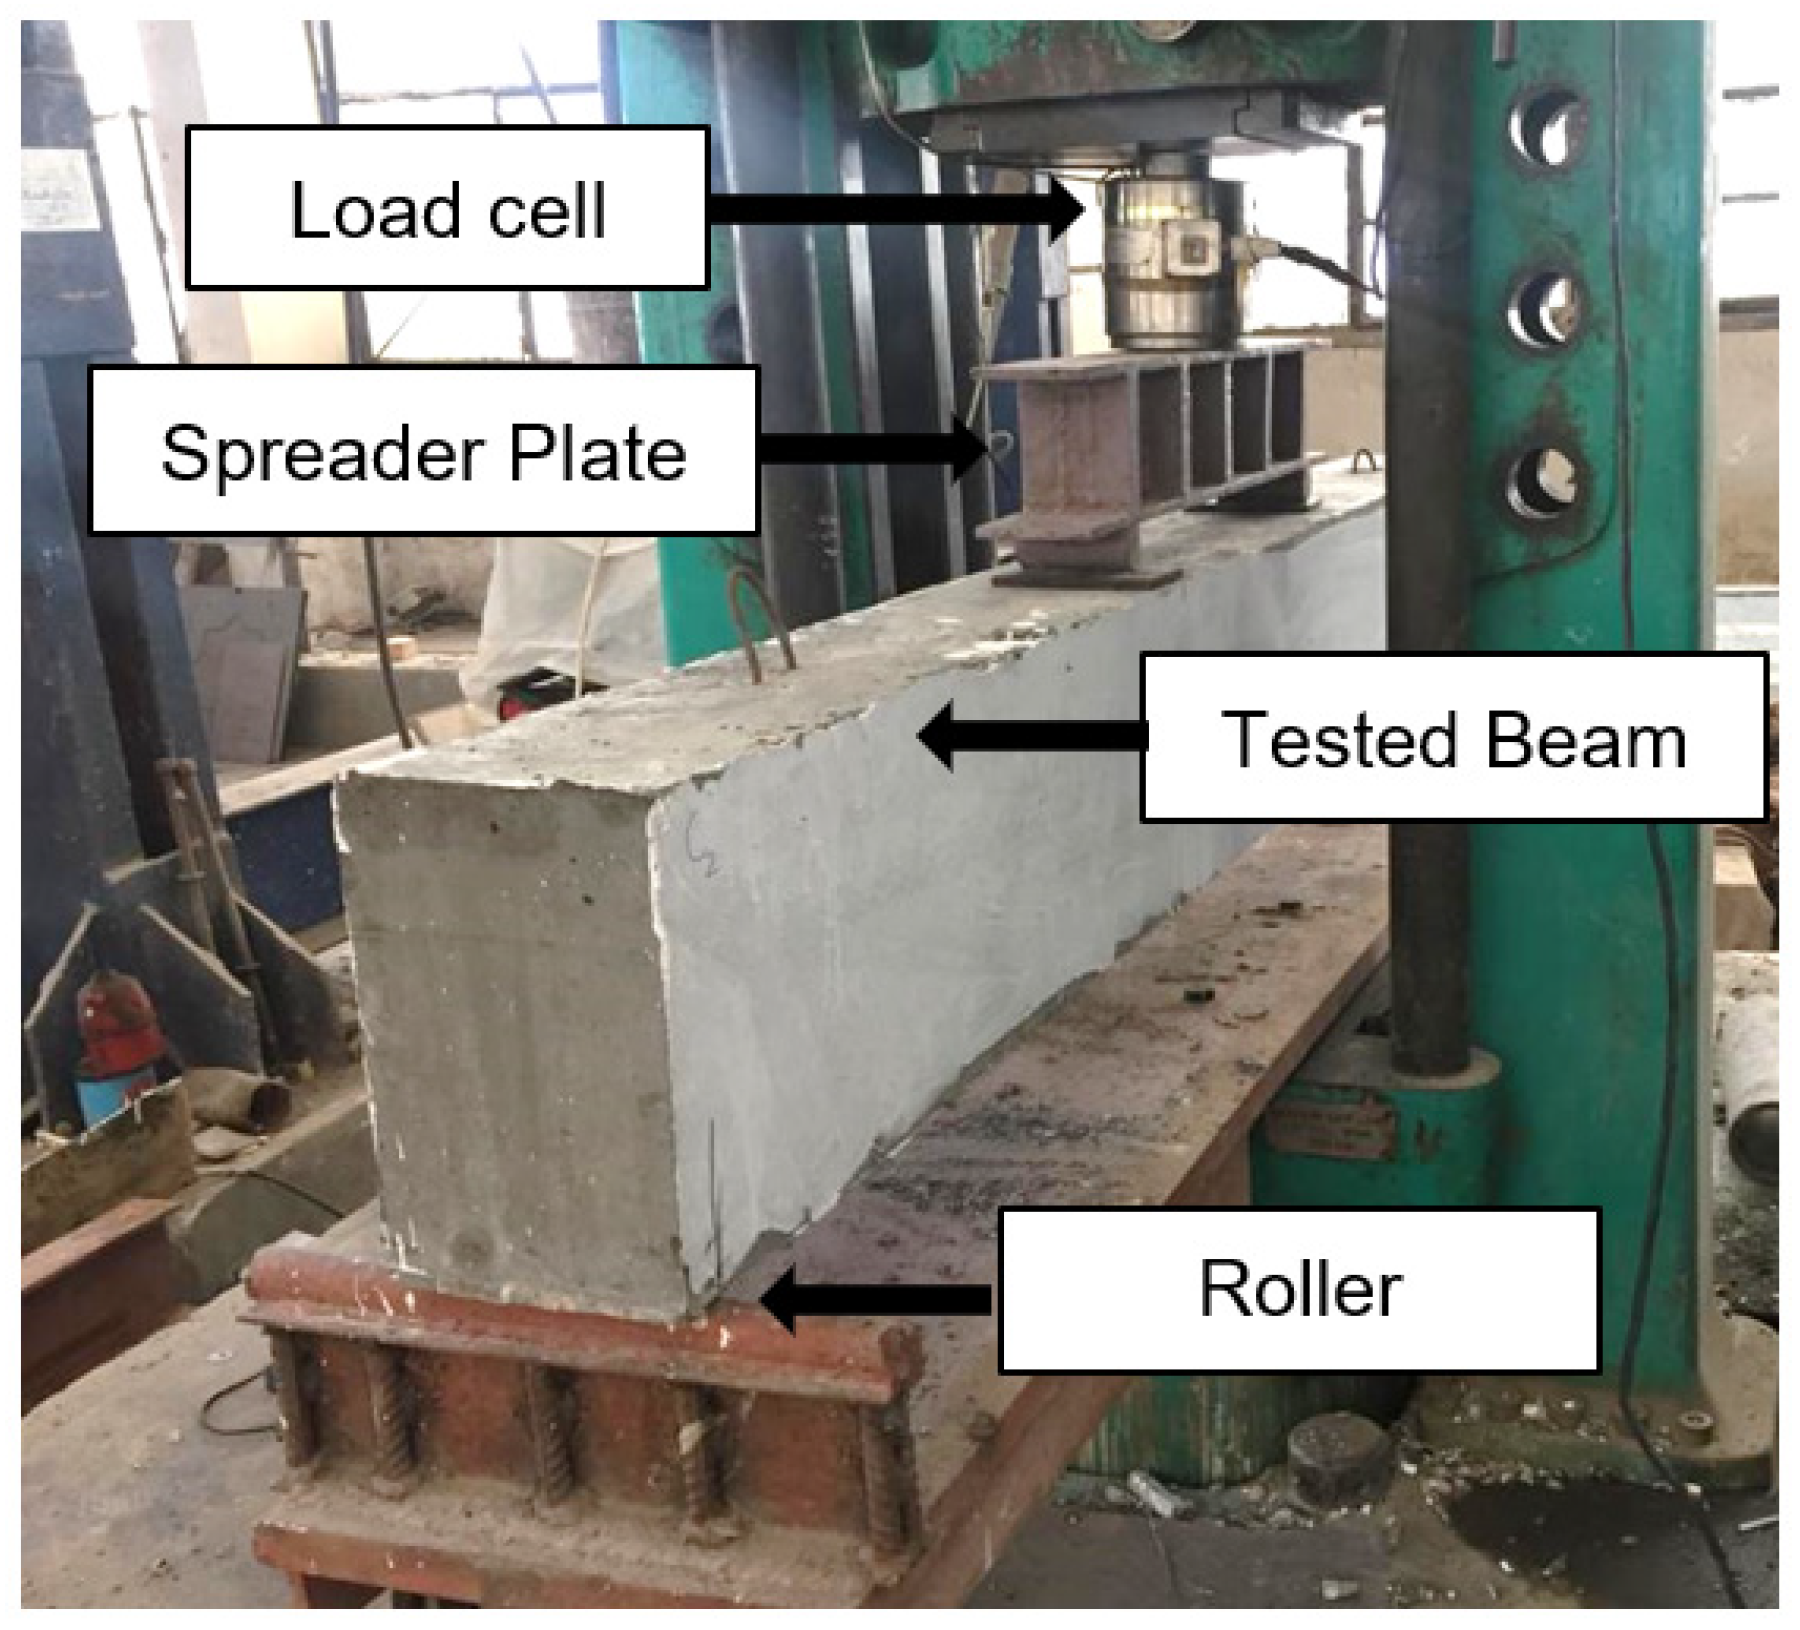
2.3. Test Procedure
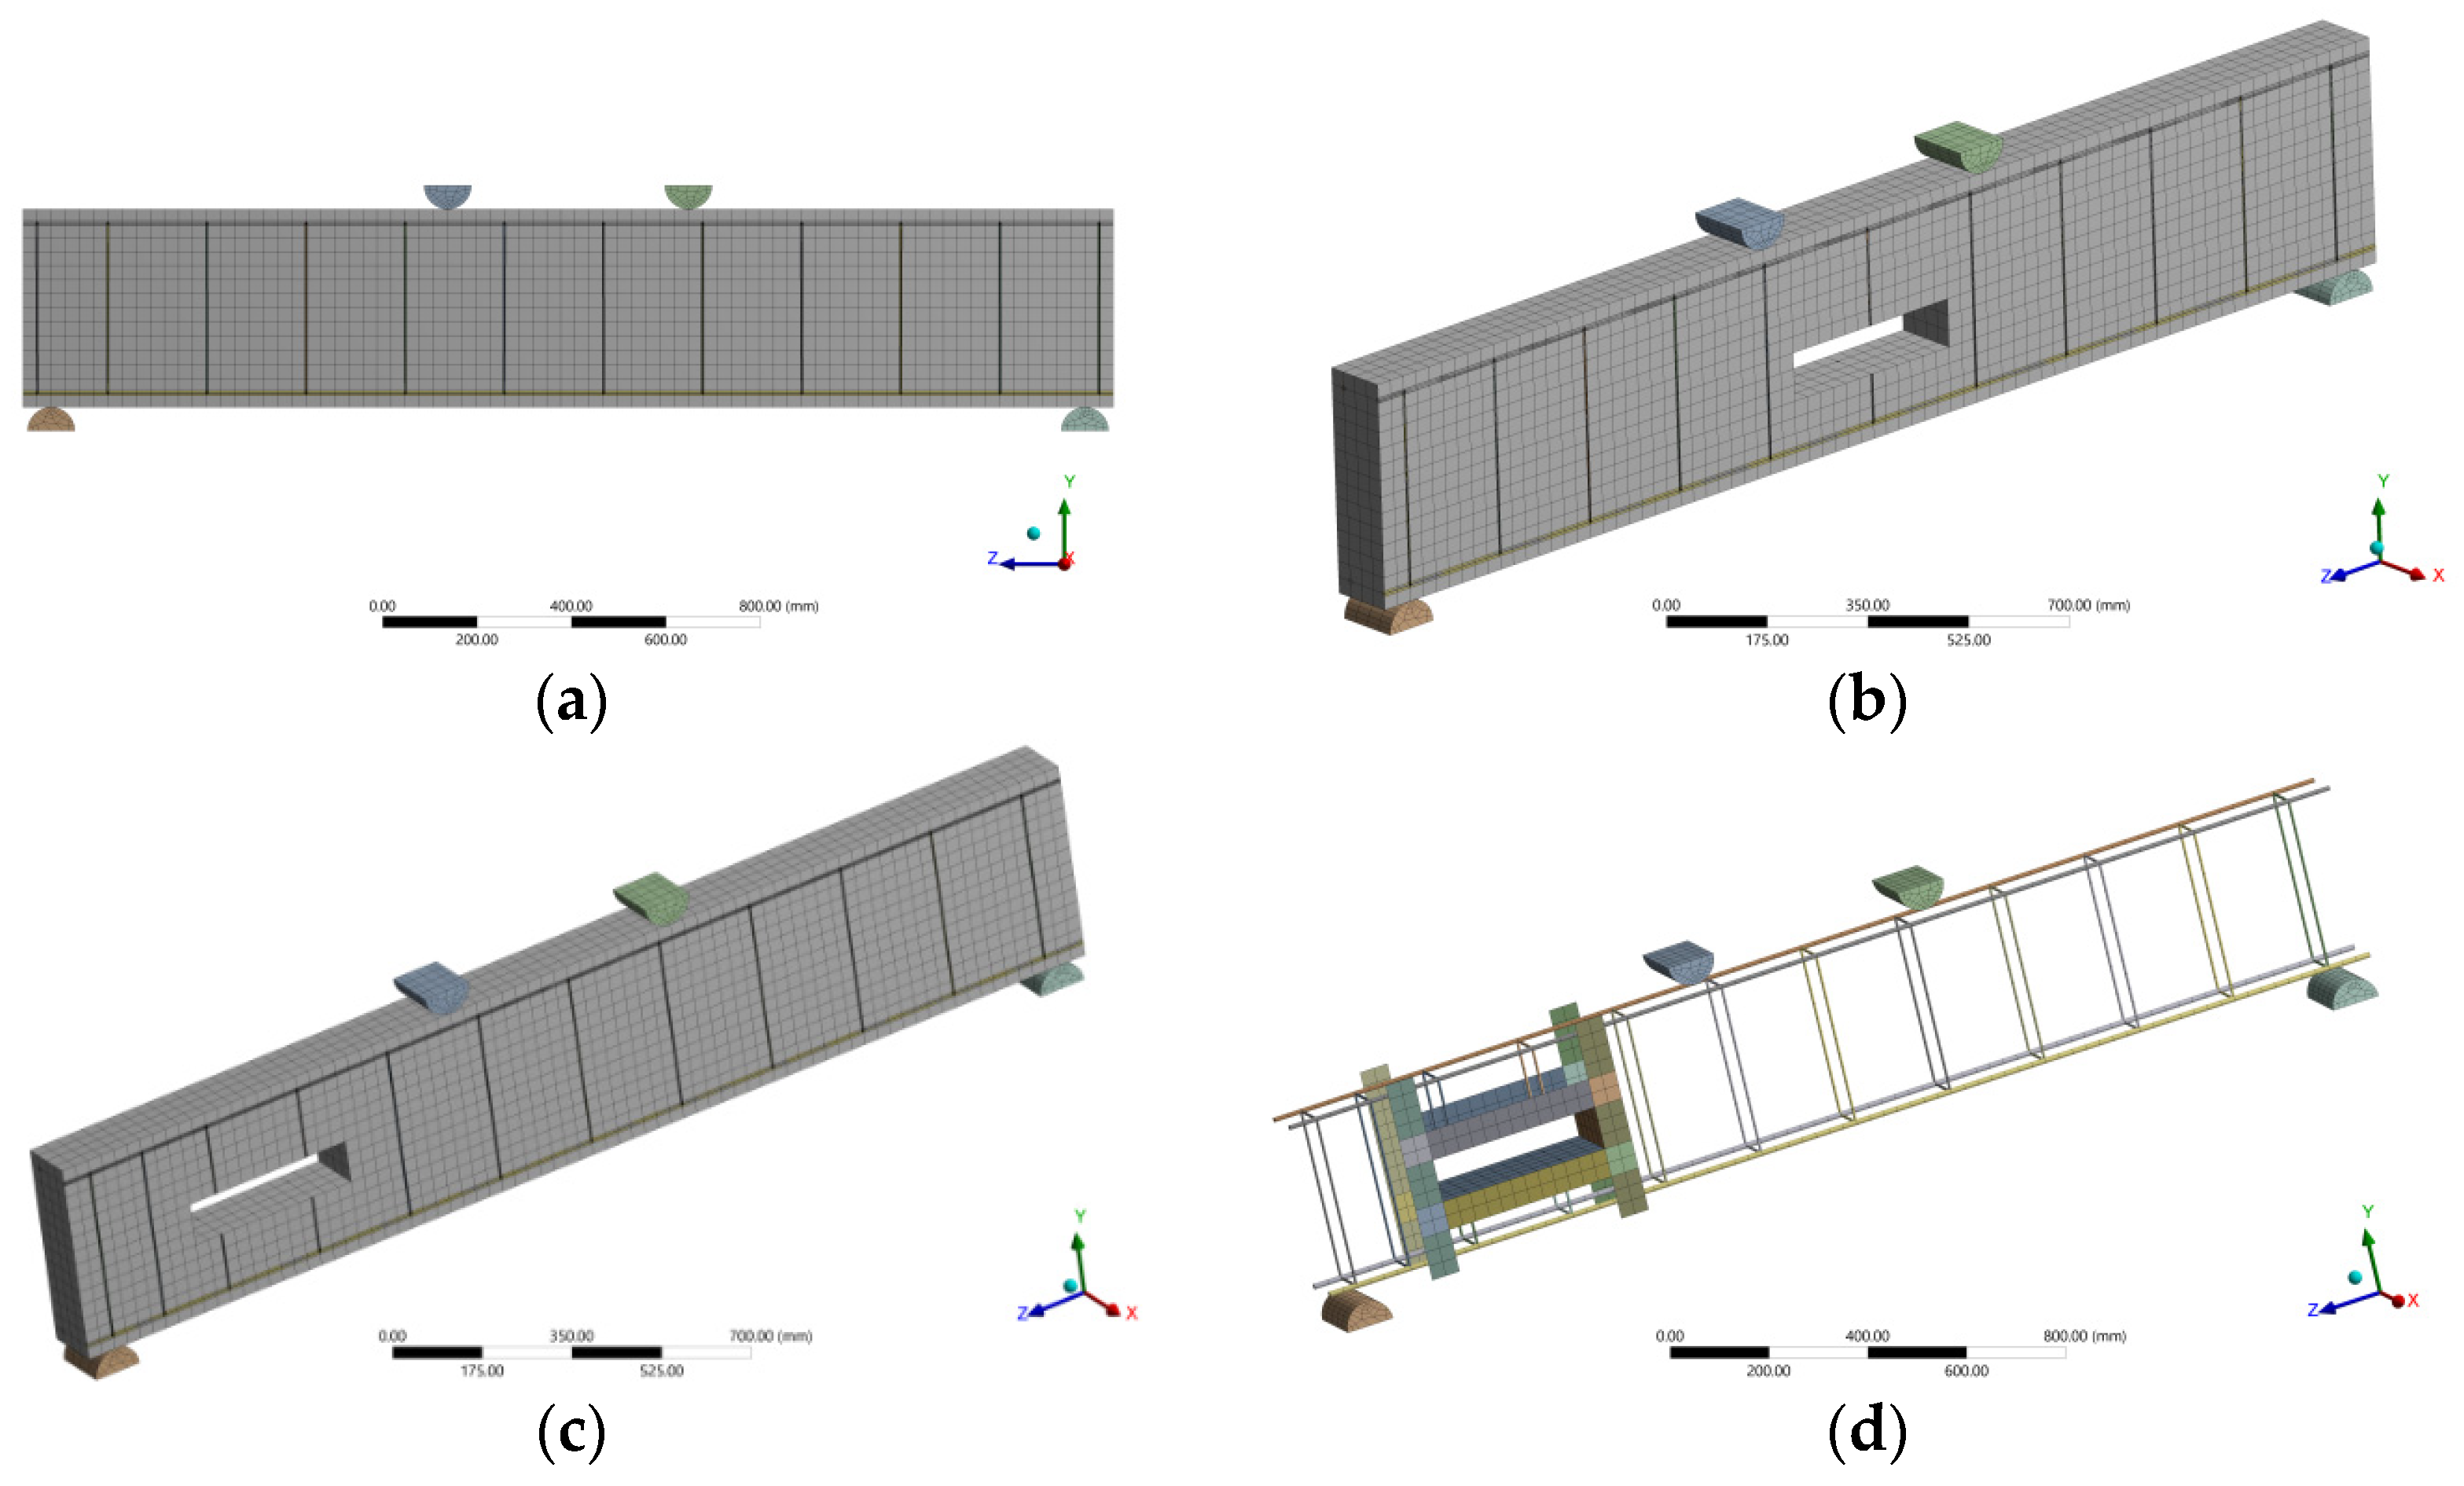
3. Numerical Study
4. Experimental Results
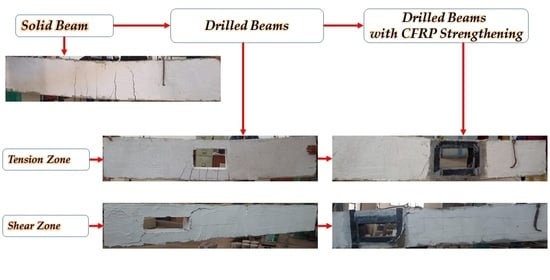
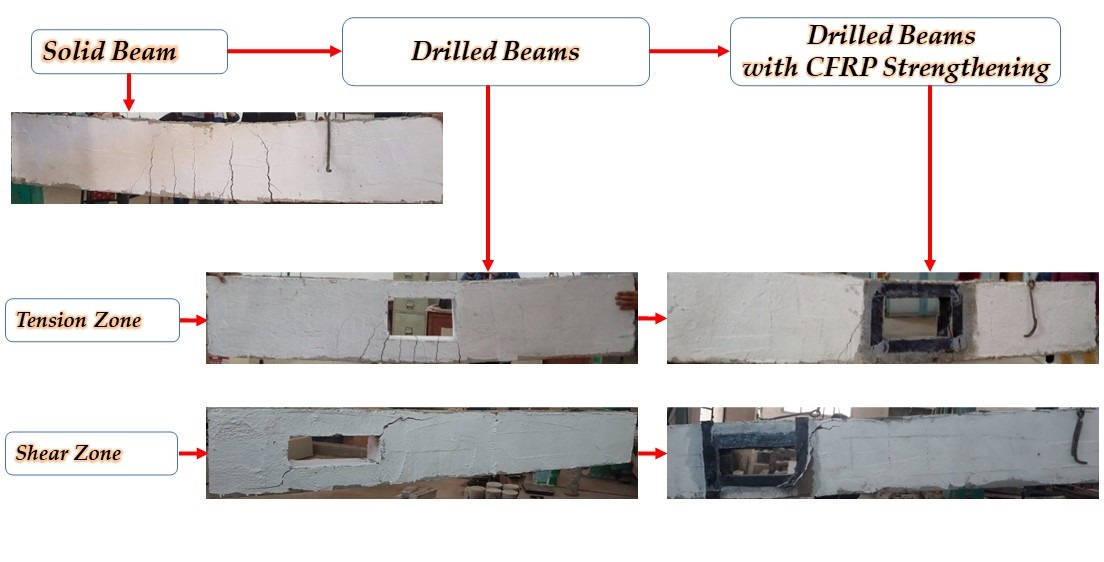
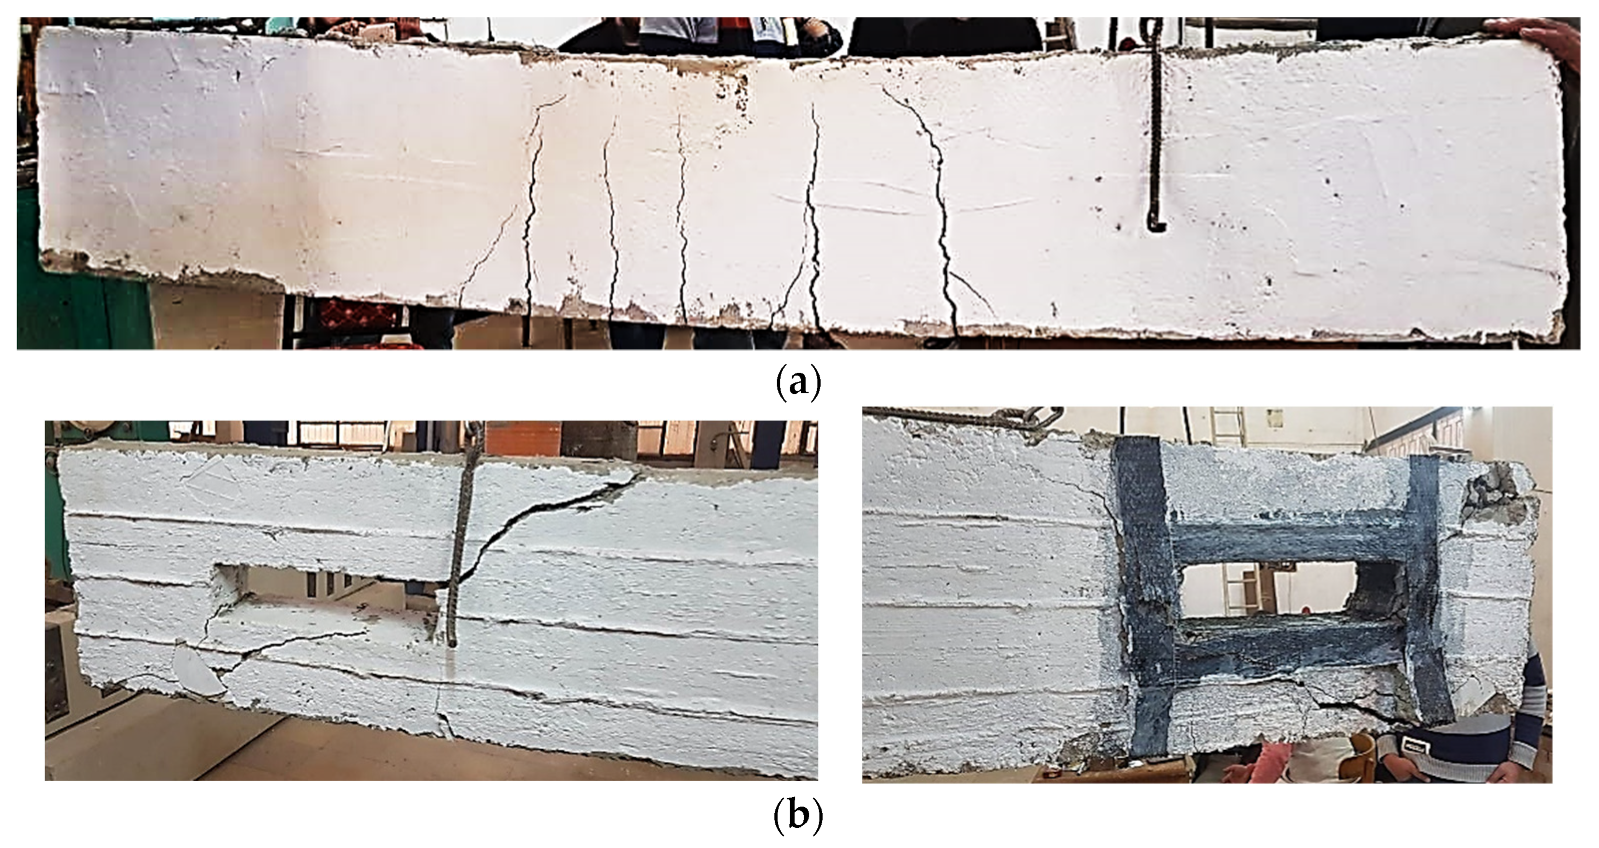
4.1. Control Beam
4.2. The Behavior of Drilled Beams in Tension-Zone
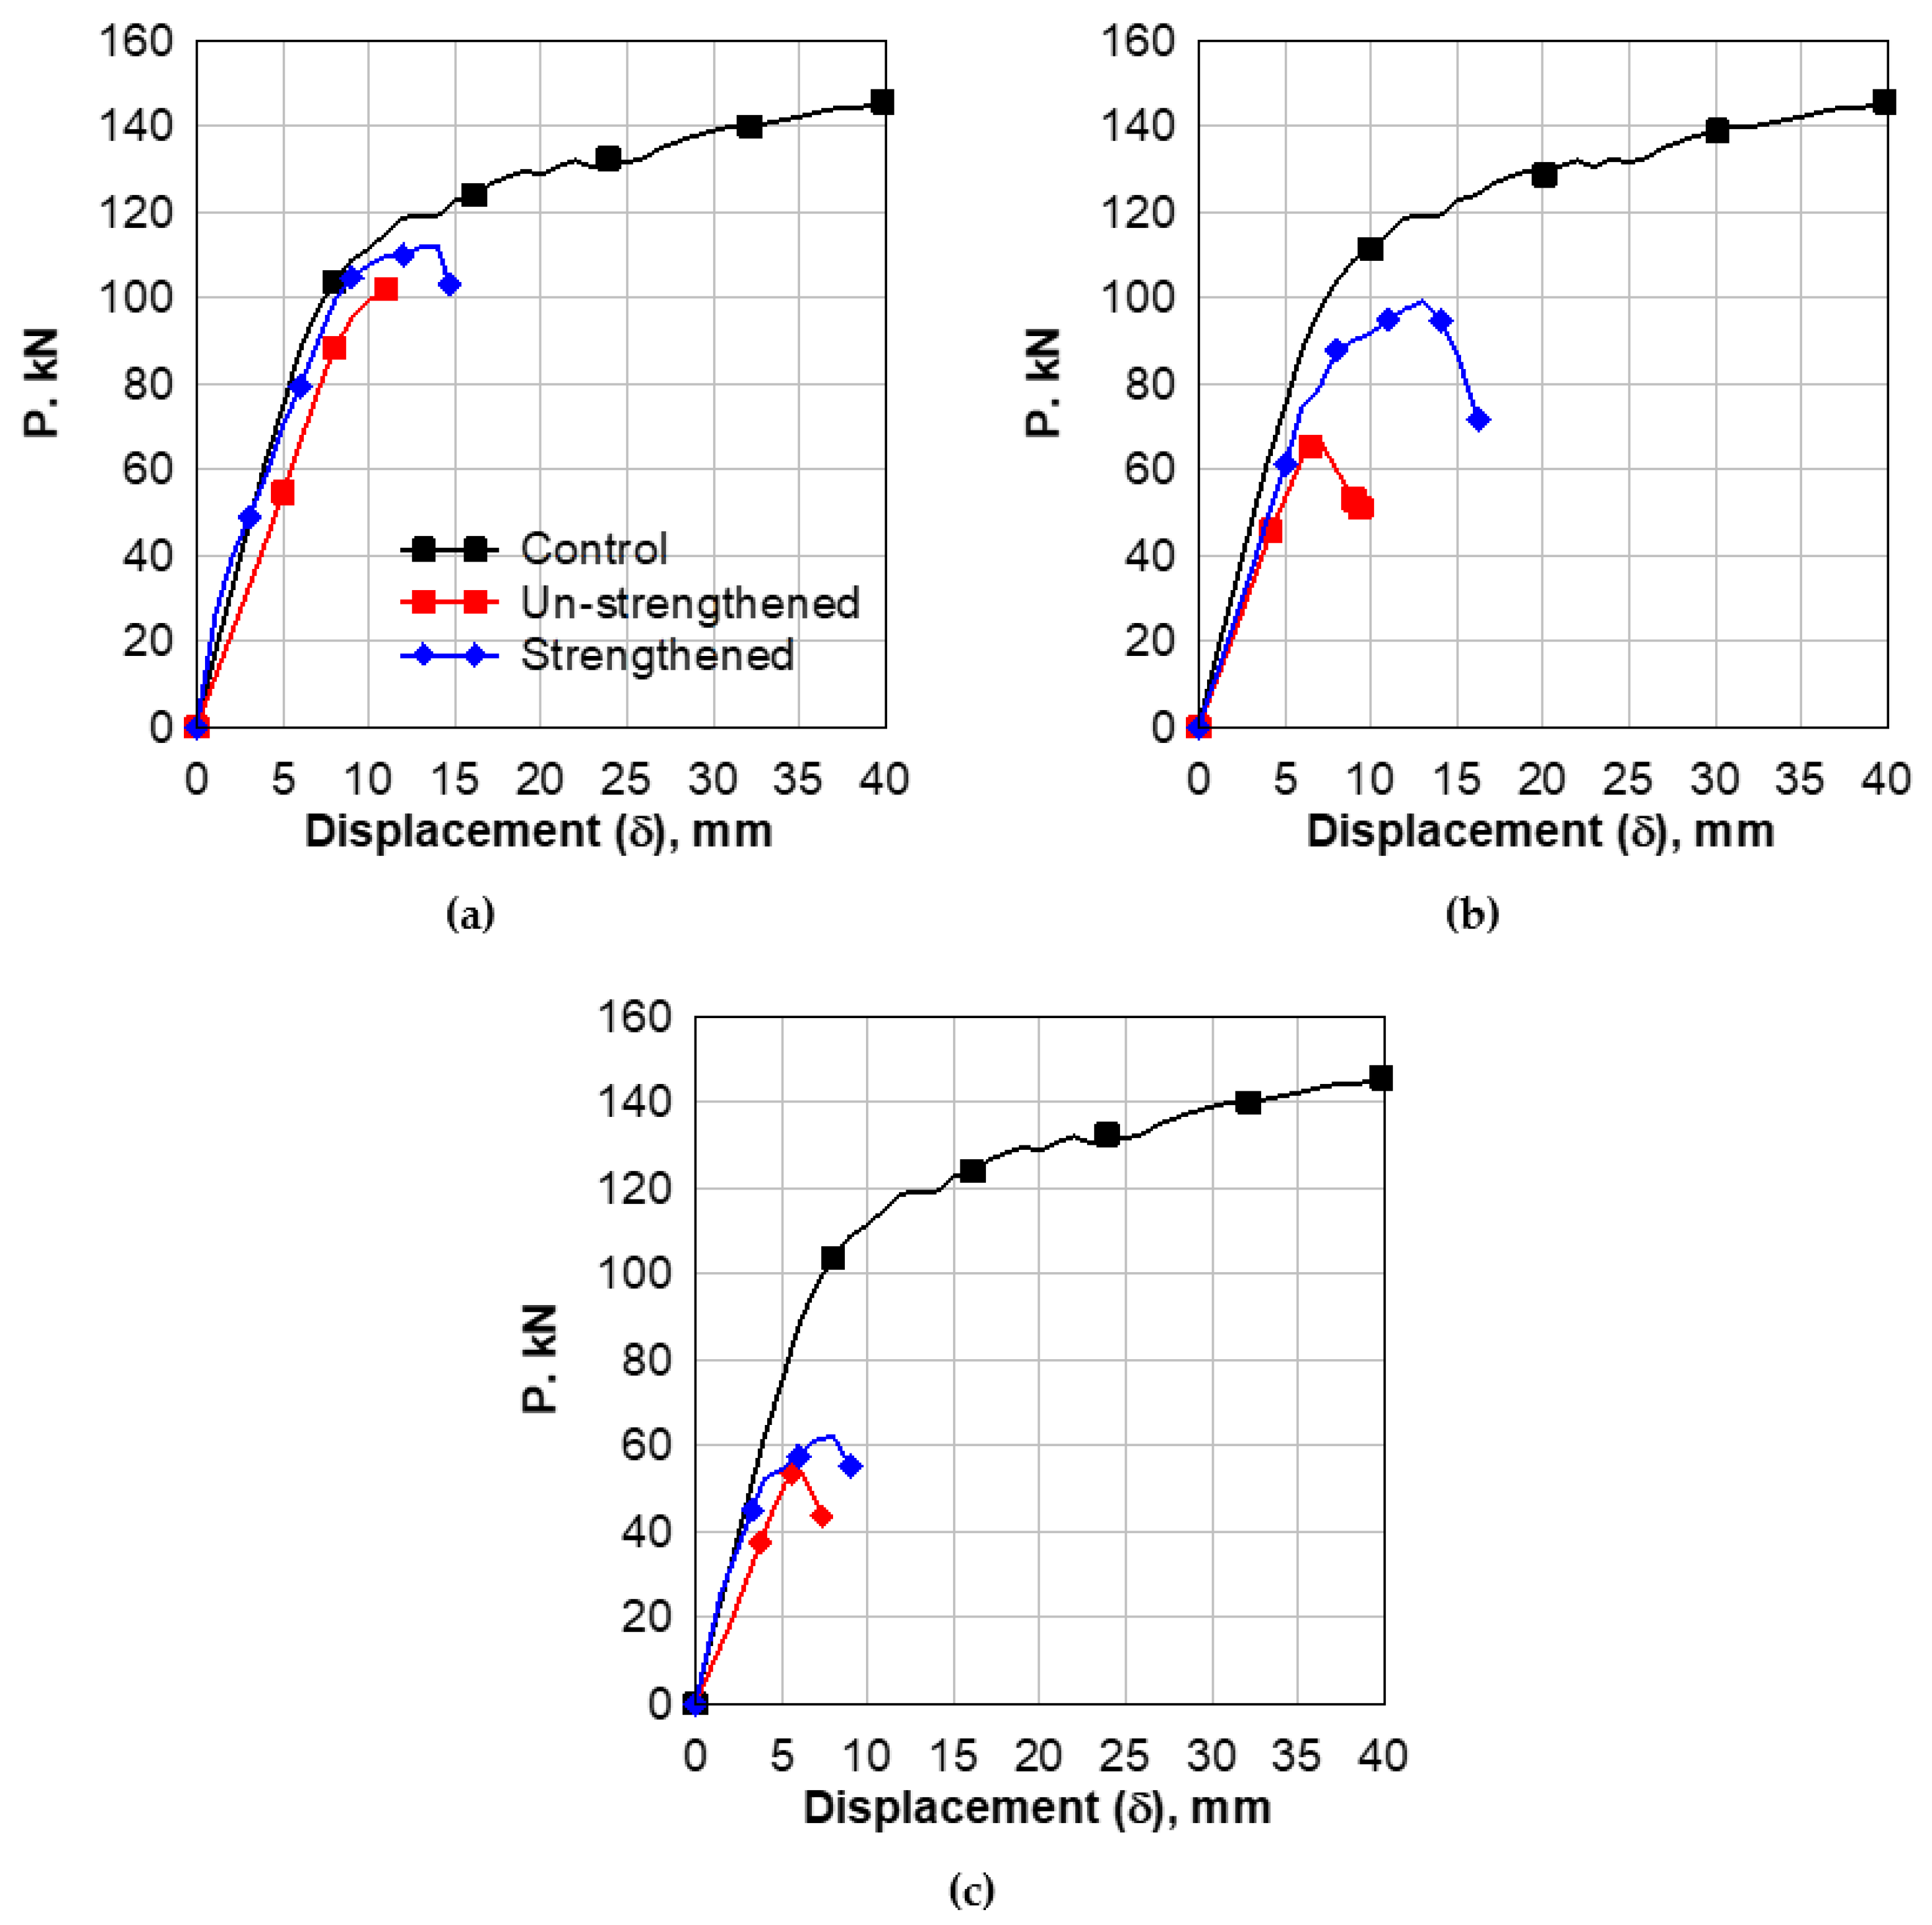
4.2.1. Load–Displacement Behavior
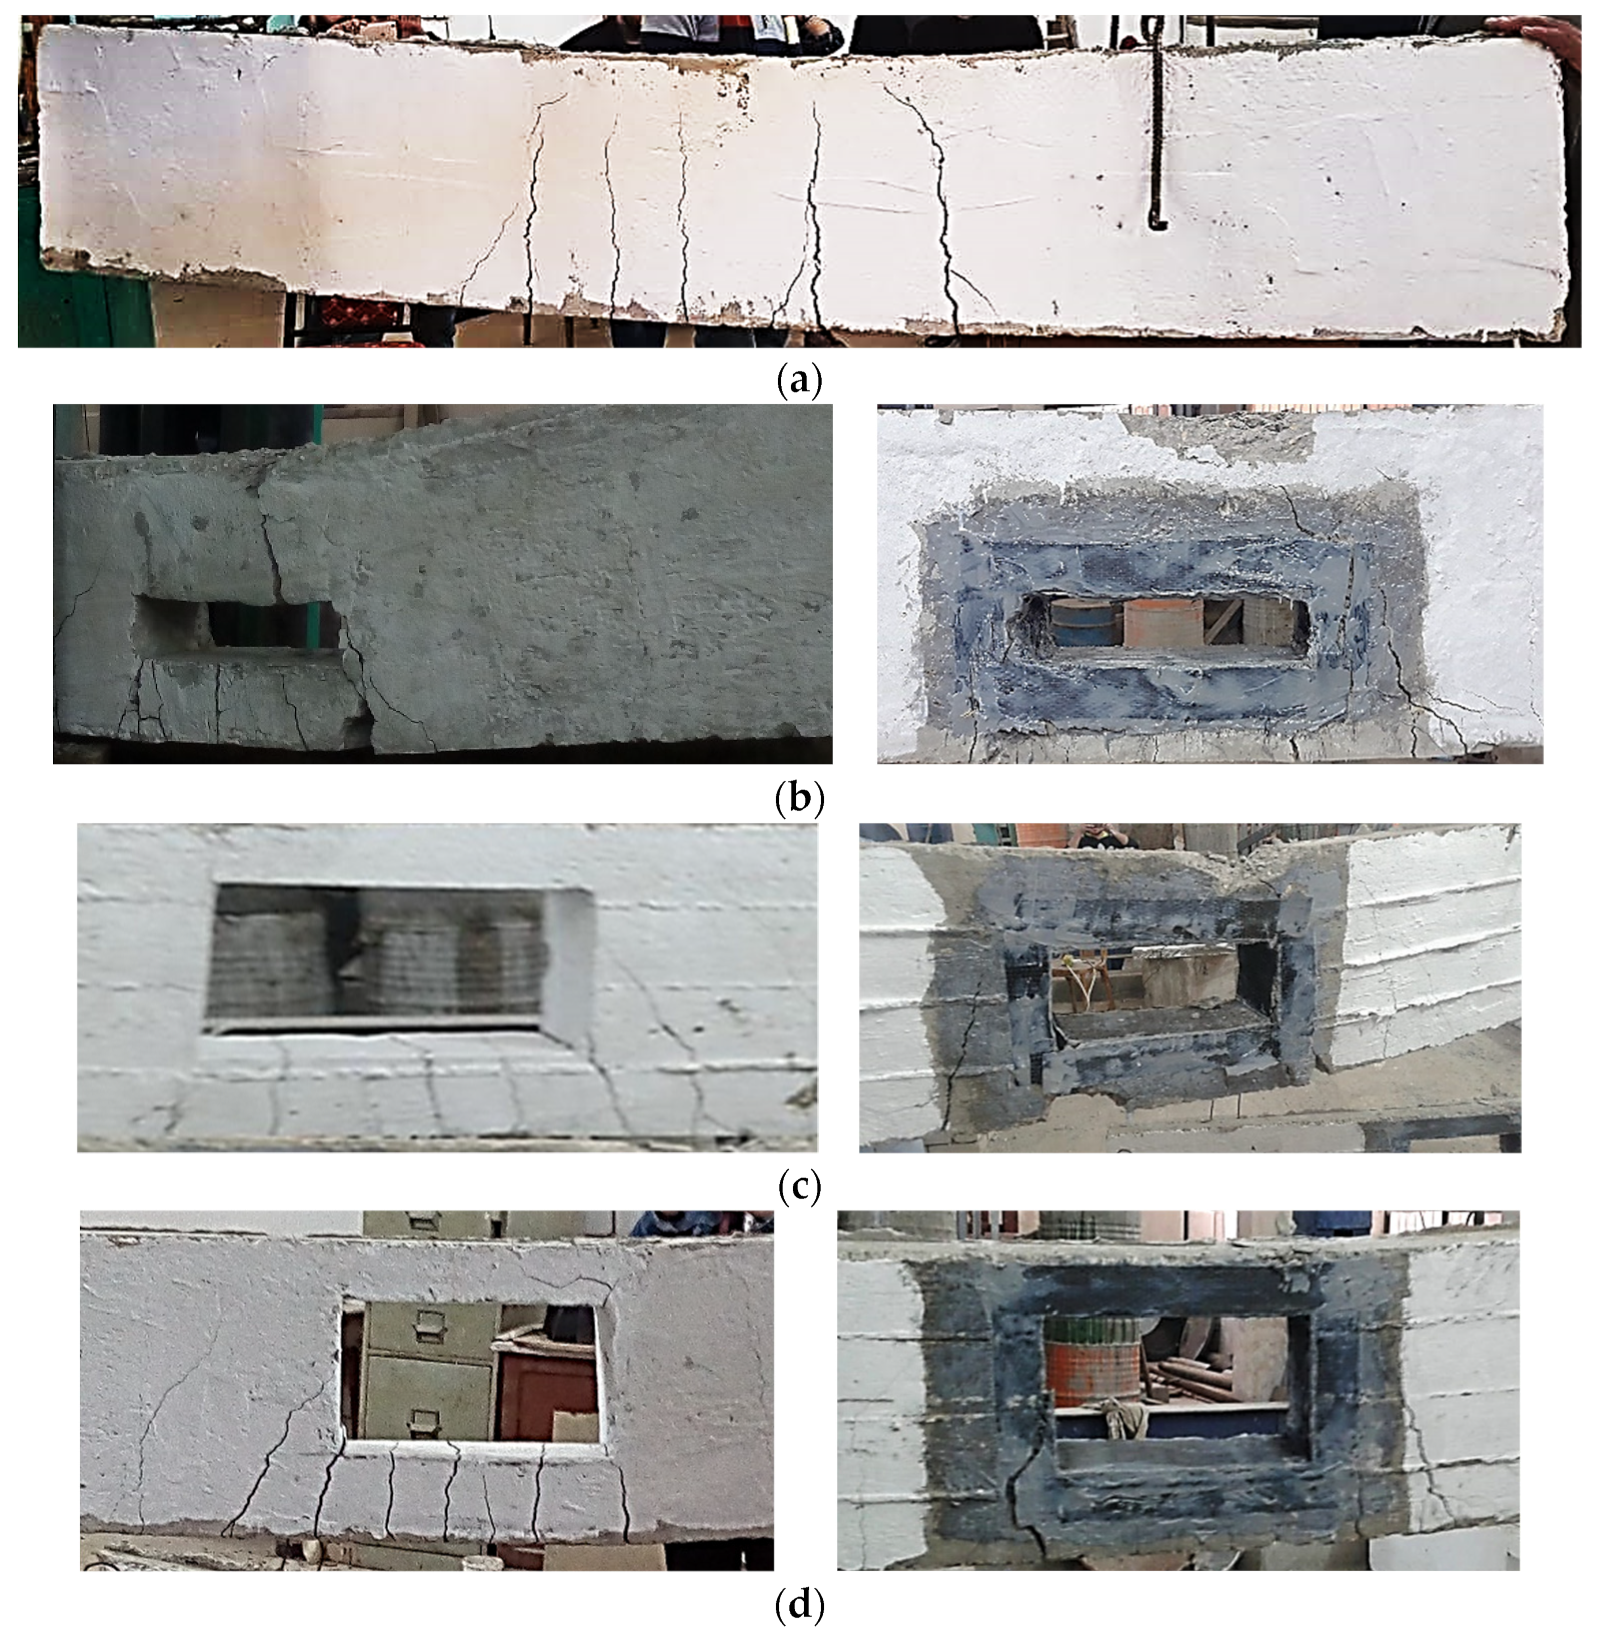
4.2.2. Failure Analysis of Tension-Zone Drilled Beams
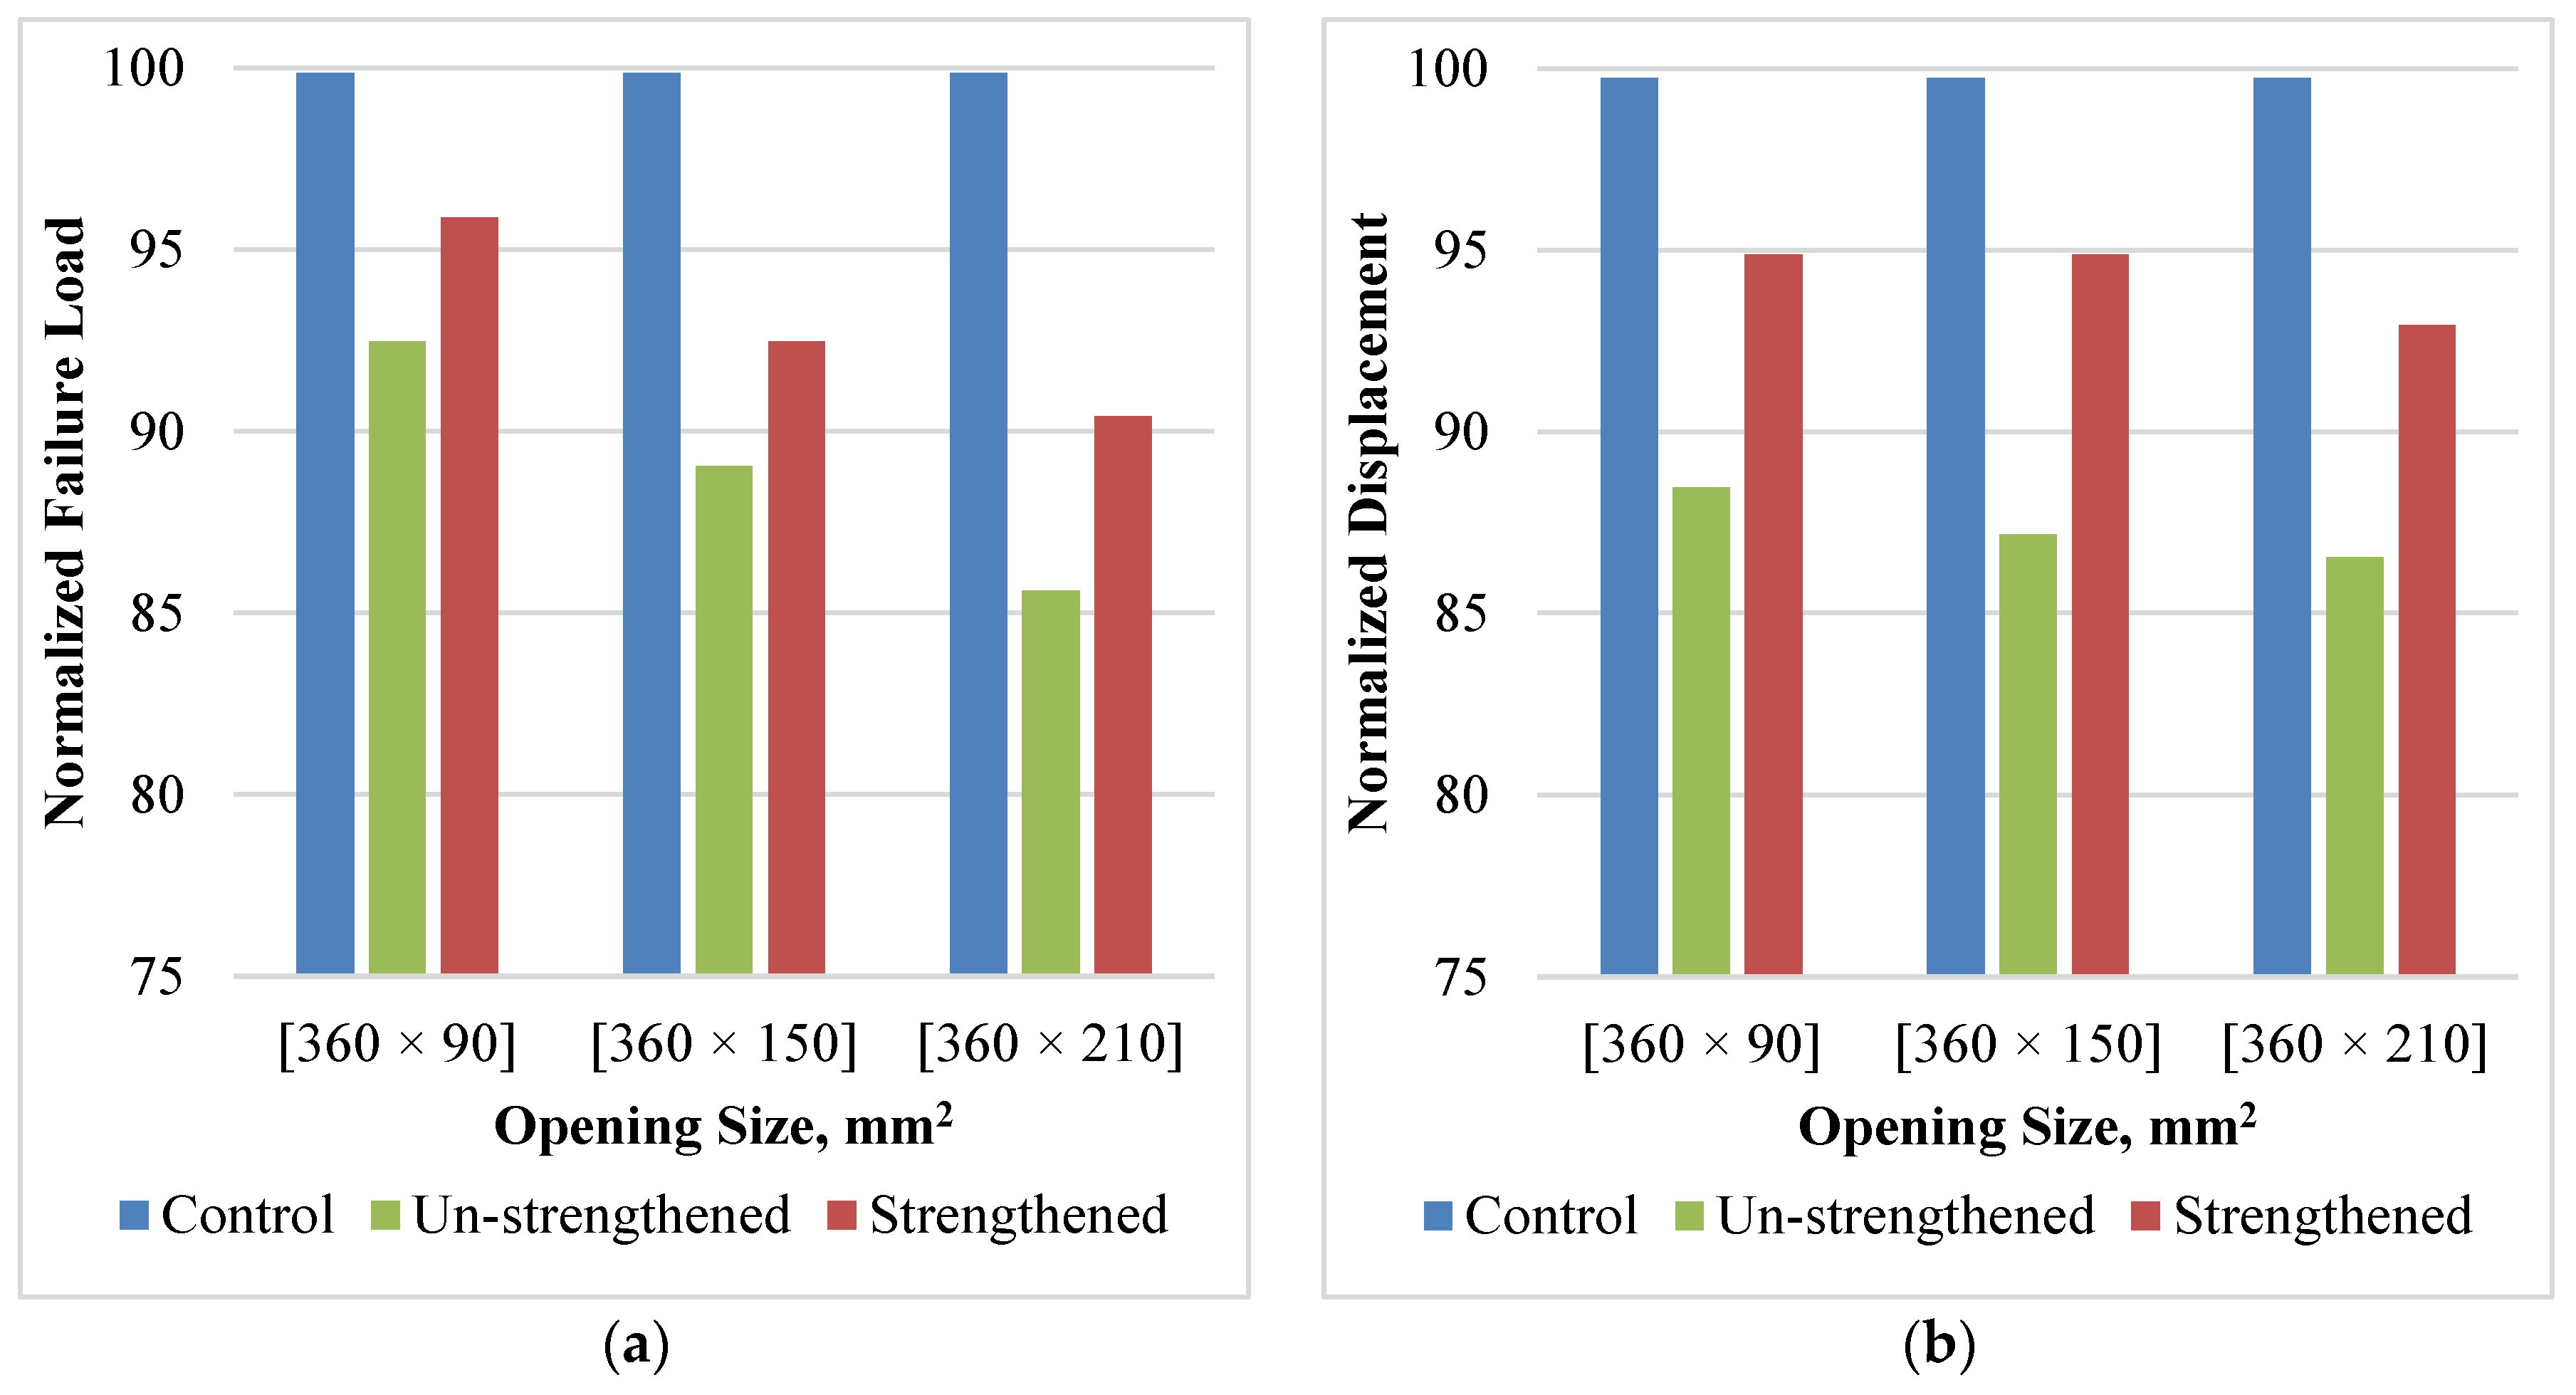
4.2.3. Effect of Strengthening and Opening Size on Beams Behaviors
4.3. The Behavior of Drilled Beams in the Shear Zone
4.3.1. Load Deflection Behavior
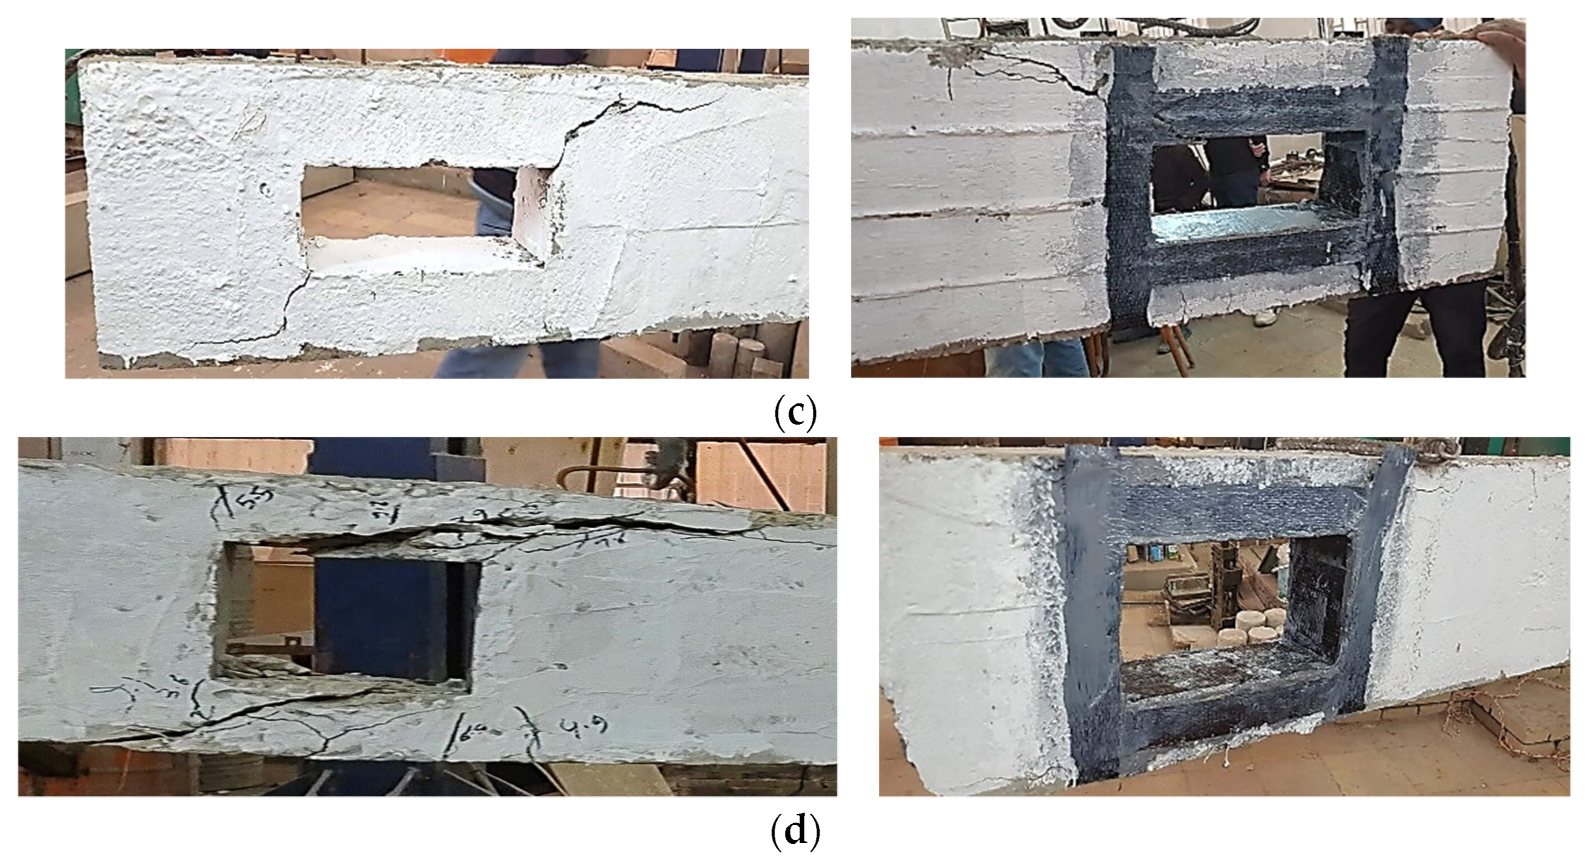
4.3.2. Failure Analysis of Tension-Zone Drilled Beams
4.3.3. Effect of Strengthening and Opening Size on Beams Behaviors
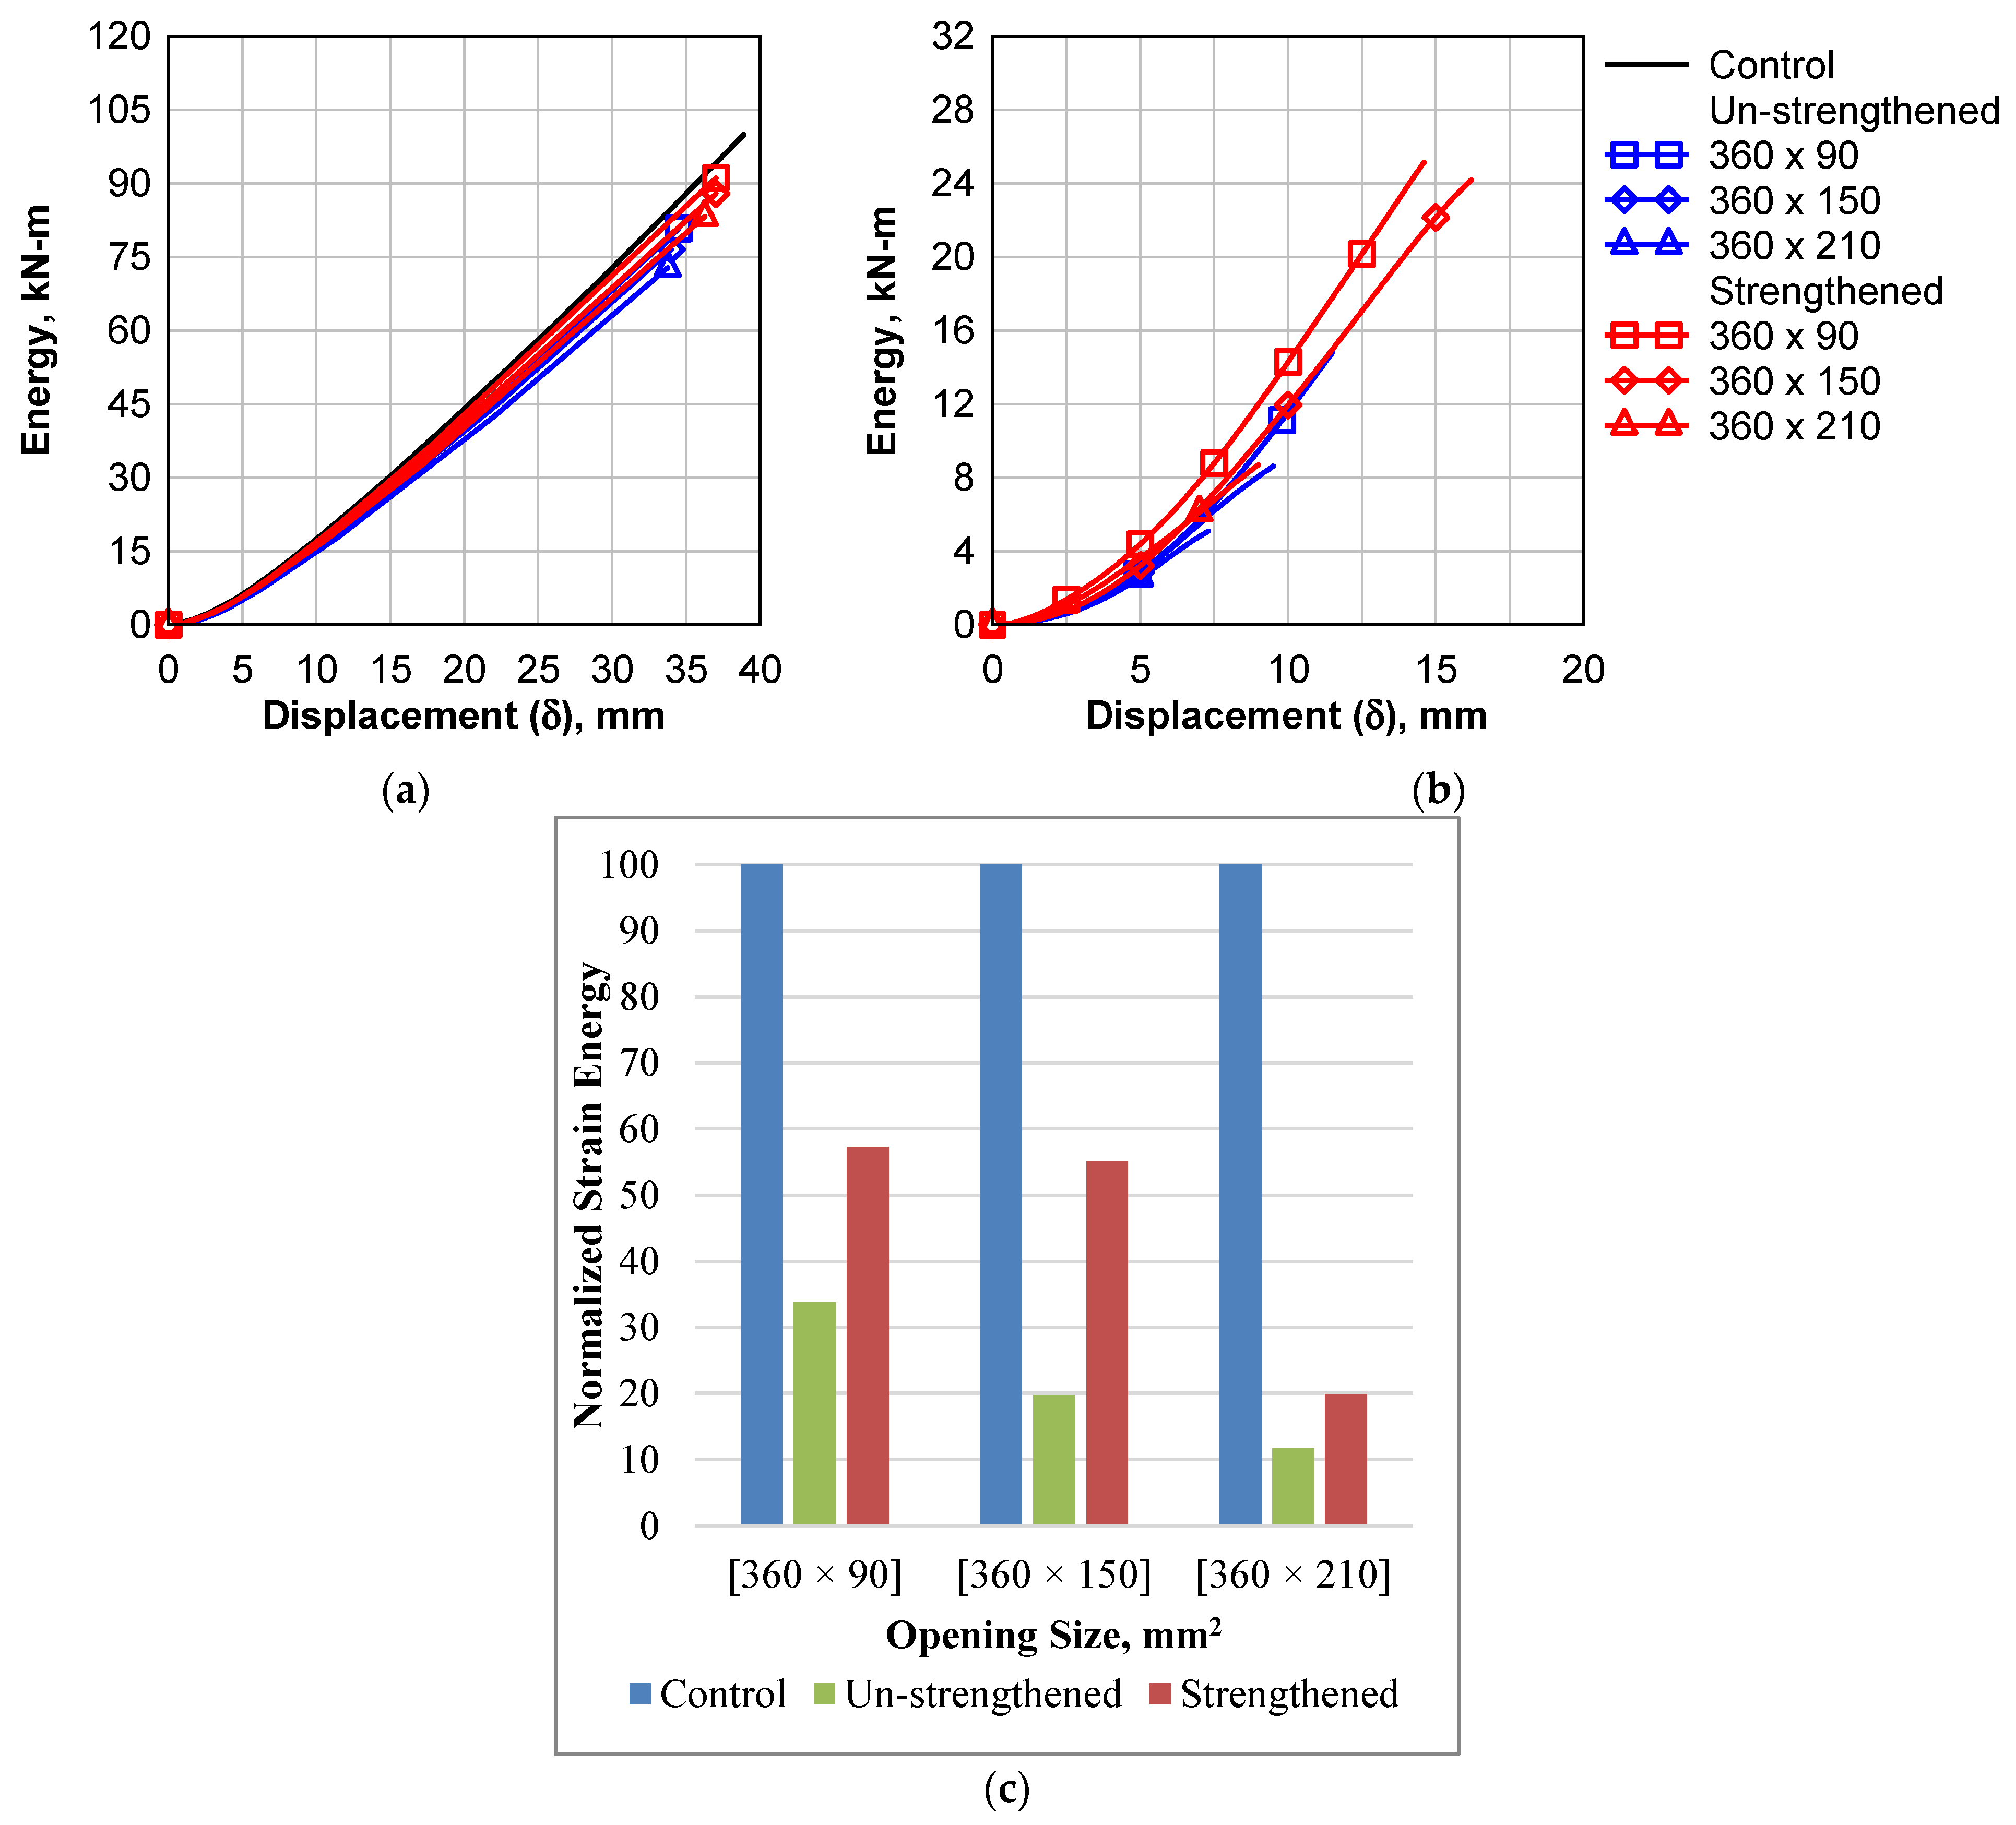
5. Energy Absorption of the Beams
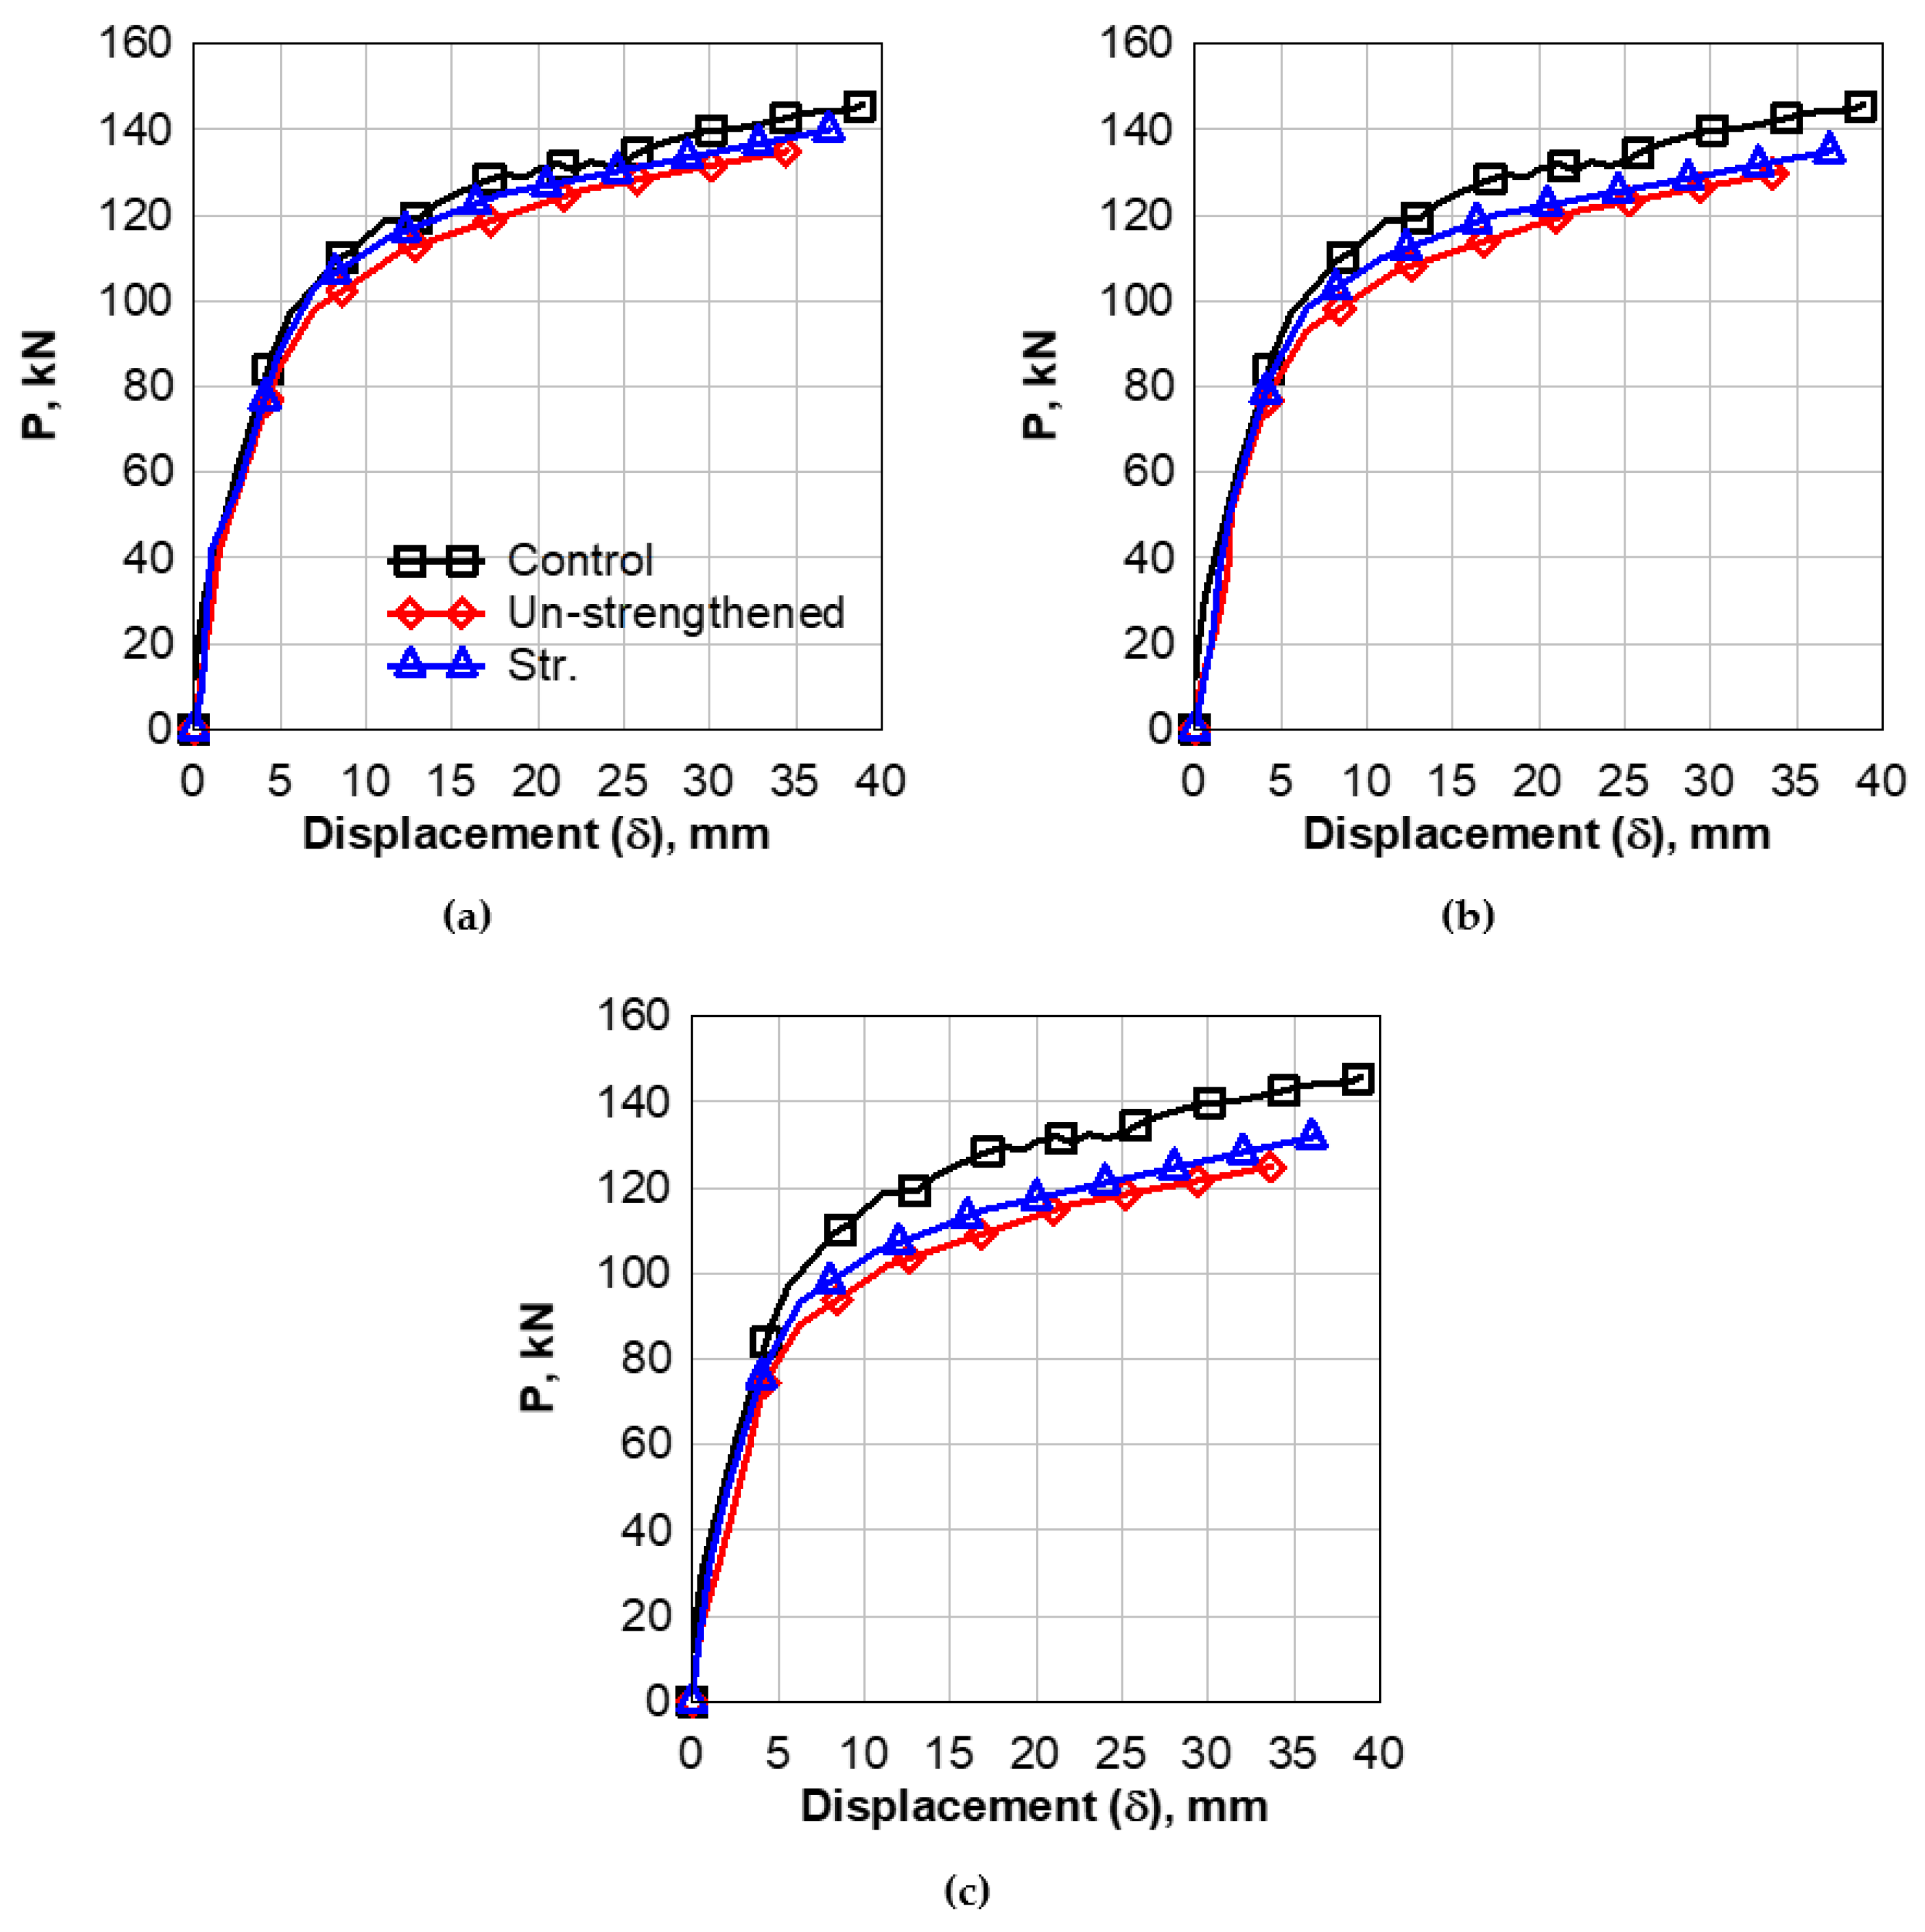
6. Numerical Modeling Results
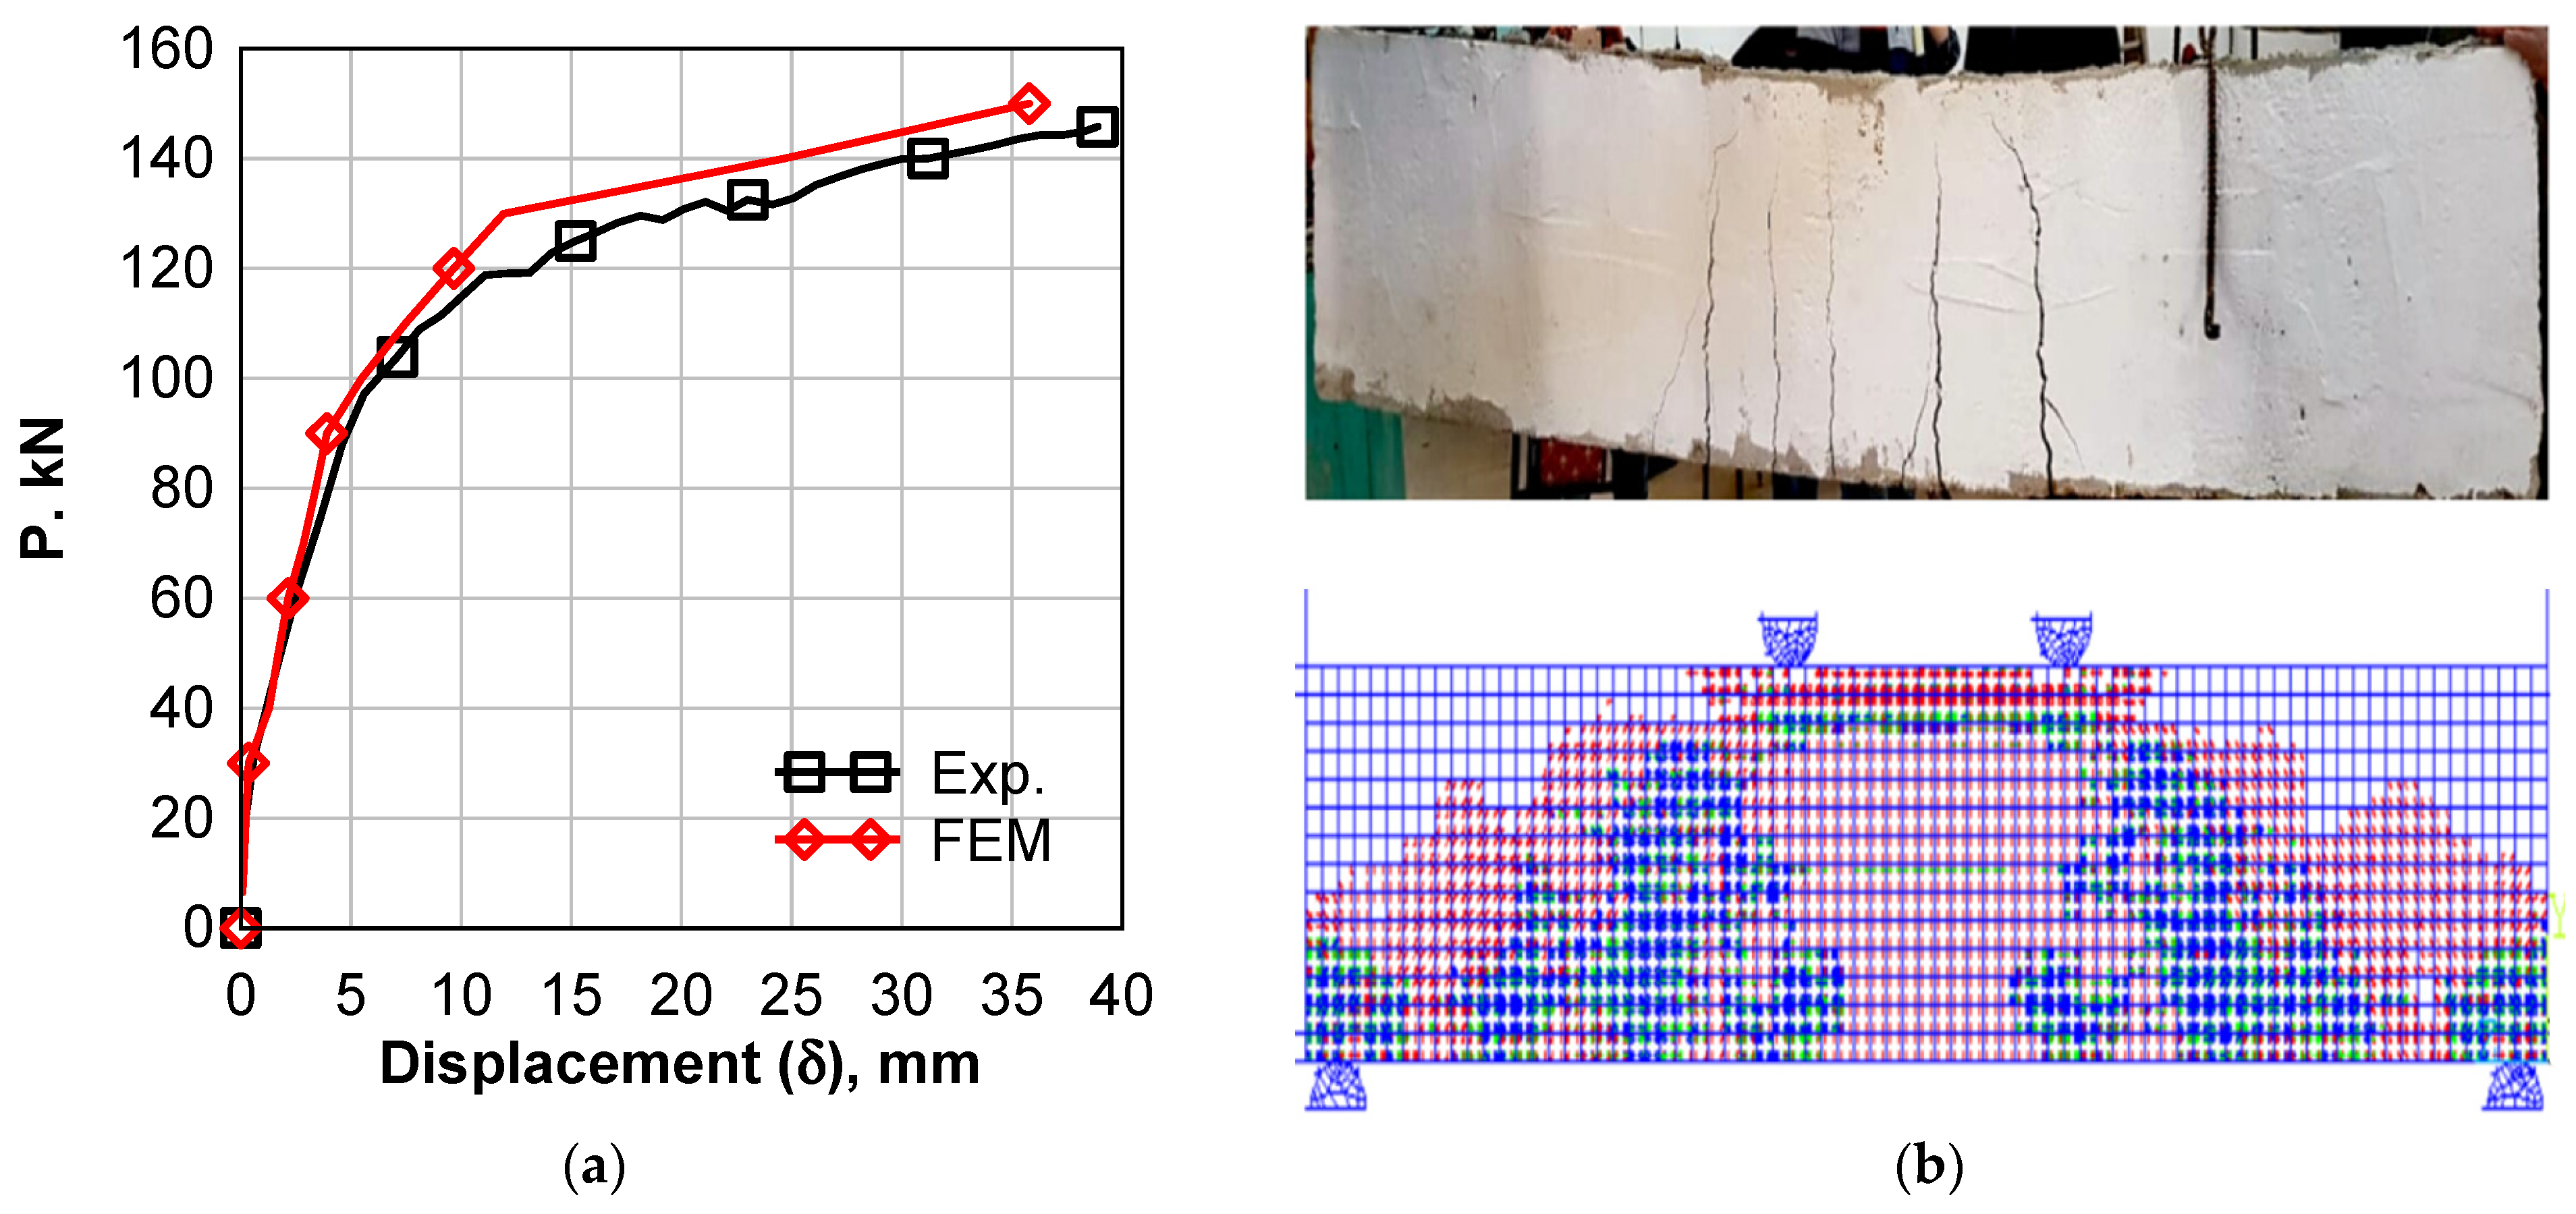
6.1. Control Beam
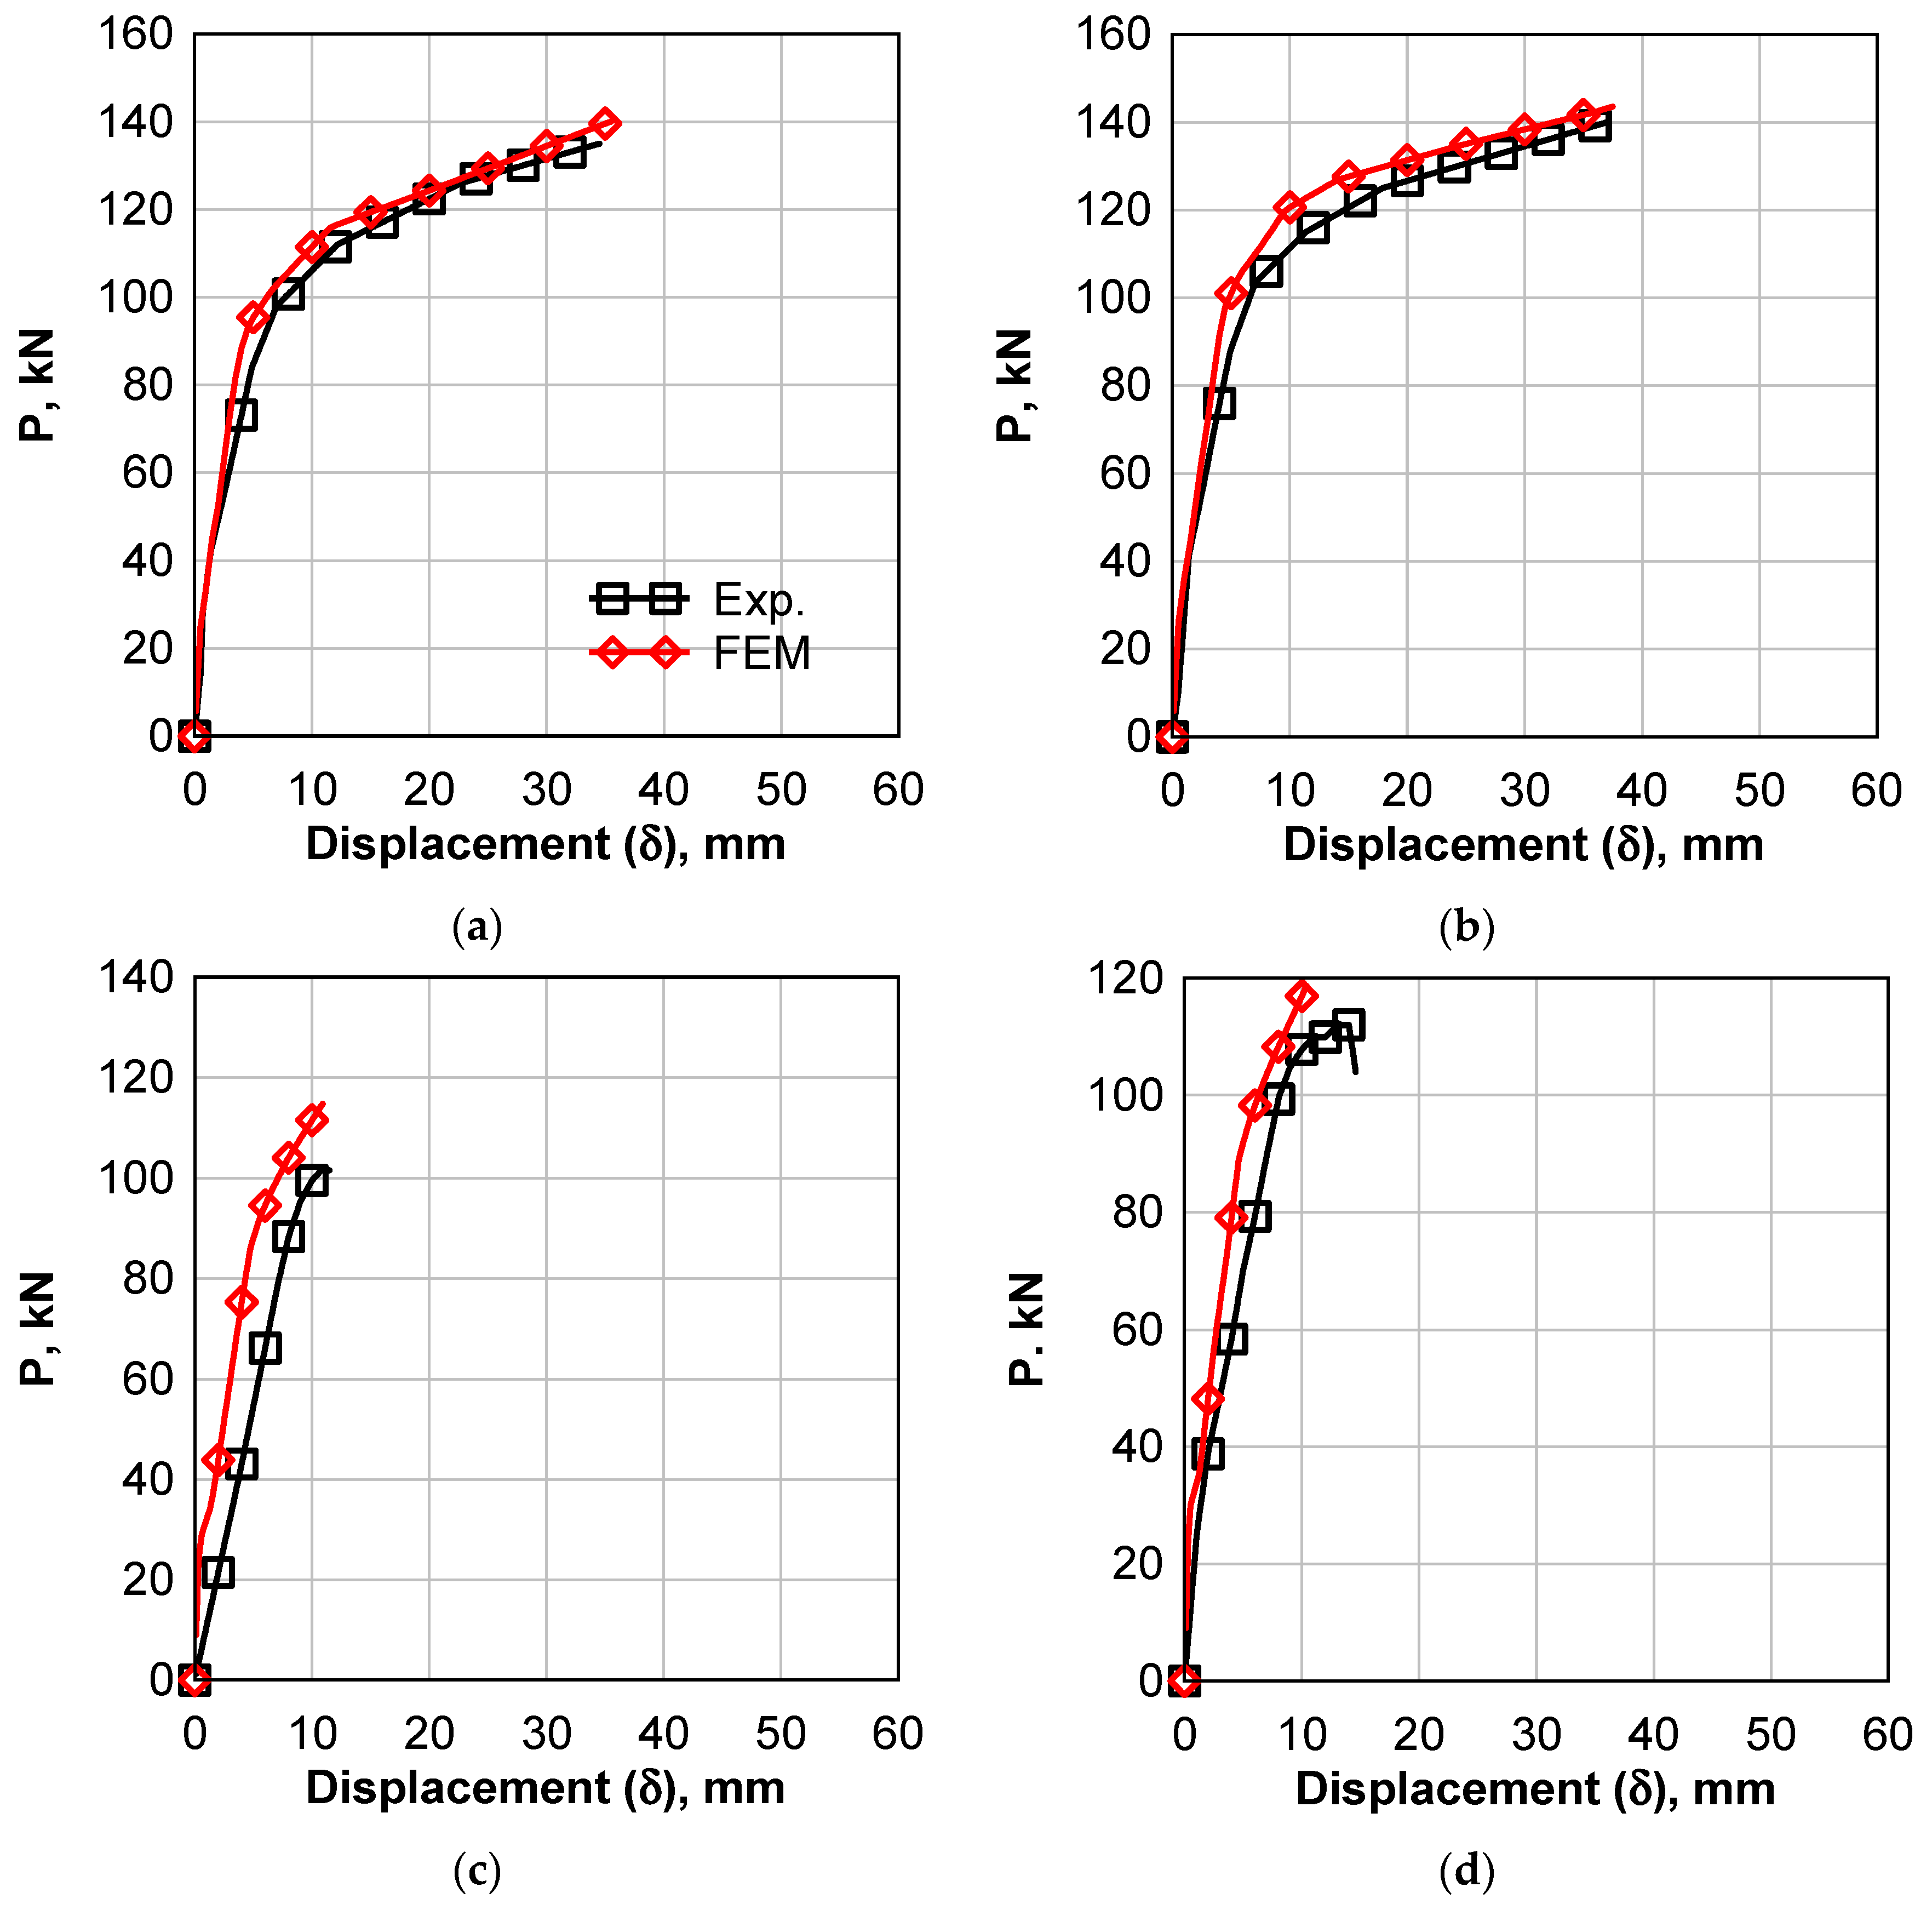
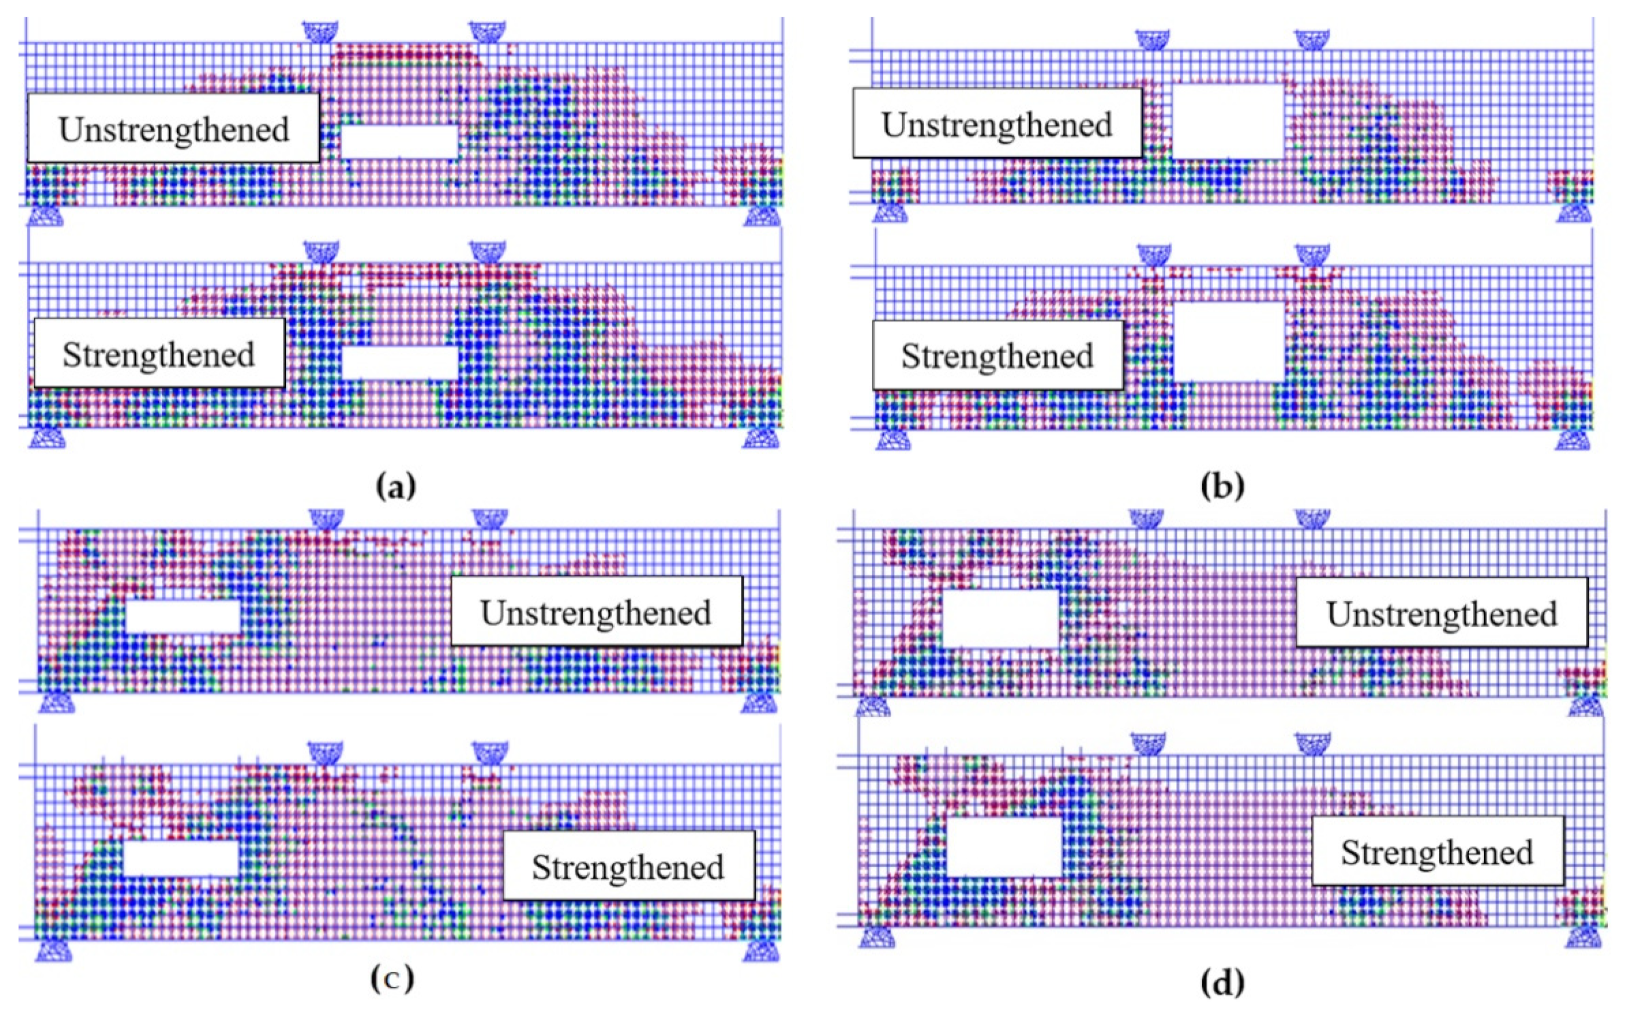
6.2. Comparison of Drilled Beams Results
7. Conclusions
- The tension-zone opening did not significantly decrease the strength of the beam. The maximum failure load reduction was 14% for the 360 × 120 mm2 opening compared to the undrilled control beam.
- Although the strengthening enhancement was marginal compared to the control beam strength, the strength of the strengthening beams increased by approximately 31 to 46%, which represents the efficiency of the strengthening.
- Sever strength and ductility reductions were observed in the case of the shear-zone drilled openings due to the absence of shear reinforcement. The strength and ductility reductions due to the openings ranged from 30 to 62%. The CFRP strengthening enhanced both the strength and displacement by 5–22% and 4–17%, respectively.
- The efficiency of the strengthening in recovering the lost strength was 8–40%. Therefore, it is not recommended to drill any opening at the shear zone as strength loss can reach 57% even with the strengthening.
- The opening also badly affected the failure displacement and absorbed strain energy by a reduction percentage of 63–81% and 66–88%, respectively.
- The developed finite element modeling was able to closely predict the structural behavior of the RC beams with openings.
- A preliminary dynamic blast analysis was performed. It was found that although the strengthening enhanced the blast response of the drilled beam, it is not recommended to drill any openings in the blast resistance structures.
Author Contributions
Funding
Informed Consent Statement
Conflicts of Interest
References
- Nie, X.F.; Zhang, S.S.; Teng, J.G.; Chen, G.M. Experimental Study on RC T-Section Beams with an FRP-Strengthened Web Opening. Compos. Struct. 2018, 185, 273–285. [Google Scholar] [CrossRef]
- El-kareim Shoeib, A.; El-sayed Sedawy, A. Shear Strength Reduction Due to Introduced Opening in Loaded RC Beams. J. Build. Eng. 2017, 13, 28–40. [Google Scholar] [CrossRef]
- Latha, M.S.; Naveen Kumar, B.M. Behavior of Reinforced Concrete Beam with Opening. Int. J. Civ. Eng. Technol. 2017, 8, 581–593. [Google Scholar]
- Karzad, A.S.; Al Toubat, S.; Maalej, M.; Estephane, P. Repair of Reinforced Concrete Beams Using Carbon Fiber Reinforced Polymer. In Proceedings of the MATEC Web of Conferences, Online, 9 August 2017. [Google Scholar] [CrossRef] [Green Version]
- El Maaddawy, T.; Sherif, S. FRP Composites for Shear Strengthening of Reinforced Concrete Deep Beams with Openings. Compos. Struct. 2009, 89, 60–69. [Google Scholar] [CrossRef]
- Mondal, S.; Bandyapadhya, J.; Gautam, C. Strengthening and Rehabilitation of Reinforced Concrete Beams with Opening. Int. J. Civ. Struct. Eng. 2012, 2, 359. [Google Scholar]
- Amiri, J.; Hosseinalibygie, M. Effect Of Small Circular Opening On The Shear And Flexural Behavior And Ultimate Strength Of Reinforced Concrete Beams Using Normal And High Strength Concrete. In Proceedings of the 13th World Conference on Earthquake Engineering, Vancouver, BC, Canada, 1–6 August 2004; p. 3239. [Google Scholar]
- Nuhu Danraka, M.; Mahir Mahmod, H.; Job Oluwatosin, O. Strengthening of Reinforced Concrete Beams Using FRP Technique: A Review. Int. J. Eng. Sci. Comput. 2017, 7, 13199–13213. [Google Scholar]
- Elshafey, A.; Mohammed, M.; El-Shami, M.; Kandil, K. Strengthening of Concrete Beams Using FRP Composites. Concr. Res. Lett. 2014, 5, 740–759. [Google Scholar]
- Akhila, S.; Arathi, S. Analysis of Beam Openings Strengthened by Carbon Fibre Reinforced Polymer (CFRP) Using ANSYS. Int. J. Sci. Res. 2016, 11, 2319–7064. [Google Scholar]
- Agag, F.; Ahmad, S.S.E.; Sallam, H.E.-D.M. Experimental Assessment of Different Strengthening Techniques for Opening in Reinforced Concrete Beams. Frat. Integrità Strutt. 2021, 16, 549–565. [Google Scholar] [CrossRef]
- Agag, F.; El-kholy, A.E.; Seleem, A.; Sallam, H.E.-D. Strengthening RC Beams Contain Opening with Several Techniques: Numerical Study. In Proceedings of the Second International Conference for Engineering Sciences and Applications ICESA (2021), Cairo, Egypt, 21–23 November 2021. [Google Scholar]
- Wan, B.; Jiang, C.; Wu, Y.F. Effect of Defects in Externally Bonded FRP Reinforced Concrete. Constr. Build. Mater. 2018, 172, 63–76. [Google Scholar] [CrossRef]
- Magnusson, J. Fibre Reinforced Concrete Beams Subjected to Air Blast Loading. Int. J. Nord. Concr. Res. 2006, 18–34. [Google Scholar]
- Magnusson, J. Structural Concrete Elements Subjected to Air Blast Loading. Ph.D. Thesis, KTH, Stocholm, Sweden, 2007. [Google Scholar]
- Thiagarajan, G.; Kadambi, A.V.; Robert, S.; Johnson, C.F. Experimental and Finite Element Analysis of Doubly Reinforced Concrete Slabs Subjected to Blast Loads. Int. J. Impact Eng. 2015, 75, 162–173. [Google Scholar] [CrossRef]
- Jacques, E.; Lloyd, A.; Saatcioglu, M. Predicting Reinforced Concrete Response to Blast. Can. J. Civ. Eng. 2013, 40. [Google Scholar] [CrossRef]
- UFC 3-340-02 DoD Structures to Resist the Effects of Accidental Explosions; US DoD: Washington, DC, USA, 2008.
- Sharaky, I.A.; Baena, M.; Barris, C.; Sallam, H.E.M.; Torres, L. Effect of Axial Stiffness of NSM FRP Reinforcement and Concrete Cover Confinement on Flexural Behaviour of Strengthened RC Beams: Experimental and Numerical Study. Eng. Struct. 2018, 173, 987–1001. [Google Scholar] [CrossRef]
- Sharaky, I.A.; Selmy, S.A.I.; El-Attar, M.M.; Sallam, H.E.M. The Influence of Interaction between NSM and Internal Reinforcements on the Structural Behavior of Upgrading RC Beams. Compos. Struct. 2020, 234, 111751. [Google Scholar] [CrossRef]
- Rahal, K.N.; Alrefaei, Y.T. Shear Strength of Recycled Aggregate Concrete Beams Containing Stirrups. Constr. Build. Mater. 2018, 191, 866–876. [Google Scholar] [CrossRef]
- SikaWrap® Hex-230 C SikaWrap® Hex-230 C Product Data Sheet. Available online: https://usa.sika.com/content/dam/dms/us01/g/sikawrap_hex-230c.pdf (accessed on 1 April 2022).
- Sikadur®-330 Sikadur®-330 Product Data Sheet. Available online: https://usa.sika.com/content/dam/dms/us01/0/sikadur_-330.pdf (accessed on 1 April 2022).
- ANSYS. ANSYS Release 18.1 Documentation; ANSYS: Canonsburg, PA, USA, 2017. [Google Scholar]
- El-Sisi, A.E.; Saucier, A.; Salim, H.A.; Hoemann, J.M. Experimental and Numerical Evaluation of Reinforced Concrete Walls Retrofit Systems for Blast Mitigation. J. Perform. Constr. Facil. 2019, 33, 04018113. [Google Scholar] [CrossRef]
- El-Sisi, A.E.; Saucier, A.; Salim, H.A.; Nawar, M. Experimental and Numerical Analysis for Non-Load Bearing Sandwich Wall Panels for Blast Mitigation. In Proceedings of the Structures Congress 2017: Blast, Impact Loading and Response of Structures—Selected Papers from the Structures Congress 2017, Denver, CO, USA, 6–8 April 2017. [Google Scholar]
- El-Emam, H.; El-Sisi, A.; Bneni, M.; Ahmad, S.S.E.; Sallam, H.E.D.M. Effects of Tensile Reinforcing Steel Ratio and Near-Surface-Mounted Bar Development Length on the Structural Behavior of Strengthened Rc Beams. Lat. Am. J. Solids Struct. 2020, 17, e295. [Google Scholar] [CrossRef]
- El-Emam, H.; El-Sisi, A.; Reda, R.; Seleem, M.; Bneni, M. Effect of Concrete Cover Thickness and Main Reinforcement Ratio on Flexural Behavior of RC Beams Strengthened by NSM-GFRP Bars. Frat. Integrita Strutt. 2020, 14, 197–210. [Google Scholar] [CrossRef]
- Amer, A.; Abdel kader, H.; Abdel-Razek, L.; El-Sisi, A. Numerical analysis of FRP reinforced frames under cyclic loading. Egypt. J. Eng. Sci. Technol. 2021, 34, 28–37. [Google Scholar] [CrossRef]
- El-Sisi, A.E.; Saucier, A.; Salim, H.A. Parametric Study of Non-Load-Bearing Sandwich Wall Panels for Blast Mitigation. J. Perform. Constr. Facil. 2022, 36. [Google Scholar] [CrossRef]
- Desayi, P.; Krishnan, S. Equation for the Stress-Strain Curve of Concrete. J. Proc. 1964, 61, 345–350. [Google Scholar] [CrossRef]


| Beam No. | Group | Location of the Opening | Opening Dimensions (a × b), mm2 | Relative Dimensions, (a/b) | CFRP Strengthening |
|---|---|---|---|---|---|
| B1 | Reference beam | ~ | ~ | ~ | No |
| B2 | 1 | In the constant moment region | 90 × 360 | 0.21 (90/420) | No |
| B3 | 90 × 360 | 0.21 | Yes | ||
| B4 | 150 × 360 | 0.36 | No | ||
| B5 | 150 × 360 | 0.36 | Yes | ||
| B6 | 210 × 360 | 0.50 | No | ||
| B7 | 210 × 360 | 0.50 | Yes | ||
| B8 | 2 | In the shear span | 90 × 360 | 0.21 (90/420) | No |
| B9 | 90 × 360 | 0.21 | Yes | ||
| B10 | 150 × 360 | 0.36 | No | ||
| B11 | 150 × 360 | 0.36 | Yes | ||
| B12 | 210 × 360 | 0.50 | No | ||
| B13 | 210 × 360 | 0.50 | Yes |
| Steel/Property | Yield Strength, MPa | Tensile Strength, MPa | % Maximum of Elongation |
|---|---|---|---|
| Main steel, Grade 440 | 440 | 600 | 20 |
| Confinement steel, Grade 300 | 300 | 450 | 25 |
| Component | Element Type | Material Model |
|---|---|---|
| Concrete | SOLID 65 | Concrete Model |
| Rebar | BEAM 186 | Bilinear Isotropic Hardening |
| FRP Strips | SHELL 181 | Elastic Orthotropic |
| Contact | CONTA 174 and TARGE 170 | CZM Material |
| Loading and Bearing Plates | SOLID 180 | Elastic Isotropic |
Publisher’s Note: MDPI stays neutral with regard to jurisdictional claims in published maps and institutional affiliations. |
© 2022 by the authors. Licensee MDPI, Basel, Switzerland. This article is an open access article distributed under the terms and conditions of the Creative Commons Attribution (CC BY) license (https://creativecommons.org/licenses/by/4.0/).
Share and Cite
El-Sisi, A.A.; El-Emam, H.M.; El-Kholy, A.E.-M.I.; Ahmad, S.S.; Sallam, H.M.; Salim, H.A. Structural Behavior of RC Beams Containing Unreinforced Drilled Openings with and without CFRP Strengthening. Polymers 2022, 14, 2034. https://0-doi-org.brum.beds.ac.uk/10.3390/polym14102034
El-Sisi AA, El-Emam HM, El-Kholy AE-MI, Ahmad SS, Sallam HM, Salim HA. Structural Behavior of RC Beams Containing Unreinforced Drilled Openings with and without CFRP Strengthening. Polymers. 2022; 14(10):2034. https://0-doi-org.brum.beds.ac.uk/10.3390/polym14102034
Chicago/Turabian StyleEl-Sisi, Alaa A., Hesham M. El-Emam, Abd El-Monem I. El-Kholy, Seleem S. Ahmad, Hossam M. Sallam, and Hani A. Salim. 2022. "Structural Behavior of RC Beams Containing Unreinforced Drilled Openings with and without CFRP Strengthening" Polymers 14, no. 10: 2034. https://0-doi-org.brum.beds.ac.uk/10.3390/polym14102034