
Mechanical and Tribological Behavior of Functionally Graded Unidirectional Glass Fiber-Reinforced Epoxy Composites

 , , ,
, , ,  and
and
Abstract
:
1. Introduction
2. Experimental Works
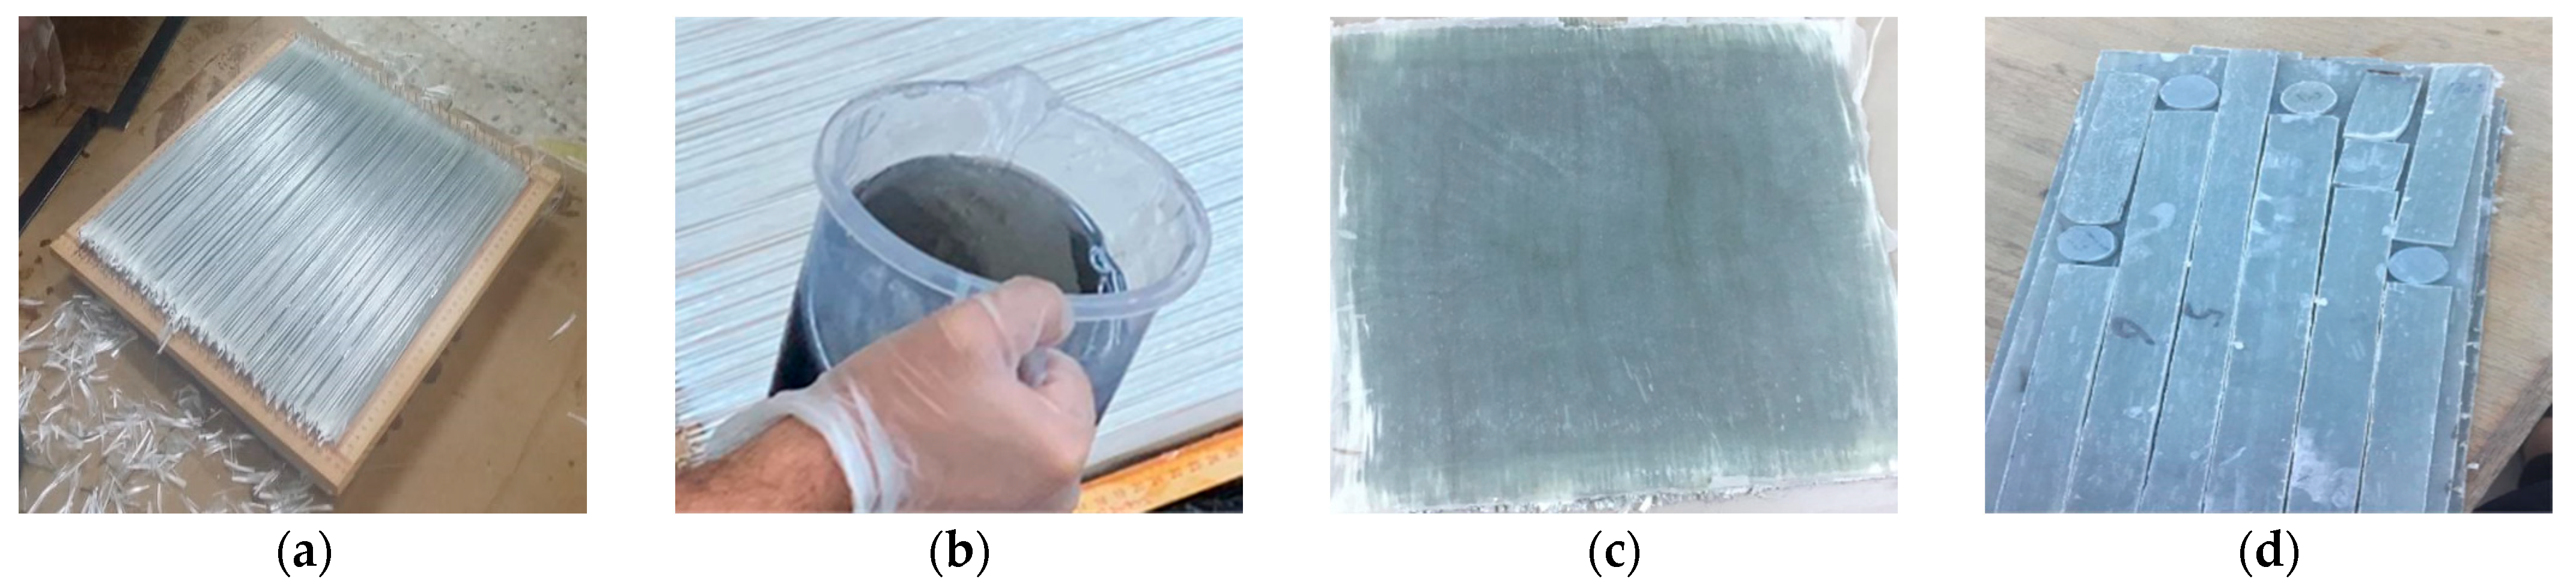
2.1. Material Preparation and Mechanical Properties
2.2. Sample and Tests Characterization
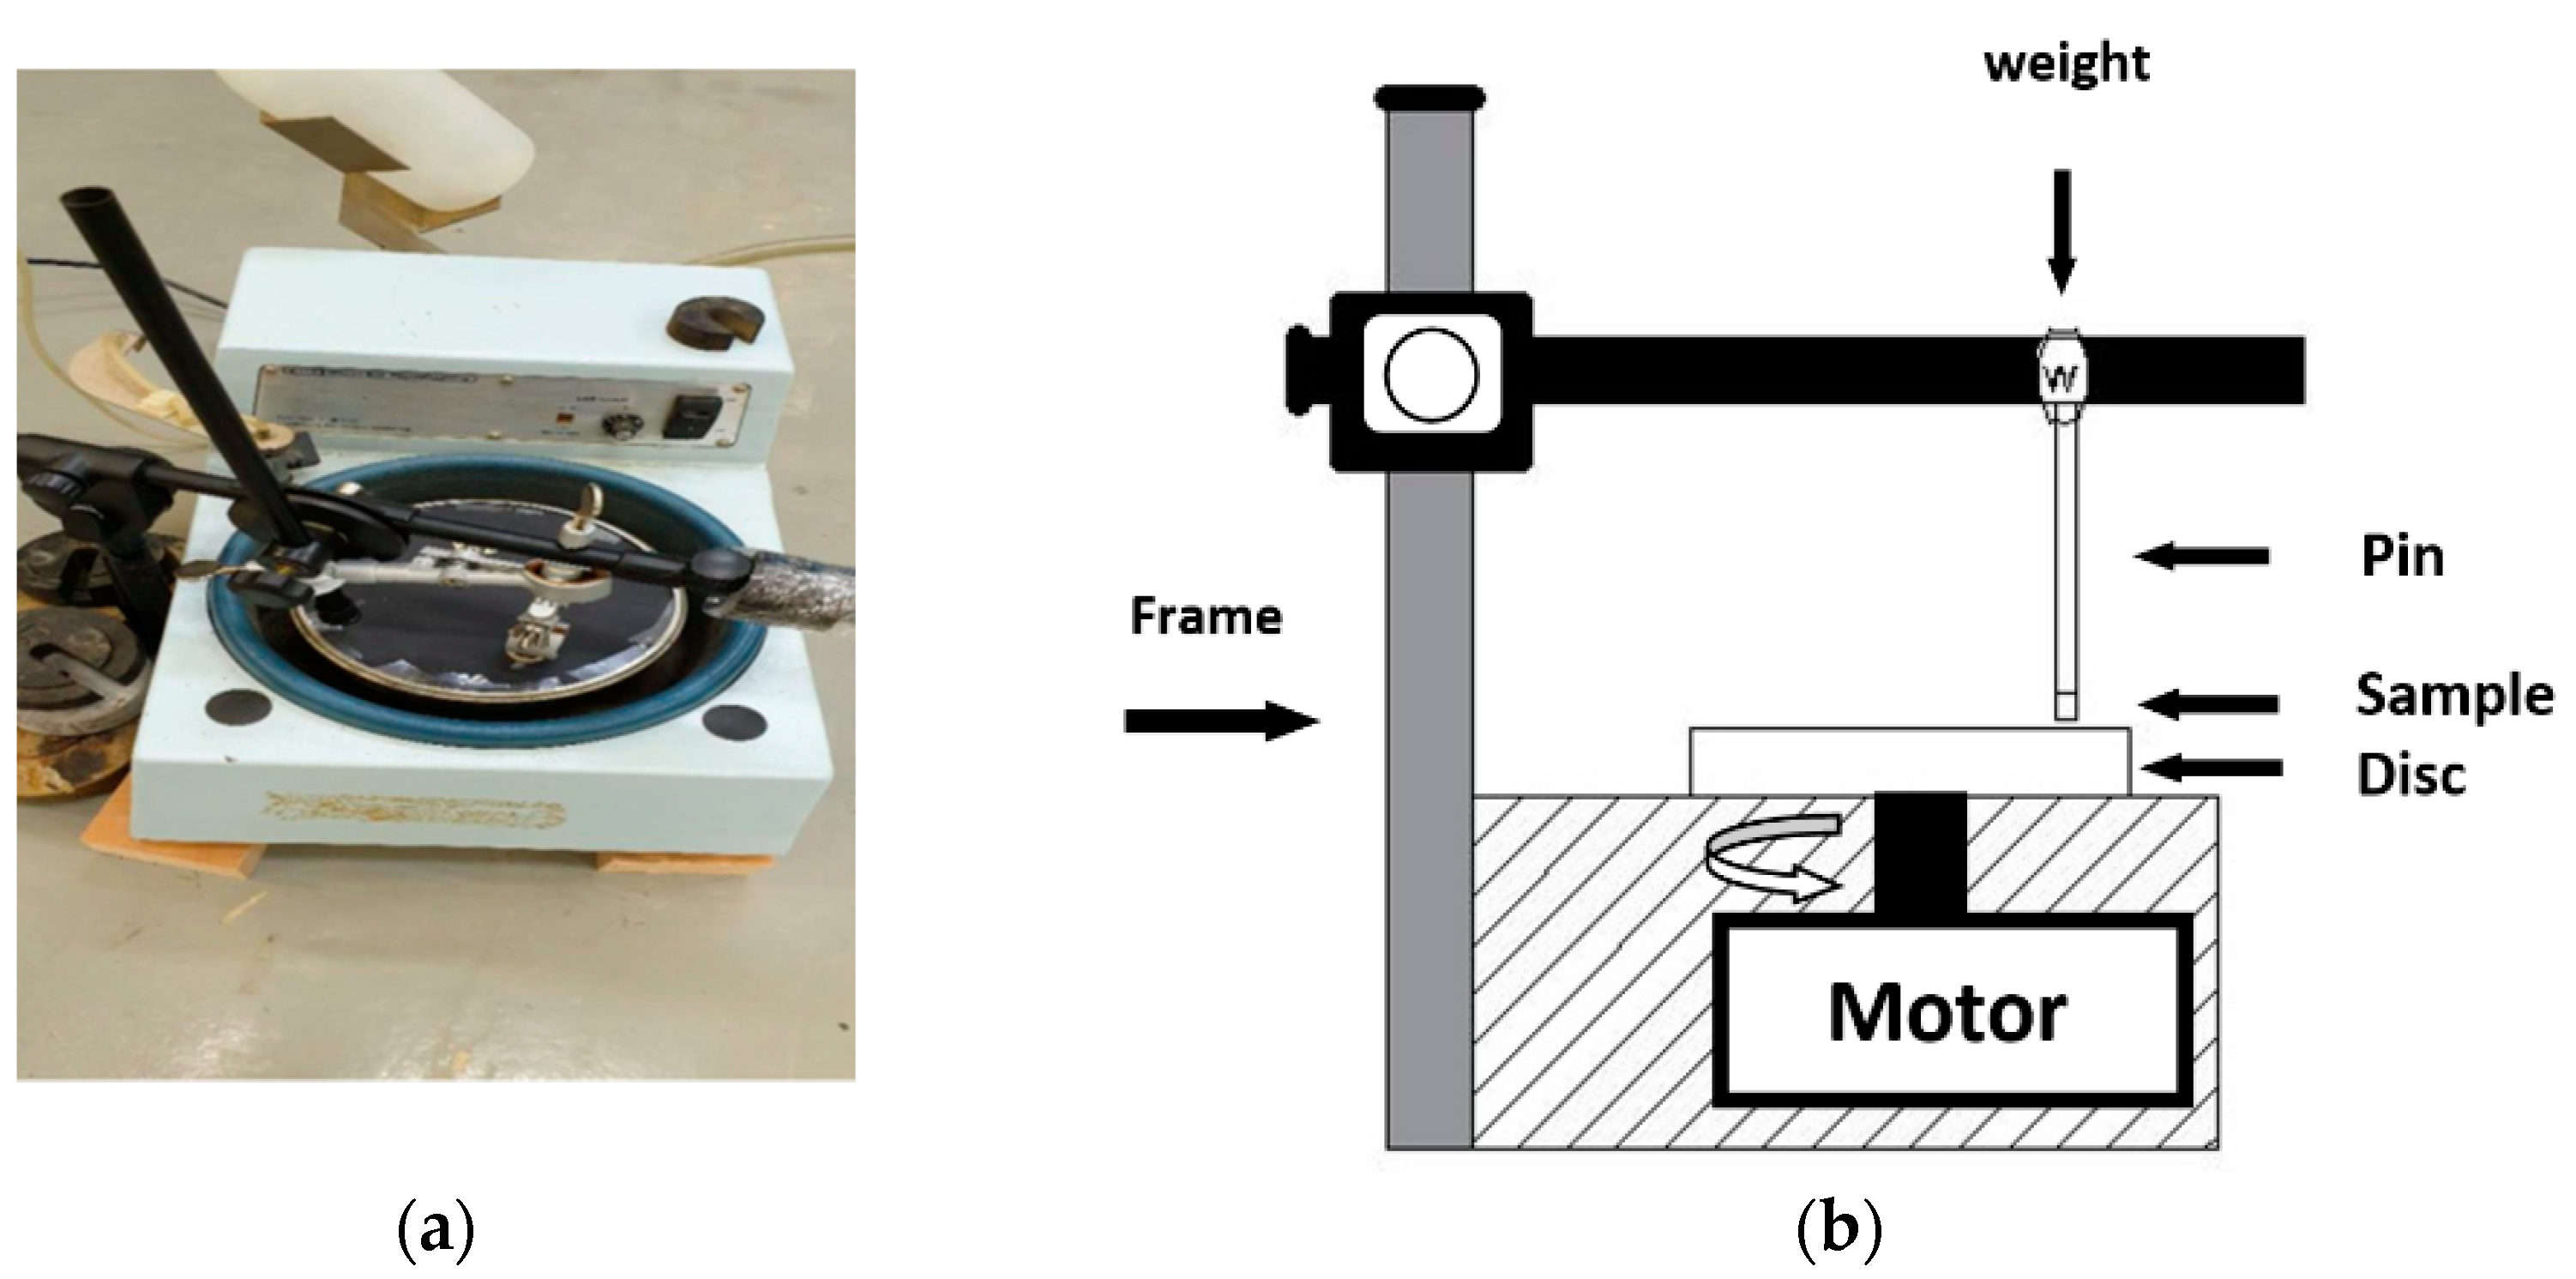
2.2.1. Wear Tests
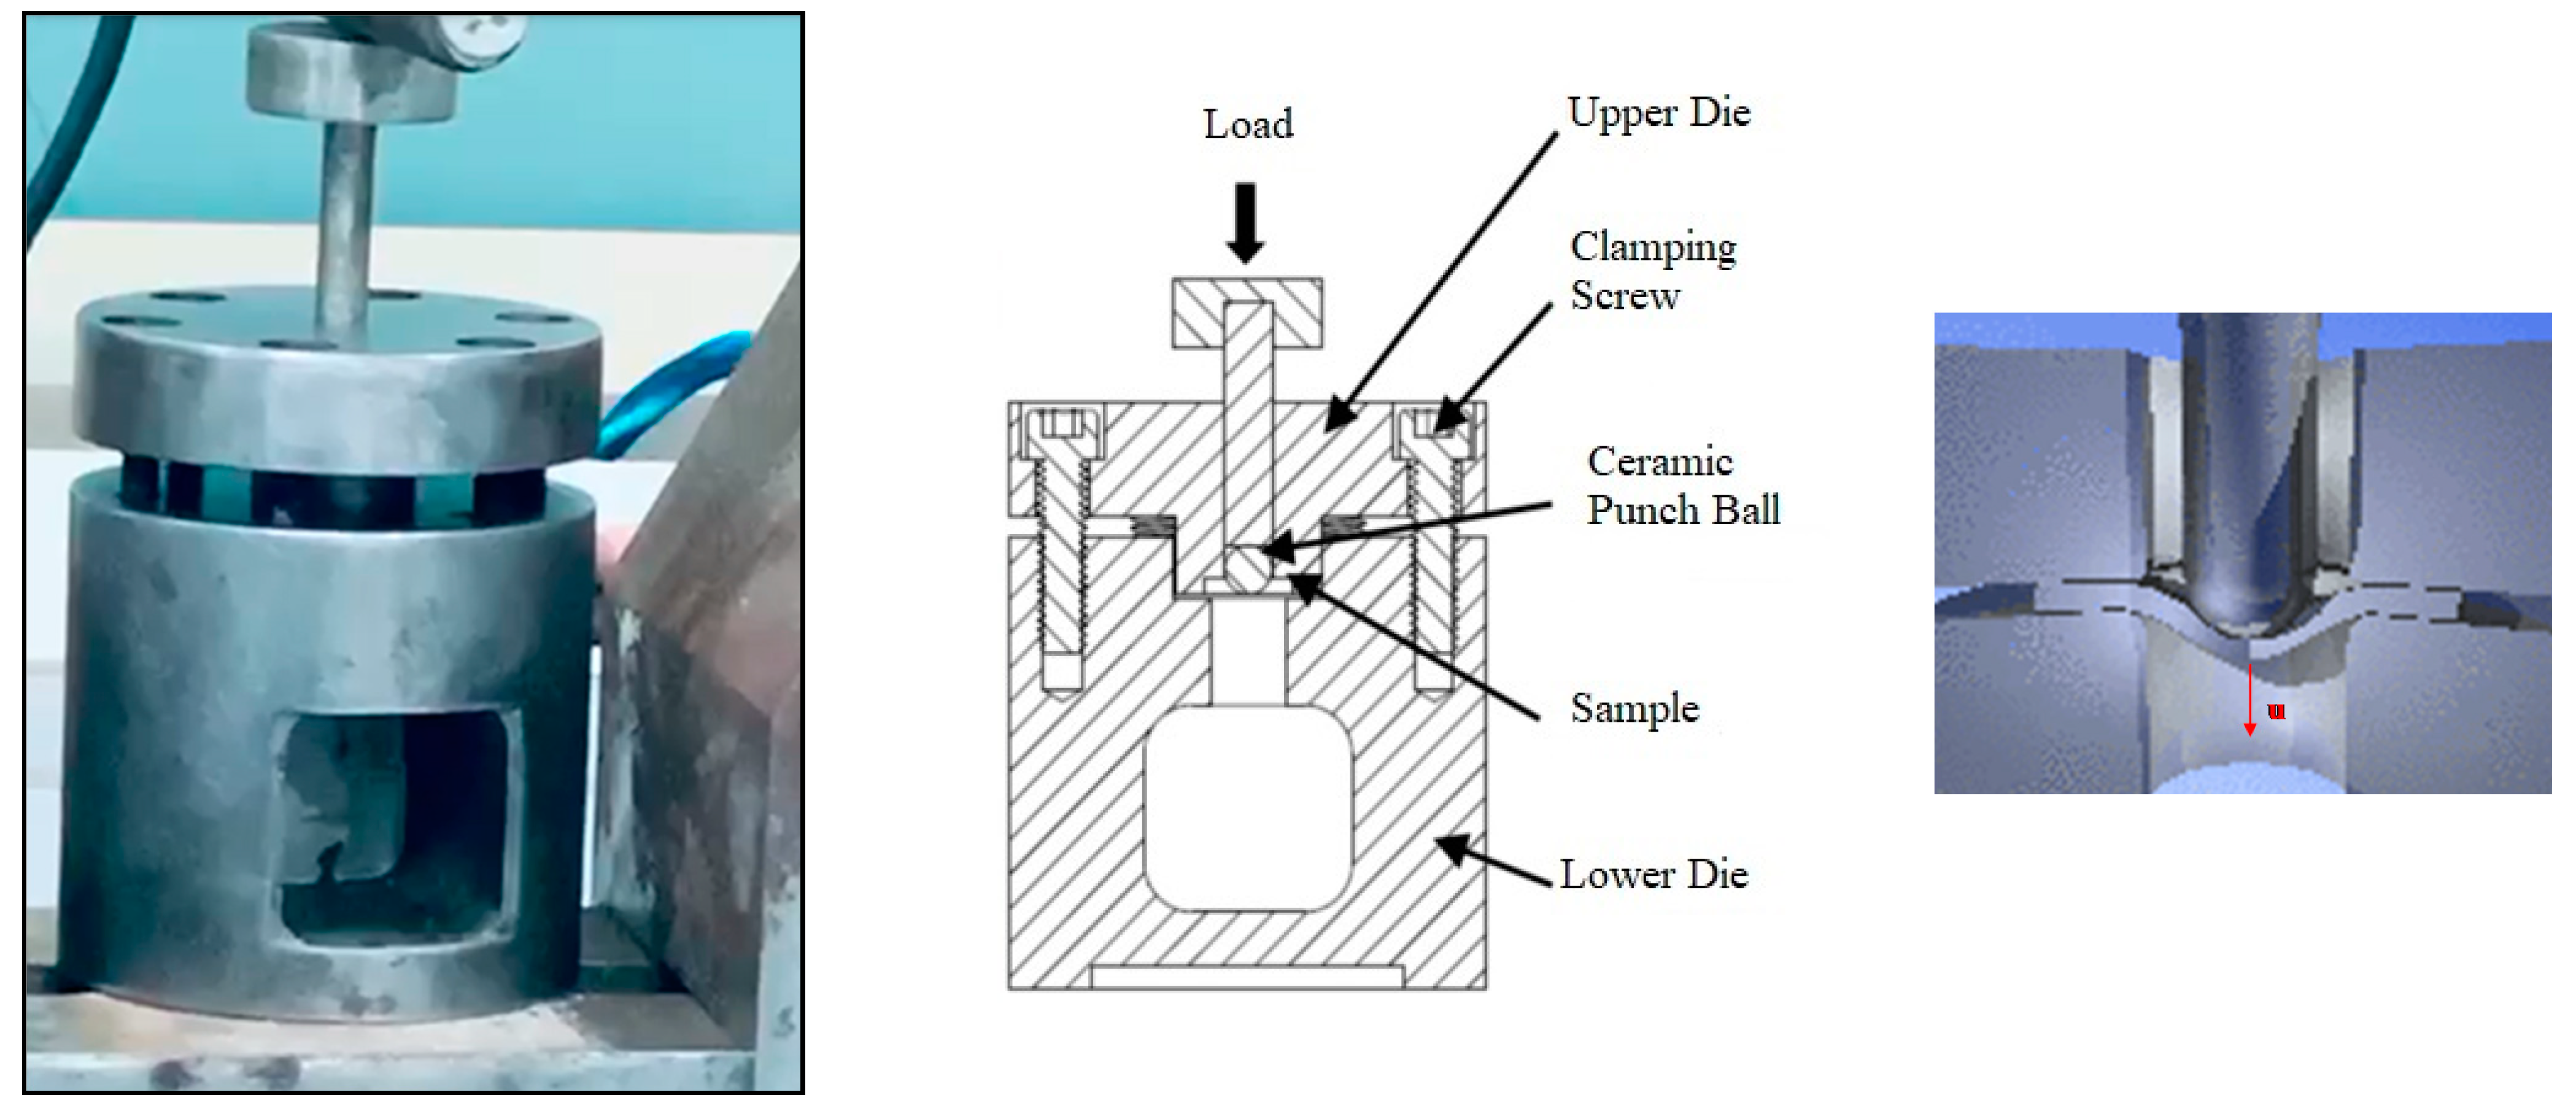
2.2.2. Small Punch Tests (SPT)
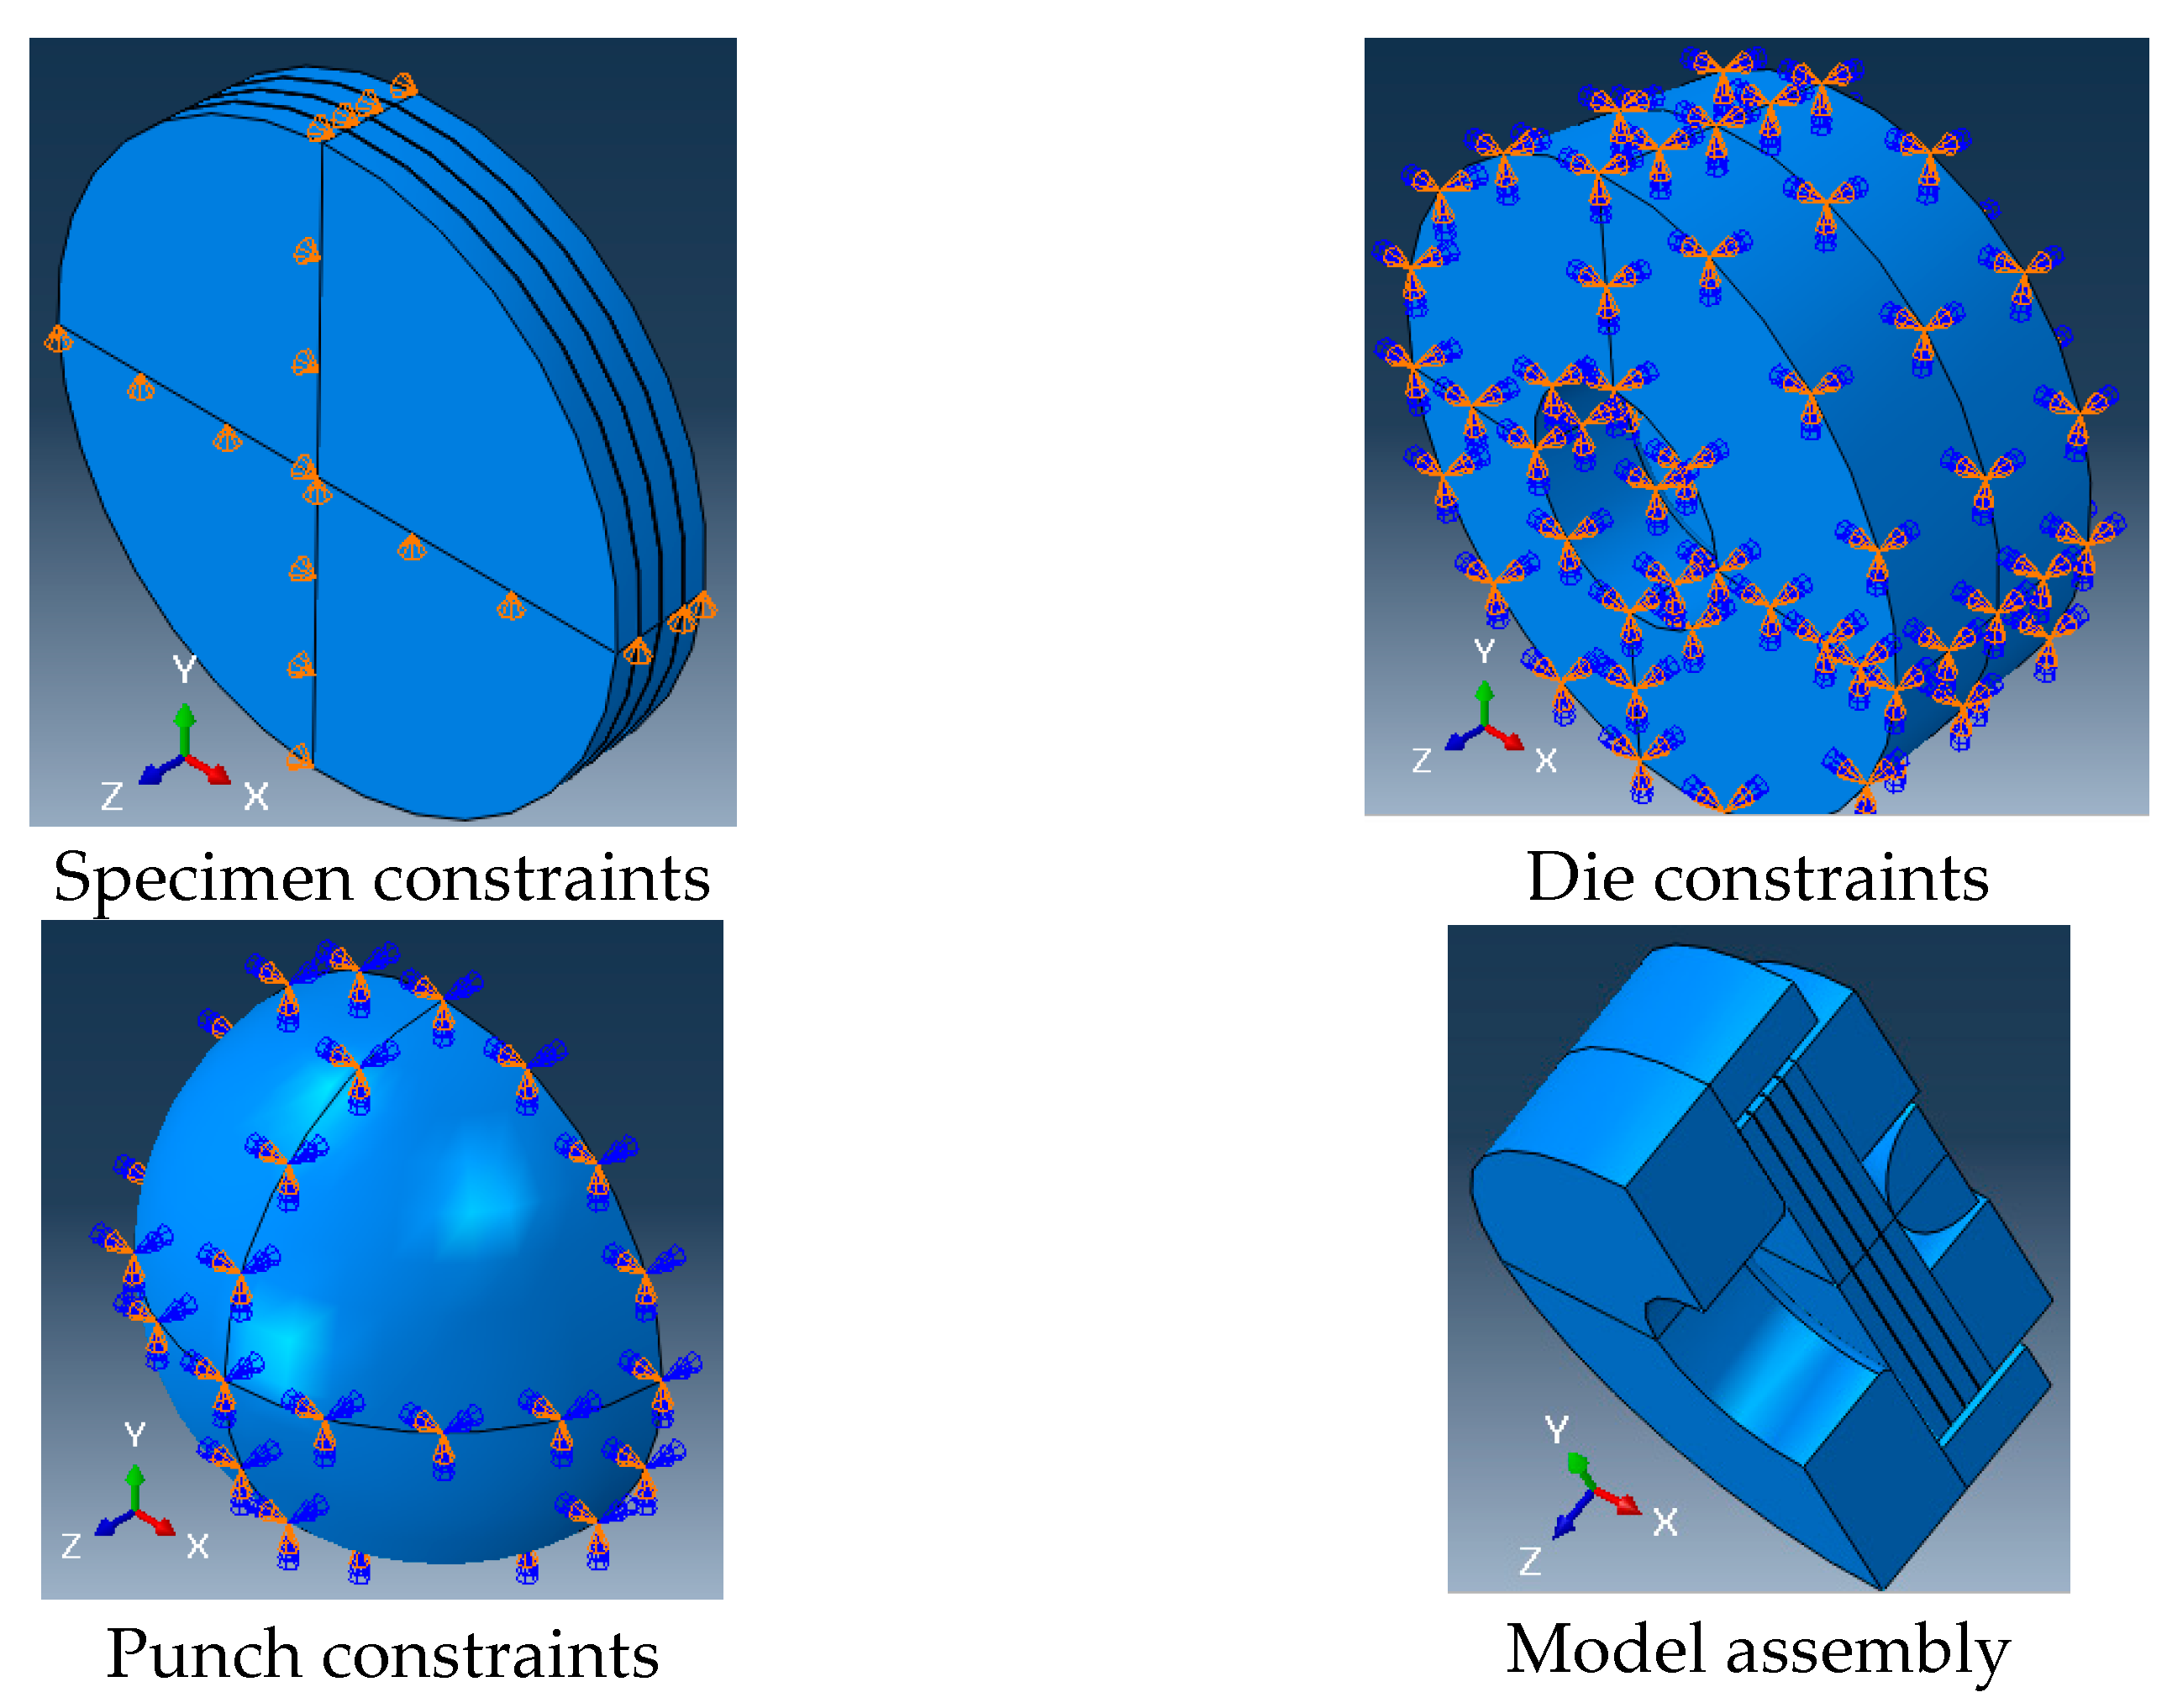
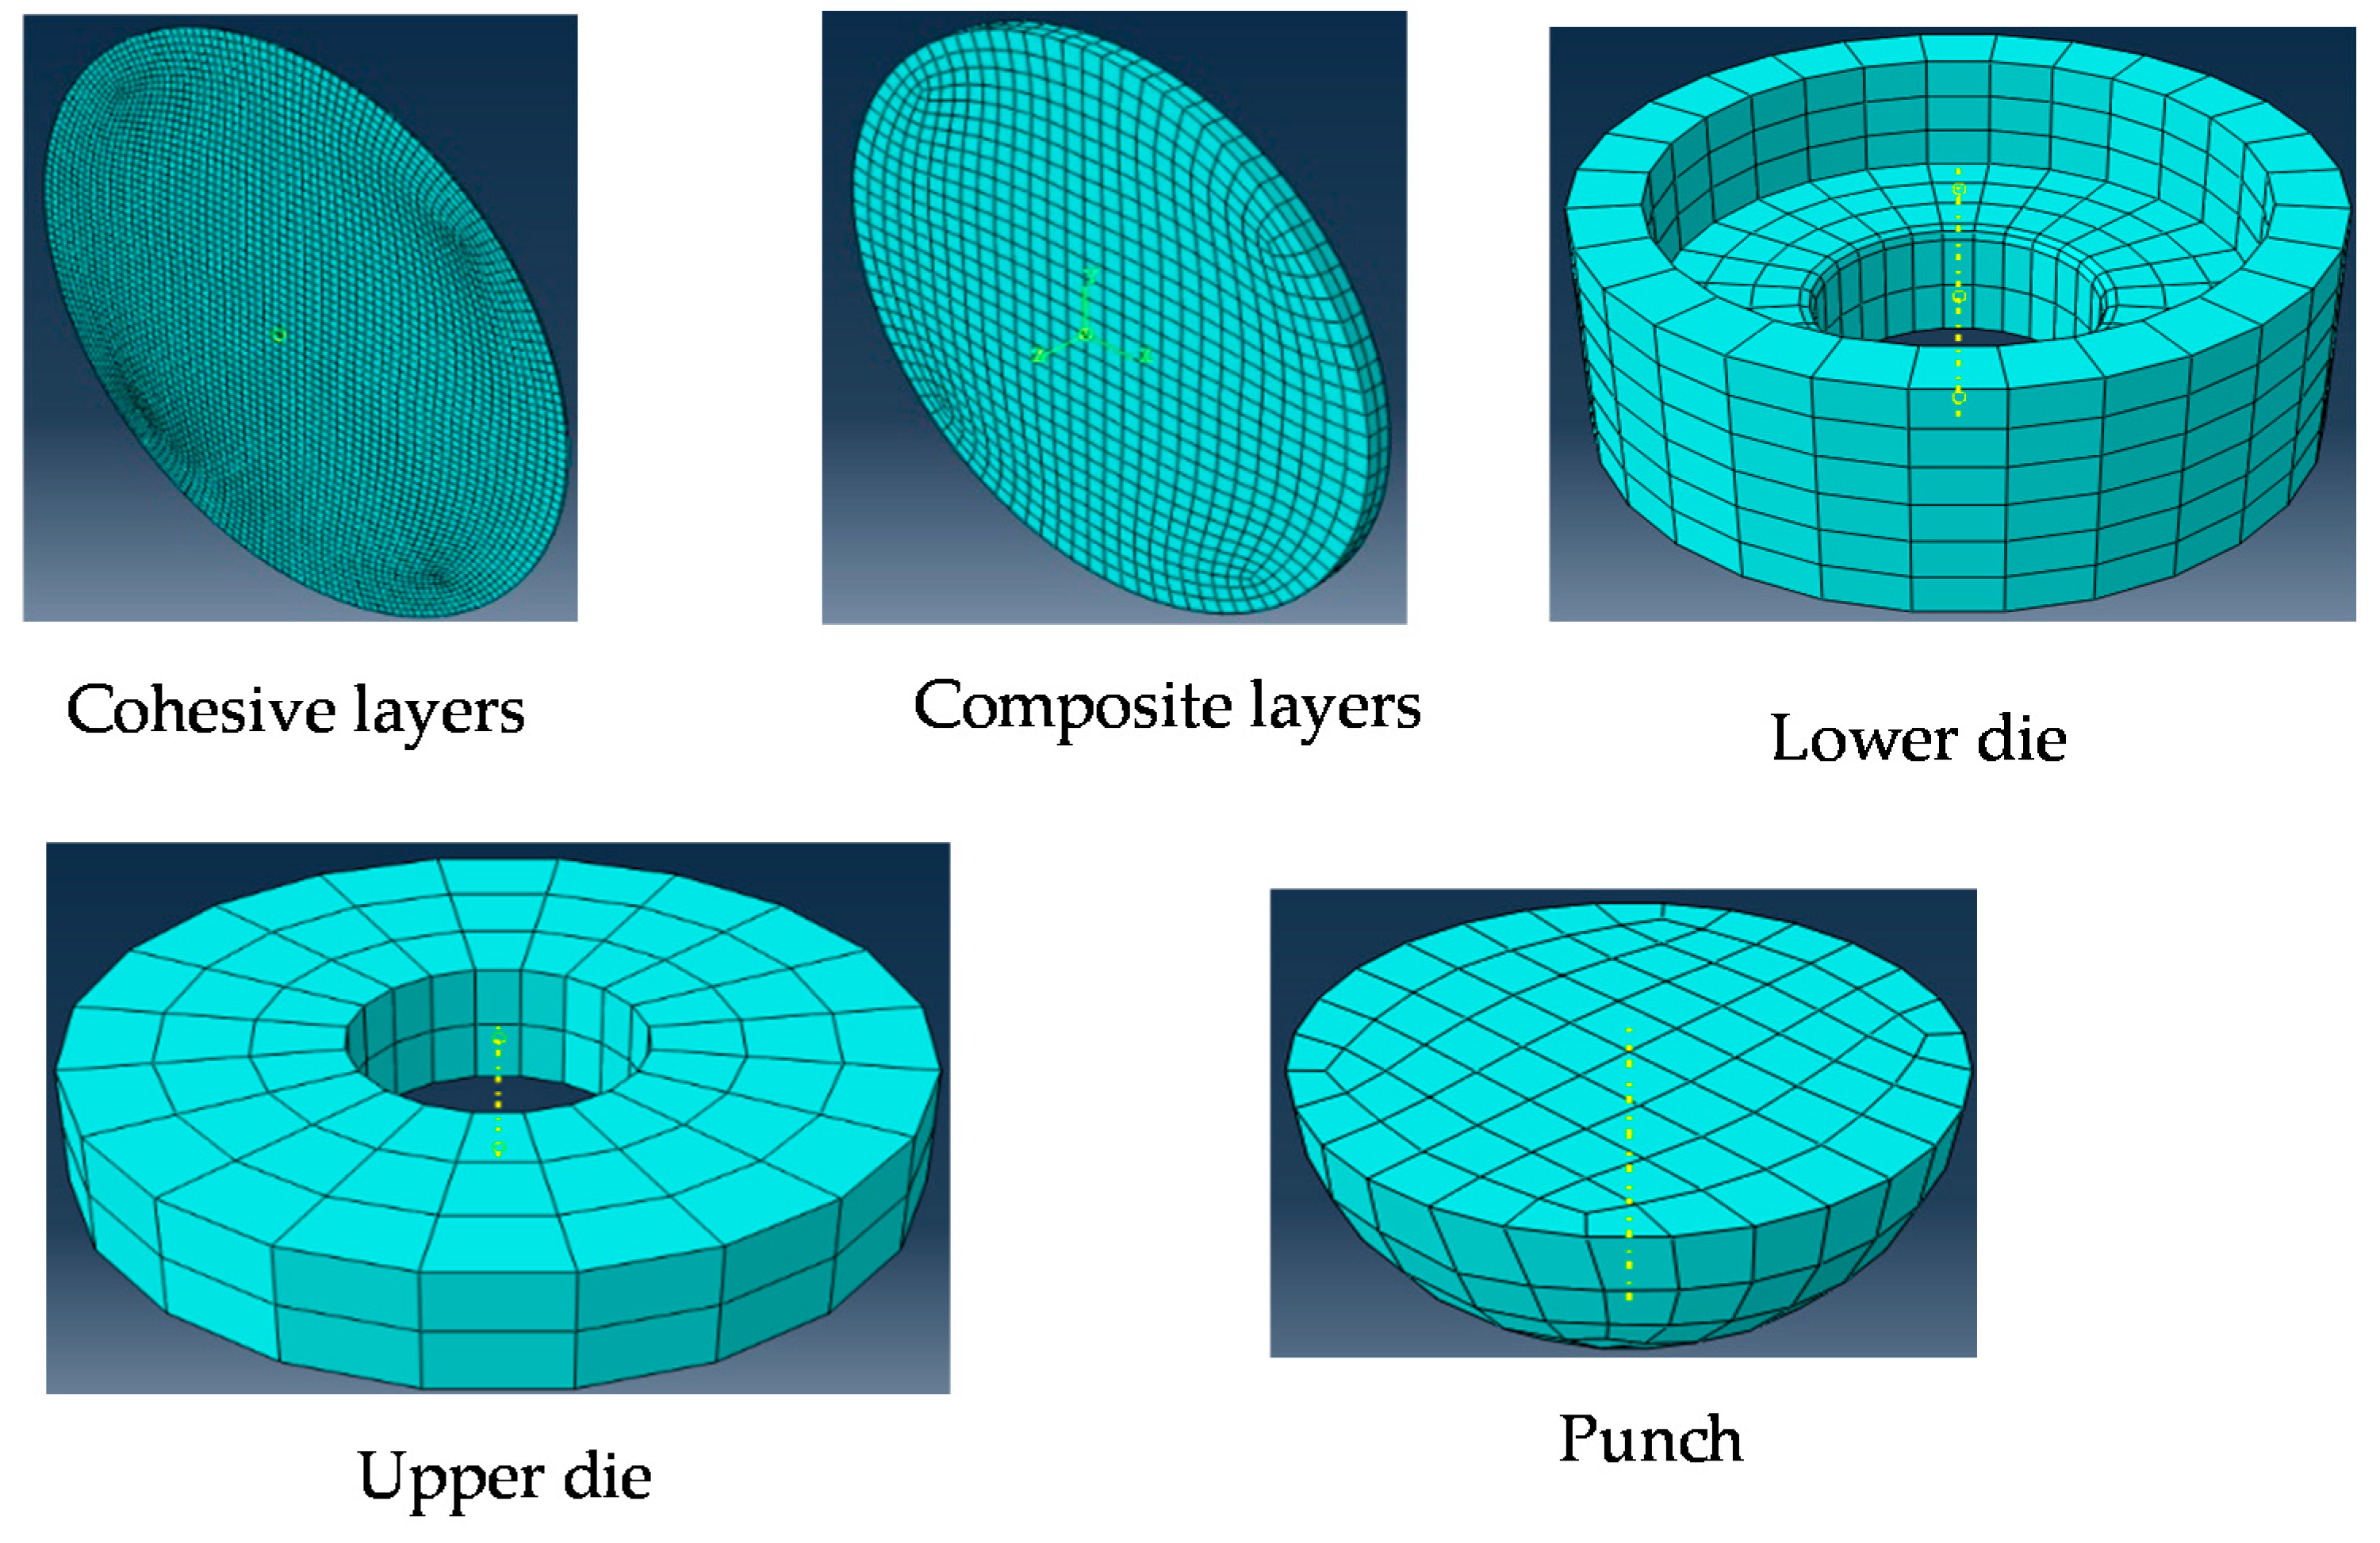
3. Finite Element Model for the SP Test
4. Results and Discussion
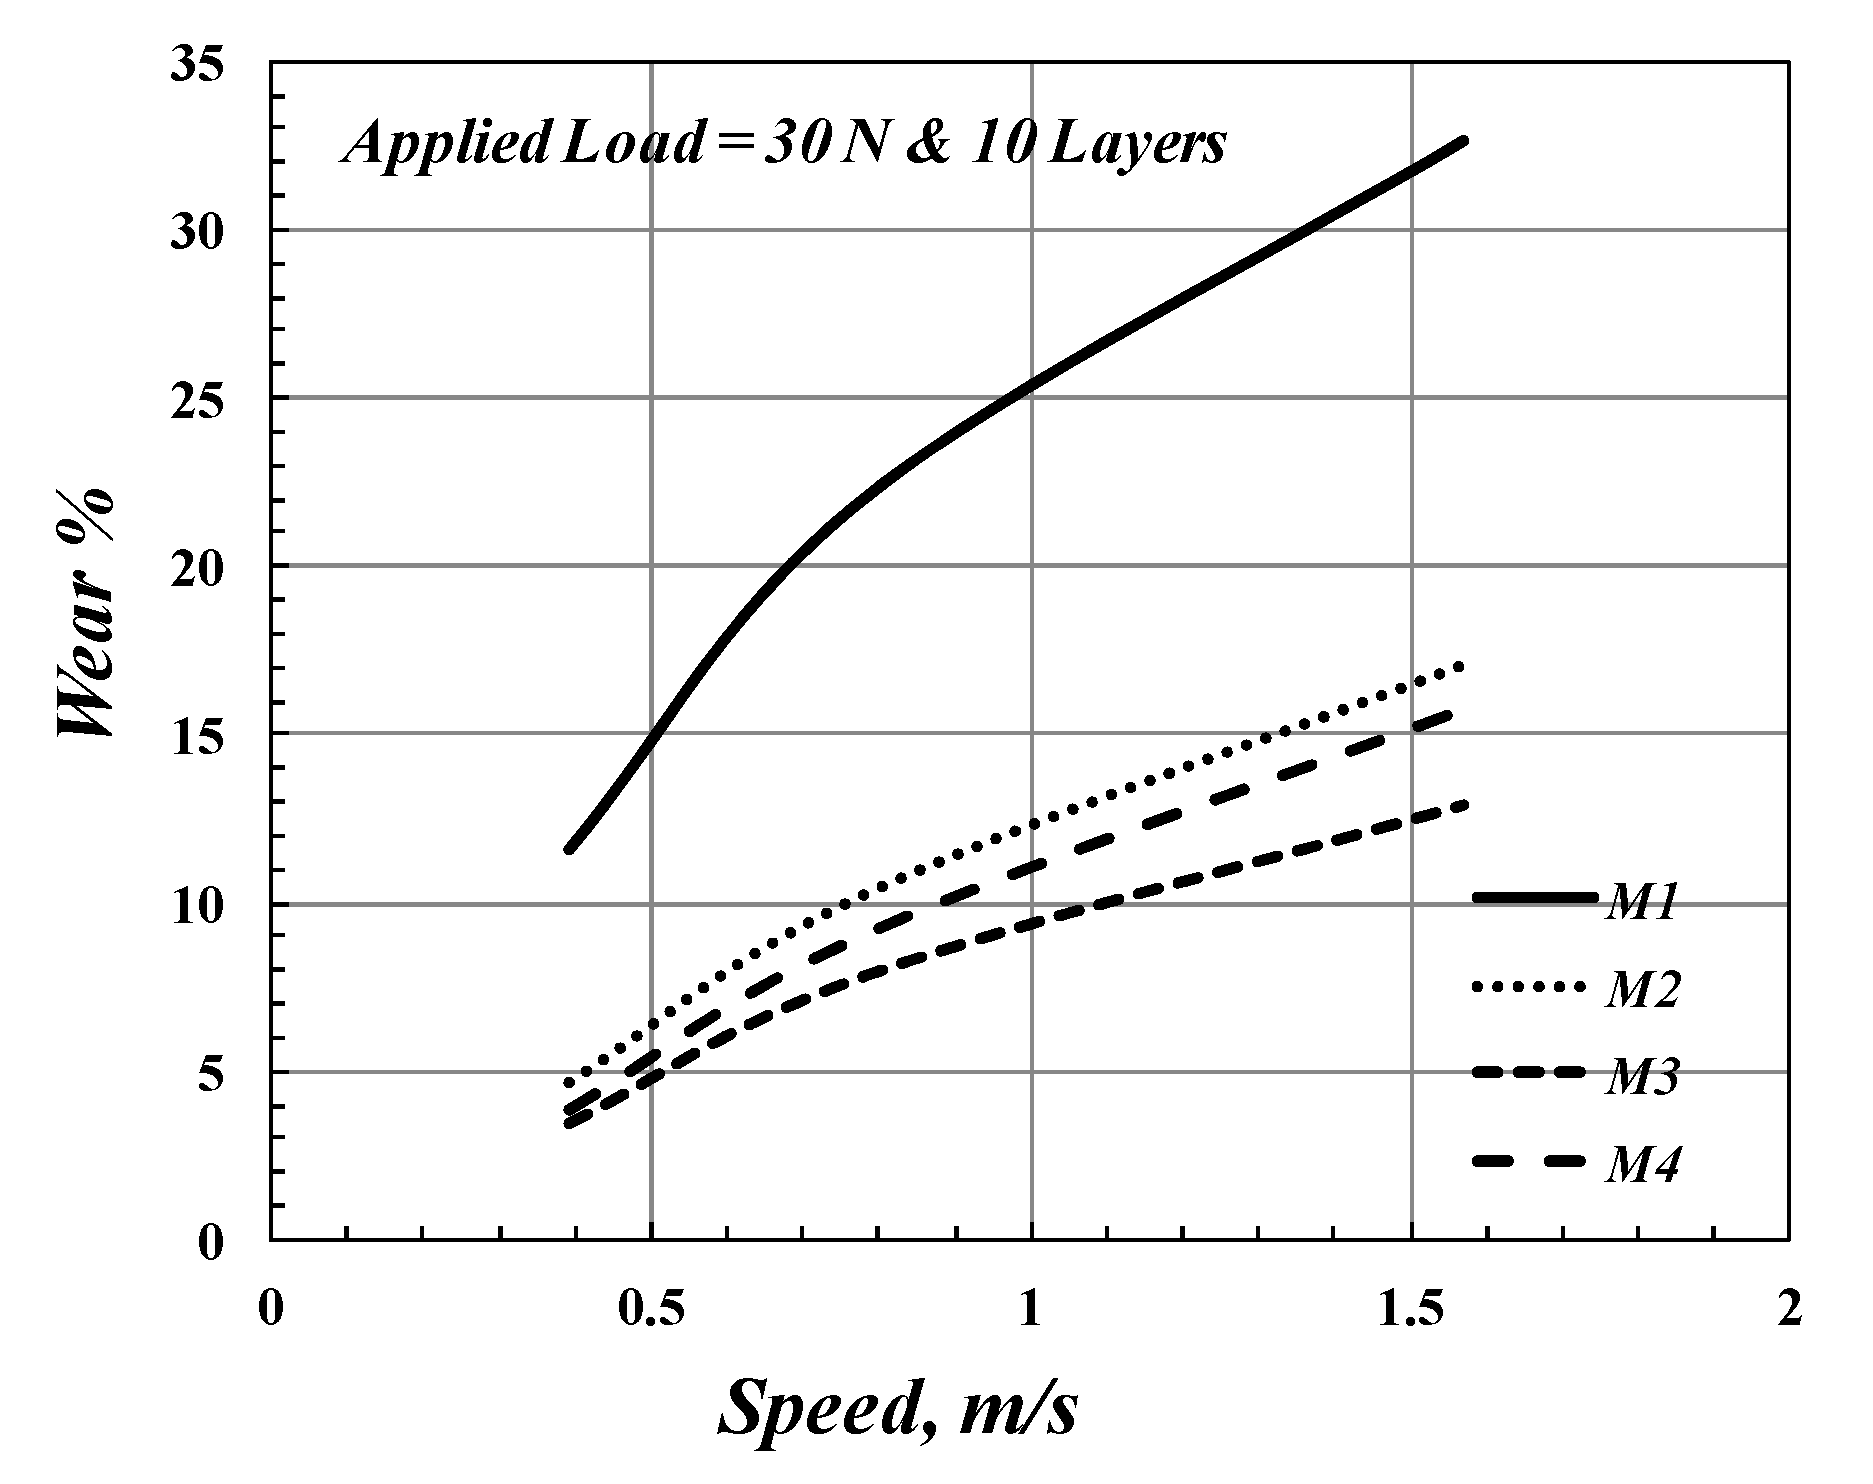
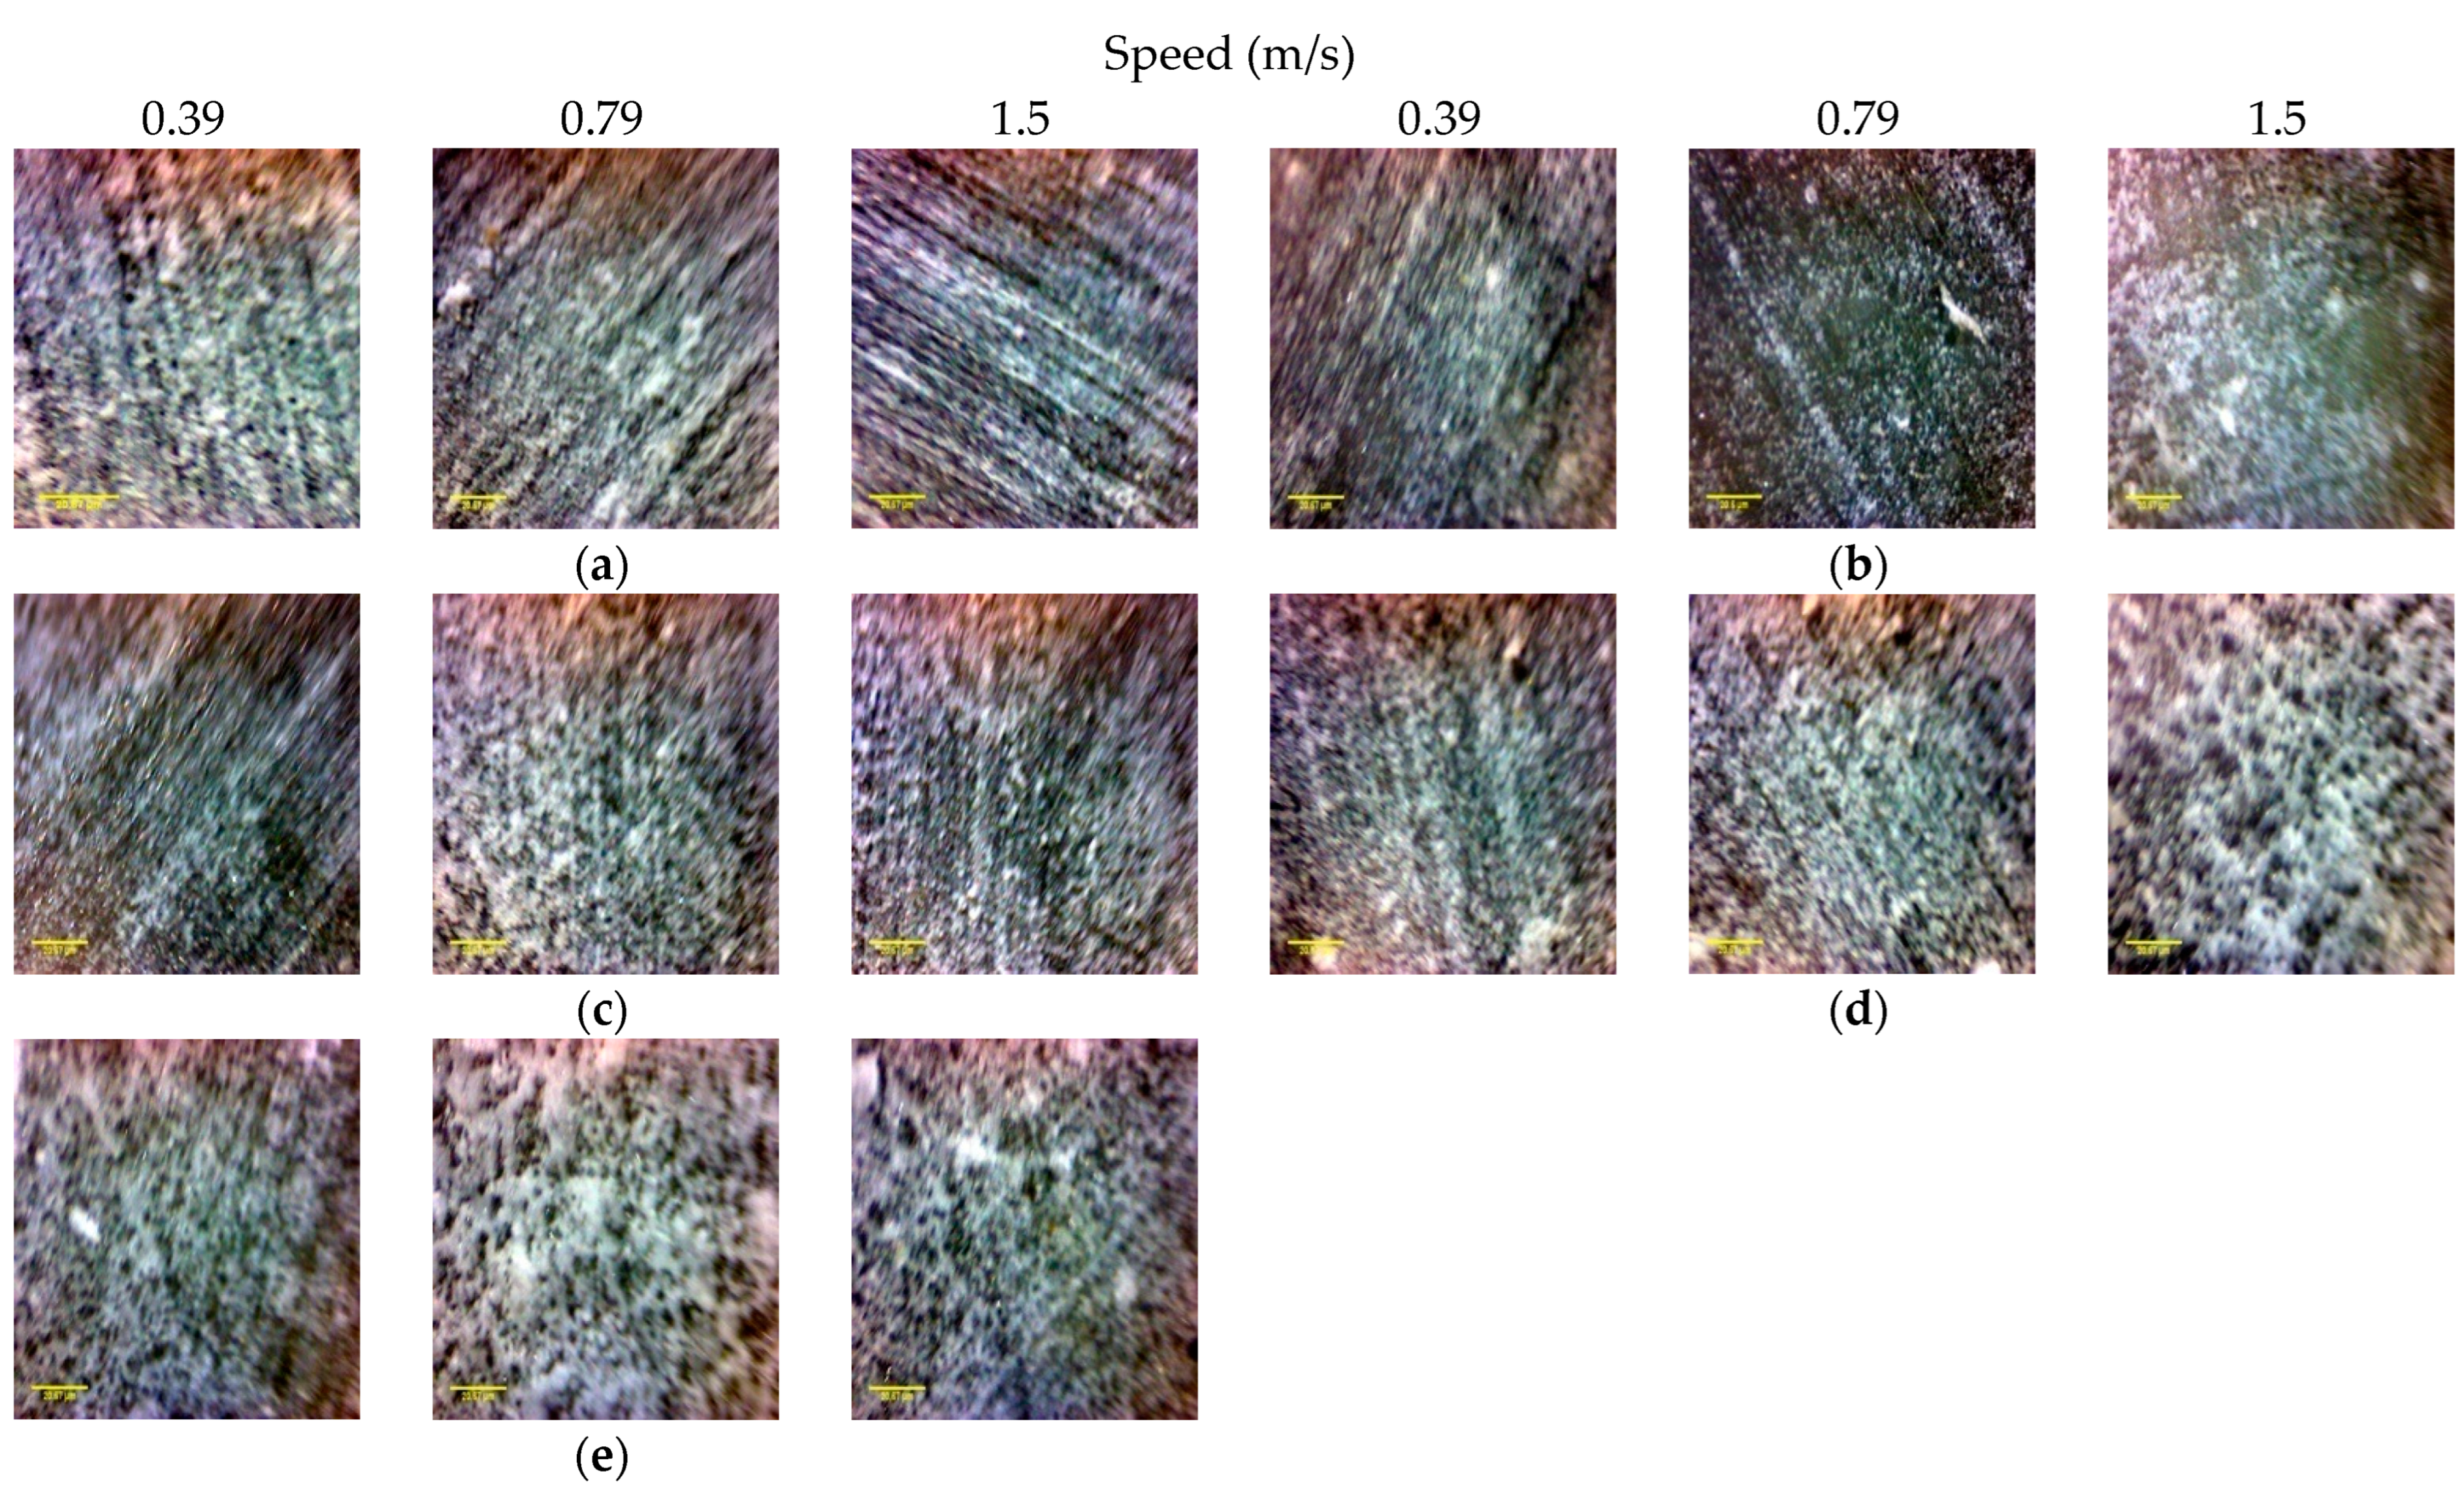
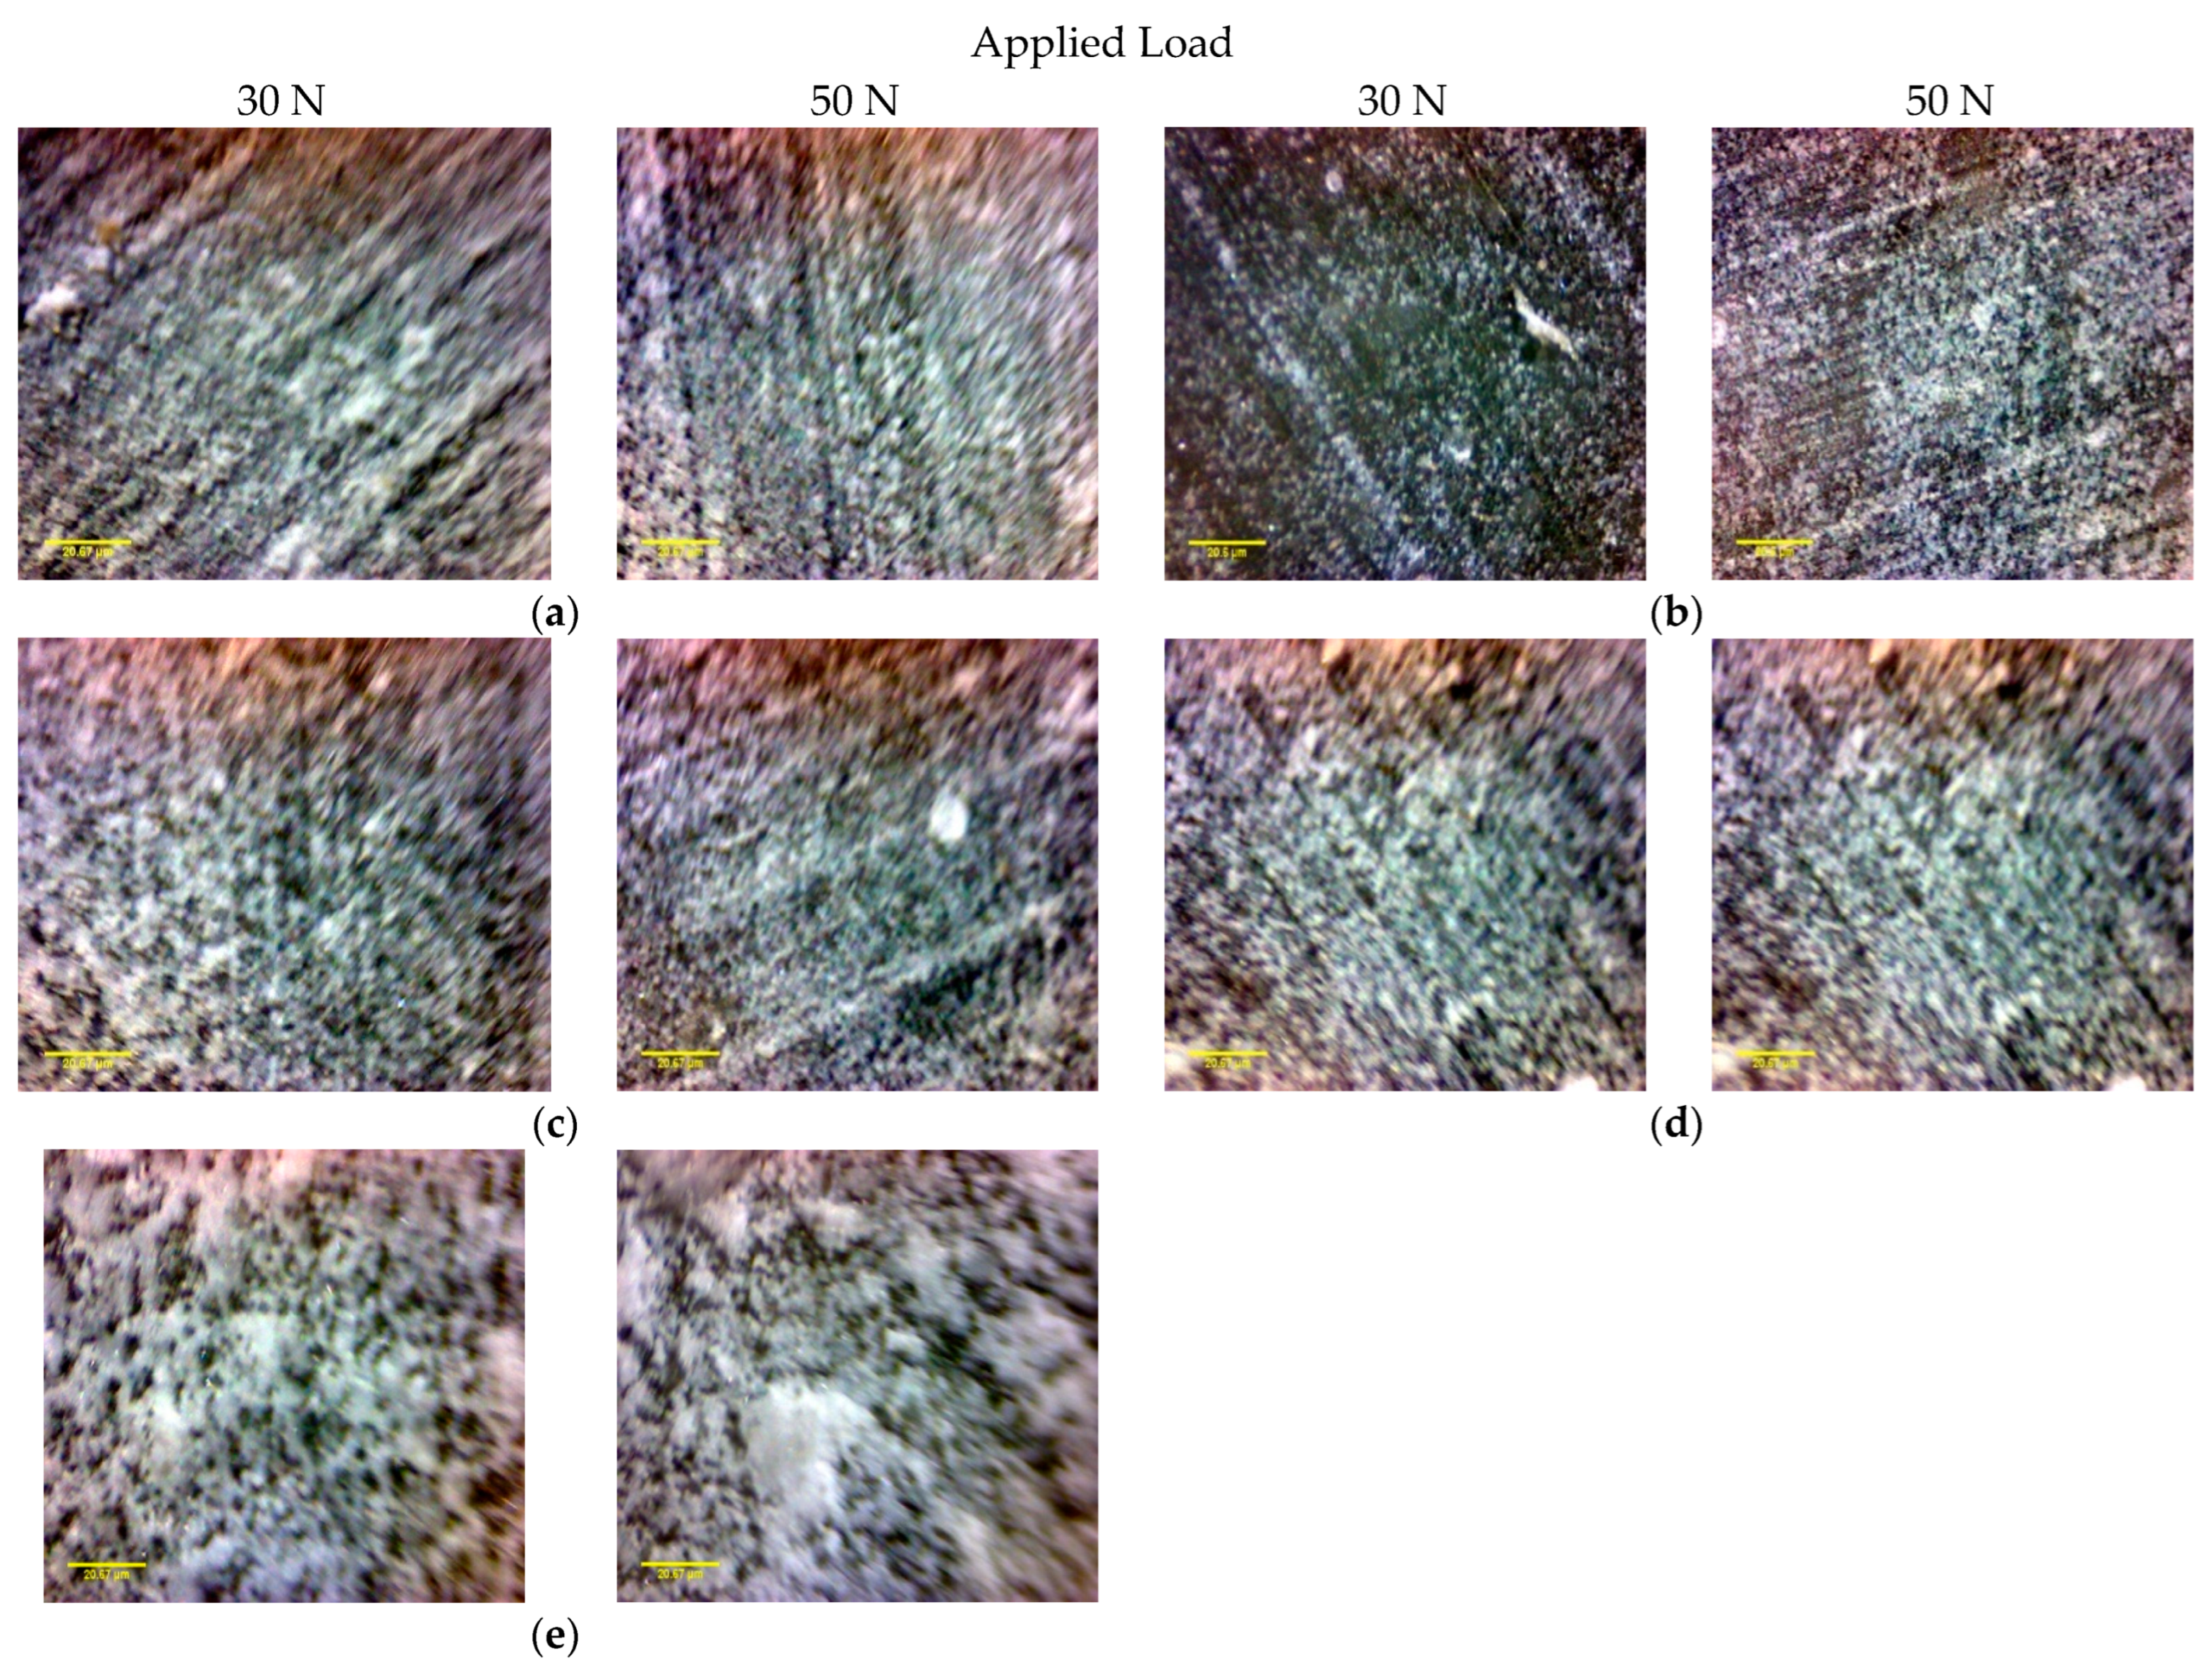
4.1. Wear Results
4.2. SPT Results
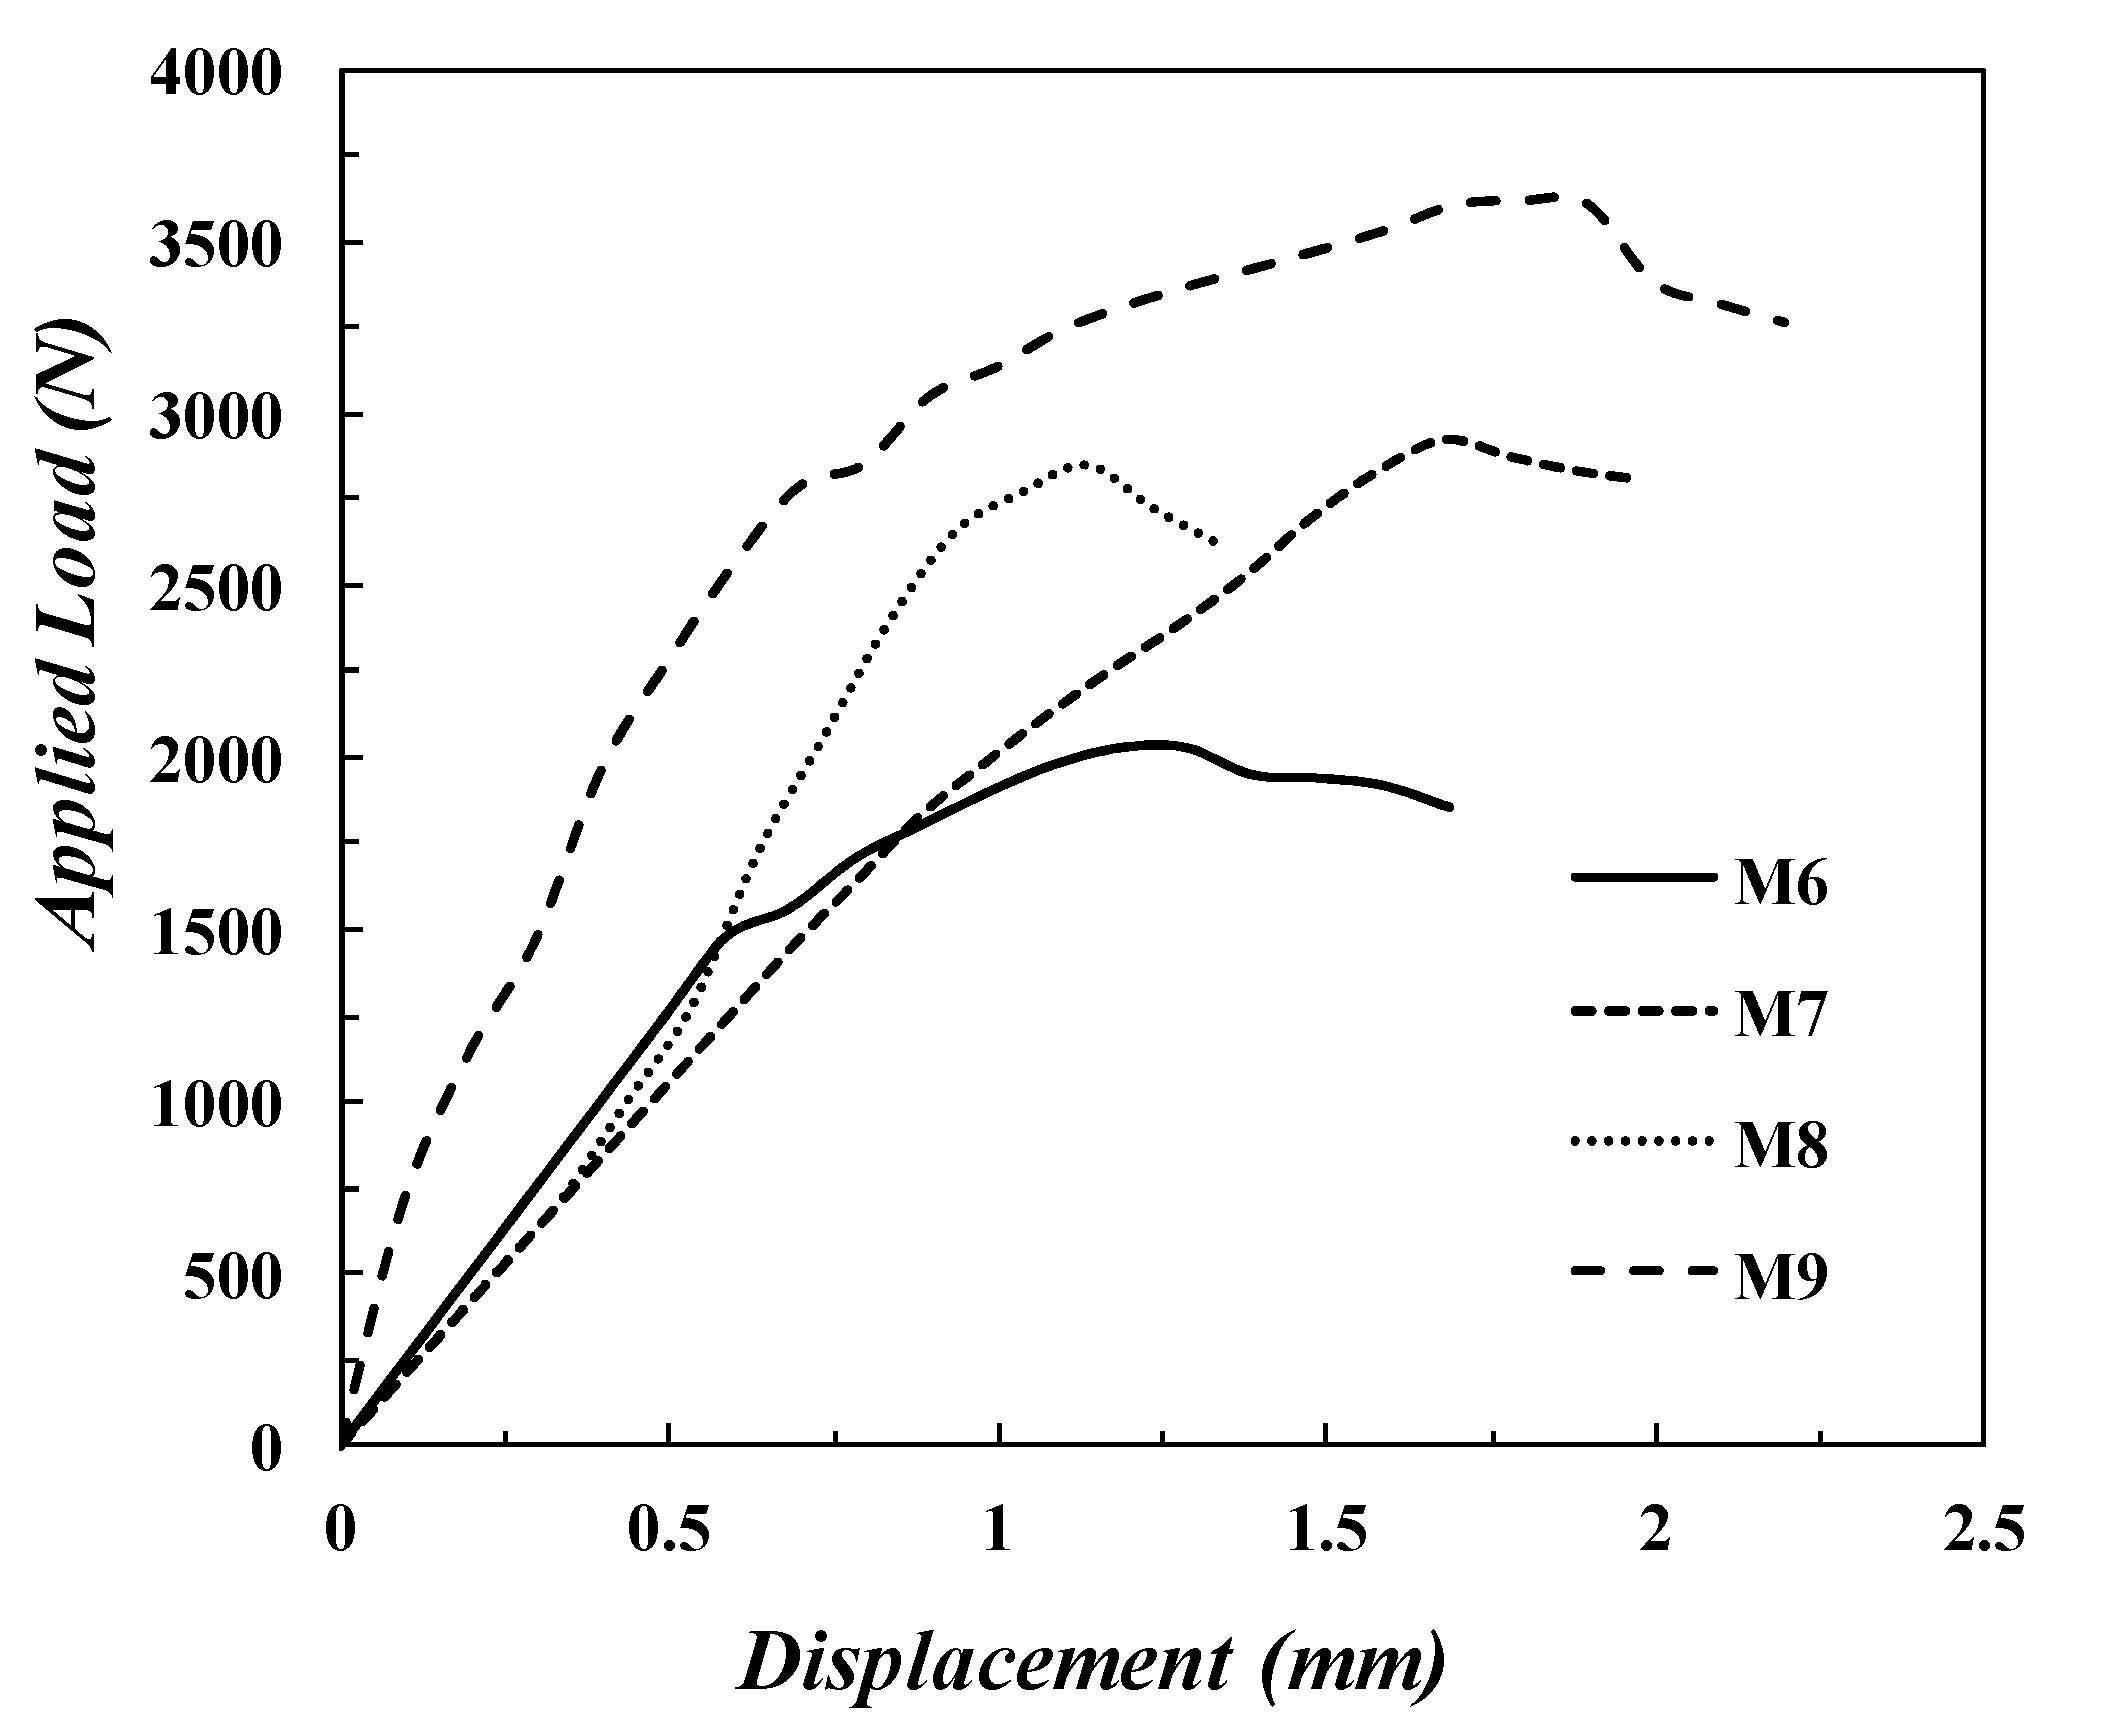
4.2.1. Experimental Results
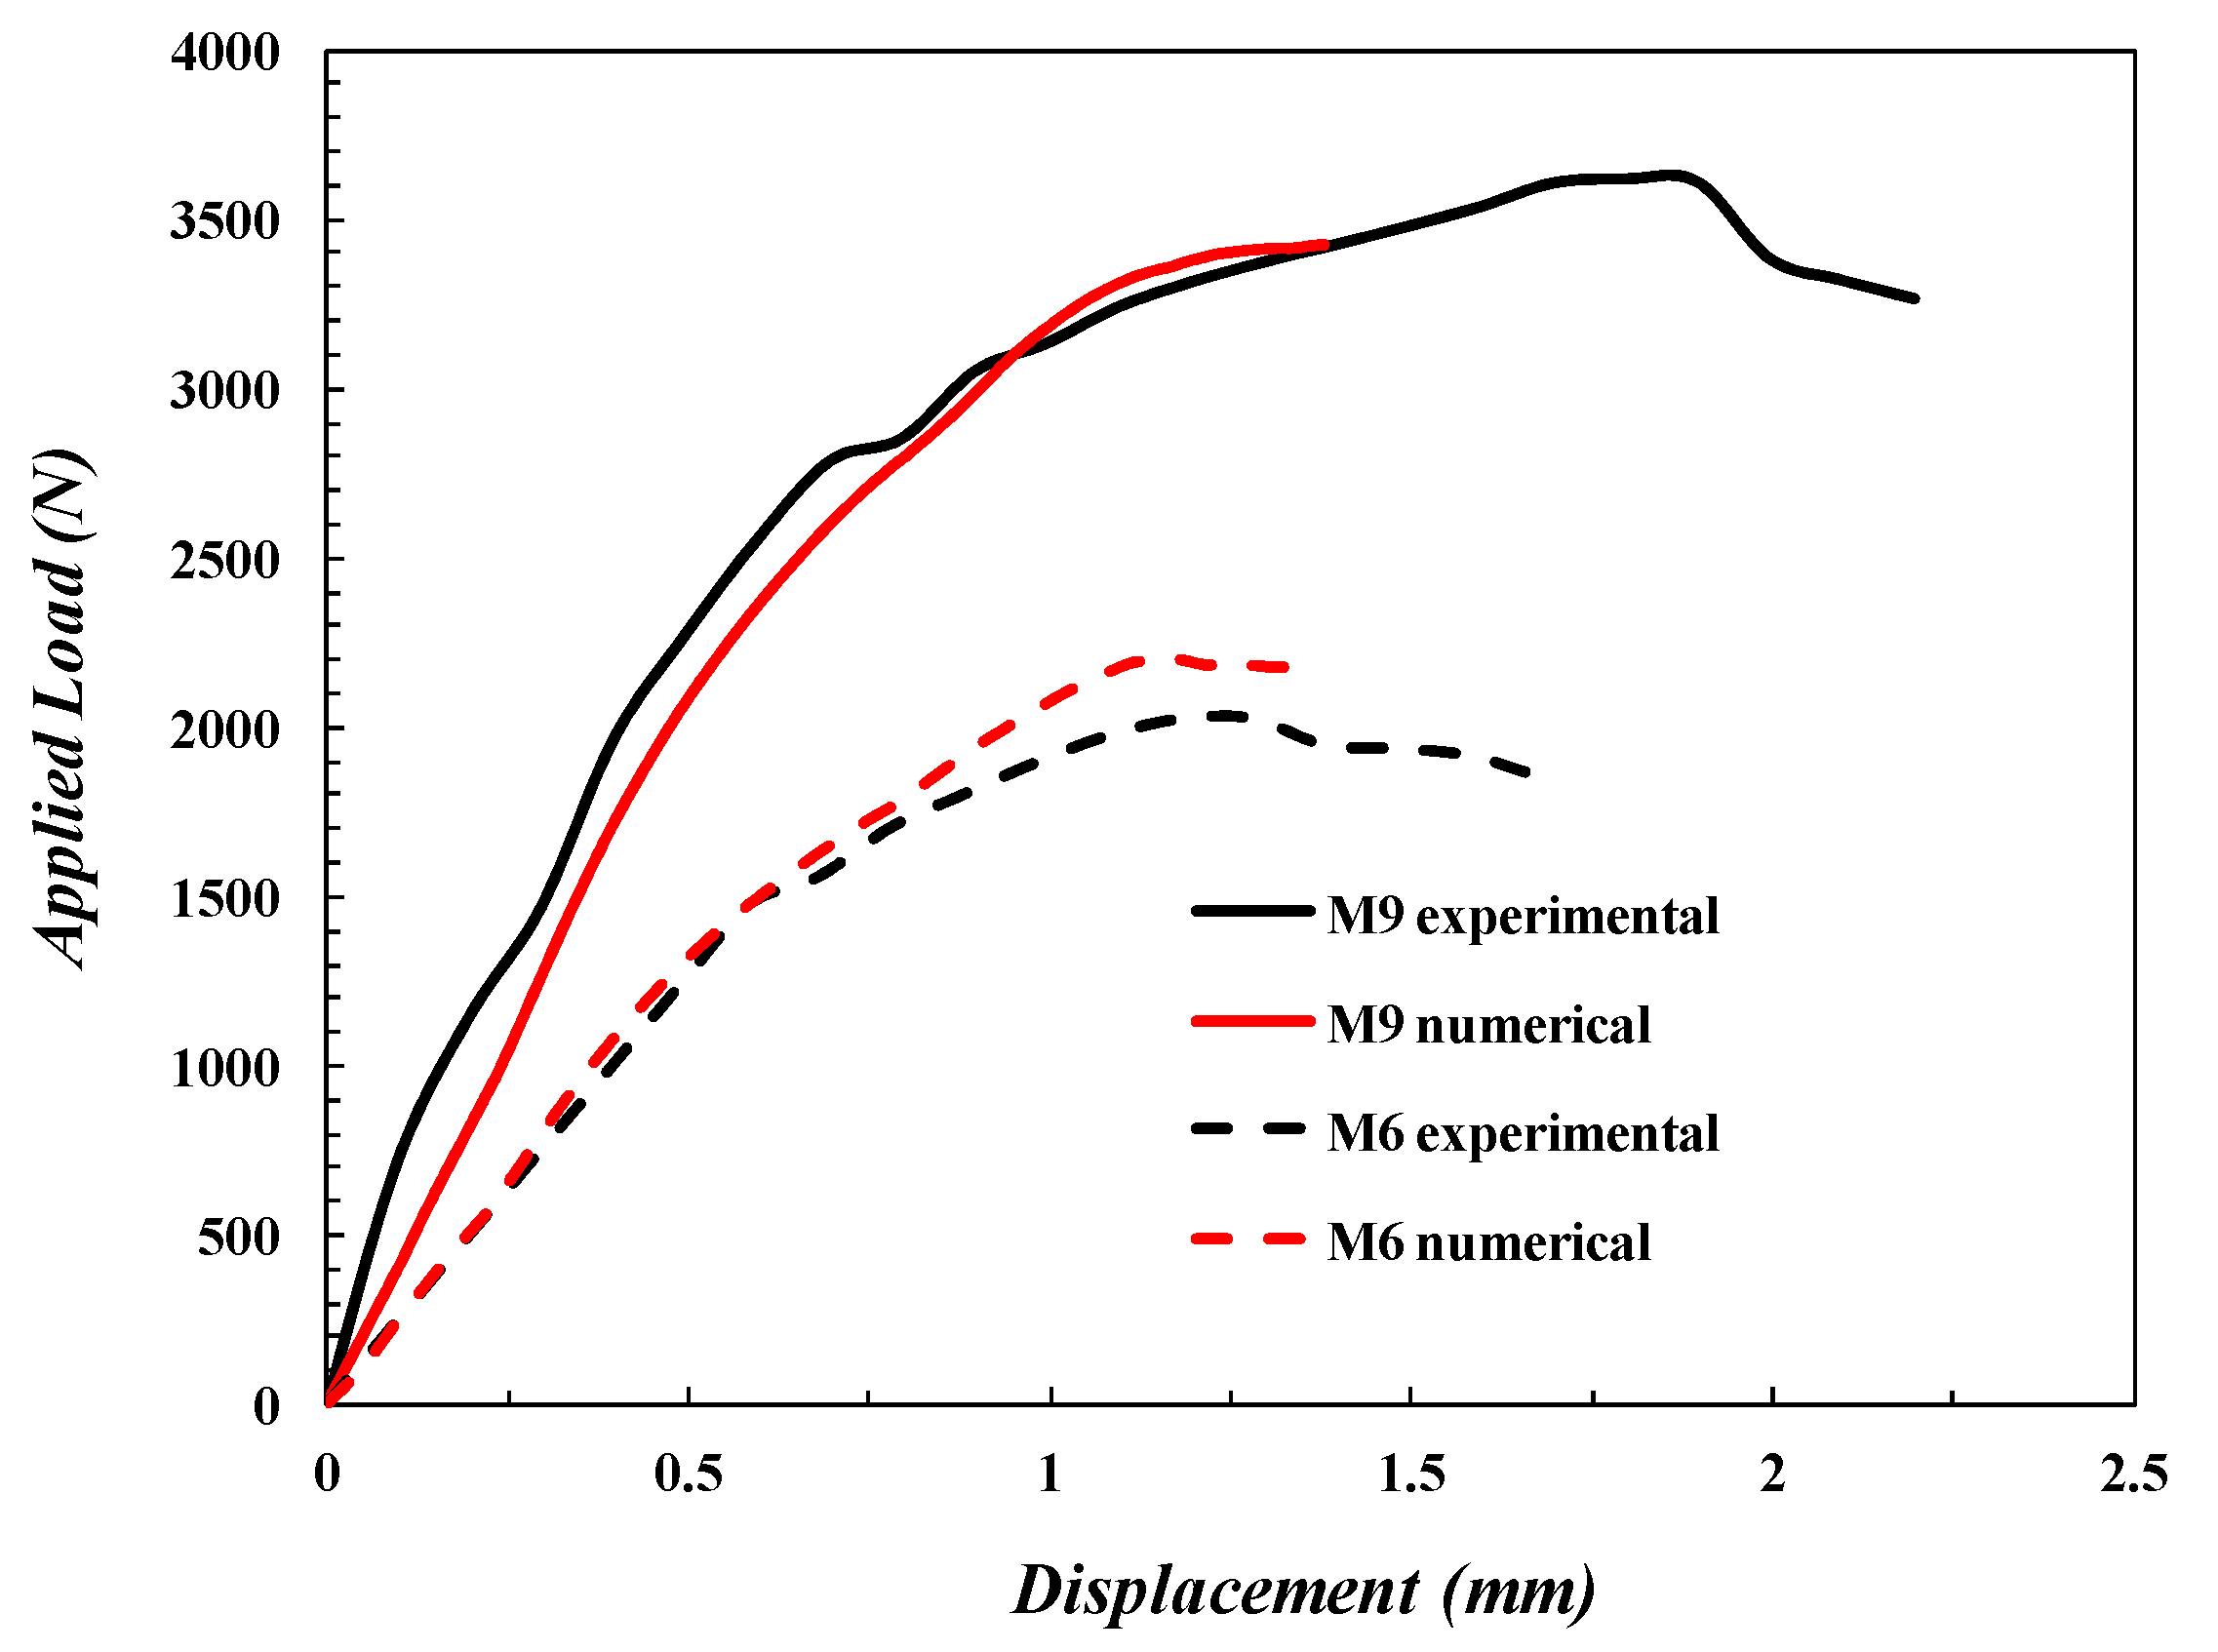
4.2.2. Numerical Results
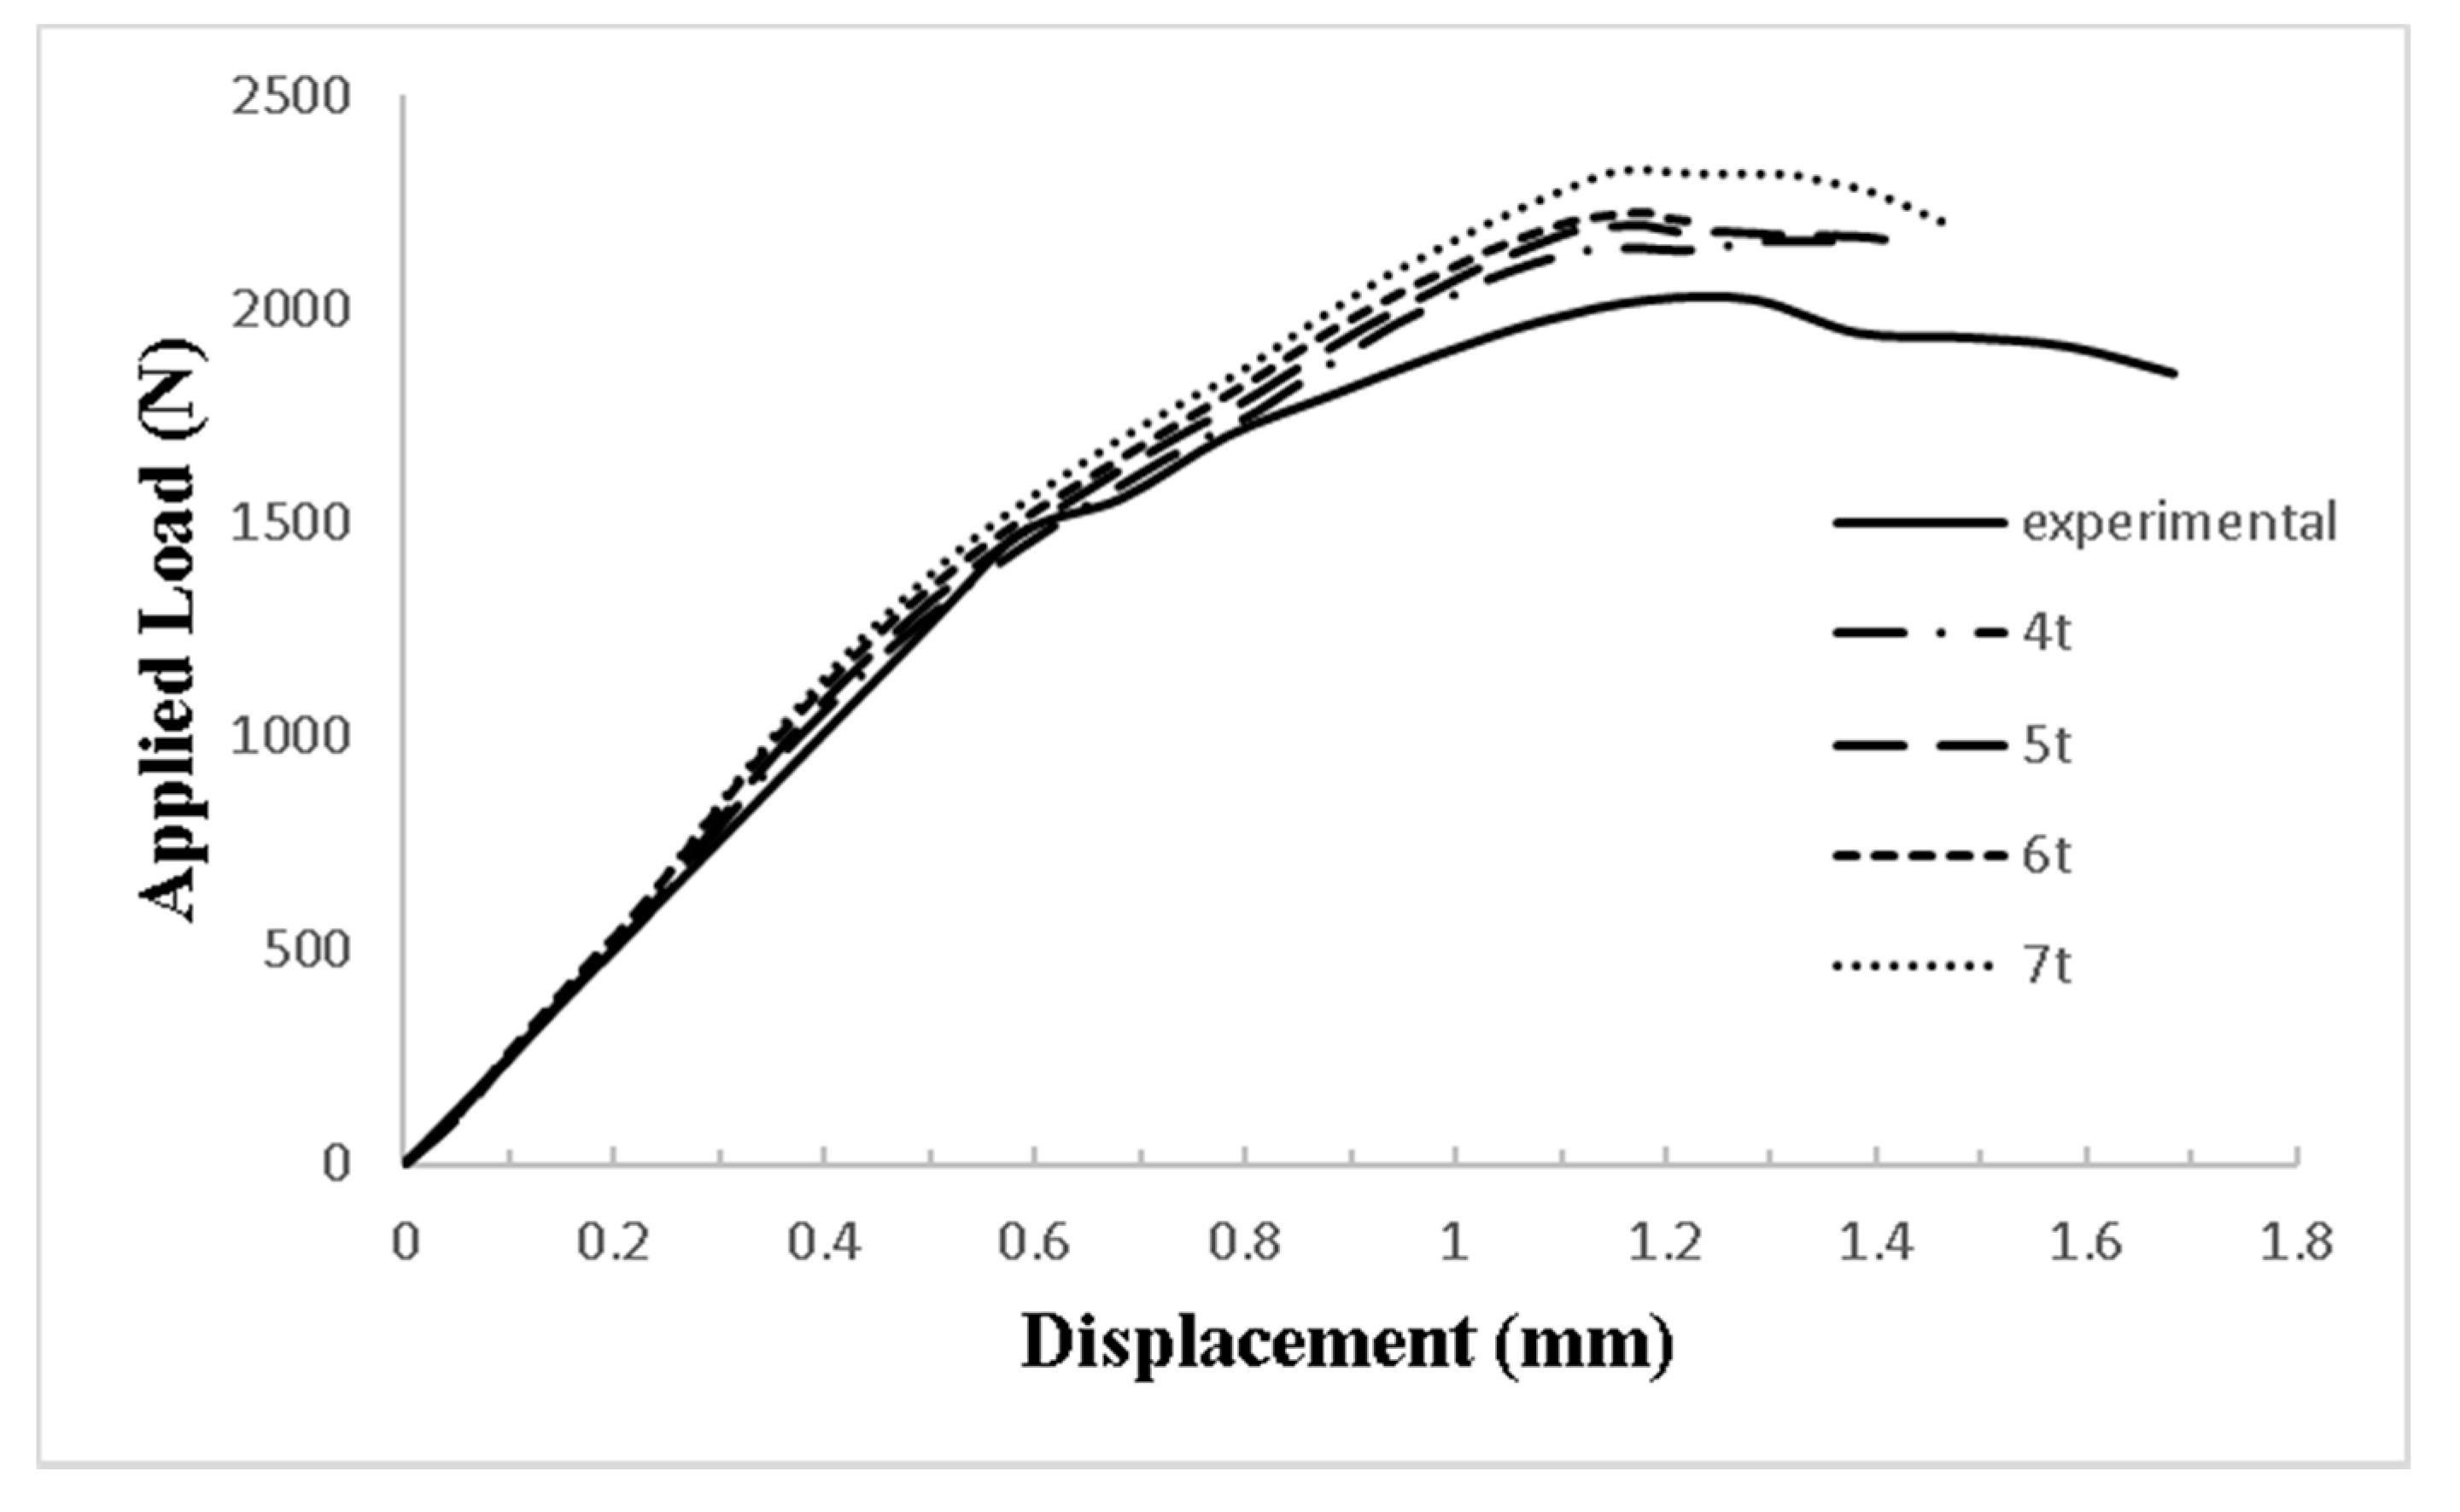
Modeling Verification
The Parametric Study
5. Conclusions
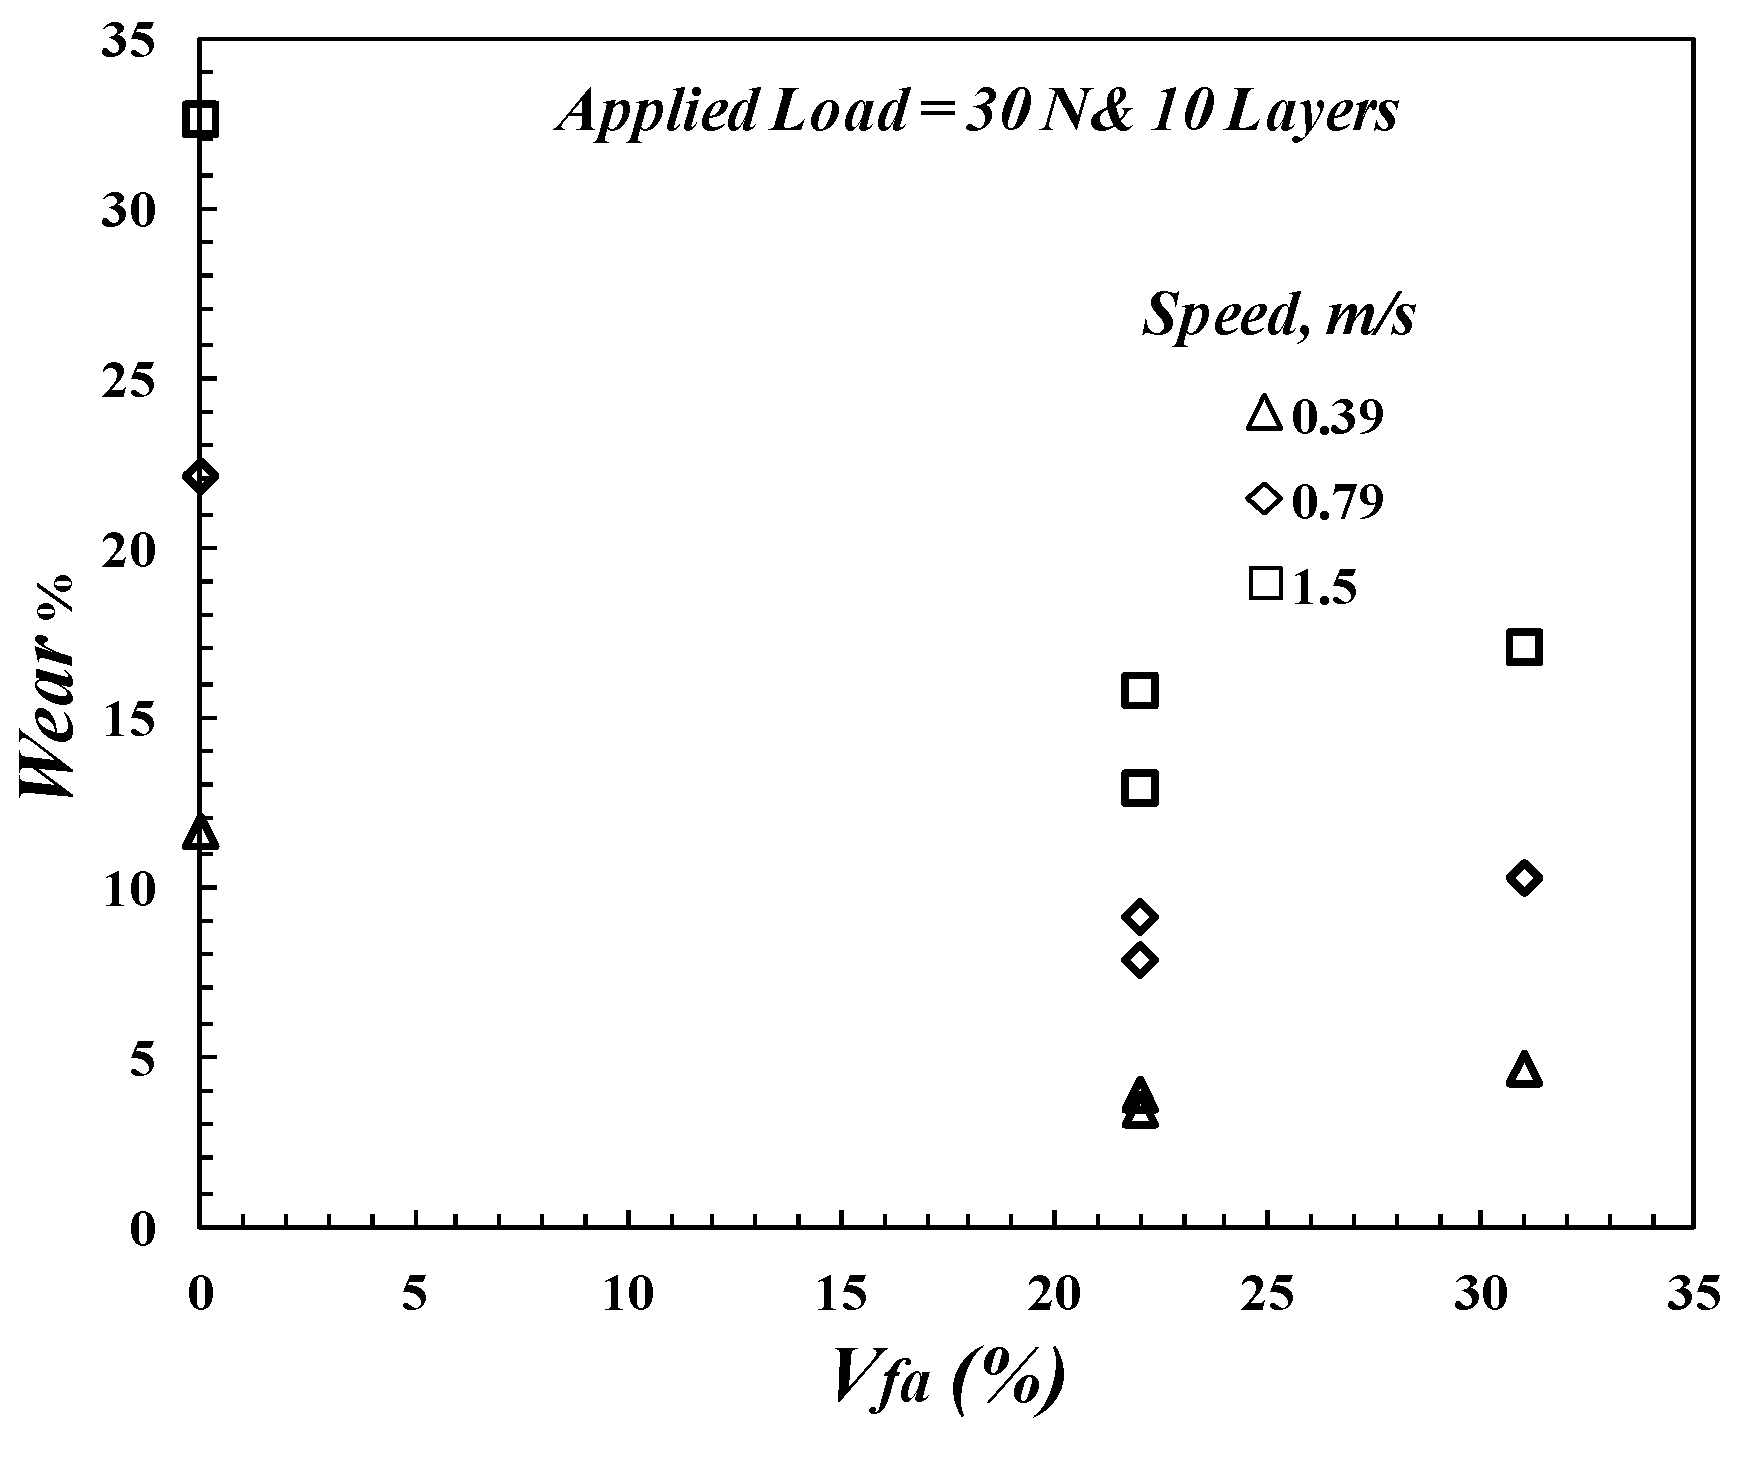
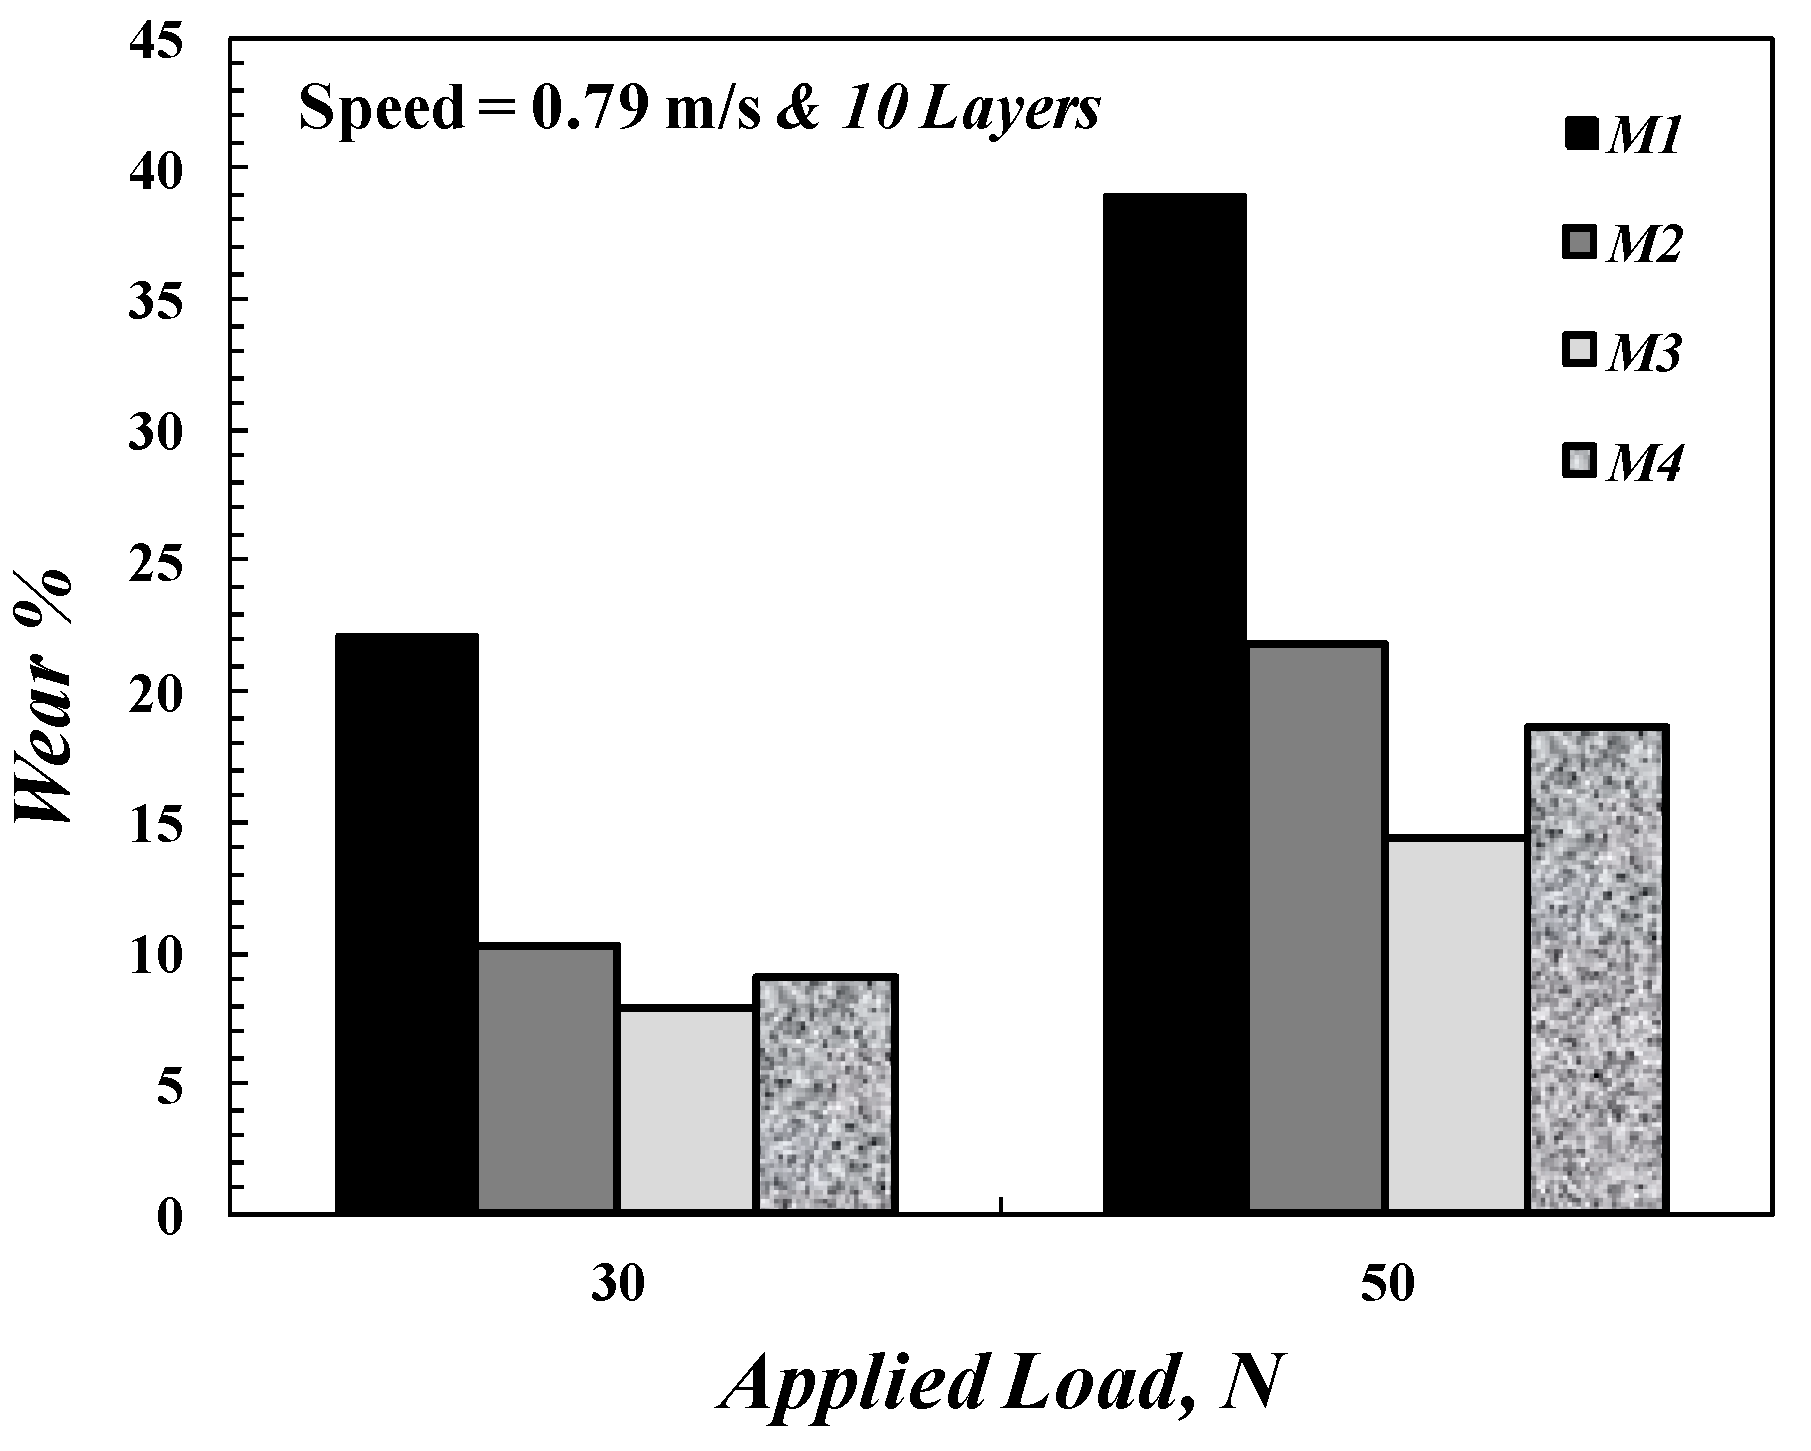
- The wear resistance of the composites increases by increasing the average fiber volume fraction up to 22%. An increase in the number of layers helps improve the wear resistance of composite materials.
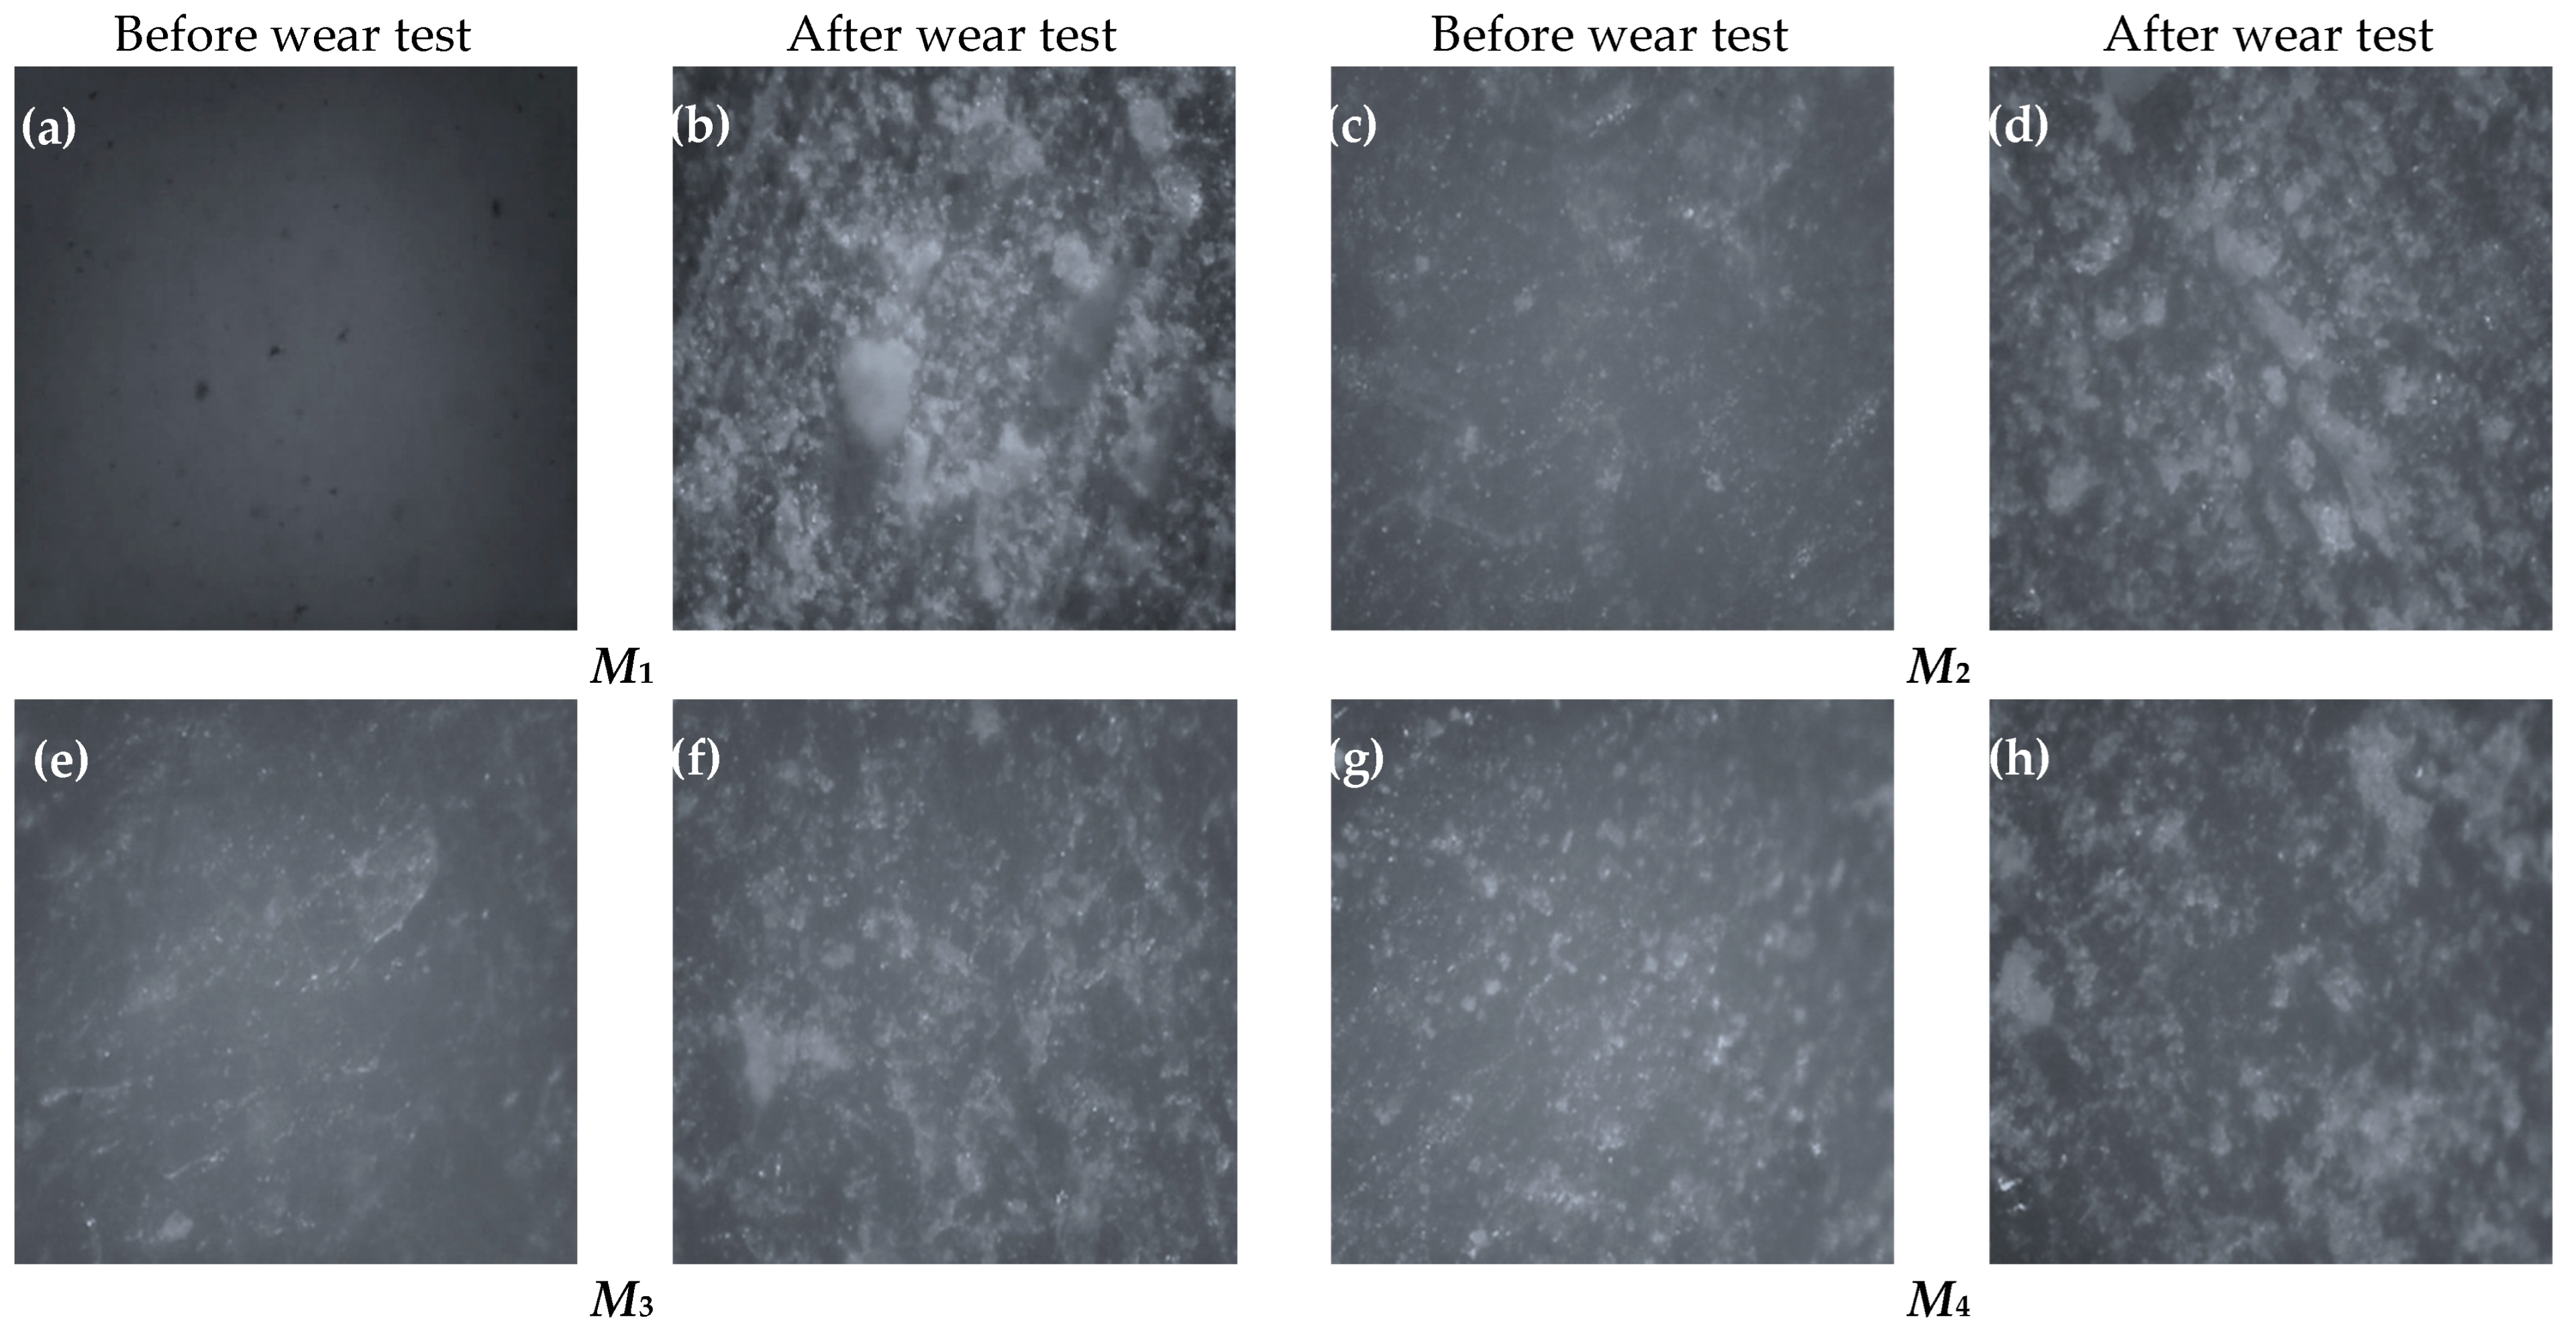
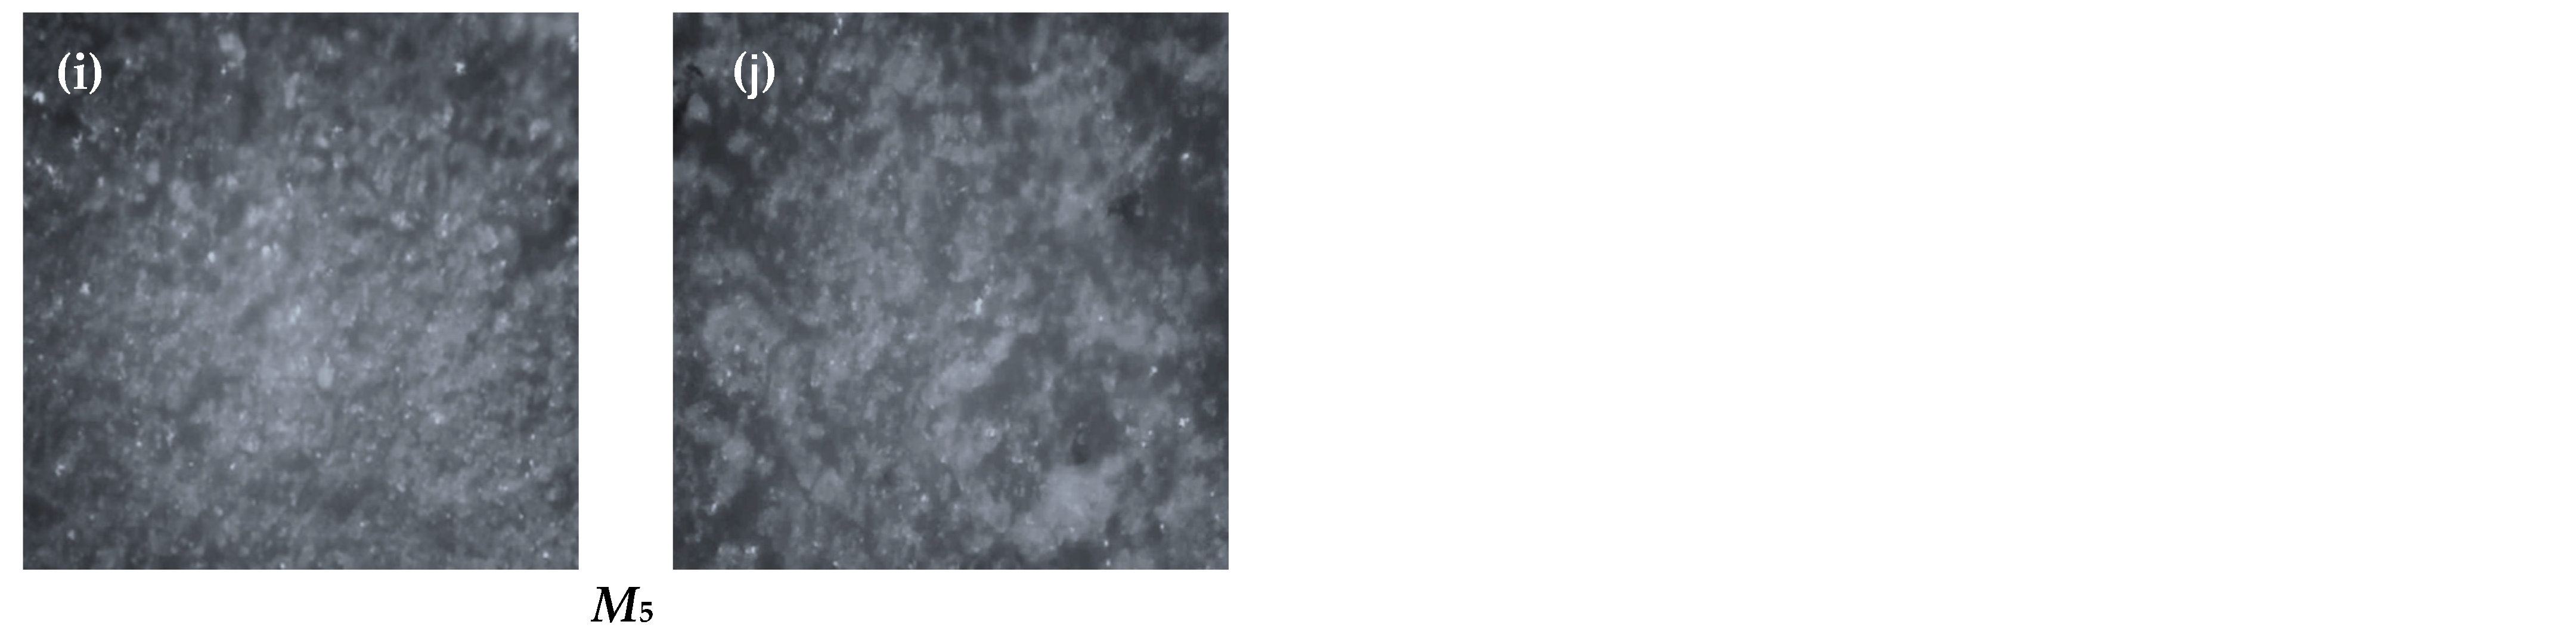
- The existence of worn glass fibers on the surface acts like three-body wear on the contact area and decreases the composite’s ability to resist abrasive wear.
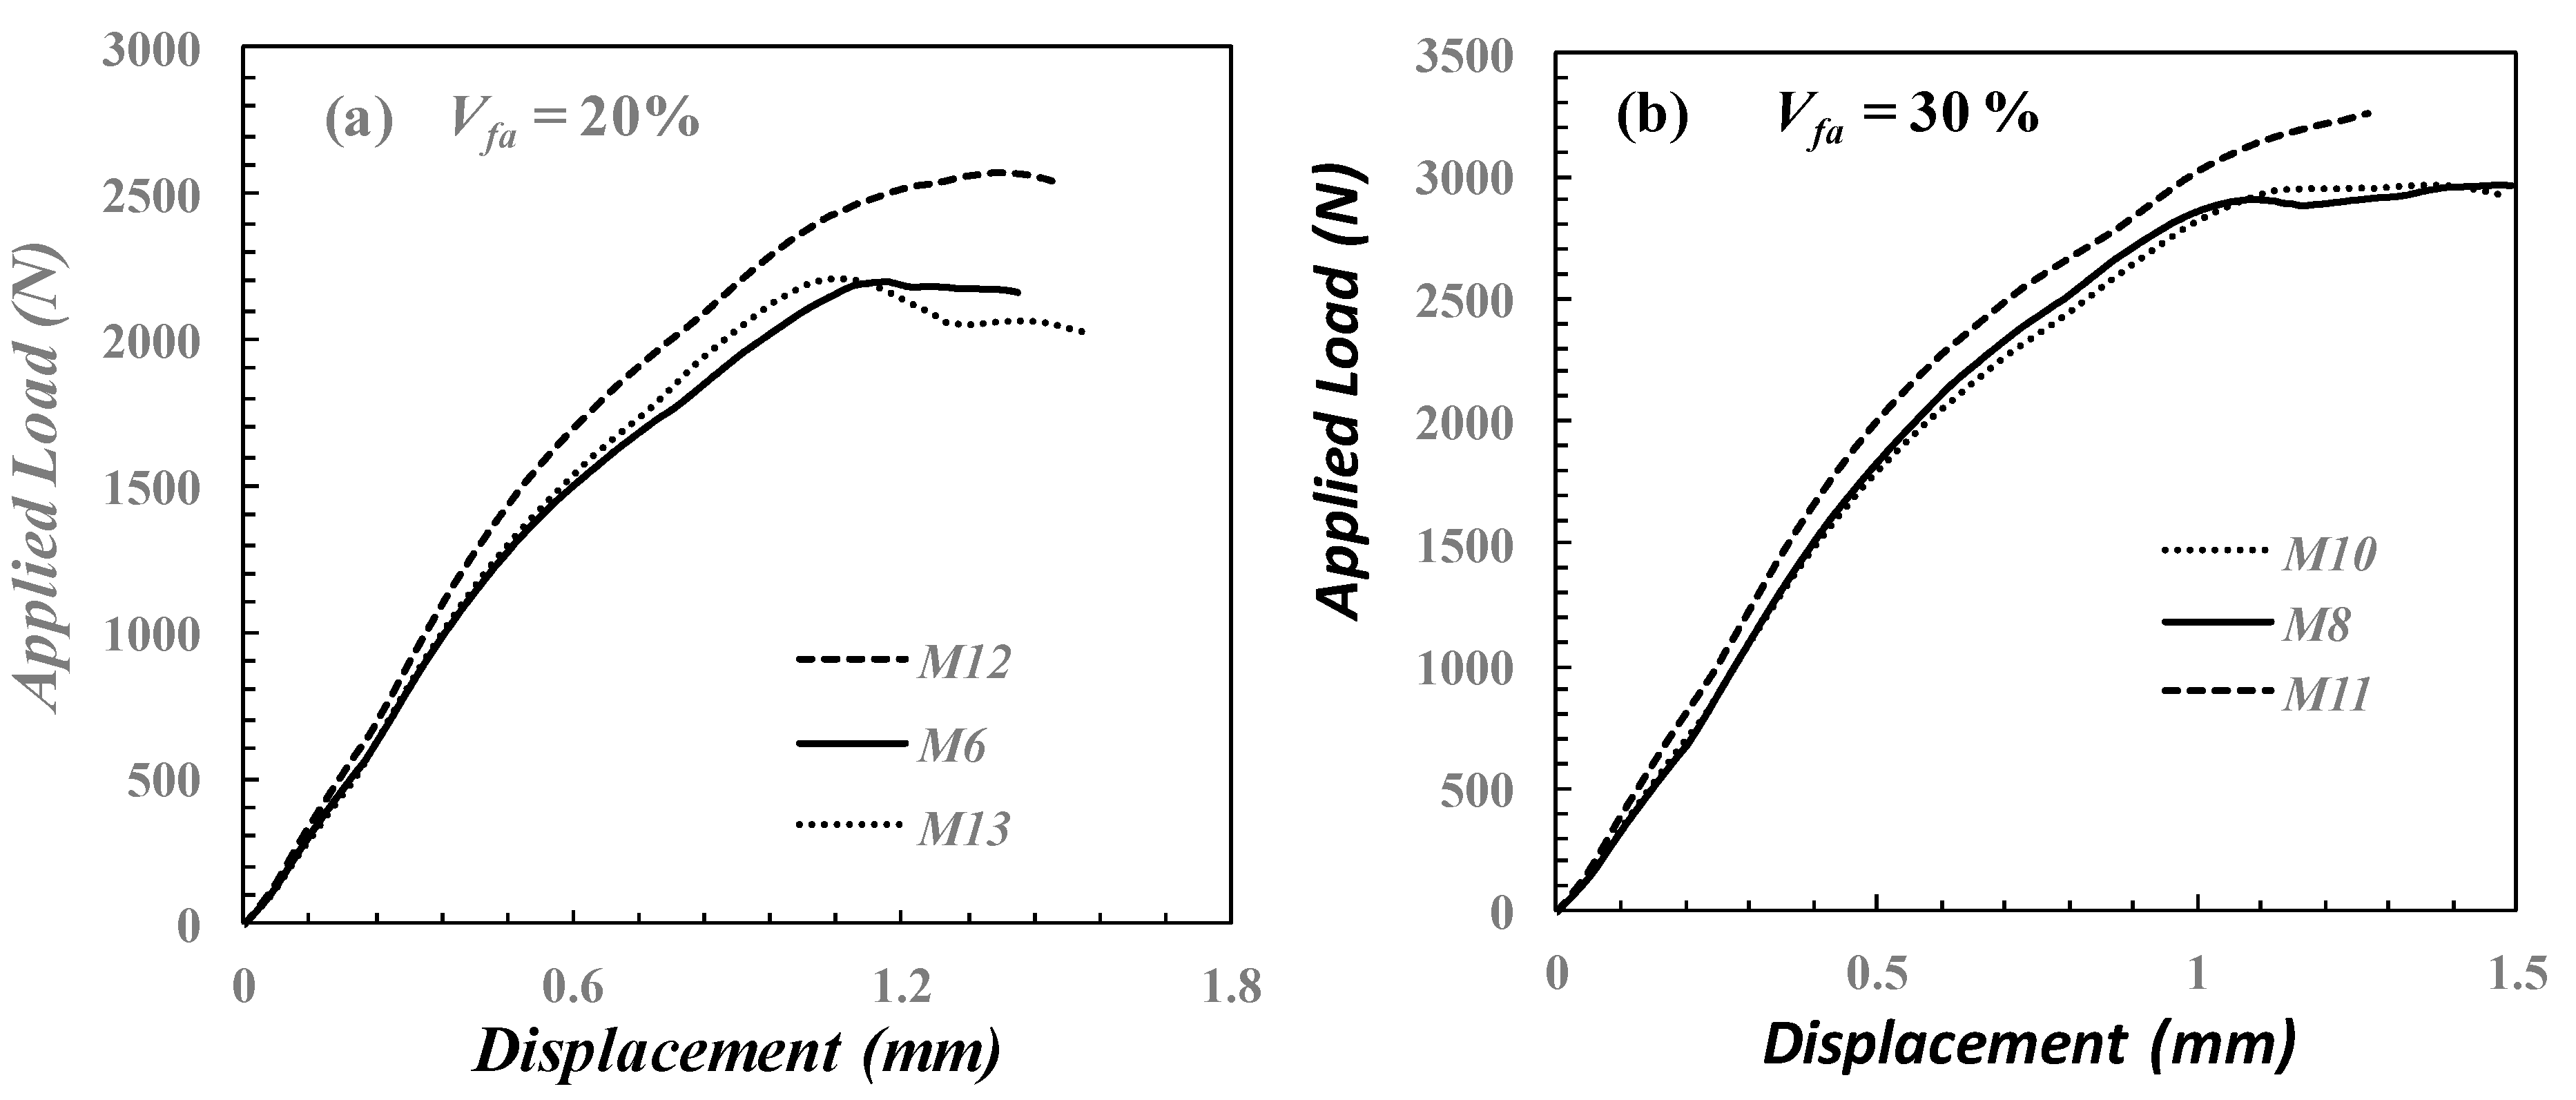
- SPT results showed that the ultimate load of FG composites increased by 30% compared with the conventional composites.
- The Vf % of the outer layers and the average volume fraction of SPT specimens are the major factors in improving their flexural strength.
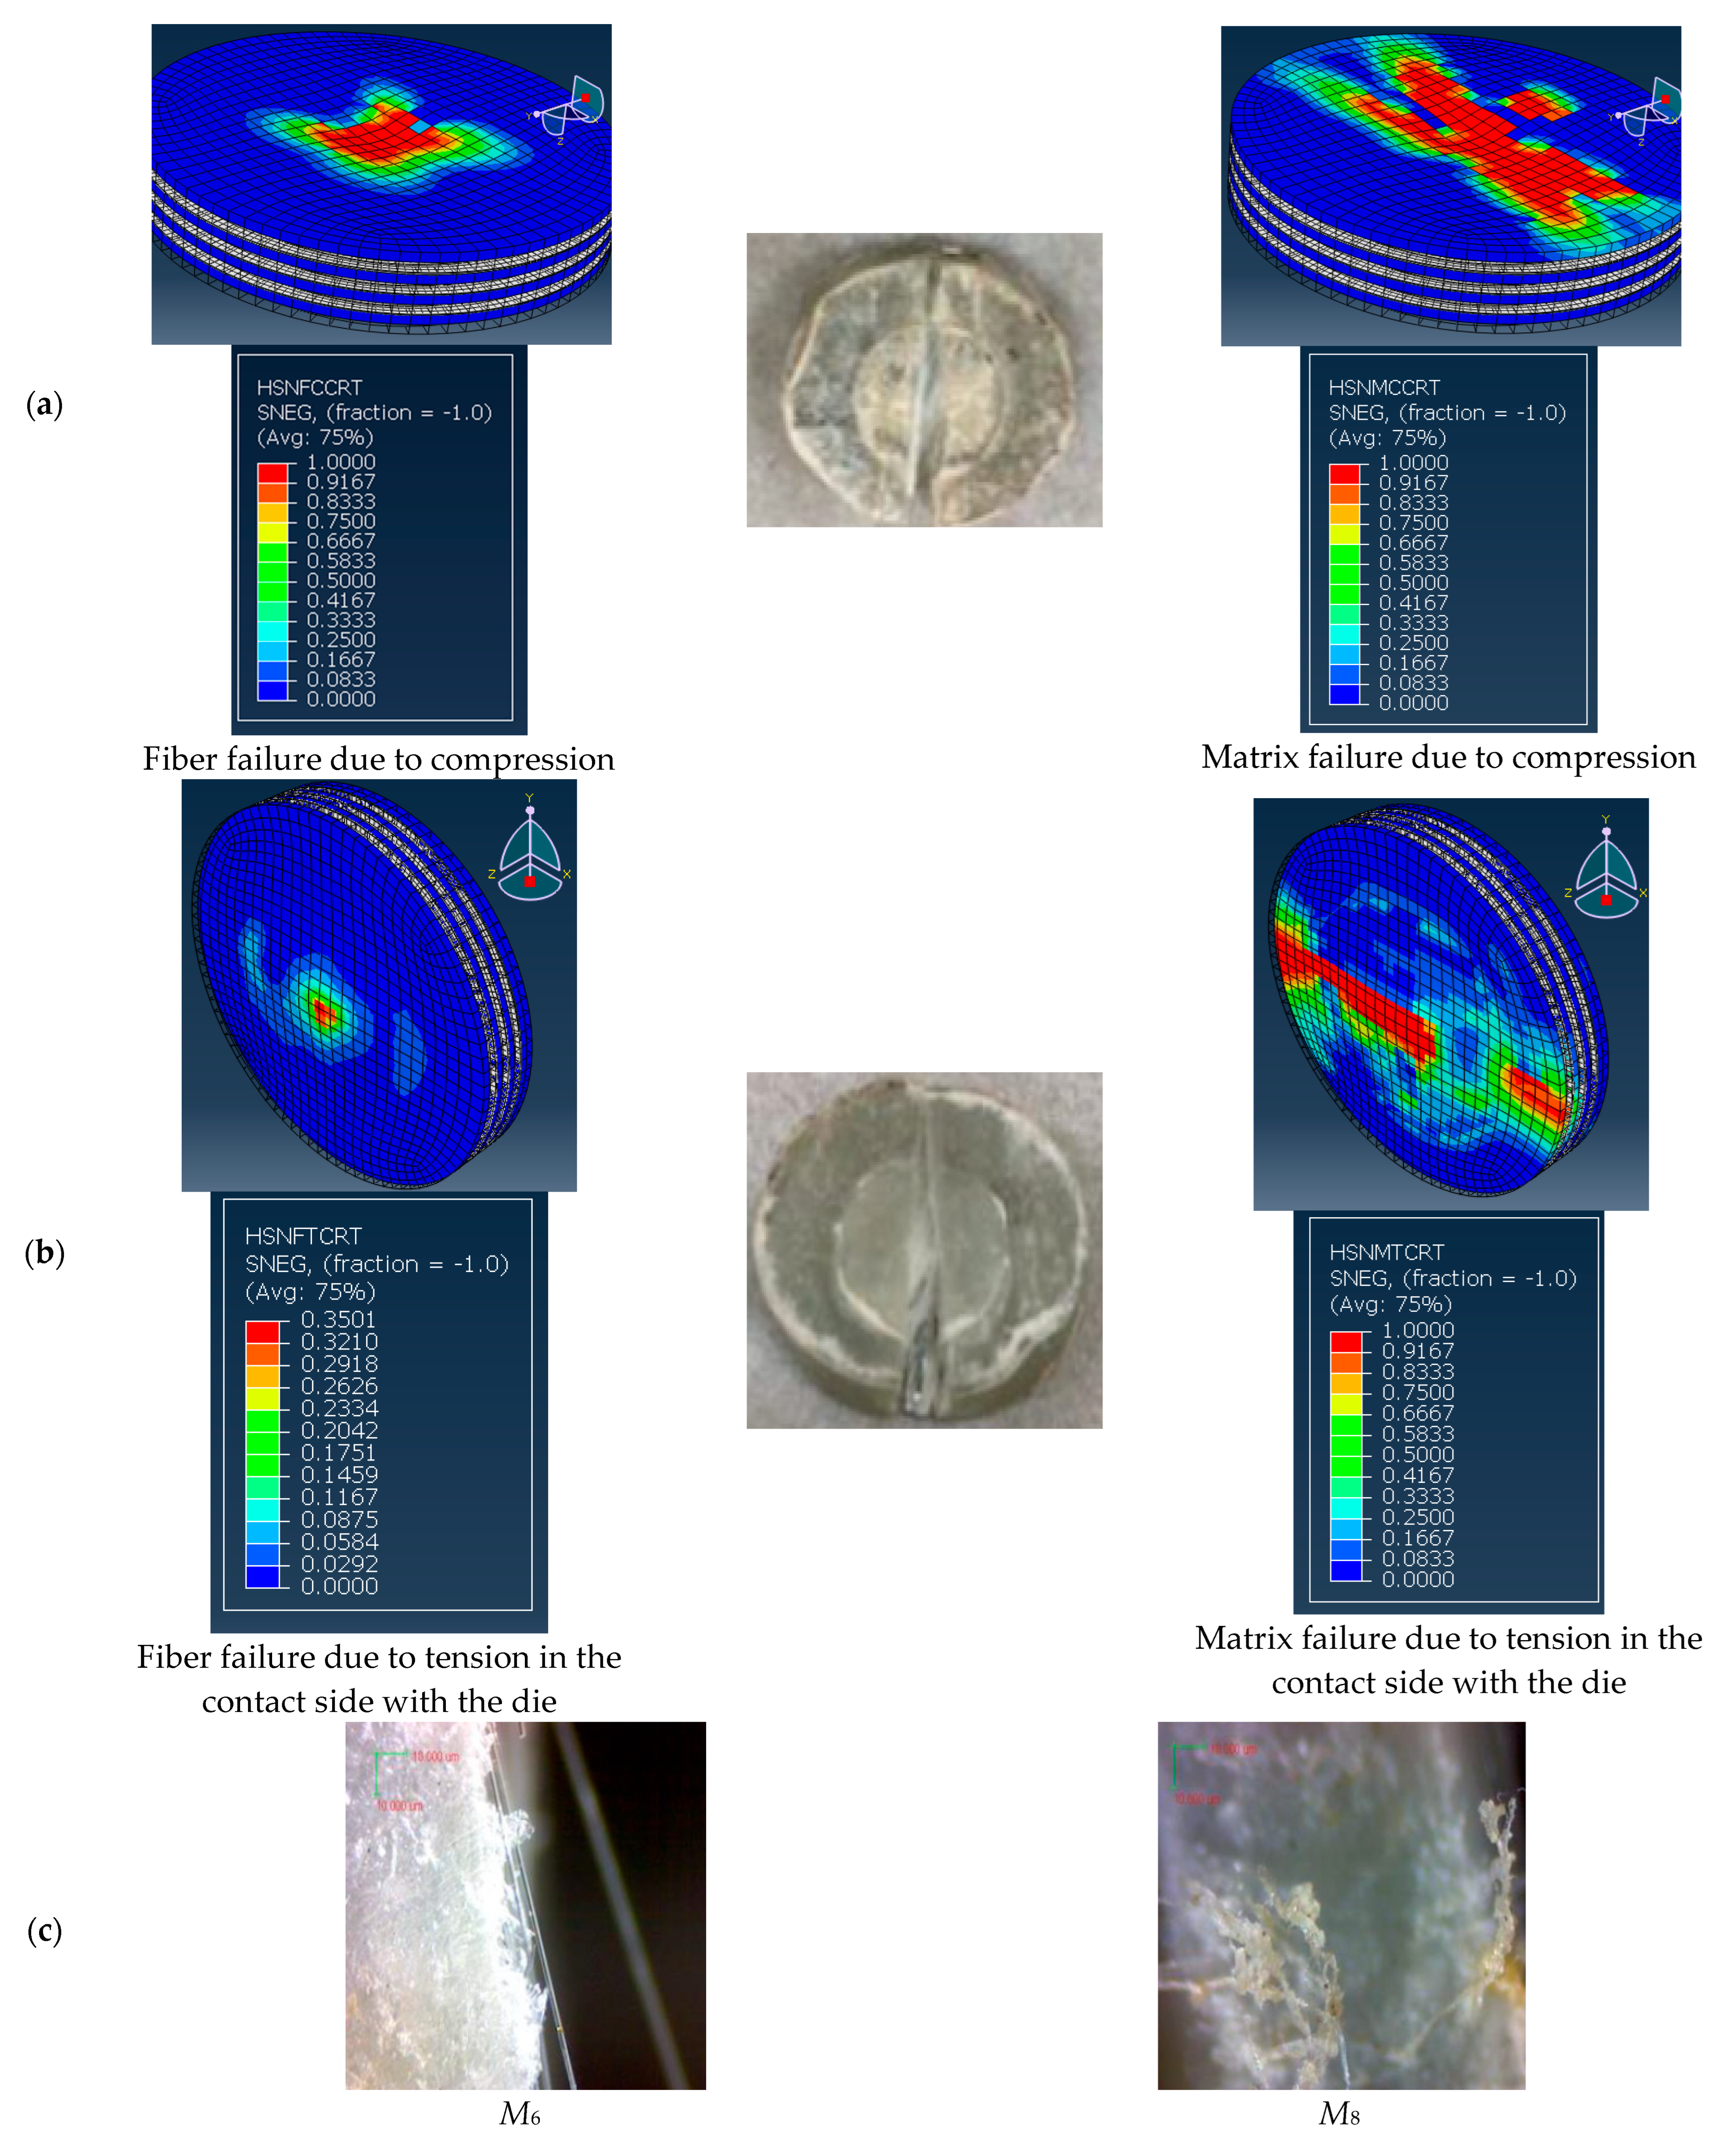
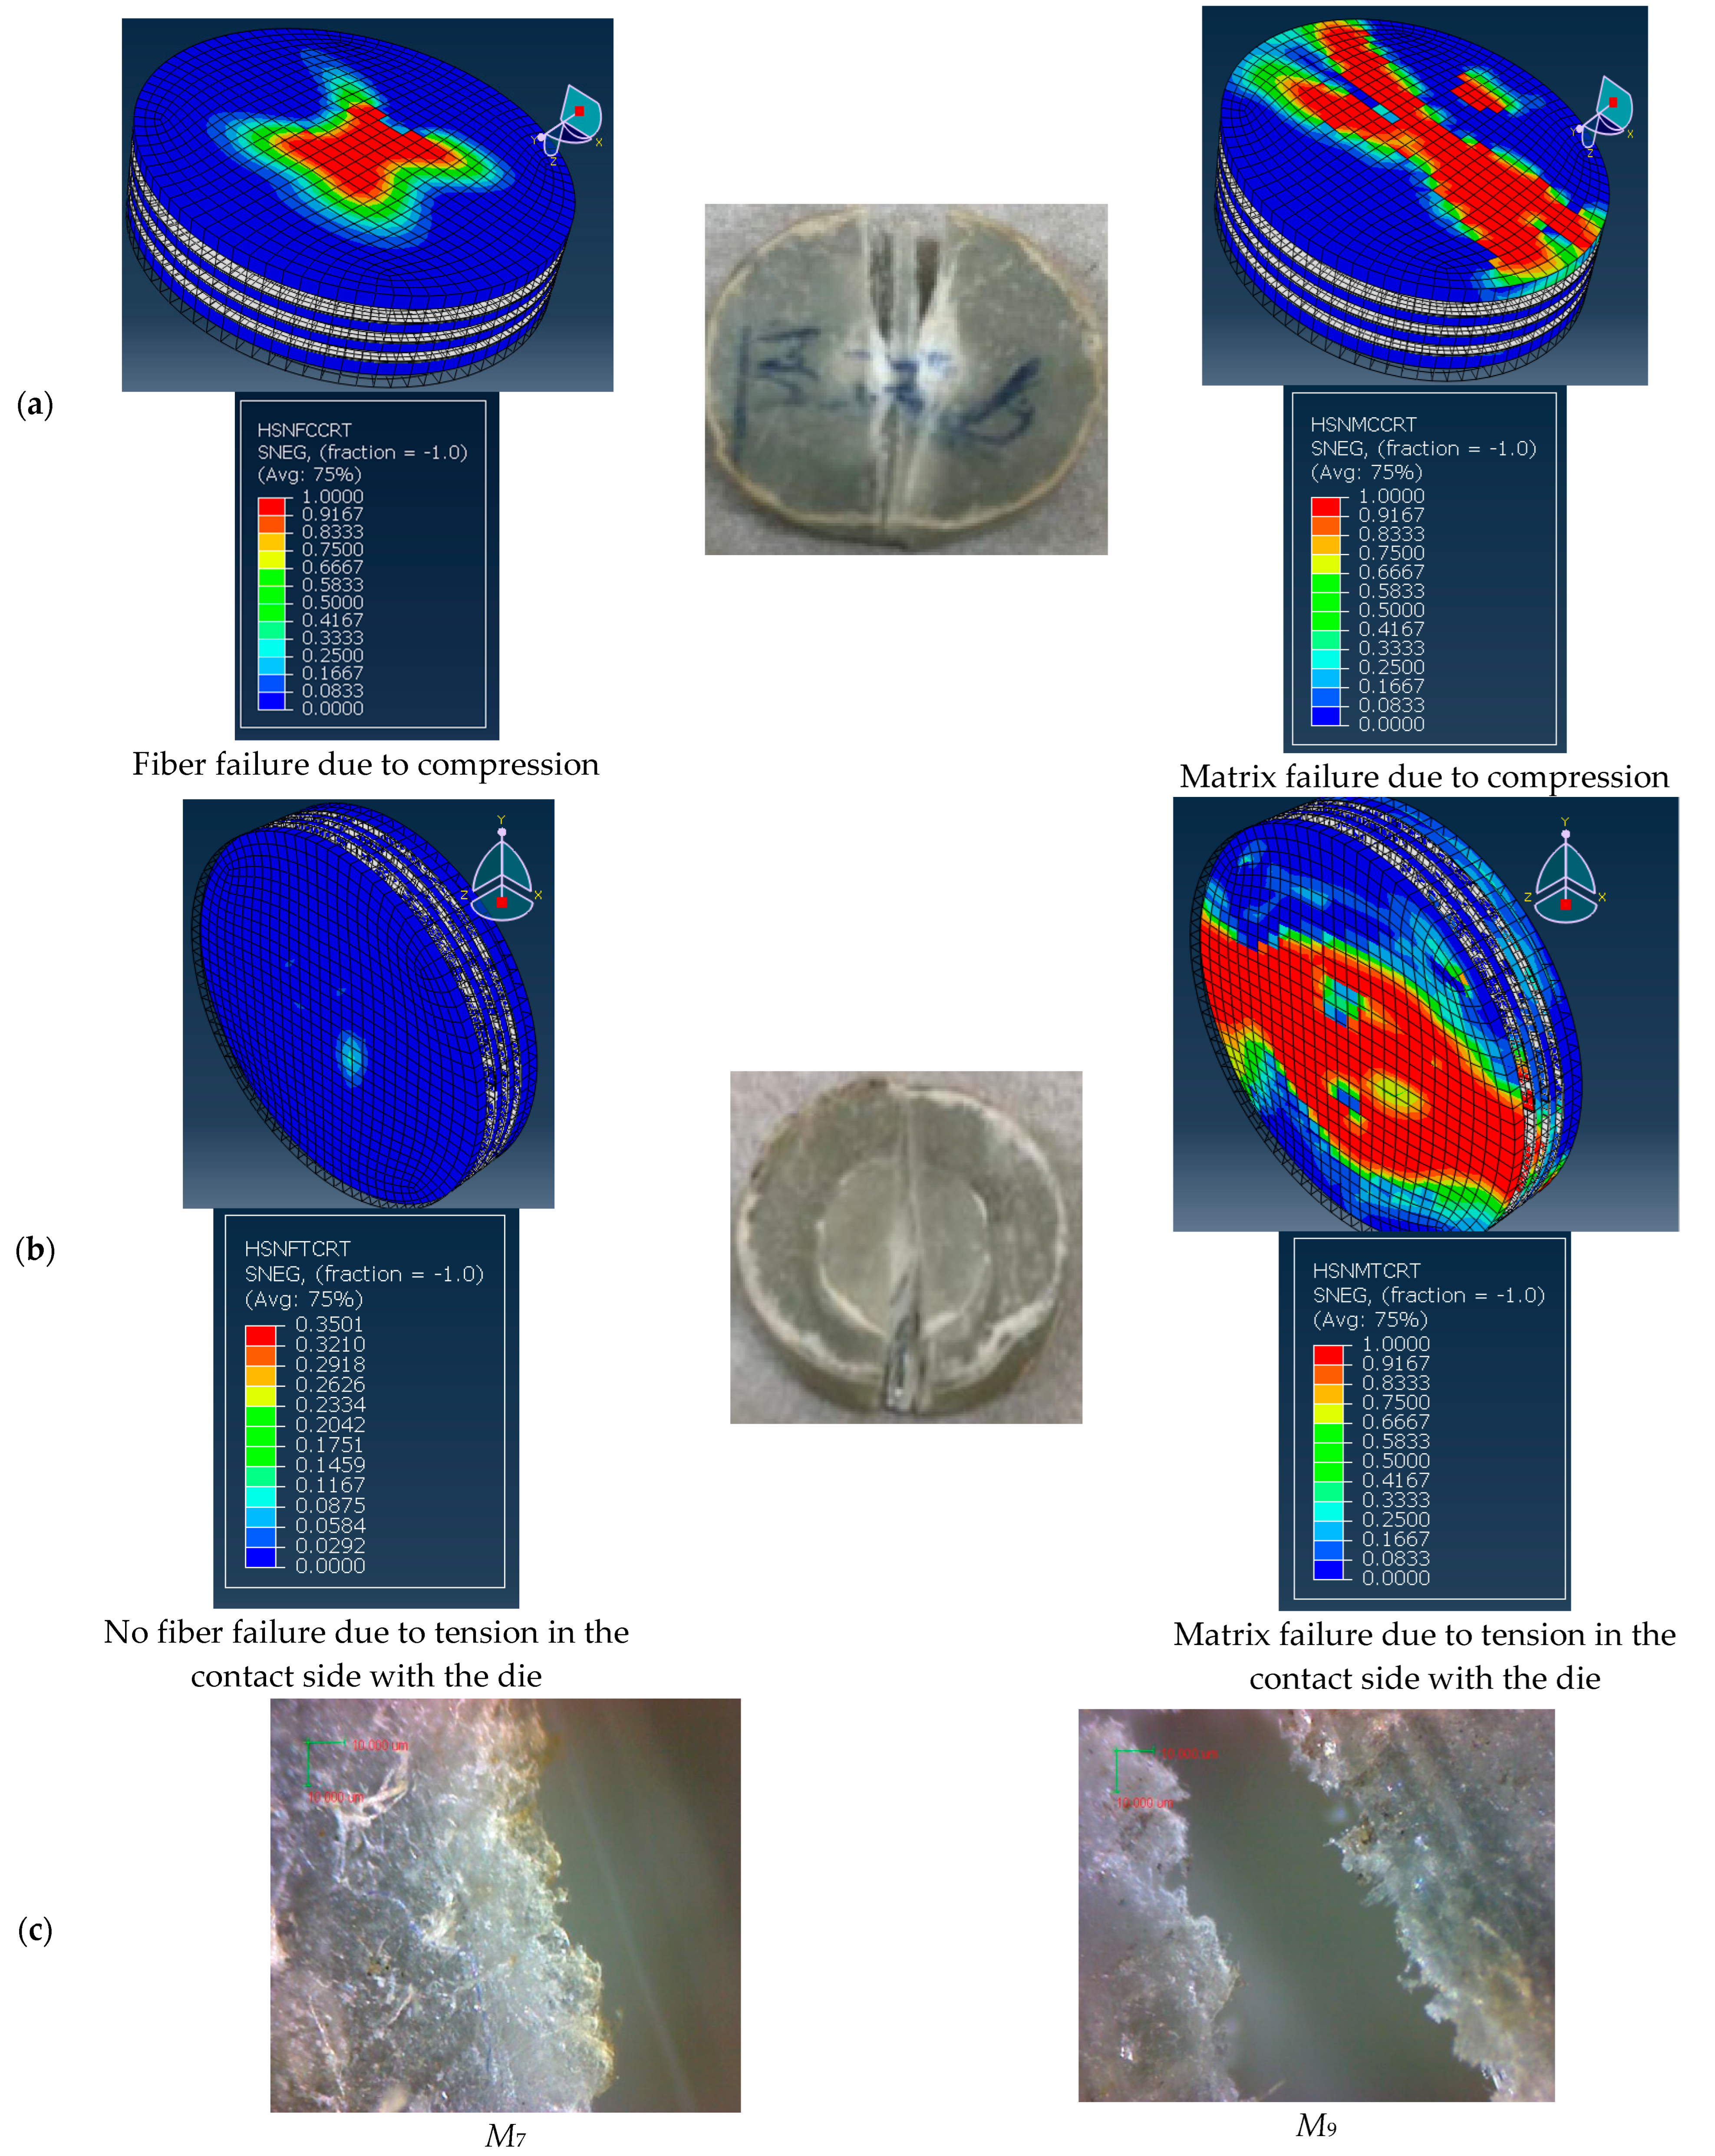
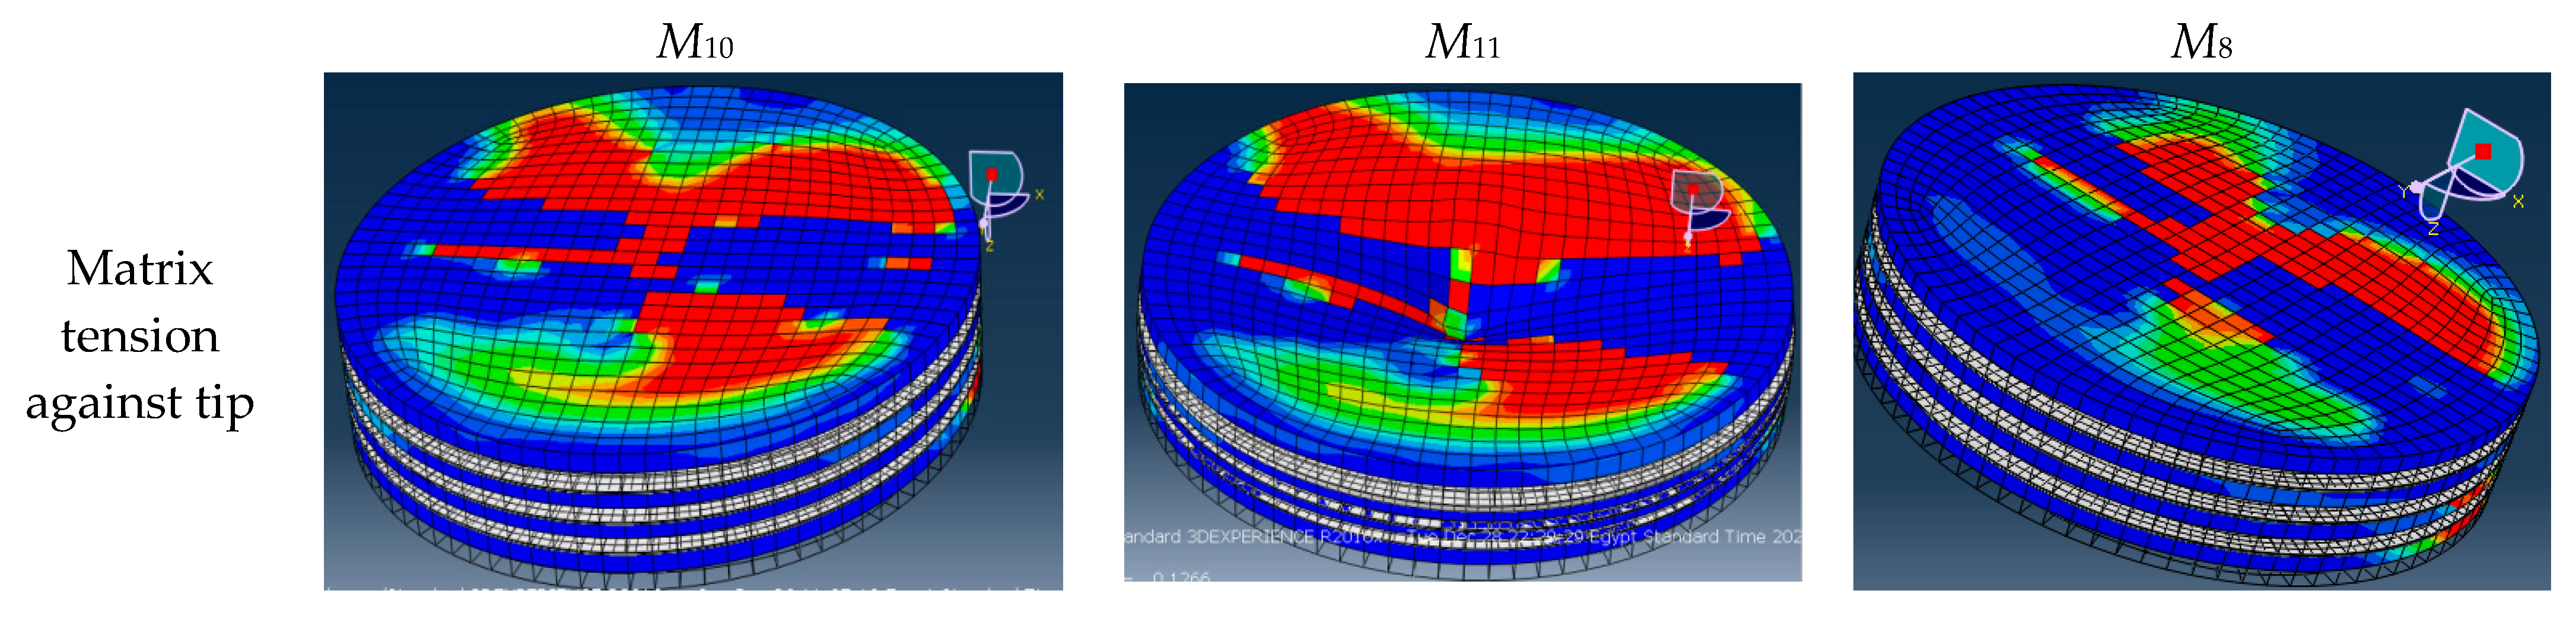
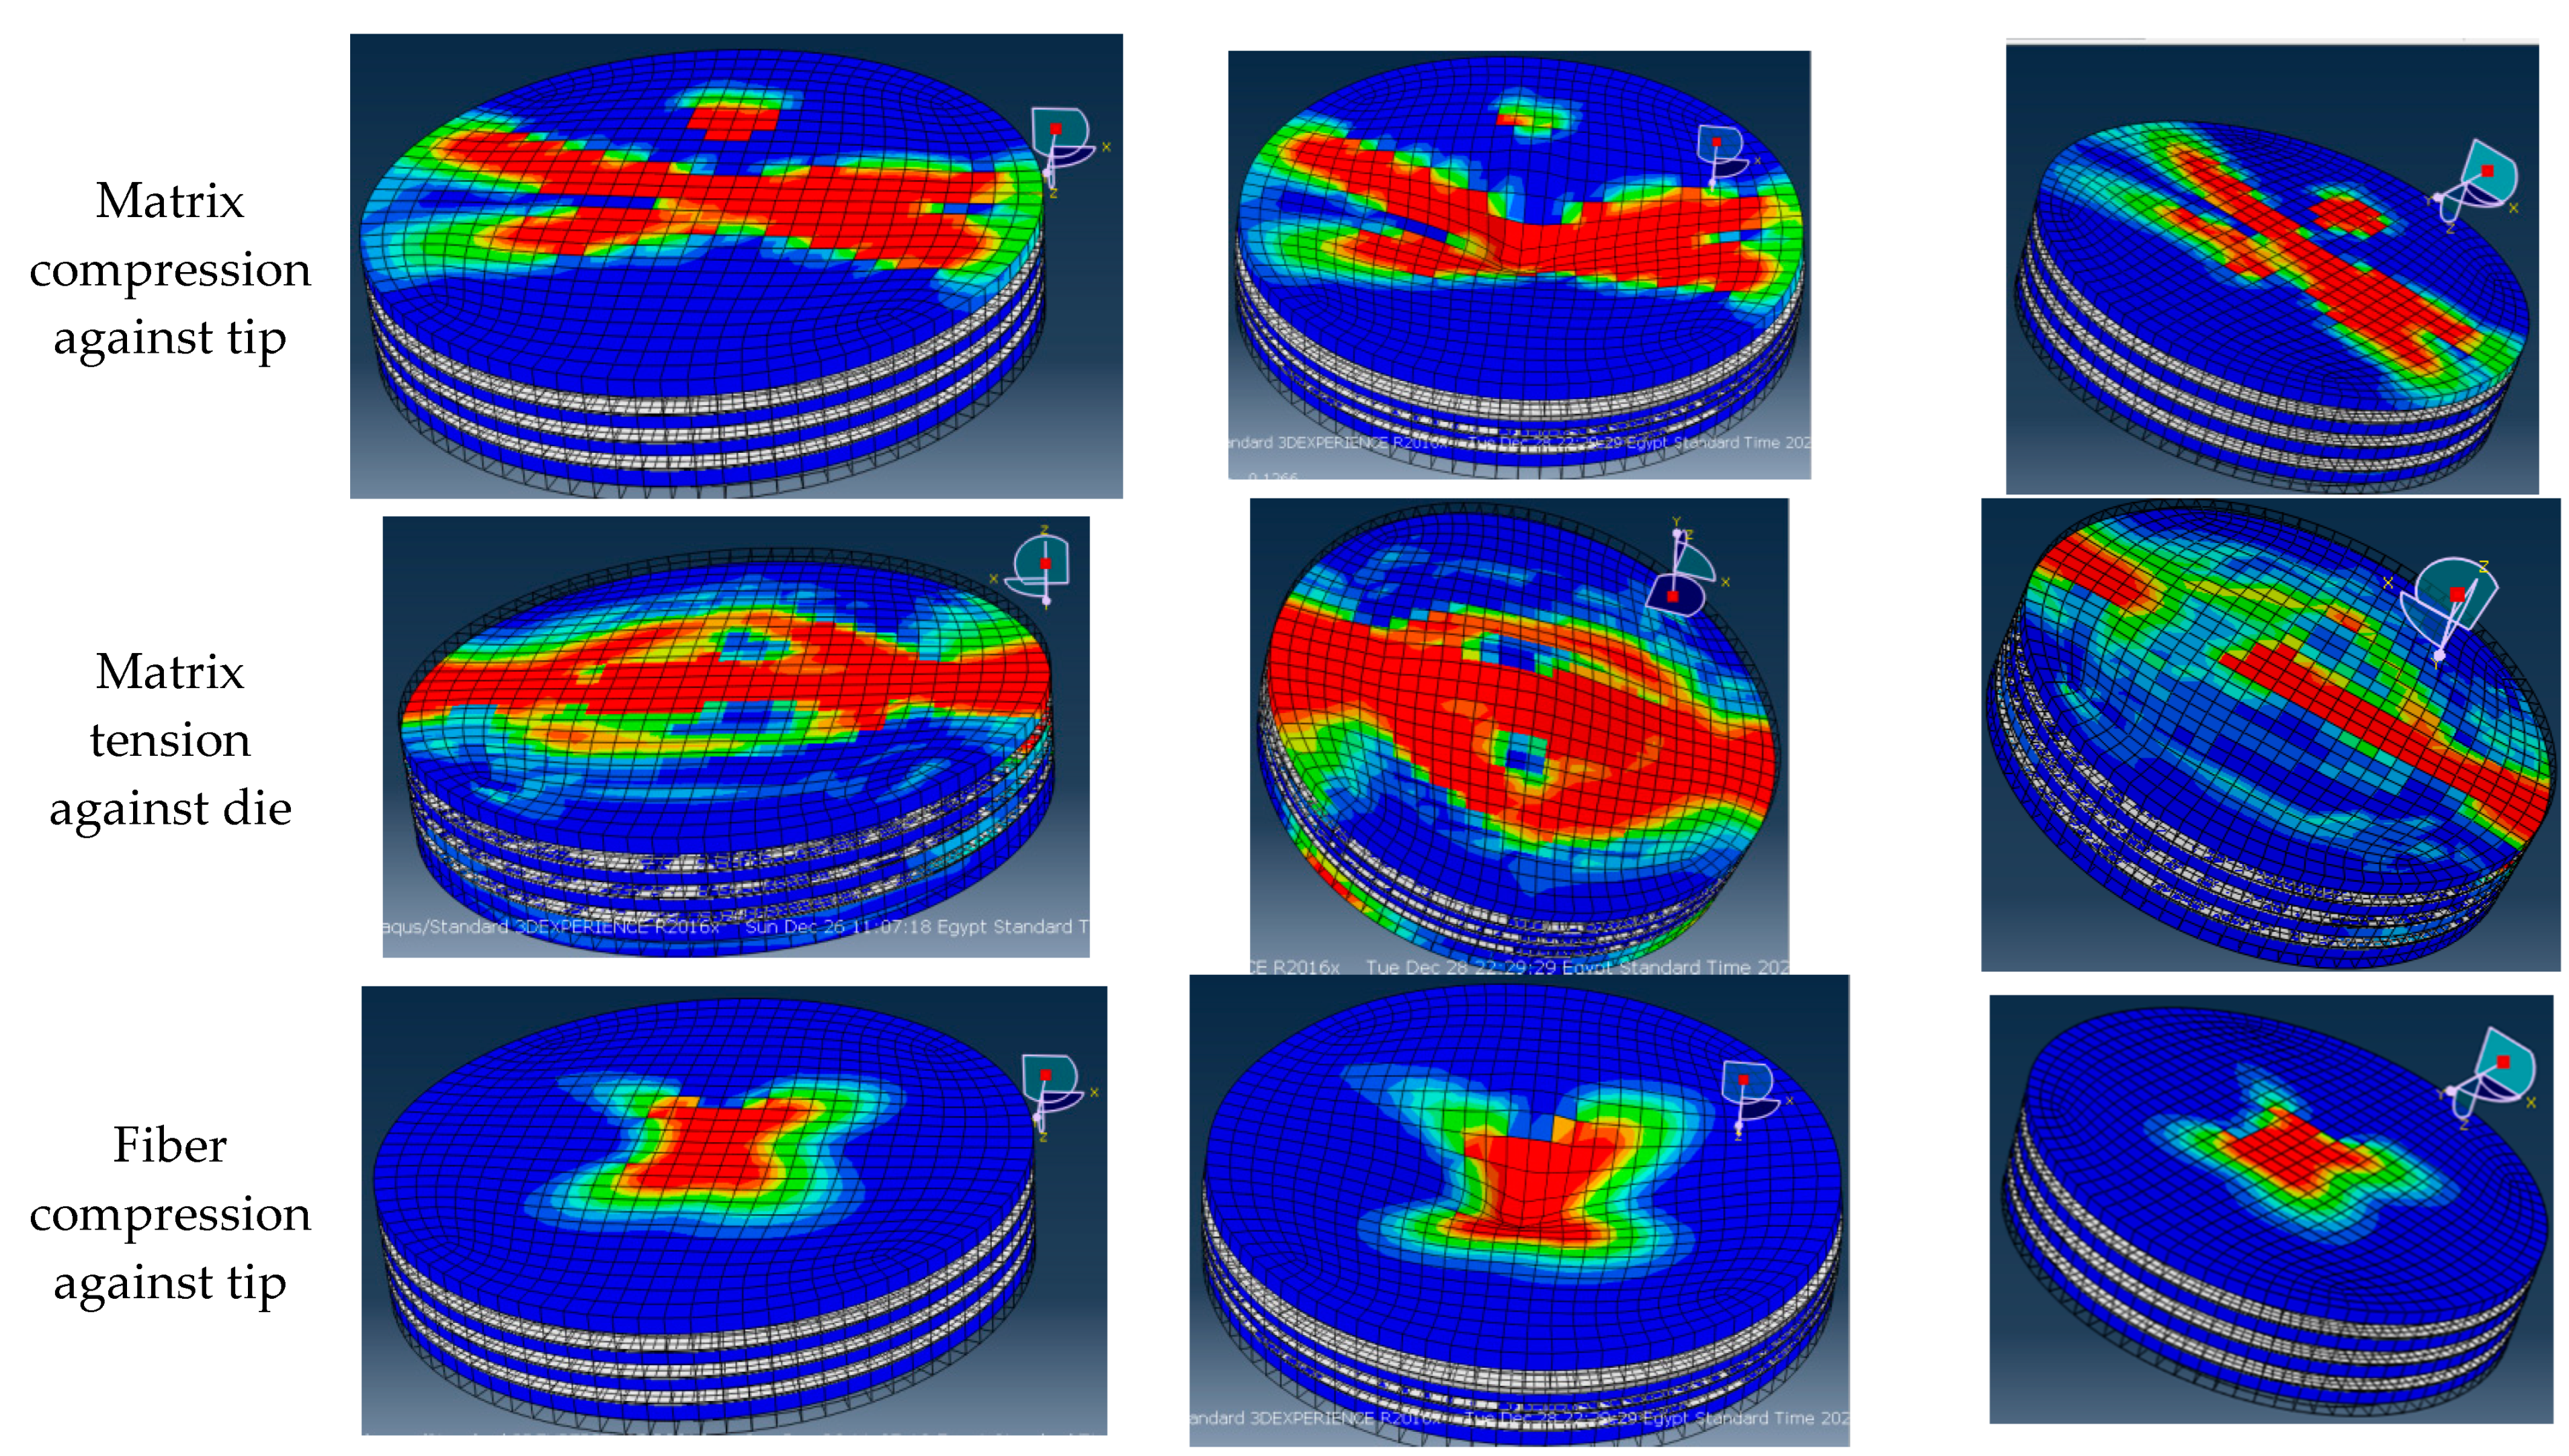
- The final damage of the polymeric composites reinforced with continuous glass fibers specimens under SPT starts beneath the punch tip and grows in the direction of the fiber, after which the specimen is broken into two pieces.
- The results were confirmed by modeling the SPT test. This allows additional studies for more specimen configurations to study the advantages of the FGM over conventional composite materials.
- A comparison of standard sandwich structures and FGM patterns, in particular, the pull-out strength of the inserts embedded in them, will be of interest for study in future work.
Supplementary Materials
Author Contributions
Funding
Institutional Review Board Statement
Informed Consent Statement
Data Availability Statement
Acknowledgments
Conflicts of Interest
References
- Rengasamy, N.; Rajkumar, M.; Kumaran, S.S. An analysis of mechanical properties and optimization of EDM process parameters of Al 4032 alloy reinforced with Zrb2 and Tib2 in-situ composites. J. Alloy. Compd. 2016, 662, 325–338. [Google Scholar] [CrossRef]
- Minoo, N.; Shirvanimoghaddam, K. Functionally graded materials: A review of fabrication and properties. Appl. Mater. Today 2016, 5, 223–245. [Google Scholar]
- Jha, D.K.; Kant, T.; Singh, R.K. A critical review of recent research on functionally graded plates. Compos. Struct. 2013, 96, 833–849. [Google Scholar] [CrossRef]
- Gangil, B.; Patnaik, A.; Kumar, A. Mechanical and wear behavior of vinyl ester-carbon/cement by-pass dust particulate filled homogeneous and their functionally graded composites. Sci. Eng. Compos. Mater. 2012, 20, 105–116. [Google Scholar] [CrossRef]
- Pindera, M.; Aboudi, J.; Arnold, S.; Jones, W. Use of composites in multiphased and functionally graded materials. Compos. Engng. 1997, 4, 1–145. [Google Scholar]
- Uemura, S. The Activities of FGM on New Application. Mater. Sci. Forum. 2003, 423–425, 1–10. [Google Scholar] [CrossRef]
- Singh, S.B.; Chawla, H.; Ranjitha, B. Hybrid effect of functionally graded hybrid composites of glass–carbon fibers. Mech. Adv. Mater. Struct. 2018, 26, 1195–1208. [Google Scholar] [CrossRef]
- Radhika, N.; Raghu, R. Characterization of mechanical properties and three-body abrasive wear of functionally graded aluminum LM25/titanium carbide metal matrix composite. Mater. Und Werkst. 2017, 48, 882–892. [Google Scholar] [CrossRef]
- Jayakumar, E.; Jacob, J.C.; Rajan, T.P.D.; Joseph, M.A.; Pai, B.C. Processing and Characterization of Functionally Graded Aluminum (A319)—SiCp Metallic Composites by Centrifugal Casting Technique. Met. Mater. Trans. A 2016, 47, 4306–4315. [Google Scholar] [CrossRef]
- Babu, K.V.; Jappes, J.W.; Rajan, T.; Uthayakumar, M. Dry sliding wear studies on SiC reinforced functionally graded aluminium matrix composites. Proc. Inst. Mech. Eng. Part L J. Mater. Des. Appl. 2014, 230, 182–189. [Google Scholar] [CrossRef]
- Kunimine, T.; Shibuya, M.; Sato, H.; Watanabe, Y. Fabrication of copper/diamond functionally graded materials for grinding wheels by centrifugal sintered-casting. J. Mater. Process. Technol. 2015, 217, 294–301. [Google Scholar] [CrossRef]
- Coomar, N.; Kadoli, R. Comparative analysis of steady state heat transfer in a TBC and functionally graded air cooled gas turbine blade. Sadhana 2010, 35, 1–17. [Google Scholar] [CrossRef]
- Maciejewski, G.; Mroz, Z. Optimization of functionally gradient materials in valve design under cyclic thermal and mechanical loading. Comput. Assist. Methods Eng. Sci. 2013, 20, 99–112. [Google Scholar]
- Lee, W.Y.; Stinton, D.P.; Berndt, C.C.; Erdogan, F.; Lee, Y.-D.; Mutasim, Z. Concept of Functionally Graded Materials for Advanced Thermal Barrier Coating Applications. J. Am. Ceram. Soc. 1996, 79, 3003–3012. [Google Scholar] [CrossRef]
- Schwarzer, E.; Holtzhausen, S.; Scheithauer, U.; Ortmann, C.; Oberbach, T.; Moritz, T.; Michaelis, A. Process development for additive manufacturing of functionally graded alumina toughened zirconia components intended for medical implant application. J. Eur. Ceram. Soc. 2019, 39, 522–530. [Google Scholar] [CrossRef]
- Jojith, R.; Sam, M.; Radhika, N. Recent advances in tribological behavior of functionally graded composites: A review. Eng. Sci. Technol. Int. J. 2021, 25, 100999. [Google Scholar] [CrossRef]
- Radhika, N.; Raghu, R. Development of functionally graded aluminium composites using centrifugal casting and influence of reinforcements on mechanical and wear properties. Trans. Nonferrous Met. Soc. China 2016, 26, 905–916. [Google Scholar] [CrossRef]
- Agarwal, G.; Patnaik, A.; Sharma, R.K. Parametric optimization of three-body abrasive wear behavior of bidirectional and short kevlar fiber reinforced epoxy composites. Int. J. Eng. Res. Appl. 2012, 2, 1148–1167. [Google Scholar]
- Singh, T.; Gangil, B.; Singh, B.; Verma, S.; Biswas, D.; Fekete, G. Natural-synthetic fiber reinforced homogeneous and functionally graded vinyl ester composites: Effect of bagasse-Kevlar hybridization on wear behavior. J. Mater. Res. Technol. 2019, 8, 5961–5971. [Google Scholar] [CrossRef]
- Gangil, B.; Patnaik, A.; Kumar, A.; Kumar, M. Investigations on mechanical and sliding wear behaviour of short fibre-reinforced vinylester-based homogenous and their functionally graded composites. Proc. Inst. Mech. Eng. Part L J. Mater. Des. Appl. 2012, 226, 300–315. [Google Scholar] [CrossRef]
- Singh, A.K. Siddhartha Mechanical and thermo-mechanical peculiarity of functionally graded materials-based glass fiber-filled polybutylene terephthalate composites. J. Reinf. Plast. Compos. 2018, 37, 410–426. [Google Scholar] [CrossRef]
- Gautam, V.; Kumar, A.; Sharma, A.; Kumar, A.; Kumar, D. Tribological behaviour of hybrid reinforced vinyl ester based functionally graded materials. Mater. Today: Proc. 2021, 44, 4682–4688. [Google Scholar] [CrossRef]
- El-Tayeb, N.; Gadelrab, R. Friction and wear properties of E-glass fiber reinforced epoxy composites under different sliding contact conditions. Wear 1996, 192, 112–117. [Google Scholar] [CrossRef]
- Tsukamoto, H. Tribological Characterization of Carbon Nanotube/Aluminum Functionally Graded Materials Fabricated by Centrifugal Slurry Methods. J. Compos. Sci. 2021, 5, 254. [Google Scholar] [CrossRef]
- Rong, M.Z.; Zhang, M.Q.; Liu, Y.; Yang, G.C.; Zeng, H.M. The effect of fiber treatment on the mechanical properties of unidirectional sisal-reinforced epoxy composites. Compos. Sci. Technol. 2001, 61, 1437–1447. [Google Scholar] [CrossRef]
- Moreno, M.F. Application of small punch testing on the mechanical and microstructural characterizations of P91 steel at room temperature. Int. J. Press. Vessel. Pip. 2016, 142, 1–9. [Google Scholar] [CrossRef]
- Krizik, P.; Balog, M.; Nagy, S. Small punch testing of heat resistant ultrafine-grained Al composites stabilized by nano-metric Al2O3 (HITEMAL©) in a broad temperature range. J. Alloy. Compd. 2021, 887, 161332. [Google Scholar] [CrossRef]
- Cheng, Z.; Sun, J.; Tai, P.; Zhang, L.; Wei, Y.; Chang, H.; Thuku, R.; Gichuhi, K.M. Comparative Study between Small Punch Tests and Finite Element Analysis of Miniature Steel Specimens. J. Mater. Eng. Perform. 2021, 30, 9094–9107. [Google Scholar] [CrossRef]
- Torres, J.; Gordon, A.P. Mechanics of the small punch test: A review and qualification of additive manufacturing materials. J. Mater. Sci. 2021, 56, 10707–10744. [Google Scholar] [CrossRef]
- Alhazmi, W.; Jazaa, Y.; Mousa, S.; Abd-Elhady, A.; Sallam, H. Tribological and Mechanical Properties of Epoxy Reinforced by Hybrid Nanoparticles. Lat. Am. J. Solids Struct. 2021, 18, e361. [Google Scholar] [CrossRef]
- Atta, M.; Abu-Sinna, A.; Mousa, S.; Sallam, H.; Abd-Elhady, A. Flexural behavior of functionally graded polymeric composite beams. J. Ind. Text. 2021. [Google Scholar] [CrossRef]
- Hirshikesh; Natarajan, S.; Annabattula, R.K.; Martínez-Pañeda, E. Phase field modelling of crack propagation in functionally graded materials. Compos. Part B Eng. 2019, 169, 239–248. [Google Scholar] [CrossRef] [Green Version]
- Abd-Elhady, A.; Mubaraki, M.A.; Sallam, H. Progressive failure prediction of pinned joint in quasi-isotropic laminates used in pipelines. Lat. Am. J. Solids Struct. 2018, 15, 15. [Google Scholar] [CrossRef]
- Abd-Elhady, A.; Sallam, H.E.-D.; Mubaraki, M. Failure Analysis of Composite Repaired Pipelines with an Inclined Crack under Static Internal Pressure. Procedia Struct. Integr. 2017, 5, 123–130. [Google Scholar] [CrossRef]
- Abd-Elhady, A.A.; Mousa, S.; Alhazmi, W.H.; Sallam, H.E.M.; Atta, M. Effects of composite patching on cyclic crack tip deformation of cracked pinned metallic joints. J. Adhes. 2020, 97, 1561–1577. [Google Scholar] [CrossRef]
- ASTM International. ASTM D3171-15-Standard Test Methods for Constituent Content of Composite Materials; American Society for Testing and Materials: Philadelphia, PA, USA, 2015. [Google Scholar]
- ASTM F732-17; Standard Test Method for Wear Testing of Polymeric Materials Used in Total Joint Prostheses. ASTM International: West Conshohocken, PA, USA, 2017.
- Czichos, H.; Becker, S.; Lexow, J. Multilaboratory tribotesting: Results from the Versailles Advanced Materials and Standards programme on wear test methods. Wear 1987, 114, 109–130. [Google Scholar] [CrossRef]
- ASTM E3205-20; Standard Test Method for Small Punch Testing of Metallic Materials. ASTM International: West Conshohocken, PA, USA, 2020.
- ABAQUS 6.14. Analysis User’s Manual; Dassault Systems: Providence, RI, USA, 2014; Volume 5.
- Hashin, Z. Failure Criteria for Unidirectional Fiber Composites. J. Appl. Mech. 1980, 47, 329–334. [Google Scholar] [CrossRef]
- Hashin, Z.; Rotem, A. A fatigue failure criterion for fiber reinforced materials. J. Compos. Mater. 1973, 7, 448–464. [Google Scholar] [CrossRef] [Green Version]
- El-Sagheer, I.; Abd-Elhady, A.A.; Sallam, H.E.-D.M.; Naga, S.A.R. An Assessment of ASTM E1922 for Measuring the Translaminar Fracture Toughness of Laminated Polymer Matrix Composite Materials. Polymers 2021, 13, 3129. [Google Scholar] [CrossRef]
- Mousa, S.; Sallam, H.E.-D.M.; Kim, G.-Y.; Abd-Elhady, A.A. Investigation on integrity assessment tests of WRB metal-polymer-metal composites. Arch. Civ. Mech. Eng. 2021, 21, 60. [Google Scholar] [CrossRef]
- Rafiee, R.; Amini, A. Modeling and experimental evaluation of functional failure pressures in glass fiber reinforced polyester pipes. Comput. Mater. Sci. 2015, 96, 579–588. [Google Scholar] [CrossRef]
- Ju, S.-H.; Fan, C.-Y.; Wu, G. Three-dimensional finite elements of steel bolted connections. Eng. Struct. 2004, 26, 403–413. [Google Scholar] [CrossRef]
- Kulak, G.; Fisher, J.; Struik, J. Guide to Design Criteria for Bolted and Riveted Joints; American Institute of Steel Construction, Inc.: Chicago, IL, USA, 2001. [Google Scholar]
- Al-Salihi, H.A.; Mahmood, A.A.; Alalkawi, H.J. Mechanical and wear behavior of AA7075 aluminum matrix composites reinforced by Al2O3 nanoparticles. Nanocomposites 2019, 5, 67–73. [Google Scholar] [CrossRef] [Green Version]
- Selmy, A.I.; El-Baky, M.A.A.; Ghazy, M.R.; Kamel, M. Flexural Fatigue Performance of Glass Fiber/Epoxy Step-Wise Functionally and Non-Functionally Graded Composites of Different Structures. Int. Polym. Process. 2017, 32, 298–307. [Google Scholar] [CrossRef]


| Mechanical Properties | E-Glass Fiber | Epoxy |
|---|---|---|
| Modulus of elasticity, E, (GPa) | 72.4 | 2–6 |
| Tensile strength (MPa) | 3450 | 35–130 |
| Elongation % | 1.8–3.2 | 1–8.5 |
| Poisson’s ratio, ν, | 0.22 | 0.36 |
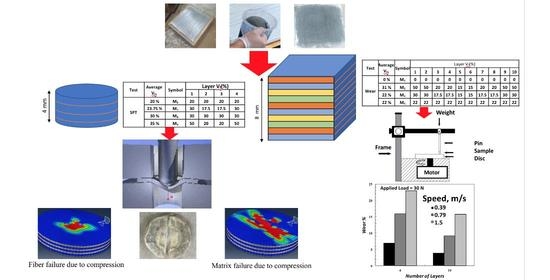
| Test | Average Vfa | Symbol | Layer Vf (%) | |||||||||
|---|---|---|---|---|---|---|---|---|---|---|---|---|
| 1 | 2 | 3 | 4 | 5 | 6 | 7 | 8 | 9 | 10 | |||
| Wear | 0% | M1 | 0 | 0 | 0 | 0 | 0 | 0 | 0 | 0 | 0 | 0 |
| 31% | M2 | 50 | 50 | 20 | 20 | 15 | 15 | 20 | 20 | 50 | 50 | |
| 22% | M3 | 30 | 30 | 17.5 | 17.5 | 15 | 15 | 17.5 | 17.5 | 30 | 30 | |
| 22% | M4 | 22 | 22 | 22 | 22 | 22 | 22 | 22 | 22 | 22 | 22 | |
| 22% | M5 | 22 | 22 | 22 | 22 | - | - | - | - | - | - | |
| SPT | 20% | M6 | 20 | 20 | 20 | 20 | - | - | - | - | - | - |
| 23.75% | M7 | 30 | 17.5 | 17.5 | 30 | - | - | - | - | - | - | |
| 30% | M8 | 30 | 30 | 30 | 30 | - | - | - | - | - | - | |
| 35% | M9 | 50 | 20 | 20 | 50 | - | - | - | - | - | - | |
| Test | Average Vfa | Symbol | Layer Vf (%) | |||
|---|---|---|---|---|---|---|
| 1 | 2 | 3 | 4 | |||
| SPT | 30% | M10 | 40 | 20 | 20 | 40 |
| 30% | M11 | 50 | 10 | 10 | 50 | |
| 20% | M12 | 30 | 10 | 10 | 30 | |
| 20% | M13 | 10 | 30 | 30 | 10 | |
| Vf (%) | Density (gm/cm3) | Young’s Modulus (GPa) | In-Plane Shear Modulus (GPa) | Poisson’s Ratio | ||||||
|---|---|---|---|---|---|---|---|---|---|---|
| EX | EY | EZ | GXY | GXZ | GYZ | υxy | υxz | υyz | ||
| 50 | 1.825 | 38.2936 | 8.8788 | 8.8788 | 3.4521 | 3.4521 | 3.0432 | 0.277 | 0.277 | 0.458 |
| 40 | 1.68 | 31.3283 | 6.8910 | 6.8910 | 2.7656 | 2.7656 | 2.3042 | 0.290 | 0.290 | 0.495 |
| 30 | 1.535 | 24.3614 | 5.6323 | 5.6323 | 2.2530 | 2.2530 | 1.8643 | 0.304 | 0.304 | 0.510 |
| 20 | 1.39 | 17.3928 | 4.7922 | 4.7922 | 1.8557 | 1.8557 | 1.5908 | 0.318 | 0.318 | 0.506 |
| 17.5 | 1.354 | 15.6504 | 4.6259 | 4.6259 | 1.7700 | 1.7700 | 1.5403 | 0.322 | 0.322 | 0.501 |
| 10 | 1.245 | 10.4224 | 4.1925 | 4.1925 | 1.5388 | 1.5388 | 1.4220 | 0.3339 | 0.3339 | 0.4741 |
| Vf% | Longitudinal Tensile Strength XT (MPa) | Transverse Tensile Strength YT (MPa) | Longitudinal Compressive Strength XC (MPa) | Transverse Compressive Strength YC (MPa) | Longitudinal Shear Strength SL (MPa) | Transverse Shear Strength ST (MPa) |
|---|---|---|---|---|---|---|
| 50 | 1806.4124 | 44.8321 | 489.8681 | 111.3933 | 65.000 | 55.696 |
| 40 | 1477.6949 | 50.6262 | 488.9371 | 97.7584 | 65.0000 | 48.8792 |
| 30 | 1148.9774 | 56.3602 | 457.5301 | 87.3665 | 65.000 | 43.6833 |
| 20 | 820.2599 | 62.7957 | 393.7940 | 79.0956 | 65.000 | 39.5478 |
| 17.5 | 738.0805 | 64.6491 | 372.3337 | 77.8411 | 65.000 | 38.9205 |
| 10 | 491.5424 | 71.4214 | 292.8034 | 72.5700 | 65.0000 | 36.2850 |
| Specimen Code | Max. Load, Fm | ||
|---|---|---|---|
| Experimental | Numerical | Error % | |
| M6 | 2026.263 | 2201.95 | 8.670508 |
| M7 | 2929.286 | 2662.27 | −9.1154 |
| M8 | 2852.661 | 2862.4 | 0.341386 |
| M9 | 3624.024 | 3420.41 | −5.61845 |
Publisher’s Note: MDPI stays neutral with regard to jurisdictional claims in published maps and institutional affiliations. |
© 2022 by the authors. Licensee MDPI, Basel, Switzerland. This article is an open access article distributed under the terms and conditions of the Creative Commons Attribution (CC BY) license (https://creativecommons.org/licenses/by/4.0/).
Share and Cite
Alhazmi, W.; Jazaa, Y.; Althahban, S.; Mousa, S.; Abu-Sinna, A.; Abd-Elhady, A.; Sallam, H.E.-D.; Atta, M. Mechanical and Tribological Behavior of Functionally Graded Unidirectional Glass Fiber-Reinforced Epoxy Composites. Polymers 2022, 14, 2057. https://0-doi-org.brum.beds.ac.uk/10.3390/polym14102057
Alhazmi W, Jazaa Y, Althahban S, Mousa S, Abu-Sinna A, Abd-Elhady A, Sallam HE-D, Atta M. Mechanical and Tribological Behavior of Functionally Graded Unidirectional Glass Fiber-Reinforced Epoxy Composites. Polymers. 2022; 14(10):2057. https://0-doi-org.brum.beds.ac.uk/10.3390/polym14102057
Chicago/Turabian StyleAlhazmi, Waleed, Yosef Jazaa, Sultan Althahban, Saeed Mousa, Ahmed Abu-Sinna, Amr Abd-Elhady, Hossam El-Din Sallam, and Mahmoud Atta. 2022. "Mechanical and Tribological Behavior of Functionally Graded Unidirectional Glass Fiber-Reinforced Epoxy Composites" Polymers 14, no. 10: 2057. https://0-doi-org.brum.beds.ac.uk/10.3390/polym14102057