
Mechanical, Dynamic-Mechanical, Thermal and Decomposition Behavior of 3D-Printed PLA Reinforced with CaCO3 Fillers from Natural Resources

 , , , and
Abstract
:
1. Introduction
2. Materials and Methods
2.1. Materials
2.2. Filament Production and Temperature Printing Parameters
2.3. Manufacturing of the Test Specimens
2.4. Tensile and Flexural Testing
2.5. Differential Scanning Calorimetry (DSC)
2.6. Melt Flow Index (MFI)
2.7. Thermogravimetric Analysis (TGA)
2.8. Dynamic Mechanical Thermal Analysis (DMTA)
2.9. Microstructural Characterization
2.10. Surface Characterization
3. Results and Discussion
3.1. Differential Scanning Calorimetry and Melt-Flow Index
3.2. Tensile, Flexural, and Impact Testing
3.3. Thermograviemtric Analysis
3.4. Dynamic-Mechanical Analysis
3.5. Microstructural Characterization
3.6. Surface Characterization
4. Conclusions
Author Contributions
Funding
Institutional Review Board Statement
Informed Consent Statement
Data Availability Statement
Acknowledgments
Conflicts of Interest
References
- Parandoush, P.; Lin, D. A Review on Additive Manufacturing of Polymer-Fiber Composites. Compos. Struct. 2017, 182, 36–53. [Google Scholar] [CrossRef]
- Hofmann, M. 3D Printing Gets a Boost and Opportunities with Polymer Materials. ACS Macro Lett. 2014, 3, 382–386. [Google Scholar] [CrossRef] [PubMed]
- Gibson, I.; Rosen, D.W.; Stucker, B. Additive Manufacturing Technologies: Rapid Prototyping to Direct Digital Manufacturing; Springer: New York, NY, USA, 2010; ISBN 9781441911193. [Google Scholar]
- Mohan, N.; Senthil, P.; Vinodh, S.; Jayanth, N. A Review on Composite Materials and Process Parameters Optimisation for the Fused Deposition Modelling Process. Virtual Phys. Prototyp. 2017, 12, 47–59. [Google Scholar] [CrossRef]
- Yao, T.; Deng, Z.; Zhang, K.; Li, S. A Method to Predict the Ultimate Tensile Strength of 3D Printing Polylactic Acid (PLA) Materials with Different Printing Orientations. Compos. Part B Eng. 2019, 163, 393–402. [Google Scholar] [CrossRef]
- Ngo, T.D.; Kashani, A.; Imbalzano, G.; Nguyen, K.T.Q.; Hui, D. Additive Manufacturing (3D Printing): A Review of Materials, Methods, Applications and Challenges. Compos. Part B Eng. 2018, 143, 172–196. [Google Scholar] [CrossRef]
- de Leon, A.C.; Chen, Q.; Palaganas, N.B.; Palaganas, J.O.; Manapat, J.; Advincula, R.C. High Performance Polymer Nanocomposites for Additive Manufacturing Applications. React. Funct. Polym. 2016, 103, 141–155. [Google Scholar] [CrossRef]
- Mohamed, O.A.; Masood, S.H.; Bhowmik, J.L. Optimization of Fused Deposition Modeling Process Parameters: A Review of Current Research and Future Prospects. Adv. Manuf. 2015, 3, 42–53. [Google Scholar] [CrossRef]
- Stratasys Stratasys: 3D Printing & Additive Manufacturing|Stratasys. Available online: https://www.stratasys.com/ (accessed on 26 March 2020).
- Coppola, B.; Cappetti, N.; Di Maio, L.; Scarfato, P.; Incarnato, L. 3D Printing of PLA/Clay Nanocomposites: Influence of Printing Temperature on Printed Samples Properties. Materials 2018, 11, 1947. [Google Scholar] [CrossRef] [Green Version]
- Wittbrodt, B.; Pearce, J.M. The Effects of PLA Color on Material Properties of 3-D Printed Components. Addit. Manuf. 2015, 8, 110–116. [Google Scholar] [CrossRef] [Green Version]
- Groenendyk, M.; Gallant, R. 3D Printing and Scanning at the Dalhousie University Libraries: A Pilot Project. Libr. Hi Tech 2013, 31, 34–41. [Google Scholar] [CrossRef]
- Gkartzou, E.; Koumoulos, E.P.; Charitidis, C.A. Production and 3D Printing Processing of Bio-Based Thermoplastic Filament. Manuf. Rev. 2017, 4, 1. [Google Scholar] [CrossRef]
- Garlotta, D. A Literature Review of Poly(Lactic Acid). J. Polym. Environ. 2001, 9, 63–84. [Google Scholar] [CrossRef]
- Farah, S.; Anderson, D.G.; Langer, R. Physical and Mechanical Properties of PLA, and Their Functions in Widespread Applications—A Comprehensive Review. Adv. Drug Deliv. Rev. 2016, 107, 367–392. [Google Scholar] [CrossRef] [PubMed] [Green Version]
- Södergård, A.; Stolt, M. Properties of Lactic Acid Based Polymers and Their Correlation with Composition. Prog. Polym. Sci. 2002, 27, 1123–1163. [Google Scholar] [CrossRef]
- Liu, X.; Wang, T.; Chow, L.C.; Yang, M.; Mitchell, J.W. Effects of Inorganic Fillers on the Thermal and Mechanical Properties of Poly(Lactic Acid). Int. J. Polym. Sci. 2014, 2014, 827028. [Google Scholar] [CrossRef] [PubMed]
- Pawlak, F.; Aldas, M.; López-Martínez, J.; Samper, M.D. Effect of Different Compatibilizers on Injection-Molded Green Fiber-Reinforced Polymers Based on Poly(Lactic Acid)-Maleinized Linseed Oil System and Sheep Wool. Polymers 2019, 11, 1514. [Google Scholar] [CrossRef] [PubMed] [Green Version]
- Jang, W.Y.; Shin, B.Y.; Lee, T.J.; Narayan, R. Thermal Properties and Morphology of Biodegradable PLA/Starch Compatibilized Blends. J. Ind. Eng. Chem. 2007, 13, 457–464. [Google Scholar]
- Toro, P.; Quijada, R.; Yazdani-Pedram, M.; Arias, J.L. Eggshell, a New Bio-Filler for Polypropylene Composites. Mater. Lett. 2007, 61, 4347–4350. [Google Scholar] [CrossRef]
- NatureWorks. IngeoTM Biopolymer 2003D Technical Data Sheet for Fresh Food Packaging and Food Serviceware; Minnetonka: Minneapolis, MN, USA, 2013. [Google Scholar]
- ISO 527-1:2012; Plastics—Determination of Tensile Properties—Part 1: General Principles. International Standards Organization: Geneva, Switzerland, 2012.
- ISO 178:2011; Plastics—Determination of Flexural Properties. International Standards Organization ISO: Geneva, Switzerland, 2011; Volume 19.
- Atodiresei, G.-V.; Sandu, I.G.; Tulbure, E.-A.; Vasilache, V.; Butnaru, R. Chromatic Characterization in Cielab System for Natural Dyed Materials, Prior Activation in Atmospheric Plasma Type DBD. Rev. Chim. 2013, 64, 165–169. [Google Scholar]
- Nekhamanurak, B.; Patanathabutr, P.; Hongsriphan, N. Thermal-Mechanical Property and Fracture Behaviour of Plasticised PLA-CaCO3 Nanocomposite. Plast. Rubber Compos. 2012, 41, 175–179. [Google Scholar] [CrossRef]
- Melocchi, A.; Parietti, F.; Maroni, A.; Foppoli, A.; Gazzaniga, A.; Zema, L. Hot-Melt Extruded Filaments Based on Pharmaceutical Grade Polymers for 3D Printing by Fused Deposition Modeling. Int. J. Pharm. 2016, 509, 255–263. [Google Scholar] [CrossRef] [PubMed]
- Zilles, J.U. Micas. In Polymers and Polymeric Composites: A Reference Series Fillers for Polymer Applications; Springer: Cham, Switzerland, 2016; pp. 177–194. [Google Scholar]
- Móczó, J.; Pukánszky, B. Particulate Fillers in Thermoplastics. In Polymers and Polymeric Composites: A Reference Series Fillers For Polymer Applications; Springer: Cham, Switzerland, 2016; pp. 51–94. [Google Scholar]
- Nekhamanurak, B.; Patanathabutr, P.; Hongsriphan, N. Mechanical Properties of Hydrophilicity Modified CaCO3-Poly (Lactic Acid) Nanocomposite. Int. J. Appl. Phys. Math. 2012, 2, 98–103. [Google Scholar] [CrossRef] [Green Version]
- Silva, A.F.; Carneiro, O.S.; Gomes, R. 3D Printing of Polypropylene Using the Fused Filament Fabrication Technique. AIP Conf. Proc. 2017, 1896, 1–5. [Google Scholar] [CrossRef]
- Ahmed, A.A.; Susmel, L. Static Assessment of Plain/Notched Polylactide (PLA) 3D-Printed with Different Infill Levels: Equivalent Homogenised Material Concept and Theory of Critical Distances. Fatigue Fract. Eng. Mater. Struct. 2019, 42, 883–904. [Google Scholar] [CrossRef]
- Fernandez-Vicente, M.; Calle, W.; Ferrandiz, S.; Conejero, A. Effect of Infill Parameters on Tensile Mechanical Behavior in Desktop 3D Printing. 3D Print. Addit. Manuf. 2016, 3, 183–192. [Google Scholar] [CrossRef]
- Essabir, H.; Bensalah, M.O.; Rodrigue, D.; Bouhfid, R.; el Kacem Qaiss, A. A Comparison between Bio- and Mineral Calcium Carbonate on the Properties of Polypropylene Composites. Constr. Build. Mater. 2017, 134, 549–555. [Google Scholar] [CrossRef]
- Dasgupta Adak, M.; Purohit, K.M. Synthesis of Nano-Crystalline Hydroxyapatite from Dead Snail Shells for Biological Implantation. Trends Biomater. Artif. Organs 2011, 25, 101–106. [Google Scholar]
- Hernández-Hernández, A.; Vidal, M.L.; Gómez-Morales, J.; Rodríguez-Navarro, A.B.; Labas, V.; Gautron, J.; Nys, Y.; García Ruiz, J.M. Influence of Eggshell Matrix Proteins on the Precipitation of Calcium Carbonate (CaCO3). J. Cryst. Growth 2008, 310, 1754–1759. [Google Scholar] [CrossRef]
- Nekhamanurak, B.; Patanathabutr, P.; Hongsriphan, N. The Influence of Micro-/Nano-CaCO3 on Thermal Stability and Melt Rheology Behavior of Poly(Lactic Acid). Energy Procedia 2014, 56, 118–128. [Google Scholar] [CrossRef] [Green Version]
- Gao, W.; Ma, X.; Liu, Y.; Wang, Z.; Zhu, Y. Effect of Calcium Carbonate on PET Physical Properties and Thermal Stability. Powder Technol. 2013, 244, 45–51. [Google Scholar] [CrossRef]
- Pluta, M. Morphology and Properties of Polylactide Modified by Thermal Treatment, Filling with Layered Silicates and Plasticization. Polymer 2004, 45, 8239–8251. [Google Scholar] [CrossRef]
- Pluta, M.; Murariu, M.; Alexandre, M.; Galeski, A.; Dubois, P. Polylactide Compositions. The Influence of Ageing on the Structure, Thermal and Viscoelastic Properties of PLA/Calcium Sulfate Composites. Polym. Degrad. Stab. 2008, 93, 925–931. [Google Scholar] [CrossRef]
- Ren, Z.; Dong, L.; Yang, Y. Dynamic Mechanical and Thermal Properties of Plasticized Poly(Lactic Acid). J. Appl. Polym. Sci. 2006, 101, 1583–1590. [Google Scholar] [CrossRef]
- Djellali, S.; Sadoun, T.; Haddaoui, N.; Bergeret, A. Viscosity and Viscoelasticity Measurements of Low Density Polyethylene/Poly(Lactic Acid) Blends. Polym. Bull. 2015, 72, 1177–1195. [Google Scholar] [CrossRef]
- Menard, K.P. Dynamic Mechanical Analysis: A Practical Introduction, 2nd ed.; CRC Press: Boca Raton, FL, USA, 2008; ISBN 1420053132. [Google Scholar]
- Fiore, V.; Botta, L.; Scaffaro, R.; Valenza, A.; Pirrotta, A. PLA Based Biocomposites Reinforced with Arundo Donax Fillers. Compos. Sci. Technol. 2014, 105, 110–117. [Google Scholar] [CrossRef]
- Zuhaira, N.; Aziz, A.B.D.; Mohamed, R. Calcium Carbonate Composition Effect Upon Morphology, Water Absorption and Flexural. In Proceedings of the 63rd The IIER International Conference, Barcelona, Spain, 4 March 2016; pp. 20–24. [Google Scholar]
- Prez-Magario, S.; Gonzalez-SanJose, M.L. Prediction of Red and Rosé Wine CIELab Parameters from Simple Absorbance Measurements. J. Sci. Food Agric. 2002, 82, 1319–1324. [Google Scholar] [CrossRef]
- Pavon, C.; Aldas, M.; López-Martínez, J.; Ferrándiz, S. New Materials for 3D-Printing Based on Polycaprolactone with Gum Rosin and Beeswax as Additives. Polymers 2020, 12, 334. [Google Scholar] [CrossRef] [Green Version]
- Arrieta, M.P.; Peltzer, M.A.; López, J.; del Carmen Garrigós, M.; Valente, A.J.M.; Jiménez, A. Functional Properties of Sodium and Calcium Caseinate Antimicrobial Active Films Containing Carvacrol. J. Food Eng. 2014, 121, 94–101. [Google Scholar] [CrossRef] [Green Version]


| Property | Value | Property | Value |
|---|---|---|---|
| Density | 1.24 g/cm3 | Izod impact | 0.16 J/cm |
| Tensile strength | 53.0 MPa | Heat distortion temperature | 55 °C |
| Flexural strength | 82.7 MPa | Glass transition temperature | 55–60 °C |
| Tensile modulus | 3.61 GPa | Melting temperature | 140–160 °C |
| Flexural modulus | 3.83 GPa | Transmission (visible) | 90% |
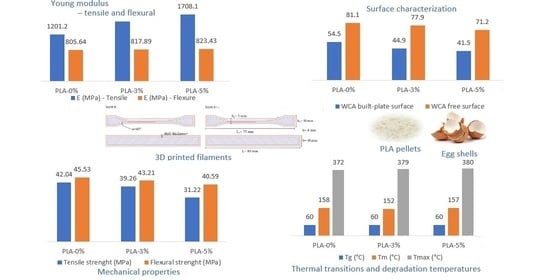
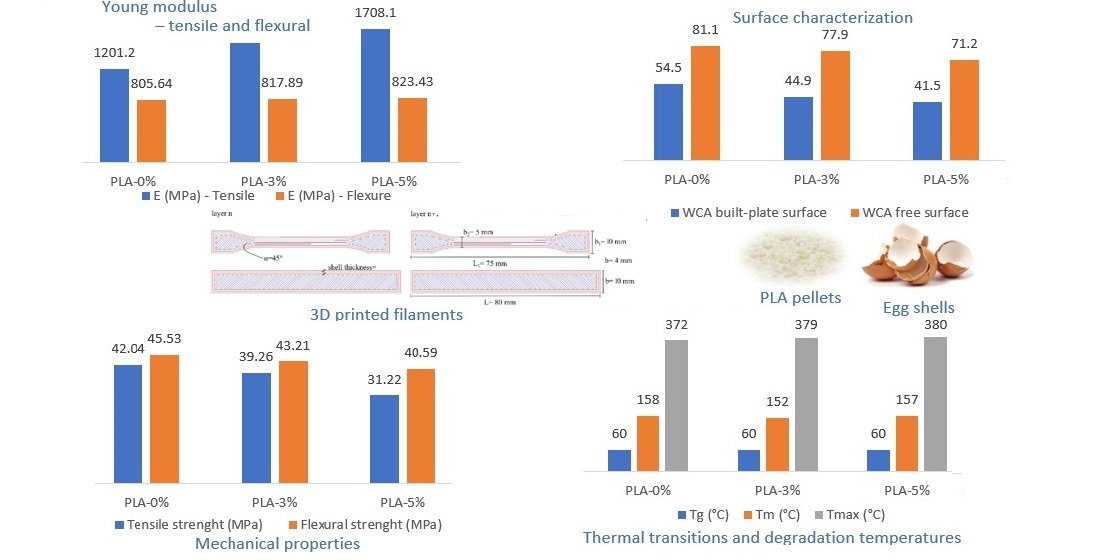
| Specimen | Tg (°C) | Tm (°C) | Tend (°C) | MFR (g/10 min at 190 °C) |
|---|---|---|---|---|
| PLA-0% | 60 | 158 | 185 | 10.10 ± 0.60 |
| PLA-3% | 60 | 152 | 183 | 10.43 ± 0.40 |
| PLA-5% | 60 | 157 | 186 | 10.32 ± 0.72 |
| Tensile Properties | Flexural Properties | |||||
|---|---|---|---|---|---|---|
| Material | Young’s Modulus (MPa) | Tensile Strength (MPa) | Elongation at Break (%) | Young’s Modulus in Flexure (MPa) | Flexural Strength (MPa) | Charpy’s Impact Energy (kJ/m2) |
| PLA-0% | 1201.2 ± 95.76 | 42.04 ± 1.98 | 9.79 ± 1.57 | 805.64 ± 10.113 | 45.53 ± 4.70 | 7.75 ± 0.13 a |
| PLA-3% | 1534.6 ± 185.71 | 39.26 ± 2.98 | 4.26 ± 0.63 | 817.89 ±21.54 | 43.21 ± 5.65 | 6.33 ± 0.91 b |
| PLA-5% | 1708.1 ± 43.22 | 31.22 ± 1.28 | 4.32 ± 0.45 | 823.43 ± 14.98 | 40.59 ± 6.67 | 6.19 ± 0.11 b |
| Material | T5% (°C) | Tmax (°C) | T95% (°C) |
|---|---|---|---|
| PLA-0% | 335 | 372 | 387 |
| PLA-3% | 334 | 379 | 400 |
| PLA-5% | 321 | 380 | 401 |
| Material | G′ at 40 °C (MPa) | G′ at 80 °C (MPa) | G′ at 120 °C (MPa) | T at Tan δ Peak |
|---|---|---|---|---|
| PLA-0% | 824 | 1.0 | 18 | 60.9 |
| PLA-3% | 721 | 1.1 | 12 | 61.2 |
| PLA-5% | 890 | 1.2 | 12 | 60.8 |
| Material | WCA Build-Plate Surface | WCA Free Surface | L* | a* | b* | YI | ΔE |
|---|---|---|---|---|---|---|---|
| PLA-0% | 54.5 ± 2.3 a | 81.1 ± 2.3 a | 59.6 ± 1.5 a | −0.9 ± 0.1 a | 3.2 ± 0.2 a | 8.5 ± 0.7 a | 0.7 ± 0.3 a |
| PLA-3% | 44.9 ± 2.8 b | 77.9 ± 2.5 b | 72.1 ± 1.4 b | −0.6 ± 0.1 b | 8.7 ± 0.4 b | 20.6 ± 0.9 b | 13.4 ± 1.0 b |
| PLA-5% | 41.5 ± 1.8 c | 71.2 ± 2.0 c | 78.3 ± 0.5 c | −0.2 ± 0.1 c | 12.6 ± 0.3 c | 27.9 ± 0.6 c | 21.6 ± 0.7 c |
Publisher’s Note: MDPI stays neutral with regard to jurisdictional claims in published maps and institutional affiliations. |
© 2022 by the authors. Licensee MDPI, Basel, Switzerland. This article is an open access article distributed under the terms and conditions of the Creative Commons Attribution (CC BY) license (https://creativecommons.org/licenses/by/4.0/).
Share and Cite
Pavon, C.; Aldas, M.; Samper, M.D.; Motoc, D.L.; Ferrandiz, S.; López-Martínez, J. Mechanical, Dynamic-Mechanical, Thermal and Decomposition Behavior of 3D-Printed PLA Reinforced with CaCO3 Fillers from Natural Resources. Polymers 2022, 14, 2646. https://0-doi-org.brum.beds.ac.uk/10.3390/polym14132646
Pavon C, Aldas M, Samper MD, Motoc DL, Ferrandiz S, López-Martínez J. Mechanical, Dynamic-Mechanical, Thermal and Decomposition Behavior of 3D-Printed PLA Reinforced with CaCO3 Fillers from Natural Resources. Polymers. 2022; 14(13):2646. https://0-doi-org.brum.beds.ac.uk/10.3390/polym14132646
Chicago/Turabian StylePavon, Cristina, Miguel Aldas, María Dolores Samper, Dana Luca Motoc, Santiago Ferrandiz, and Juan López-Martínez. 2022. "Mechanical, Dynamic-Mechanical, Thermal and Decomposition Behavior of 3D-Printed PLA Reinforced with CaCO3 Fillers from Natural Resources" Polymers 14, no. 13: 2646. https://0-doi-org.brum.beds.ac.uk/10.3390/polym14132646