Article

Analysis of the Heterogeneities of First and Second Order of Cellulose Derivatives: A Complex Challenge

1
Institute of Food Chemistry, Technische Universität Braunschweig, Schleinitzstr. 20, D-38106 Braunschweig, Germany
2
Research Institute of Feed Technology, Frickenmühle 1A, D-38110 Braunschweig, Germany
3
Chair for Functional Materials, Dresden University of Technology, Stadtgutstr. 59, D-01217 Dresden, Germany
*
Author to whom correspondence should be addressed.
Submission received: 30 September 2021 / Revised: 21 October 2021 / Accepted: 27 October 2021 / Published: 3 November 2021
(This article belongs to the Special Issue (Nano)cellulose: Extraction, Characterizations, Application)

Abstract

:
The complexity of the substituent distribution in polysaccharide derivatives is discussed and defined. The challenges regarding analytical characterization that results from various interrelated categories of distributions, including molecular weight, chemical composition, and microstructure, are outlined. Due to these convoluted levels of complexity, results should always be interpreted with carefulness. Various analytical approaches which have been applied to starch and cellulose derivatives are recapped, including enzymatic, mass spectrometric, and chromatographic methods. The relation of heterogeneities of first and second order among and along the polysaccharide chains is addressed. Finally, examples of own analytical work on cellulose ethers are presented, including the MS analysis of methyl cellulose (MC) blends and fractionation studies of fully esterified MC, especially its 4-methoxybenzoates by gradient HPLC on normal phase. Preparative fractionation according to the degree of substitution (DS) allows follow-up analysis in order to get more detailed information on the substituent distribution in such sub-fractions.

1. Introduction

Chemical modification of polysaccharides, especially of the most abundant ones, cellulose and starch, has a long history. Properties and fields of application of these biopolymers have thus been widely extended since the mid of the 19th century. In industrial processes, both glucans are modified in heterogeneous reactions. Starch granules are suspended in water to give a slurry. Reagents need to diffuse into swollen granules. Depending on the ratio of diffusion and reaction rate, the final distribution of substituents can be more or less uniform over the granule. Due to channels in the granules, the diffusion might be fast [1,2,3,4,5,6].
The β-1,4-linked and unbranched cellulose is also organized in a supramolecular structure, however, a complete different one. Due to the unique stereochemistry with all equatorial OH groups and glycosidic linkages, strong co-operative intra- and intermolecular hydrogen bonding patterns exist in the horizontal plane, while hydrophobic C-H linkages above and below the glucopyranosyl rings have been discussed as structural feature, causing an amphiphilic character [7,8]. This unique structure provides cellulose with extraordinary physical and chemical properties [9,10], for instance high mechanical strength and non-solubility in common solvents. The hierarchical order of the cellulose structure is critical for its natural function. Its disintegration to micro- and nanoscale particles and fibers has opened a new field of research about the preparation, application, and understanding of new functional materials. Crystalline regions alternate with amorphous domains which are less ordered, less dense, and are assumed to be better accessible [11]. To enable the access of all glucosyl units in the commonly heterogeneous cellulose modification, activation of these crystalline areas is a crucial step. In industrial etherification, cellulose is usually swollen and activated by concentrated aqueous sodium hydroxide (18–50%) [12]. Above a certain concentration, depending on the type of cellulose at 10–15%, alkaline lye can swell cellulose fibers and make them reactive on a molecular level. This activation process goes along with deprotonation of hydroxyl groups, making them good nucleophiles for the attack of alkyl halides or oxiranes. Since these substitution and addition reactions are irreversible and thus kinetically controlled, it is obvious that uniformity, i.e., perfect random substituent distribution, over the entire material and cellulose chains would require a simultaneous start of the reaction at the same rate all over the reactor. It can be easily imagined that this requirement will not be perfectly fulfilled under real conditions. In case of thermodynamically controlled reactions, for instance nitration, sulfation, organic esterification, or acrylonitrile addition, substituent distribution has the chance to equilibrate according to thermodynamic stabilities-provided that reaction conditions render this possible.

1.1. How Complex?

Needless to say that it was obvious from the beginning of cellulose modification that the degree of substitution (DS = number of modified OH/glucosyl unit) influences the properties, since this was eventually the goal of these efforts. But it took some time to realize the complexity of this question. Latest in the thirties of the 20th century, characterization of cellulose esters and ethers was no longer limited to the average DS, but also directed to the distribution on the different hydroxyls in the monomer unit and in the polymer as well [13]. The work of Spurlin [14] about the kinetics and thermodynamics of consecutive reactions in the polyfunctional cellulose published in 1939 is a pioneer work highly regarded even today. Spurlin made a number of assumptions, among others, that the OH groups in the positions 2, 3, and 6 of the glucosyl units react independently from each other, i.e., the relative rate constants ki (i = 2, 3, 6-position of the glucosyl unit) do not change during the course of the reaction. Primary substitution does not influence the reactivity of neighbored OH. Chain ends are neglected. According to this “Spurlin model”, the substituent distribution in the form of the mol fractions si (si = mol fractions of i-substituted glucosyl units, i = 0, 2, 3, 6 and all combinations possible) can be calculated as a “weighted random one” from the partial DS values xi (i = 2, 3, 6; ∑xi = DS). Regarding the relative reactivities of these three different OH groups in a glucopyranosyl ring, the following can be stated. There is one primary (position 6) and two vicinal secondary OH (2 and 3). Primary alcohols are more acidic than secondary ones, however, 2-OH is even more acidic due to the electron withdrawing effect of the adjacent anomeric center. (This phenomenon is much more pronounced in starch with its axial glucosidic bond than in cellulose.) Thus, in cellulose, the order of acidity is 2 > 6 > 3. This is of relevance in base catalyzed kinetically controlled reactions. On the other side, the primary 6-OH is sterically less hindered, which has been used for the selective protection of this position, e.g., in trityl or TBDMS celluloses [15,16,17]. Furthermore, the reactivity is not generally independent on the neighbored position. For instance, by the primary product of the addition of oxiranes, i.e., an anionic hydroxyalkyl ether, deprotonation of the neighbored OH is entropically favored [18]. If at all, such neighboring group effects occur everywhere in a nanoscale dimension. They have an impact on the substituent distribution in the glucosyl unit, but in every glucosyl unit. They cause a deviation from the Spurlin model but can be fitted by extended models like the Spurlin II or Reuben model, which additionally considers the influence of O-2 substitution on the reactivity at O-3, leading to k3′ beside k3 [19]. The message is that there is no fixed order or ratio of reactivities, but preferences which can be influenced in a certain range by the reaction process [20]. The theoretical mol fractions of the constituents si can be calculated for a set of experimentally determined xi-values according to the Spurlin model. This weighted random distribution is then compared with the experimental si data. This is, so to speak, the one-dimensional or the first structural level of the substituent distribution in cellulose derivatives (see Figure 1).

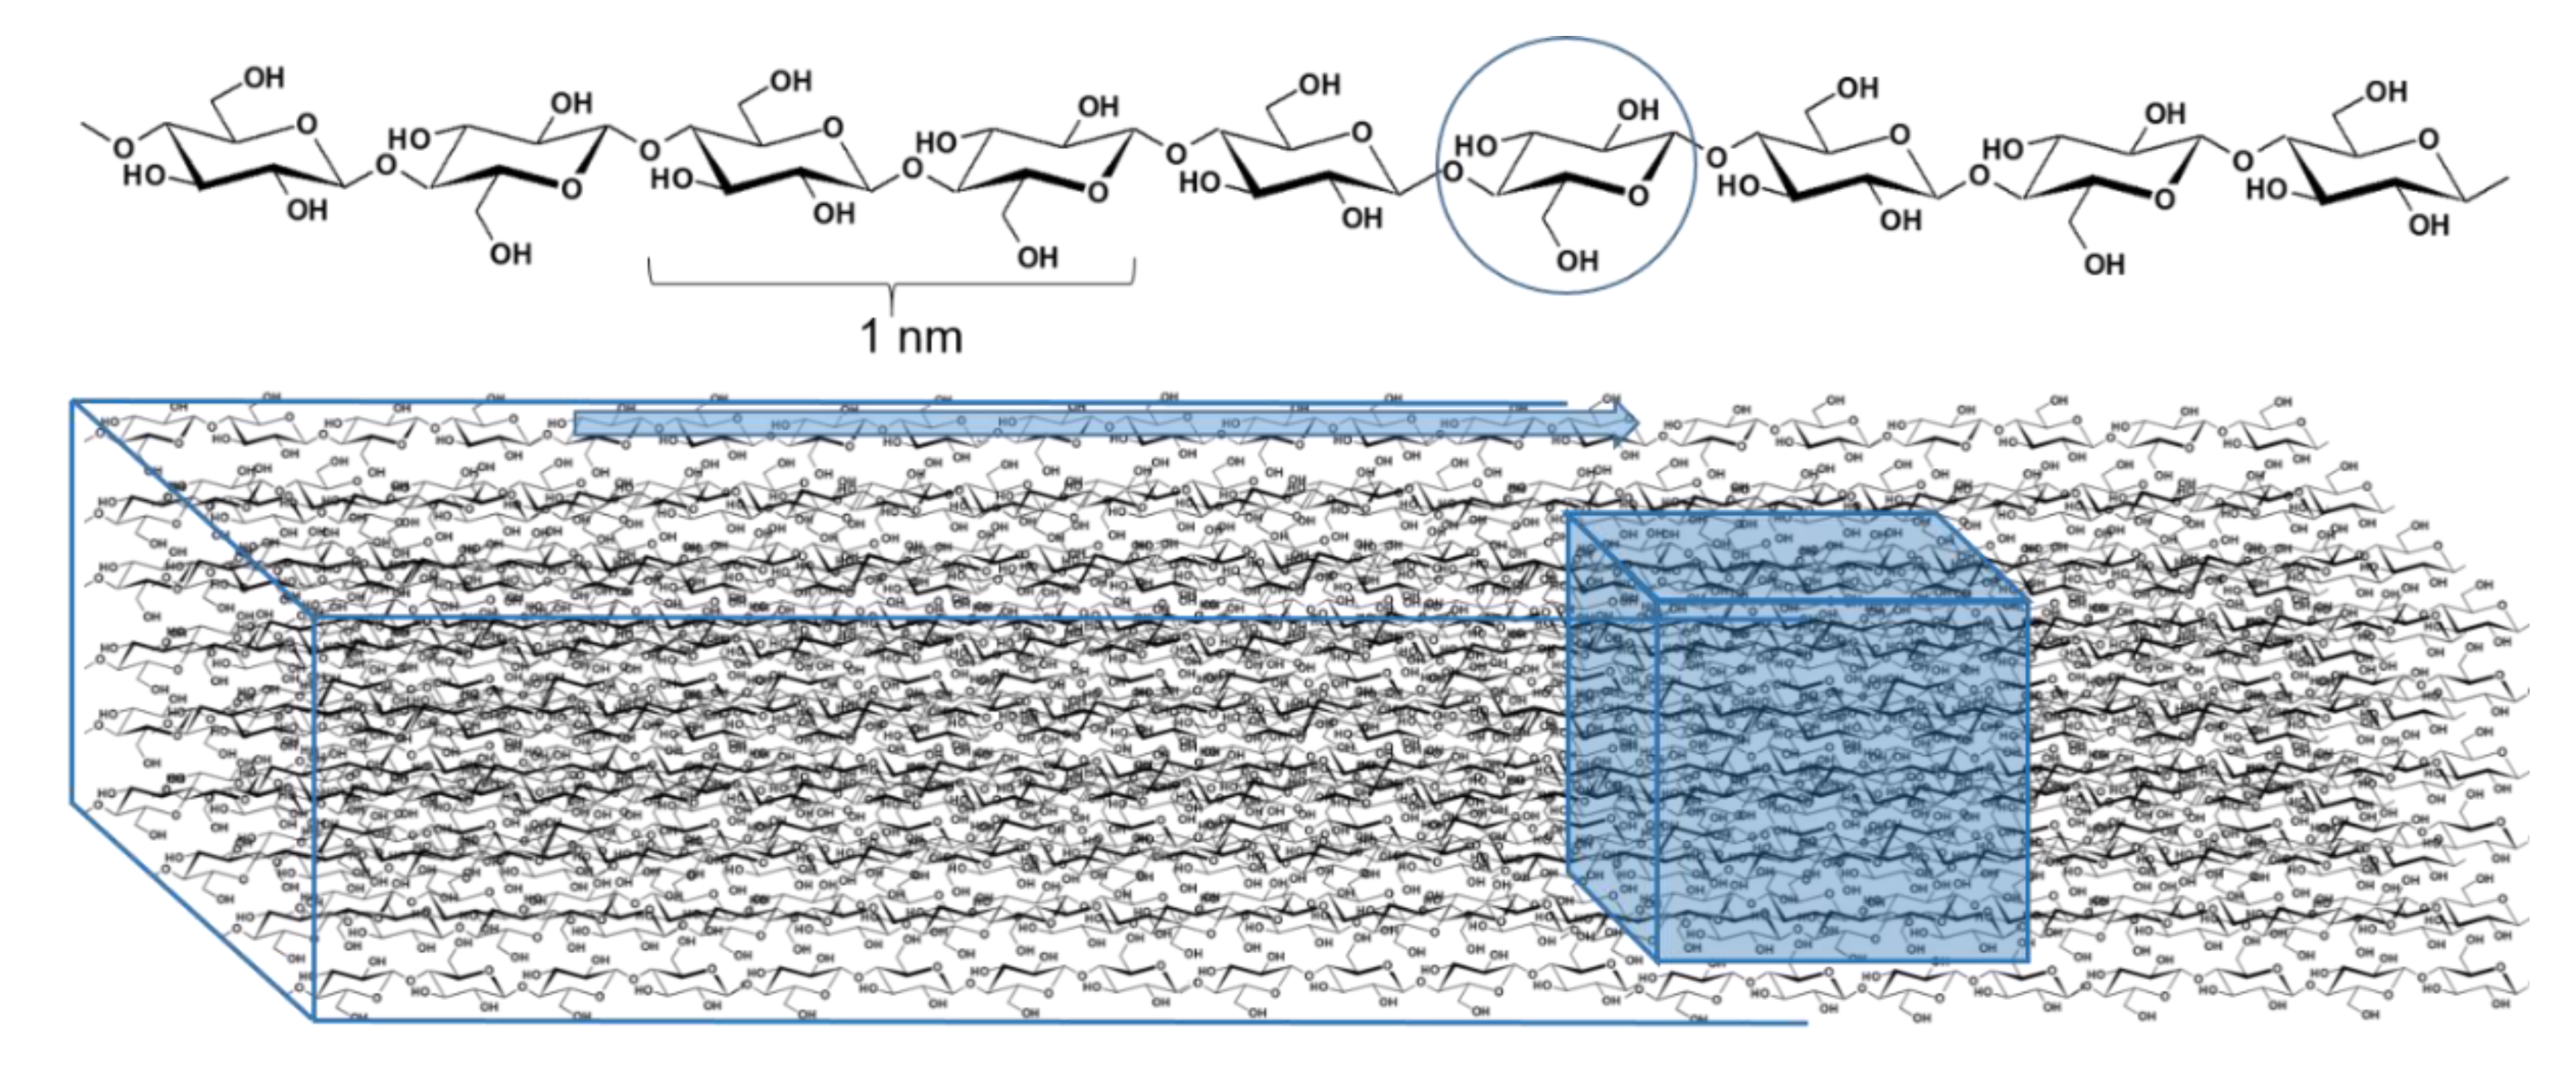
1.2. The Two- and Three-Dimensional Substituent Distribution

Let us go the next step from the glucosyl unit to the macromolecule. The product of polymer-analog modification can be considered as a “copolymer” with—in case of one type of substituent—eight different types of monads si. Of course, this does not imply formation by copolymerization, but the final product reassembles a complex copolymer. Employing the cationic ring-opening polymerization of 1,2,4-ortho-pivalate activated glucose derivatives, developed and in many cases applied by Nakatsubo and Kamitakahara and coworkers [21,22], such 1,4-β-glucan derivatives are even available by co-polymerization.
When Spurlin’s assumption of independent reactivities of OH in a glucosyl unit is applied to the glucosyl units in the cellulose chain, one can calculate the probabilities of the various possible substituent distributions in oligomeric domains of various DP (DP = degree of polymerization), accordingly [23,24,25]. This is the two-dimensional or the second structural level of the substituent distribution (Figure 1). For DP2 comprising two glucosyl units, each with eight (n) different possibilities of substitution, nDP = 82 = 64 different patterns are possible. If we neglect the asymmetry of a disaccharide, we can reduce the number to 34 [26]. And if we summarize cellooligomeric domains with an equal total number of substituents, while disregarding their location (i.e., all constitutional isomers with the same mass), the number of different types reduces to 7, more generally to 3·DP + 1. These various groups of constitutional isomers of a particular DP can be differentiated by mass spectrometry, which is important for analytics. In case all glucosyl units of one as well as of all other cellulose macromolecules would react at the same rate, starting at the same time, an entirely random distribution would be the result. The distribution of the substituents would only vary with respect to statistics but within its normal distribution curve be identical for all cellulose chains, i.e., the three-dimensional substituent distribution (Figure 1).
Since the relative reactivities of 2-, 3-, and 6-OH naturally are different (see above), such a statistic distribution differs with respect to regioselectivity for the three OH in the glucosyl units. The larger the preference for a particular position, the narrower is the DS-distribution on the macromolecular level, the smaller are the local differences [25,27]. Figure 2 shows the calculated DS profiles for two randomly substituted MCs with DS 1.99, one with equal substitution at positions 2, 3, and 6 in the glucosyl unit, one substituted with higher regioselectivity (50% at O-2, 10% at O-3, 40% at O-6). It is obvious that the profiles are much narrower for the more selective case. This means a fast leveling of the methyl density with increasing length of domains. And even in case of neighboring group effects, those would have only indirect impact on the distribution in the chain by means of the affected ratio of the monomer constituents (the monads), but would not influence the distribution of these substituted glucosyl constituents along and among the chains.
This means that the width of the substituent distribution on the macromolecular level will be identical within the statistical variance for all cellulose molecules. Thus, there is no difference with respect to the heterogeneity of first order, i.e., the distribution among the polymer chains (intermolecular heterogeneity) and the heterogeneity of second order, i.e., along the polymer chains (intramolecular heterogeneity). This is the theory. However, in practice, in a large scale reactor containing activated cellulose, the reaction will not start at the same time and at the same rate for all molecules. Reaction conditions as concentration of reagents, temperature, and activation state of the cellulose will not be fully identical, either locally or temporally. That means we expect a certain deviation from the normal distribution. That is what we call heterogeneity in contrast to what is often called “uniformity”, “even distribution”, or “homogeneity”. Especially the latter could be misunderstood, since even in “uniform” cellulose ethers with a DS < 3, there is no uniformity in the sense that we have equal molecules. Nearly uniform compounds, for instance regioselectively O-methylated glucans, have only been obtained by synthesis using protecting group chemistry [16,17,28,29], or by de-novo synthesis, the already mentioned ring-opening polymerization of activated glucosyl derivatives [17,21,22]. “Heterogeneity” comprises all deviations from statistics. This might be, for instance, a broader substituent distribution compared to the theoretical DS variance within the material, or bimodality, e.g., due to residual crystalline domains that have remained nearly unaffected. The symmetry of the substituent distribution profile of such compounds is lost: the profiles usually become distorted or even bimodal [24,25,30,31]. The question arises, whether such effects cause differences between heterogeneities of first and second order, i.e., among and along the polymer chains. The pivotal aspect in this regard is the local difference of two considered domains: In the case of second order heterogeneity, the maximal distance is limited by the dimension of the macromolecule, i.e., in the range of hundreds of nm (0.5 nm/DP), while for independent macromolecules, it is determined by the dimension of the reactor.
But the situation is even more complex. So far, we have disregarded that polysaccharides exhibit a molecular mass distribution (dispersity). The question, whether DS and substituent distribution are independent of DP or whether shorter chains are modified to a larger extent cannot be answered definitely. Since mass and properties depend on both DS and DP, it is hard to fractionate a cellulose derivative exclusively according to chemical composition or molar mass (see below).
To know as many as possible details of this complex puzzle is of great interest, since these have an impact on the physicochemical properties as solubility, solution state, or gelling behavior, hysteresis of gels, etc.

1.3. Analytical Approaches

The analysis of polysaccharide derivatives has been reviewed in 2012 [31]. In the last decades, various analytical approaches to gain more insight into the substituent distribution, for instance by applying enzymes as selective tools, have been reported for starch [32,33,34] or cellulose derivatives [35,36,37,38,39,40]. In our group, we developed mass spectrometric methods for a number of ether and ester derivatives [31,41,42,43]. Briefly, the cellulose derivative is converted to a mixture of representative oligosaccharides, capable of quantitative MS analysis [23,25,31]. By the analysis of oligomeric domains, derived from the polymer by partial random degradation, information about the two- and three-dimensional substituent distributions, the heterogeneities of second and first order, are obtained. These two dimensions can usually not be differentiated, since the origin of an oligosaccharide, whether from the same or another chain cannot be traced back from the measurement data.
The same applies to the enzymatic methods mentioned above. Released glucose or non-digestible oligosaccharides cannot be traced back to their origin from one or different polysaccharide chains. There is not a particular sequence of the macromolecules as in DNA or proteins, but these two levels are strongly related to each other. From an analytical point of view, the key difference is that independent macromolecules can be separated (according to their chemistry and/or size), while domains located on the same macromolecule cannot. Therefore fractionation of the intact polymeric material has to be performed in at least semi-preparative scale, followed by oligomer profile analysis of all fractions to enhance the resolution of pattern analysis.
But such separations are also valuable in the analytical scale. Copolymers can be separated according to molecular weight by size exclusion chromatography (SEC), which is controlled by entropic changes, and on the other hand by liquid adsorption chromatography (LAD) with respect to their chemical composition distribution (CCD), driven by enthalpic differences of interaction. Since large molecules are strongly adsorbed on stationary phases, an appropriate eluent composition is required to elute them at all. At these critical conditions of adsorption (CCA), entropic and enthalpic factors counterbalance each other (steric and attractive forces). Already for statistical or blocky copolymers of type AnBm, the theory as well the behavior is very complex. The reader is referred to review articles of Brun [44], Pasch and Trathnigg [45], or Radke [46]. Polysaccharide derivatives are even more complex with respect to CCD and microstructure. As we have seen, instead of two, they consist of eight different monads. For simplification, one can consider the two types of functional groups, e.g., OR and OH, as the constituents A and B of a copolymer as has been reported by Radke et al. [47,48,49,50]. Shakun et al. profiled the DS and the Mw distribution of carboxymethyl cellulose (CMC) [47,48], and Ghareeb and Radke that of cellulose acetates (CA) [49,50] by 1D- and 2D-chromatography, giving insight into the chemical dispersity of the samples related to their molecular weight distribution. Blends of CMC could be nicely separated in 2D plots. However, no additional information on the monomer and oligomer level which could be correlated with the chromatographic data was available. By normal phase gradient HPLC, CA in the DS range of 1.5–2.9 were separated according to DS [49,50]. Since retention in interaction chromatography also depends on molar mass up to a certain Mw, early eluting fractions in gradient HPLC will comprise CA molecules from the low molecular weight end, covering a certain DP and DS range, with lower DS for lower Mw and higher DS for higher Mw [50]. Therefore, in SEC the early fractions from gradient HPLC show broader mass distributions than expected. On the other hand, the molar mass does not only depend on the DP of the cellulose chains, but also on DS. The contribution of the substituents to the total molar mass is for instance already 34% for a CA of DS 2.0. (DP100/DS2.0 has the same molar mass as DP120/DS1.1.) And the change in chemistry might also influence the hydrodynamic volume. The chemistry does not only mean the average DS, but furthermore the substituent distribution in the glucosyl units. For example, the gelling temperature of MCs with the same average DS can strongly be shifted by a change in the regioselectivity of substitution [20], which hints at a correlation between molecular interactions—usually on the scale of oligomeric domains—and regioselectivity of substitution. From 2D-separations of CMCs in the DS range of 0.45–1.55, Ghareeb and Radke concluded that the DS was independent of DP [48]. On the contrary, Fischer et al. [51] concluded from their SEC/UV studies of two benzylamidated CMC a more or less decreasing DS with the molecular mass of CMC, depending on its viscosity. The same relation was observed for xanthogenates by them [51], while for CA, measured as phenylcarbamates, they reported the opposite relation [52]. All in all, this makes the interpretation of the elution profiles of 2D separations of these complex compounds crucial and the question whether the DS is dependent on molar mass cannot easily be answered. Fitzpatrick et al. fractionated MC (DS 1.8) by SEC and determined the DS of the fractions after acetylation by 1H NMR spectroscopy [53]. A slight but not significant decrease in DS with Mw was observed and no difference in thermogelation behavior which is dependent on DS.
CMCs have been directly separated by capillary electrophoresis (CE) to obtain an individual profile of a particular CMC [54]. In another example, CM-cellooligosaccharides (COS) were generated and concomitantly dissolved by methanolysis of CMC in a heterogeneous process. Higher substituted CM-COS are released preferentially. Therefore, the soluble portions showed larger DS, while finally retaining a small insoluble residue containing the most heterogeneous, lowest substituted portion [55]. The average Mw of the insoluble portion also decreased with progressing methanolysis, indicating that not higher substituted molecules of lower molar mass are preferentially degraded, but the higher substituted domains in the chains were easier accessible. From the results of further comprehensive analyses of all soluble and insoluble fractions, an entire picture of the CMC could be reconstructed.
Chemistry-related and thus DS-dependent solubility can also be used for fractionation. Leaving the macromolecules intact, we stepwise extracted various MCs of the same average DS by applying solvent mixtures of increasing polarity (CHCl3/MeOH, MeOH/H2O) [56]. Extracts showed decreasing DS with increasing polarity of the solvent, and strong enrichment of low substituted and heterogeneous portions in the insoluble residue [25,56]. For the non-soluble residue of one MC, which was produced with poor alkali-activation, a bimodal methyl distribution could be recognized with enlarged portions on non-substituted domains. Another example of separation and study of fraction properties is reported by Greiderer et al. [57], dealing with thermo-responsive 2D-chromatography of a set of hydroxypropyl methylcelluloses (HPMC). Viridén et al. [58] separated HPMC by successive thermogelation.
In older work, fractional dissolution and fractional precipitation of cellulose ethers have been studied comprehensively. However, subsequent analysis mainly referred to average MS and Mw. For instance, Wirick et al. [59] fractionated high substituted HPCs (MS > 4) by stepwise dissolution of the solid material in mixtures of dry ethanol (solvent) and n-heptane (non-solvent) with increasing amounts of ethanol. Increasing molecular mass at slightly decreasing MSHP was found (e.g., in a range of 3.85–4.65 at an average MSHP of 4.30). Spurlin reported on fractionated precipitation of cellulose nitrate from an acetone solution by heptane and subsequent study of properties [60].
Applying our MS analysis of oligomeric domains to HPMC, enhanced resolution of the substituent distribution was achieved by using the number of HP groups as a probe [61]. By mass spectrometric separation only, it became possible to consider sub-patterns of the methyl distribution: The lower the number of HP, and especially for the fraction with n(HP) = 0, the lower was the methyl DS and the more heterogeneous the methyl distribution. This effect was better visible the smaller a considered fraction was, since the poorly activated portions of cellulose usually are present on very low amounts. To see their deviating substitution requires to avoid “dilution” of these portions by the much larger number of randomly substituted molecules [25,61].

1.4. Résumé

As mentioned above, in the ideal case, i.e., all cellulose chains in a bulk material (in the reaction vessel are evenly accessible and activated and can react at the same rates (k2, k3, (k3′), k6) in space and in time, there is no basic difference between distributions along and among the chains, but only a DP-related difference of the width of the symmetrical DS distribution (chain ends are neglected). In the real case, the question is: What is the extent and scale of inhomogeneity (regarding the molecular dimension), which cause deviation from the ideal case? How does the distribution of substituents qualitatively and quantitatively deviate from this random reference model (Figure 2), e.g., by distortion or bimodality?
Thus, the question arises, whether DS differences or gradients have been established on a macroscopic scale, e.g., due to non-uniform reaction conditions, for instance a temporally and local concentration gradient of reagents, or local clusters of non-activated material with unaffected crystallinity in the bulk. And the next question asks about the relation of the scales of such spatial variances compared to the extension of the individual molecules. In case of pronounced differences of these dimensions, the material might be closer to a “complex blend” of randomly substituted cellulose molecules of different DS than to heterogeneously modified chains.
Beside local variances, temporal differences might play a role. Depending on scale and dosing, or temperature control, reaction conditions might locally change over time, causing local delay of otherwise similar reactions. Furthermore, even if the relative rate constants ki remain constant over the course of the reaction, the absolute rate of transformation/conversion will decrease for a certain molecule due to decrease of the concentration (number) of free OH. As a consequence, molecules starting with delay or slower rate might catch up with time. But it must also be considered that poorly activated molecules will more and more fall behind the more smoothly/readily reacting ones. Thus, there might be a convergent and divergent development at the same time.
In the following, experimental approaches and their informational power with respect to various levels of substituent distributions are presented and shall open perspectives for future work and progress in this field.

2. Materials and Methods

2.1. General

MCs were provided by Dow Wolff, Bomlitz, Germany, or purchased from Sigma Aldrich, Steinheim, Germany. Solvents (acetone, ACN, DCM, DMSO, EtOAc, EtOH, n-hexane, MeOH, 2-PrOH, pyridine, THF, toluene) and reagents (trifluoroacetic acid (TFA), trifluoroacetic acid anhydride (TFAA), glacial acid (HOAc), HCOOH, MeI-d3, propionic acid, methoxybenzoic acid, methoxybenzoic chloride, m-amino-benzoic acid (m-ABA), picoline borane) were from Fluka, Buchs, Switzlerland, Sigma-Aldrich (see above) or Merck, Darmstadt, Germany. Dialysis tube, MWCO 14000, was from Roth, Karlsruhe, Germany; SPE cartridges: Isolute Si, 12.5 × 200 mm, were from Biotage, Lund, Sweden; RP18 cartridges, 8 × 15 mm, were from Varian, Darmstadt, Germany; Strata-X-A (8B-S123-FCH), 6 mL, were purchased from Phenomenex, Aschaffenburg, Germany.

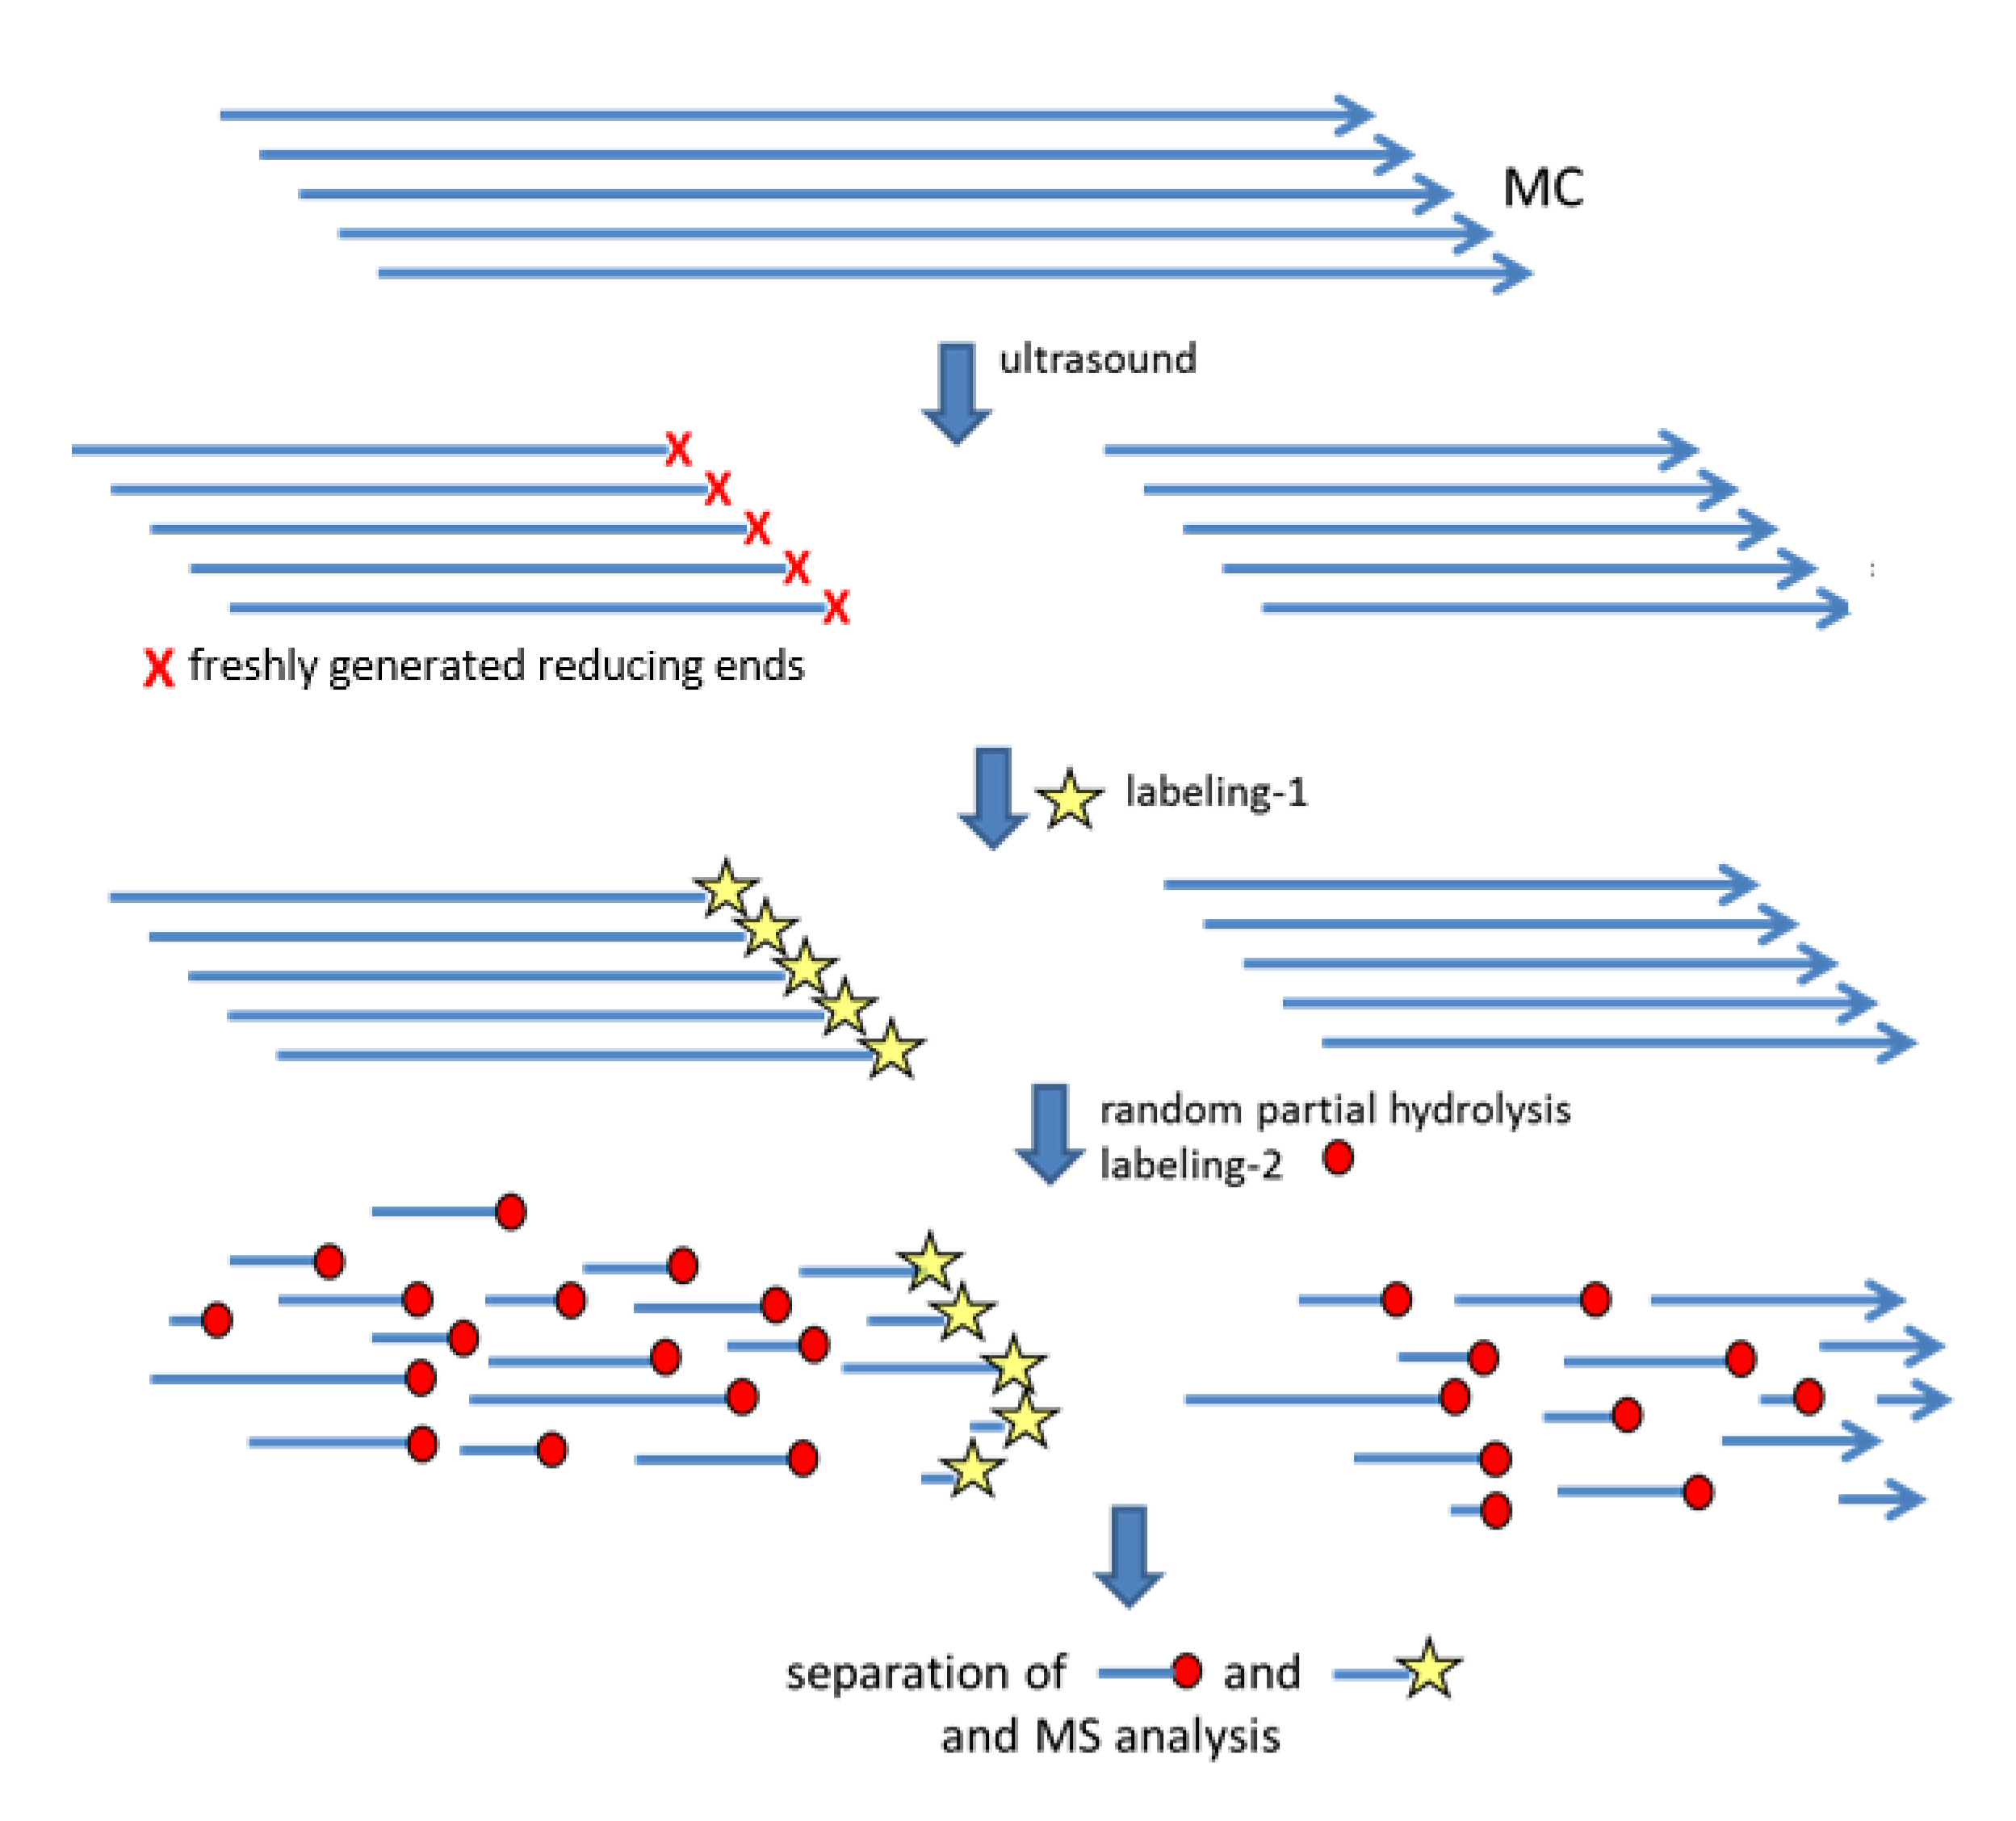
2.2. Preparation of One Labeled Oligosaccharide per Chain

The procedure was applied to an MC (DS 1.95) and a blend of two MCs (DS 1.29 and 1.95, 2:3, average DS 1.67).

2.2.1. Ultrasonic Treatment

A Sonopuls HD 3200 from Bandelin was used. HF power: 200 Weff, working frequency 20 kHz. Sonotrode: KE76, titan-aluminium alloy; diameter 6 mm; length 135 mm; submersion depth: 17 mm. Amplitude applied: 15%, pulse times: 5 s active, 2 s break. The perdeuteromethylated MC (MDC, ca. 200 mg) in a 50 mL round bottom flask was dissolved in 20 mL distilled dichloromethane (DCM) and subsequently diluted with 30 mL freshly distilled THF. The solution was cooled to 0 °C and treated with pulsed ultrasound for 6 h. The solvents were removed in vacuum and the MDC residue dissolved in DCM and centrifuged to remove the metal abrasion. This procedure was repeated twice. DCM was removed in vacuum and stepwise substituted by MeOH. Subsequently, the MeOH was removed and stepwise substituted by water. The ultrasonic-treated MDC precipitated and was freeze-dried.

2.2.2. Labeling by Reductive Amination with m-ABA

Ultrasonic-treated MDC (180 mg) in a 100 mL round bottom flask was dissolved in 15 mL DCM and diluted with 20 mL MeOH. m-ABA (64 mg in 5 mL MeOH) and 5 mL HOAc was added. The mixture was stirred at 40 °C for 30 min. Then, picoline borane (51 mg in 1.25 mL MeOH) was added and the mixture stirred again at 40 °C for 90 min. Solvents were removed and the residue dissolved in DCM/MeOH. The procedure was repeated twice. Further work-up was as described in Section 2.2.1.

2.2.3. Partial Hydrolysis

MDC was dissolved in water/acetone (16/21 v/v). After 2 h at r.t., TFA (3 v) was added (resulting in cTFA 1 M). The solution was heated to 120 °C for 20 min. After cooling, the solvent was evaporated and the residual acid removed by repeated co-distillation with toluene.

2.2.4. Separation of Labeled and Non-Labeled O-Me/O-Me-d3-Cellooligosaccharides (COS)

The partially labeled COS mixture of 2.2.3 (50 mg) was dissolved in 10 mL MeOH/H2O (1:1, v/v) and the pH adjusted at 8 with 2 M NH3. The Strata-X-A cartridge was conditioned with 6 mL MeOH followed by 6 mL H2O. The COS solution (2 mL containing 10 mg) was given on a cartridge. The unlabeled COS was not adsorbed and eluted with 3 × 2 mL MeOH. Subsequently, the labeled COS was eluted with 3 × 2 mL 5% HCOOH in MeOH. The successful separation was checked by TLC on RP18 (1% HOAc in ACN/H2O (1:1, v/v). The combined fractions were evaporated to dryness.

2.3. Instrumentation

Electrospray Ionization-Mass Spectrometry (ESI-MS)

ESI-IT Mass spectra were recorded on a HCT Ultra ETDII (Bruker Daltonics, Bremen, Germany), equipped with an ion trap. Mass spectra evaluation was performed with Data Analysis (Bruker Daltonics, Bremen, Germany). Syringe pump infusion: The analyte solutions (~0.02 mg/mL in MeOH) were infused directly with a syringe at a flow rate of 200 µL/h. Each spectrum was an average of 200 scans. Nitrogen was used as dry gas (6 L min−1, 300 °C) and as nebulizer gas (10 psi). The following voltages were used: capillary ±4500 V, end plate offset ±500 V). Target mass: 1000; LC-MS: The HPLC separation was carried out on an Agilent HPLC system consisting of a binary pump (1100 Series) and a DAD (G1312A). A C18-column (Phenomenex, Kinetex, 2.6 µm, 100 × 2.1 mm) was used with H2O/HOAc (99/1, v/v) (A) and ACN/HOAc (99/1, v/v) (B) in a gradient system and a flow rate of 0.2 mL/min; injection volume 5 µL. MS parameters were as reported for syringe pump infusion with the exception of the nitrogen gas. Nitrogen was used as dry gas (9 L min−1, 365 °C) and as nebulizer gas (40 psi).

2.4. Fractionation of MCs by Means of Soxhlet-Extraction

MCs (Zeisel-DS 0.73 and DS 1.82, 2 g or 0.2 g) were mixed with the same volume solid NaCl and filled into a glass fiber Soxhlet sheath. Extraction in the Soxhlet apparatus was carried out with 200 mL of freshly distilled THF for, and subsequently with water for 48 h each. Both fractions and the residue were dialyzed (MWCO 14,000) to remove the salt, and freeze-dried. From MC (DS 0.73), only 0.1–0.2 and 0.2–0.3% were extracted. For MC (DS 1.82), 1.7%/1.6% (2 g/0.2 g scale; THF) and 5.3%/6.6% (2 g/0.2 g scale; H2O) were obtained. The fractions from MC (DS 1.98) were further analyzed with respect to their monosaccharide constituents by the alditol acetate method with direct hydrolysis, as has been described [62]. For data, see Supplementary Material, Table S1.

2.5. Fractionation of Esterified MC

2.5.1. Propionylation and Methoxybenzoylation of MC: Impeller Method

Freshly prepared impeller reagent (0.9 mL TFAA (6.5 mmol) and 0.6 mL propionic acid (8.0 mmol) heated at 50 °C under reflux for 20 min) was added to 200 mg MC (Zeisel-DS 1.95) in a 10 mL round bottom flask. After 5–6 h stirring at 50 °C, the solution was directly (a) or after neutralization with solid Na2HPO4 (b) precipitated in water, or in phosphate buffer (pH 6.4) (c). The filtrate was dialyzed and freeze-dried: residue 5%.
For methoxybenzoylation of the MC, 1.15 g 4-methoxy-benzoic acid was applied instead and reaction run for 23 h. The product was precipitated in phosphate buffer (pH 6.4) and after about 12 h filterd and washed with water. The product and the filtrate were dialyzed against EtOH/H2O (75/25, v/v) and freeze-dried. The filtrate contained less than 1% of the material.

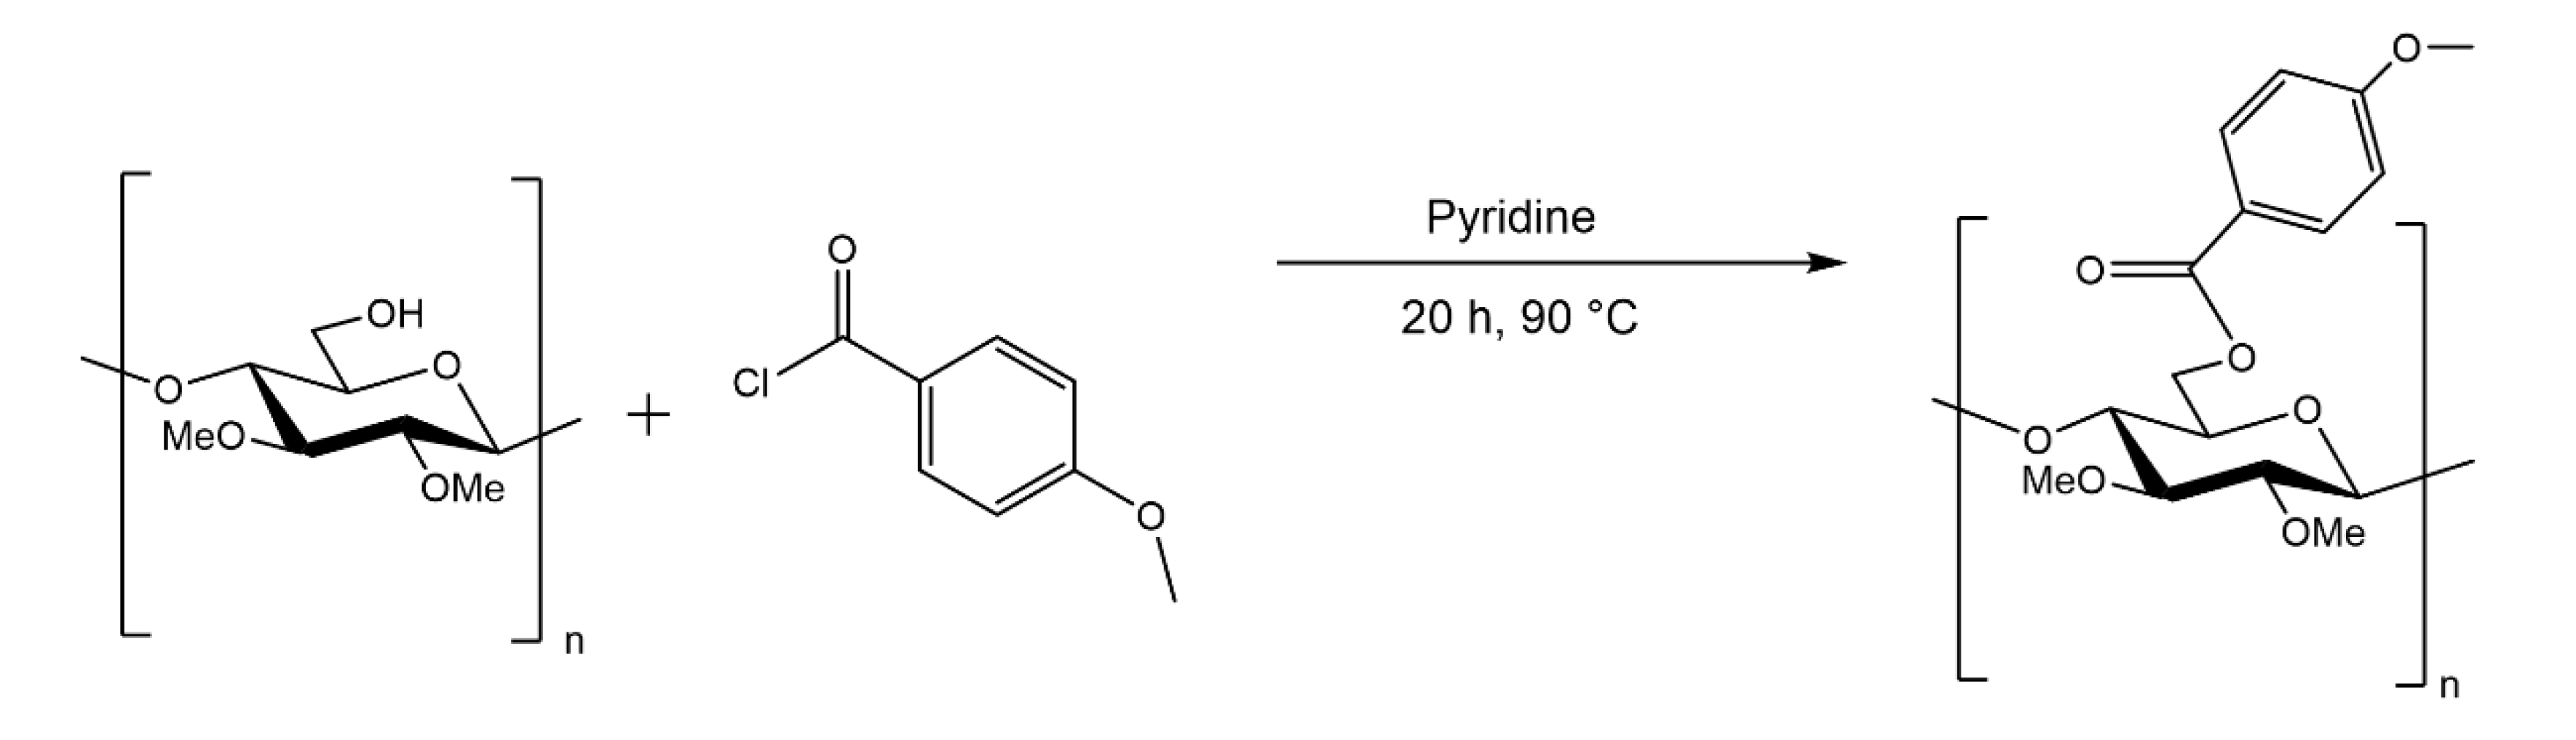
2.5.2. Methoxybenzoylation of MC with the Acid Anhydride in Pyridine

MC or Cellulose (25 mg) was dissolved under stirring in 4 mL dry pyridine at 80 °C. After dissolution, 500 µL 4-methoxybenzoyl chloride was added, and the mixture was stirred at 80 °C for 24 h. The product was precipitated in 500 mL distilled water and let rest for 2 h. Then the product was filtrated over a glass fiber-filter, rinsed with water and dried overnight at 40 °C. The dry MC-methoxybenzoate (MC-MeOBz) was rinsed again four times with MeOH. Further purification can be performed by dialysis against EtOH/H2O (75/25, v/v). Completeness of the esterification was checked by ATR-IR spectroscopy.

2.5.3. Fractionation of Esterified MC by Solid Phase Extraction

MC-propionate: The silica cartridge was conditioned with 20 mL n-hexane. MC-propionate (DSMe 1.95, 13.9 mg in 250 μL DCM) is loaded on the cartridge. Portions of the MC-propionate were subsequently stepwise eluted with 10 mL of EtOAc/toluene with the following volume ratios: F1: 5:5), F2: 7:2.5, F3: 9:1, F4: 10:0. Finally the cartridge was rinsed with 10 mL acetone (F5). All fractions are evaporated to dryness and weighed. Total recovery: 13.4 mg (96.9%). F1: 3.7 mg, F2: 1.6 mg; F3: 2.1 mg, F4: 1.7 mg; F5: 4.5 mg. The fractions were submitted to constituent analysis by the alditol acetate method (2.5.5).
MC-methoxybenzoate: The RP18 cartridge was conditioned with 20 mL MeOH and 20 mL H2O. MeOBz-MC (DSMe 1.95, 20 mg in 300 μL ACN/H2O (5:1, v/v) was loaded on the cartridge. Portions of the MeOBz-MC are subsequently stepwise eluted with 10 mL of ACN/H2O with the following volume ratios: F1: 5:5), F2: 7:2.5, F3: 9:1, F4: 10:0. Finally the cartridge was rinsed with 10 mL acetone (F5). All fractions are evaporated to dryness and weighed. Total recovery: 17.9 mg (89.6%) due to technical losses of F1. F1: 2.2 mg; F2: 3.4 mg; F3: 6.7 mg, F4: 4.5 mg; F5: 1.2 mg.

2.5.4. Fractionation of MC Methoxybenzoate by LAC-HPLC

An Agilent 1260 HPLC system was applied equipped with a G1311B Quat Pump, a column oven, an Agilent Infinity 1260 autosampler, and a G7129A fraction sampler. Chromatograms were recorded by a UV/Vis detector LaChrom L-7420 at 257 nm, and an evaporative light scattering detector (ELSD, Model 1600, SofTA). The ELSD was operated at a nebulization temperature of 40 °C, an evaporation temperature of 70 °C and a nitrogen pressure of 5 bar. Data collection and processing was performed using OpenLAB CDS version (Agilent Technologies GmbH, Waldbronn, Germany). Analytical column: Polaris 5 Si-A, 5 µm, 180 Å pore diameter, 250 mm × 4.6 mm I.D. (Agilent Technologies, Waldbronn, Germany); semi-preparative column: Polaris 5 Si-A 250 × 10.6 mm. Flow rate: analytical: 1.0 mL/min; semi-preparative: 4.5 mL/min. The column temperature was kept constant at 22 °C. The injected sample volume was 30–40 µL at a concentration of 0.4–0.6 mg/mL dissolved in DCM (analytical), or 1 mL at a concentration of ca. 6 mg/mL (semi-preparative), respectively. Mobile phase: A: DCM, B: 2-PrOH. The gradient is described and discussed in Section 3.4.2. Relation of % 2-PrOH(y) and DSMe (x): y = 0.25 · exp(x/0.64) + 3.

2.5.5. Constituent Analysis of Esterified MC Fractions

MC propionate fractions were directly hydrolyzed and converted to alditol acetates for GLC analysis, as has been described [62]. Propionates were sufficiently fast cleaved off during hydrolysis. For MC-MeOBz, deprotection was necessary prior to depolymerization.

3. Results and Discussion

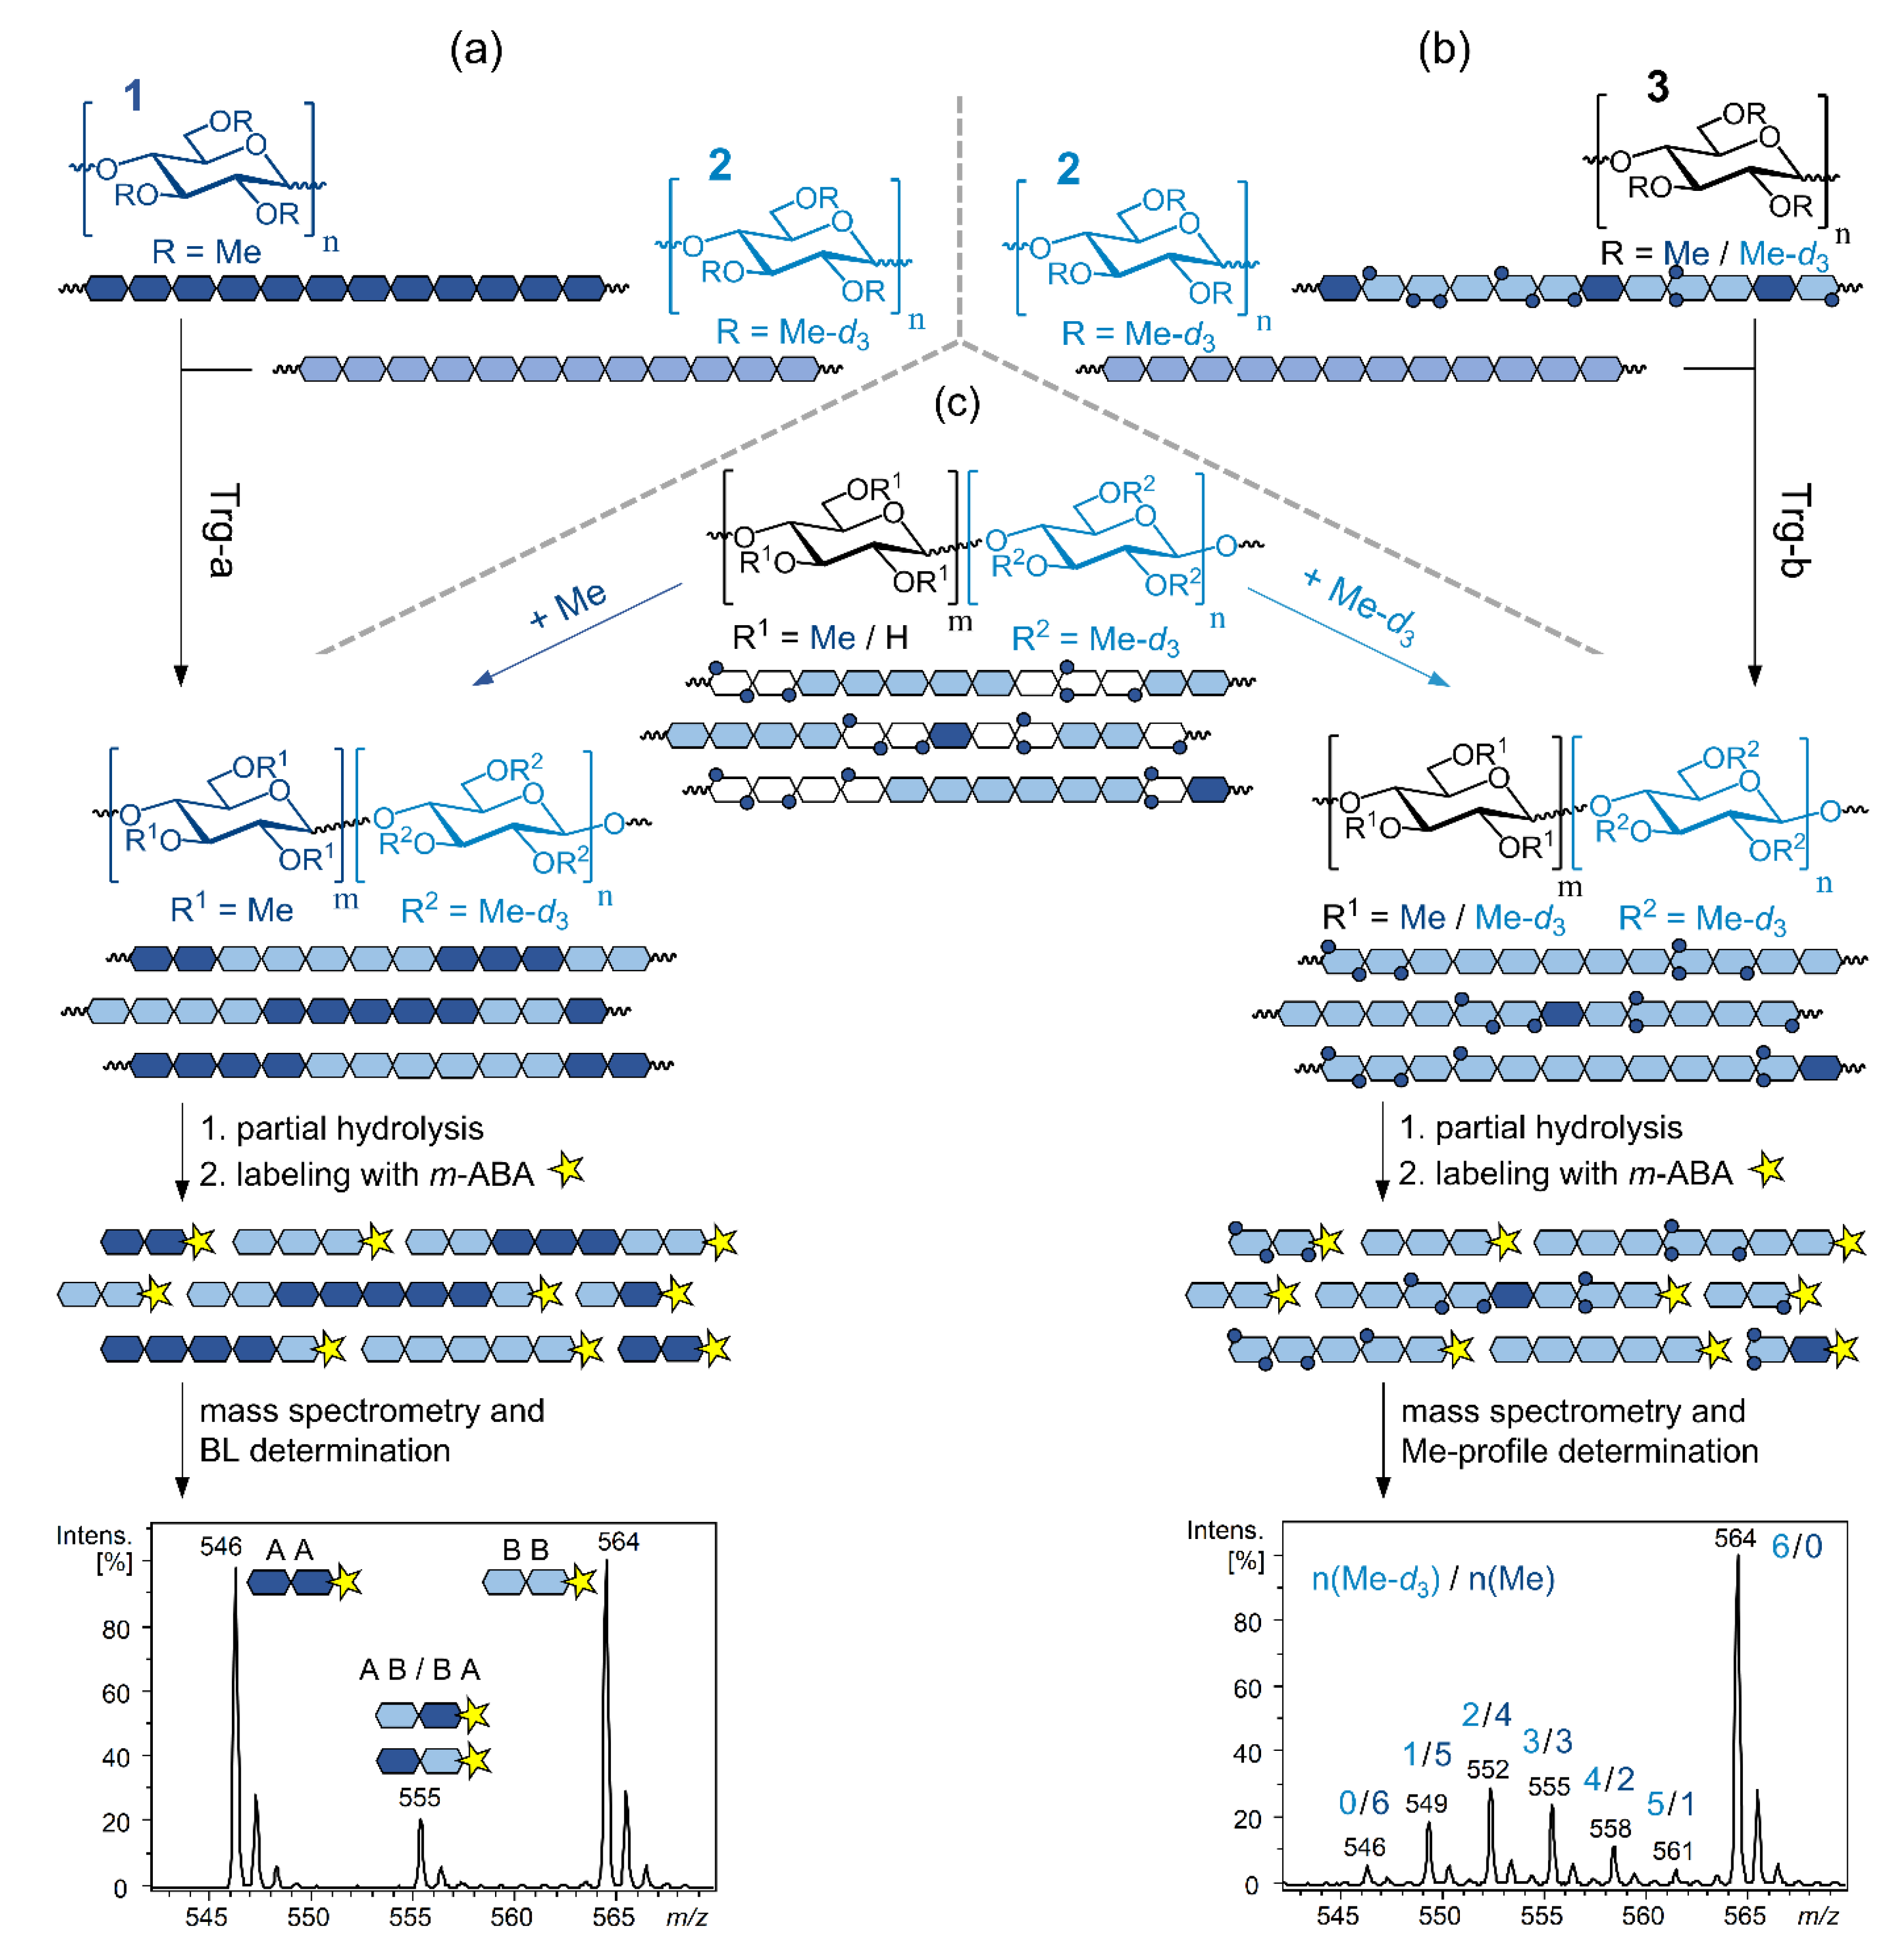
3.1. Is There Any Difference between the Heterogeneities of First and Second Order? A Practical Method Resulting in a Gedankenexperiment

With the idea in mind, to differentiate between first and second order heterogeneities, we developed a method that should yield two fractions of COS, one representing the heterogeneity of first order only, the second one comprising both. The concept is illustrated in Figure 3.
First, a MC (DS 1.96) was permethylated with MeI-d3, to achieve a chemically uniform polymer (→MDC). By this peralkylation, the originally free OH become isotopically labeled by deuteromethyl groups and can consequently be distinguished from the original methyl groups by mass spectrometric analysis. By treatment of this MDC with a sonotrode, new reducing ends should be generated: one from each MDC chain, respectively. Ultrasonic treatment ruptures macromolecules about in the middle since the forces of the collapsing cavities are strongest there [63]. This degradation mainly affects the longer molecules and finally levels off since a minimum chain length is required to act sufficiently [64,65,66]. The degraded cellulose molecules were labeled at their freshly generated reducing ends as representatives for each polymer chain with an acid resistant tag. Completeness of the reductive amination with m-amino benzoic acid (m-ABA) was proved. After partial depolymerization of polymer chains by acid-catalyzed hydrolysis, the two sets of COS obtained were separated on a cartridge. The required selectivity for the ABA-tag beside the permethylated backbone was achieved with a reversed SPE material bearing a N-benzyl-N,N-dimethyl-butane-1-ammonium group for electrostatic and π-π-interaction. Two fractions were obtained: a small one of labeled COS, according to theory approximately each presenting a different cellulose molecule, and the non-labeled ones, i.e., all others, arising from different and same chains, thus presenting both, heterogeneity of first and second order rolled into one. Subsequently, both sets of oligomers were analyzed by LC-ESI-IT-MS, independently.
For method development, two-step hydrolysis instead of ultrasonic degradation and hydrolysis was applied to gain a larger portion of the labeled COS. Thus, it could be proven that there were no selective losses during fractionation. Comparison by ESI-MS showed that both fractions exhibited identical methyl distribution profiles, prior and after fractionation. When applying ultrasonic degradation, the labeled portion was too small for proper quantitative measurements by (LC)-ESI-MS. (Too much noise by syringe pump infusion and too few data points in LC-IT-MS.) However, the methyl distributions of the two COS fractions, from slight and from pronounced hydrolysis of MDC, were in good agreement (see Figure S1 in Supplementary Material). When we made a gedankenexperiment and considered the dimensions of the oligo- and polysaccharides and its relation to the number of molecules in a particular sample, we realized that the substituent profiles are always dominated by the heterogeneity of first order. A common concentration for an ESI-MS measurement is 10−6 M. This means 6 × 10¹¹ molecules/μL. If assuming the generation of on average about 60 COS of for instance of DP3 from one cellulose chain (for random degradation the yield of COS exponentially decreases with its DP), the ratio of COS from different molecules to those from one particular cellulose chain in 1 μL sample solution is of the order 1010:1. The simplified sketch in Figure 3 suggests an opposite ratio, an example how misleading such graphical illustrations can be. Besides being far from the real proportions, it must be kept in mind that from such a low number of macromolecules, no representative information on the entire composition of such a complex mixture would be possible. In conclusion, this means that our method of quantitative analysis of the substituent distribution in oligosaccharides derived from polysaccharide derivatives is always by far dominated by the heterogeneity of first order, while that of second order is a related sub-pattern of it. The only difference between domains on the same and on different chains is that the latter are independent and can be separated from each other. During a polymer analog modification, the difference between the particular local reaction conditions at two spots of the material in the reactor probably correlates rather with the distance than with the location of these spots on the same or on two different molecules.
The gedankenexperiment shows that heterogeneity along and among the macromolecules of a modified polysaccharide cannot be differentiated by this approach. And for typical modified cellulose, there is no fundamental difference between these two dimensions. Therefore, we refrained from scaling up the analytical procedure described, in order to gain enough material for more accurate measurements of the labeled COS.

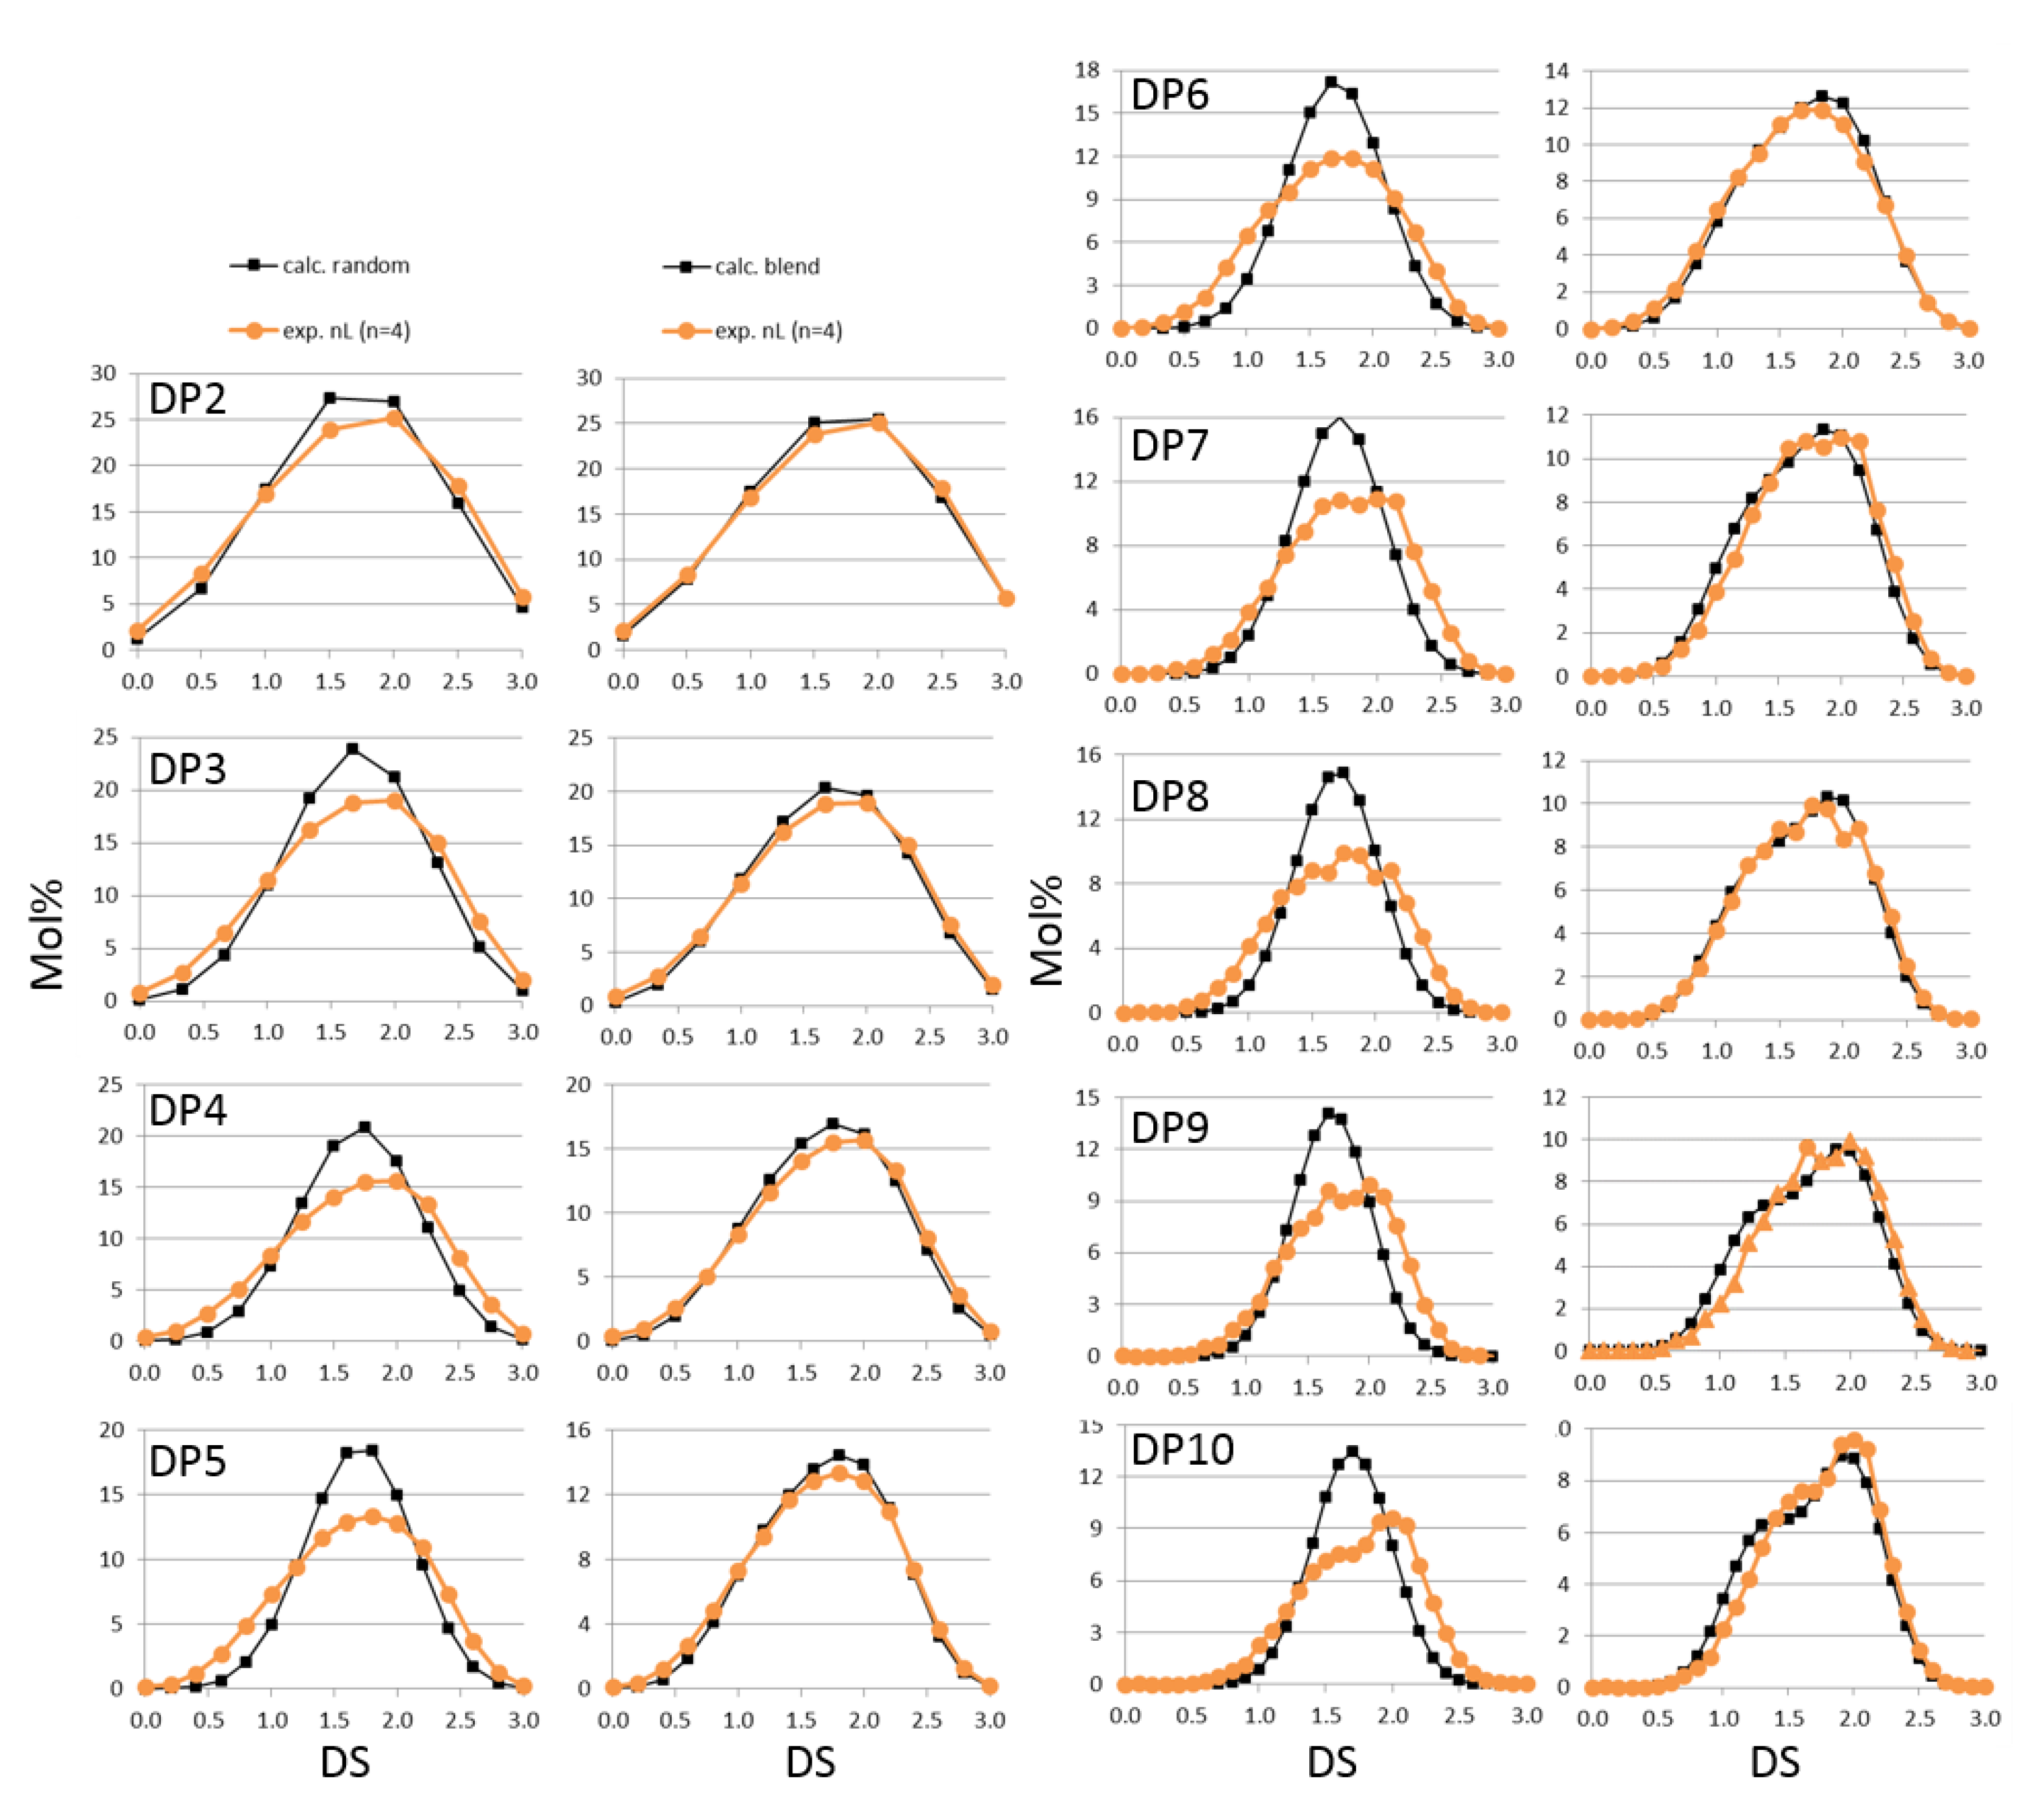
3.2. Analysis of Two Mixed MCs-Blend or Block Structure?

Instead of fractionating a MC into portions of narrower compositional diversity, one can choose the other way around and blend materials in order to use it as a model material for analytical studies. In order to check the capability of our MS analysis of COS, we blended two MDCs, one of low (1.29) and one of high average DSMe (1.96), at a molar ratio of 2:3, i.e., with an average DS of 1.69 and a ΔDS of 0.67. This artificial bimodal MC obviously had a pronounced heterogeneity of first order, while each of the two MCs had a close to random, only slightly heterogeneous methyl distribution. We calculated the theoretical methyl distributions for each particular DP. On one hand, we used the overall monomer constituents of the blend, on the other hand, we calculated the distributions of the two MCs independently, and then formed the weighted average, i.e., the theoretical substitution profile expected for the blend (disregarding some heterogeneity of the MCs). This is illustrated in Figure 4 (black profiles). The first ones are naturally much narrower than the latter. Those methyl distribution profiles broaden with DP, in our case develop a plateau at DP7 and a saddle point at DP8. Beyond DP8, the two individual profiles start to become visible separately (see also Figure S2, Supplementary Material). The experimentally obtained methyl profiles (orange curves) were compared with the two theoretical distribution curves (Figure 4), one assuming a single batch of MC and one referring to the blend.
The experimental data for the MC blend does not indicate a random distribution of the glucosyl units present in the material, but show a much broader substituent distribution profile, developing two maxima with increasing DP. This profile matches the curve calculated for the blend well. It should be kept in mind that no exact congruence is expected since the two individual MCs do not show a perfect random pattern. The deviation is a measure of heterogeneity. However, the course of the methyl profiles clearly indicates the character of a blend.
But how can we differentiate between a theoretically possible di-block-copolymer (or multi-block structures with relatively large block length) and the blend of two MCs? Only from the knowledge and experience of polymer analog modifications, it can be concluded that the data in Figure 4 refer to a blend. But from the data for the low DPs, we cannot yet recognize that it is a blend of only two MCs. As has been demonstrated in Figure 2, the lower the regioselectivity of substitution is in the AGU, the more the ratio of reactivities of O-2, O-3 and O-6 approximates to 1:1:1, the greater are the local DS-differences in the individual MC chain [25], which means, the broader is the random substituent distribution curves. And the smaller ΔDS of two components of a blend is, the later the bimodal pattern in the methyl distribution profiles will become visible (i.e., at higher DP). With respect to the COS composition, the key-difference between a blocky MC and a corresponding blend of MCs with different DS, is the occurrence or absence of COS comprising glucosyl units from both patterns (linking COS), respectively. If applicable, those would only be present at very low amounts, and furthermore not be uniform, but would also show a particular substituent distribution. Therefore, it is impossible to detect them in such a type of sample. And since by MS analysis only, the total number of methyl groups/DP is recorded, they would in any case disappear among the huge number of isomers.
As described above, by the 2D-chromatographic systems developed by the Radke group, blends of CMCs or of CA, differing in DS and/or molecular mass, have been separated directly [48,50].

3.3. Detection of Transition Domains

The only difference with respect to the origin of a methyl pattern from the same or another chain is the lack or occurrence of transition COS between domains: If they are present, these patterns exist on the same molecules; if not, they are independent. Due to complexity, such connecting domains are only visible in special compounds.
To demonstrate the difference between a blend of two independent cellulose ethers and the corresponding blocky samples comprising blocks of both of them, we prepared appropriate samples by transglycosylation of the blend. The procedures were reported by Rother et al. [67] and Hashemi et al. [68]. If we partially degrade a blend of permethylated and perdeuteromethylated cellulose, there will only be two signals in MS, one of the permethylated, and one of the perdeuteromethylated COS. After submitting this blend of homoplymers (An, Bn) to transglycosylation, quenching, and sample preparation for MS analysis, COS indicating the linkage between both types of cellulose ethers occur in the mass spectra. The number of possible linking di-block-COS increases with DP (AnBm with n + m = DP), the relative intensity increases with proceeding transglycosylation (Figure 5).
The detection and identification of transition COS is also possible in case of blocky samples obtained by transglycosylation of only one uniform, e.g., perdeuteromethylated cellulose with DS(Me-d3) = 3, and a perdeuteromethylated randomly substituted MC (→MDC), at least for larger DPs [68]. Additional sequencing of COS by collision-induced dissociation (CID) proved that the COS contain permethylated sequences, alternating with randomly substituted areas [68]. Thus, differentiation between first and second order heterogeneity is only possible for very special, less-complex cases (“co-polymers”) by MS analysis of MC-derived COS.

3.4. Fractionation According to Heterogeneity of First Order

For conventional cellulose derivatives, fractionation of the sample is necessary prior to further analysis in order to increase the resolution pattern recognition and to enrich special portions as for instance poorly substituted tiny amounts. In case of a random DS-distribution (normal curve of distribution), separation according to DS will give subfractions with random substituent profiles and a narrower DS range. The larger the molecular weight, the narrower the DS-distribution over the cellulose molecules, since local differences are more and more leveled over the chain length, as is visible from Figure 2 [27]. However, since DS and DP-distribution are convoluted, each DS-fraction has a molecular weight distribution (for more details, see [48,50]). In case of a DS variance beyond the statistical dispersity, i.e., some heterogeneity, for instance due to local and temporal different reaction conditions as described above, the border fractions of the substituent distribution in MC-derived COS, i.e., those with no or very few, and those with many substituents, will increase, and especially their deviation from the random pattern will be more pronounced. If small amounts of the cellulose have been insufficiently activated, this very low substituted material will be concentrated and thus no longer be overlooked due to dilution in the overall material. Examples for such enrichment, such as the stepwise dissolution of MC with solvents of increasing polarity [56], have been given in the introduction. It should be kept in mind that earlier studies of such processes, for instance fractionation of HPCs (MS > 4), reported a separation according to molecular weight with the shorter chains being more substituted [59]. Whether this shows a correlation resulting from synthesis, i.e., a faster or “better” reaction of shorter molecules, or a correlation of the separation method, i.e., the shorter and the higher substituted the molecule, the better soluble it is, cannot easily be decided, and should always be considered critically. Nevertheless, this is an additional aspect of complexity.
The stepwise extraction procedure reported by Adden et al. [56] suffers from tedious and difficult separation of the slightly gelling solution from the non-dissolved MC residue. Therefore, we tried Soxhlet extraction as an alternative. The MC (DS 1.98) was filled in glass fiber thimbles instead of cardboard in order to avoid any contamination with cellulose fibers. Extraction was performed successively with THF, MeOH, and water. Independent on the scale (2 g or 200 mg) 1–2% of the material was obtained with THF (εr 7.6), while subsequent extraction with MeOH (εr 33) yielded about 6% at a total recovery of 96% of the MC. Further analysis of all fractions by GLC after total hydrolysis and formation of alditol acetates [62] showed that hemicelluloses comprising mannose and xylose (and glucose) had nearly completely been extracted. This might also be promoted by their lower molecular weight. The average degree of methylation, for better comparison of pentoses and hexoses expressed as % of the available OH, was 77% in the THF extract, 73% in the MeOH extract, and 65% in the residue (for details, see Supplemental, Table S1). Hemicelluloses were higher methylated than cellulose. In addition, the extracts contained higher methylated MC (DSTHF 2.27, DSMeOH 2.16, DSresidue 1.95). The DS of the weighted average was in good accordance with the starting material (1.98). In order to better adjust the polarity, various solvent mixtures forming azeotropes were tested in dissolution experiments of the MC. However, all promising solvent mixtures consisting of CHCl3 and an alcohol (MeOH or EtOH) caused gelling of MC, which clogged the thimbles.

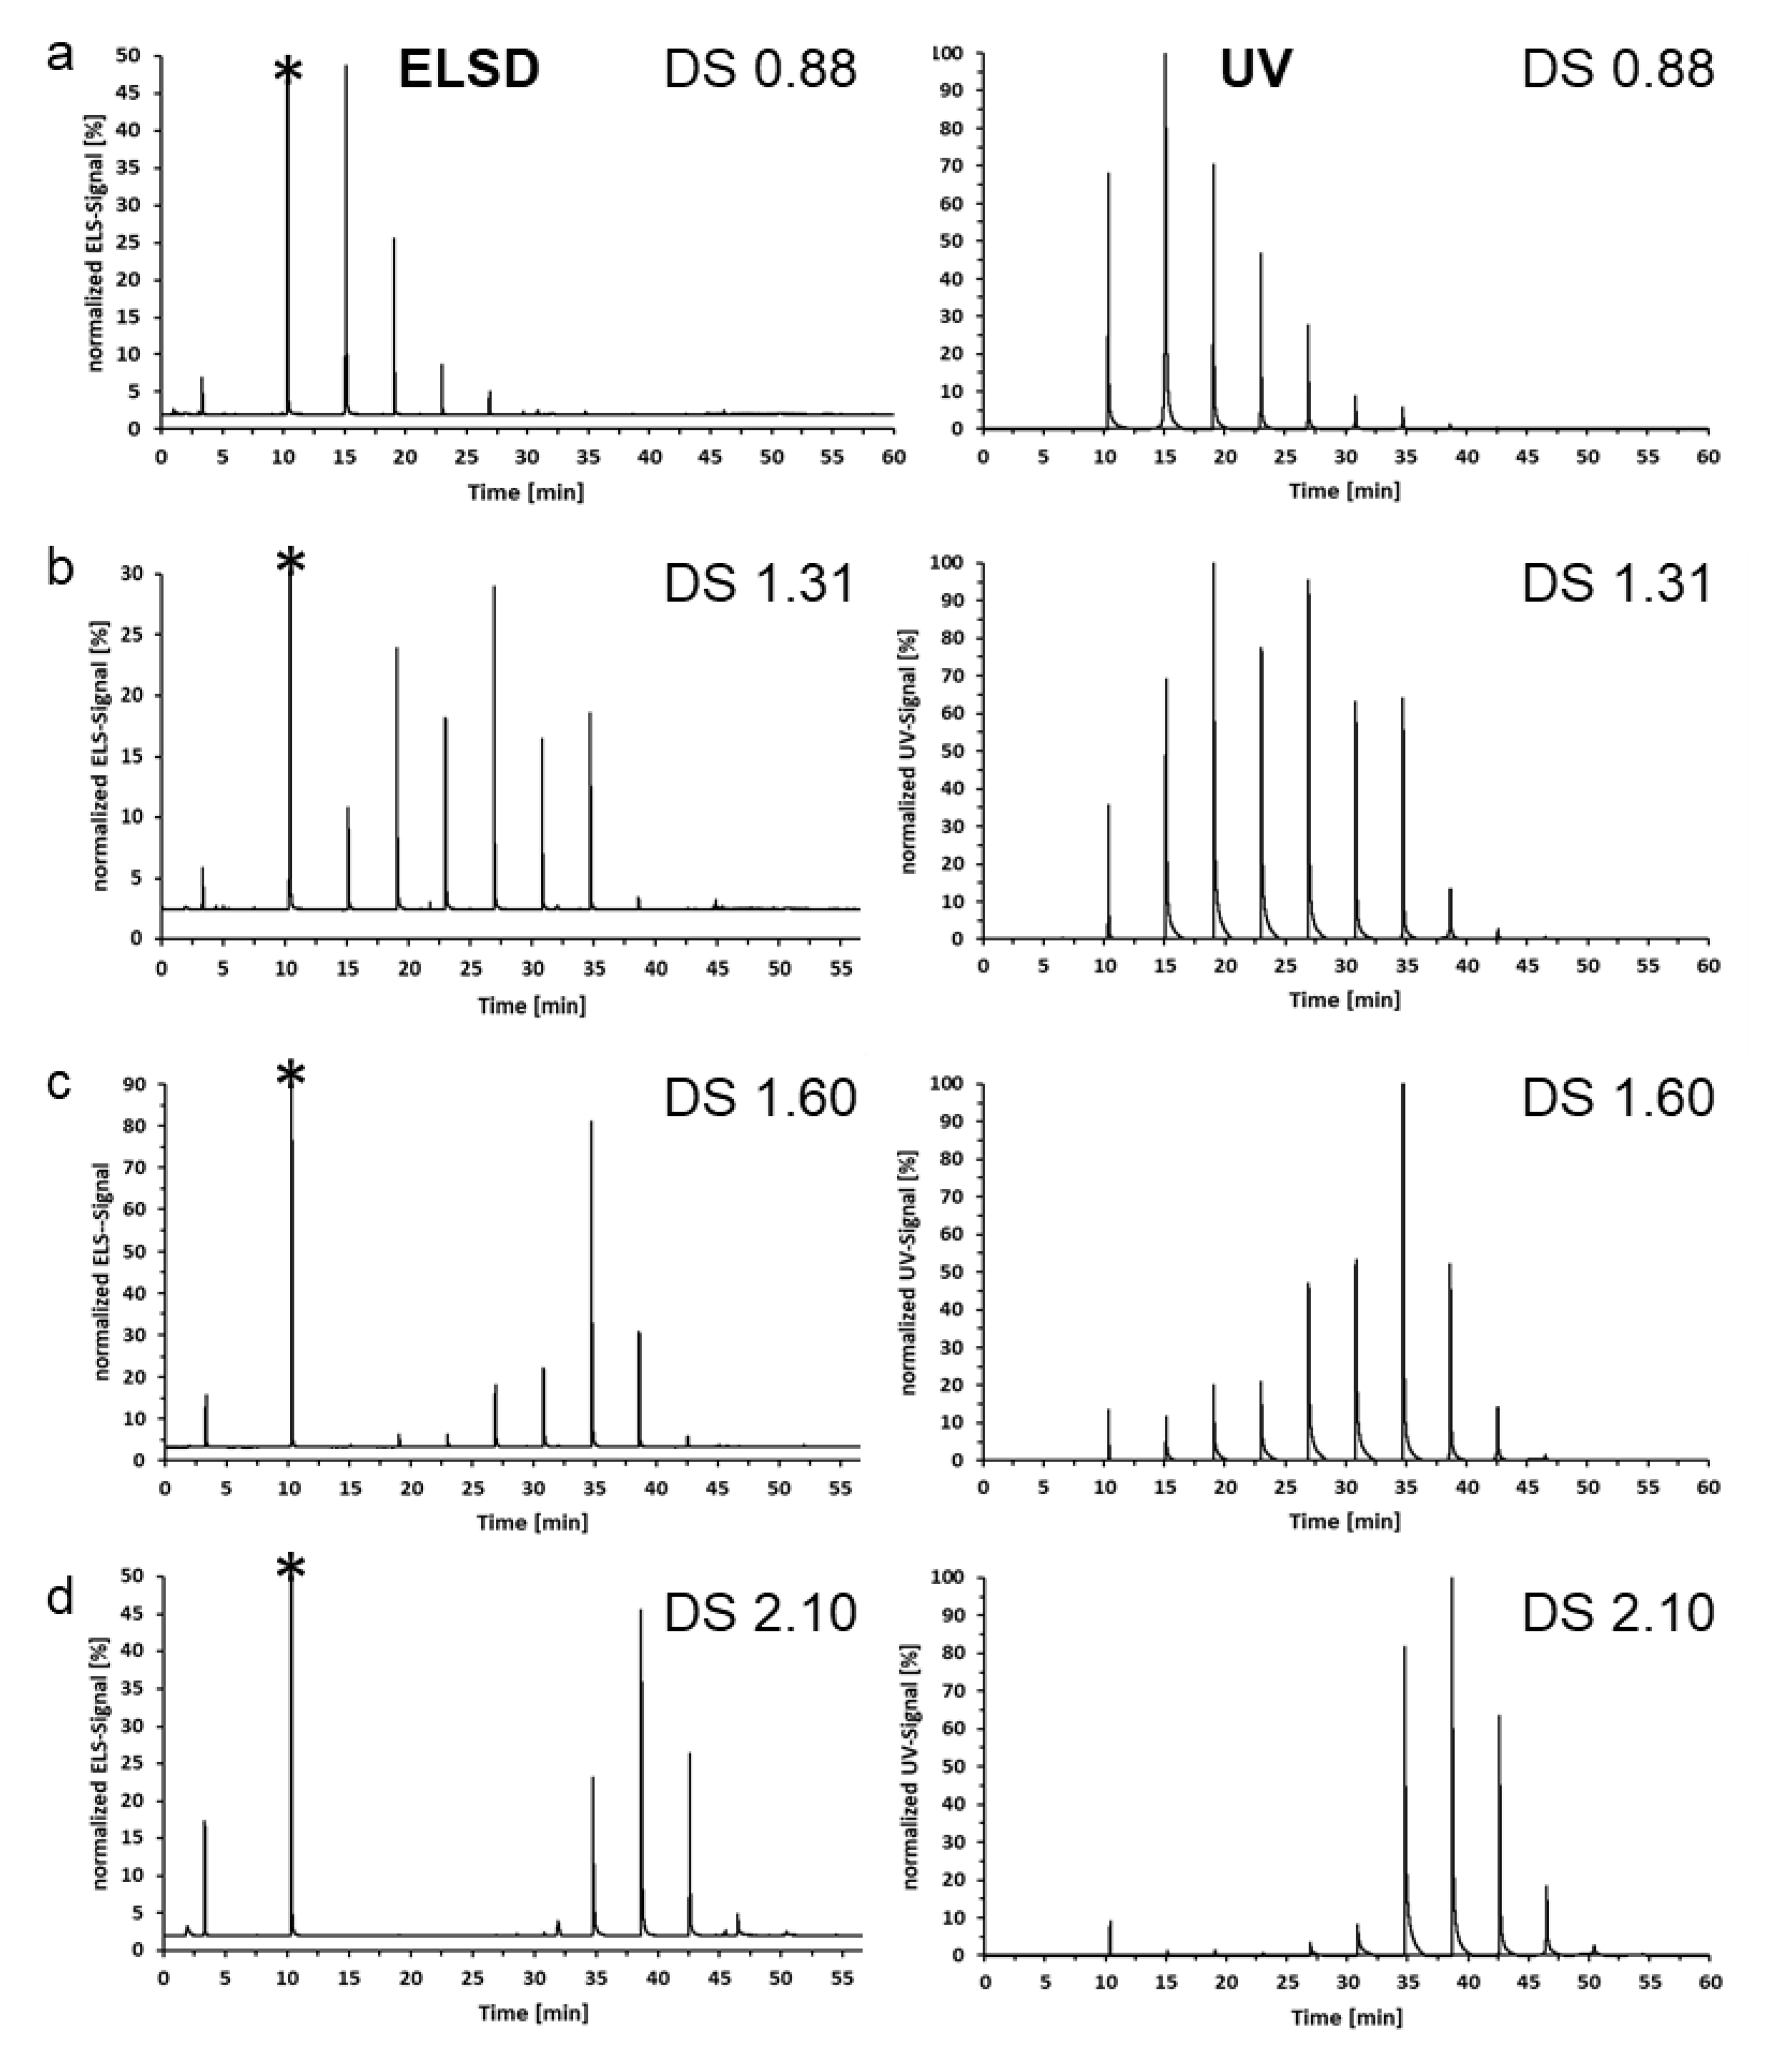
3.4.1. Fractionation of MC Esters on NP and RP Phases

Since direct fractionation suffered from too strong aggregation, gelling, or phase separation problems, we decided to fully protect the free OH of the MC, to overcome aggregation, and at the same time enhance the chemical difference between chains of various DS. A further requirement was that the protecting groups should finally be removable or directly exchangeable against deuteromethyl groups for quantitative MS analysis of COS [68]. Therefore, esterification was the method of choice. Propionylation and methoxybenzoylation were tested. The UV activity of the latter might be helpful for detection in LC separation and as a measure of DS [51,52]. Furthermore, microfiltration required prior to liquid chromatography is accompanied by the risk to lose poorly soluble or aggregated material [47,48], often present in tiny amounts in cellulose derivatives, inspite of its importance for overall properties. By full protection of all OH, complete solubility in organic solvents should be achieved. From light scattering experiments, Schulz et al. [69] concluded that only fully protected celluloses form molecular disperse solutions, while the solution state of those with DS < 3 can be described as fringed micelles. However, the additional esterification step also bears the risk of selective material losses with the consequence that the composition of the MC would no longer be representative for the starting material. Assuming the MC contains small amounts of very low substituted aggregated cellulose, it is crucial whether this will be discriminated during the entire procedure. Therefore, we thoroughly checked completeness of esterification and recovery of the material. After esterification of a MC (DS 2.02) by the impeller method (propionic or 4-methoxybenzoic acid, TFAA, solvent-free) [15,70] or the classical method with the corresponding acid chloride and pyridine (Figure 6) [15], the MC-ester was precipitated by pouring into water, into buffer (pH 6.4), or after neutralization with solid Na2HPO4 (to avoid ester cleavage).
The raw products could be best purified by dialysis against EtOH/H2O (75/25 v/v). The polymeric residue as well as the dried precipitate were weighed and analyzed by ATR-IR-spectroscopy to check for complete OH-protection (see Supplementary Material, Figures S3 and S4). To clarify any selective loss of the material, the filtrates from sample precipitation, containing less than 4–5% (propionate) or 1% of the material (methoxybenzoate), were analyzed. Monosaccharide analysis [62] showed that the filtrates mainly contained the sugar constituents of hemicelluloses. Since glucose also occurs in hemicelluloses, the MC portion and the DS of the glucan part cannot be exactly calculated. But it is a tiny amount, probably of lower DP and higher DS. Furthermore, the methyl pattern in the glucosyl units of the MC and the esterified MCs were identical. Thus, with sufficient care, fully propionylated or methoxybenzoylated MCs can be prepared without discrimination, losing only the accompanying hemicelluloses. Lower molecular weight of the latter might again be the reason for their inability to precipitate.
Some preliminary fractionation studies with the propionates and the 4-methoxybenzoates of MC were promising. The MC propionate (DSMe 2.02) was fully soluble in a wide polarity range (MeOH, EtOH, acetone, EtOAc, EtOEt, DCM), the per-propionate of cellulose only in EtOAc and acetone. The MC-MeOBz was soluble in acetonitrile, acetone, THF and DCM, but not in pure alcohols. Cellulose methoxybenzoate with DSMeOBz 3.0 was only soluble in DCM.
First studies were performed on silica with EtOAc/toluene (MC propionate), and on RP18-cartridges with ACN/H2O (MC methoxybenzoate), respectively. For full recovery, the cartridges were rinsed with acetone. (The results are given in detail in Supplementary Material, Table S2 and Figure S5). In the normal phase, MC propionates were eluted with increasing DSMe, while on the RP18 cartridge, the higher methylated and thus lower methoxybenzoylated material eluted first. Direct methyl pattern analysis by the alditol acetate method [62] was successful for the propionates: the ester linkages were fully cleaved off during depolymerization of the polysaccharide. The DS increased from 1.93 in F1 to 2.11 in F5. The weighted average was 2.03, which is in very good agreement with the DS of the entire material (2.02). Moderate deviation from the Spurlin model was found with a minimum of heterogeneity for F3. MC methoxybenzoates were not fully deprotected during acidic depolymerization, causing a lowered yield of target compounds. Consequently, too high DSMe values were obtained for these fractions. Nevertheless, a trend of decreasing DSMe was visible. Therefore, in later studies, deprotection with sodium methanolate was performed prior to acid hydrolysis.

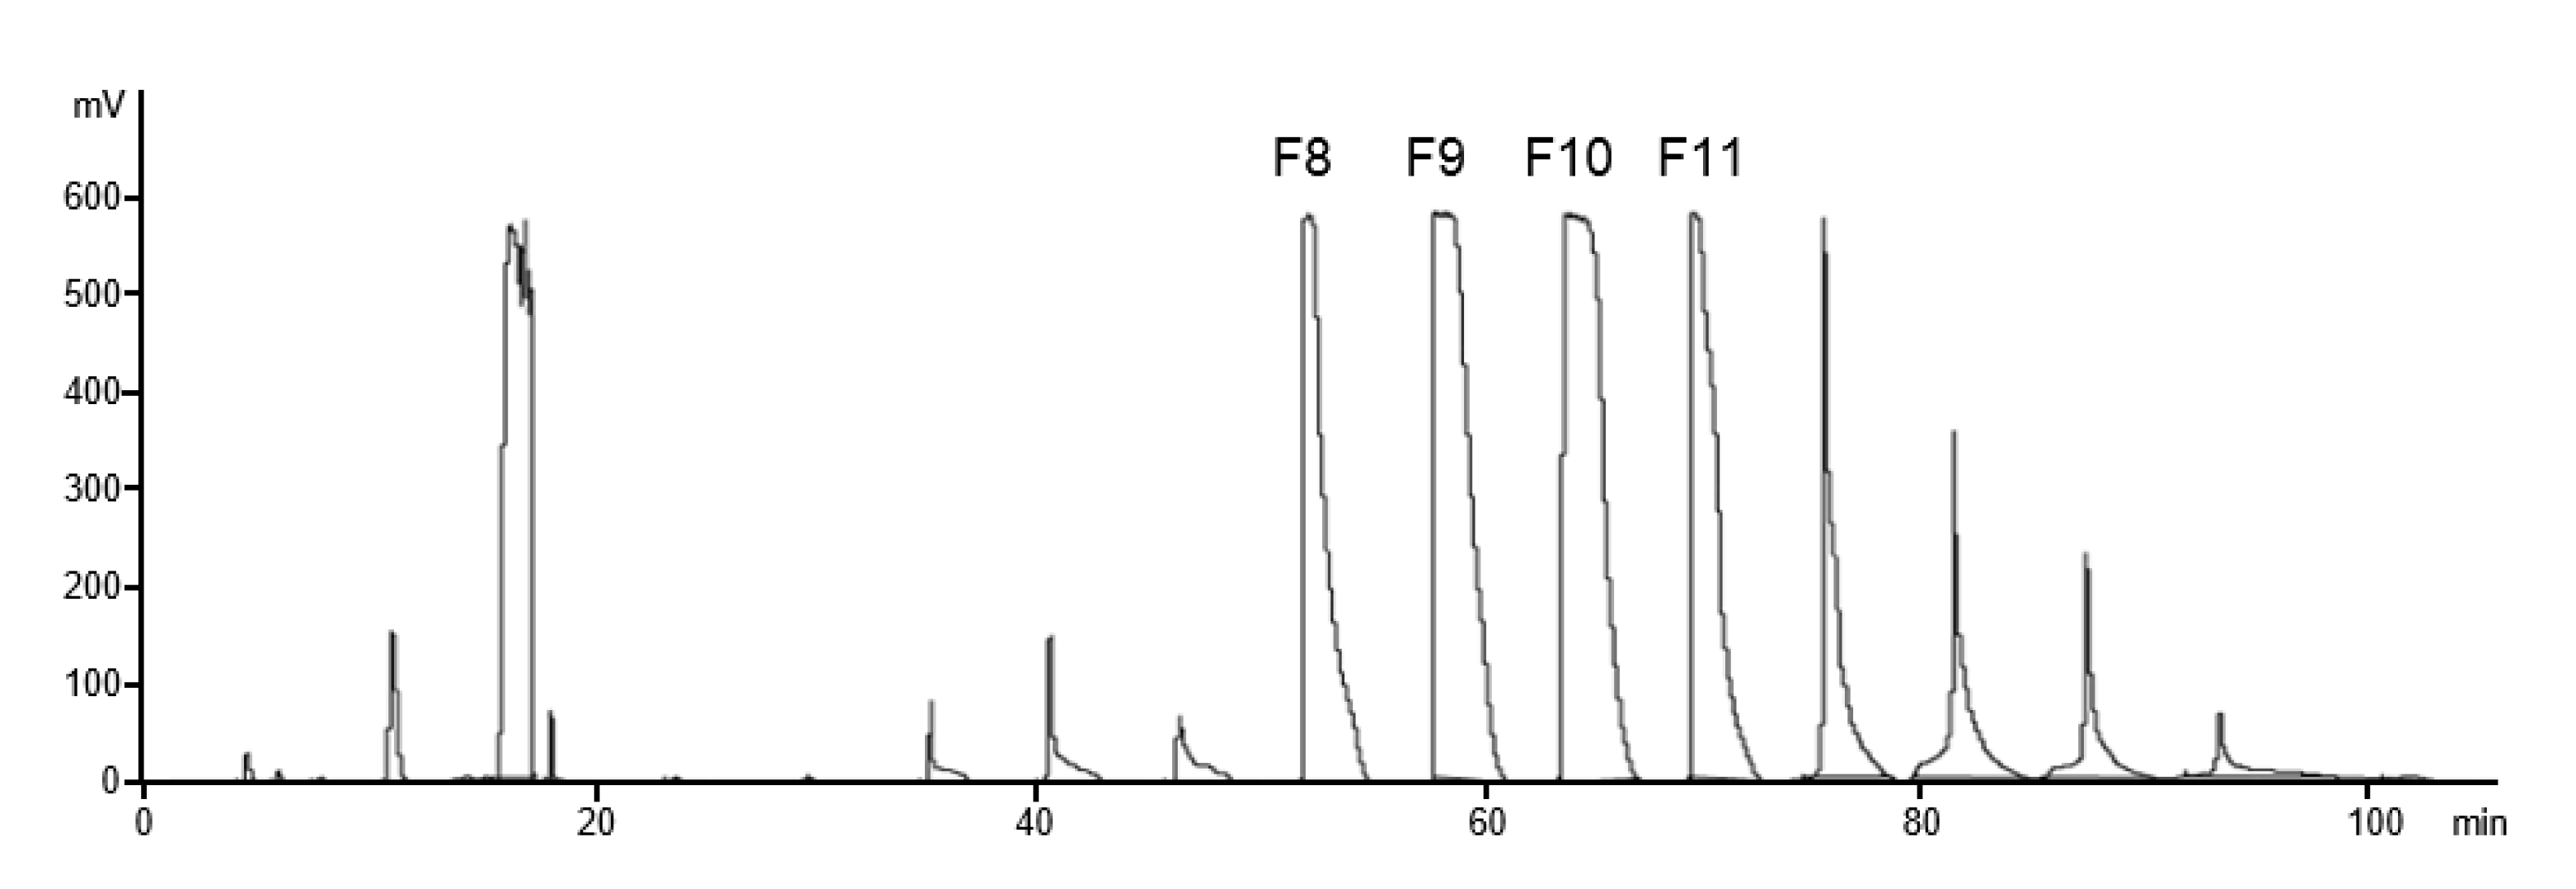
3.4.2. Fractionation of MC Methoxybenzoates by Gradient HPLC

In further experiments, we used liquid adsorption gradient HPLC to fractionate the MC-MeOBz. As already briefly outlined in the introduction, interaction polymer chromatography is a very complex field due to the manifold categories of distributions and their mutual impact: beside molecular weight and chemical composition distribution, the distribution of the monads in the chains, i.e., the microstructure, also plays a role [44,45,46]. Since MCs and MC-MeOBz as well consist of eight different constituents, even at the same average DS and a random distribution pattern, the local density of one type of substituent and thus enthalpic interaction will depend on the partial DS values, i.e., on the regioselectivity. And at the same time, these structural differences might also influence any entropic effects in pores or on the surface, since it might affect the conformational changes. This should be kept in mind when the following approach is considered.
MCs covering the DSMe range 0.88–2.10 and additionally, the border cases of per-methoxybenzoylated (DSMe = 0) and permethylated cellulose (DSMe = 3) were separated on a normal phase. Tests with the weak eluent DCM (E° 0.30) and increasing amounts of MeOH as displacer showed a too strong eluotropic effect of MeOH (E° 0.73). Therefore, 2-PrOH (E° 0.60) was used instead. The chromatography of the MC-MeOBz was run with a gradient of 2-PrOH in DCM. The samples eluted over a very wide range. Therefore, no critical condition of adsorption (CCA) was defined for these complex samples comprising a certain DS range. The maxima or midpoint of these elution curves shifted with DSMe to longer retention times. For the elution of the uniform fully methylated MC, a huge increase of the 2-PrOH to 30% was required. In the gradient regime of 2.8–4.5% 2-PrOH, MC-MeOBz with DSMe 0–1.0 showed their peak midpoint, while for samples with DSMe 1.0–2.2, this occurred in the range 4.5–10% 2-PrOH in DCM. A relation between average DS, midpoint of the peak profile and corresponding % of 2-PrOH was fitted with an exponential equation (s. Section 2.5.4). Since the MCs used are not from one series, but beside DS differ in molecular mass and microstructure, this equation has to be considered as preliminary. In the next step of method development, instead of a steady increase of the 2-PrOH eluent, the latter was only temporarily increased, held steady for 2 min, and then fast reduced and held steady again for 2 min. By this adsorption-desorption technique in a “trap-and-release” manner, the MC-MeOBz was eluted in portions rather than continuously. Figure 7 shows the applied gradient. For the trapping-step, the 2-PrOH content of the preceding desorption step was halved.
Figure 8 shows the chromatograms (ELSD) for four MC-MeOBz with DSMe 0.88, 1.31, 1.60, and 2.10. The UV-active peak at 10 min occurs in all samples and results from contamination with 4-methoxy-benzoic acid. Unfortunately, its retention time is identical to that the of per-methoxybenzoylated cellulose, but by more thorough purification, it can be removed. The peaks are generally superimposed by artifact signals of the ELSD, due to fast change of solvent composition. However, it is clearly visible that the maximum of the distribution is shifted to longer retention times with increasing DS.
The method was transferred to a semi-preparative column (according to [71], flow 4.5 mL/min; adsorption/desorption time: 3 min. each). Figure 9 shows the corresponding chromatogram recorded for the MC with DSMe 1.91.
The fractions collected for the main peaks from an injection of 6.8 mg MC-MeOBz (DSMe 1.91) were evaporated to dryness, weighed and subsequently re-analyzed on the analytical system. The resulting chromatograms (UV 257 nm) of F8-F11 show that the DSMe increases with the fraction number, but still exhibits a wide DS-distribution within each fractions (see Supplementary material, Figure S6). The late fractions (not shown) eluting after the main portion, do not change anymore significantly in composition. As outlined above, due to the complexity with respect to various types of distributions, one MC-MeOBz might be considered as a complex “blend” of many randomly substituted MCs with a certain range of average DS values. It contains molecules or fractions with different CCA, probably a continuous wide range of CCA. And these CCA ranges exist and overlap for the various categories of distribution. As mentioned above, macromolecules of a certain DS and of comparable low DP might elute at a solvent composition related to a higher DSMe in case of the longer cellulose chains. Adsorption interaction of a polymer with the stationary phase surface also depends on average length of strongly adsorbing domains. As can be derived from Figure 2, describing the probabilities of the substituent density in domains of defined dimension (DP) for two MCs with the same average DS, but different distribution (microstructure), these probabilities significantly depend on the latter. In the present case (Figure 9), the broad DS-range contained in one peak of the semi-preparative separation is probably also the result of an overload of the column. During the desorption period, only a portion of the molecules with appropriate composition and structure were practically eluted, while a big portion is only moved (like tailing) along the column and trapped again, before it elutes with the next or even subsequentr portion. The resolution can probably be improved, if much smaller amounts were injected per run and material would be collected from many such runs.
The best control of the real average DS of the eluted fractions is obtained by analysis of its O-Me-glucosyl composition. The main fractions of the MC shown in Figure 9 were analyzed by the alditol acetate method [62]. The results are shown in Figure 10. The DS, calculated from the molar portions of the various glucosyl units, was 1.75, 1.88, and 2.03 for the main fractions F8, F9, and F10, respectively. Thus, it increases by about 0.14/fraction, but less than expected from the DS-correlation with the 2-PrOH content of the eluent (0.25/fraction). This is possibly due to the discussed factors and the overload. Considering the weighted amounts and the average molar mass/AGU of these three fractions, the weighted average DS is 1.92 and thus in good agreement with the starting material (1.91). However, since these three fractions do not represent the entire material (about 57%), this is more by chance.
Average DS values have also been calculated from the corrected peak areas of a sample separation. For this correction, dependence of the ELSD signal from the solvent composition has been determined. It increased with the 2-PrOH portion up to a volume of ca. 9% and then remained constant. The UV absorption (257 nm) increased linearly with the molar concentration of the MC-MeOBz (DSMe 1.91). Surprisingly, this was not found with increase of the DSMeOBz as expected, but the UV signal remained constant over a wide DS range (1–2) normalized to the molar concentration (AGU). This might be due to a hypochromic effect of the equatorially oriented hardly flexible chromophores as is known, for instance, for DNA and RNA.
To summarize, the observations for the fractionation of MCs as their methoxybenzoates have shown the following:
  • Complete acylation of MCs and purification is possible without selective losses of material (except hemicelluloses).
  • Solutions of fully protected MC-MeOBz can be micro-filtrated without losses.
  • MC-MeOBz are completely recovered from the silica column with the DCM/2-PrOH eluent system. This was proven by measuring the signal intensities of the UV detector after direct injection (without column) of Me-MeBz solutions, and injection with column. Both signals were equal.
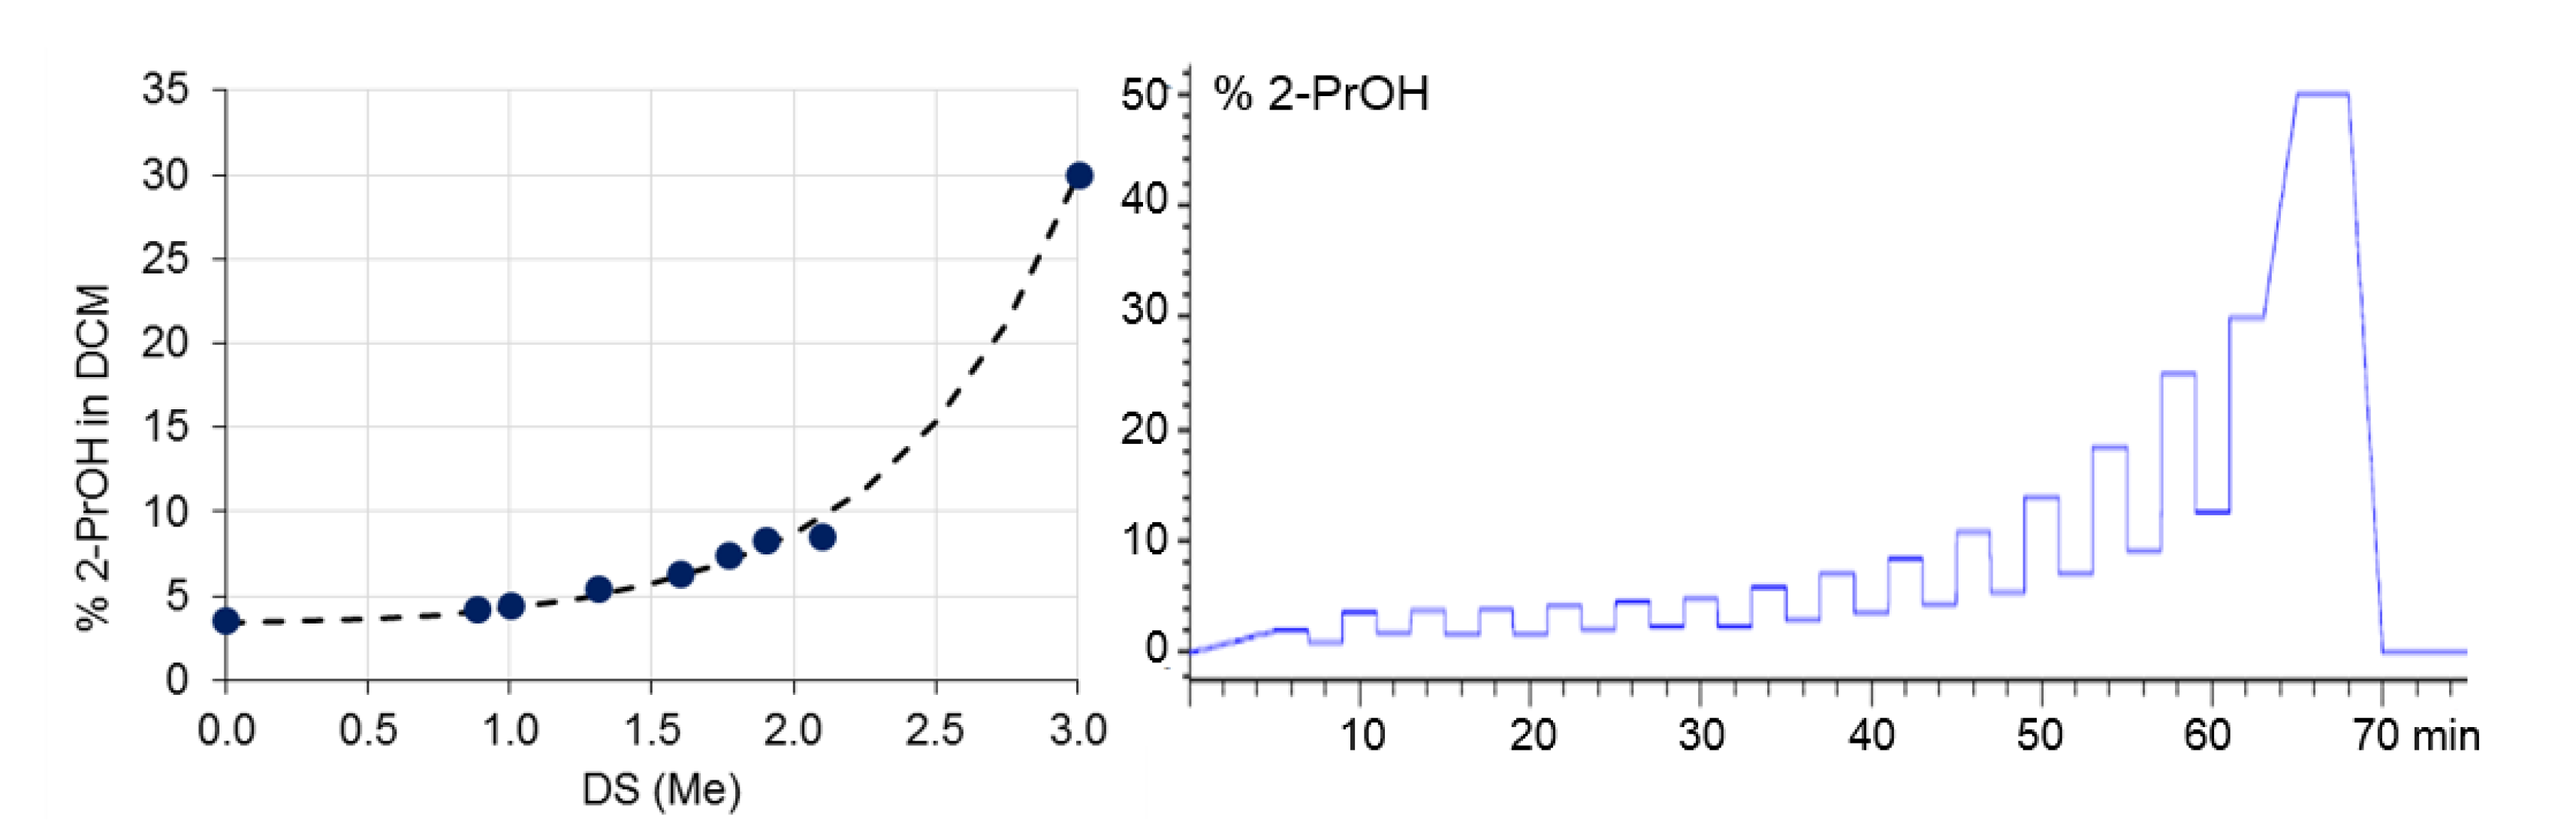
  • MC-MeOBz can be separated according to polarity, mainly defined by the ratio of DSMe/DSMeOBz, by liquid adsorption chromatography on normal (DCM/ROH) or reversed phases (ACN/H2O).
  • Portions of MC-MeOBz can be eluted from cartridges or HPLC columns by stepwise enhancing the volume of the displacer and intermittent trapping of the residual material by reducing the stronger eluent again.
  • The fractions obtained with NP showed increasing DSMe with the fraction number, and the opposite is true for RP.
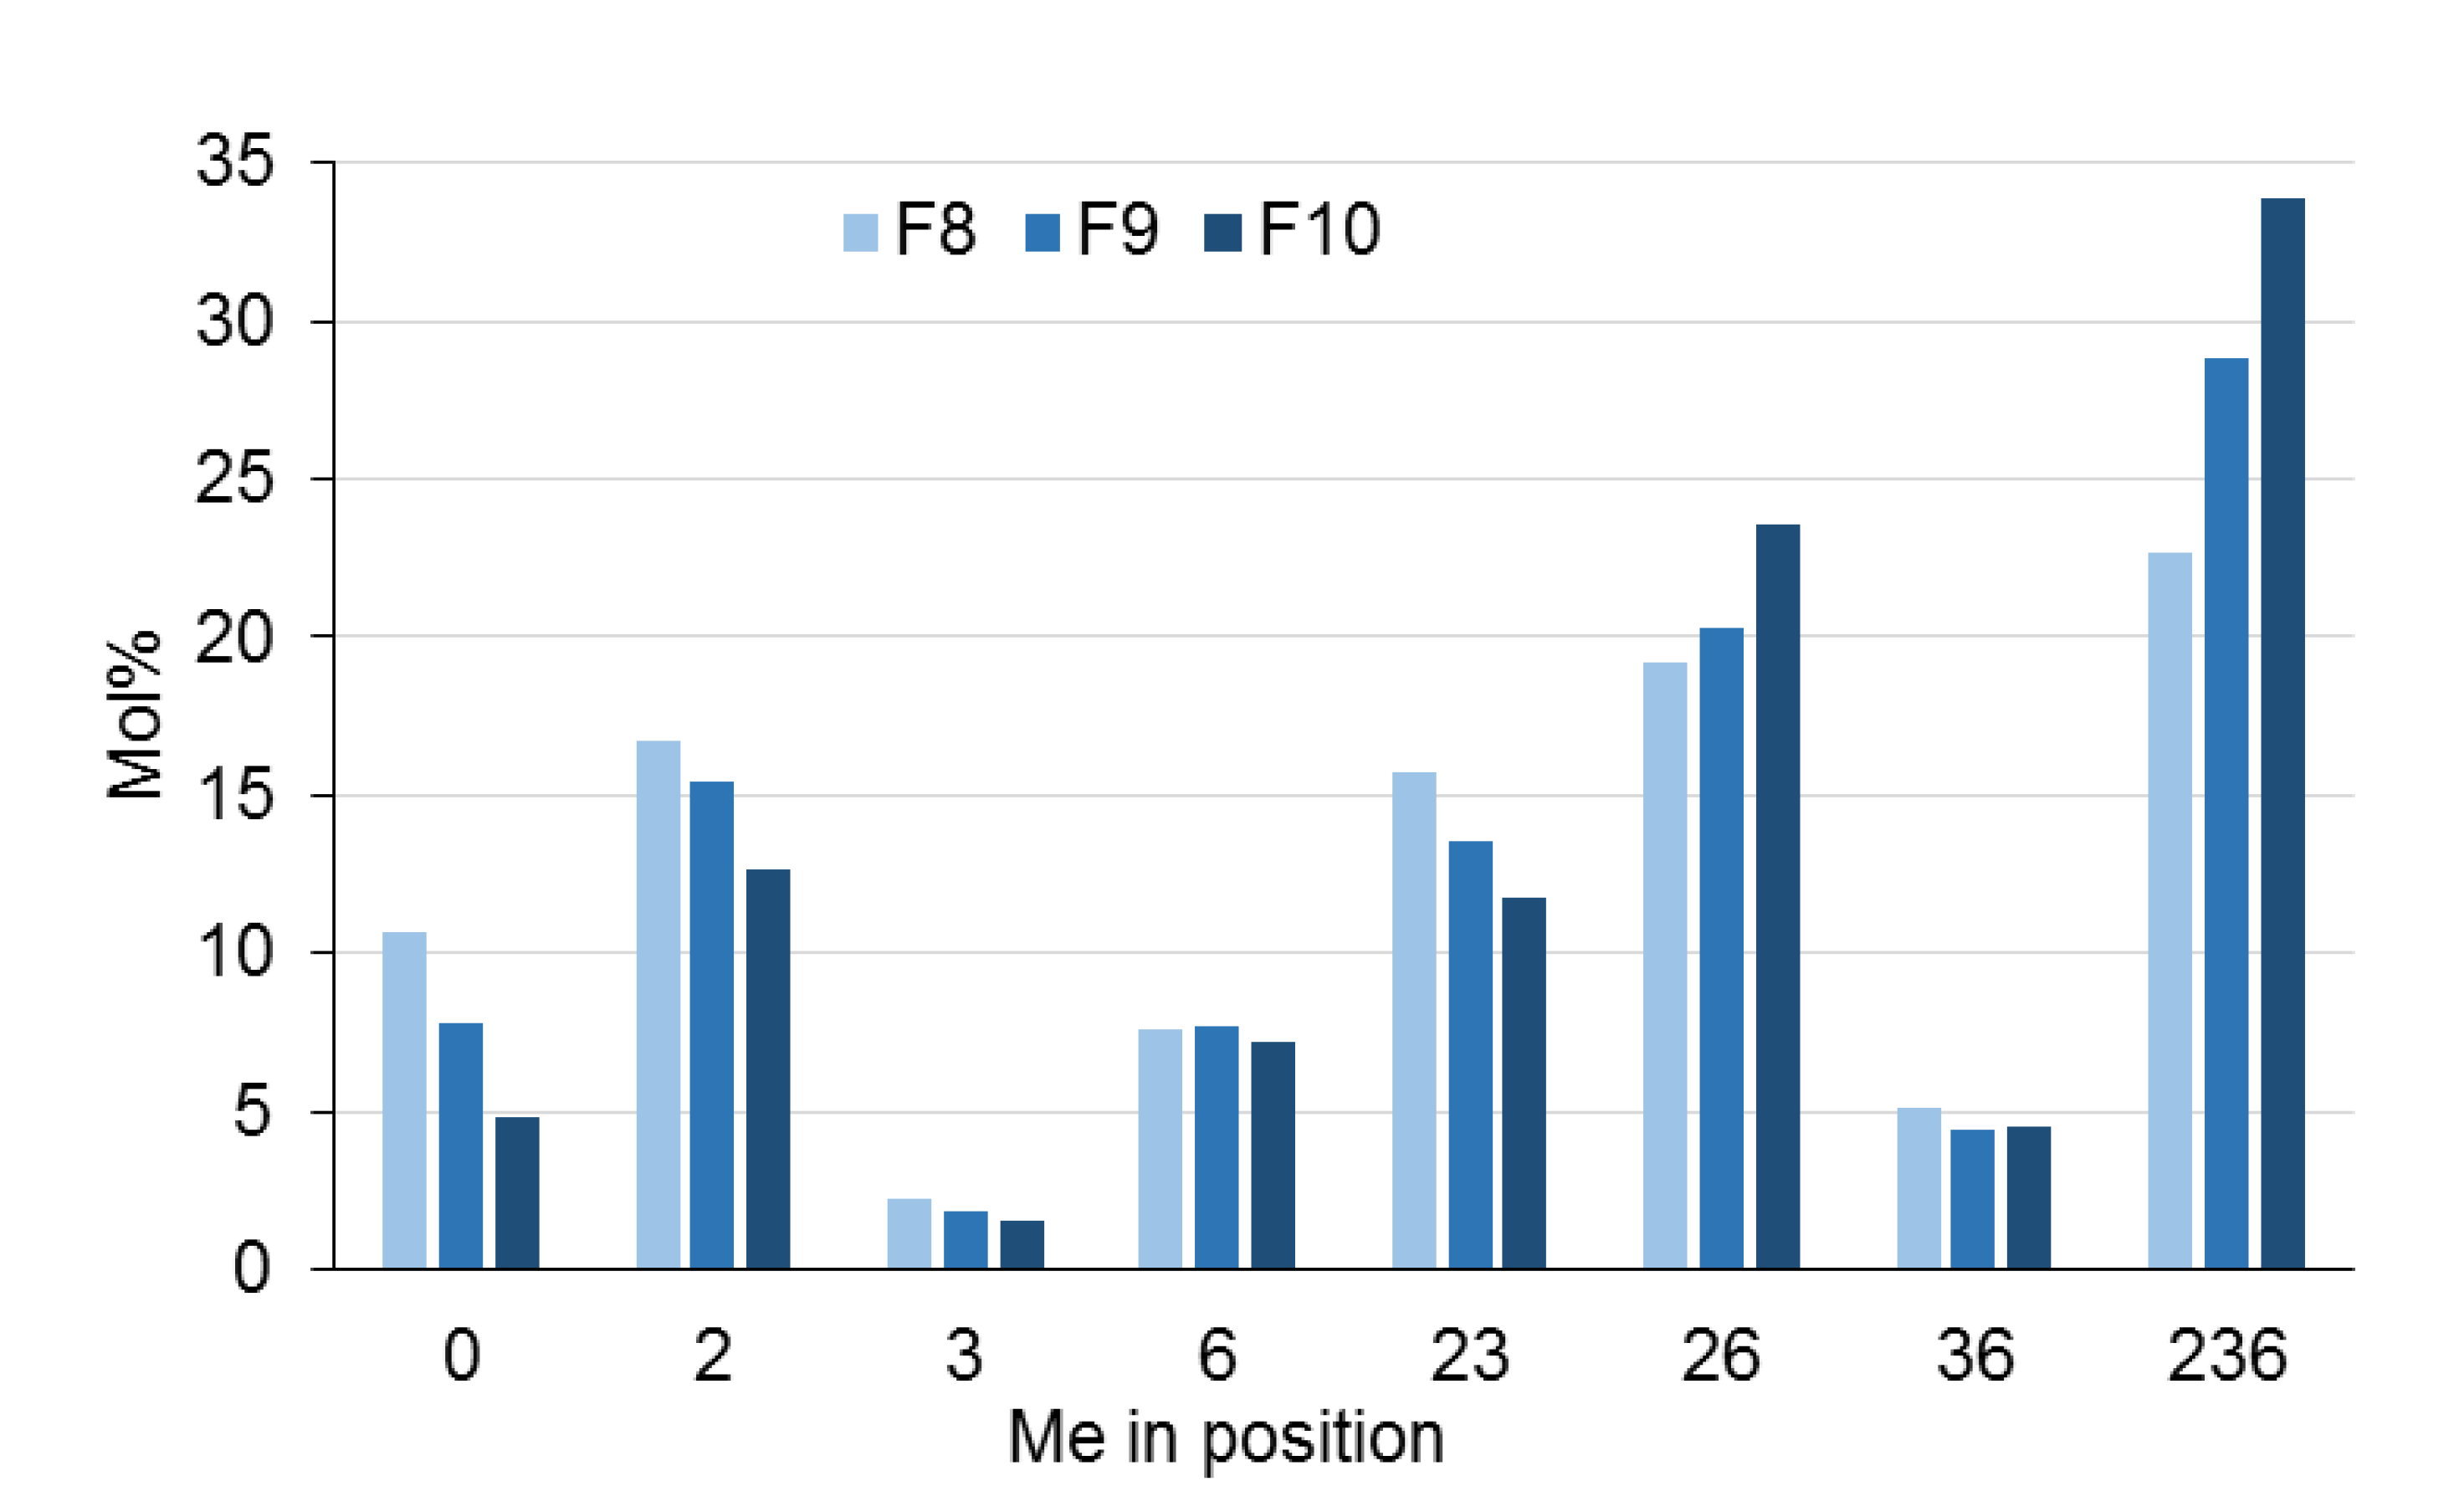
  • Sufficient material for further methyl pattern analysis can be obtained by semi-preparative HPLC. MC-MeOBz have been submitted to the alditol acetate method after deprotection with sodium methanolate. The average DS of subsequent main fractions increased by 7–8%.
  • Re-analysis of the preparatively obtained fractions still show a wide DS range, which can probably be narrowed by accumulating fractions from several runs with less material per injection. Resolution should be improved, and quantitative reconstruction of the sample needs to be performed.
  • If more material is collected, it can also be used for O-Me/O-Me-d3-COS preparation and MS analysis to determine the methyl distribution along the polysaccharide chain.

4. Conclusions

Polysaccharide derivatives produced in polymer analog reactions comprise various catergories of distribution, the molecular weight distribution, the chemical composition distribution, and –depending on the regioselectivity of the reaction with respect to the OH in the glucosyl unit–a distribution of microstructures or domains. Patterns can be considered and analyzed in three dimensions: within the glucosyl unit (1st dimension), along the cellulose chain (2nd dimension), and among the cellulose chains (3rd dimension). Enzymatic and chemical degradation in combination with separation and mass spectrometric methods, interaction polymer chromatography in combination with SEC (2D) as well as fractionation of the material have been applied to gain insight into this complexity. In this paper, various analytical approaches and results have been presented, discussing their potential and partly inherent limitations as well. Blends could be recognized, including their individual average DS values and ratio by the MS analysis of representative COS. Heterogeneities of second and first order are closely related and can only be distinguished by separation of the macromolecules with respect to chemistry. MCs have been successfully separated in fractions of increasing DS after protecting all free OH as methoxybenzoates. The semi-preparative fractionation allows subsequent more detailed analysis of the methyl patterns. This opens the chance to achieve a higher resolution of pattern recognition.

Supplementary Materials

The following material is available online at https://0-www-mdpi-com.brum.beds.ac.uk/article/10.3390/polysaccharides2040051/s1, Figure S1: Methyl profiles obtained during method development in order to obtain about one labeled COS/MC molecule, separated from all other COS, derived from the same and different MC chains. Figure S2: Methyl distribution profile calculated for a 2:3 blend of two MCs, DS 1.29 and DS 1.96. Figure S3: ATR-IR spectrum of MC (DSMe 2.02) and the precipitated MC propionate. Figure S4: ATR-IR spectrum of MC 4-methoxybenzoate. Figure S5: Methyl pattern in the glucosyl units of the MC fractions given in Table S2 (DSMe 2.02). Table S1: Yields and molar portions of monosaccharide constituents of fractions obtained by stepwise Soxhlet extraction of MC, DS 1.98. Table S2: Fractionation of MC propionate and MC methoxybenzoate (DSMe 2.02) by SPE on silica (Me propionate) and RP18 cartridge (MC-MeOBz), respectively. Figure S6: Analytical HPLC-runs of the semi-preparative fractions F8-F11 of Figure 9.

Author Contributions

Conceptualization: P.M.; writing (draft): P.M.; review and editing: P.M., K.V., J.C.-D.; illustrations: all authors; methodology, experimental work and evaluation: 3.1 and 3.2: K.V.; 3.3: P.H.; 3.4: I.U., J.C.-D., P.S., and A.W. All authors have read and agreed to the published version of the manuscript.

Funding

Parts of the work presented was funded by the WoodWisdom-Net, the Bundesministerium für Bildung und Forschung (BMBF FKZ 0330837A), and the Deutsche Forschungsgemeinschaft, GK 1952-1.

Institutional Review Board Statement

Not applicable.

Informed Consent Statement

Not applicable.

Data Availability Statement

The data presented in this study are available from the manuscript and the supplementary material.

Acknowledgments

Funding by BMBF and DFG, and the technical assistance of Katharina Stegemann (Section 3.1 and Section 3.2) is gratefully acknowledged.

Conflicts of Interest

The authors declare no conflict of interest.

References

  1. Fannon, J.E.; Gray, J.A.; Gunawan, N.; Huber, K.C.; BeMiller, J.N. Heterogeneity of starch granules and the effect of granule channelization on starch modification. Cellulose 2004, 11, 247–254. [Google Scholar] [CrossRef]
  2. Tomasik, P.; Schilling, C.H. Chemical modification of starch. Adv. Carbohydr. Chem. Biochem. 2004, 59, 175–403. [Google Scholar] [PubMed]
  3. Whistler, R.L.; Madson, M.A.; Zhao, J.; Daniel, J.R. Surface derivatization of corn starch granules. Cereal Chem. 1998, 75, 72–74. [Google Scholar] [CrossRef]
  4. Steeneken, P.A.M.; Woortman, A.J.J. Surface effects in the acetylation of granular potato starch. Carbohydr. Res. 2008, 343, 2278–2284. [Google Scholar] [CrossRef] [PubMed]
  5. Steeneken, P.A.M.; Smith, E. Topochemical effects in the methylation of starch. Carbohydr. Res. 1991, 209, 239–249. [Google Scholar] [CrossRef]
  6. Muetgeert, J. Fractionation of starch. Adv. Carbohydr. Chem. 1961, 16, 299–333. [Google Scholar] [PubMed]
  7. Medronho, B.; Romano, A.; Miguel, M.G.; Stigsson, L.; Lindman, B. Rationalizing cellulose (in)solubility: Reviewing basic physicochemical aspects and role of hydrophobic interactions. Cellulose 2012, 19, 581–587. [Google Scholar] [CrossRef]
  8. Glasser, W.G.; Atalla, R.H.; Blackwell, J.; Brown, R.M., Jr.; Burchard, W.; French, A.D.; Klemm, D.O.; Nishiyama, Y. About the structure of cellulose: Debating the Lindman hypothesis. Cellulose 2012, 19, 589–598. [Google Scholar] [CrossRef]
  9. Klemm, D.; Heublein, B.; Fink, H.-P.; Bohn, A. Cellulose: Fascinating Biopolymer and Sustainable Raw Material. Angew. Chem. Int. Ed. 2005, 44, 3358–3393. [Google Scholar] [CrossRef] [PubMed]
  10. Klemm, D.; Philipp, B.; Heinze, T.; Heinze, U.; Wagenknecht, W. Comprehensive Cellulose Chemistry: Fundamentals and Analytical Methods, Volume 1, and Functionalization of Cellulose; Wiley-VCH: Weinheim, Germany, 1998; Volume 2. [Google Scholar]
  11. Mann, G.; Kunze, J.; Loth, F.; Fink, H.-P. Cellulose ethers with a block-like distribution of the substituents by structure-selective derivatization of cellulose. Polymer 1998, 39, 3155–3165. [Google Scholar] [CrossRef]
  12. Wüstenberg, T. Cellulose and Cellulose Derivatives in the Food Industry; Wiley-VCH: Weinheim, Germany, 2015. [Google Scholar]
  13. Ott, E.; Spurlin, H.M.; Grafflin, M.G. Cellulose and Cellulose Derivatives, High Polymers V, 1-3, 2nd ed.; Interscience Publishers: New York, NY, USA, 1954. [Google Scholar]
  14. Spurlin, H.M. Arrangement of substituents in cellulose derivatives. J. Am. Chem. Soc. 1939, 61, 2222–2227. [Google Scholar] [CrossRef]
  15. Heinze, T.; Liebert, T.; Koschella, A. Esterification of Polysaccharides; Springer: Berlin/Heidelberg, Germany, 2006; p. 232. [Google Scholar]
  16. Koschella, A.; Heinze, T.; Klemm, D. First synthesis of 3-O-functionalized cellulose ethers via 2,6-di-O-protected silyl cellulose. Macromol. Biosci. 2001, 1, 49–54. [Google Scholar] [CrossRef]
  17. Kamitakahara, H.; Koschella, A.; Mikawa, Y.; Nakatsubo, F.; Heinze, T.; Klemm, D. Synthesis and comparison of 2,6-di-O-methyl-celluloses from natural and synthetic cellulloses. Macromol. Biosci. 2006, 8, 690–700. [Google Scholar] [CrossRef]
  18. Köhler, S.; Liebert, T.; Heinze, T.; Vollmer, A.; Mischnick, P.; Möllmann, E.; Becker, W. Interactions of Ionic Liquids with Polysaccharides, 9. Hydroxyalkylation of Cellulose without Additional Inorganic Bases. Cellulose 2010, 17, 437–448. [Google Scholar] [CrossRef]
  19. Reuben, J. Description and Analysis of Hydroxyethylcelluloses. Macromolecules 1984, 17, 156–161. [Google Scholar] [CrossRef]
  20. Huebner, B.; Knarr, M.; Adden, R.; Sammler, R.; Adden, A. Methods and Compositioins for Inducing Satiety. U.S. 9295712B2, 16 March 2016. [Google Scholar]
  21. Kamitakahara, F.; Nakatsubo, F.; Klemm, D. Block co-oligoers of tri-O-methylated and unmodfied cello-oligosaccharides as model compounds for methylcellulose and its dissolution/gelation behavior. Cellulose 2005, 13, 375–392. [Google Scholar] [CrossRef]
  22. Kamitakahara, H.; Funakoshi, T.; Takanao, T.; Nakatsubo, F. Synthesis of 2,6-O-alkyl celluloses: Influence of methyl and ethyl groups regioselectively introduced at O-2 and O-6 positions on their solubility. Cellulose 2009, 16, 1167–1178. [Google Scholar] [CrossRef]
  23. Arisz, P.W.; Kauw, H.J.J.; Boon, J.J. Substituent distribution along the cellulose backbone in O-methylcelluloses using GC and FAB MS for monomer and oligomer analysis. Carbohydr. Res. 1995, 271, 1–14. [Google Scholar] [CrossRef]
  24. Mischnick, P.; Kühn, G. Correlation between reaction conditions and primary structure: Model studies on methyl amylose. Carbohydr. Res. 1996, 290, 199–207. [Google Scholar] [CrossRef]
  25. Mischnick, P.; Adden, R. Fractionation of Polysaccharide Derivatives and Subsequent Analysis to Differentiate Heterogeneities on Various Hierarchical Levels. Macromol. Symp. 2008, 262, 1–7. [Google Scholar] [CrossRef]
  26. Adden, R.; Mischnick, P. A novel method for the analysis of the substitution pattern of O-methyl-α- and β-1,4-glucans by means of electrospray-ionization mass spectrometry/collision induced dissociation. Int. J. Mass Spectrom. 2005, 242, 63–73. [Google Scholar] [CrossRef]
  27. Mischnick, P. Analysis of the Substituent Distribution in Cellulose Ethers—Recent Contributions. In Cellulose Science and Technology, 1st ed.; Rosenau, T., Potthast, A., Hell, J., Eds.; Wiley: Weinheim, Germany, 2019; pp. 143–173. [Google Scholar]
  28. Kondo, T. Preparation of 6-O-alkyl-celluloses. Carbohydr. Res. 1993, 238, 231–240. [Google Scholar] [CrossRef]
  29. Xu, D.; Voiges, K.; Elder, T.; Mischnick, P.; Edgar, K. Regioselective Synthesis of Cellulose Ester Homopolymers. Biomacromolecules 2012, 13, 2195–2201. [Google Scholar] [CrossRef]
  30. Adden, R.; Niedner, W.; Müller, R.; Mischnick, P. Comprehensive analysis of the substituent distribution in the glucosyl units and along the polymer chain of hydroxyethylmethylcelluloses and statistical evaluation. Anal. Chem. 2006, 78, 1146–1157. [Google Scholar] [CrossRef]
  31. Mischnick, P.; Momcilovic, D. Chemical Structure Analysis of Starch and Cellulose Derivatives. Adv. Carbohydr. Chem. Biochem. 2010, 64, 117–210. [Google Scholar] [CrossRef] [PubMed]
  32. Steeneken, P.A.M. Reactivity of amylose and amylopectin in potato starch. Starch-Stärke 1984, 36, 13–18. [Google Scholar] [CrossRef]
  33. Steeneken, P.A.M.; Woortman, A.J.J. Substitution pattern in methylated starch as studied by enzymic degradation. Carbohydr. Res. 1994, 258, 207–221. [Google Scholar]
  34. Steeneken, P.A.M.; Tas, A.C.; Woortman, A.J.J.; Sanders, P.; Mijland, P.J.H.C.; de Weijs, L.G.R. Substitution patterns in methylated starch as revealed from the structure and composition of fragments in enzymatic digests. Carbohydr. Res. 2008, 343, 2411–2416. [Google Scholar] [CrossRef] [PubMed]
  35. Nojiri, M.; Kondo, T. Application of regioselectively substituted methylcelluloses to characterize the reaction mechanism of cellulase. Macromolecules 1996, 29, 2392–2395. [Google Scholar] [CrossRef]
  36. Horner, S.; Puls, J.; Saake, B.; Klohr, E.-A.; Thielking, H. Enzyme-aided characterisation of carboxymethylcellulose. Carbohyd. Polym. 1999, 40, 1–7. [Google Scholar] [CrossRef]
  37. Saake, B.; Puls, J.; Wagenknecht, W. Endoglucanase fragmentation of cellulose sulfates derived from different synthesis concepts. Carbohydr. Polym. 2002, 48, 7–14. [Google Scholar] [CrossRef]
  38. Melander, C.; Adden, R.; Brinkmalm, G.; Gorton, L.; Mischnick, P. New approaches to the analysis of enzymatically hydrolyzed methyl cellulose. Part 2. comparison of various enzyme preparations. Biomacromolecules 2006, 7, 1410–1421. [Google Scholar] [CrossRef] [PubMed]
  39. Schagerlöf, U.; Schagerlöf, H.; Momcilovic, D.; Brinkmalm, G.; Tjerneld, F. Endoglucanase sensitivity for substituents in methyl cellulose hydrolysis studied using MALDI-TOFMS for oligosaccharide analysis and structural analysis of enzyme active sites. Biomacromolecules 2007, 8, 2358–2365. [Google Scholar] [CrossRef] [PubMed]
  40. Enebro, J.; Momcilovic, D.; Siika-aho, M.; Karlsson, S. Liquid chromatography combined with mass spectrometry for investigation of endoglucanase selectivity on carboxymethyl cellulose. Carbohydr. Res. 2009, 344, 2173–2181. [Google Scholar] [CrossRef] [PubMed]
  41. Cuers, J.; Unterieser, I.; Burchard, W.; Adden, R.; Rinken, M.; Mischnick, P. Simultaneous determination of substituent patterns in partially acid hydrolyzed O-Me/O-Me-d3-cellulose and quantification of the obtained oligomers by HPLC-ESI-MS. Carbohydr. Res. 2012, 348, 55–63. [Google Scholar] [CrossRef] [PubMed]
  42. Mischnick, P.; Unterieser, I.; Voiges, K.; Cuers, J.; Rinken, M.; Adden, R. A new method for the analysis of the substitution pattern of hydroxyethyl(methyl) celluloses over the polysaccharide chain. Macromol. Chem. Phys. 2013, 214, 1363–1374. [Google Scholar] [CrossRef]
  43. Gohdes, M.; Mischnick, P. Determination of the substitution pattern in the polymer chain of cellulose sulfates. Carbohydr. Res. 1998, 309, 109–115. [Google Scholar] [CrossRef]
  44. Brun, Y. The mechanism of copolymer retention in interactive polymer chromatography. I. Critical point of adsorption for statistical copolymers. J. Liquid Chromatogr. Rel. Techn. 1999, 22, 3027–3065. [Google Scholar] [CrossRef]
  45. Pasch, H.; Thrathnigg, B. Multidimensional HPLC of Polymers. In Springer Laboratory Manuals in Polymer Science; Alig, I., Pasch, H., Eds.; Springer: Berlin/Heidelberg, Germany, 2013. [Google Scholar] [CrossRef]
  46. Radke, W. Polymer separations by liquid interaction chromatography: Principles—prospects—limitations. J. Chromatogr. A 2014, 1335, 62–79. [Google Scholar] [CrossRef] [PubMed]
  47. Shakun, M.; Heinze, T.; Radke, W. Determination of the DS distribution of non-degraded sodium carboxymethyl cellulose by gradient chromatography. Carbohydr. Polym. 2013, 98, 943–950. [Google Scholar] [CrossRef] [PubMed]
  48. Shakun, M.; Heinze, T.; Radke, W. Characterization of sodium carboxymethyl cellulose by comprehensive two-dimensional liquid chromatography. Carbohydr. Polym. 2015, 130, 77–86. [Google Scholar] [CrossRef] [PubMed]
  49. Ghareeb, H.O.; Radke, W. Separation of cellulose acetates by degree of substitution. Polymer 2013, 54, 2632–2638. [Google Scholar] [CrossRef]
  50. Ghareeb, H.O.; Radke, W. Characterization of cellulose acetates according to DS and molar mass using two-dimensional chromatography. Carbohydr. Polym. 2013, 98, 1430–1437. [Google Scholar] [CrossRef] [PubMed]
  51. Fischer, K.; Krasselt, K.; Schmidt, I.; Weightman, D. Distribution of substituents along the cellulose chain on cellulose xanthate and carboxymethyl cellulose. Macromol. Symp. 2005, 223, 109–120. [Google Scholar] [CrossRef]
  52. Fischer, S.; Thümmler, K.; Volkert, B.; Hettrich, K.; Schmidt, I.; Fischer, K. Properties and applications of cellulose acetate. Macromol. Symp. 2008, 262, 89–96. [Google Scholar] [CrossRef]
  53. Fitzpatrick, F.; Schagerlöf, H.; Andersson, T.; Richardson, S.; Tjerneld, F.; Wahlung, K.-G.; Wittgren, B. NMR, cloud-point measurements and enzymatic depolymerization: Complementary tools to investigate substituent patterns in modified celluloses. Biomacromolecules 2006, 7, 2909–2917. [Google Scholar] [CrossRef] [PubMed]
  54. Oudhoff, K.A.; Buijtenhuijs, F.A.; Winjen, P.H.; Schoenmakers, P.J.; Kok, W.T. Determination of the degree of substitution and its distribution of carboxymethylcelluloses by capillary zone electrophoresis. Carbohydr. Res. 2004, 339, 1917–1924. [Google Scholar] [CrossRef] [PubMed]
  55. Bol, M.; Dobos, M.A.; Lebioda, S.; Saake, B.; Mischnick, P. Methanolysis of Carboxymethyl Cellulose—A Comprehensive Study. Cellulose 2019, 26, 383–397. [Google Scholar] [CrossRef]
  56. Adden, R.; Müller, R.; Mischnick, P. Fractionation of methyl cellulose according to polarity—A tool to differentiate first and second order heterogeneity of the substituent distribution. Macromol. Chem. Phys. 2006, 207, 954–965. [Google Scholar] [CrossRef]
  57. Greiderer, A.; Steeneken, L.; Aalbers, T.; Vivó-Truyois, G.; Schoenmakers, P. Characterizaton of hydroxypropylmethylcellulose (HPMC) using comprehensive two-dimensional liquid chromatography. J. Chromatogr. A 2011, 1218, 5787–5793. [Google Scholar] [CrossRef] [PubMed]
  58. Viridén, A.; Wittgren, B.; Andersson, T.; Arahmsén-Alami, S.; Larsson, A. Influence of substitution pattern on solution behavior of hydroxypropyl methylcellulose. Biomacromolecules 2009, 10, 522–529. [Google Scholar] [CrossRef] [PubMed]
  59. Wirick, M.G.; Waldman, M.H. Some solution properties of fractionated water-soluble hydroxypropylcelluloses. J. Appl. Polm. Sci. 1970, 14, 579–597. [Google Scholar] [CrossRef]
  60. Spurlin, H.M. Homogeneity and Properties of Nitrocellulose. Industr. Eng. Chem. 1938, 30, 538–542. [Google Scholar] [CrossRef]
  61. Cuers, J.; Rinken, M.; Adden, R.; Mischnick, P. Critical investigation of the substituent distribution in the polymer chains of hydroxypropyl methylcelluloses by LC-ESI-MS. Anal. Bioanal. Chem. 2013, 405, 9021–9032. [Google Scholar] [CrossRef] [PubMed]
  62. Voiges, K.; Adden, R.; Rinken, M.; Mischnick, P. Critical Re-Investigation of the Alditol Acetate Method for Analysis of Substituent Distribution in Methyl Cellulose. Cellulose 2012, 19, 993–1004. [Google Scholar] [CrossRef]
  63. Basedow, A.M.; Ebert, K. Ultrasonic degradation of polymers in solution. In Advances in Polymer Science—Physical Chemistry; Springer: Berlin/Heidelberg, Germany, 1977; pp. 83–148. [Google Scholar]
  64. Schittenhelm, N.; Kulicke, W.M. Producing homologous series of molar masses for establishing structure-property relationships with the aid of ultrasonic degradation. Macromol. Chem. Phys. 2000, 201, 1976–1984. [Google Scholar] [CrossRef]
  65. Grönroos, A.; Pirkonen, P.; Ruppert, O. Ultrasonic depolymerization of aqueous carboxymethylcellulose. Ultrasonics Sonochem. 2004, 11, 9–12. [Google Scholar] [CrossRef]
  66. Stefanovic, B.; Rosenau, T.; Potthast, A. Effect of sonochemical treatments on the integrity and oxidation state of cellulose. Carbohydr. Polym. 2013, 92, 921–927. [Google Scholar] [CrossRef] [PubMed]
  67. Rother, M.; Radke, W.; Mischnick, P. Block-structured 1,4-glucans by transglycosidation of cellulose ethers. Macromol. Chem. Phys. 2016, 217, 889–900. [Google Scholar] [CrossRef]
  68. Hashemi, P.; Mischnick, P. 1,4-D-Glucan Block Copolymers—Synthesis and Comprehensive Structural Characterization. Anal. Bioanal. Chem. 2020, 412, 1597–1610. [Google Scholar] [CrossRef] [PubMed] [Green Version]
  69. Schulz, L.; Seger, B.; Burchard, W. Structures of cellulose in solution. Macromol. Chem. Phys. 2000, 201, 2008–2022. [Google Scholar] [CrossRef]
  70. Morooka, T.; Norimoto, M.; Yamada, T.; Shiraishi, N. Dielectric properties of cellulose acylates. J. Appl. Polym. Sci. 1984, 29, 3981–3990. [Google Scholar] [CrossRef]
  71. Penduff, P. Analytical to Preparative HPLC Method Transfer. An Easy Way to Scale up from UHPLC to Preparative HPLC Using Focused Gradient; Agilent Technology: Santa Clara, CA, USA, 2013; Publication Number 5991-2013EN. [Google Scholar]
Figure 1. Simplified sketch of the hierarchical levels or dimensions of substituent distributions in cellulose derivatives: in the glucosyl unit (first dimension, 1D), along a cellulose chain (heterogeneity of second order, second dimension, 2D), and over the bulk material (heterogeneity of third order, third dimension, 3D).
Polysaccharides 02 00051 g001
Figure 2. Methyl distribution profiles for domains with increasing number of AGU (DP2-10, starting with the broadest profile for DP2, ending with the narrowest for DP10) in two MCs, both with DS 1.99. (a): equal distribution on positions O-2, O-3, O-6; (b): preferred methylation at O-2 followed by O-6 and O-3. Partial DS values xi are given in the legend. * The Mol% scale does refer to 7 data points for DP2. All other profiles with increasing number of data points are normalized to DP2 for comparability.
Polysaccharides 02 00051 g002
Figure 3. Concept of the analysis of the substituent distribution among the chains. Approximately one labeled COS/cellulose molecule shall be generated and separated from all COS of the same cellulose chain. The MC has been permethylated with MeI-d3 prior to ultrasonic degradation. For details see text.
Polysaccharides 02 00051 g003
Figure 4. Comparison of the experimentally determined methyl distributions (orange) of COS for DP2-10 with various calculated random profiles (black). Sample: blend of MC 1.29 and MC 1.96 (2:3); DS 1.67. Left (1st and 3rd column): comparison with random methyl profile calculated for the overall monomer composition of the blend; right (2nd and 4th column): comparison with weighted combination of random profiles of MC 1.29 (40%) and MC 1.96 (60%), i.e., theoretical profile for the blend (with random distributions for both MCs).
Polysaccharides 02 00051 g004
Figure 5. Schematic demonstration of the preparation of blocky glucan ether structures (a,b) by transglycosylation (Trg), the analytical procedure (c) for structural characterization of the products by ESI-LC-MS, and typical mass spectra for DP2 of the glucan-derived COS. Reproduced from Figure 1 of Ref. [68]: Hashemi, P.; Mischnick, P. Anal. Bioanal. Chem. 2020, 412, 1597–1610.
Polysaccharides 02 00051 g005
Figure 6. Transformation of MC (OMe/OH) into fully protected cellulose derivative (MC-MeOBz, OMe/OBzOMe).
Polysaccharides 02 00051 g006
Figure 7. Correlation of DS and 2-PrOH (vol %) at the peak midpoint of MC-MeOBz according to their average DS (left); eluent program with stepwise enhancement and decrease of the ratio of 2-PrOH in DCM (right).
Polysaccharides 02 00051 g007
Figure 8. Analytical stepwise gradient HPLC of 4-methoxybenzoates of various MCs (Me-MeOBz, DSMe: (a) 0.88, (b) 1.31, (c) 1.60, (d) 2.10) on a silica column with DCM/2-PrOH. Left column: ELSD. Right column: UV (257 nm). Adsorption-desorption technique with stepwise enhancement and decrease of 2-PrOH, according to Figure 7. Portions of the MeOBz-MC are eluted in each desorption step with increasing amounts of 2-PrOH. The signal at 10 min (*) corresponds to the retention time of MeOBz cellulose DSMe = 0, but is superimposed by co-eluting contamination.
Polysaccharides 02 00051 g008
Figure 9. HPLC-Chromatogram of MC-MeOBz (DSMe 1.91) on a semipreparative column (Polaris 5 Si-A 250 × 10.6 mm), DCM/2-PrOH, 4.5 mL/min, 3 min hold for each adsorption and desorption step; UV-detection at 257 nm. Injection: 1 mL; c 6.8 mg/mL in DCM.
Polysaccharides 02 00051 g009
Figure 10. Methyl distribution in the glucosyl units of the main fractions obtained by semi- preparative fractionation of MC (DS 1.91) as MC-MeOBz by gradient HPLC on silica with DCM/2-PrOH gradient as shown in Figure 9. DS: 1.75 (F8), 1.88 (F9) and 2.03 (F10).
Polysaccharides 02 00051 g010
Publisher’s Note: MDPI stays neutral with regard to jurisdictional claims in published maps and institutional affiliations.

