
Valuable Biodiesel Catalyst from Solvay Wastewater


Chemical Engineering Department, Faculty of Engineering, The British University in Egypt, El-Sherouk City 11837, Egypt
*
Author to whom correspondence should be addressed.
Processes 2022, 10(5), 1042; https://0-doi-org.brum.beds.ac.uk/10.3390/pr10051042
Submission received: 7 April 2022
/
Revised: 19 May 2022
/
Accepted: 20 May 2022
/
Published: 23 May 2022
(This article belongs to the Special Issue Process Intensification for Biomass Conversion to Next-Generation Biofuels)
Abstract
:Biodiesel is considered a renewable, green fuel as it is derived from renewable living resources like animal fats or vegetable oils. This research is utilized to investigate the possibility of using Solvay wastewater as a source of biodiesel catalyst, which is CaO. CaCl2 from Solvay wastewater reacts with CO2 to produce CaCO3. CaCO3 is then heated to produce pure CaO. Waste cooking oil, wastewater, and CO2, which are considered dangerous materials to the environment, are used to produce valuable products. This research has environmental and economic benefit benefits of using waste materials as a replacement for raw materials. The selected experimental parameters for the CaCO3 production step are stirring rate (500–1300) rpm, CO2 gas flow rate (900–2000) mL/min, amount of ammonia (15–35) mL, and glycerol volume (0–25) mL. The selected experimental parameters for the biodiesel production step are reaction time (2–6) h, methanol to oil ratio (9–15), catalyst loading (1–5) %, and reaction temperature (50–70) °C. The impact of reaction parameters on reaction responses was assessed using the response surface methodology technique. A formula that represents the reaction response as a function of all the independent factors has been created. The optimization of the process is done in two steps: the first one is for the CaCO3 process while the second one is biodiesel production optimization. The first optimization was done to get the CaCO3 with minimum particle size and yield. The second optimization was done to get the maximum amount of biodiesel using minimum energy and low reaction conditions. Process optimization resulted in another economic benefit for this research. The resulted biodiesel yield equals 95.8% biodiesel yield at 2 h reaction time, 15:1 molar ratio of methanol to oil, 56 °C reaction temperature, and 1% catalyst loading.
1. Introduction
The constant rise in energy need for global industrialization and modernization has resulted in a non-renewable energy shortage in recent years. Because energy is such an important aspect globally, people are becoming more aware of the need to find environmentally friendly biofuels [1,2,3]. Biofuels like biodiesel are considered effective renewable sources. Transesterification is one of the processes that produce biodiesel. Biodiesel, commonly known as fatty acid methyl diesel, is chemically identical to Petro-diesel as they have approximately the same properties. Biodiesel is made by mixing biomass, ethanol or methanol, and catalysts such as sodium or potassium hydroxide or solid catalyst. Biomass is like vegetable oils and animal fats [4,5,6,7].
To start the transesterification process, chemical or biological catalysts are used. Homogeneous reagents (alkali or acid), heterogeneous agents (solid acid or solid alkali catalysts), heterogeneous nano-catalysts, and supercritical fluids make up the chemical catalyst. These catalysts are effective in completing the process, even though the reaction requires a lot of energy and a long purification step to get the refined end product [8,9,10].
Many researchers used CaO or solid waste containing CaO as a biodiesel catalyst. Watcharathamrongkul et al. used calcium oxides produced from the calcination of CaO, Ca(OH)2, limestone, and Ca(OH)2/CaO as solid base catalysts to catalyze the transesterification of soybean oil and ethanol. After 10 h of reaction time, the conversion of soybean oil reached 96.3 percent [11]. Calcium oxide (CaO) was generated from eggshells and employed as a catalyst for biodiesel generation from rubber seed oil with 99.7% yield by Sai Bharadwaj et al. With a 12:1 molar ratio of methanol to rubber seed oil, 4% by weight catalyst, and a 3 h reaction duration, 99.7% RSO to biodiesel conversion was achieved [12]. As a heterogeneous catalyst, Al-Sakkari et al. used cement kiln dust. The following circumstances were discovered to be optimal: a reaction period of around 6 h, catalyst loading of 2% of oil mass, and methanol to oil molar ratio of 15:1. In all trials, a fixed mixing speed of 800 rpm and a constant temperature of 65 °C were used [13].
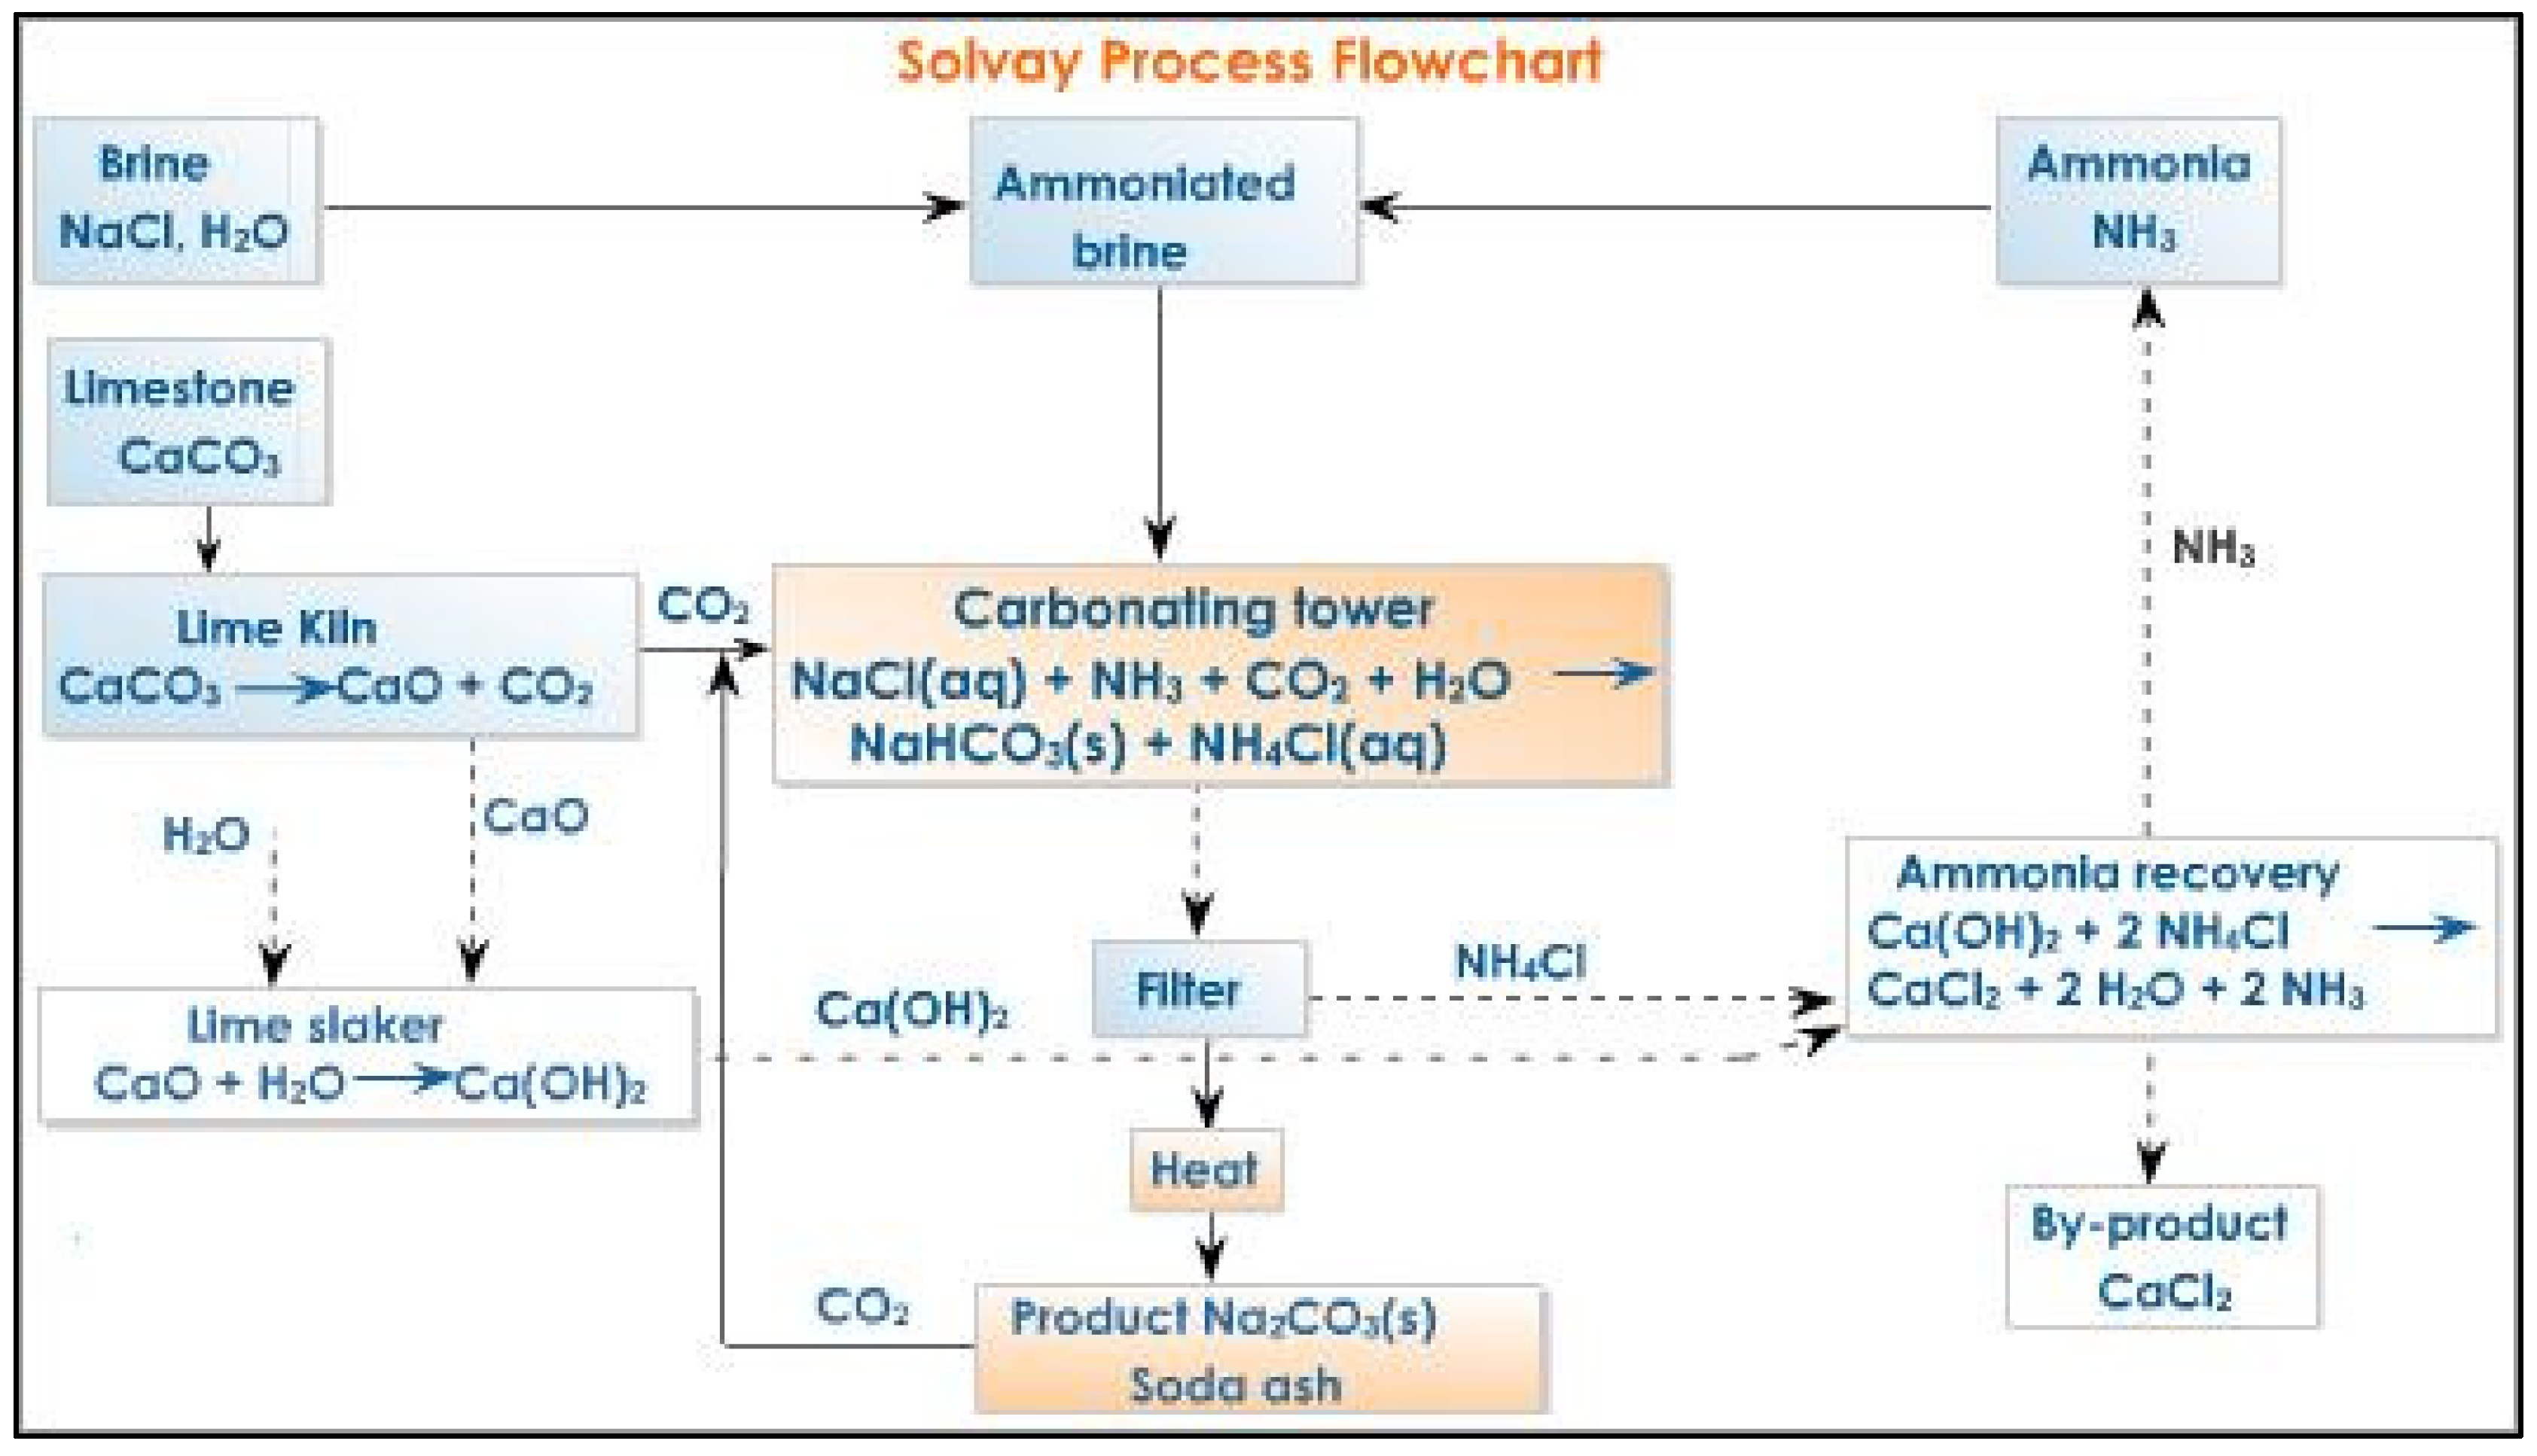
The Solvay process’s basic product is synthetic soda ash (Na2CO3) as described in Figure 1. Soda ash is an important raw material source for a variety of industries. In the Solvay process, ammonia is recovered. The liquid waste solution of the soda production remains after the ammonia has been removed. In soda ash production through the Solvay process, a waste stream of 10 m3 per ton of product Na2CO3 is produced. This stream, known as distiller waste, contains CaCl2, NaCl, and small quantities of Ca(OH)2 and CaCO3. This stream is discharged into the Mediterranean sea, rivers, and lakes, which cause environmental problems [14,15,16].
The first goal of this research is to innovate and examine the possibility of using Solvay wastewater as a source of valuable biodiesel catalyst, which is CaO to be used as a heterogeneous catalyst using optimum process and reaction parameters. This research has an economic benefit as it used minimum energy and low reaction conditions. The second goal is using the waste cooking oil, wastewater, and CO2 which are considered dangerous materials to the environment for producing a valuable product, so this research has an environmental benefit and economic benefit because using waste materials as a replacement for raw materials. The third goal is the production of biodiesel with a high yield, which is considered an important biofuel and can replace diesel fuel in all its uses. In the future, all petroleum products will disappear as they are non-renewable energy sources and will be replaced by renewable energy sources.
2. Materials and Methods
2.1. Experimental Work Raw Materials
There are five types of raw materials used in this work as follows:
- (a)
- Solvay wastewater from the Solvay process factory. The composition of this wastewater is shown in Table 1.
- (b)
- Carbon dioxide gas purchased from “Delta Carbon for Gases Company”
- (c)
- Ammonia Solution (NH4OH) 33% purchased from “El Nasr Pharmaceutical Chemicals company”.
- (d)
- (e)
- Methanol (MeOH) 99% that was purchased from Morgan Chemical Ltd., City, Egypt.
2.2. Assessment of Produced CaCO3 and the Biodiesel Catalyst (CaO)
The phases included in the substrate can be seen using X-ray diffraction (XRD). The particle size distribution was determined using the standardized screening process described in ASTM D 422/2007 [17] and ASTM E 11/2009 [18]. Scanning electron microscopes are used to show the phases and the shape of the particles present in the used biodiesel catalyst.
2.3. SFWCO Collection and Preparation
Several cafes provided SFWCO. The SFWCO was dried at 105 °C for 2 h for water removal and centrifuged for removal of any suspended materials to get clean oil for biodiesel production with high and good quality [19].
2.4. Biodiesel Catalyst Preparation (CaO)
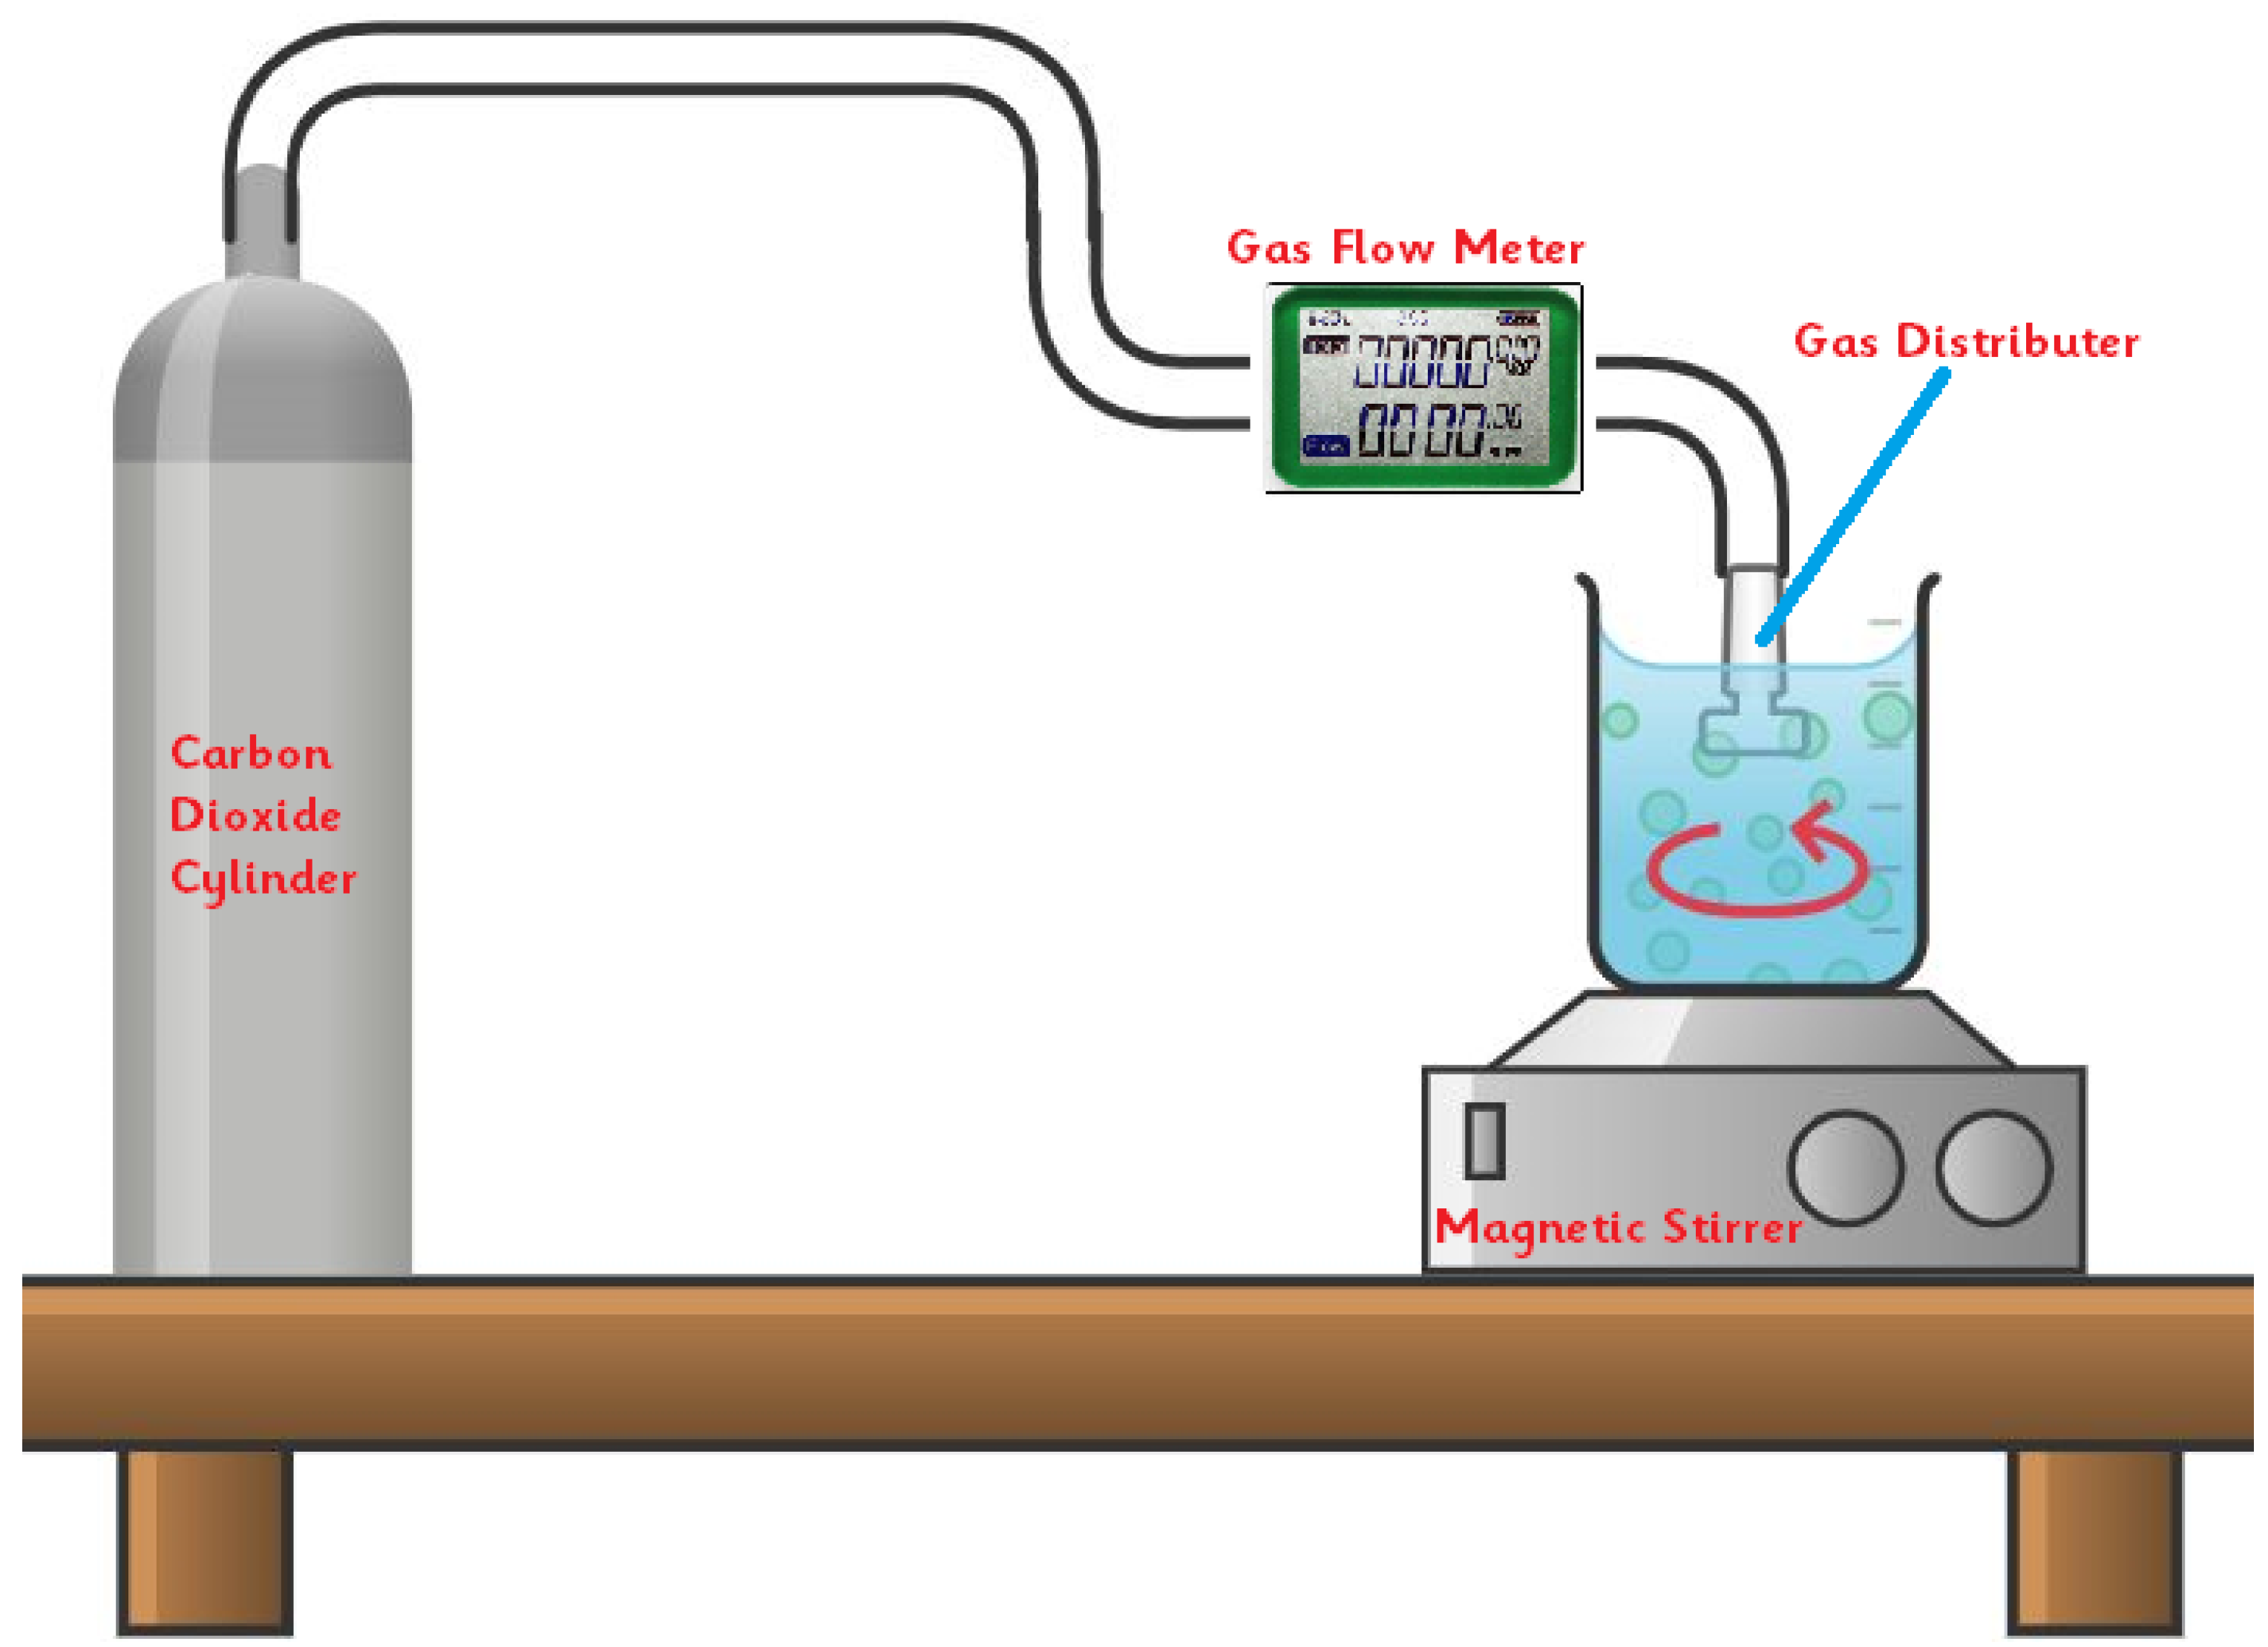
The production of biodiesel catalyst from Solvay wastewater was done by the following steps and the experimental setup is shown in Figure 2:
- Ammonia solution was added with a certain amount to the Solvay wastewater to form a mixture of 250 mL.
- Glycerol was added with a certain amount to the reaction mixture, which is mixed using a magnetic stirrer (WiseStir MSH-20D) adjusted to the required stirring rate.
The glycerol was added to the reaction medium with a certain amount. To produce precipitated calcium carbonate with a smaller particle size in the nano range is very important to slow down the crystal growth. This can be achieved by using a suitable additive that can be adsorbed to the selected sites at the crystal/solution interface and hinder the approach of constituent ions, thereby slowing down the crystal growth in directions perpendicular to the affected faces. Consequently, the relative growth rates of affected and non-affected faces may change [20]. Therefore, glycerol is used as an additive, which can hinder the crystal growth by forming calcium complexes [21].
- 3.
- CO2 gas was bubbled with a certain flow rate which is measured by the “MICRO-FLO PADDLEWHEEL FLOWMETER” for 20 min using a PYREX gas distribution tube with sintered thimble purchased from SciLabware:
- Diameter of tube: 8 mm;
- Nominal overall length: 300 mL;
- OD of thimble: 15 mm;
- Porosity grade: 1.
Popescu et al. [22] suggested a mechanism for the reactions involved in the carbonation of CaCl2 solution in the presence of ammonium hydroxide (NH4OH) solutions, which can be described by the following steps:
- Absorption of CO2 gas
- Formation of hydroxide ion (OH−)
- Formation of bicarbonate ion
- Formation of carbonate ion
- Formation of CaCO3
The chlorine (Cl−) ions presented may react with (NH4+) to yield ammonium chloride (NH4Cl) that can be used for the preparation of useful fertilizers. Hence, the overall reaction to the above process can be expressed by Equation (6):
- 4.
- The resulting product (CaCO3) is allowed to settle, the clear water is withdrawn by filtration, and then the generated particles were allowed to dry naturally.
- 5.
2.5. Production of Biodiesel by a Transesterification Reaction Method
The production of biodiesel was done by the following steps:
- The sunflower oil was added to the round glass batch reactor and heated to the desired reaction temperature using a magnetic stirrer with a heater where the temperature is measured using a thermocouple.
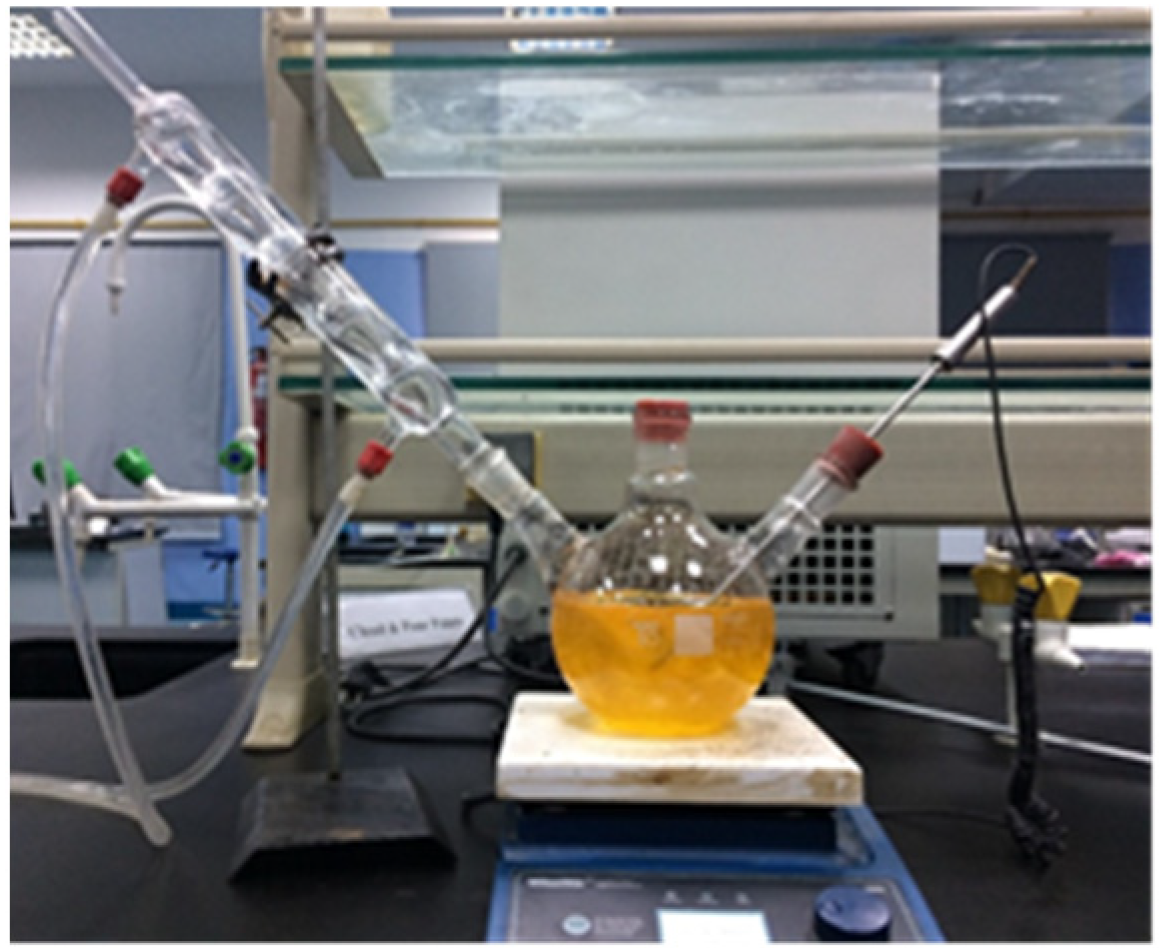
- The mixture of methanol and biodiesel catalyst (CaO) was added to the heated oil at the indicated reaction temperature. The reflux condenser was attached to one neck for methanol condensation as shown in Figure 3.
- The reaction mixture was quenched with cooled methanol by the end of the reaction to stop the reaction.
- The reaction products were filtered to remove the used catalyst.
- The biodiesel and glycerol were poured into a separating funnel for product separation for 2 h then dried at 80 °C for ma in to remove excess methanol.
- Biodiesel was then washed with warm (tap water) water to remove the dissolved contaminations like CaO catalyst, methanol, and glycerol, which has a solubility preference in water rather than biodiesel. Thus, contaminations were transferred to lean water and lowered its concentration in biodiesel. The mass transfer was insured by gently mixing of the mixture. Rich water with contaminations were then separated and replaced by lean water to absorb the remaining contaminations in oil. The washing up was repeated several times until the turbidity of washing water is negligible where water appears transparent having been added to the oil. Transparency of washing water in biodiesel shows that there are no more contaminations to be transferred to water.
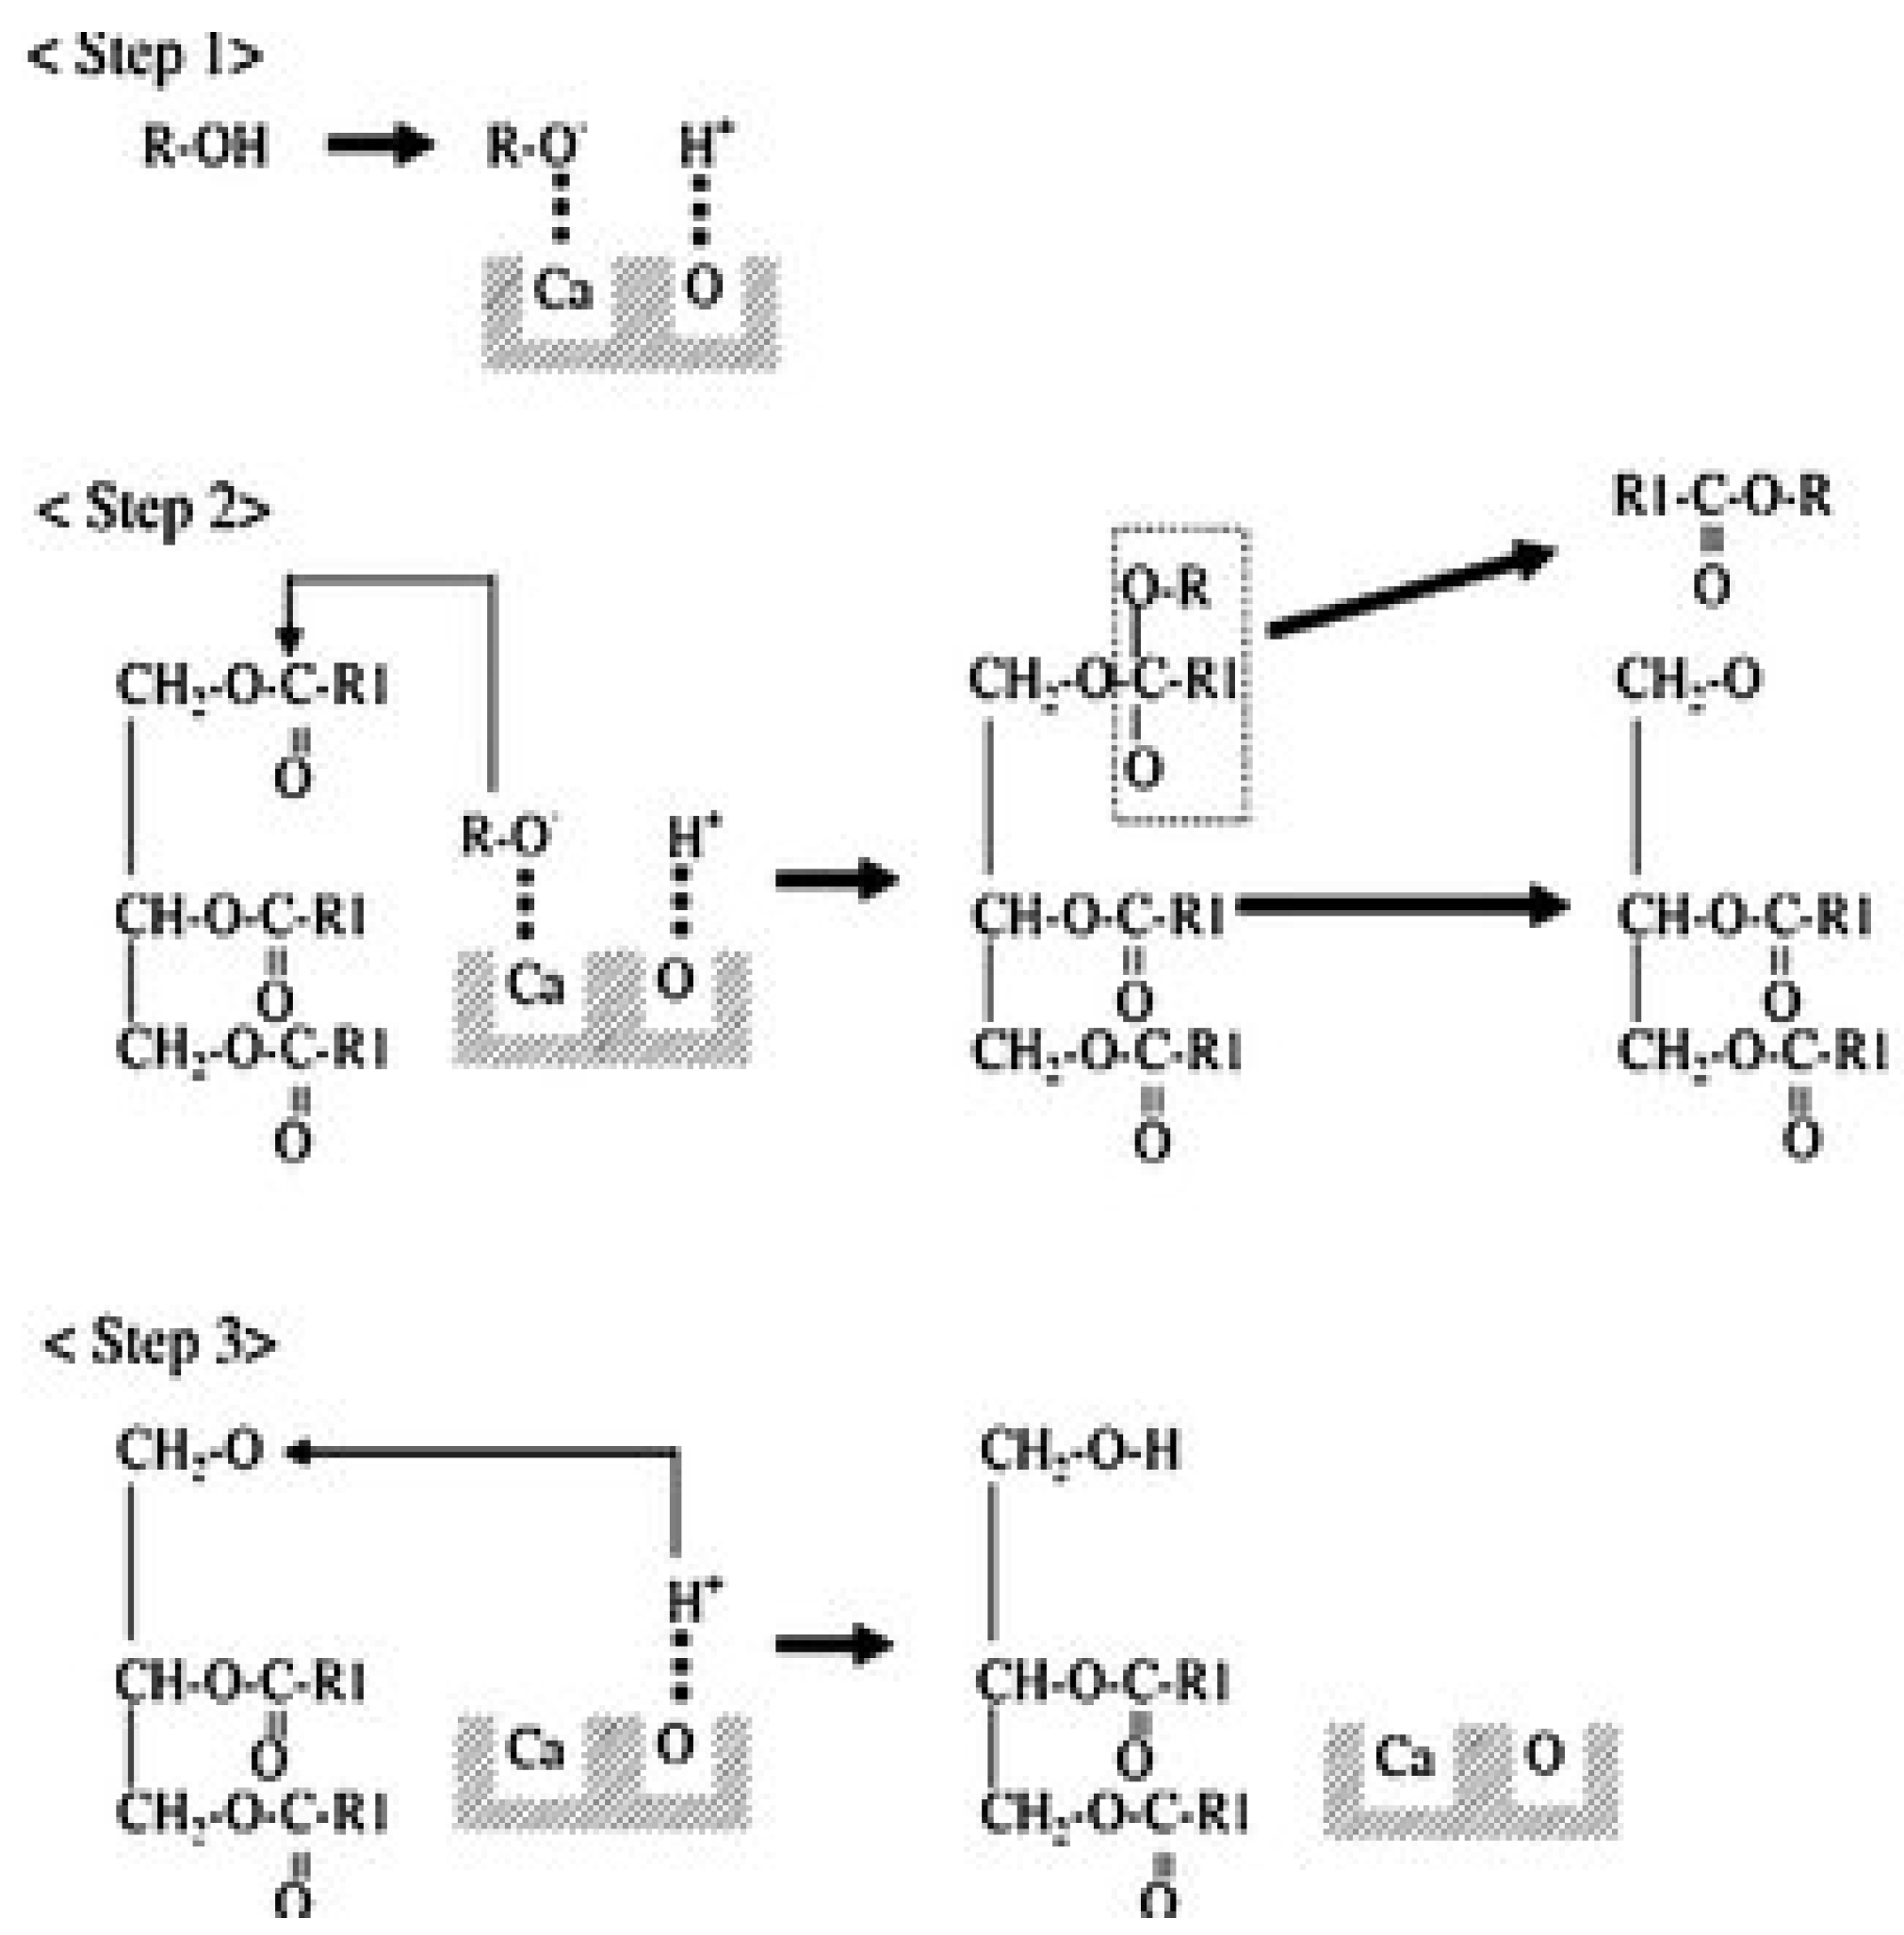
The biodiesel conversion was calculated using Equation (7). The mechanism for the biodiesel production using the transesterification method and CaO catalyst is shown in Figure 4:
2.6. Designing Experiments
In this research, response surface methodology was utilized to establish and produce a complete analysis of the impact of reaction variables on reaction responses utilizing experimental design by design expert version 13 [26]. To reduce the number of experimental trials, the central composite design technique (CCD) is applied. Thirty runs were used and the runs 25 to 30 represent the design center. The optimization is done to maximize biodiesel production and minimize its cost.
2.6.1. CaCO3 Production
- The selected reaction responses are the particle size, nm of produced CaCO3, and its yield in percentage.
- Optimization was done by minimizing the particle size and maximizing the production yield of CaCO3, while minimizing the stirring rate.
2.6.2. Biodiesel Production
- The selected reaction response is biodiesel yield;
- Optimization was done by maximizing the production yield of biodiesel while minimizing the reaction time and temperature.
2.7. Investigations Done on the Optimal Biodiesel Sample
The resulted biodiesel optimum sample was tested using the following methods:
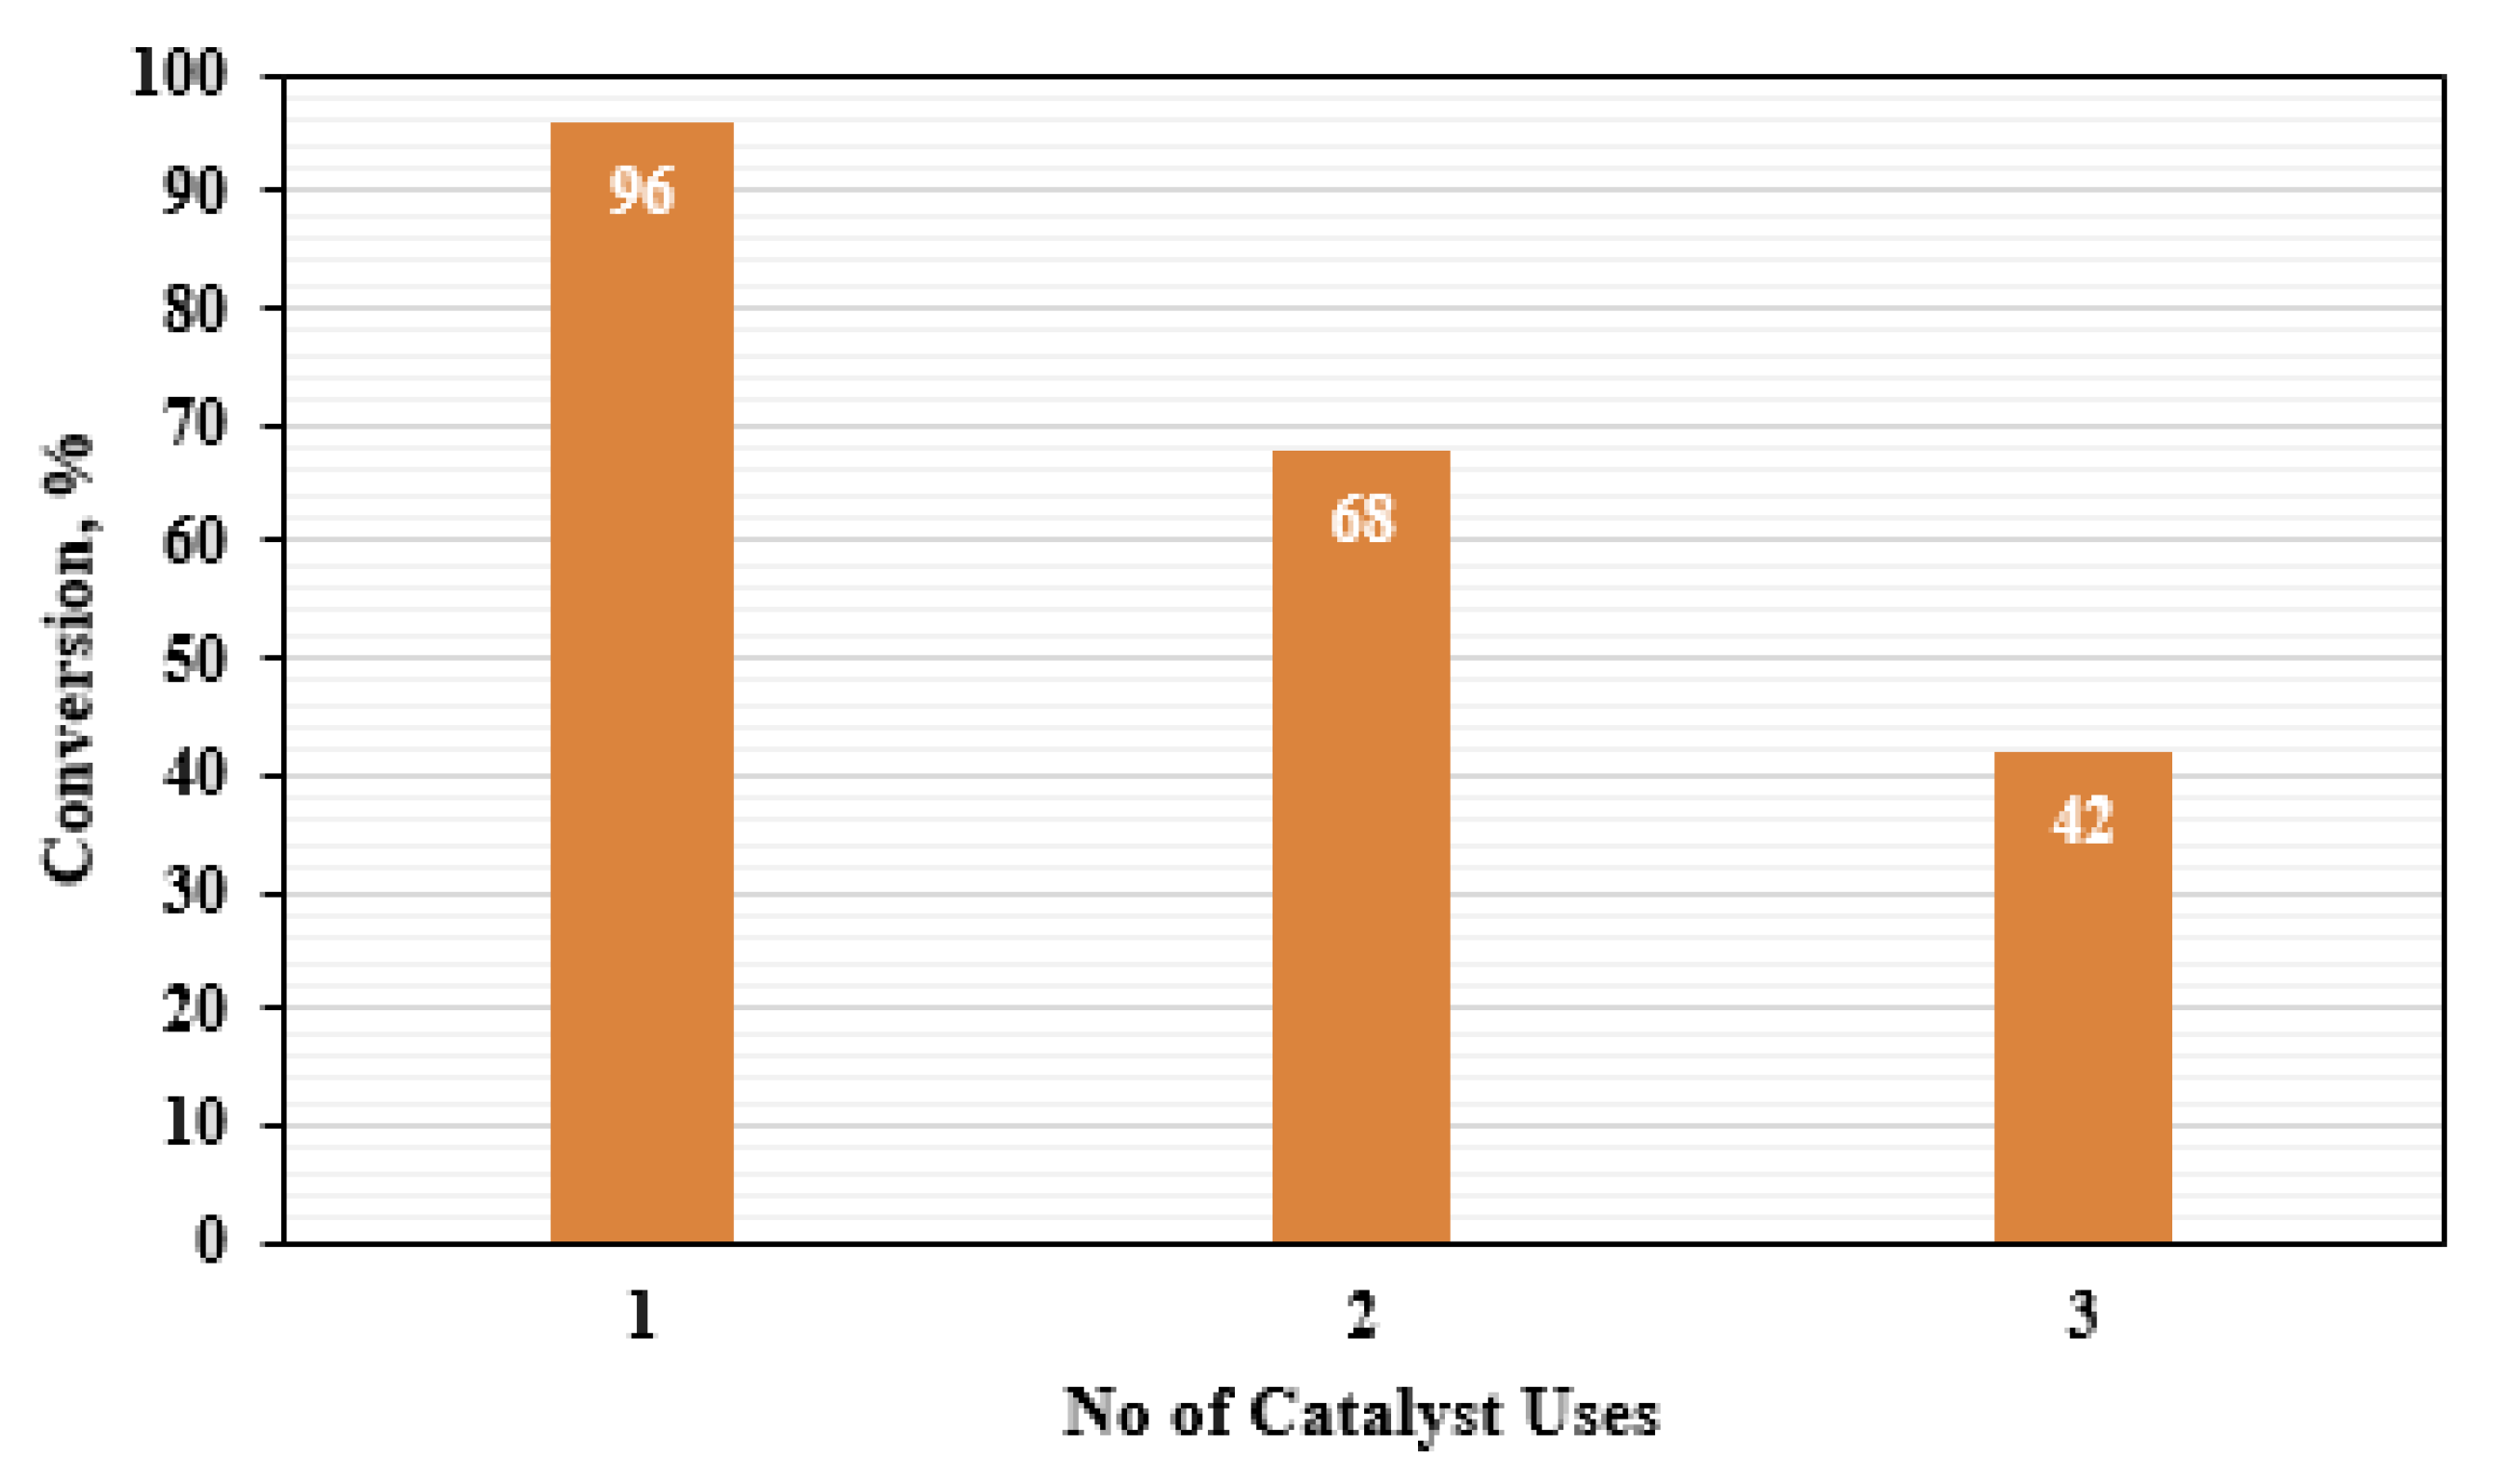
2.8. CaO Reusability
The optimum biodiesel sample that resulted from the first reaction use with biodiesel conversion equals approximately 96%, being filtered and reacted with glycerol to remove the methanol molecules from the catalyst and then reused again and again without adding any new solid waste at the optimum reaction conditions. The biodiesel conversion was calculated at each use as an indication for the catalyst strength determination.
3. Results and Discussion
3.1. Mineralogical Analysis of Produced CaCO3 and the Biodiesel Catalyst
3.1.1. CaCO3 Mineralogical Analysis
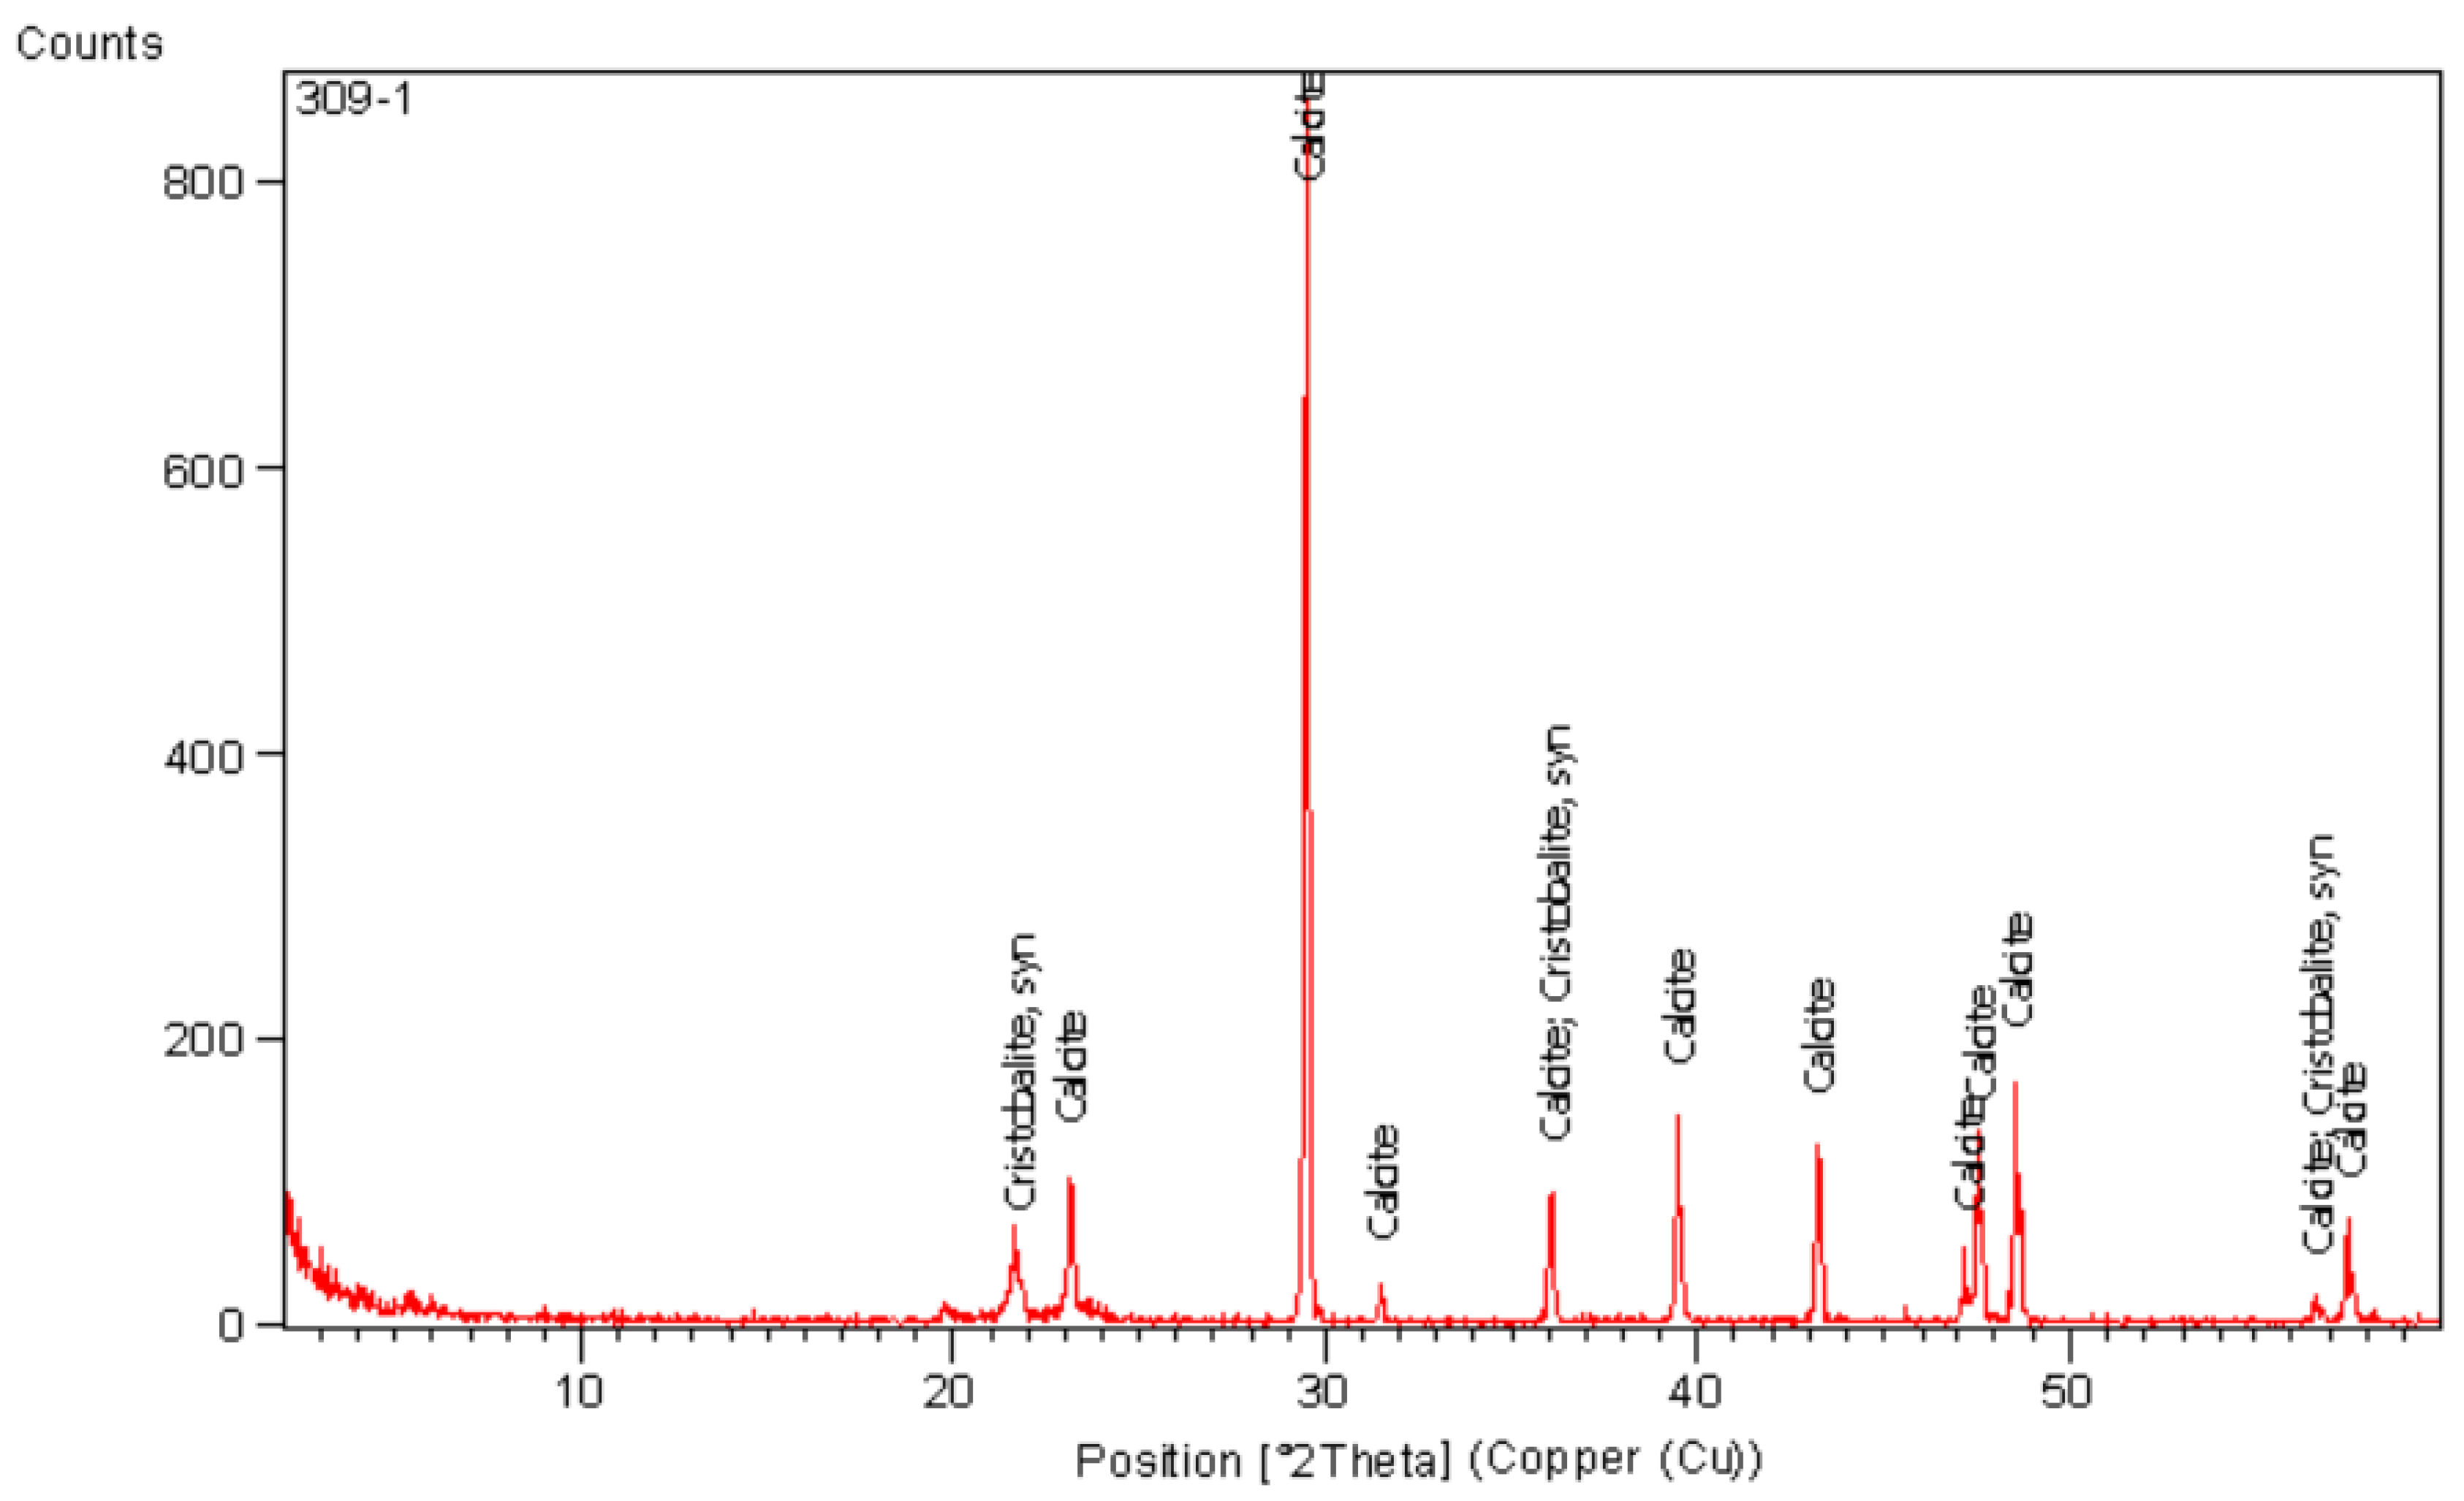
The mineralogical investigation in Figure 5 reveals that it is primarily composed of the calcite (CaCO3) phase, with a trace of cristobalite (SiO2). This confirmed that the CaCO3 is produced by the CaCO3 process, which is expected to be produced by the chemical reaction.
3.1.2. Mineralogical Analysis of Biodiesel Catalyst (CaO)
Figure 6 shows the XRD pattern of CaO and the peaks list of the reference sample (pure calcium oxide) in blue. X-ray diffraction analysis proved that it consists almost exclusively of CaO. The peak positions and relative intensities of the biodiesel catalyst and reference data are an excellent match. This proved that the decomposition of CaCO3 to CaO is completed at approximately 100% since the only present phase is CaO with no CaCO3 phase.
3.2. SEM Results of CaO
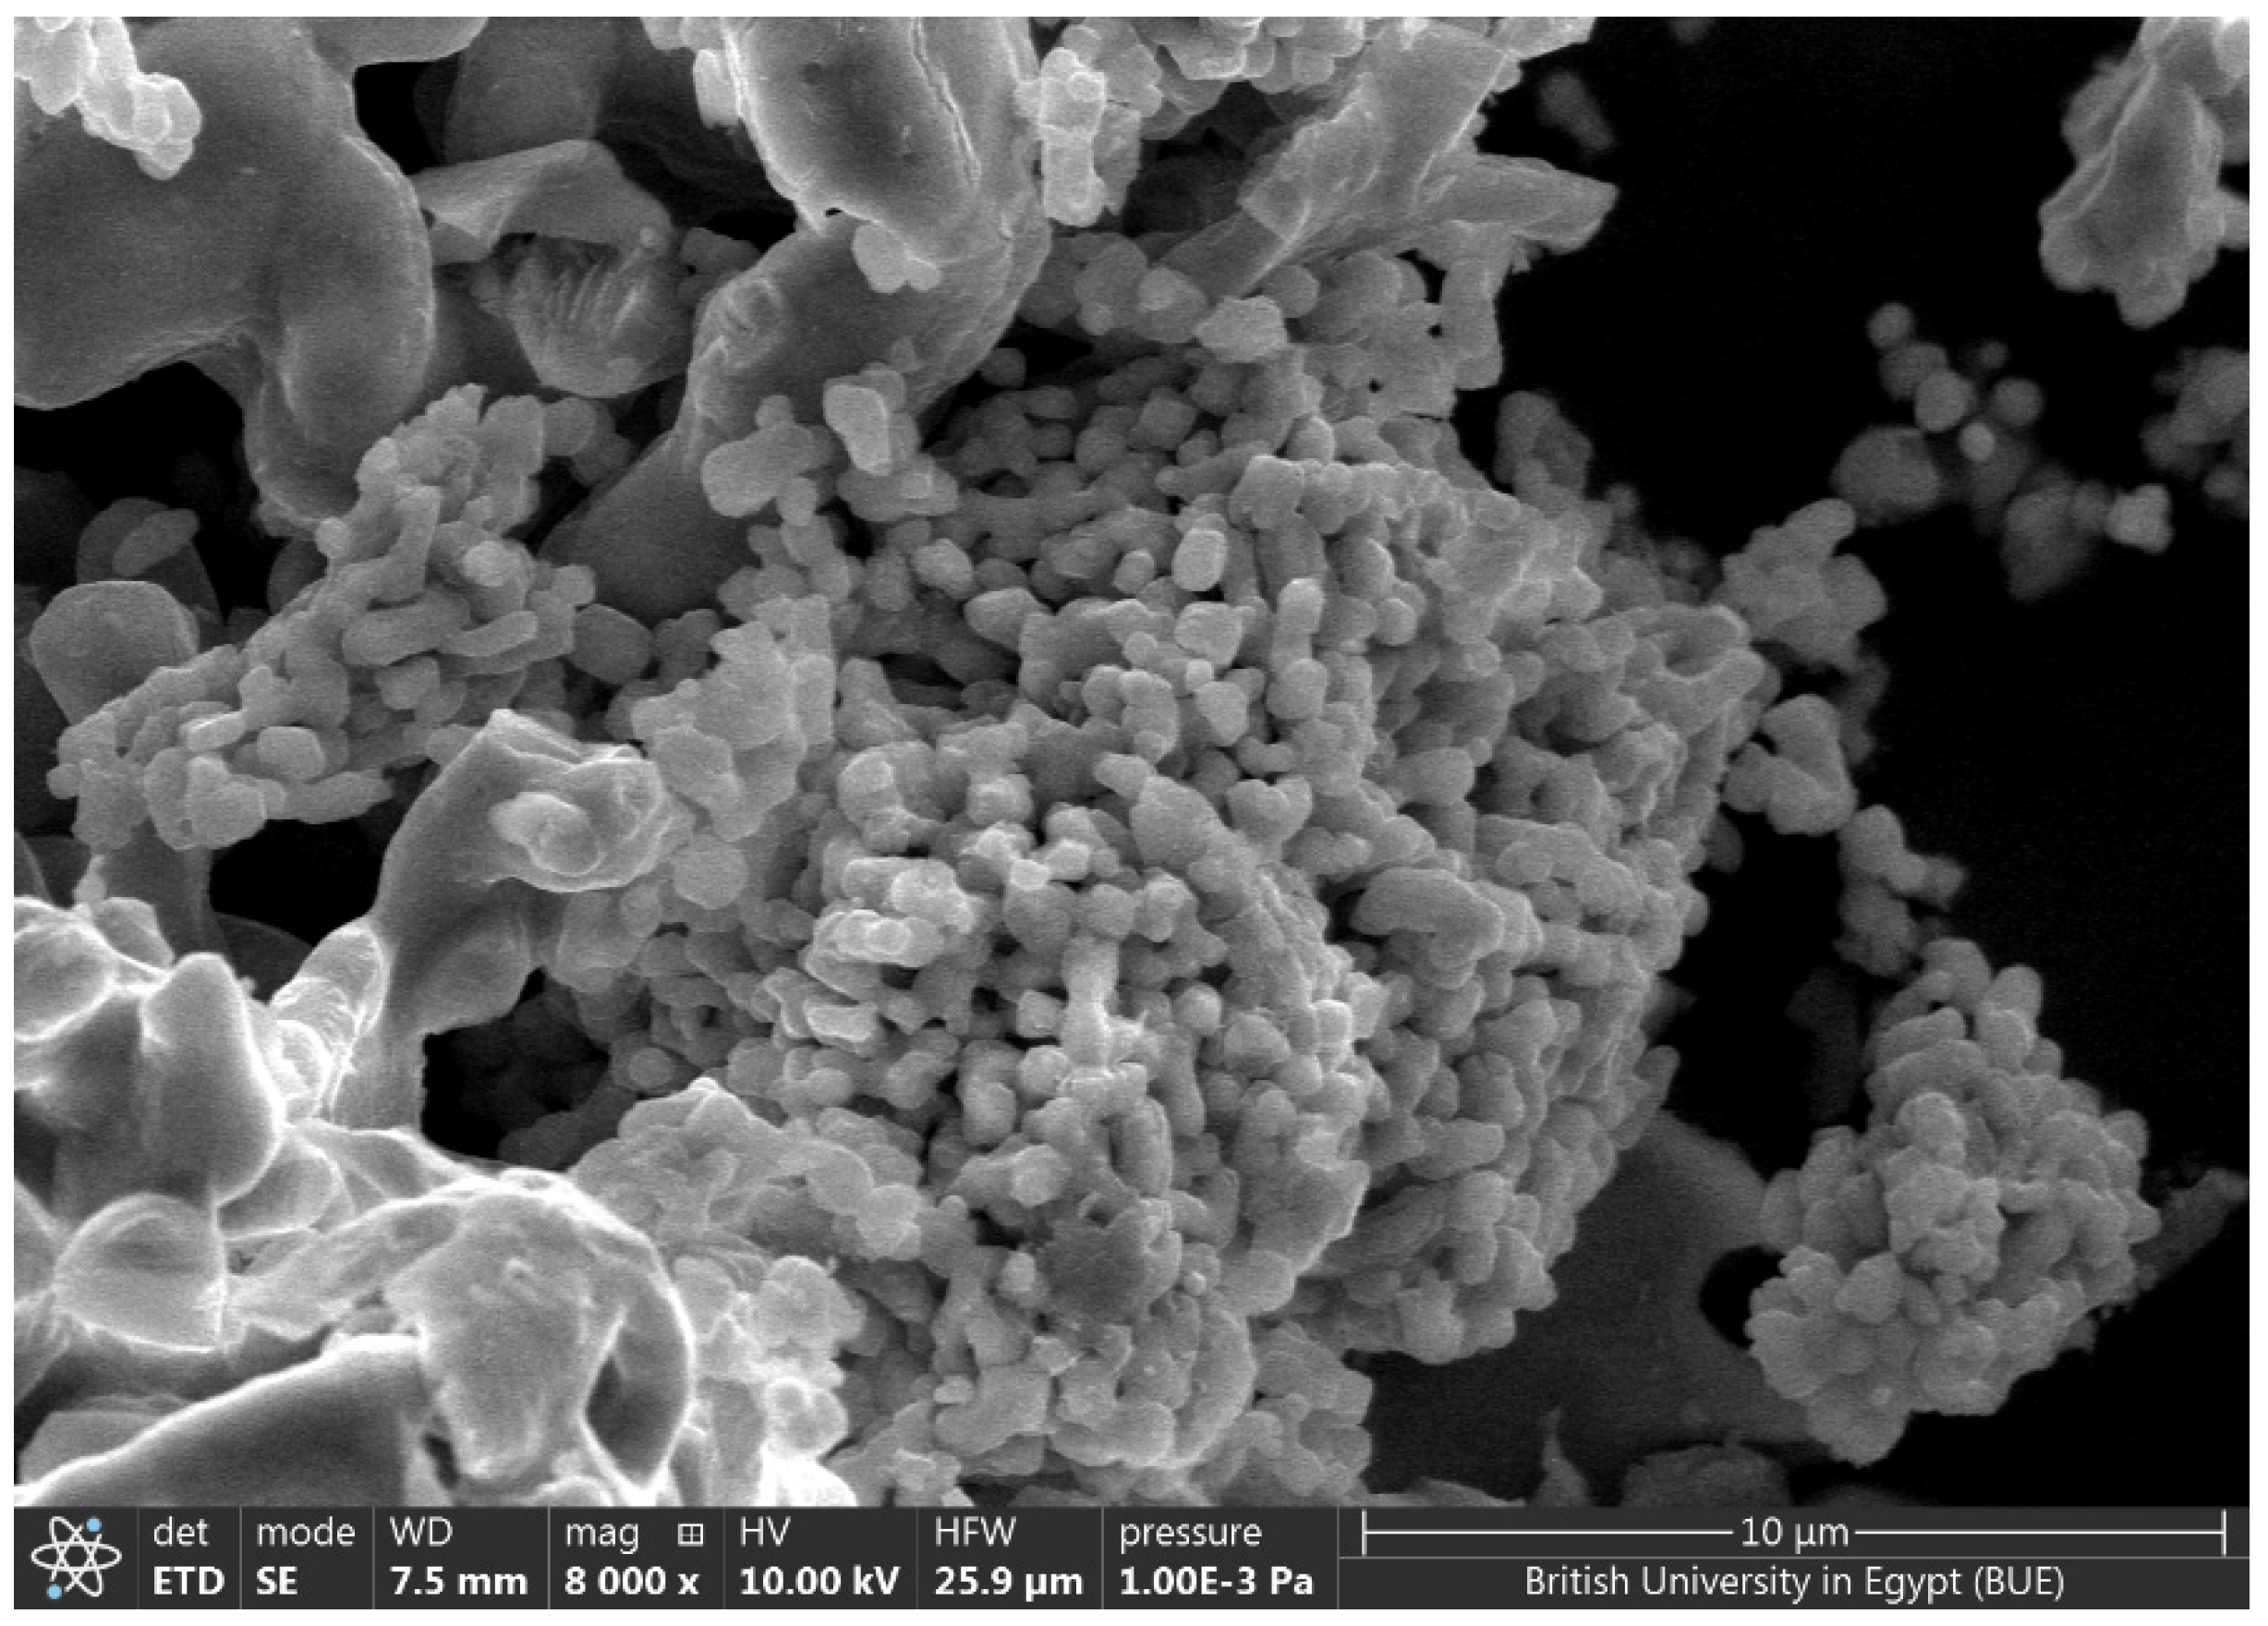
The SEM analysis of the used biodiesel catalyst is shown in Figure 7. According to SEM pictures, the generated CaO catalyst is irregular in shape, porous in structure, and contains active sites. In other words, there were a variety of particle sizes and shapes, indicating that the catalyst has a larger surface area for reaction. This gives a good indication that this catalyst will be active and give biodiesel with a high yield and with a low used amount of catalyst.
3.3. Screen Analysis of Biodiesel Catalyst (CaO)
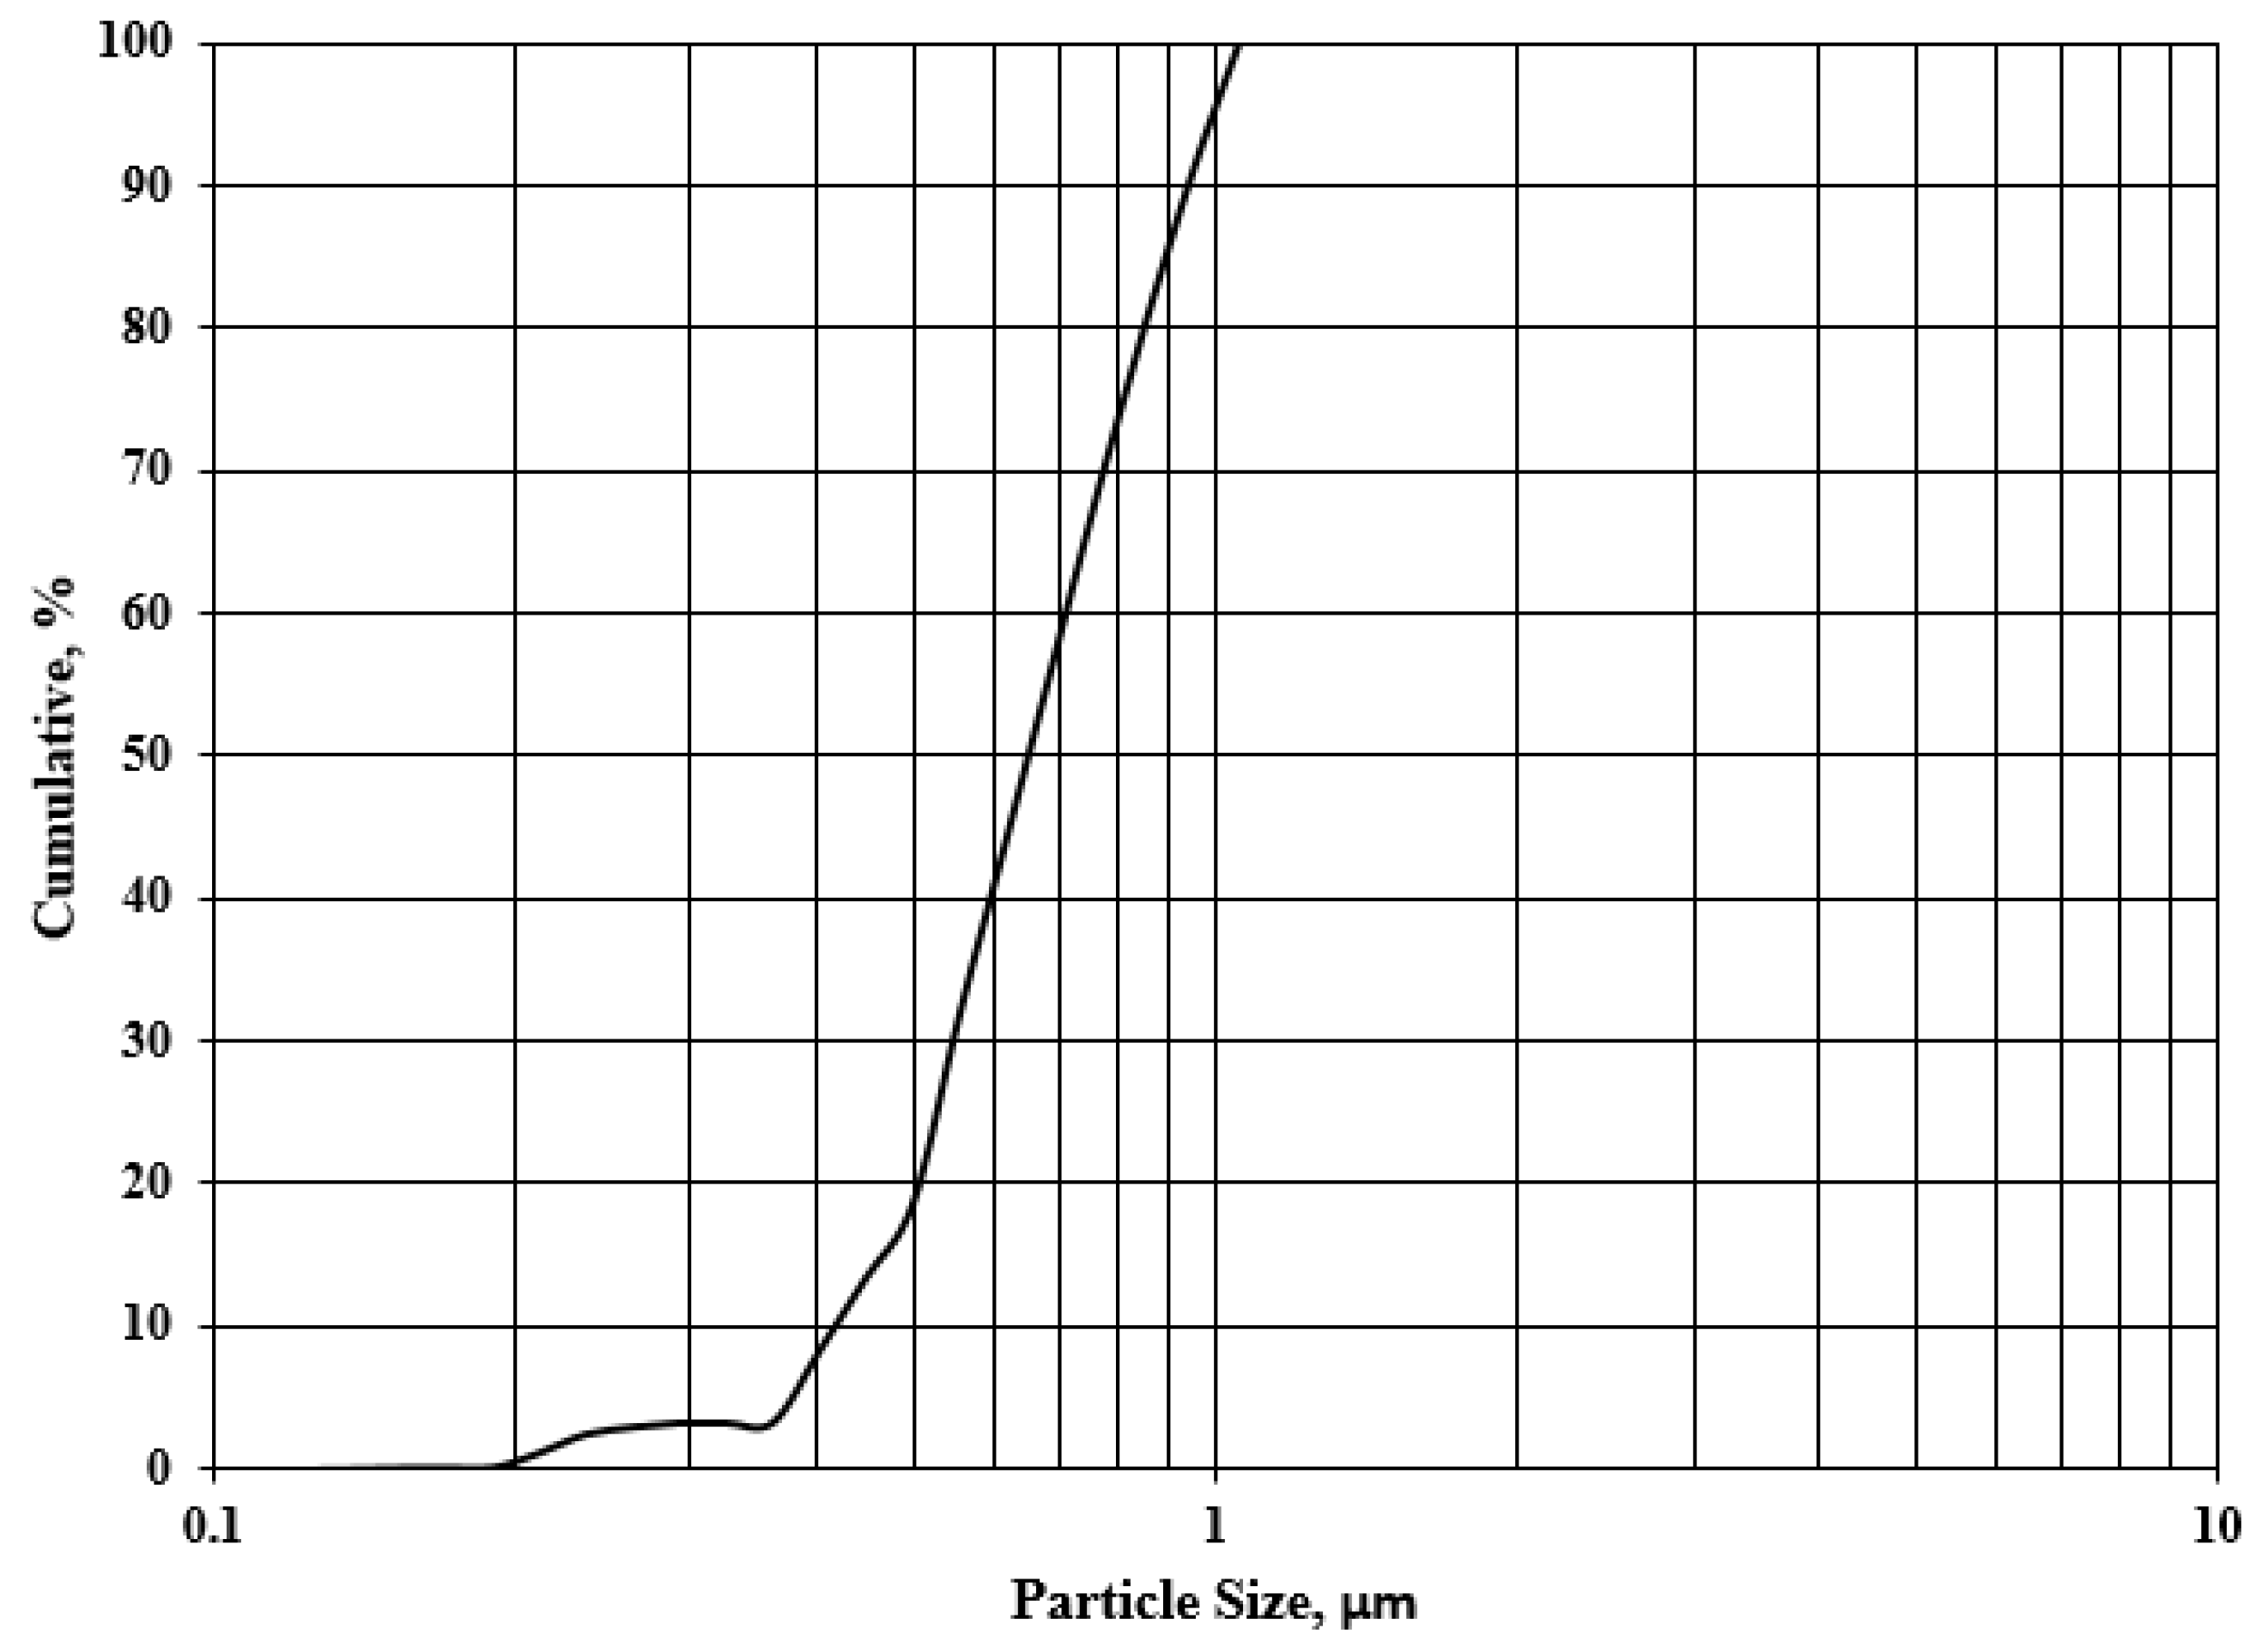
The particle size distribution of calcium oxide is shown in Figure 8. The catalyst is so fine, as shown in this diagram. The average particle size was 0.56 μm. This low particle size means a high surface area, which is confirmed by the SEM result.
3.4. Analysis of the Products
Design Expert was used to create the regression model. At a 95% confidence level or 5% significance level, analysis of variance (ANOVA) was employed to assess the significance of the resulting model. The p-values should be less than 0.05. The critical F value for the resulting model can be determined using the number of variables, sample size, and significance level, and then compared with the F values for the model to determine the significance of the model.
3.5. CaCO3 Analysis
The particle size and yield of CaCO3 were calculated. The findings of the ANOVA analysis performed by the design expert program are shown in Table 8 and Table 9. The following equations illustrate the relationship between particle size, the yield of produced CaCO3, and reaction conditions using a simplified quadratic model:
where X is the particle size of produced CaCO3 in nm or the first reaction response while Y is the yield of produced CaCO3 in percentage, A is stirring rate in rpm, B is CO2 gas flow rate in mL/min, C is the amount of ammonia in mL, and D is the amount of glycerol in mL.
3.6. Biodiesel Analysis
The biodiesel was produced, and the conversion rate was determined. Table 10 shows the results of the ANOVA analysis done by the design expert program. The following equation shows a relationship between biodiesel conversion and reaction conditions using a simplified quadratic model:
where Z stands for biodiesel conversion, E stands for reaction time in hours, F stands for methanol to oil ratio, G stands for catalyst loading in weight percent, and H stands for reaction temperature in degrees Celsius.
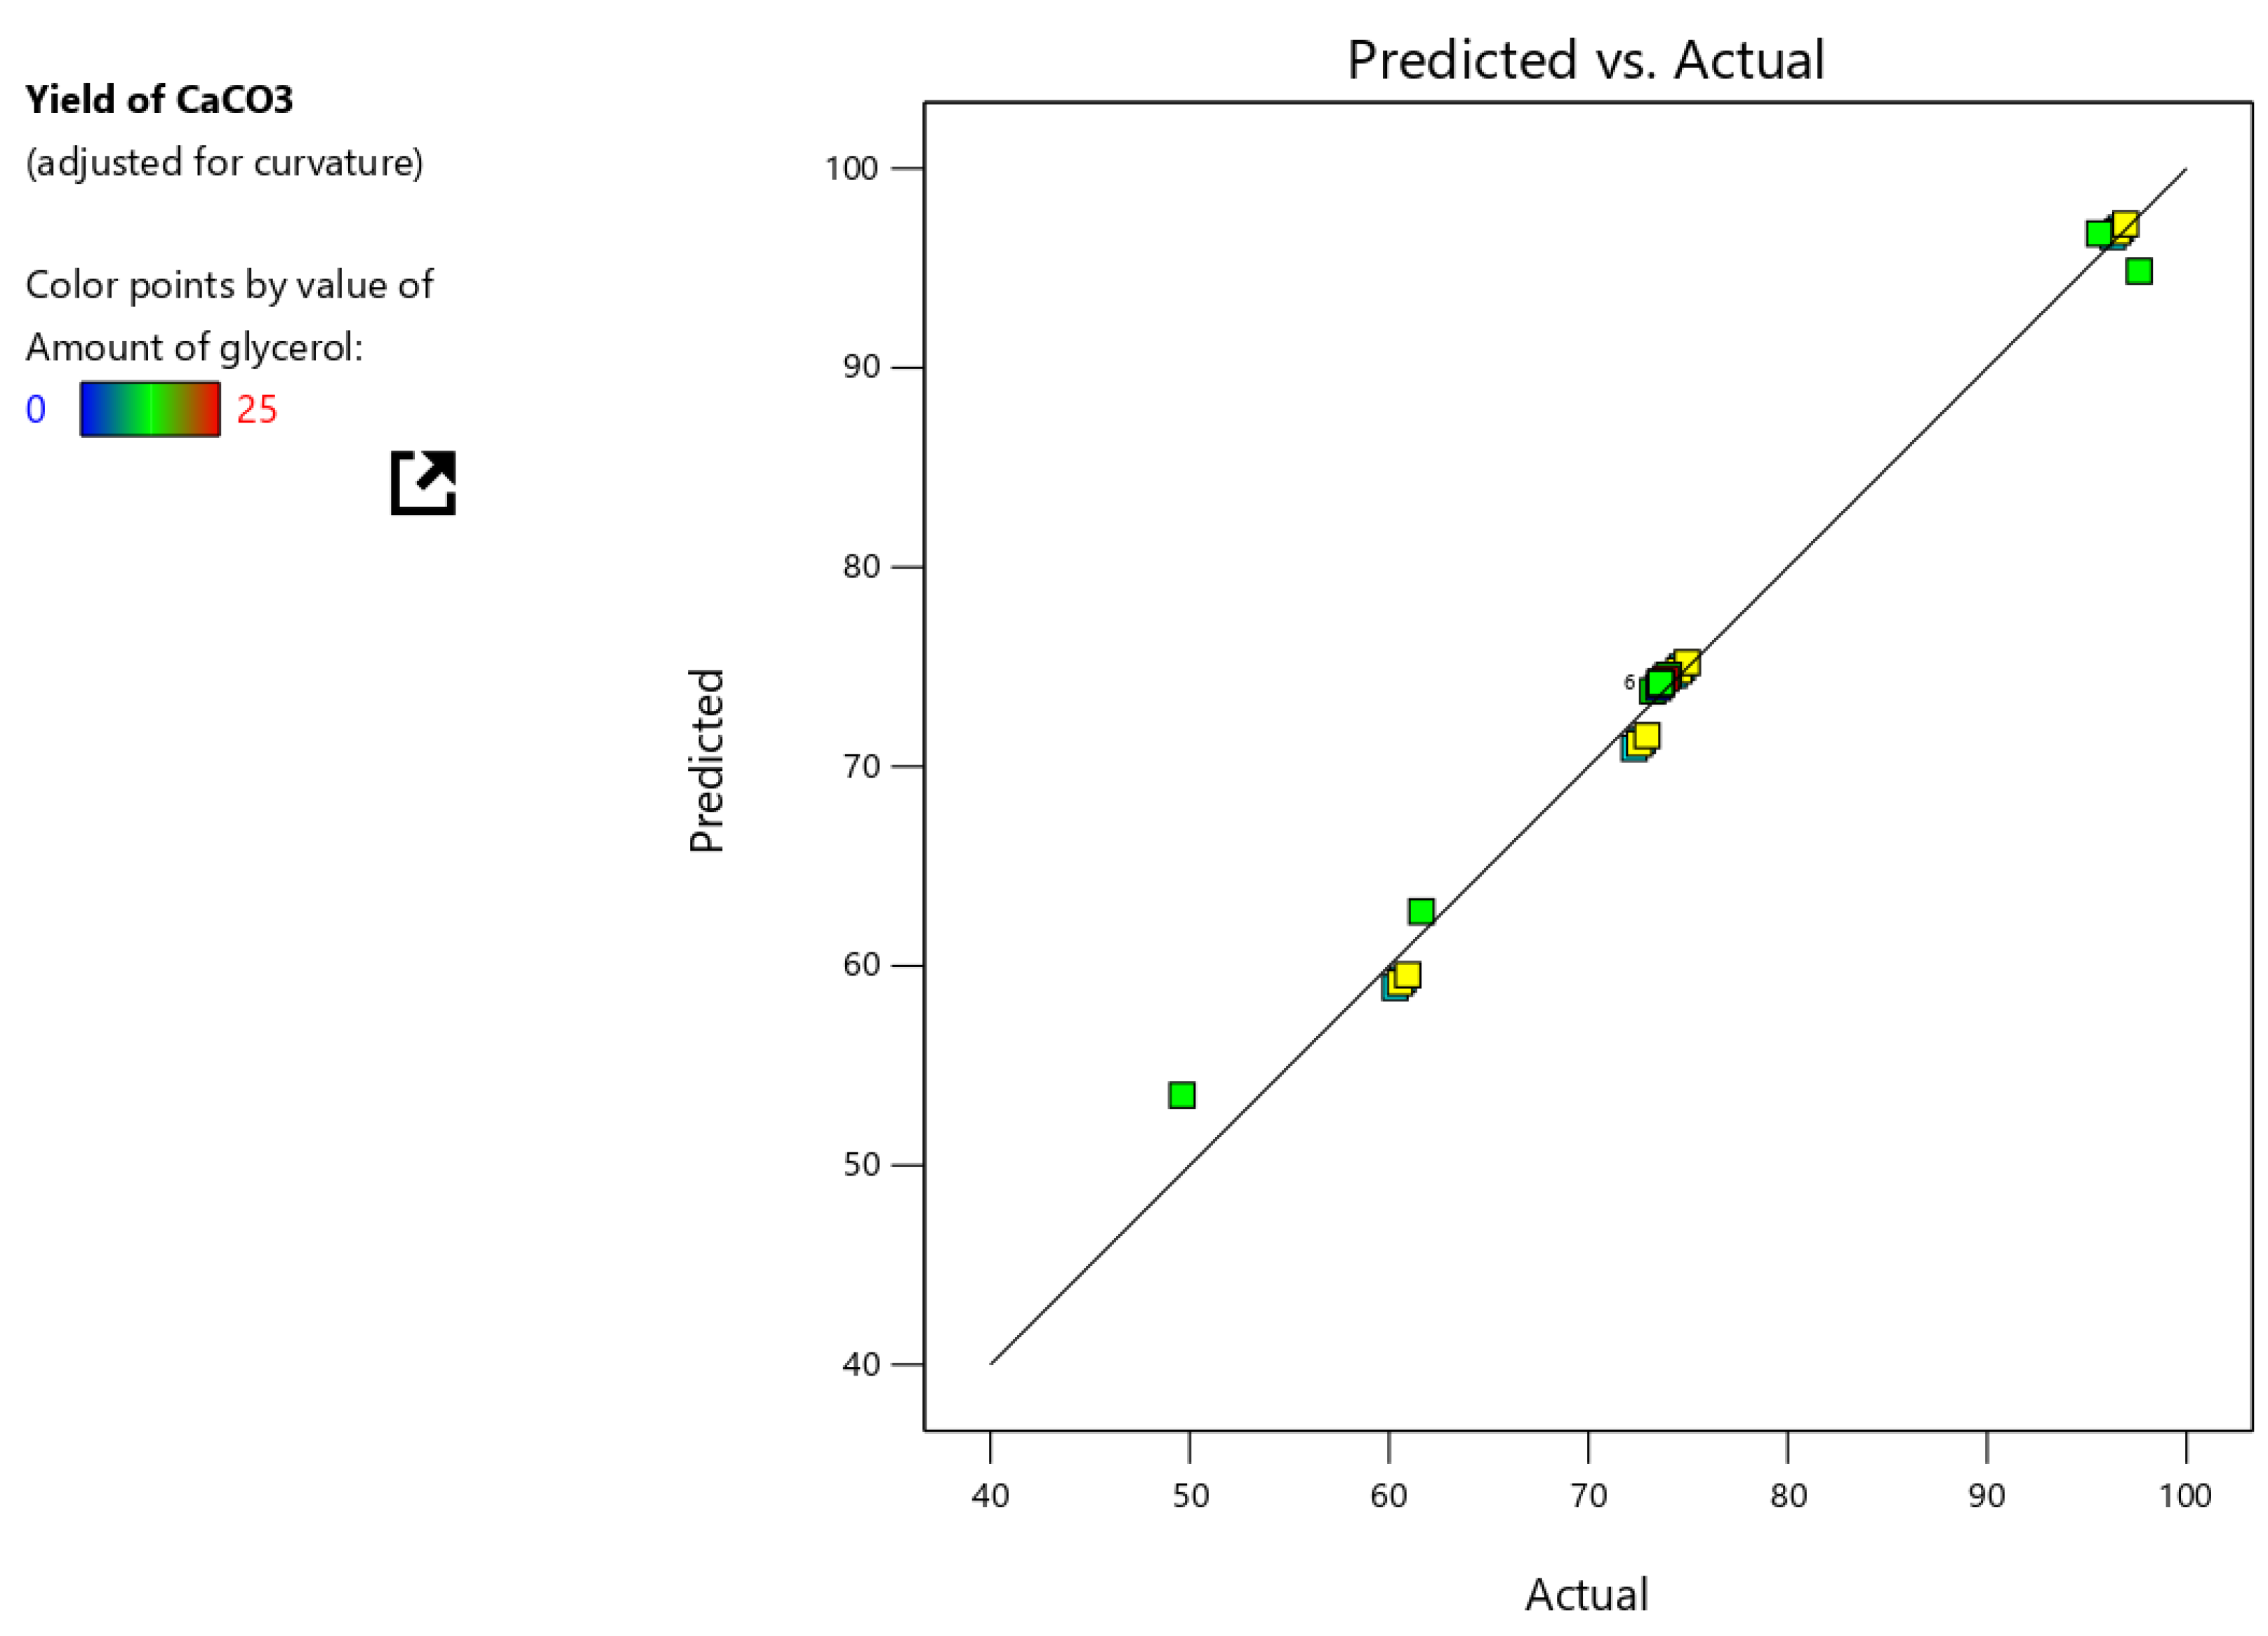
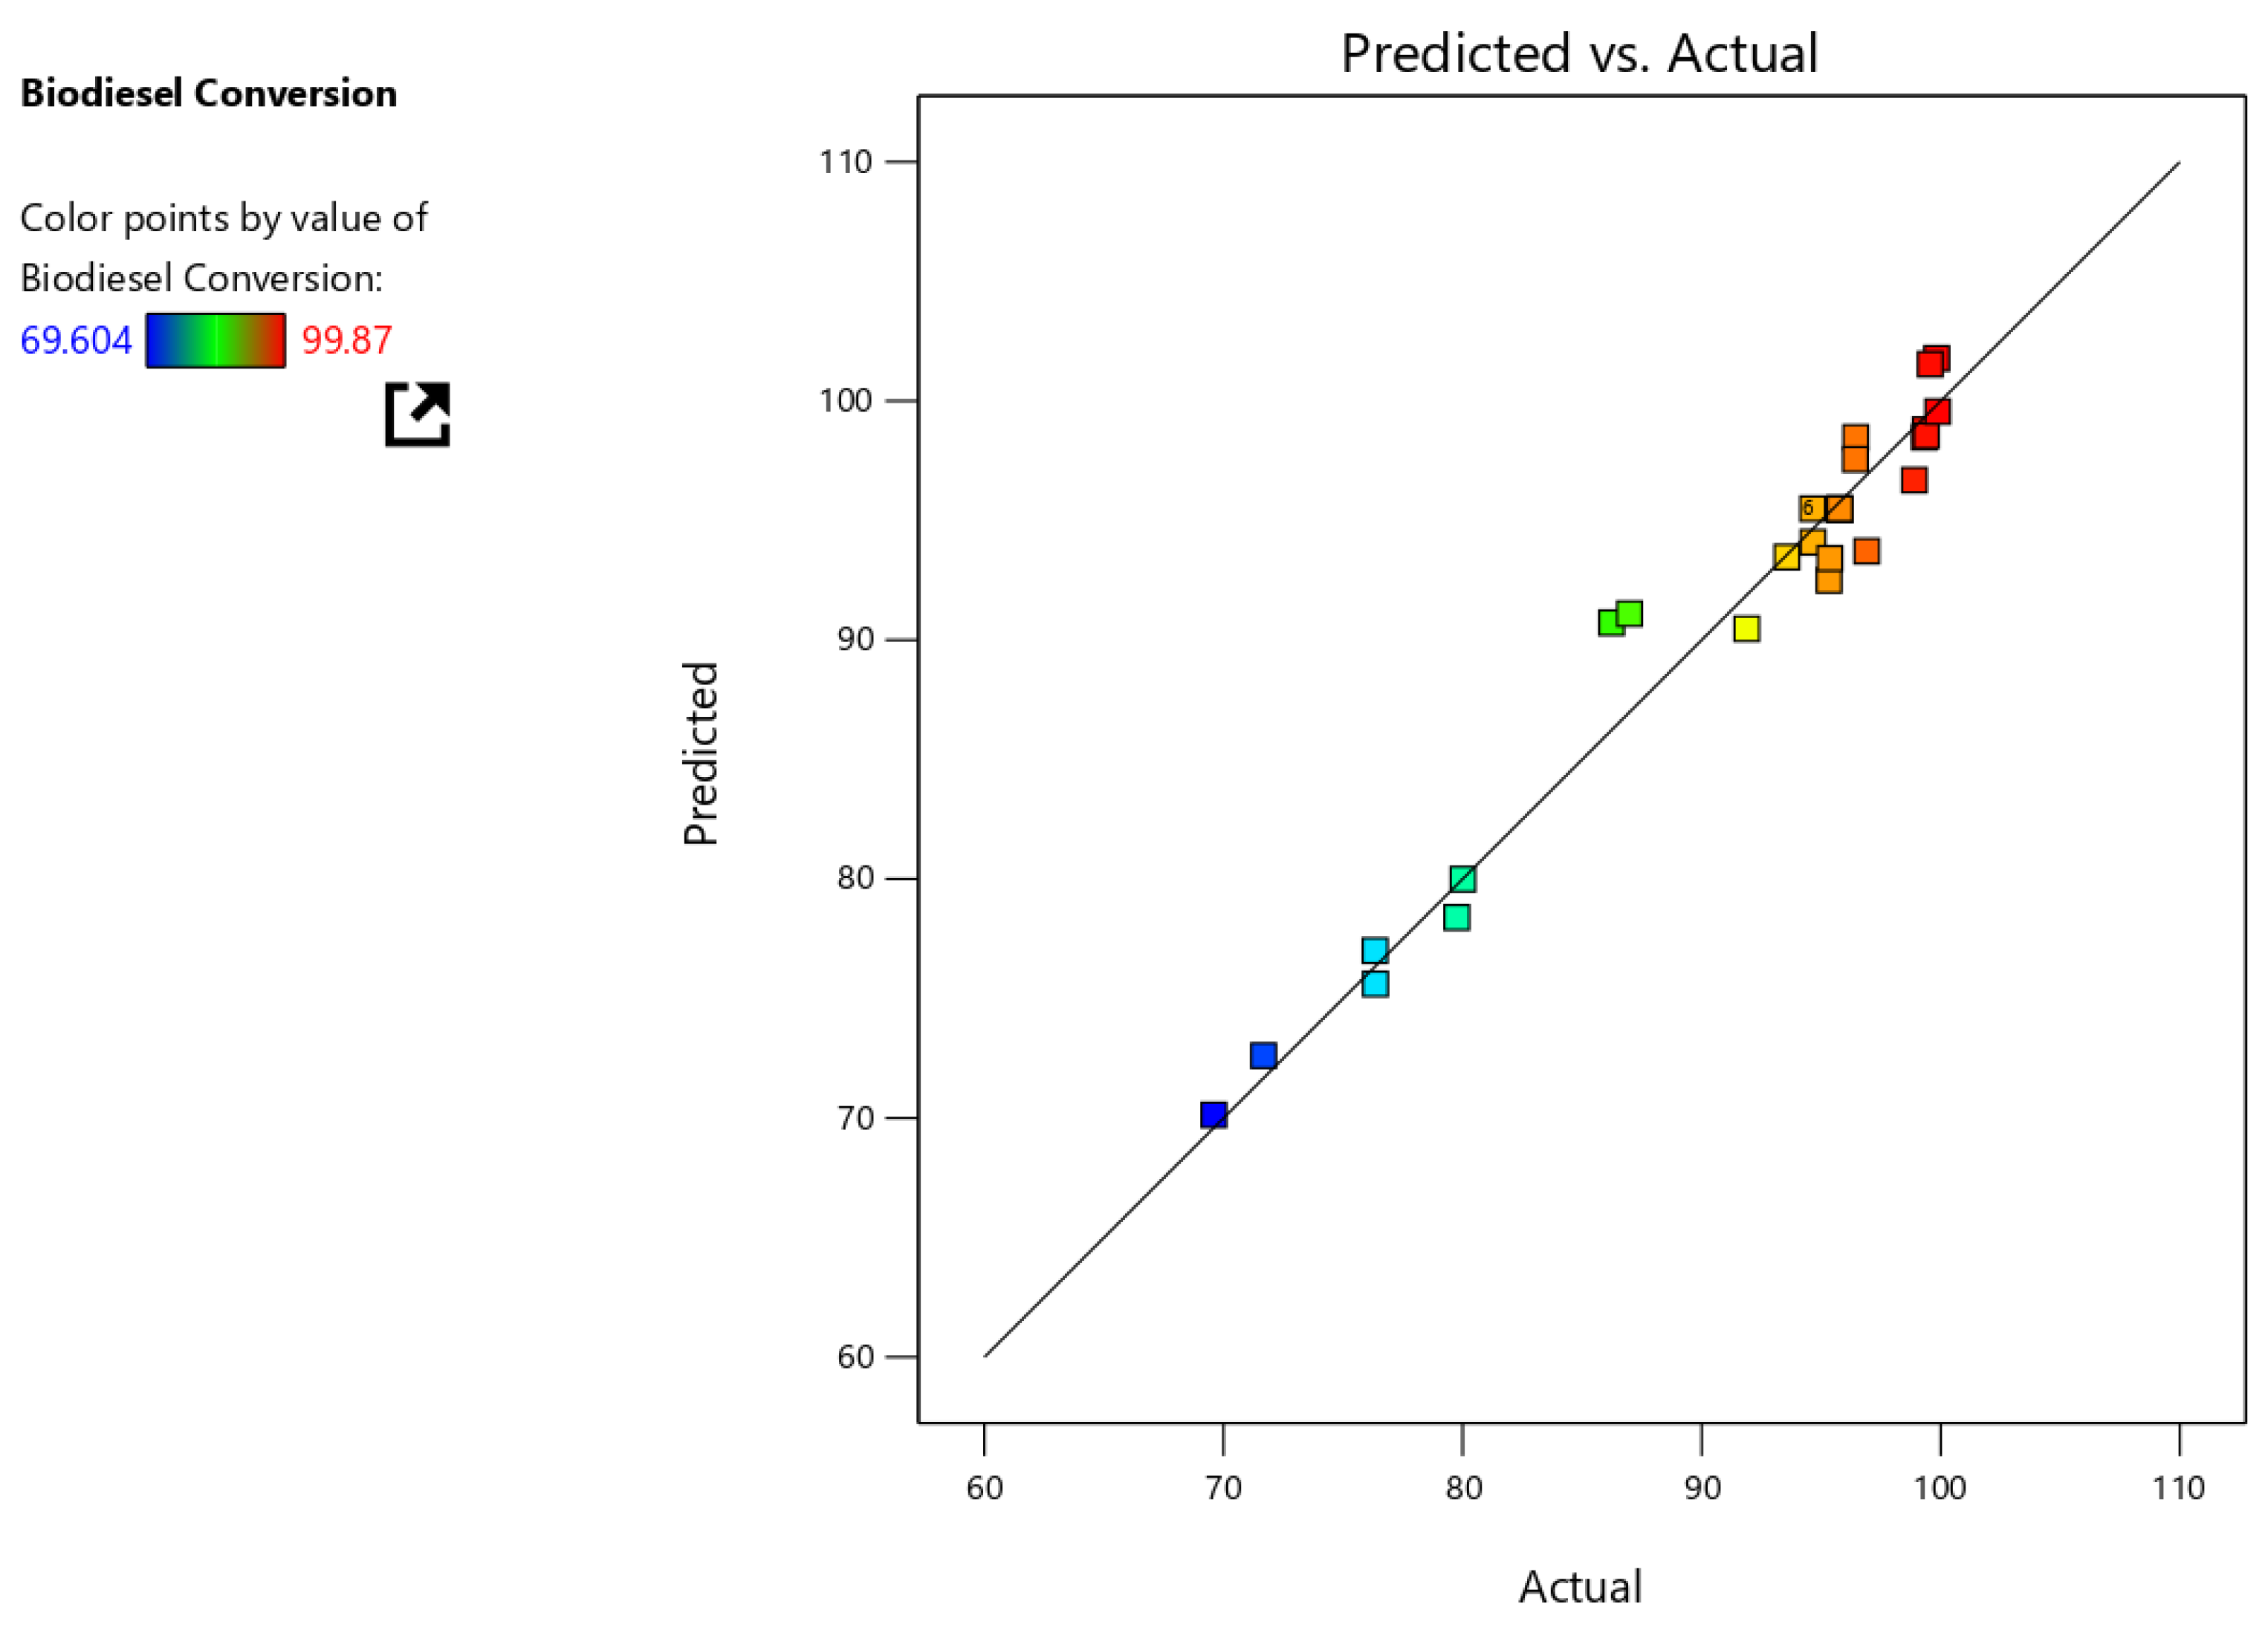
The predicted values were compared to the experimental results. As demonstrated in Figure 11, this graph exhibits excellent agreement.
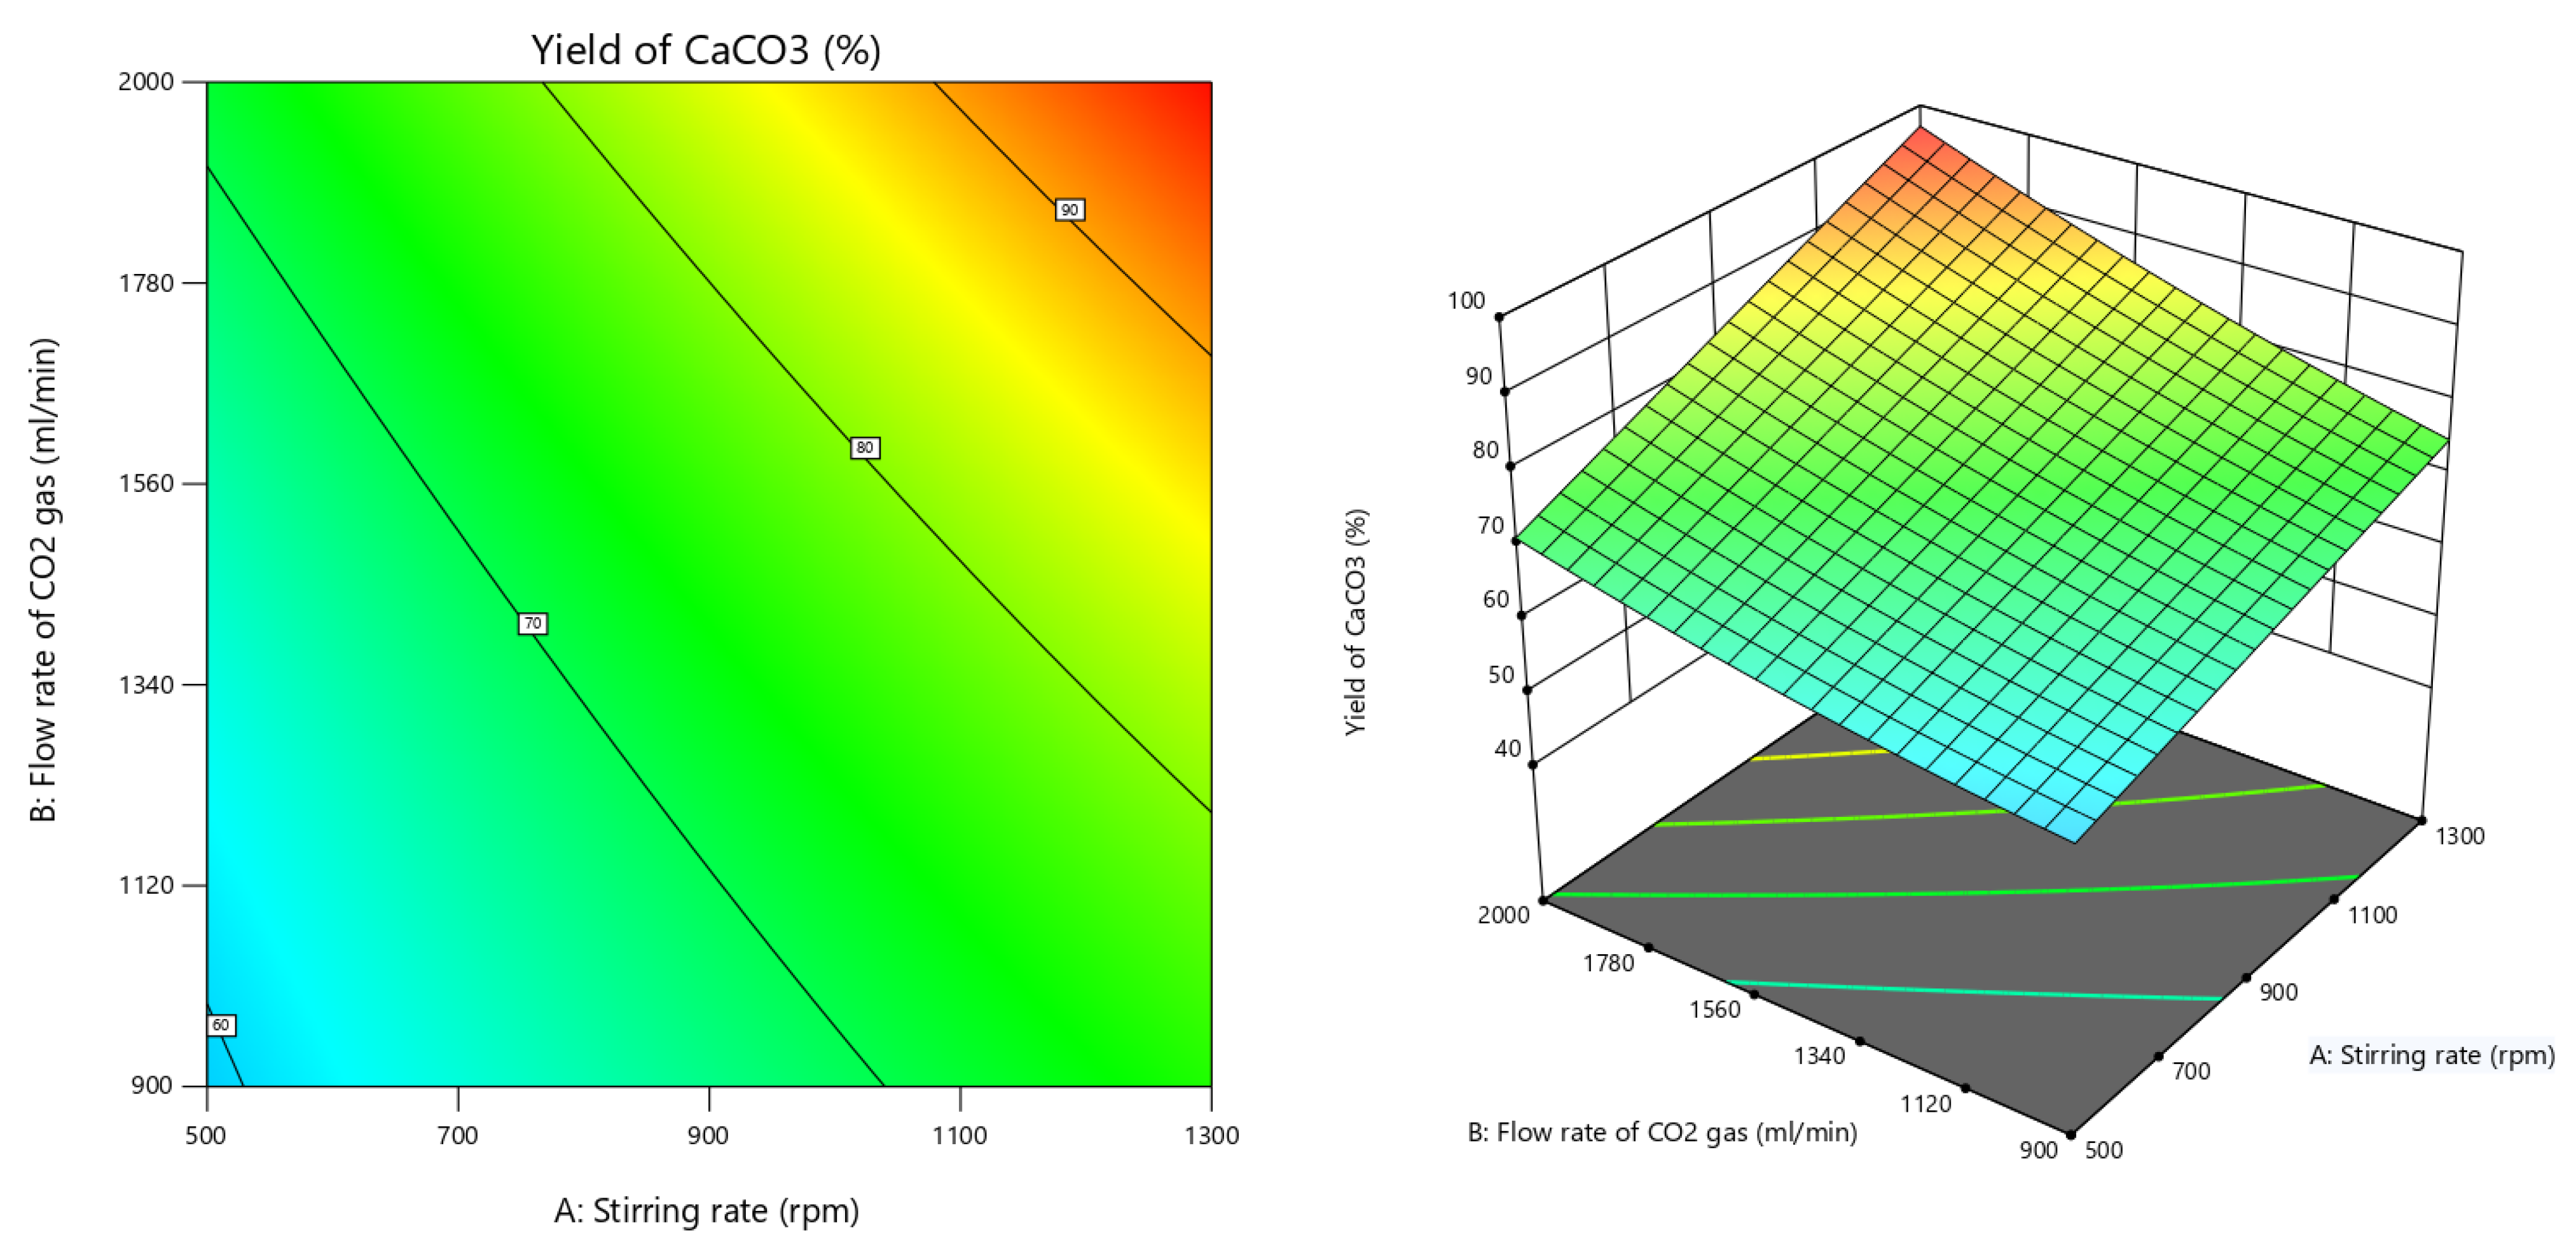
3.7. Reaction Conditions Effect on the Particle Size and the Yield of CaCO3
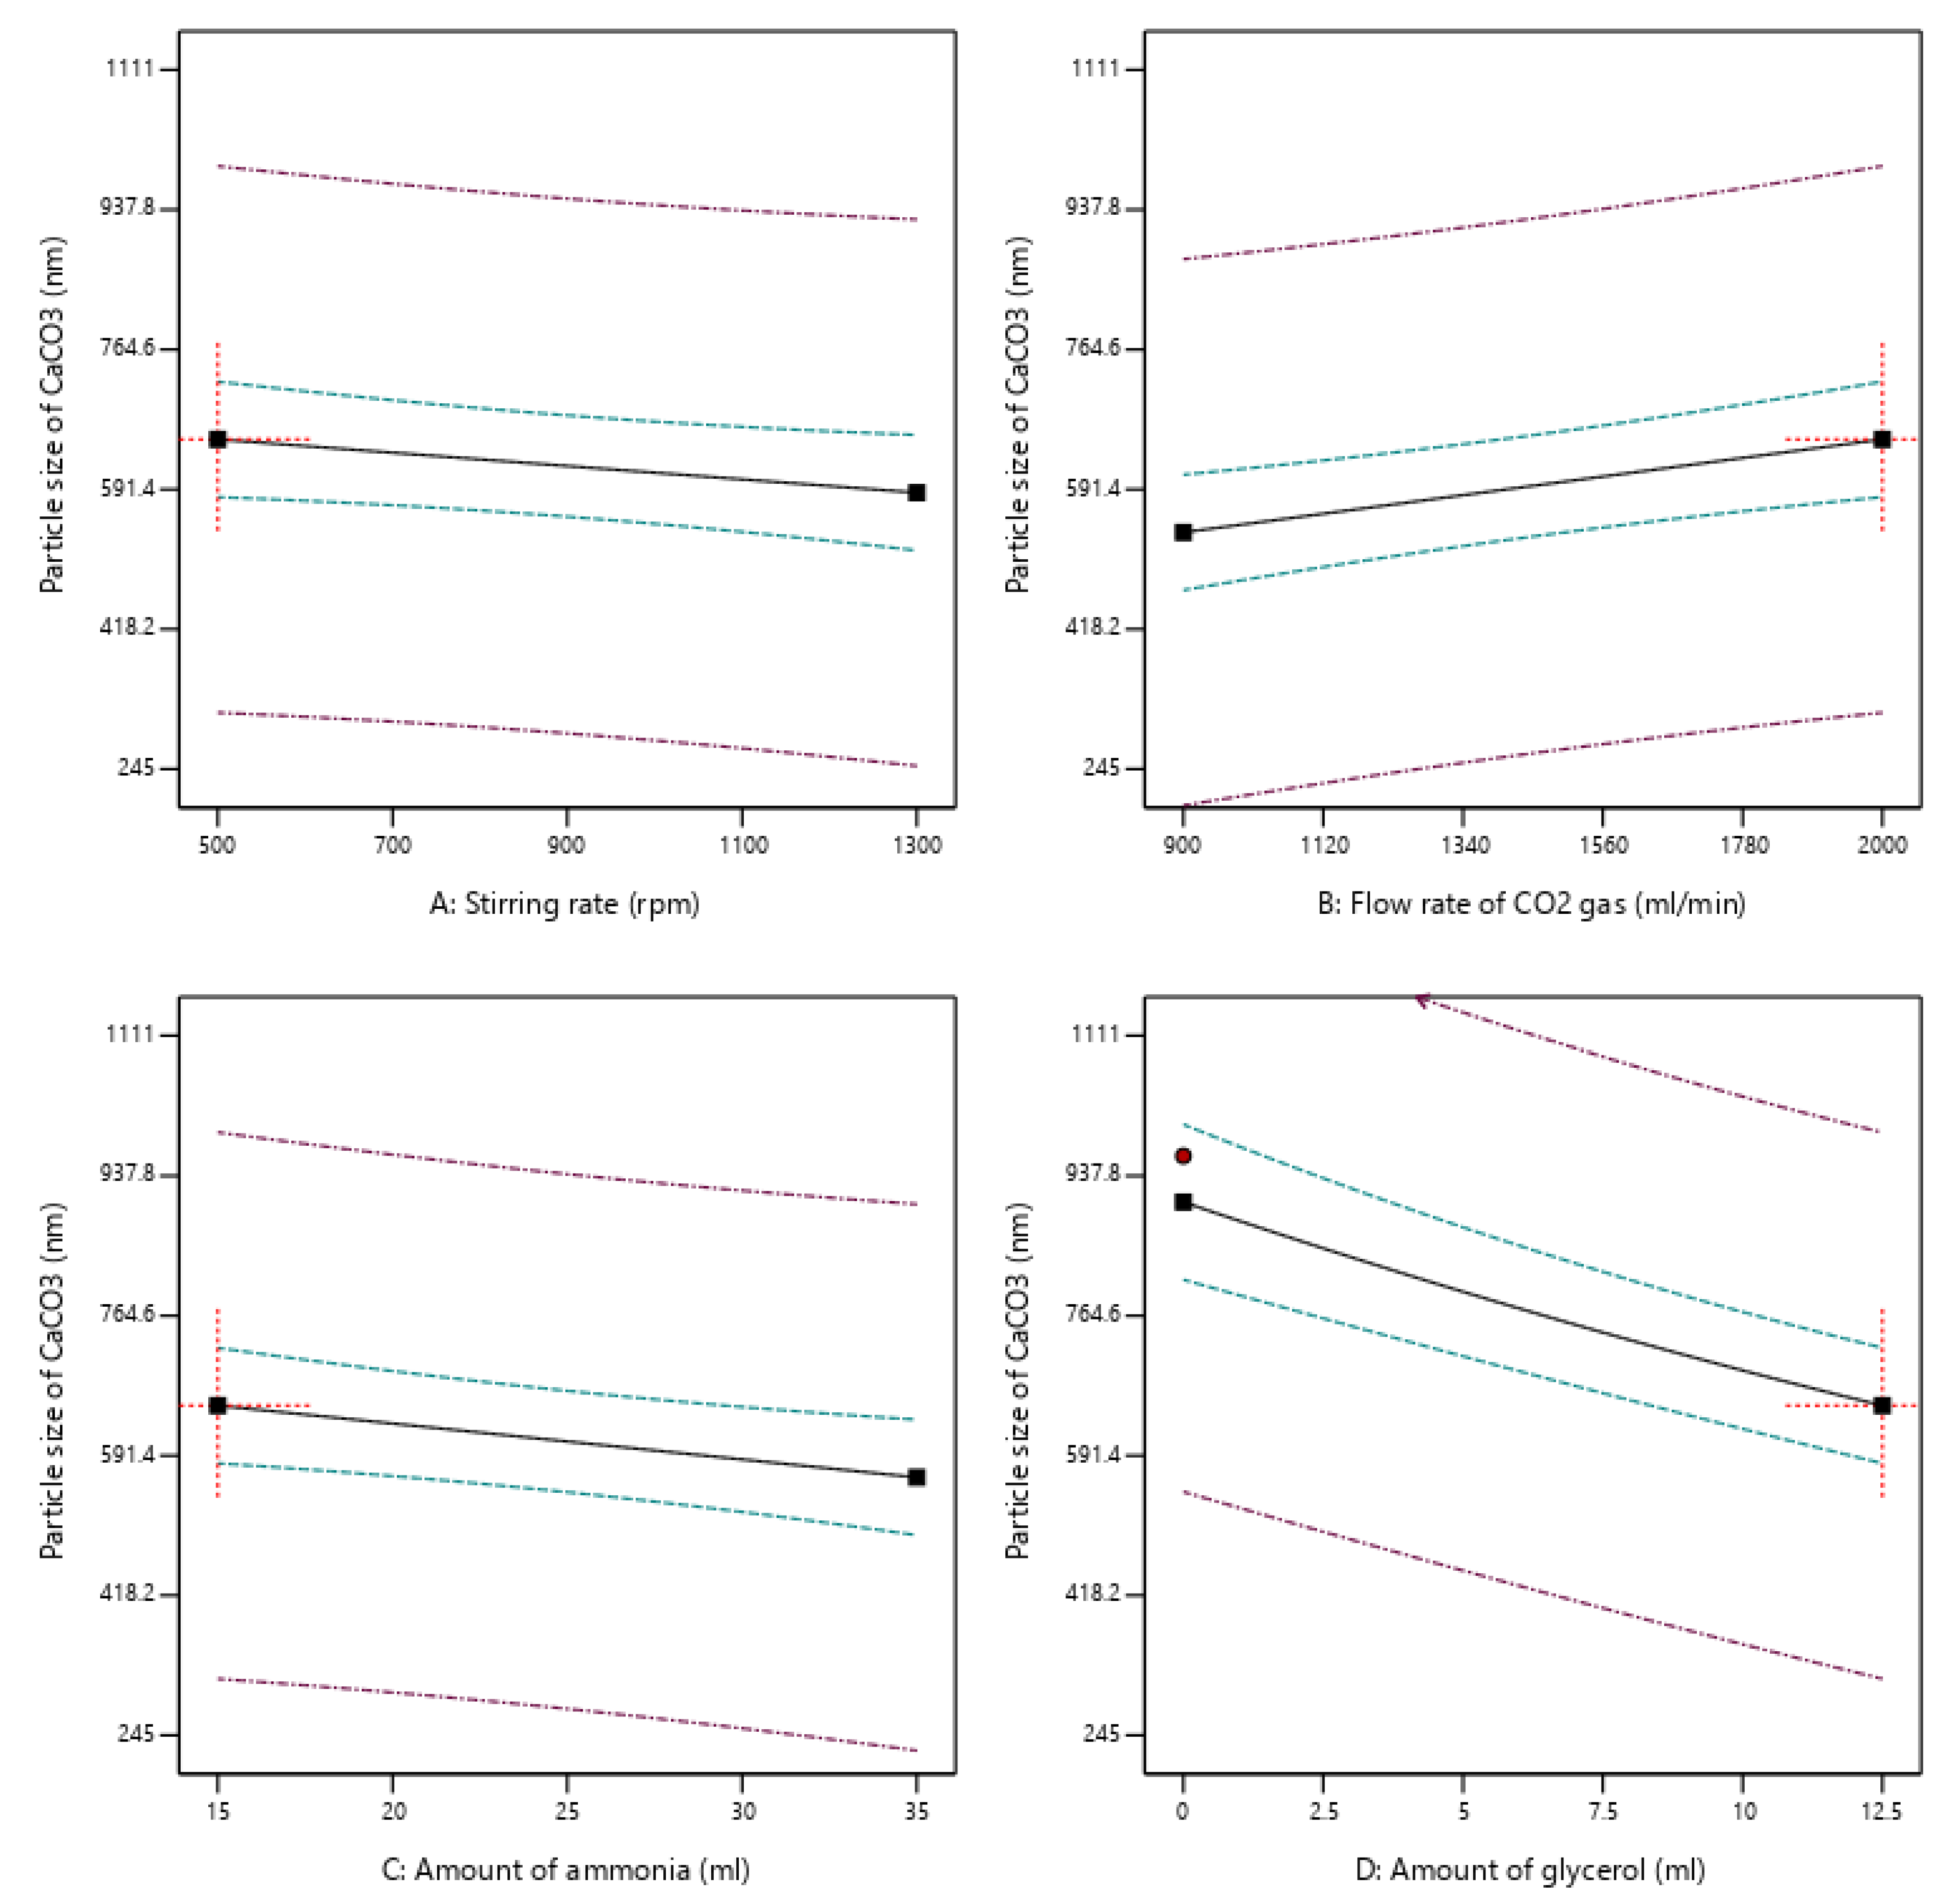
The effect of the stirring rate, CO2 flow rate, ammonia amount, and glycerol amount on the particle size and yield of CaCO3 is depicted in Figure 12 and Figure 13. The amount of glycerol has the greatest impact on the particle size of CaCO3 while the stirring rate and the flow rate of CO2 have the greatest impact on the CaCO3 yield.
3.7.1. Effect of Stirring Rate on the Particle Size and the Yield of CaCO3
The average particle size appears to decrease as the stirring rate increases. Because of the high mass transfer resistance, operation at low stirring rates results in a local accumulation of super-saturation, which facilitates the development of agglomerated particles and hence a bigger particle size. High stirring rates, on the other hand, improve gas–liquid mass transfer because the stirring velocities can overcome the high mass transfer barrier in this case. This slows the agglomeration process and allows to produce smaller particles [32].
An increase in the stirring rate resulted in a rise in yield. This extremely small monotonic rise in yield could point to a reduction in mass transfer resistance. This reduction may have aided the process, increasing the reaction yield.
3.7.2. Effect of the Amount of Ammonia on the Particle Size and the Yield of CaCO3
It was discovered that, as the amount of ammonia added to the mixture grows, the particle size of the resulting product decreases. Considering the entire reaction equation, this discovery makes sense (Equation (6). According to this equation, increasing the amount of ammonium hydroxide will shift the reaction to the forward direction, resulting in a high degree of calcium carbonate super-saturation, leading to a large rise in the nucleation rate, and therefore the creation of smaller sized PCC particles [33].
The amount of ammonia used in the reaction has a minor impact on the product yield. Because ammonia can extract the chloride from calcium chloride, but CO2 cannot, the reaction cannot proceed without it. The Le Chatelier principle strongly supports this theory, as increasing the amount of ammonia shifts the reaction to the forward direction, increasing the amount of product.
3.7.3. Effect of the Gas Flow Rate on the Particle Size and the Yield of CaCO3
The following is an explanation for CO2 behavior: at low CO2 gas flow rates, the amount of CO2 provided is insufficient to react with all calcium ions present in the solution, resulting in calcium ion accumulation inside the solution. Due to the adsorption of these positively charged ions on the surface of the negatively charged CaCO3 crystals, the presence of excess Ca2+ would result in increased particle size, lowering the repulsion forces between crystals and causing particle agglomeration [34]. Any increase in the gas volumetric flow rate causes a significant rise in the gas–liquid mass transfer rate, resulting in an increase in the nucleation rate and a decrease in the particle size of CaCO3 [33].
The CO2 gas is used in the reaction, and its flow rate has a significant impact on the product yield. Increasing the gas flow rate, according to Le Chatelier’s principle, will shift the reaction to the forward direction, increasing the amount of product produced.
3.7.4. Effect of the Amount of Glycerol on the Particle Size and the Yield of CaCO3
As the glycerol percentage rises, the particle size falls. The creation of an adsorption layer on the surface of CaCO3 particles could explain this. Adsorbed molecules are oriented perpendicular to the CaCO3 surface and OH− groups are connected to the surface if the concentration of surface-active molecules of the organic additive is sufficient. As a result of the presence of three OH− groups, glycerol can form a well-organized layer. However, at high glycerol concentrations, the medium’s viscosity rises, affecting the mass transfer coefficient and causing inefficient mass transfer, resulting in the creation of big particles [35].
As expected, the addition of glycerol has no influence on the product yield. The yield is exclusively affected by the reactants in the process; glycerol is merely an external component utilized to control particle size.
3.8. Reaction Conditions Effect on the Yield of Biodiesel
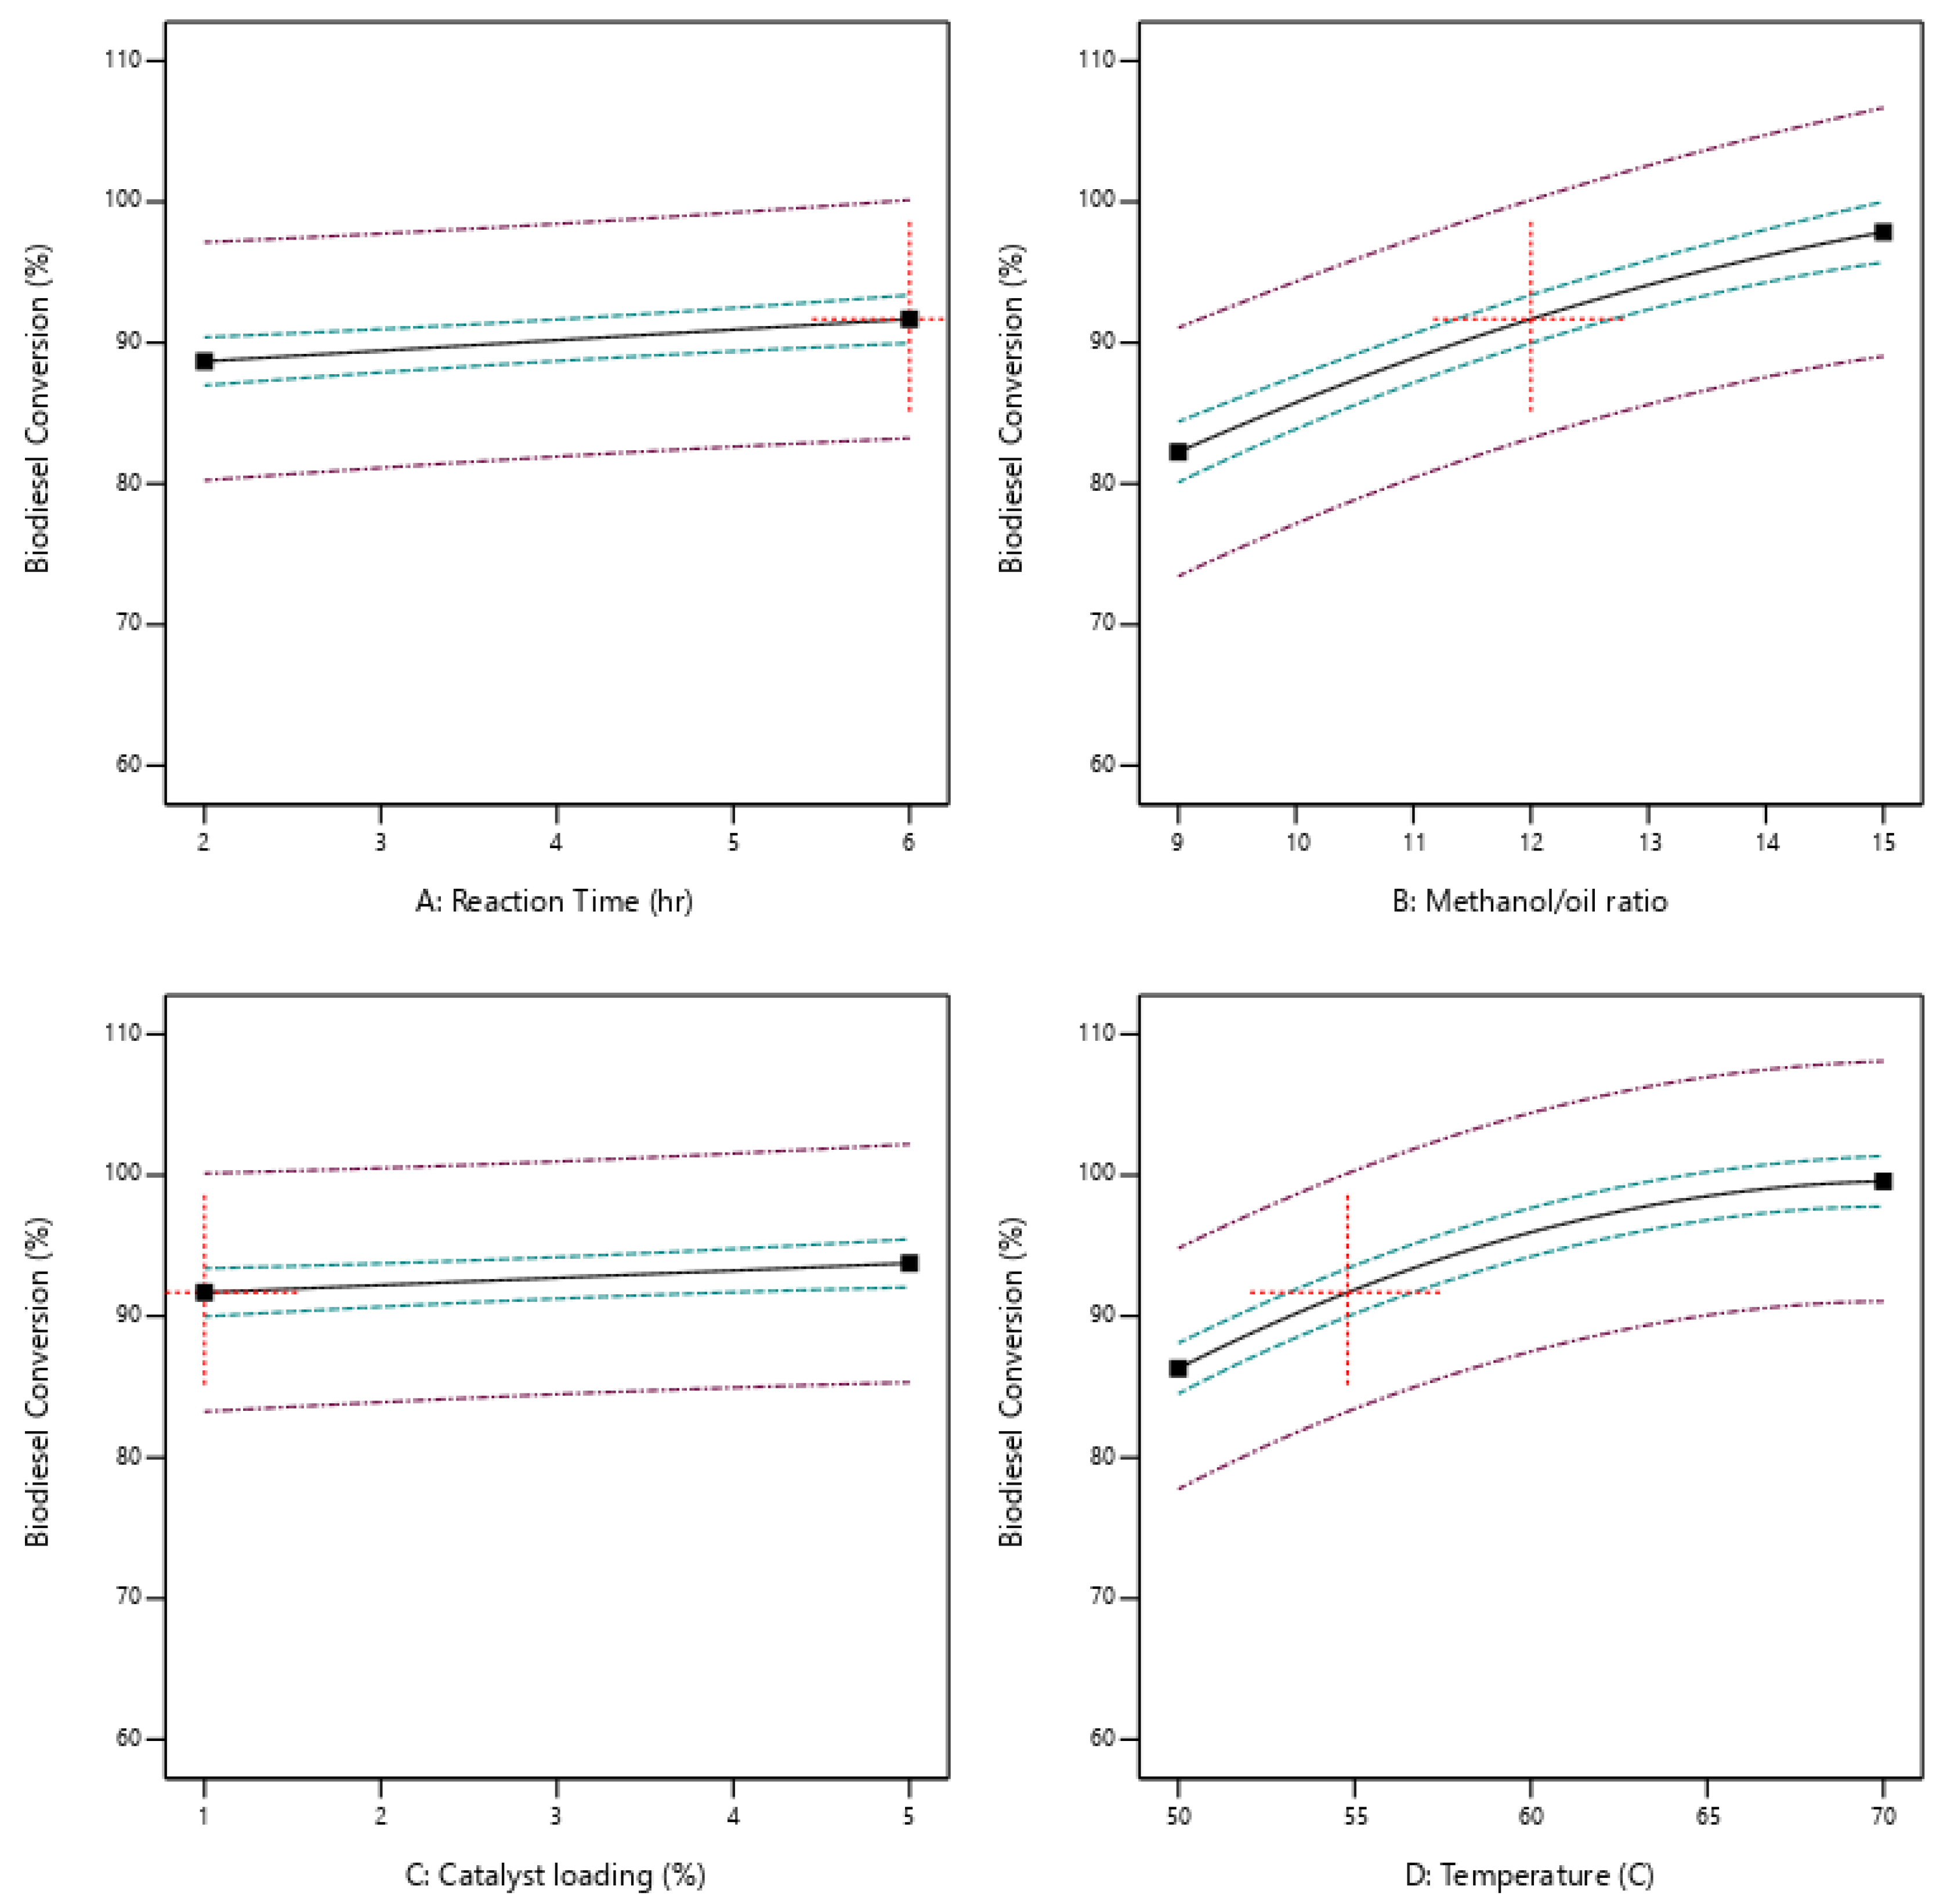
The temperature of the reaction and the M:O ratio has the biggest influence on biodiesel conversion as indicated in Figure 14, which shows the influence of each reaction parameter on biodiesel conversion.
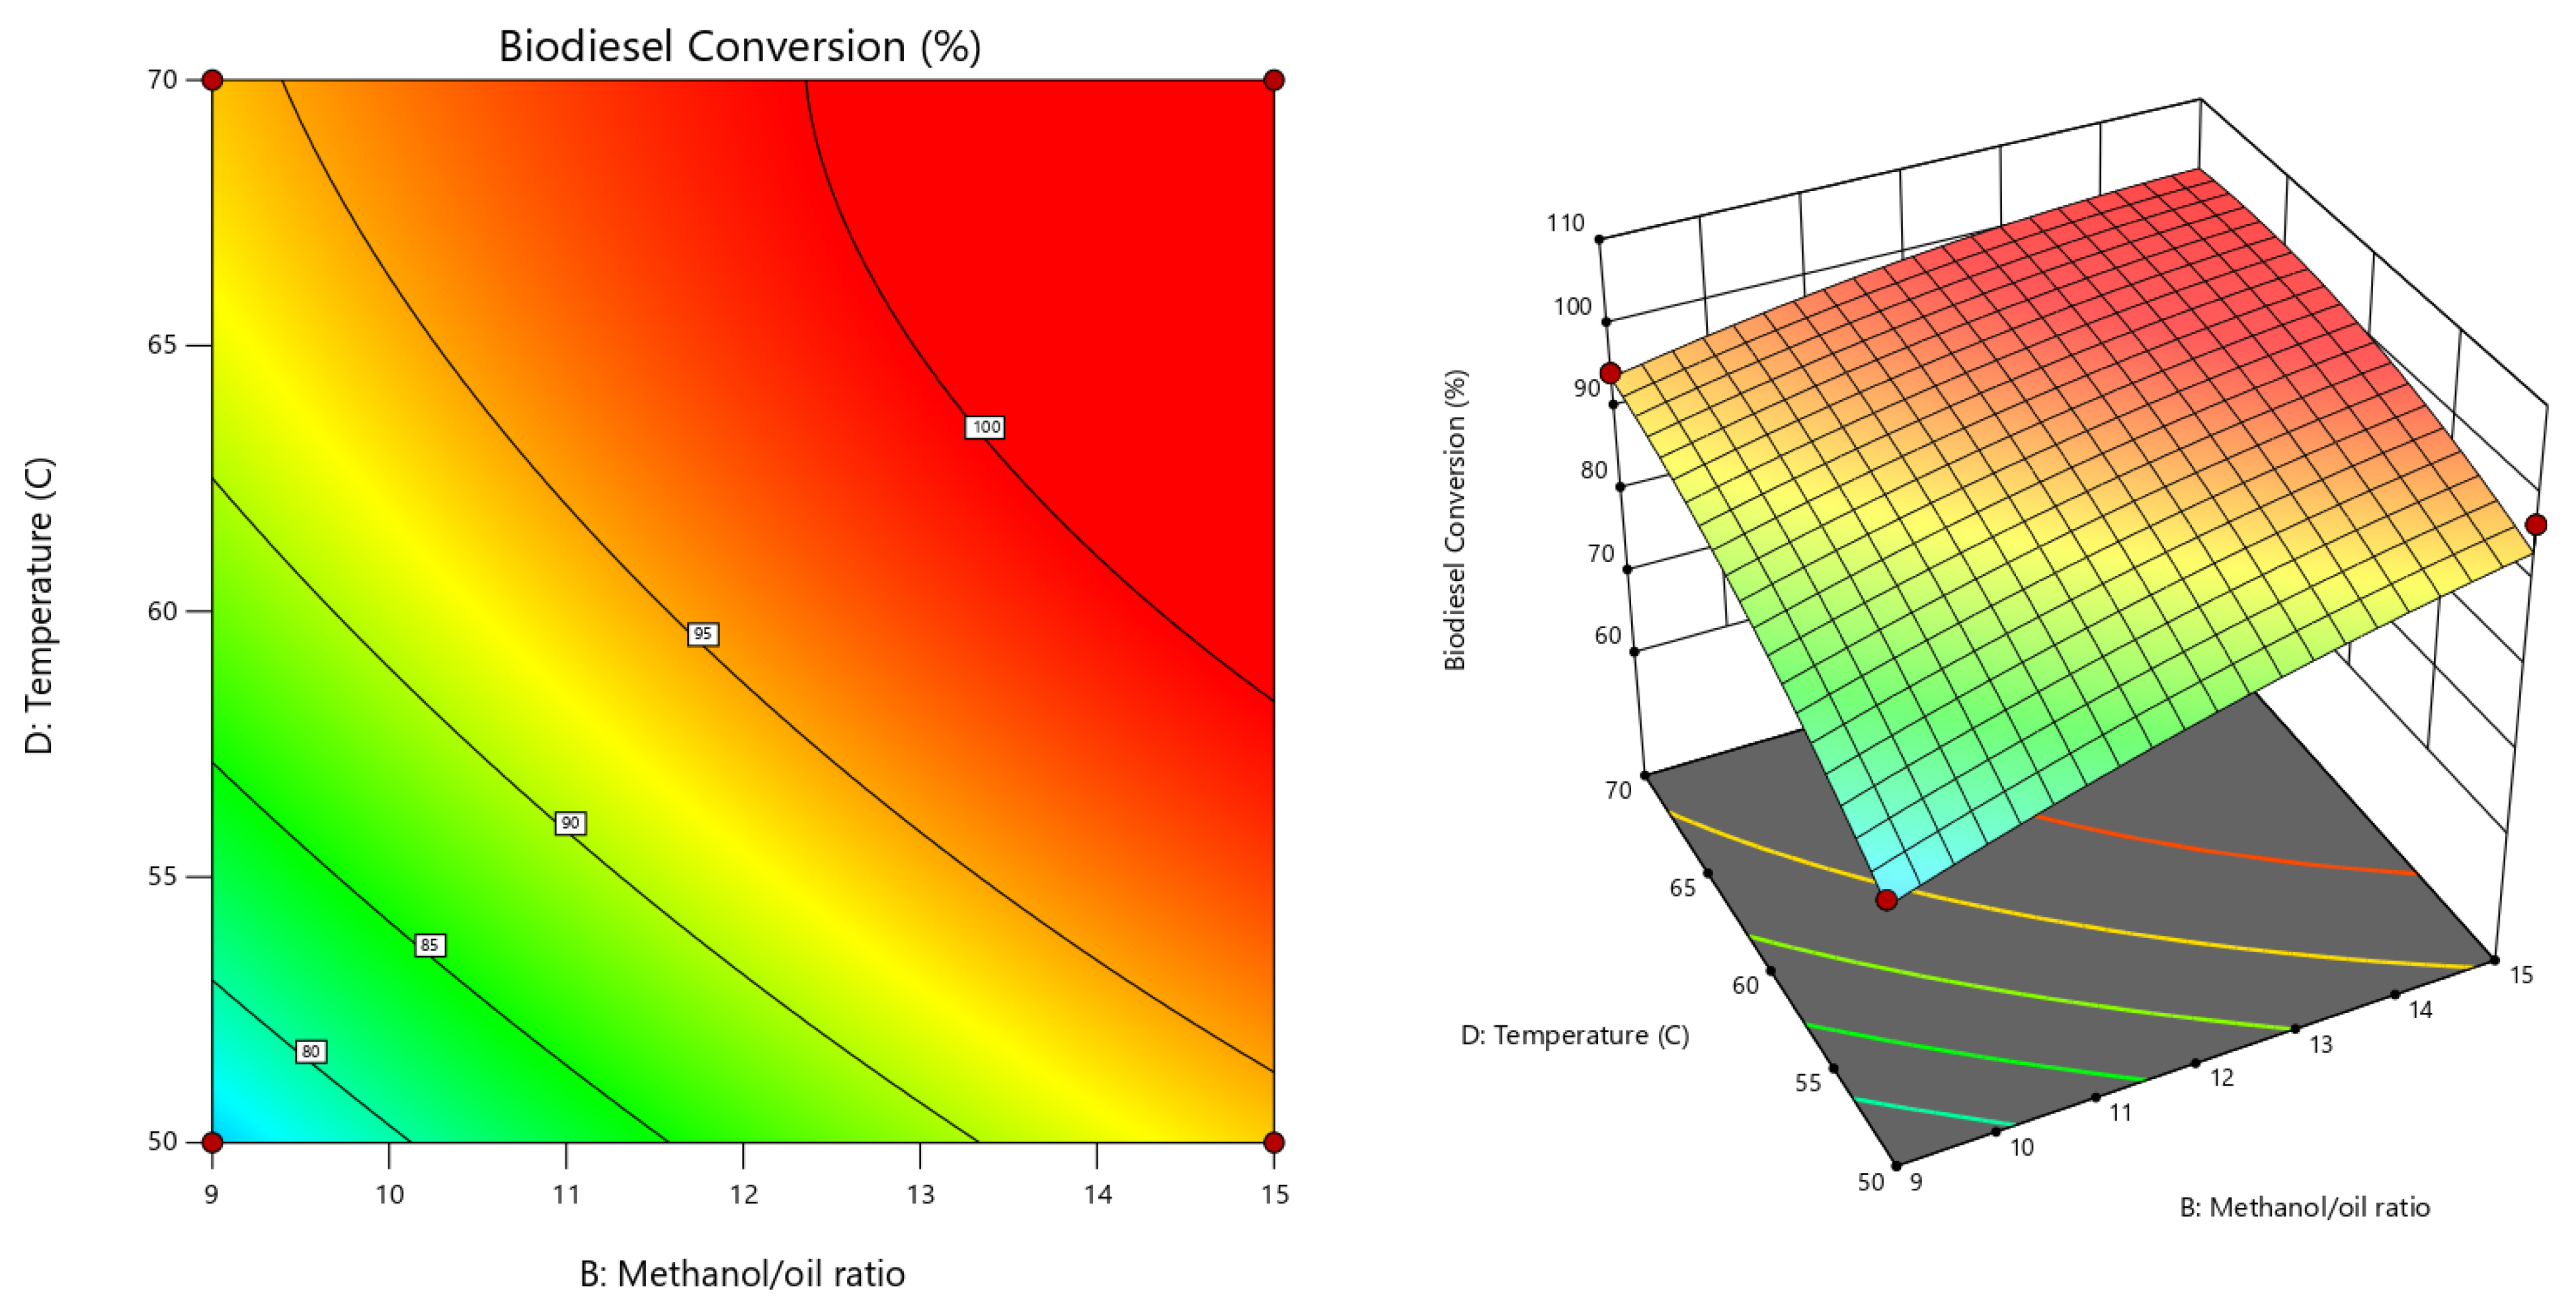
3.8.1. Effect of the Reaction Temperature on the Yield of Biodiesel
Reaction temperature is an important variable for biodiesel production. Consequently, the reaction temperature has been chosen within a range of 50 to 70 °C to investigate the effect of wide range of excess methanol on the biodiesel conversion. It observed that increasing temperature will greatly increase the biodiesel yield. Increasing reaction temperature will increase the reaction rate or velocity, which increases the biodiesel yield.
3.8.2. Effect of the Reaction Time on the Yield of Biodiesel
Reaction time is an important variable for biodiesel production. Consequently, the reaction time has been chosen within a range of 1 to 4 h to investigate the effect of wide range of reaction time on the biodiesel yield. Increasing the reaction time will give more time for the reaction to happen, which will increase the biodiesel yield.
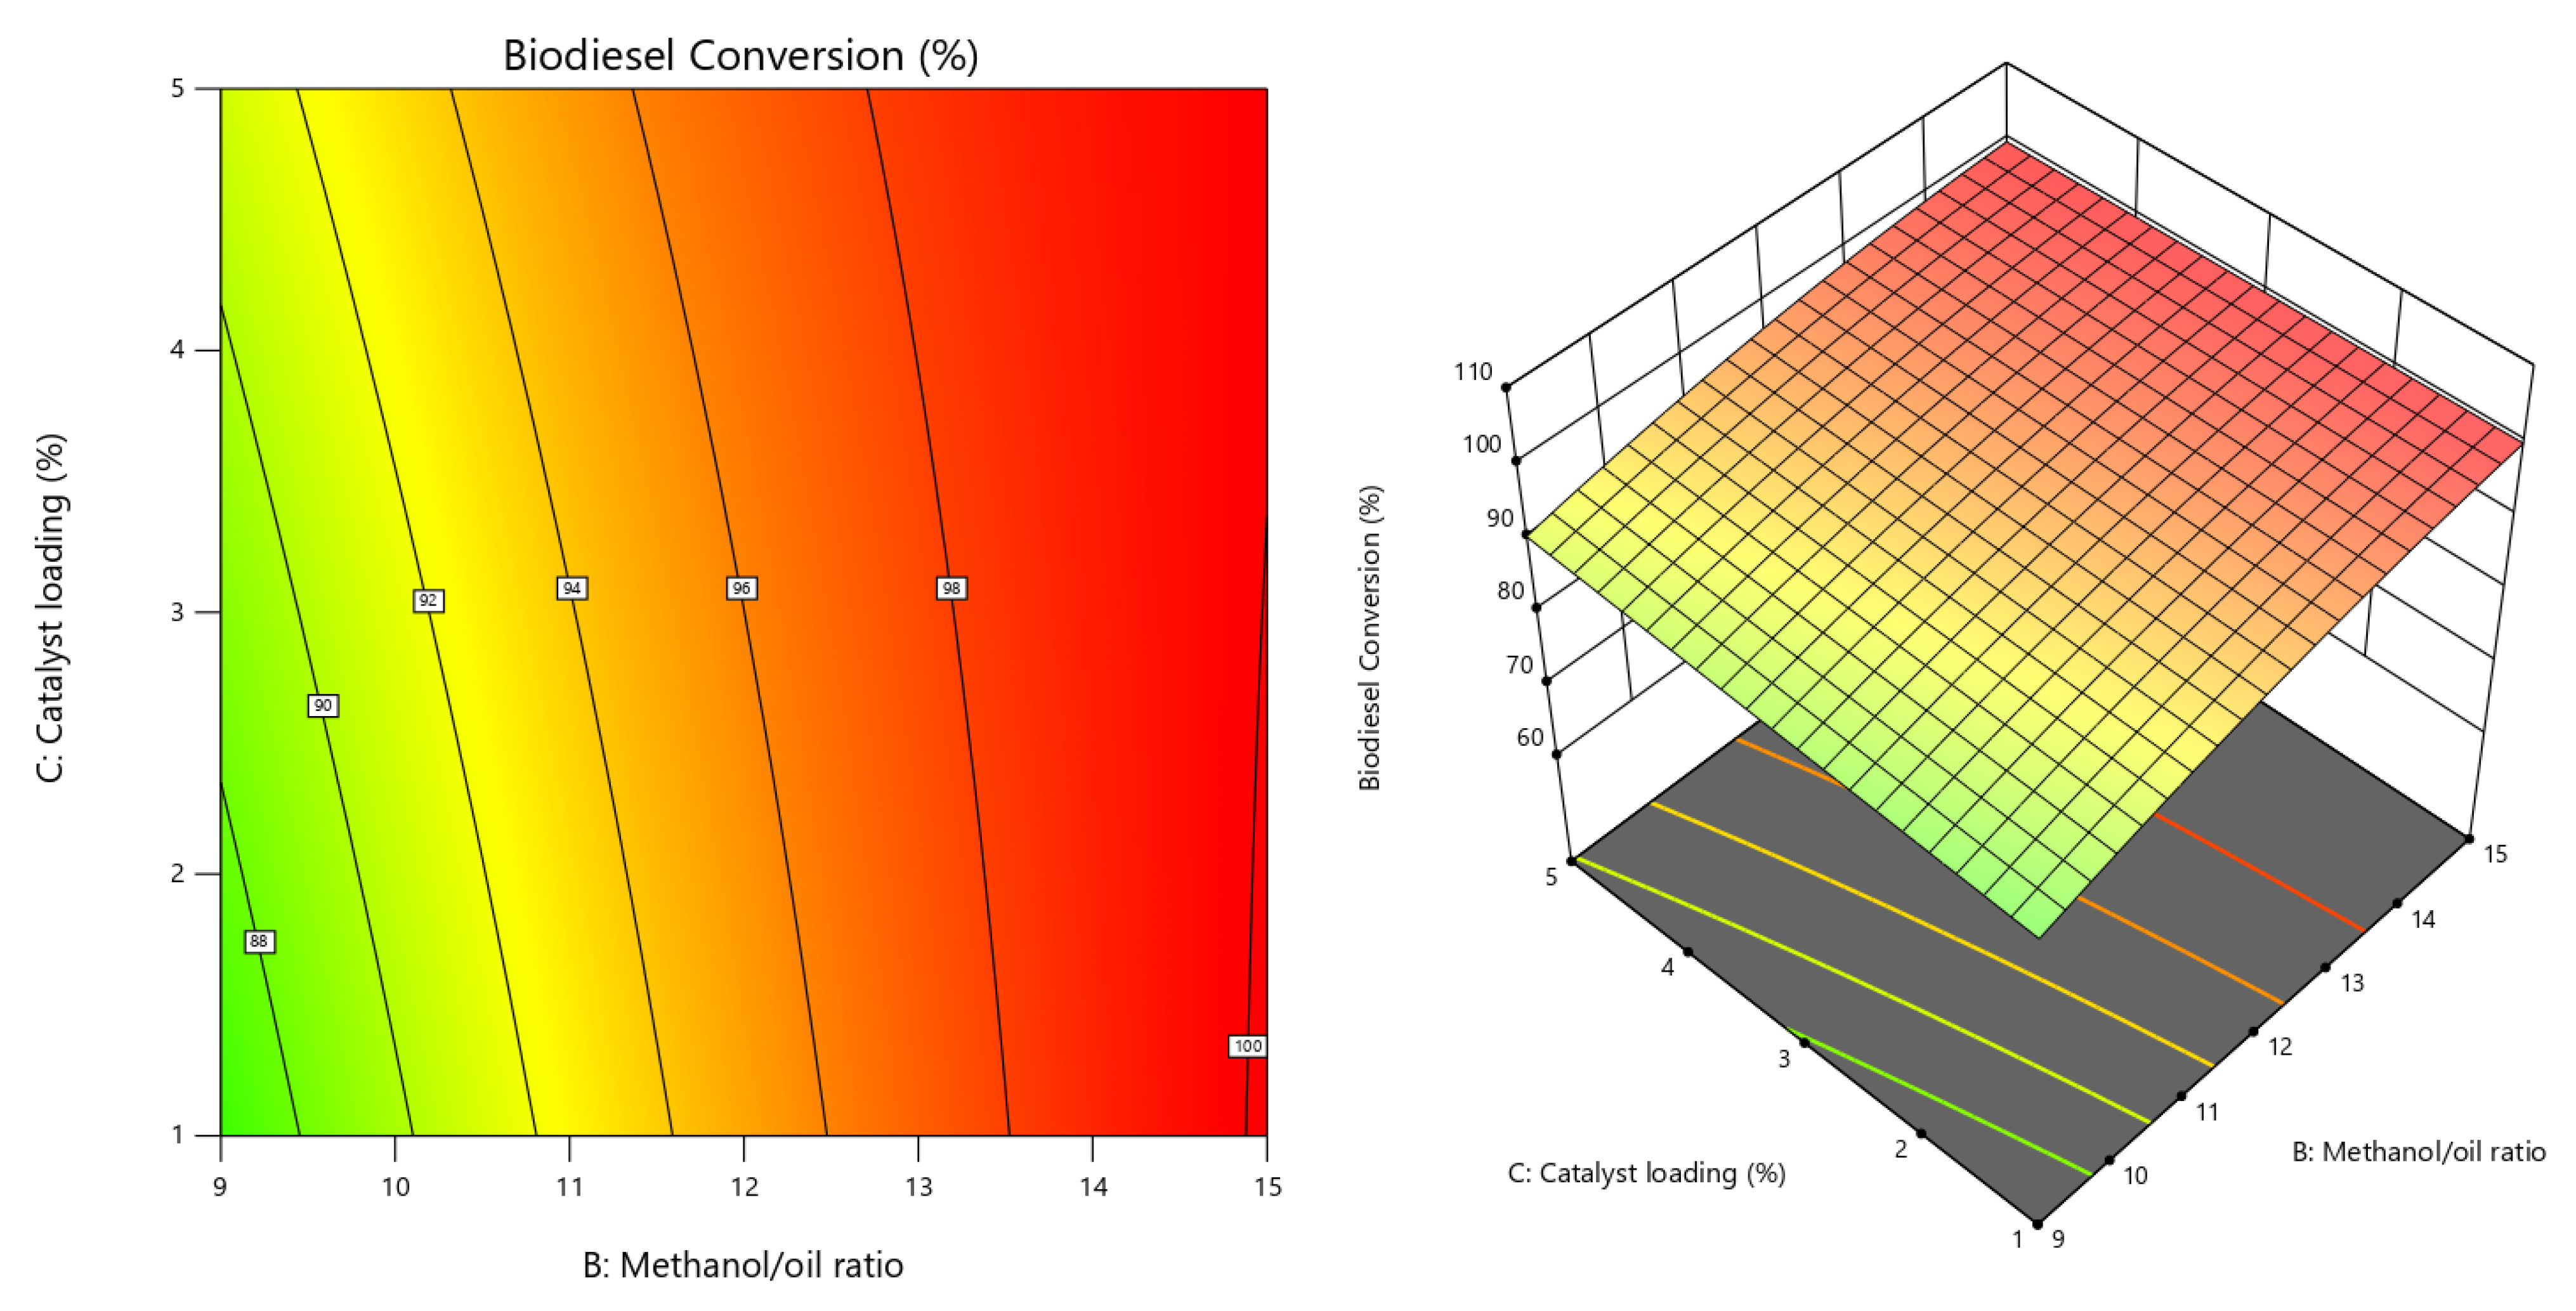
3.8.3. Effect of the Methanol to Oil Ratio on the Yield of Biodiesel
M:O molar ratio is an important variable for biodiesel production. According to the stoichiometric equation of trans-esterification reaction, three moles of methanol are required to convert 1 mole of oil to 3 moles of biodiesel. This illustrates the importance of excess methanol, which has an important role in maintaining the reaction at constant rate and enhancing forward reaction. Consequently, the M:O molar ratio has been chosen within a range of 9:1 to 15:1 to investigate the effect of wide range of excess methanol on the biodiesel conversion. It observed that the yield of biodiesel greatly increases with the increase in the methanol to oil ratio.
3.8.4. Effect of the Catalyst Loading on the Yield of Biodiesel
CaO weight percentage is an important variable for biodiesel production. Consequently, CaO weight percentage has been chosen within a range of 1 to 5% to investigate the effect of wide range of excess methanol on the biodiesel conversion. It was observed that the catalyst loading has a low or approximately no effect on the biodiesel yield, which means that a minimum amount of catalyst will give the required result, as this catalyst is a strong one.
3.9. Reaction Response Variation with the Variables’ Interactions
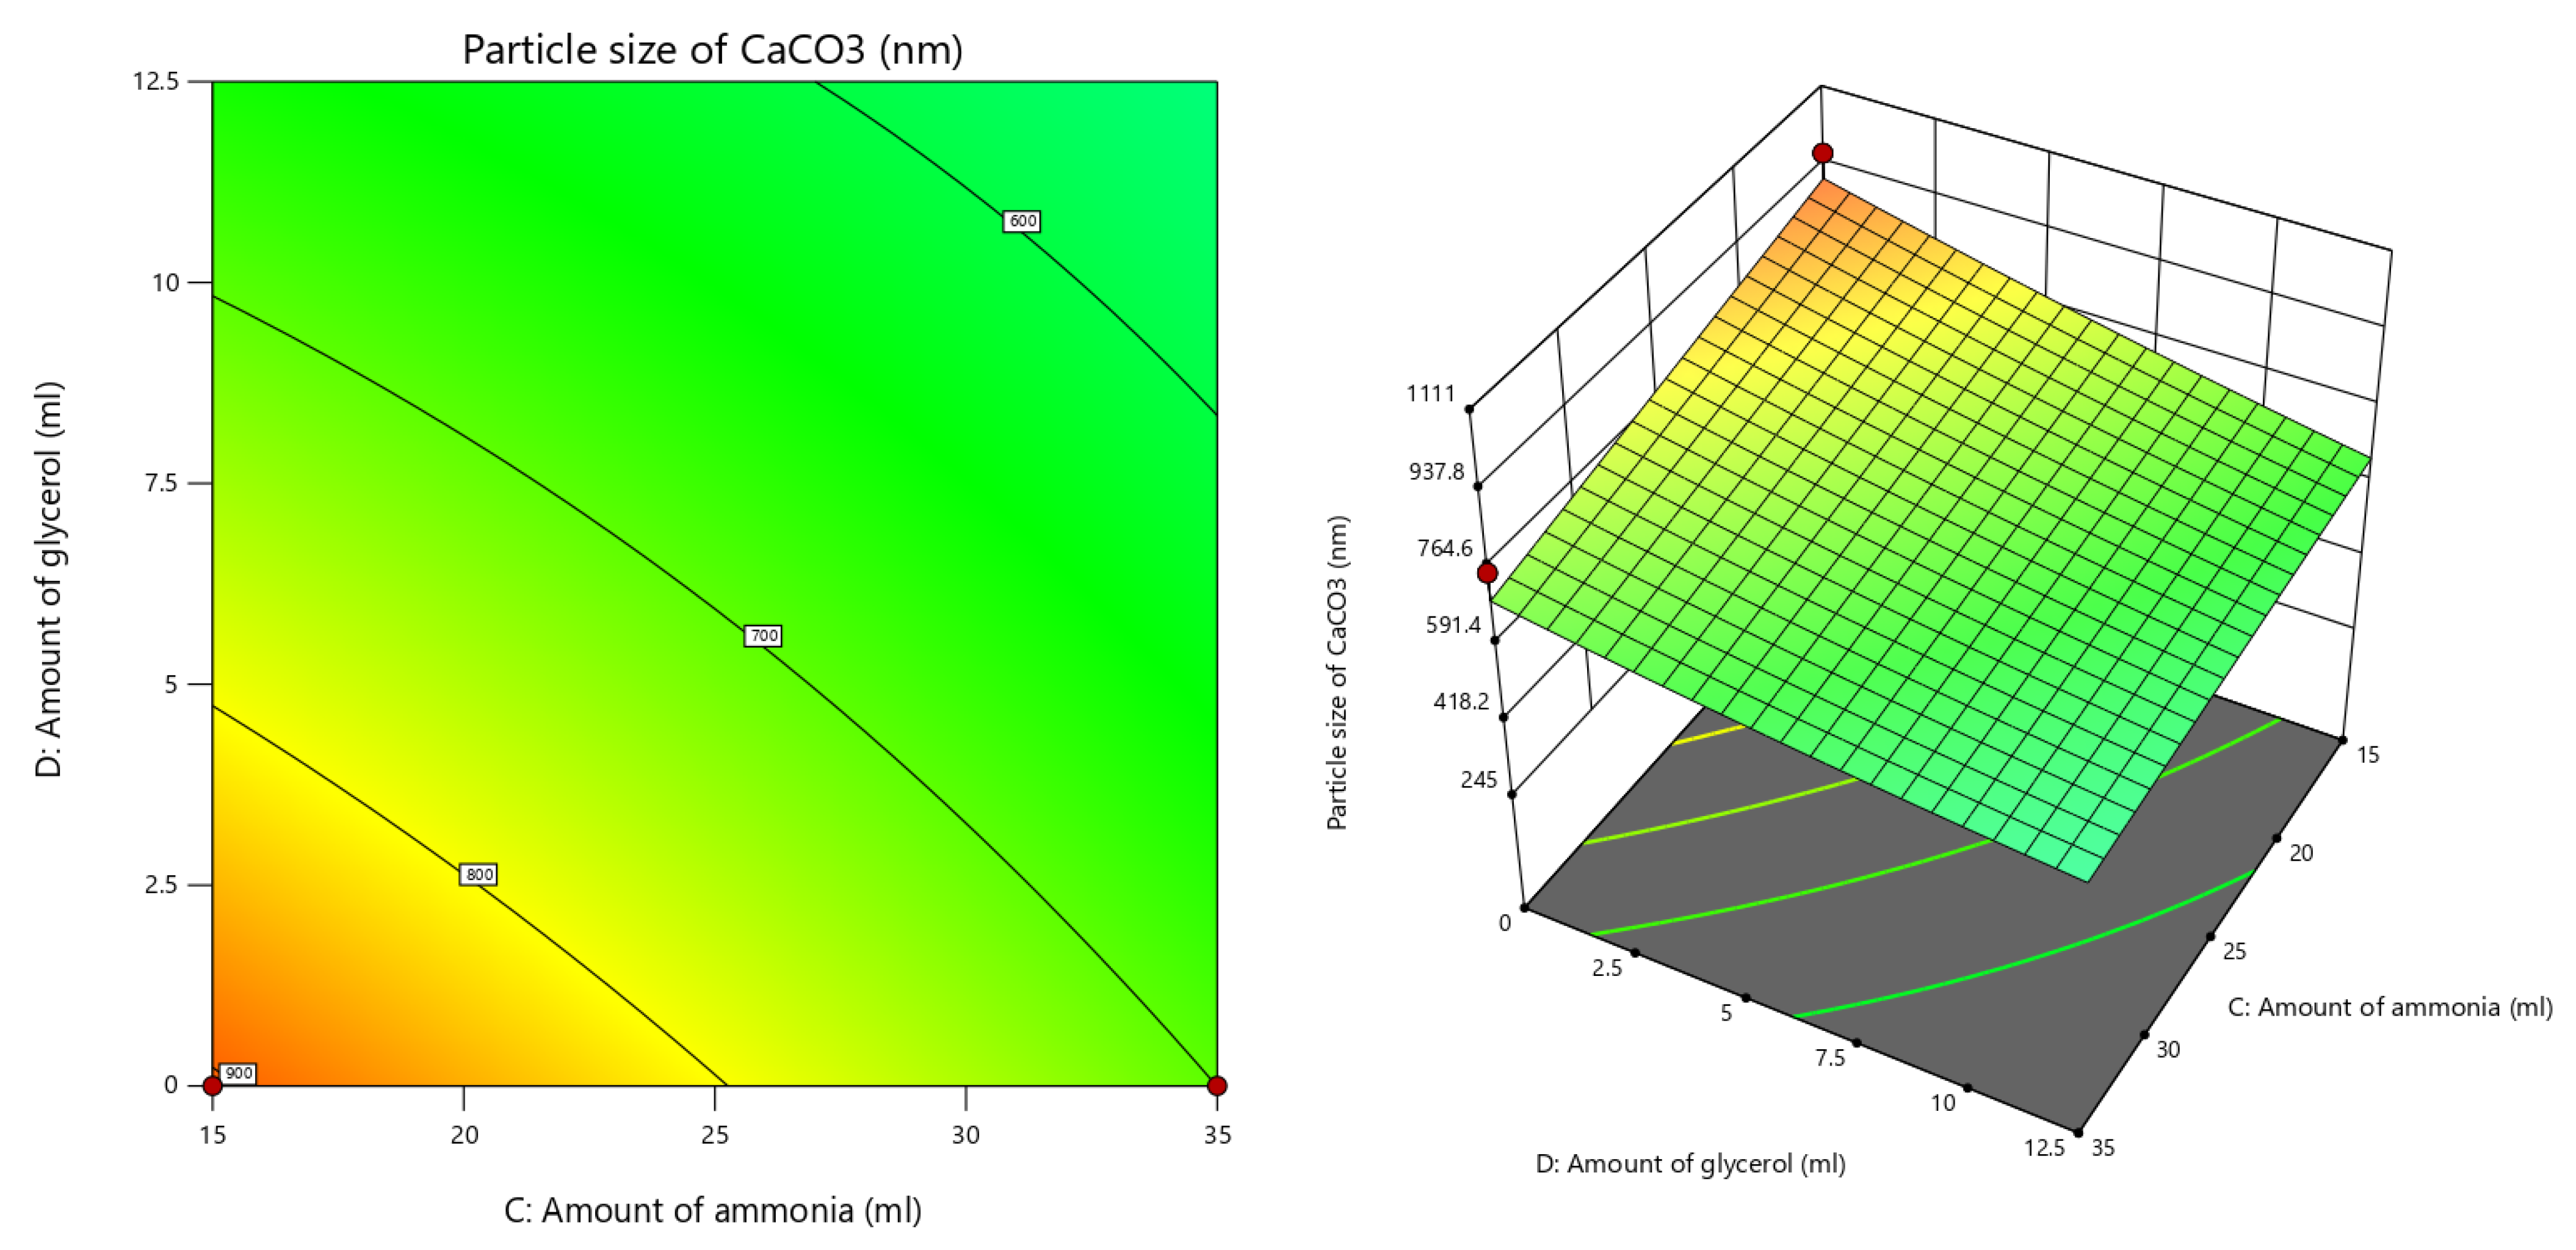
Figure 15 indicates the relationship between the CO2 flow rate, amount of glycerol, and the particle size of CaCO3. Figure 16 indicates the relationship between the amount of ammonia, the amount of glycerol, and the particle size of CaCO3. Figure 17 indicates the relationship between the CO2 flow rate, stirring rate, and the yield of CaCO3. Figure 18 indicates the relationship between the catalyst loading, methanol to oil ratio, and the yield of biodiesel. Figure 19 indicates the relationship between the reaction temperature, methanol to oil ratio, and the yield of biodiesel.
3.10. Process Optimization
Many solutions were developed by the design expert, but the solution with the highest desirability was selected as an optimum solution. The optimization process was done in two steps as follows.
3.10.1. CaCO3 Production Process Optimization
Targets of the independent variables have been set based on minimizing the particle size of CaCO3 while increasing its yield to be able to get a highly active catalyst with a high amount. Table 11 shows the optimum results for CaCO3 production processes.
3.10.2. Biodiesel Production Process Optimization
Targets of the independent variables have been set based on environmental and economic considerations. For the highly energy consuming variables including temperature and time, they have been set to be minimized with high importance (5th degree of importance). Finally, the response variable, which is the biodiesel yield, has been set to be maximized to achieve the highest biodiesel yield within the independent variables’ target restrictions. Table 12 shows the optimum results for biodiesel production processes.
3.11. Optimum Biodiesel Sample Analysis
3.12. CaO Reusability
Figure 20 demonstrates that conversion falls from 96 percent after the first usage to the third use. One of the associated problems with the catalyst’s lower activity is glycerol contamination on the active site. The second reason is that active CaO is slaking into less active carbonate, bicarbonate, and hydroxide compounds forming in addition to 1% catalyst loading that is used. This means it is used with a very low amount, so it is worth nothing to recycle the catalyst or search for any method for catalyst recycling.
4. Optimum Biodiesel Production from Solvay Wastewater
The concentration of CaCl2 is not low as its value is 115 kg/m3 according to Table 1, and the factory produced a large amount of wastewater each day. Soda ash production by the Solvay process produced a waste stream of 10 m3 per ton of product Na2CO3. This stream, known as distiller waste, contains CaCl2, NaCl, and small quantities of Ca(OH)2 and CaCO3 [41]. This stream is discharged into the Mediterranean Sea, which may cause environmental problems, and it is suggested to recover CaCl2 present in this stream and produce valuable products such as CaCO3. According to the amount of wastewater produced every day, the CaO can be produced and used in biodiesel production as its loading in the biodiesel reaction is 1%, so it is used with a small amount so there is no need for additional raw materials. Regarding the energy consumption cost, it will be totally covered by the cost of produced biodiesel, so this process is a profitable process.
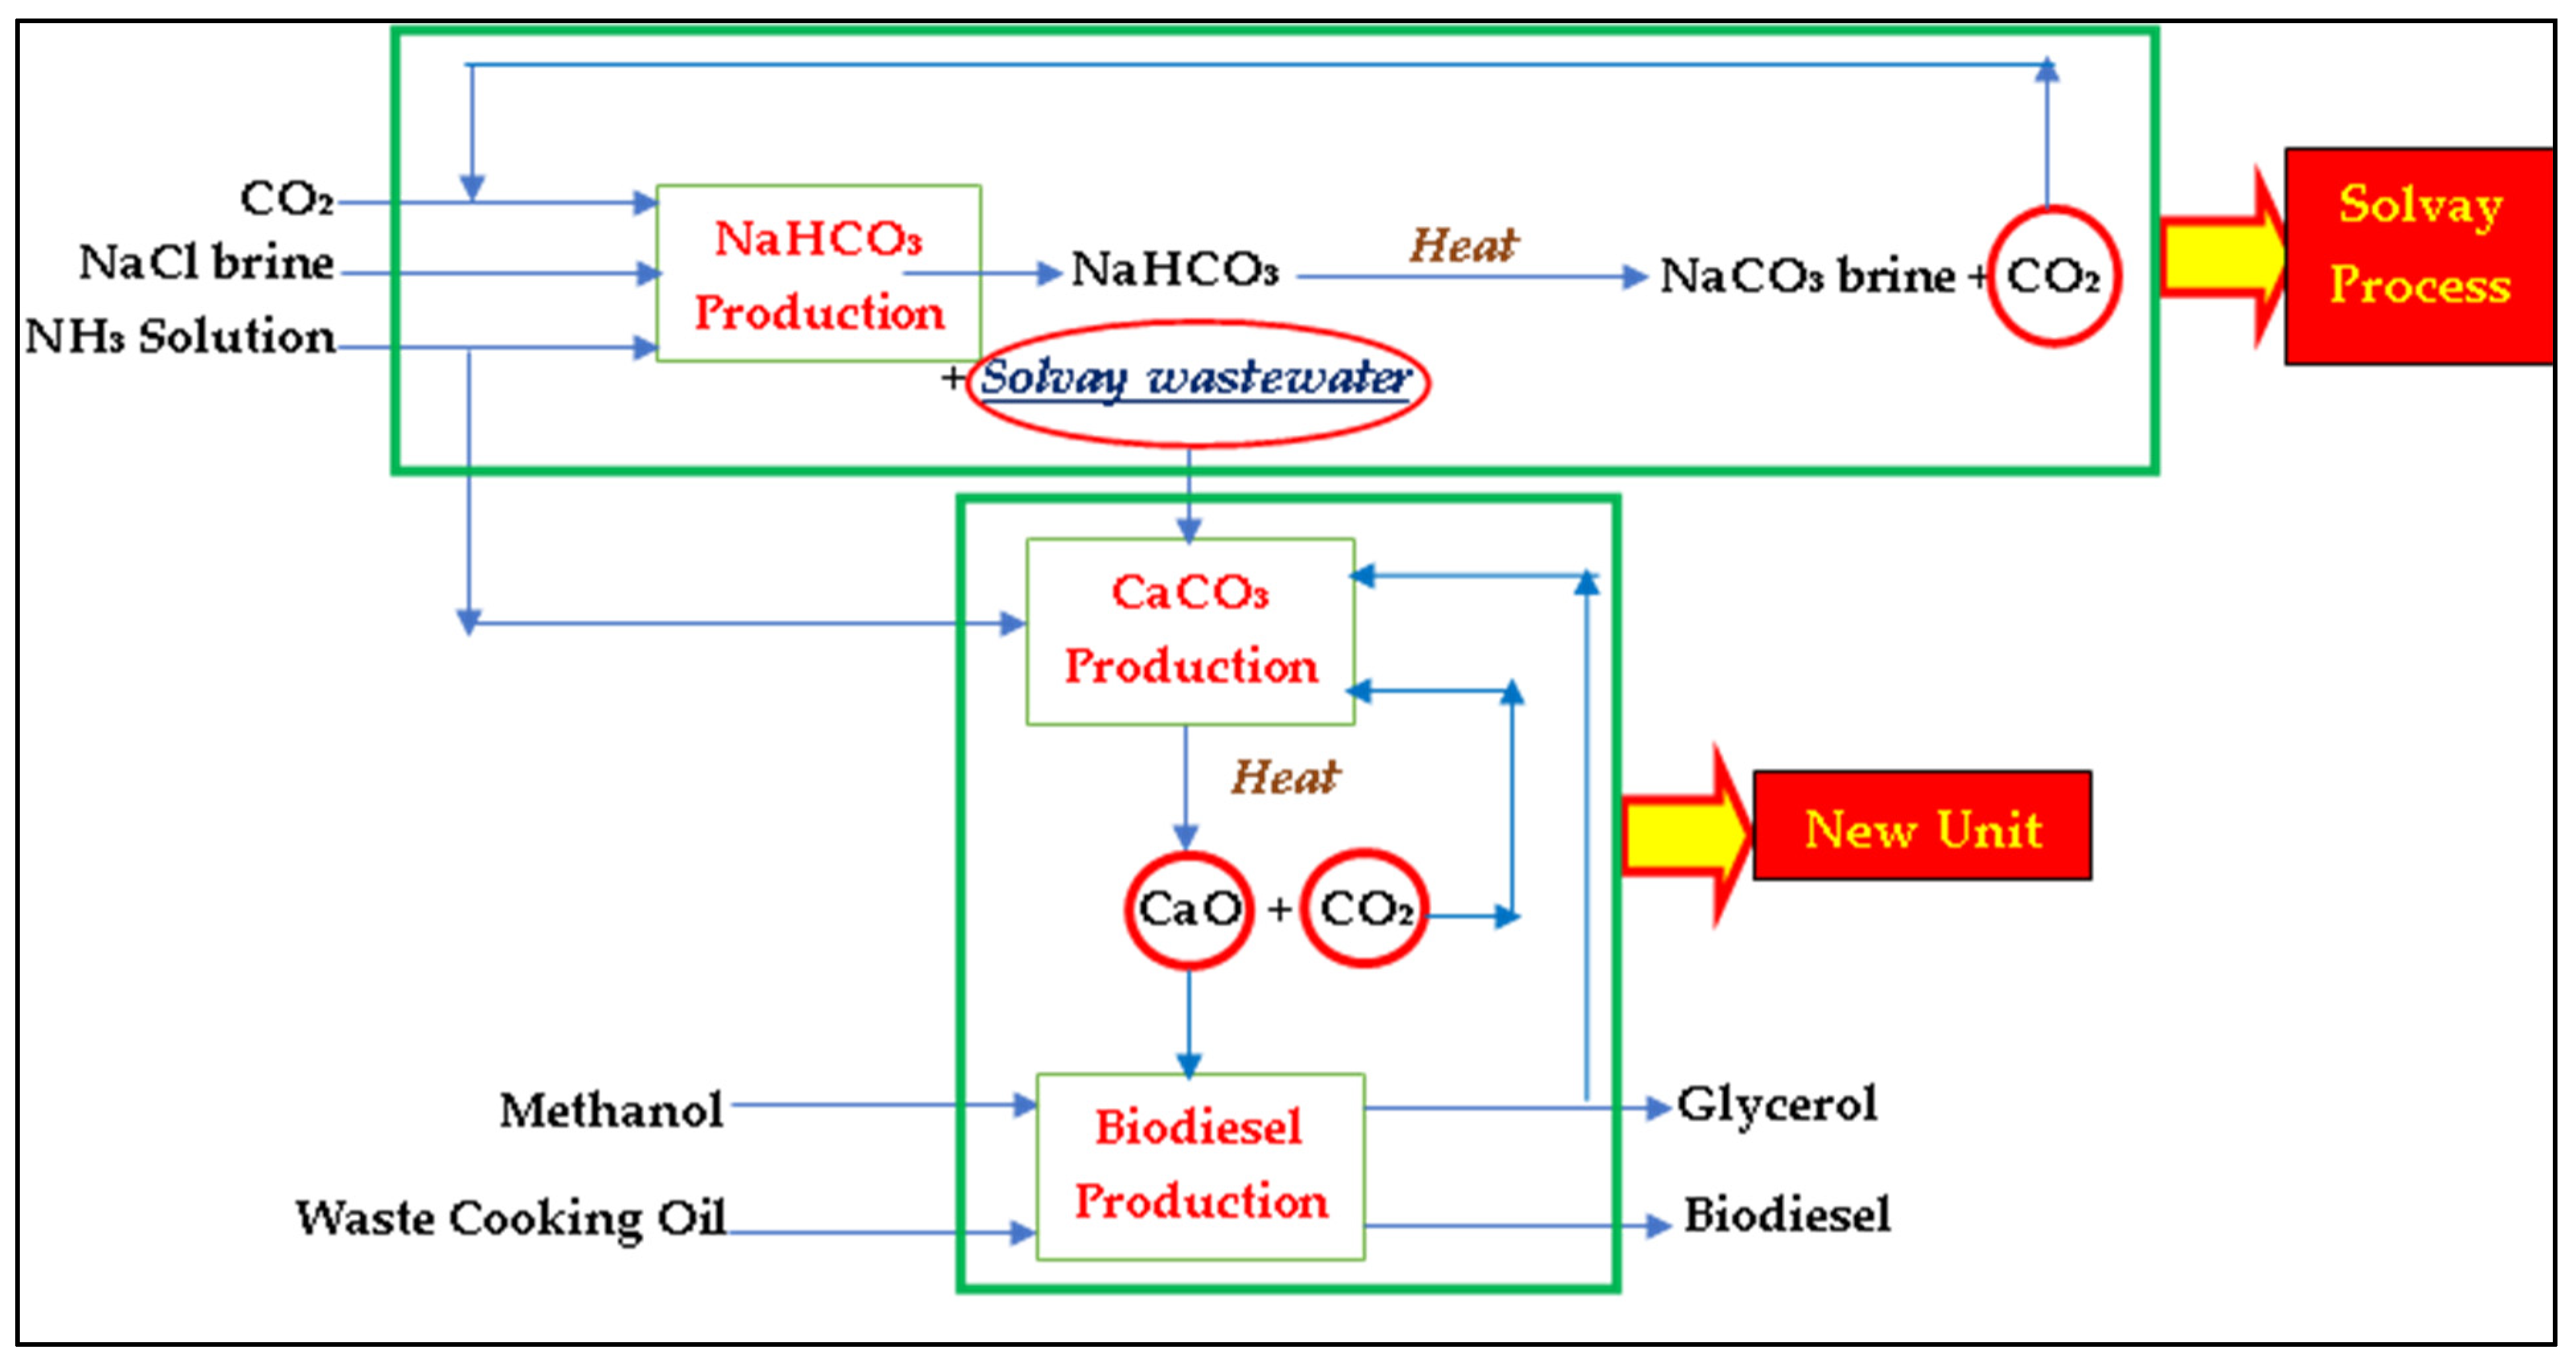
This research can be done in real-life by adding a new unit to the factory that produces NaCO3 (soda ash) using the Solvay process method to get the use of valuable chemicals in its wastewater before throwing it as shown in Figure 21. The wastewater is used to produce CaCO3, then firing to produce CaO, and then finally the biodiesel production step. The following steps show the summary for all experimental procedures done on a lab scale with the optimum conditions for all reaction or process parameters. Process upgrading can be done to make this process done on industrial scale.
4.1. CaCO3 Production Step
- Mixing Solvay wastewater with ammonia solution using a mixing ratio 3 (ammonia solution): 47 (wastewater).
- Adding glycerol to the reaction mixture with an amount equal to 10% of the total volume of the mixture.
- Stirring the resulted solution mixture using 1300 rpm rotational speed on a magnetic stirrer.
- Bubbling CO2 gas with a flowrate of 2000 mL/min using a gas distributer for 20 min.
- By the end of the reaction, the product was filtered to get the resulting CaCO3 with 420.4 nm particle size and 96.8% yield.
4.2. CaO Production Step
CaCO3 was calcined at 900 °C for 2 h and then stored in desiccators to protect the produced calcium oxide which can react with water that is present in the humidity of the air.
4.3. Biodiesel Production Step
- Purification and drying for the waste sunflower waste cooking oil.
- Heating the resulted biodiesel in a round bottom flask at 56 °C using a magnetic stirrer with a heater.
- Mixing methanol and biodiesel catalyst with the hot oil with 15 methanol to oil ratio and 1% catalyst loading.
- Leaving the reaction mixture for 2 h and then quenching with cold methanol to stop the reaction. Then, the products were left to cool.
- Separating the products using a separating funnel for 2 h.
- Drying the resulting products at 80 °C for half an hour to remove the methanol.
- Biodiesel washing to remove any contaminations in it.
- By the end of these steps, the resulting biodiesel has 95.8% conversion.
5. Comparison between This Research and the Previous Ones
The comparison shown in Table 15 shows the differences between the results obtained by this research and other published papers. This research has many important benefits and advantages as shown in the following:
- Low energy consumption because of using a low reaction compared with others.
- High biodiesel conversion.
- Biodiesel catalyst generation from Solvay wastewater, CO2, and waste cooking oil.
- High used methanol to oil ratio. The extra methanol is separated from the resulting biodiesel by distillation and then recycled and reused.
- Low amount of used catalyst compared with the other studies so its separation after the reaction is easier.
6. Conclusions
Biodiesel was produced from waste sunflower oil and methanol in the presence of CaO as a heterogeneous catalyst. Solvay wastewater was used as a source for CaO. Waste cooking oil, wastewater, and CO2, which are considered dangerous materials to the environment, are used to produce a valuable product, so this research has an environmental benefit and economic benefit because of using waste materials as a replacement for raw materials. Four independent reaction conditions were selected to detect their impact on biodiesel production: reaction temperature, methanol to oil (M:O) molar ratio, reaction time, and catalyst loading, and another four independent reaction conditions were selected to detect their impact on particle size and the yield of CaCO3: CO2 flowrate, amount of glycerol, amount of ammonia, and stirring rate. The response surface approach was used to assess the impact of all reaction factors on biodiesel output. Three models were developed to describe the relationship between the reaction responses and reaction variables. The design expert program developed the optimum reaction responses and reaction variables, which resulted in an optimum biodiesel production process. This research has an economic benefit. This research aims to produce the maximum amount of biodiesel using minimum energy and low reaction conditions. The best conditions were found to be an M:O molar ratio of 15:1, a catalyst dosage of 1%, a reaction temperature of 56 °C, a reaction period of 2 h, and a stirring rate of 750 rpm, yielding a biodiesel conversion of 95.8 percent that agreed with the international standards of biodiesel. The reusability test revealed that it recommended to not reuse CaO again after the first use, and there is no problem as CaO is used in the biodiesel production with a small amount.
Author Contributions
Conceptualization, M.H.R.; Data curation, R.A.B.; Formal analysis, M.H.R.; Investigation, R.A.B.; Methodology, M.H.R.; Supervision, M.H.R.; Validation, M.H.R.; Writing—original draft, M.H.R.; Writing—review and editing, M.H.R. All authors have read and agreed to the published version of the manuscript.
Funding
The authors declare that this paper is not funded by any funding agency.
Data Availability Statement
All data generated or analyzed during this study are available in this article.
Acknowledgments
M. H. Roushdy, the first author, wishes to express her heartfelt gratitude to Magdi F. Abadir of Cairo University.
Conflicts of Interest
The authors declare that they have no known competing financial interests or personal relationships that could have appeared to influence the work reported in this paper.
References
- Habibullah, M.; Masjuki, H.H.; Kalam, M.A.; Rahman, S.M.A.; Mofijur, M.; Mobarak, H.M.; Ashraful, A.M. Potential of biodiesel as a renewable energy source in Bangladesh. Renew. Sustain. Energy Rev. 2015, 50, 819–834. [Google Scholar] [CrossRef]
- Ayoola, A.A.; Fayomi, O.S.I.; Adegbite, O.A.; Raji, O. Biodiesel Fuel Production Processes: A Short Review. IOP Conf. Ser. Mater. Sci. Eng. 2021, 1107, 012151. [Google Scholar] [CrossRef]
- Khodary, K.E.; Naeem, M.M.; Roushdy, M.H. Utilization of electric arc furnace dust as a solid catalyst in biodiesel production. Clean Technol. Environ. Policy 2021. [Google Scholar] [CrossRef]
- Chintagunta, A.D.; Zuccaro, G.; Kumar, M.; Kumar, S.P.J.; Garlapati, V.K.; Postemsky, P.D.; Kumar, N.S.S.; Chandel, A.K.; Simal-Gandara, J. Biodiesel Production From Lignocellulosic Biomass Using Oleaginous Microbes: Prospects for Integrated Biofuel Production. Front. Microbiol. 2021, 12, 658284. [Google Scholar] [CrossRef]
- Lamichhane, G.; Khadka, S.; Adhikari, S.; Koirala, N.; Poudyal, D.P. Biofuel Production from Waste Cooking Oils and its Physicochemical Properties in Comparison to Petrodiesel. Nepal J. Biotechnol. 2020, 8, 87–94. [Google Scholar] [CrossRef]
- Shankar, S.; Shikha. Renewable and Nonrenewable Energy Resources: Bioenergy and Biofuels; Principles and Applications of Environmental Biotechnology for a Sustainable Future book series; Springer: Singapore, 2017; pp. 293–314. [Google Scholar]
- De Blasio, C. Processes of Bioethanol Production. In Fundamentals of Biofuels Engineering and Technology. Green Energy and Technology; Springer: Singapore, 2019. [Google Scholar] [CrossRef]
- Pasha, M.K.; Dai, L.; Liu, D.; Guo, M.; Du, W. An overview to process design, simulation and sustainability evaluation of biodiesel production. Biotechnol. Biofuels 2021, 14, 129. [Google Scholar] [CrossRef]
- Roushdy, M.H. Heterogeneous Biodiesel Catalyst from Steel Slag Resulting from an Electric Arc Furnace. Processes 2022, 10, 465. [Google Scholar] [CrossRef]
- Thangaraj, B.; Solomon, P.R.; Muniyandi, B.; Ranganathan, S.; Lin, L. Catalysis in biodiesel production—A review. Clean Energy 2019, 3, 2–23. [Google Scholar] [CrossRef] [Green Version]
- Watcharathamrongkul, K.; Jongsomjit, B.; Phisalaphong, M. Calcium oxide based catalysts for ethanolysis of soybean oil. Songklanakarin J. Sci. Technol. 2010, 32, 627–634. [Google Scholar]
- Sai Bharadwaj, A.V.S.L.; Singh, M.; Niju, S.; Meera Sheriffa Begum, K.M.; Anantharaman, N. Biodiesel production from rubber seed oil using calcium oxide derived from eggshell as catalyst-optimization and modeling studies. Green Processing Synth. 2019, 8, 430–442. [Google Scholar] [CrossRef]
- Al-Sakkari, E.G.; El-Sheltawy, S.T.; Abadir, M.F.; Attia, N.K.; El-Diwani, G. Investigation of cement kiln dust utilization for catalyzing biodiesel production via response surface methodology. Int. J. Energy Res. 2017, 41, 593–603. [Google Scholar] [CrossRef]
- Çalban, T.; Kavci, E. Removal of calcium from soda liquid waste containing calcium chloride. Energy Sources Part A: Recovery Util. Environ. Eff. 2010, 32, 407–418. [Google Scholar] [CrossRef]
- Czaplicka, N.; Konopacka-Łyskawa, D. Studies on the utilization of post-distillation liquid from Solvay process to carbon dioxide capture and storage. SN Appl. Sci. 2019, 1, 431. [Google Scholar] [CrossRef] [Green Version]
- Czaplicka, N.; Konopacka-Łyskawa, D. Utilization of gaseous carbon dioxide and industrial ca-rich waste for calcium carbonate precipitation: A review. Energies 2020, 13, 6239. [Google Scholar] [CrossRef]
- Rasouli, H.; Esmaeili, H. Characterization of MgO nanocatalyst to produce biodiesel from goat fat using transesterification process. 3 Biotech 2019, 9, 429. [Google Scholar] [CrossRef]
- ASTM E 11-09; Standard Specification for Woven Wire Test Sieve Cloth and Test Sieves. ASTM International: West Conshohocken, PA, USA, 2010; Volume 1, p. 9.
- Degfie, T.A.; Mamo, T.T.; Mekonnen, Y.S. Optimized Biodiesel Production from Waste Cooking Oil (WCO) using Calcium Oxide (CaO) Nano-catalyst. Sci. Rep. 2019, 9, 18982. [Google Scholar] [CrossRef] [Green Version]
- Varma, S.; Chen, P.; Unnikrishnan, G. Gas-liquid reactive crystallization for the synthesis of CaCO3 nanocrystals. Mater. Chem. Phys. 2011, 126, 232–236. [Google Scholar] [CrossRef]
- Westin, K.J.; Rasmuson, Å.C. Crystal growth of aragonite and calcite in presence of citric acid, DTPA, EDTA and pyromellitic acid. J. Colloid Interface Sci. 2005, 282, 359–369. [Google Scholar] [CrossRef]
- Popescu, M.-A.; Isopescu, R.; Matei, C.; Fagarasan, G.; Plesu, V. Thermal decomposition of calcium carbonate polymorphs precipitated in the presence of ammonia and alkylamines. Adv. Powder Technol. 2014, 25, 500–507. [Google Scholar] [CrossRef]
- Widayat, W.; Darmawan, T.; Hadiyanto, H.; Rosyid, R.A. Preparation of Heterogeneous CaO Catalysts for Biodiesel Production. J. Phys. Conf. Ser. 2017, 877, 012018. [Google Scholar] [CrossRef] [Green Version]
- Singh, N.B.; Singh, N.P. Formation of CaO from thermal decomposition of calcium carbonate in the presence of carboxylic acids. J. Therm. Anal. Calorim. 2007, 89, 159–162. [Google Scholar] [CrossRef]
- Widiarti, N.; Nimah Yatim, L.; Bahruji, H.; Prasetyoko, D. Development of CaO From Natural Calcite as a Heterogeneous Base Catalyst in the Formation of Biodiesel: Review. J. Renew. Mater. 2019, 7, 915–939. [Google Scholar] [CrossRef]
- Montgomery, D.C. Montgomery Design and Analysis of Experiments, 8th ed.; Arizona State University: Tempe, AZ, USA, 2013; Volume 2009, 2001p. [Google Scholar]
- Bayoumi, R.A.; Ahmed, T.S.; Soliman, A.; Ismail, I.M. Nano Calcium Carbonate Production Utilizing Solvay-Process Industrial Wastewater and Carbon Dioxide. Key Eng. Mater. 2019, 821, 350–358. [Google Scholar] [CrossRef]
- EN 14214:2013 V2+A1; Liquid Petroleum Products—Fatty Acid Methyl Esters (FAME) for Use in Diesel Engines and Heating Applications—Requirements and Test Methods. European Committee for Standardization: Brussels, Belgium, 2013; p. 14538.
- D6751-15c A; Standard Specification for Biodiesel Fuel Blend Stock (B100) for Middle Distillate Fuels. ASTM International: West Conshohocken, PA, USA, 2010; pp. 1–11.
- Biodiesel, A. APPLICATION NOTE EN 14103 Determination of Total FAME and Linolenic Acid Methyl Ester in FAME with AC Biodiesel All in One Solution; AC Analytical Controls, PAC L.P.: Houston, TX, USA, 2011; pp. 1–3. [Google Scholar]
- Biodiesel, A.; Glycerol, T. APPLICATION NOTE EN 14105 Determination of Free and Total Glycerol and Mono-, Di—Triglycerides in Fatty Acid Methyl Esters (FAME); SCION Instruments: Livingston, UK, 2011; pp. 2–4. [Google Scholar]
- Scmeme, C.E. Effect of gas-liquid mass transfer on crystal size distribution during the batch precipitation of calcium carbonate. Chem. Eng. Sci. 1991, 46, 3289–3293. [Google Scholar]
- Sun, B.-C.; Wang, X.-M.; Chen, J.-M.; Chu, G.-W.; Chen, J.-F.; Shao, L. Synthesis of nano-CaCO3 by simultaneous absorption of CO2 and NH3 into CaCl2 solution in a rotating packed bed. Chem. Eng. J. 2011, 168, 731–736. [Google Scholar] [CrossRef]
- Jung, W.M.; Kang, S.H.; Kim, K.S.; Kim, W.S.; Choi, C.K. Precipitation of calcium carbonate particles by gas-liquid reaction: Morphology and size distribution of particles in Couette-Taylor and stirred tank reactors. J. Cryst. Growth 2010, 312, 3331–3339. [Google Scholar] [CrossRef]
- Konopacka-Łyskawa, D.; Kościelska, B.; Karczewski, J. Effect of some organic solvent–water mixtures composition on precipitated calcium carbonate in carbonation process. J. Cryst. Growth 2015, 418, 25–31. [Google Scholar] [CrossRef]
- Mahapatra, D. A Review on Steam Coal Analysis—Calorific Value. Am. Int. J. Res. Sci.Technol. Eng. Math. 2016, 14, 143–152. [Google Scholar]
- Products, P. Astm D93 Flash Point; ASTM International: West Conshohocken, PA, USA, 2004; p. 80112. [Google Scholar]
- Edition, F. Final Draft Uganda Standard; ASTM International: West Conshohocken, PA, USA, 2013. [Google Scholar]
- D40052-15; Standard Test Method for Density, Relative Density, and API Gravity of Liquids by Digital Density Meter. ASTM International: West Conshohocken, PA, USA, 2013; pp. 1–8.
- ASTM D445-06; Standard Test Method for Kinematic Viscosity of Transparent and Opaque Liquids (and Calculation of Dynamic Viscosity). In Manual on Hydrocarbon Analysis, 6th ed; ASTM International: West Conshohocken, PA, USA, 2008; pp. 1–10.
- Alamdari, A.; Alamdari, A.; Mowla, D. Kinetics of calcium carbonate precipitation through CO2 absorption from flue gas into distiller waste of soda ash plant. J. Ind. Eng. Chem. 2014, 20, 3480–3486. [Google Scholar] [CrossRef]
- Erchamo, Y.S.; Mamo, T.T.; Workneh, G.A.; Mekonnen, Y.S. Improved biodiesel production from waste cooking oil with mixed methanol–ethanol using enhanced eggshell-derived CaO nano-catalyst. Sci. Rep. 2021, 11, 6708. [Google Scholar] [CrossRef] [PubMed]
- Ayoola, A.A.; Fayomi, O.S.I.; Adeeyo, O.A.; Omodara, J.O.; Adegbite, O. Impact assessment of biodiesel production using CaO catalyst obtained from two different sources. Cogent. Eng. 2019, 6, 1615198. [Google Scholar] [CrossRef]
- Vivi Sisca, S.; Zilfa, J.N. Biodiesel Production from Waste Cooking Oil Using Catalyst Calcium Oxide Derived of Limestone Lintau Buo. Arch. Pharm. Pract. 2020, 11, 8–14. [Google Scholar]
- Soria-Figueroa, E.; Mena-Cervantes, V.Y.; García-Solares, M.; Hernández-Altamirano, R.; Vazquez-Arenas, J. Statistical optimization of biodiesel production from waste cooking oil using CaO as catalyst in a Robinson-Mahoney type reactor. Fuel 2020, 282, 118853. [Google Scholar] [CrossRef]
- Bharti, P.; Singh, B.; Dey, R.K. Process optimization of biodiesel production catalyzed by CaO nanocatalyst using response surface methodology. J. Nanostruct. Chem. 2019, 9, 269. Available online: link.gale.com/apps/doc/A607973452/AONE?u=anon~f1b9196&sid=googleScholar&xid=fe3eb596 (accessed on 14 May 2022). [CrossRef] [Green Version]
- Abd Malek, M.N.F.; Pushparaja, L.; Hussin, N.M.; Embong, N.H.; Bhuyar, P.; Rahim, M.H.A.; Maniam, G.P. Exploration of efficiency of nano calcium oxide (CaO) as catalyst for enhancement of biodiesel production. J. Microbiol. Biotechnol. Food Sci. 2021, 11, e3935. [Google Scholar] [CrossRef]
Figure 1.
Solvay process.

Figure 2.
Experimental setup for CaCO3 production.

Figure 3.
Experimental setup for biodiesel production.

Figure 4.
Mechanism of transesterification reaction using CaO catalyst [25].
Figure 4.
Mechanism of transesterification reaction using CaO catalyst [25].

Figure 5.
Mineralogical analysis of produced CaCO3.

Figure 6.
Mineralogical analysis of CaO including the peaks list of CaO and the reference sample.

Figure 7.
SEM of biodiesel catalyst (CaO).

Figure 8.
Cumulative screen analysis curve of biodiesel catalyst (CaO).

Figure 9.
CaCO3 particle size relationship between expected and experimental results.

Figure 10.
CaCO3 yield relationship between expected and experimental results.

Figure 11.
Relationship between biodiesel predicted yield and experimental results.

Figure 12.
Process variables affect the CaCO3 particle size.

Figure 13.
Process variables affect the CaCO3 yield.

Figure 14.
Process variables affect the yield of biodiesel.

Figure 15.
Relationship between the CO2 flow rate, amount of glycerol, and the particle size of CaCO3 (Contour and 3D plot).
Figure 15.
Relationship between the CO2 flow rate, amount of glycerol, and the particle size of CaCO3 (Contour and 3D plot).

Figure 16.
Relationship between the amount of ammonia, amount of glycerol, and the particle size of CaCO3 (Contour and 3D plot).
Figure 16.
Relationship between the amount of ammonia, amount of glycerol, and the particle size of CaCO3 (Contour and 3D plot).

Figure 17.
Relationship between the CO2 flow rate, stirring rate, and the yield of CaCO3 (Contour and 3D plot).
Figure 17.
Relationship between the CO2 flow rate, stirring rate, and the yield of CaCO3 (Contour and 3D plot).

Figure 18.
Relationship between the catalyst loading, methanol to oil ratio, and the yield of biodiesel (Contour and 3D plot).
Figure 18.
Relationship between the catalyst loading, methanol to oil ratio, and the yield of biodiesel (Contour and 3D plot).

Figure 19.
Relationship between the reaction temperature, methanol to oil ratio, and the yield of biodiesel (Contour and 3D plot).
Figure 19.
Relationship between the reaction temperature, methanol to oil ratio, and the yield of biodiesel (Contour and 3D plot).

Figure 20.
Reusability test results.

Figure 21.
Optimum biodiesel production process utilizing Solvay wastewater, CO2, and waste cooking oil.
Figure 21.
Optimum biodiesel production process utilizing Solvay wastewater, CO2, and waste cooking oil.


Table 1.
Composition of Solvay wastewater.
| Element | Concentration, (Kg/m3) |
|---|---|
| CaCl2 | 115 |
| NaCl | 54 |
| Ca(OH)2 | 9 |
| CaCO3 | 12 |
| CaSO4 | 4 |
| SiO2 | 1 |
| NH3 | 0.02 |
Table 2.
Chemical composition of SFWCO.
| Fatty Acid | v/v % |
|---|---|
| Arachidic acid | 1.42 |
| Eicosadienoic acid | 0.43 |
| Heptadecanoic acid | 36.55 |
| Lauric acid | 0.3 |
| Linoleic acid | 1.51 |
| Linolenic acid | 2.25 |
| Myristic acid | 0.75 |
| n-pentadecanoic acid | 1.64 |
| Oleic acid | 30.44 |
| Others | 4.13 |
| Palmitic acid | 20.21 |
| Palmitoleic acid | 0.37 |
Table 3.
Physicochemical properties of SFWCO.
| Property | Value |
|---|---|
| Acid value (mg of KOH/g of oil) | 1.5 |
| Density of 25 °C (kg/m3) | 845 |
| Molecular weight | 830.2 |
| Viscosity at 40 °C | 40.3 |
Table 4.
Design of experiment matrix for CaC3.
| Parameter | Unit | Values | |
|---|---|---|---|
| −1 | 1 | ||
| Stirring rate | rpm | 500 | 1300 |
| CO2 gas flow rate | mL/min | 900 | 2000 |
| Amount of ammonia | mL | 15 | 35 |
| Volume of glycerol | mL | 0 | 25 |
Table 5.
CaCO3 experimental runs.
| Run No. | Stirring Rate, rpm | CO2 Gas Flow Rate, mL/min | Amount of Ammonia, mL | The Volume of Glycerol, mL |
|---|---|---|---|---|
| 1 | 500 | 900 | 15 | 0 |
| 2 | 1300 | 900 | 15 | 0 |
| 3 | 500 | 2000 | 15 | 0 |
| 4 | 1300 | 2000 | 15 | 0 |
| 5 | 500 | 900 | 35 | 0 |
| 6 | 1300 | 900 | 35 | 0 |
| 7 | 500 | 2000 | 35 | 0 |
| 8 | 1300 | 2000 | 35 | 0 |
| 9 | 500 | 900 | 15 | 25 |
| 10 | 1300 | 900 | 15 | 25 |
| 11 | 500 | 2000 | 15 | 25 |
| 12 | 1300 | 2000 | 15 | 25 |
| 13 | 500 | 900 | 35 | 25 |
| 14 | 1300 | 900 | 35 | 25 |
| 15 | 500 | 2000 | 35 | 25 |
| 16 | 1300 | 2000 | 35 | 25 |
| 17 | 100 | 1450 | 25 | 12.5 |
| 18 | 1700 | 1450 | 25 | 12.5 |
| 19 | 900 | 350 | 25 | 12.5 |
| 20 | 900 | 2550 | 25 | 12.5 |
| 21 | 900 | 1450 | 5 | 12.5 |
| 22 | 900 | 1450 | 45 | 12.5 |
| 23 | 900 | 1450 | 25 | 0 |
| 24 | 900 | 1450 | 25 | 37.5 |
| 25–30 | 900 | 1450 | 25 | 12.5 |
Table 6.
Design of experiment matrix for biodiesel production.
| Parameter | Unit | Values | |
|---|---|---|---|
| −1 | 1 | ||
| Reaction time | h | 2 | 6 |
| Methanol to oil molar ratio | - | 9 | 15 |
| CaO catalyst loading concentration | % | 1 | 5 |
| Stirring rate | °C | 50 | 70 |
Table 7.
Biodiesel experimental runs.
| Run No. | Temperature, °C | Catalyst Loading, % | Methanol/Oil Ratio | Reaction Time, h |
|---|---|---|---|---|
| 1 | 50 | 1 | 9 | 2 |
| 2 | 50 | 1 | 9 | 6 |
| 3 | 50 | 1 | 15 | 2 |
| 4 | 50 | 1 | 15 | 6 |
| 5 | 50 | 5 | 9 | 2 |
| 6 | 50 | 5 | 9 | 6 |
| 7 | 50 | 5 | 15 | 2 |
| 8 | 50 | 5 | 15 | 6 |
| 9 | 70 | 1 | 9 | 2 |
| 10 | 70 | 1 | 9 | 6 |
| 11 | 70 | 1 | 15 | 2 |
| 12 | 70 | 1 | 15 | 6 |
| 13 | 70 | 5 | 9 | 2 |
| 14 | 70 | 5 | 9 | 6 |
| 15 | 70 | 5 | 15 | 2 |
| 16 | 70 | 5 | 15 | 6 |
| 17 | 60 | 3 | 12 | 0 |
| 18 | 60 | 3 | 12 | 8 |
| 19 | 60 | 3 | 6 | 4 |
| 20 | 60 | 3 | 18 | 4 |
| 21 | 60 | 1 | 12 | 4 |
| 22 | 60 | 7 | 12 | 4 |
| 23 | 40 | 3 | 12 | 4 |
| 24 | 80 | 3 | 12 | 4 |
| 25–30 | 60 | 3 | 12 | 4 |
Table 8.
ANOVA analysis table for response 1: particle size of CaCO3.
| Source | Sum of Squares | df | Mean Square | F-Value | p-Value |
|---|---|---|---|---|---|
| Model | 5.345 × 10⁵ | 7 | 76,351.81 | 11.59 | <0.0001 |
| A-Stirring rate | 26,169.01 | 1 | 26,169.01 | 3.97 | 0.0588 |
| B-Flow rate of CO2 gas | 79,637.76 | 1 | 79,637.76 | 12.09 | 0.0021 |
| C-Amount of ammonia | 47,481.51 | 1 | 47,481.51 | 7.21 | 0.0135 |
| D-Amount of glycerol | 2.286 × 10⁵ | 1 | 2.286 × 10⁵ | 34.70 | <0.0001 |
| BD | 45,956.64 | 1 | 45,956.64 | 6.97 | 0.0149 |
| CD | 54,347.27 | 1 | 54,347.27 | 8.25 | 0.0089 |
| D2 | 52,232.72 | 1 | 52,232.72 | 7.93 | 0.0101 |
| Residual | 1.450 × 10⁵ | 22 | 6589.16 | ||
| Lack of Fit | 1.450 × 10⁵ | 17 | 8527.15 | ||
| Pure Error | 0.0000 | 5 | 0.0000 |
Table 9.
ANOVA analysis table for response 2: CaCO3 Yield.
| Source | Sum of Squares | df | Mean Square | F-Value | p-Value |
|---|---|---|---|---|---|
| Model | 4453.22 | 6 | 742.20 | 385.19 | <0.0001 |
| A-Stirring rate | 2562.67 | 1 | 2562.67 | 1329.97 | <0.0001 |
| B-Flow rate of CO2 gas | 1734.00 | 1 | 1734.00 | 899.91 | <0.0001 |
| C-Amount of ammonia | 0.9600 | 1 | 0.9600 | 0.4982 | 0.4874 |
| D-Amount of glycerol | 0.3151 | 1 | 0.3151 | 0.1635 | 0.6897 |
| AB | 100.00 | 1 | 100.00 | 51.90 | <0.0001 |
| B2 | 55.28 | 1 | 55.28 | 28.69 | <0.0001 |
| Residual | 44.32 | 23 | 1.93 | ||
| Lack of Fit | 44.32 | 18 | 2.46 | ||
| Pure Error | 0.0000 | 5 | 0.0000 |
Table 10.
Biodiesel conversion ANOVA analysis.
| Source | Sum of Squares | df | Mean Square | F-Value | p-Value |
|---|---|---|---|---|---|
| Model | 2246.30 | 8 | 280.79 | 68.16 | <0.0001 |
| E-Reaction Time | 53.76 | 1 | 53.76 | 13.05 | 0.0016 |
| F-Methanol/oil ratio | 671.72 | 1 | 671.72 | 163.06 | <0.0001 |
| G-Catalyst loading | 25.74 | 1 | 25.74 | 6.25 | 0.0208 |
| H-Temperature | 1057.82 | 1 | 1057.82 | 256.78 | <0.0001 |
| FG | 21.49 | 1 | 21.49 | 5.22 | 0.0329 |
| FH | 108.47 | 1 | 108.47 | 26.33 | <0.0001 |
| F2 | 75.35 | 1 | 75.35 | 18.29 | 0.0003 |
| H2 | 259.22 | 1 | 259.22 | 62.92 | <0.0001 |
| Residual | 86.51 | 21 | 4.12 | ||
| Lack of Fit | 86.51 | 16 | 5.41 | ||
| Pure Error | 0.0000 | 5 | 0.0000 |
Table 11.
Optimization results.
| Stirring Rate, rpm | The Flow Rate of CO2 Gas, mL/min | Amount of Ammonia, mL | Amount of Glycerol, mL | The Particle Size of Produced CaCO3, nm | The Yield of CaCO3, % | Desirability |
|---|---|---|---|---|---|---|
| 1300 | 2000 | 15 | 25 | 420.4 | 96.8 | 0.911 |
Table 12.
Optimization results.
| Methanol/Oil Ratio | Temperature, °C | Catalyst Loading, % | Reaction Time, h | Biodiesel Conversion, % | Desirability |
|---|---|---|---|---|---|
| 15 | 56 | 1 | 2.000 | 95.8 | 0.765 |
Table 13.
The optimal biodiesel sample’s physicochemical characteristics.
| Test | Results | Standard Method | EN14214 | ASTM D6751 |
|---|---|---|---|---|
| Calorific value (MJ/kg) | 39.821 | ASTM D-5865 [36] | >32.9 | |
| Flashpoint (°C) | 170 | ASTM D-93 [37] | >101 | >130 |
| Pour point (°C) | −22 | ASTM D-97 [38] | ||
| Density at 15 °C (g/cm3) | 0.8851 | ASTM D-4052 [39] | 0.86–0.9 | |
| Cloud point (°C) | −13 | ASTM D-97 [38] | <−4 | |
| Kinematic viscosity at 40 °C (cSt) | 4.6 | ASTM D-445 [40] | 3.5–5.0 | 1.9–6.0 |
Table 14.
GC results.
| Composition | Results | Specification | |
|---|---|---|---|
| Total FAME | 97.6% | More than 96.5% | |
| Glycerides | Tri- | 0.0856% | Less than 0.2% |
| Di- | 0.0078% | Less than 0.2% | |
| Mono- | 0.0043% | Less than 0.8% | |
| Glycerol | Total | 0.019% | Less than 0.25% |
| Free | 0.01% | Less than 0.02% | |
Table 15.
Comparison of the results of this research and the previous ones.
| Study | Used Catalyst | Catalyst Preparation | Reaction Conditions | Biodiesel Conversion | Reference | |||
|---|---|---|---|---|---|---|---|---|
| Methanol/Oil Ratio | Catalyst Loading | Reaction Temperature | Reaction Time | |||||
| 1 | CaO from Eggshell | Need | 12:1 | 3.5 wt% | 60 °C | 2 h | 92% | [42] |
| 2 | Technical grade CaO | Do not need | 7.1:1 | 5.9 wt% | 65 °C | 2 h | 92.6% | [43] |
| CaO from eggshells | Need | 7:1 | 6 wt% | 65 °C | 2.2 h | 91.4% | ||
| 3 | CaO from Limestone | Need | 6:1 | 5 wt% | 65 °C | 4 h | 86% | [44] |
| 4 | CaO, industrial grade | Do not need | 8.72:1 | 8.75 wt% | 60 °C | 2 h | 98.5% | [45] |
| 5 | Nano-CaO | Do not need | 11:1 | 3.675 wt% | 60 °C | 2 h | 97.61% | [46] |
| 6 | Nano-CaO | Do not need | 15:1 | 5 wt% | 65 ± 2 °C | 3 h | 88.87% | [47] |
| 7 | CaO is Solvay wastewater | Need | 15:1 | 1 wt% | 56 °C | 2 h | 95.8% | (Present work) |
Publisher’s Note: MDPI stays neutral with regard to jurisdictional claims in published maps and institutional affiliations. |
© 2022 by the authors. Licensee MDPI, Basel, Switzerland. This article is an open access article distributed under the terms and conditions of the Creative Commons Attribution (CC BY) license (https://creativecommons.org/licenses/by/4.0/).
Share and Cite
MDPI and ACS Style
Roushdy, M.H.; Bayoumi, R.A. Valuable Biodiesel Catalyst from Solvay Wastewater. Processes 2022, 10, 1042. https://0-doi-org.brum.beds.ac.uk/10.3390/pr10051042
AMA Style
Roushdy MH, Bayoumi RA. Valuable Biodiesel Catalyst from Solvay Wastewater. Processes. 2022; 10(5):1042. https://0-doi-org.brum.beds.ac.uk/10.3390/pr10051042
Chicago/Turabian StyleRoushdy, Mai Hassan, and Rana Adel Bayoumi. 2022. "Valuable Biodiesel Catalyst from Solvay Wastewater" Processes 10, no. 5: 1042. https://0-doi-org.brum.beds.ac.uk/10.3390/pr10051042
Note that from the first issue of 2016, this journal uses article numbers instead of page numbers. See further details here.