Article

Performance Comparison of EGSB and IC Reactors for Treating High-Salt Fatty Acid Organic Production Wastewater

1
Key Laboratory of Industrial Ecological Simulation and Environmental Health in the Yangtze River Basin in Jiangxi Province, Jiujiang University, Jiujiang 332005, China
2
School of Resources Environmental Sciences, Jiujiang University, Jiujiang 332005, China
3
Department of Environmental Engineering, Kunsan National University, Gunsan 54150, Korea
4
Science Environmental Protection Technology Thain Co., Ltd., Jiujiang 332000, China
*
Author to whom correspondence should be addressed.
Submission received: 18 April 2022 / Revised: 21 June 2022 / Accepted: 23 June 2022 / Published: 30 June 2022
(This article belongs to the Special Issue Advances in Water and Wastewater Treatment Processes)

Abstract

:
This study used the EGSB and IC reactors to treat the high-salt and high-concentration organic wastewater (high-salt fatty acid production wastewater) and compared their performances The experimental results showed that the optimal influent water quality thresholds for both bioreactors to treat this wastewater were a COD concentration of 18,000 mg/L and a sulfate ion concentration of about 8000 mg/L. The reactor operated well when C/S was greater than 2.8. In addition, the value of C/S should not be less than 1.5. This is due to that under this condition, the sulfate reduction process has a significant impact on the removal of COD, and MPB may be inhibited by sulfides. The organic load OLR should not be greater than 10 kgCOD/(m3·d). It was also found that the start-up time of the IC reactor with external circulation was slightly shorter, and the COD removal effect, gas production rate, and load tolerance were slightly better than those of the EGSB reactor, the best reflux ratio of the two reactors was 6:1. The appropriate rising flow rate was 0.4 m/h.

1. Introduction

High-salt fatty acid organic production wastewater comes from the production of fatty acid series products. The production process of fatty acid series products is as follows: waste materials from vegetable oil and fat processing plants, i.e., the saponins, are acidified by sulfuric acid to obtain crude fatty acids, and then the crude fatty acids are subjected to continuous medium-pressure hydrolysis and continuous high vacuum distillation to produce high-quality refined fatty acids, stearic acid, and plant pitch. In addition to high-concentration organic substances, such as phospholipids and soaps as well as pollutants such as acids and SS, the production wastewater contains high-concentration salts (mainly sodium sulfate). Generally, the concentrations of pollutants in the wastewater are as follows: the concentration of animal oil and vegetable oil is 100 mg/L, the concentration of COD is 30,000~60,000 mg/L, and the concentration of SS is 1200~3000 mg/L. The pH value is about 3.0, and the salt content is 3~5% (mainly sodium sulfate salt).
Since this wastewater has a BOD/COD (B/C) ratio of 0.4 to 0.45, it is easy to treat using biochemical treatment. The conventional treatment method is pretreatment + biochemical treatment. As a low-cost biotechnology, anaerobic biochemical treatment technology can stably and efficiently remove pollutants at high organic loads, thereby simultaneously achieving the degradation of pollutants and the recovery of resources. It is usually used as a core technology for industrial enterprises with serious environmental problems and insufficient funds [1,2,3].
During the anaerobic digestion of organic wastewater containing high concentrations of sulphate, SRB competes with methane-producing bacteria (MPB) for substrates and inhibits MPB. At the same time, the sulfate produced in the reduction reaction by SRB also has a toxic effect on MPB and other anaerobic bacteria, thus affecting the treatment effect of the anaerobic reactor [4]. For this reason, researchers used a two-phase process to separate the sulfate reduction process from the methane production process to eliminate the impact of SRB on MPB, which makes the process complicated and expensive. With the in-depth research on SRB and the development of anaerobic reactors, researchers and engineers are increasingly interested in using some modern new high-efficiency anaerobic reactors to treat high-sulfate wastewater [5,6,7,8,9,10,11,12,13,14].
Suspension growth reactors, such as expanded granular sludge bed (EGSB) and internal circulation (IC) reactors, rely on a high liquid rising flow rate Vup and a large amount of produced biogas to ensure that the granular sludge is always in a good suspension state. The EGSB and IC reactors take full advantage of mature biological and engineering technologies such as sludge granulation, fluidization, feedback control (reflux), and a large height-to-diameter ratio design. Meanwhile, the performance of granular sludge as a microbial polymer is adjusted according to the operating conditions and treatment load of the reactor, which overcomes the disadvantages of the adhesion growth reactor caused by the fillers, such as easy clogging and larger power consumption. The two reactors have become the typical representatives of the third generation of anaerobic reactors. The structures of the two reactors are shown in Figure 1.
The EGSB reactor was developed based on the upflow anaerobic sludge bed (UASB) reactor. It adds an effluent recirculation part to the structure of the UASB reactor and thus has a much higher rising flow rate than the UASB reactor, which reduces the sludge deposition at the bottom of the UASB and improves the ability to bear the organic load. The higher rising flow rate also ensures the overall mixing of organic matter and granular sludge and strengthens the contact between microorganisms and pollutants, thereby improving the treatment efficiency.
The IC reactor is structurally equivalent to the superposition of two-stage UASB in the vertical direction, so it has two-stage reaction zones and two three-phase separators, which are located in the middle and top of the reactor, respectively. The most important feature of the IC reactor is that it has an independent internal circulation system, i.e., two three-phase separators and the gas–liquid separator at the top are connected through two gas risers, and the gas-liquid separator is connected with the bottom of the reactor through a descending pipe. The biogas produced in the anaerobic digestion process will form a gas stripping effect during the ascent, carrying the mixed liquid in the reactor with it. After reaching the gas–liquid separator at the top, the mixed liquid will flow back to the bottom of the reactor along the descending pipe under the action of gravity, while the gas is discharged with the biogas, forming a powerless internal circulation system
The main characteristics of both reactors are compared in Table 1.
Both EGSB and IC reactors have a similar structure and performance but also have their distinct characteristics. They are both suitable for treating high-concentration organic wastewater. However, there are no or less reported comparative studies on the two reactors in the treatment of the same organic wastewater. High-salt fatty acid organic production wastewater is a type of organic wastewater with a high salt and high concentration, which mainly comes from meat processing wastewater, oil processing wastewater, synthetic fatty acid wastewater, dairy processing wastewater, daily chemical wastewater, etc. In order to explore and compare the treatment effects of EGSB and IC reactors on this type of wastewater, this study took hypersaline fatty acid wastewater as the research object, focused on the startup and operation rules of the two different reactors for treating fatty acid wastewater, and conducted an in-depth comparative analysis of the treatment outcomes of both reactors. Based on the comparison results, the advantages and disadvantages of both reactors for treating high-salt fatty acid wastewater were evaluated. The results can provide a reference for the design selection and operation parameters of the anaerobic reaction.

2. Materials and Methods

2.1. Experimental Device

In this experiment, the EGSB and IC reactors were made of plexiglass, both cylindrical, with a volume of 38 L. The temperature was controlled at 35 ± 5 °C. The combined experimental process of the EGSB reactor and IC reactor is shown in Figure 2.
The experimental water was prepared in the inlet bucket and then passed through 2 (inlet pump), rotameter, and control valve to reach the bottom of the V-shaped inlet of the reactor. The return pipe was located in the sludge settlement area of the reactor, under the three-phase separator and 45 cm away from the outlet pipe. The return water passes through 5 (return pump) and the rotameter, mixes with new water in the water inlet pipe, and enters the reactor. The reactor was connected with a constant-temperature water bath heating device. The surface of the reactor was covered with 8 (insulation materials) to insulate the reactor. The effluent from the reactor flows into 17 (outlet buckets). Depending on its quality, the effluent will be either discarded or used to reconfigure the experimental water.
The part of 12 (water-sealed bottle) in the gas collection device was used to stabilize the voltage and ensure the stability of the three-phase separator. After the gas passes 12, the output of methane gas could be measured through 14 (CO2 absorption bottle), 15 (Mariotte bottle or Markov), and 16 (measuring cylinder), or we could also skip 14 and directly pass 15 and 16 to measure the total gas production.
The inner diameter of the column in the EGSB reaction zone was 160 mm, the thickness of the plexiglass was 10 mm, and the total height was 1.73 m. On both sides of the reactor, there were 5 sample holes with an inner diameter of 10 mm and 4 feed holes with an inner diameter of 50 mm, respectively.
The inner diameter of the column in the IC reaction zone was 200 mm, the thickness of the plexiglass was 10 mm, and the total height was 1.2 m. The IC reaction zone was divided into upper and lower parts. The upper part was the first reaction zone, and the lower part was the second reaction zone. On both sides of the reactor, there were 4 sample holes with an inner diameter of 10 mm and 3 feed holes with an inner diameter of 50 mm, respectively.
External circulation of the analog EGSB reactor was added to the design of the tested IC reactor. The effect of external circulation on IC reactor performance was investigated.
The appearance of the completed EGSB and IC reactor and the combined experimental device is shown in Figure 3.

2.2. Test Water

Test water 1: Artificial glucose was mixed with water, and then urea and potassium dihydrogen phosphate were added to adjust COD:N:P to 500:5:1. Simultaneously, the trace elements such as Ca2+, Mg2+, Fe2+, Fe2+, Co2+, Mn2+, and Ni2+ were added. Meanwhile, NaHCO3 was added to the water to adjust the pH of the solution to the range of 6.5~7.5.
Test water 2: The wastewater came from the biochemical adjustment tank of the production department of an enterprise. The main water quality index is shown in Table 2.
NaHCO3 solution was used to adjust the pH of the influent to the range of 6.5~7.5.
According to different water quality requirements of the experimental program, test water 2 (diluted and dissolved in a certain amount of Na2SO4 to form raw wastewater with different salt contents) or test water 1 (changed the ratio of glucose and dissolved in a certain amount of Na2SO4 to form raw wastewater with different salt contents) was used.

2.3. Seeding Sludge

The anaerobic biological filter granular sludge in the sewage treatment plant of Jinshawan Industrial Park, Hukou District, Jiujiang City, Jiangxi was used as the seeding sludge. The seeding sludge was dark brown. The volatile suspended solids (VSS) concentration of the seeding sludge was 44.7 g/L, and the total suspended solids (TSS) concentration was 59.4 g/L.
Before seeding, the sludge particles were screened and washed, and then rinsed and activated with artificial water with a COD concentration of about 22,000 mg·L−1 and a SO42− concentration of about 8000 mg/L. The amount of seeding sludge in both reactors was 16 L.

2.4. Analysis Method

The COD, salinity (SO42−), pH, volatile fatty acid (VFA), and temperature of the influent and effluent of the reactor were continuously measured on a daily basis. The monitoring system was used to record the flow rate of inlet water and circulation amount in each stage every other day. The microbial community structure and morphology of the sludge were analyzed.
The COD was measured by the potassium dichromate method (GB11914-89); the VFA was measured by the titration method; the SS sludge concentration was measured by the gravimetric method; the salt content was measured by the gravimetric method; the methane content was measured by the alkali absorption method, and the pH was measured by an acidimeter. The microbial community structure was measured by high-throughput sequencing.

2.5. Experiment Procedure

2.5.1. Domestication of Salt-Tolerant Sludge

The seeding anaerobic granular sludge should occupy about 2/5~3/5 of the volume of the reactor. The sludge and glucose were added at the same time, and 10 kg of glucose was mixed with a ton of sludge. In addition, urea and sodium dihydrogen phosphate were added at 1/20 and 1/100 of glucose, respectively. Before the test, the salt-tolerant activated sludge was cultivated and domesticated by the raw water of wastewater (COD: 22,000 mg/L, sulfate ion: 8000 mg/L) collected from the biochemical regulating tank of an enterprise for 9 days (From 23 October 2020 to 1 November 2020), and sodium bicarbonate was used to adjust the pH. The soaking water was changed every two days. After the seeding sludge adapted to the quality of the wastewater, it was fed into the reactor. The concentration of sludge was controlled between 10,000 and 22,000 mg/L.
A certain amount of Na2SO4 and the wastewater collected from the biochemical adjustment tank of an enterprise were used to prepare raw water with a salt content of 8000 mg/L.

2.5.2. Start-up Period

The length of the start-up period is an important indicator of reactor performance. The entire start-up process includes an adaptation phase, a load increase phase, and a stable phase. The start-up test lasted for 42 days (3 November to 14 December 2020), and the pH of the inlet water was 7.5 ± 0.1. The HRT was maintained for 38 h. In this process, we investigated the influence of the influent water quality on the reactor and the influence of external circulation on the IC reactor and compared the performance of both reactors The specific experimental parameters are shown in Table 3.

2.5.3. Reactor Performance under Stable-Load and High-Load Operating Conditions

In order to further investigate the performance of the EGSB and IC reactors under stable-load and high-load operating conditions, experiments were conducted for a total of 48 days (From 15 December 2020 to 1 February 2021) during the stable- and high-load operations of the reactors. During this period, we investigated the impact of different values of C/S and different values of reflux ratio R on the performance of the reactor and compared the performance of both reactors. The specific experimental parameters are shown in Table 4.

3. Results and Discussion

3.1. Effect of Influent Water Quality on COD Removal and the Comparison of Two Reactors

The inlet water quality, outlet water quality, and COD removal rate of the EGSB reactor and IC reactor are shown in Figure 4. Due to the use of anaerobic sludge inoculation, both reactors started up quickly. Five days before the initial start-up of the reactor, the COD in the inlet and outlet water did not have obvious changes. The COD removal rate of the IC reactor (14.10~36.72%) was slightly lower than that of the EGSB reactor (18.24~41.47%). The reason may be that the EGSB reactor runs the external circulation during this period, while the IC reactor has no external circulation. After the IC reactor started the external circulation on the 6th day, the COD removal rate of the IC reactor began to be slightly higher than that of the EGSB reactor. On the 11th day, the IC reactor internal circulation was established, and on the 24th day, the COD removal rate of the IC reactor was increased to above 90% The COD removal rate of the EGSB reactor was increased to around 90% on the 27th day. In the later period, due to the simultaneous action of the external circulation and internal circulation of the IC reactor, it had a slightly higher effect than the EGSB reactor.

3.2. Influence of Organic Load on COD Removal Rate and the Comparison of Two Reactors

Variations in organic loading rate (OLR) have a significant impact on the microbial community structure and operation efficiency of the system [15] and can affect the COD removal rate [16]. As shown in Figure 5, the volumetric load was increased by gradually increasing the influent flow rate and the influent COD concentration. With the increase in operating time, the influent COD load was gradually increased from the initial value of 3.47 kgCOD/(m3·d) to the highest value of 11.37 kgCOD/(m3·d). The sludge can quickly adapt to the increase in the volumetric load. As the influent load increased, the COD removal rate gradually increased and stabilized when the COD load was 8~10 kgCOD/(m3·d). Under the same COD concentration of influent water, the effluent COD concentration of the EGSB reactor was higher than that of the IC reactor; therefore, the IC reactor had slightly better COD removal performance than the EGSB reactor. After the COD load reached 10 kgCOD/(m3·d), the removal rate of the two reactors decreased obviously. In particular, when the COD load increased to 11.37 kgCOD/(m3·d), the performance of both reactors dropped sharply. Overall, the COD concentration in the effluent of the IC reactor was slightly lower than that of the EGSB reactor, indicating that the COD removal rate of the IC reactor was higher than that of the EGSB reactor and the load-bearing performance of the IC reactor was slightly better than the EGSB reactor.

3.3. Influence of COD/ S O 4 2 on COD Removal Rate and the Comparison of Two Reactors

COD/SO42− is an important factor affecting the anaerobic digestion process [17,18,19,20,21,22] and plays a decisive role in the substrate competition between sulfate-reducing bacteria (SRB) and methane-producing bacteria (MPB) in the system. Moreover, the sulfate reduction product, sulfide, has a toxic effect on MPB, inhibits the normal metabolism of MPB, and reduces the removal efficiency of COD. Studies have shown that the substrate competition effect of SRB on MPB in the anaerobic digestion process is mainly determined by the COD/ S O 4 2 value of the influent. However, under different conditions such as carbon source, the pH value, sludge morphology, and the values of COD/ S O 4 2 are also different.
From Figure 6, when the influent C/S changed from 2.8 to 3.75, the COD removal rate did not change much. The COD removal rate of the EGSB reactor was maintained above 75.1%, and the COD removal rate of the IC reactor was maintained above 80.3%. When the influent C/S dropped to 1.5 and below 1.5, the COD concentration of the effluent from the two reactors gradually increased. The COD concentration of the effluent from the EGSB and IC reactors can reach 9357 mg/L and 5321 mg/L, respectively. The COD removal rate dropped to 48.32% and 70.76%, indicating that the sulfate reduction process had a significant impact on the removal of COD under this condition. In addition, MPB may be inhibited by sulfides. Especially, when the C/S dropped to below 1.0, the reactor began to show obvious signs of deterioration, indicating that when the C/S was less than one, the reactor could no longer maintain stable and efficient COD removal performance. This was similar to the report by Firmino et al. [23], which stated that in the UASB reactor using ethanol as the carbon source, the C/S decreased from 5.2 to 2.4 and 0.8, and the average COD removal rate decreased from 91.8% to 81% and 72.5% [23]. In addition, in the treatment of UASB with mixed carbon sources of acetic acid and hexanol, when the C/S decreased from 20 to 0.5, the COD removal rate decreased slightly from 89.1% to 79.2% [24]. However, some studies found that when the UASB was used to treat starch wastewater, the reduction of C/S from 10 to 0.5 had no effect on the removal performance of COD, and the removal rate was always maintained at about 80% [25]. In these three reports, the influent COD concentration was generally low (1000~3000 mg/L). In this study, when the C/S was as low as 0.8, the COD removal performance deteriorated rapidly and the COD removal rates of these two reactors were only about 48.32% and 70.76%, respectively. This may be related to the higher influent COD concentration. The influent COD concentration was in the range of 11,000~18,000 mg/L. Under a higher organic load, the reactor was more susceptible to the influence of operating parameters. The IC reactor had a higher tolerance than the EGSB reactor.

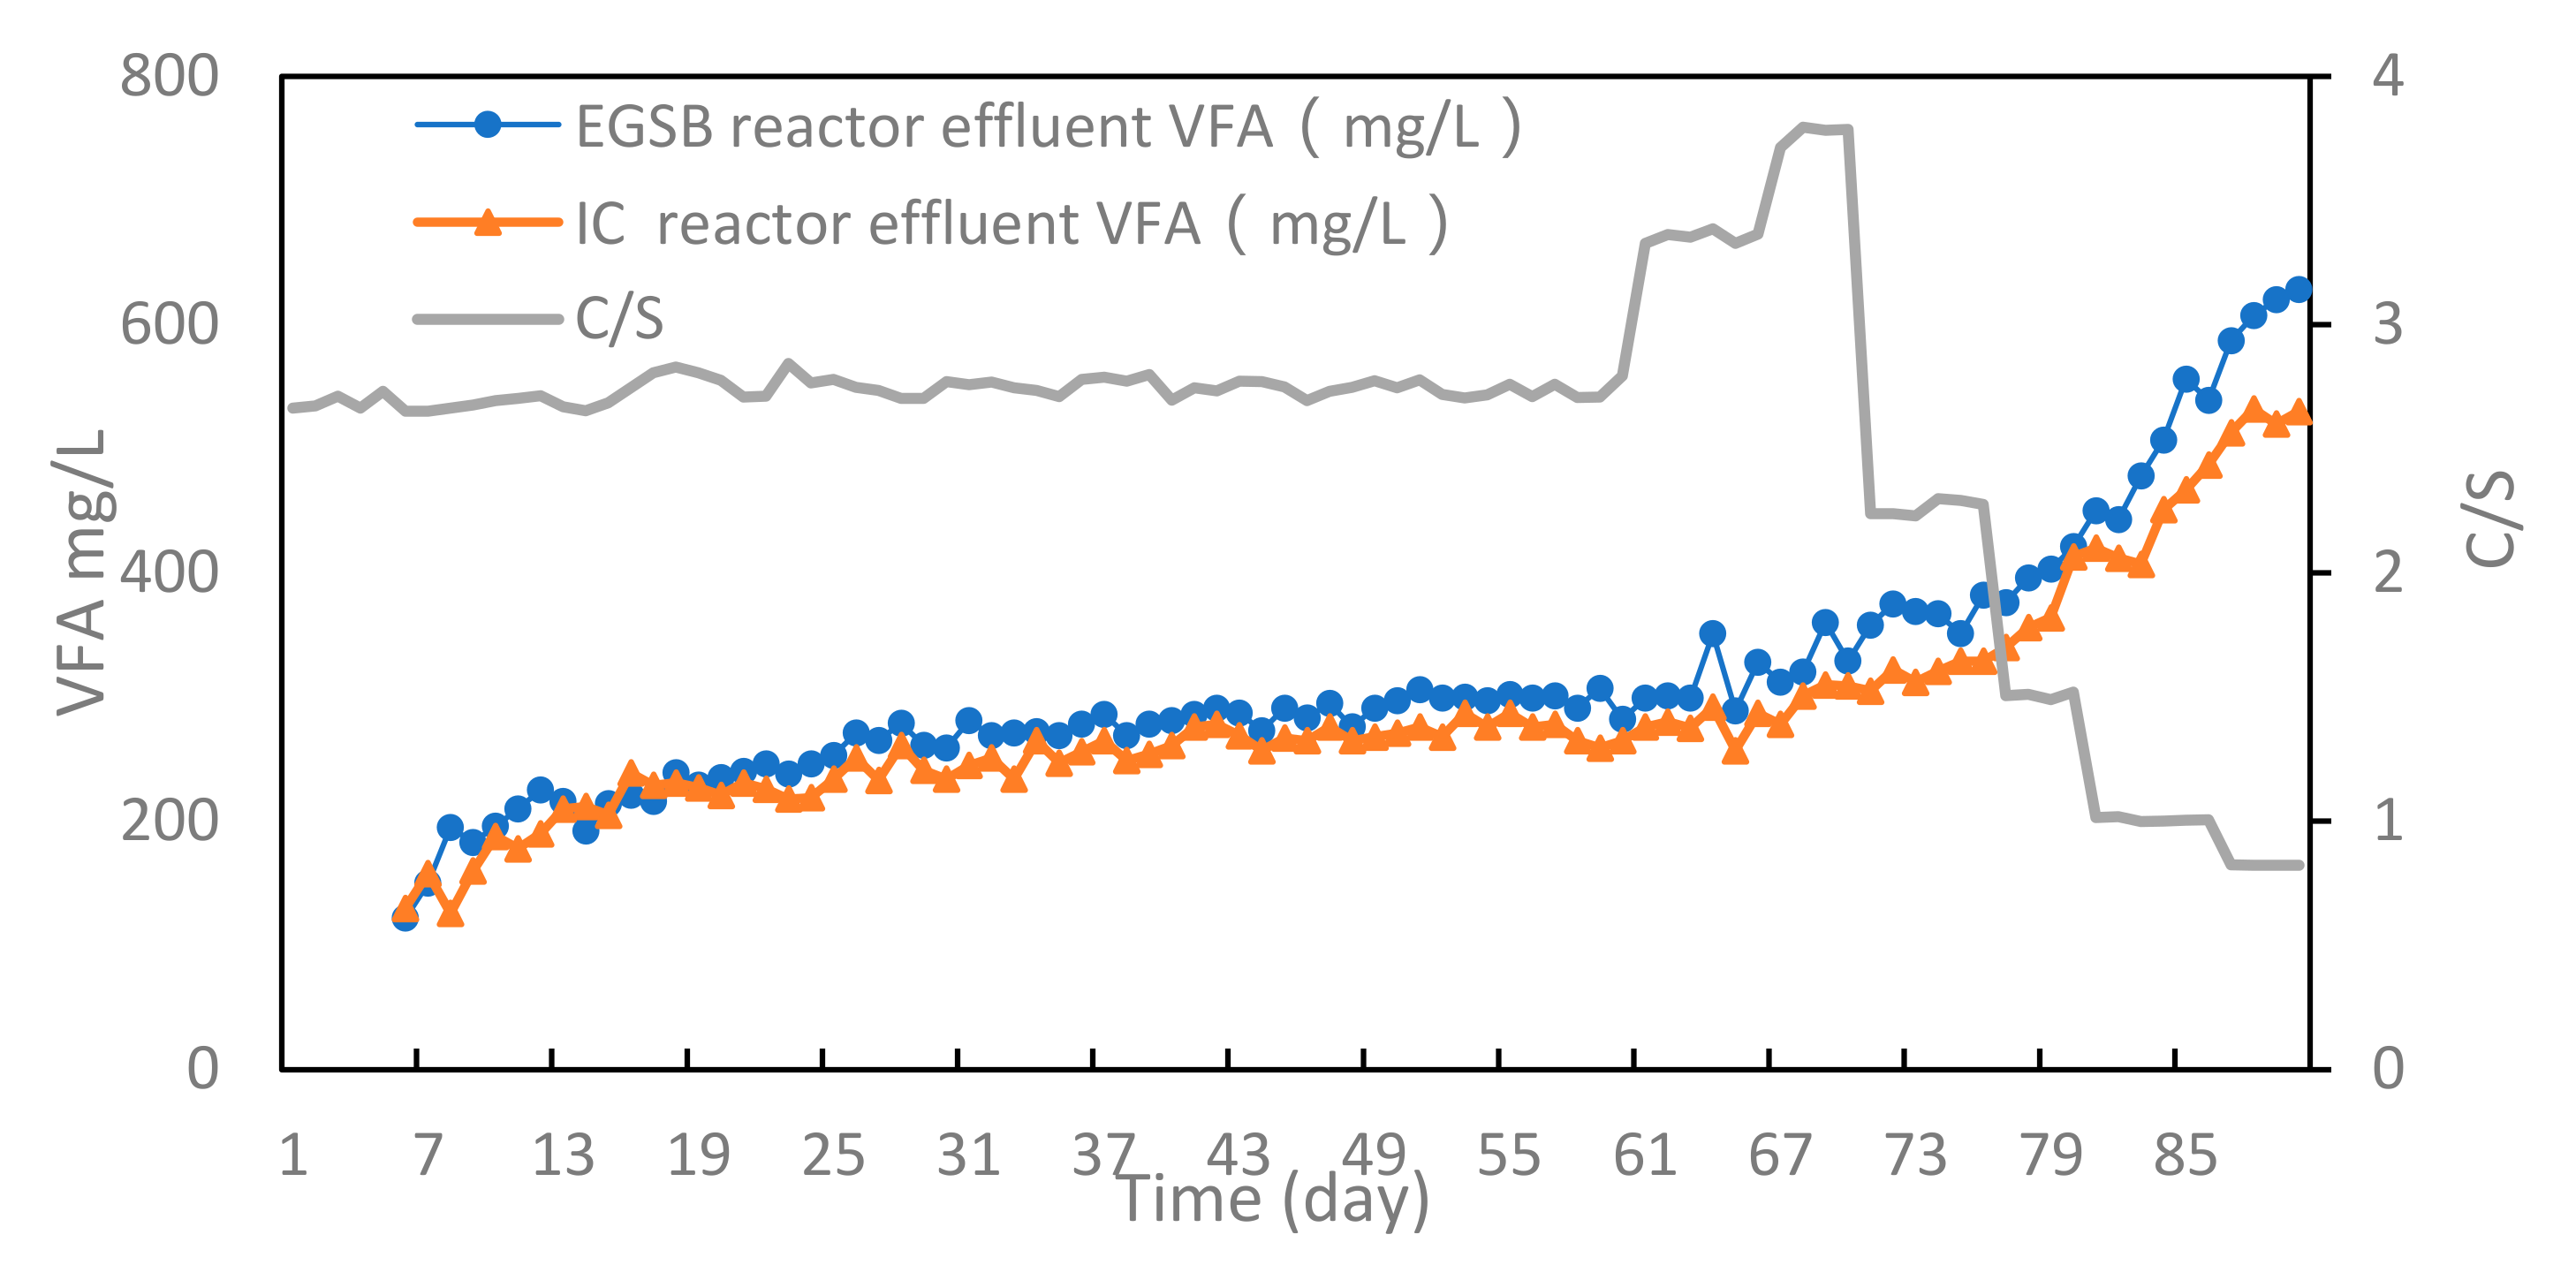
3.4. Changes of pH and VFA of Reactor Effluent and the Comparison of Two Reactors

pH and VFA are important to control parameters of the anaerobic reactor, which can reflect the actual operating conditions of the reactor.
Figure 7 shows the change in effluent pH during the operation of two reactors. Due to the low pH of the influent water in the experiment and the salt in the wastewater was mainly sodium sulfate, lime was used instead of NaHCO3 or NaOH as a neutralizer to remove part of the sulfate ions without adding the sodium salt. After the neutralization reaction and precipitation, the supernatant was used as the inlet water of the reaction tower, and the pH of the inlet water was adjusted to 7~8 to make the reactor operate normally. At the initial stage of reactor startup, the pH of the effluent was relatively stable, with the highest value of 8.4. After 40 days, the pH of the effluent dropped, which may be caused by the increase in volume load. After 60 days of operation, the lowest pH of the EGSB reactor effluent was 5.5, and the lowest pH of the IC reactor effluent was 6.
It can be seen from Figure 7 that in the later stage, there was a continuous decrease in the pH of water effluent, from 8.2 and 8.4 to below 5.5 and 6. This result indicated that the alkalinity produced by sulfate reduction at this time can no longer compensate for the alkalinity loss caused by the reduction of influent hydroxide ions. As a result, it cannot provide sufficient pH buffering capacity. When the C/S dropped to 0.8, a significant drop in effluent pH can also be observed. Therefore, the changes in effluent pH and COD were synchronized. The IC reactor had better tolerance than the EGSB reactor.
This synchronization can be explained by the change in the effluent VFA (see Figure 8). When the reactor increased the feedwater load of a stage, the VFA increased to varying degrees. From Figure 8, it can be seen that except for the initial stage, when C/S ≥ 2.8 (stages I-VI), the effluent VFA was always maintained at a very low level (<352 mg/L). When the value of C/S dropped to 1.5, there was a significant accumulation of acetic acid, which directly led to an increase in effluent COD (Figure 6) and a decrease in pH (Figure 7). When the value of C/S dropped to 0.8, the acetic acid in the effluent accumulated rapidly, reaching around 628 mg/L and 530 mg/L or more in about 15 days. This further led to the increase of effluent COD and the decrease in pH. Therefore, when the C/S was 0.8, the utilization of acetic acid was severely inhibited. According to the reports by Hu and O’Reilly et al., at a low C/S, the acetic acid was still mainly used by MPB. SRB does not have an advantage in the competition with MPB for acetic acid, and it does not even use acetic acid as a substrate for sulfate reduction [24]. Jing et al. found in batch experiments that when acetic acid was used as the substrate, although no sulfate reduction reaction occurred, the addition of sulfate reduced the methanogenic activity by 45.6% [4]. Therefore, when the C/S was 0.8, the deterioration of the reactor performance was related to the influence of the methanation process of acetic acid. When the C/S was below 0.8, methanogenic bacteria were suppressed and sulfur-producing bacteria were dominant, and the resulting large amount of hydrogen sulfide could impact the activated sludge in the tower, causing poisoning or even death, thus also affecting the COD removal of the reactor tower.

3.5. Relationship between Gas Production Rate and Load and the Comparison of Two Reactors

The influence of influent COD on the gas production rate of the two reactors is shown in Figure 9. From the figure, with the operation of the reactor, the influent COD increased, the sludge activity gradually increased, and the gas production rate gradually increased (Figure 9). When the COD gradually increased from 5500 mg/L to 18,000 mg/L, the gas production rate of EGSB and IC reactors gradually increased from 0.25 L/L·d and 0.22 L/L·d to 3.02 L/L·d and 4.58 L/L·d, respectively. When the COD was increased from 7500 mg/L to 11,000 mg/L and from 13,200 mg/L to 16,000 mg/L, the gas production rate had the most significant increase. When the COD was 18,000 mg/L, the gas production rate reached the peak values, which were 5.16 L/L·d and 5.61 L/L·d for the IC reactor and the EGSB reactor, respectively. The overall gas production rate of the IC reactor was slightly higher than that of the EGSB reactor.
Using the regression analysis method, the relationship between gas production rate and volume load was fitted with a second-order polynomial regression (see Figure 10), which can be expressed as:
Y = −0.0363x2 + 1.0885x − 2.8528 (R2 = 0.9749)
From the above formula and Figure 10, it can be seen that as the volume load increased, the gas production rate first increased and then gradually became flat. There was a significant correlation between the gas production rate and the volume load, and the correlation coefficient was R2 = 0.9749.

3.6. Effect of Reflux on COD Removal and the Comparison of Two Reactors

According to the experimental results (see Figure 11), when the reflux ratio (R) of the EGSB reactor changed from three to six, the COD removal rate increased steadily. When R reached seven, the water flow rate in the tower increased, causing part of the granular sludge to be impacted and dispersed into flocculent sludge. As a result, part of the deposited sludge was converted into suspended sludge, the stratification effect inside the reactor became worse, and the removal rate of COD started to decrease. When the reflux ratio R of the IC reactor changed from three to five, the COD removal rate increased steadily. When R increased to 6~7, the COD removal rate started to decrease.
The relationship between the reflux ratio and the liquid flow rate in the reaction zone was obtained, as shown in Figure 12. After the external circulation was started, the rising flow rate of the liquid in the IC reactor with the added external circulation was the same as that of the EGSB reactor under the same reflux ratio (In normal operation, the IC internal circulation volume can be considered as 3~5 times of the water intake). As shown in Figure 12b, at the same reflux ratio, the rising flow rate of the IC reactor liquid without external circulation was only half of that of the EGSB reactor liquid.
This upwardly decreasing flow rate gradient in the IC reactor with the added external circulation is one of the important guarantees for a fast start-up. On the one hand, it maintains a sufficiently strong mass transfer in the lower reaction zone; on the other hand, it avoids the problem of sludge loss under high mass transfer. Experiments have shown that the hydraulic rising flow rate in the reaction zone should be controlled at 0.4 m·h−1 during the start-up period. If the hydraulic rising flow rate is too low, the best mass transfer effect cannot be achieved; if the rising flow rate is too high, it will easily cause a large amount of sludge loss.
Through comprehensive analysis, the main reason why the EGSB and IC reactors can treat high salinity ( S O 4 2 : 8000~10,000 mg/L) in this experiment is that, through reflux, the liquid in the reactor can reach a complete mixing state, thus reducing the impact of the influent load and acidic load. Through the reflux disturbance, the H2S generated in the reduction process can diffuse from the sediment sludge layer to the water outlet area, thereby reducing the toxic effect of H2S on the activated sludge. Furthermore, a higher rising flow rate can improve the contact opportunity between the activated sludge and influent water, thereby ensuring the mass transfer efficiency between microorganisms and pollutants. In addition, the rising flow is a necessary condition for the formation of granular sludge in the reactor. Due to the traction and hydraulic screening in the height direction, the irregular rotational motion of microparticles in the sludge bed creates a favorable external environment for the formation of granular sludge.

3.7. Changes in Microbial Community Structure and Function and the Comparison of Two Reactors

Due to inadequate preparation for the test, the activated sludge from both reactors was taken for microbial community structure analysis after 90 days of the test. Figure 13 shows the histogram of the relative abundance of activated sludge microbial community structure in the EGSB and IC reactors. Figure 14 shows the heat map of the abundance of activated sludge microbial community structures in both reactors. From the figures, it can be found that Chloroflexi was the majority in both reactors, and its content was slightly higher in the IC reactor than in the EGSB reactor. Proteobacteria, which can perform sulfate reductions in an acidic environment, had low proportions in both reactors, while Firmicutes were dominant in the EGSB reactor. Since the sulfate concentration in the final stage of the reaction, i.e., stage IX, reached 18,000~22,000 mg/L, the Proteobacteria that could play a sulfate reduction effect in an acidic environment was not the majority in the activated sludge, the treatment threshold was lowered, and the removal rates of both reactors were severely reduced.

3.8. Comparison of Sludge Morphology

In the experiment, we observed that the EGSB sludge was denser, and the IC tower sludge was relatively thinner and appeared in liquid, as shown in Figure 15. The relationship between sludge density and particle diameter has not been fully determined. It is generally believed that as the diameter increases, the density of sludge decreases [26,27,28,29,30,31]. The porosity of the particles was between 40~80%. The porosity of small particles was high, and the porosity of large sludge was low. In addition, the small sludge had a stronger vitality. This result was consistent with the higher activity of the IC reactor in the experiment.
Figure 16 shows the changes in sludge concentration in both reactors. From the figure, it can be seen that with the increase of the influent COD concentration, the concentration of the mixed liquid suspended solids (MLSS) in the reactor gradually increased, indicating that microorganisms used carbon sources to grow and synthesized themselves. As the biomass grew, microorganisms degraded the COD. The sludge load affected the formation of granular sludge. A higher sludge load can provide sufficient nutrition for microorganisms and promote their reproduction so that the sludge particles contain more microbial cells and keep increasing. However, at the end of stage VIII, when the C/S ratio decreased, the sludge concentration decreased, indicating that part of the sludge was poisoned due to high salinity. The sludge concentration in the IC reactor was slightly higher than that in the EGSB reactor.

4. Conclusions and Recommendations

4.1. Conclusions

(1)
In the actual treatment of high-salt fatty acid production wastewater, the optimal influent water quality threshold for EGSB and IC anaerobic bioreactors was a COD concentration of 18,000 mg/L and a sulfate ion concentration in the salinity of about 8000 mg/L. When the C/S was greater than 2.8, the reactors operated well. In addition, the value of C/S should not be less than 1.5. The reason is that under this condition, the sulfate reduction process has a significant impact on the removal of COD, and MPB may be inhibited by sulfides. The organic load OLR should not be greater than 10 kgCOD/(m3·d).
(2)
The IC reactor with external circulation had a slightly shorter start-up time and a slightly better COD removal effect, gas production rate, and load resistance. The best reflux ratio of the two reactors was 6:1. The appropriate rising flow rate was 0.4 m/h.
(3)
For the selection of anaerobic reactors for high-salt fatty acid production wastewater, there was no major difference in performance between the EGSB and IC reactors. The IC reactor performed slightly better than the EGSB reactor due to its double-layer UASB structure.

4.2. Recommendations

The height-to-diameter ratio of the EGSB reactor is too large compared to the IC reactor (Table 1), which is detrimental to reactor production and construction installation. In addition, power consumption is huge. The IC reactor needs to be equipped with an external circulation. Overall, it is recommended to use the EGSB or IC reactor in cases with a high COD concentration and treatment capacity requirements.

Author Contributions

Conceptualization, Q.L.; Data curation, W.J.; Formal analysis, Z.Y. and W.J.; Investigation, B.-g.J., S.L. and X.X.; Methodology, Q.L.; Project administration, Q.L.; Software, S.L. and Z.Y.; Validation, X.X.; Writing—original draft, Q.L.; Writing, review and editing, Q.L. All authors have read and agreed to the published version of the manuscript.

Funding

This research received no external funding.

Institutional Review Board Statement

Not applicable.

Informed Consent Statement

Not applicable.

Data Availability Statement

The data presented in this study are available in the article.

Conflicts of Interest

The authors declare no conflict of interest.

Abbreviations

EGSBexpanded granular sludge bed
ICinternal circulation
UASBupflow anaerobic sludge bed
CODchemical oxygen demand
VFAvolatile fatty acid
SSsuspended solids
HRThydraulic retention time
OLRorganic loading rate
C/SCOD/ S O 4 2
SRBsulfate-reducing bacteria
MPBmethane-producing bacteria
Rreflux

References

  1. Kong, Z.; Li, L.; Xue, Y.; Yang, M.; Li, Y.Y. Challenges and prospects for the anaerobic treatment of chemical-industrial organic wastewater: A review. J. Clean. Prod. 2019, 231, 913–927. [Google Scholar] [CrossRef]
  2. Xu, D.; Liu, J.; Ma, T.; Zhao, X.; Ma, H.; Li, J. Coupling of sponge fillers and two-zone clarifiers for granular sludge in an integrated oxidation ditch. Environ. Technol. Innov. 2022, 26, 102264. [Google Scholar] [CrossRef]
  3. Dai, L.; Wang, Z.; Guo, T.; Hu, L.; Chen, Y.; Chen, C.; Yu, G.; Ma, L.Q.; Chen, J. Pollution characteristics and source analysis of microplastics in the Qiantang River in southeastern China. Chemosphere 2022, 293, 133576. [Google Scholar] [CrossRef]
  4. Jing, Z.Q.; Hu, Y.; Niu, Q.G.; Liu, Y.Y.; Li, Y.Y.; Wang, X.C.C. UASB performance and electron competition between 61methane-producing archaea and sulfate-reducing bacteria in treating sulfate-rich wastewater containing ethanol and acetate. Bioresour. Technol. 2013, 137, 349–357. [Google Scholar] [CrossRef]
  5. Sarti, A.; Zaiat, M. Anaerobic treatment of sulfate-rich wastewater in an anaerobic sequential batch reactor (AnSBR) using butanol as the carbon source. J. Environ. Manag. 2011, 92, 1537–1541. [Google Scholar] [CrossRef]
  6. Li, J.; Wang, J.; Luan, Z.K.; Ji, Z.G.; Yu, L. Biological sulfate removal from acrylic fiber manufacturing wastewater using a two-stage UASB. Environ. Sci. 2012, 24, 343–350. [Google Scholar] [CrossRef]
  7. Delforno, T.P.; Moura, A.G.L.; Okada, D.Y.; Varesche, M.B.A. Effect of biomass adaptation to the degradation of anionic surfactants in laundry wastewater using EGSB reactors. Bioresour. Technol. 2014, 154, 114–121. [Google Scholar] [CrossRef] [Green Version]
  8. Luo, G.; Li, J.; Li, Y.; Wang, Z.; Li, W.T.; Li, A.M. Performance behaviors and microbial community of circulation anaerobic treating wastewater with high organic loading rate: Role of external hydraulic circulation. Bioresour. Technol. 2016, 222, 470–477. [Google Scholar] [CrossRef] [PubMed]
  9. Chen, X.G.; Wang, Y.; Wang, Z.Y.; Liu, S. Efficient treatment of traditional Chinese pharmaceutical wastewater using a pilot-scale spiral symmetry stream anaerobic bioreactor compared with internal circulation reactor. Chemosphere 2019, 228, 437–443. [Google Scholar] [CrossRef]
  10. Wang, G.; Liu, D.; Fan, S.; Li, Z.; Su, J. High-k erbium oxide film prepared by sol-gel method for low-voltage thin-film transistor. Nanotechnology 2021, 32, 215202. [Google Scholar] [CrossRef]
  11. Hu, M.; Wang, Y.; Yan, Z.; Zhao, G.; Zhao, Y.; Xia, L.; Cheng, B.; Di, Y.; Zhuang, X. Hierarchical dual-nanonet of polymer nanofibers and supramolecular nanofibrils for air filtration with a high filtration efficiency, low air resistance and high moisture permeation. J. Mater. Chem. A 2021, 9, 14093–14100. [Google Scholar] [CrossRef]
  12. Muñoz Sierra, J.D.; Oosterkamp, M.J.; Wang, W.; Spanjers, H.; van Lier, J.B. Comparative performance of upflow anaerobic sludge blanket reactor and anaerobic membrane bioreactor treating phenolic wastewater: Overcoming high salinity. Chem. Eng. J. 2019, 366, 480–490. [Google Scholar] [CrossRef]
  13. Bhuyan, S.C.; Swain, A.K.; Sahoo, A.; Bhuyan, S.K. Nutrient (sulphate) removal from wastewater in inverse fluidized bed biofilm reactor. Mater. Today Proc. 2020, 33 Pt 8, 5476–5480. [Google Scholar] [CrossRef]
  14. Foglia, A.; Akyol, C.; Frison, N.; Katsou, E.; Eusebi, A.L.; Fatone, F. Long-term operation of a pilot-scale anaerobic membrane bioreactor (AnMBR) treating high salinity low loaded municipal wastewater in real environment. Sep. Purif. Technol. 2019, 236, 116279. [Google Scholar] [CrossRef]
  15. Liu, J.; Wang, C.; Wu, K.; Huang, L.; Tang, Z.; Zhang, C.; Zhang, W. Novel start-up process for the efficient degradation of high COD wastewater with up-flow anaerobic sludge blanket technology and a modified internal circulation reactor. Bioresour. Technol. 2020, 123300, 308. [Google Scholar] [CrossRef]
  16. Kang, W.; Chai, H.; Yang, S.; Du, G.; Zhou, J.; He, Q. Influence of organic loading rate on integrated bioreactor treating hypersaline mustard wastewater. Biotechnol. Appl. Biochem. 2015, 63, 590–594. [Google Scholar] [CrossRef]
  17. Lin, X.; Lu, K.; Hardison, A.K.; Liu, Z.; Xu, X.; Gao, D.; Gong, J.; Gardner, W.S. Membrane inlet mass spectrometry method (REOX/MIMS) to measure 15N-nitrate in isotope-enrichment experiments. Ecol. Indic. 2021, 126, 107639. [Google Scholar] [CrossRef]
  18. Yan, W.; Cao, M.; Fan, S.; Liu, X.; Liu, T.; Li, H.; Su, J. Multi-yolk ZnSe/2(CoSe2)@NC heterostructures confined in N-doped carbon shell for high-efficient sodium-ion storage. Compos. Part B Eng. 2021, 213, 108732. [Google Scholar] [CrossRef]
  19. Ge, D.; Yuan, H.; Xiao, J.; Zhu, N. Insight into the enhanced sludge dewaterability by tannic acid conditioning and pH regulation. Sci. Total Environ. 2019, 679, 298–306. [Google Scholar] [CrossRef]
  20. Zhang, L.; Wang, L.; Zhang, Y.; Wang, D.; Guo, J.; Zhang, M.; Li, Y. The performance of electrode ultrafiltration membrane bioreactor in treating cosmetics wastewater and its anti-fouling properties. Environ. Res. 2022, 206, 112629. [Google Scholar] [CrossRef]
  21. Yan, W.; Liang, K.; Chi, Z.; Liu, T.; Cao, M.; Fan, S.; Xu, T.; Liu, T.; Su, J. Litchi-like structured MnCo2S4@C as a high capacity and long-cycling time anode for lithium-ion batteries. Electrochim. Acta 2021, 376, 138035. [Google Scholar] [CrossRef]
  22. O’Flaherty, V.; Lens, P.; Leahy, B.; Colleran, E. Long-term competition between sulphate-reducing and methane-producing bacteria during full-scale anaerobic treatment of citric acid production wastewater. Water Res. 1998, 32, 815–825. [Google Scholar] [CrossRef]
  23. Firmino, P.L.M.; Farias, R.S.; Buarque, P.M.C.; Costa, M.C.; Rodriguez, E.; Lopes, A.C.; dos Santos, A.B. Engineering and microbiological aspecfis of BTEX removal in bioreactors under sulfate-reducing conditions. Chem. Eng. J. 2015, 260, 503–512. [Google Scholar] [CrossRef]
  24. Hu, Y.; Jing, Z.Q.; Sudo, Y.; Niu, Q.G.; Du, J.R.; Wu, J.; Li, Y.Y. Effect of influent COD/SO42− ratios on UASB of a synthetic sulfate-containing wastewater. Chemosphere 2015, 130, 24–33. [Google Scholar] [CrossRef] [PubMed]
  25. Lu, X.Q.; Zhen, G.Y.; Ni, J.L.; Hojo, T.; Kubota, K.; Li, Y.Y. Effect of influent COD/S042− ratios on biodegradation behaviors of starch wastewater in an upflow anaerobic sludge blanket (UASB) reactor. Bioresour. Technol. 2016, 214, 175–183. [Google Scholar] [CrossRef] [PubMed]
  26. Guan, Q.; Zeng, G.; Song, J.; Liu, C.; Wang, Z.; Wu, S. Ultrasonic power combined with seed materials for recovery of phosphorus from swine wastewater via struvite crystallization process. J. Environ. Manag. 2021, 293, 112961. [Google Scholar] [CrossRef] [PubMed]
  27. Fang, X.; Wang, Q.; Wang, J.; Xiang, Y.; Wu, Y.; Zhang, Y. Employing extreme value theory to establish nutrient criteria in bay waters: A case study of Xiangshan Bay. J. Hydrol. 2021, 603, 127146. [Google Scholar] [CrossRef]
  28. Xu, W.J. Study on the Flow Characteristics and the Wastewater Treatment Performance in the Modified Internal Circulation Reactor. Master’s Thesis, Zhejiang University of Technology, Hangzhou, China, 2014. [Google Scholar]
  29. Liu, W.; Huang, F.; Liao, Y.; Zhang, J.; Ren, G.; Zhuang, Z.; Zhen, J.; Lin, Z.; Wang, C. Treatment of CrVI-containing Mg(OH)2 nanowaste. Angew. Chem. 2008, 47, 5619–5622. [Google Scholar] [CrossRef]
  30. Liu, W.; Zheng, J.; Ou, X.; Liu, X.; Song, Y.; Tian, C.; Rong, W.; Shi, Z.; Dang, Z.; Lin, Z. Effective extraction of Cr(VI) from hazardous gypsum sludge via controlling the phase transformation and chromium species. Environ. Sci. Technol. 2018, 52, 13336–13342. [Google Scholar] [CrossRef]
  31. Zhang, L.; Xu, Y.; Liu, H.; Li, Y.; You, S.; Zhao, J.; Zhang, J. Effects of coexisting Na+, Mg2+ and Fe3+ on nitrogen and phosphorus removal and sludge properties using A2O process. J. Water Process Eng. 2021, 44, 102368. [Google Scholar] [CrossRef]
Figure 1. Structural diagram of EGSB and IC reactors ((a) EGSB, (b) IC).
Processes 10 01295 g001
Figure 2. Flow chart of the combined experimental device of EGSB reactor and IC reactor. (a) EGSB, (b) IC. 1. Inlet bucket; 2. inlet pump; 3. rotor flowmeter; 4. control valve; 5. reflux pump; 6. sampling port; 7. feed port; 8. insulation material; 9a. sludge bed area; 9b. the first reaction zone; 10a. sludge settlement area; 10b. the second reaction zone; 11. three-phase separator; 12. water sealed bottle; 13. valve; 14. CO2 absorption bottle; 15. Markov bottle; 16. graduated cylinder; 17. outlet bucket.
Processes 10 01295 g002
Figure 3. Appearance of the experimental device. (a) EGSB reactor. (b) IC reactor. (c) Combined experimental device.
Processes 10 01295 g003
Figure 4. Relationship between the quality of influent water and the removal of COD in the two reactors.
Processes 10 01295 g004
Figure 5. Relationship between organic load and reactor COD removal rate. (a) Relationship between OLR and COD concentration of reactor effluent and the comparison of two reactors. (b) Relationship between OLR and reactor COD removal rate and the comparison of two reactors.
Processes 10 01295 g005
Figure 6. Relationship between C/S and COD removal and the comparison of two reactors. (a) Relationship between C/S and COD concentration of reactor effluent and the comparison of two reactors. (b) Relationship between C/S and COD removal rate of reactor and the comparison of two reactors.
Processes 10 01295 g006aProcesses 10 01295 g006b
Figure 7. pH changes of reactor effluent.
Processes 10 01295 g007
Figure 8. VFA change of reactor effluent.
Processes 10 01295 g008
Figure 9. Influence of influent COD concentration on gas production rate.
Processes 10 01295 g009
Figure 10. Second-order polynomial regression analysis of gas production rate and volume load.
Processes 10 01295 g010
Figure 11. The effect of reflux on COD removal performance of the two reactors. (a) Relationship between R and COD of EGSB effluent. (b) Relationship between R and COD removal of EGSB. (c) Relationship between R and COD of IC effluent. (d) Relationship between R and COD removal of IC.
Processes 10 01295 g011
Figure 12. Relationship between the reflux ratio and the rising liquid flow rate. (a) IC reactor with external circulation. (b) IC reactor without external circulation.
Processes 10 01295 g012
Figure 13. Relative abundance histogram.
Processes 10 01295 g013
Figure 14. Relative abundance heat map.
Processes 10 01295 g014
Figure 15. Appearance of sludge in the EGSB and IC reactors. (a) Sludge in the EGSB reactor. (b) Sludge in the IC reactor.
Processes 10 01295 g015
Figure 16. Changes in sludge concentration in the two reactors.
Processes 10 01295 g016
Table 1. Main characteristics of EGSB and IC reactors.
Reactor TypeCommonalityPeculiarities
Structure SizeReaction ChamberFlow Rate (Including Reflux) m·h−1Circulation ModePower Consumption
Height (m)Aspect Ratio
EGSB
  • Third generation of the anaerobic reactor;
  • Derived from the improvement of UASB;
  • Suspended granular sludge reactors;
  • Reflux ratio of 200~300;
  • Small footprint;
  • With circulation;
  • Produce clean energy—biogas.
12~1615~4012.5~12ExteriorHigh
IC18~244~82 USAB
Series connection
6~16InteriorLow
Table 2. Test water quality index.
IndexCOD (mg/L)BOD5 (mg/L)SS (mg/L)pH
Value15,000~23,4008200~11,200720~9701.64~2.20
Table 3. Start-up procedure of reactors.
PhaseTime (d)OLR kgCOD/(m3·d)Reactor Water InletR
Flow (L·h−1)COD (mg·L−1)SO42− mg·L−1C/SEGSBIC
I1~53.471550020002.830
6~103
II11~204.741750027002.833
III21~306.95111,00040002.833
IV31~368.34113,20048002.833
37~42
44
Table 4. Scheme of reactors under stable-load and high-load operating conditions.
PhaseTime (d)OLR kgCOD/(m3·d)Reactor Water InletR
Flow (L·h−1)COD (mg·L−1)SO42− (mg·L−1)C/S
EGSBIC
V43~489.171.113,20048002.855
VI49~549.171.113,20048002.866
55~6077
VII61~6610.11116,00048003.366
67~7011.37118,0003.75
VIII71~7611.37118,00080002.2566
77~80
12,0001.5
IX81~8611.37118,00018,000166
87~9022,0000.8
Publisher’s Note: MDPI stays neutral with regard to jurisdictional claims in published maps and institutional affiliations.

