Article

Dehydration and Rehydration Kinetics Modeling in the Phytochemical, Aroma, and Antioxidant Capacity of Tree Tomato Fruit Dried with Microwaves and Freeze Driers: A Comparative Study

Institute of Graduate School, Ondokuz Mayis University, Samsun 55139, Turkey
*
Author to whom correspondence should be addressed.
Submission received: 20 June 2022 / Revised: 10 July 2022 / Accepted: 20 July 2022 / Published: 22 July 2022
(This article belongs to the Special Issue Advanced in Dewatering and Drying Processes)

Abstract

:
In the present study, we investigated and compared the effect of microwaves and freeze-drying methods on the dehydration and rehydration kinetics in the phenolic, anthocyanin, aroma profiles, and antioxidant properties of tree tomato fruit (Solanum betaceum). The tree tomatoes were dried using microwaves at 350 W, 500 W, and 650 W, and then freeze-dried. The obtained drying curves were processed to find the most suitable mathematical modeling among the different moisture ratio expressions. Total phenolics, total anthocyanins, total flavonoids total carotenoids, vitamin C, Ferric Reducing Antioxidant Power (FRAP), and 2,2-diphenyl-1-picrylhydrazyl (DPPH) were tested. Using High performance Liquid Chromatography (HPLC), phenolic and anthocyanin compound profiles were identified. The aroma profile was analyzed using gas chromatography-MS. The Midilli model, among others, precisely describes the dehydration methodology of all used drying methods with the coefficient of determination R2 = 0.99. On the other hand, the Weibull model precisely describes the rehydration process of the used drying methods (R2 = 0.99). Physical changes (color, shrinkage) were also studied. The freeze-dried tree tomatoes had a high number of phenolic compounds with 3.94 ± 0.26 mg GAE/g and total carotenoid compounds with 0.48 ± 0.04 µg/g. Epicathechin was the most abundant compound among the tested phenolics, followed by Cathechin. The Pelargonidin-3-glucoside was the most abundant anthocyanin whereas in freeze-dried tree tomatoes, 1.22 ± 0.01 mg/g. Fifty-four aroma compounds were detected and quantified. Among others, Eucalyptol was one of the most abundant aroma compounds analyzed in dried tree tomato fruit. Freeze-dried tree tomatoes retained most of the antioxidant and flavor compounds analyzed.

1. Introduction

Fruit is one of the richest sources of active bio-compounds among other foods and their distribution on the planet is neither equitable nor uniform. [1]. Fruit consumption is highly recommended, since through its consumption, the human body gains important vitamins, minerals, fiber, tocopherols, and polyphenols [2]. It is well known that eating habits can have an influence on the prevention of metabolic diseases such as hypertension, diabetes, and obesity. Various studies described many polyphenols compounds found in foods, such as fruit, vegetables, tea, and seeds, as having antioxidants properties [3,4]. These polyphenol compounds are recognized to prevent damage caused by oxidative stress, such as cell and DNA damage [5,6,7]. Epidemiological studies revealed that there is a correlation between high consumption of phenolic compounds in the diet and reduced risks of cardiovascular diseases. Probably the main antioxidant activity that has been associated with phenols is their ability to scavenge free radicals [8].
Therefore, various techniques are being used to deliver fruit to the consumer with maximum quality. As mostly well known, fruit contains approximately 80–99% free water which makes them highly perishable. The drying process is one of the preservative methods used to extend the shelf life of fruit and better retain their nutrients by the means of reducing free water in food. The drying method is chosen based on the particularities of the product characteristics and socio-economic considerations as well as the energy need as fossil fuel prices are increasing [9]. Unfortunately, some studies pointed out the losses of some active biological compounds such as vitamin C and carotenoids [10,11], total polyphenols contents, and total flavonoids content [12] during drying. The long drying times at relatively high temperatures during the falling rate periods mostly lead to thermal degradation of some heat sensitive fruit compounds; consequently, microwave drying uses a shortened drying time and improves the final quality of the dried products [11]. Furthermore, for conserving some components of fruit, thermolabile, some techniques, such as drying using microwaves and freeze-drying, have been developed with the aim of offering products with extended storage stability and adequate convenience for the consumer while reducing the nutrients losses.
Freeze-drying, also known as lyophilization, is among the best drying techniques used for producing better quality of dried and solid foods. It is a preferred method for drying foods containing high heat sensitivity and oxidation-prone compounds, since it operates at very low temperatures and under high vacuum [13]. The application of freeze drying to various fruit and vegetables, such as lemon, apple, guava, strawberry, blackberry, pumpkin, tomato, asparagus, coffee, tea, garlic, ginger, maple syrup, etc., has already been reported in the literature [14,15,16,17]. Compared to freeze drying, the microwave drying system caused some reductions on one hand, and the increase of some bioactive compounds on the other hand, as reported also by [18,19,20,21,22].
Distinct mathematical models describing the drying process have been proposed to optimize the process and the set up the effective dryers. Moreover, the prediction of drying rates for distinct dryers and moisture diffusion parameters of fruit products are important components of microwave drying simulation models and are essential for an efficient moisture transfer analysis [23].
At present, there is no study that investigated the effect of a drying method on the bioactive compounds of tree tomatoes, which are a good source of polyphenols, vitamin C, flavonoids, carotenoids, anthocyanin, and also exhibit associated antioxidant capacity as per DPPH and FRAP [4,24,25]. In the present study, the comparison between the physical properties and bioactive compounds of tree tomato fruit dried with freeze dryers and microwaves was conducted, the used methodologies and the obtained results are described in the next sections.

2. Materials and Methods

2.1. Material

Fresh tree tomatoes were cultivated and collected from Rulindo District, Rwanda in the long rainy season (always called season B) April 2019. All samples were stored in a refrigerator at 4 °C and 90% relative humidity prior to be brought to Ondokuz Mayis University (Samsun, Tukey) in laboratories for food engineering for further experiments. Tree tomatoes with the same size and color were selected to ensure uniformity of the physical-chemical characteristics of the samples.

2.2. Drying Process

The samples were washed, peeled, and sliced (5 mm thickness) prior to the drying process. The drying process was made in microwaves (Arçelik MW 674 S 20 lt, Istanbul-Türkiye) at the power of 350 W, 500 W, and 650 W for the first method whereas the moisture ratio was being checked with every one minute difference. The second method was the freeze drying method using a freeze dryer (LABCONCO; FREEZONE 12PLUS, Kansas, MO, USA).

2.2.1. Physical Properties of Dried Tree Tomatoes

Color Measurement

The Color measurement was made with the Konica Minolta CR-400 color measurement and DP-400 data processing device (Japan) with CIE (Commission International L’Eclairage, English: International Commission of Illumination, ICI) Color Scale (L, a, b). Briefly, the colorimeter was calibrated by placing the tip of measuring head flat against the surface of the white and black calibration place. After standardization, “L” (lightness), “a” (redness/greenness), and “b” (yellowness/blueness) values were measured on the surface of fresh and dried tree tomatoes slices. For analyzing the color change after drying, total color difference (ΔE), Chroma and hue angle (H°) were calculated as the equation below describing [26,27]:
C h r o m a = ( a ) 2 + ( b ) 2
H u e   a n g l e = a r c t a n b a
t h e   E = ( L L o ) 2 + ( a a o ) 2 + ( b b o ) 2
where L0, a0, and b0 are the color parameters of fresh samples; L, a, b are the color parameters of dried tree tomatoes slice samples.

Determination of Morphological Features
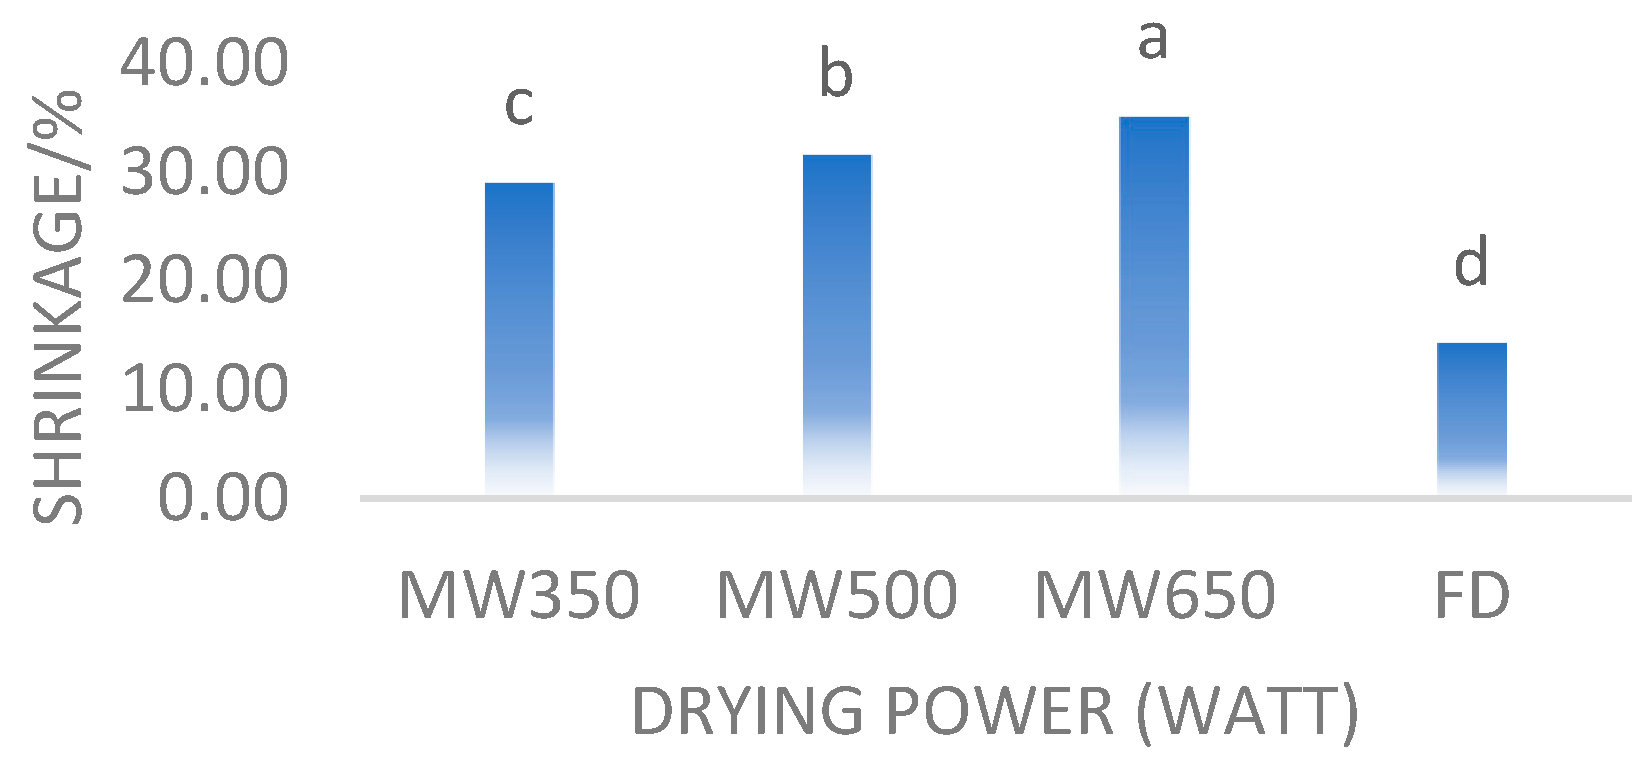
Morphological features were analyzed using the Scan Electron Microscopy SEM (Jeol 7001F FEG gun, Tokyo-Japan) device. Briefly, the dehydration of tree tomatoes was performed in an acetone series, the critical point dried using carbon dioxide and then mounted directly on stubs using double-side adhesive tape, and sputter-coated with gold. Observations were made with a Scan Electron Microscopy SEM [28].

Shrinkage Analysis

In this analysis, tree tomato slices were placed in the area divided into 1 mm2 squares as a reference under the glass pane, and photographs were taken 10 cm above each sample slice by the phone’s camera (Samsung Galaxy J5 prime, Seoul-Korea). Area change measurements were made from the photographs taken with the help of the AutoCAD package program. The chance in area was measured, compared to the initial sample, and expressed in percentage [29].

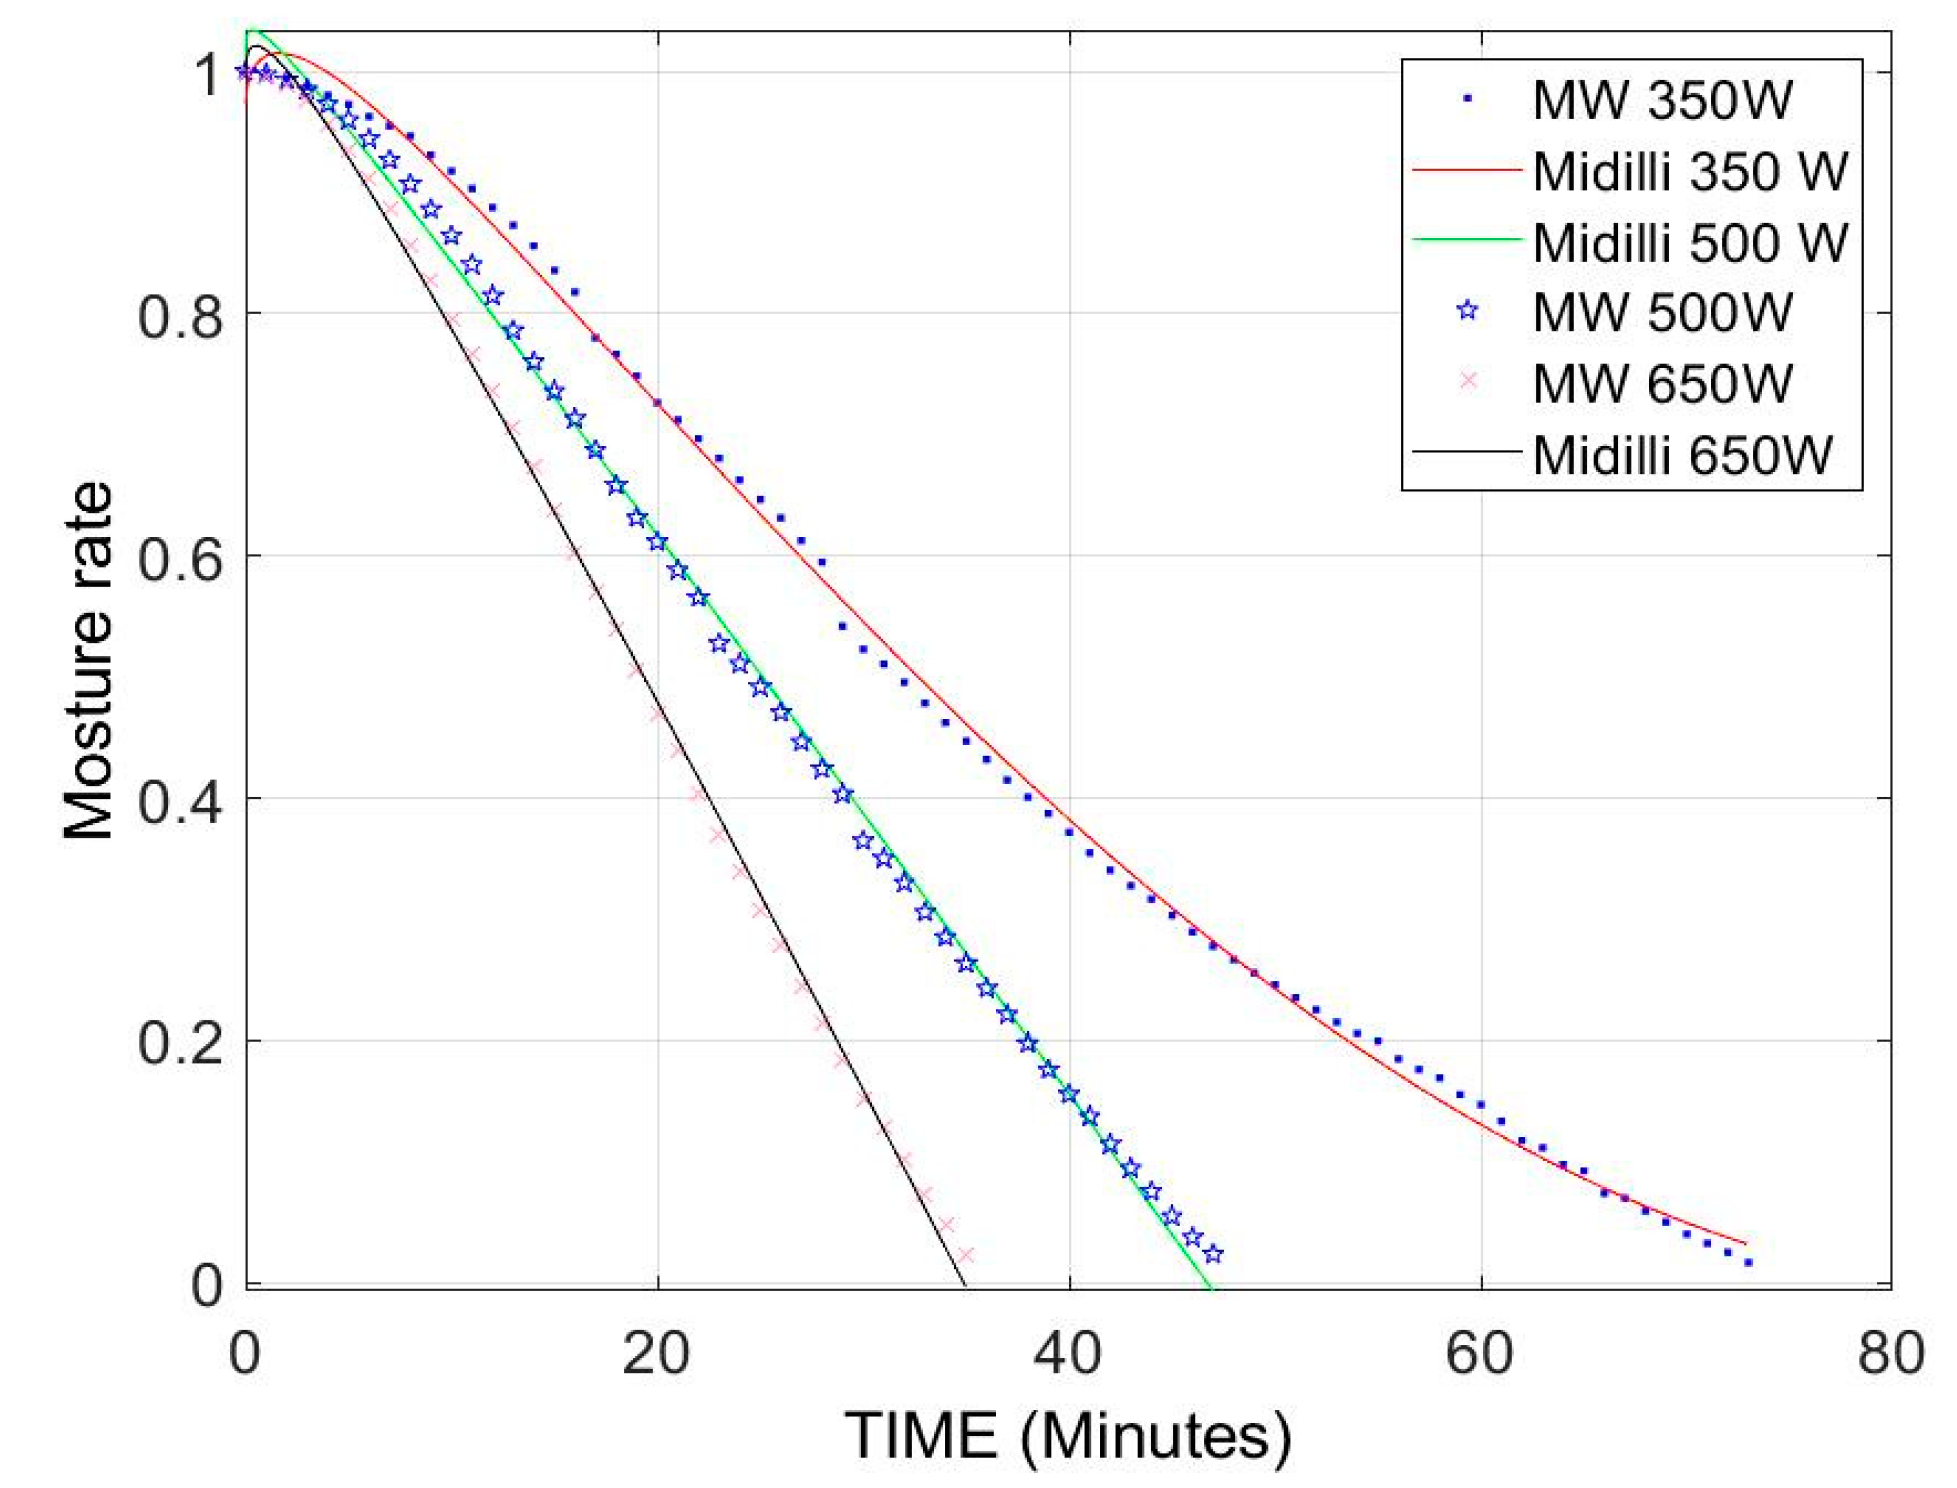
2.3. Mathematical Modeling of Drying Kinetics

The obtained drying curves were processed to find the most suitable model among the various moisture ratio expressions are given in Table 1. The moisture ratio was expressed as per Formula (4) [30,31]:
M R = ( M t M o ) M e M o
where MR is the moisture ratio, Mt is the moisture content at any point in time (g water/g dry matter), and Mo is the initial moisture content (g water/g dry matter),
Model parameters were determined using non-linear regression analysis. The indicator used to assess the compliance of the tested models with experimental data are the coefficient of determination (R2), Sum of Square Errors (SSE), root mean squared error (RMSE) for measuring the accuracy, and chi-square (χ2), which is for measuring the difference between the observed and expected frequencies of the outcomes of a set of events or variables. To complete this analysis, the MATLAB R2013a (1.22.6.30) software was used. Table 1 presents the mathematical models used. The root mean square error, RMSE, is a widely used measure of the difference between the values predicted by the model and the actual observed values. RMSE is a good measure of accuracy and serves to combine residuals into a single measure of predictive power. It can be calculated using the following [32]:
X 2 = i = 1 N ( M R o M R e ) 2 N n
RMSE = [ 1 N i = 1 N ( M R o M R e ) 2 ] 1 / 2
SSE = i = 1 N ( M R o M R e ) 2
where N is the number of observations, n is the constant number, MRo, i. predicted moisture content values, MRe, i are the experimental moisture content values.

2.4. Rehydration Process

To determine the rate of rehydration, a certain number of dried products was taken, 50 times the weight of the sample (1 g of dried fruit in 50 g of distilled water), placed in distilled water at 25 °C (room temperature) and kept in pure water for 12 h. The amount of water absorbed by the samples was recorded at 1-h intervals [39].

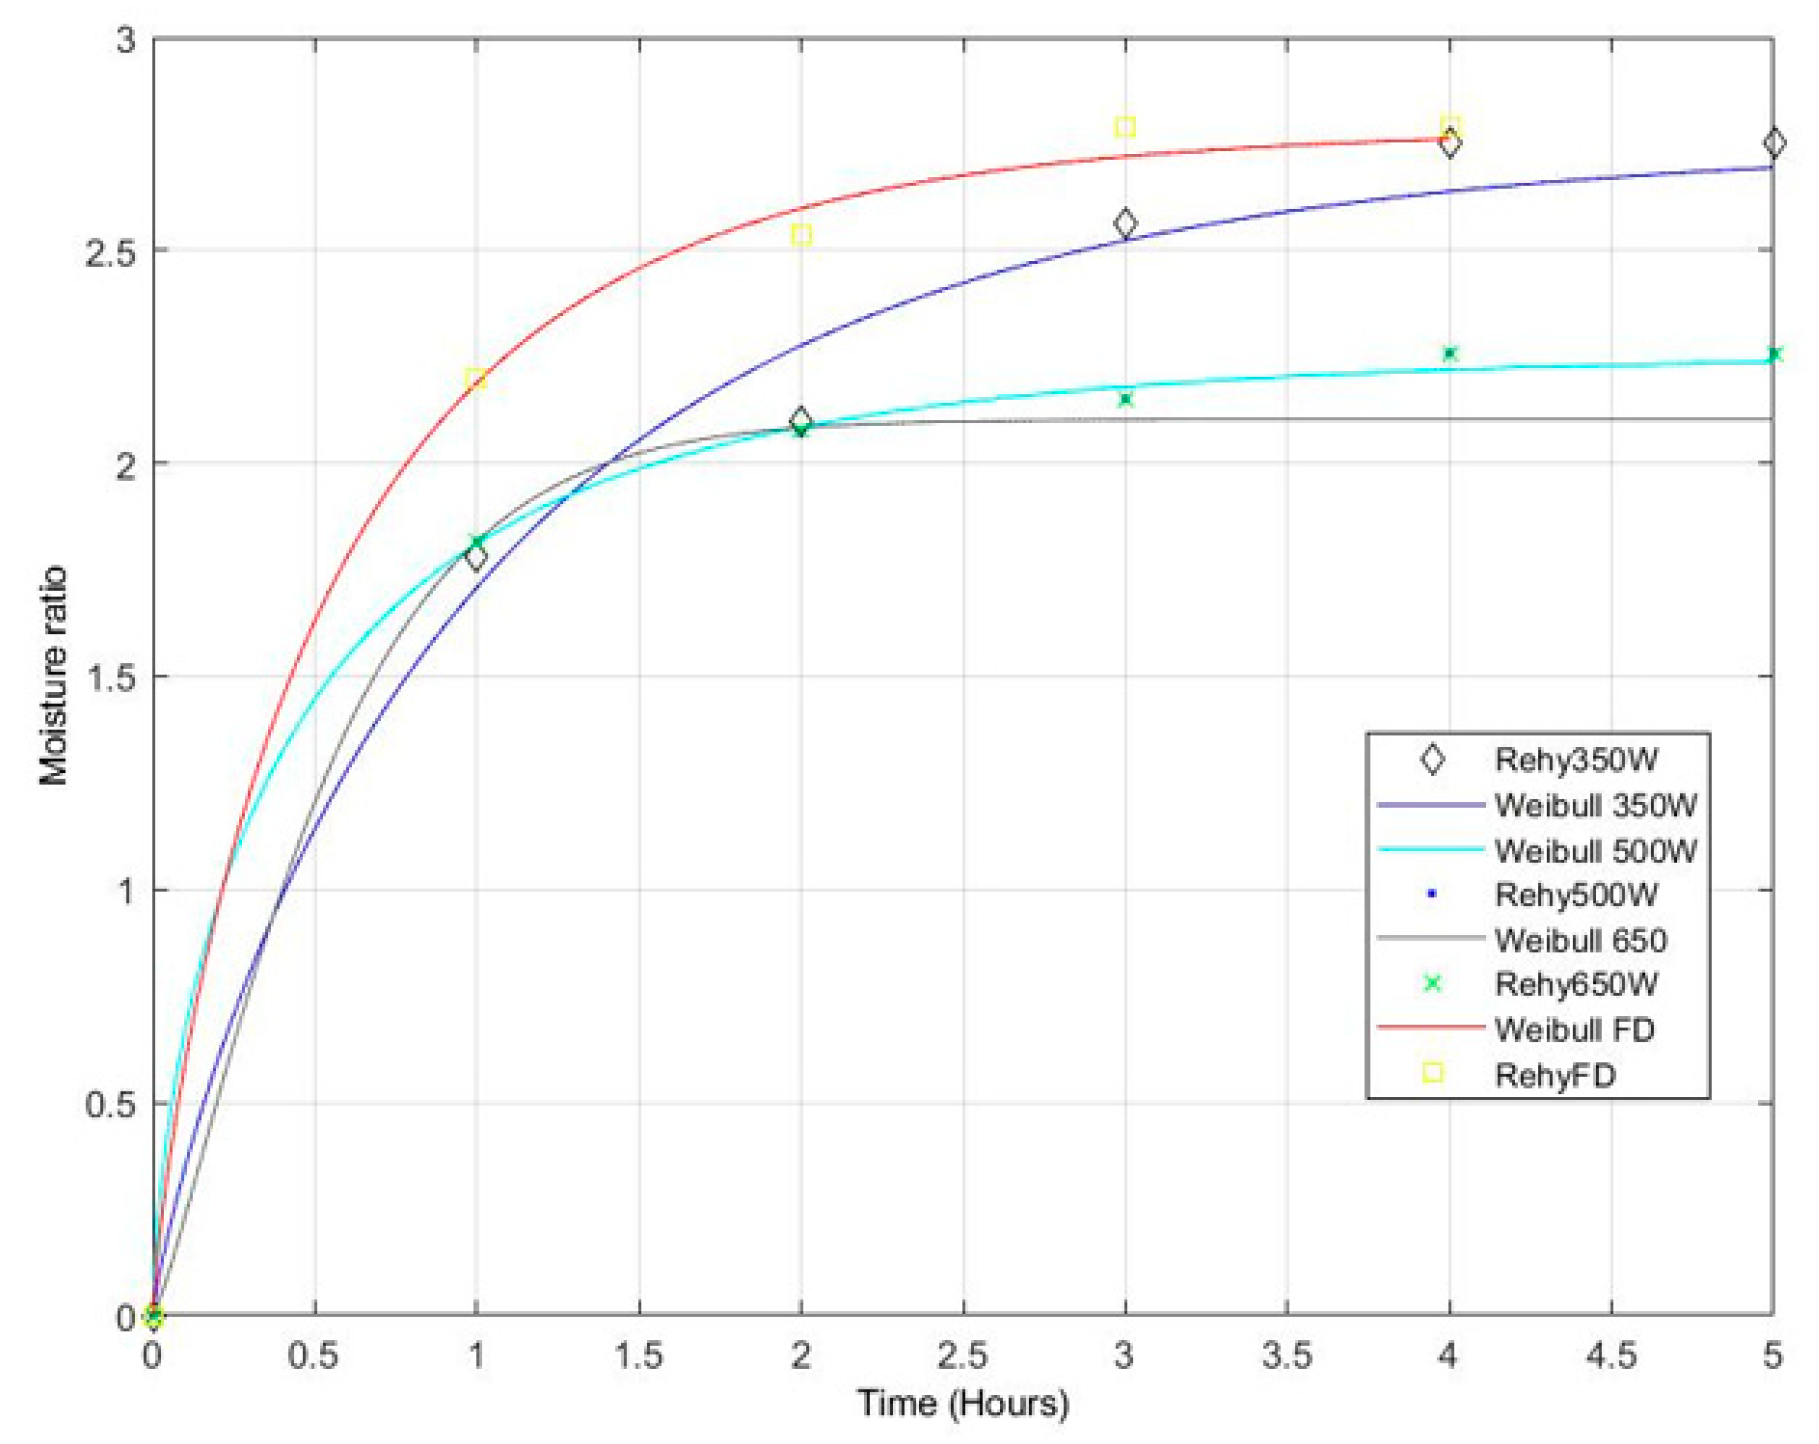
2.5. Mathematical Modeling of Rehydration Kinetics

As with previous studies, this study used various empirical models to evaluate the mechanism of rehydration. The rehydration rate equation is as follows:
Rehydration   rate   = M r Md
where Mr: Wet product weight (g); Md: The dried product weight (g).
The rehydration patterns are described in Table 2. In these equations; M(t) is the sample moisture at rehydration time t (g H2O/g dry matter), Mo is the initial moisture content of the dried sample (g H2O/g dry matter), Me is the equilibrium moisture (g H2O/g dry matter), t is the rehydration time, a [min. (g dry matter/g H2O] Peleg rate constant, and b [g dry matter/g H2O] Peleg capacitance constant. The experimental results of rehydration of tree tomatoes dried with microwaves at different powers (350 W, 500 W, and 650 W) were corrected using empirical models. The mathematical simulation was coded using the 2013a version of the MATLAB software. Four criteria were used to assess the suitability of the models used: the sum of squares of the standard error (SSE), coefficient of determination (R2), root mean square error (RMSE), and chi-square (χ2).
SSE = i = 1 N ( M e i M c i ) 2
RMSE = [ 1 N i = 1 N ( M e i M c i ) 2 ] 1 / 2
X 2   = i = 1 N ( M e i M c i ) 2 N z
where Mci is the calculated moisture content (g water/g dry matter.), Mei is the experimental moisture content (g water/g dry matter.), z; constant number and N data number [40].

2.6. Natural Antioxidants and Determination of Antioxidant Activity

2.6.1. Ascorbic acid Determination

Vitamin C was determined according to the method described by Benassi at al. [47] and AOAC [48] with slight modifications. Tree tomato samples were extracted using oxalic acid solution (0.4 g oxalic acid in 1 L distilled water). 150 μL of the fruit extracts was added to 1350 μL of 0.01% 2,6-dichlorophenolindophenol. The blank was prepared by mixing 150 μL oxalic acid with 1350 μL 2,6-dichlorophenolindophenol. The absorbance was read at 520 nm against the blank. The reduction ratio was calculated with Equation (12) and the values of vitamin C were determined as mg/g using a calibration curve of ascorbic acid at the concentrations ranged from 0.01 mg/g to 0.1 mg/g.
Reduction   ( % ) = Absorbance   of   the   control Absorbance   of   the   extract Absorbance   of   the   control

2.6.2. Determination of Total Phenolic Compounds

The contents of total phenols (TPC) were determined according to the Folin-Ciocalteu methods [49,50]. Briefly, fruit extracts were diluted to a suitable concentration for analysis. Half a milliliter of extract, 1 mL of 1 M Folin-Ciocalteu reagent and 1 mL of 20% (w/v) Na2CO3 were mixed. After 2 h of incubation in the dark at room temperature, the mixture was centrifuged for 10 min (8000 rpm). The supernatant was read at 765 nm using spectrophotometer (Thermospectronic-Helios Gamma, Paisley-UK). Different concentrations of Gallic acid (10–90 µg/mL) were determined to be a calibration curve and the results were presented as mg Gallic acid equivalents per gram, on dry weight basis (GAE)/g dw.

2.6.3. Determination of Total Flavonoids

Total flavonoid compounds were determined using a slightly modified method described by Zhishen et al. [51]. Briefly, 1 mL of the diluted fruit extract solution was added to 0.3 mL of 5% NaNO2 and left to stand for 5 min, then 0.5 mL of 5% AlCl3 was added. The mixture was kept for 6 min before adding 0.5 mL of 1 M NaOH. After 10 min, the absorbance was read at 510 nm using a spectrophotometer (Thermospectronic-Helios Gamma, Paisley-UK). The total content of flavonoids was estimated from a calibration curve using epicatechin as a standard. Results were presented as mg epicatechin equivalents (ECE) mg/g dry weight basis.

2.6.4. Determination of Total Anthocyanin Compounds

The amount of total anthocyanin compounds was determined using the pH difference method and calculated as per cyanidin-3-glucoside equivalence [52]. Briefly, after extraction, the samples were fragmented and diluted with pure water; then, they were mixed with pH 4.5 and pH 1.0 buffer solutions, filtered, and absorbance was read at 510 nm and 700 nm on a spectrophotometer (Thermospectronic-Helios Gamma, Paisley-UK). Results were presented in mg cyanidin-3-glucoside equivalents (CGE) per mg/g dry matter weight.

2.6.5. Determination of Total Carotenoids

Total carotenoid compounds were extracted and analyzed according to the method described by Hernández et al. [53] with minor modifications. Homogenized dried tree tomato samples were extracted with 25 mL of cold acetone and filtered under vacuum until the color disappeared. The extract was gradually added to 50 mL of ethyl ether in a decanting funnel. The organic phase was treated several times with anhydrous Na2SO4 (20 g/L) to remove residual water. Then the optical density was measured at 450 nm using a spectrophotometer (Thermospectronic-Helios Gamma, Paisley-UK). The results were expressed as mg of β-carotene/100 g, dry matter basis.

2.7. Determination of Antioxidant Capacity

Determination of antioxidant capacity of the tree tomato fruit was performed by 2,2-diphenyl-1-picrylhydrazyl (DPPH), radical scavenging, and ferric reducing activity (FRAP) assays. The FRAP assay value was estimated by a calibration curve of the standard solution of FeSO4 then expressed as mmol FeSO4 equivalents per g (mmol ISE/g). FRAP was calculated from a standard curve using iron sulfate at the concentrations ranged from 0.12 to 0.59 mmol/g [54]. The DPPH assay was performed according to the method adopted by Zannou et al. [55] and Kalisz et al. [56]. Briefly, 50 μL of the appropriately diluted extract was mixed with 1 mL of DPPH solution (0.06 mM in 80% methanol). The mixture was kept in the dark for 1 h at room temperature (approximately 25 °C), then the absorbance was read at 517 nm. The DPPH standard solution was used as a control, and the scavenging ratio was calculated with Equation (12). The values of DPPH radical scavenging were determined as mmol trolox/g.

2.8. Individual Anthocyanin and Phenolic Compound Profiles Analysis

Anthocyanin and phenolic compound profiles analyses were performed using high performance liquid chromatography (HPLC) coupled with a mass spectrometric detector (LC-MS/MS, Shimadzu LC-MS 8040) with an Inertsil ODS-4 column (3 µm, 4.6 mm × 50 mm) (GL Sciences Kat No: 5020-04042), flow rate 1 mL/min, oven temperature 30 °C, injection volume: 20 μL, with mobile phase A: 94% 2 mM sodium acetate and 6% acetic acid. Mobile phase B: 100% acetonitrile. The MS/MS system operated at a capillary temperature of 300 °C, an evaporator temperature of 350 °C, and a gas pressure in the cladding of 30 arb. Discharge current 4 μA. 20 µL of each sample was filtered through 0.45 µm nylon filters and injected into a reverse phase C18 column (ODS-hypersil 5 µm, 4.6 mm × 250 mm). Identified compounds were quantified using a mixture at concentrations of 0, 50, 75, 100, 150, and 200 ppm of epicatechin, catechin, resveratrol, p-coumaric acid, salicylic acid, gallic acid, sinapic acid, quercetin-3 standards-glucoside, cyanine chloride, cyanidin-3-glucoside, and pelargonidin-3-glucoside as standards [57].

2.9. Analysis of Aroma Compounds Profile

The analysis of volatile components was determined using a gas chromatography (GC) system (Agilent Brand 7890B, 7010B MS, USA). The solid phase microextraction (SPME) method of extraction was used. Briefly, 3.0 g of the sample was placed in a 20 mL vial and kept at 50 °C for 15 min, then a solid phase microextraction apparatus (SPME) for 50/30 μm divinylbenzene/carboxene was used. Polydimethylsiloxane (DVB/CAR/PDMS) coated fiber and volatile components were absorbed within 30 min. DB-Wax (60 m × 0.25 mm, id × 0.25 µm, J&W Scientific-Folsom, CA, USA) was then introduced into the capillary column by desorption for 5 min. The injection temperature was 250 °C, the column temperature was raised to 90 °C. at a rate of 3 °C per minute after holding for 4 min at 40 °C, and then to 130 °C by increments of 4 °C per minute. The temperature was brought to 240 °C by increasing by 5 °C and maintained at this temperature for 8 min. Helium (He) was used as the carrier gas. The electron energy is 70 eV and the mass range is 30–600 m/z. The split ratio was 1:10 [58].

2.10. Statistical Analysis

Experimental results of dehydration and rehydration of dehydrated tree tomatoes were compared with empirical models. The fitting was coded using MATLAB R2013a software (1.22.6.30). Four criteria were used to assess the quality of fitting and evaluate the quality of fitting of each model: linear regression coefficient (R2), root mean square error (RMSE), sum of squared errors (SSE), and chi-square (χ2). One-way statistical analysis was performed by ANOVA with Duncan’s test using SPSS (version 21). The significance of the results was assessed at p ≤ 0.05.

3. Results and Discussion

3.1. Dried Tree Tomatoes Specification

3.1.1. Color

In the present research, L (lightness), a (redness/greenness), and b (yellowness/blueness), ∆E, Hue Angle and Chroma values were analyzed to characterize the color and the results are presented in Table 3. Delta-E (∆E) representing the distance between two colors; whereas in this study the comparison was between the fresh tree tomato fruit to the dried ones. Considering the obtained ∆E values, there is a big difference between the fresh tree tomato and the dried ones as when the ∆E value is greater than 5, it indicates a large color difference [59].
According to the results of the present study, the color parameters lightness (L value), redness-greenness (a value) and yellowness-blueness (b value) changed when we compared the dried tree tomatoes with the fresh tree tomato fruit samples. Accordingly, the highest lightness L was observed in the tree tomatoes dried with the freeze dryer with 27.71 ± 0.47. The change in lightness was not significant (p > 0.05) between the samples dried with microwaves at different powers. The literature pointed out the degradation of color pigment due to non-enzymatic browning as a result of Maillard and caramelization of sugar components of the fruit [60,61,62]. The freeze-drying method affected less the tree tomatoes color as indicated by the lowest ΔE value (13.49 ± 0.27). Previous studies pointed out the same thoughts and support the present study stating the change in color of food material because of enzymatic and non-enzymatic reactions taking place during drying process [13,63].

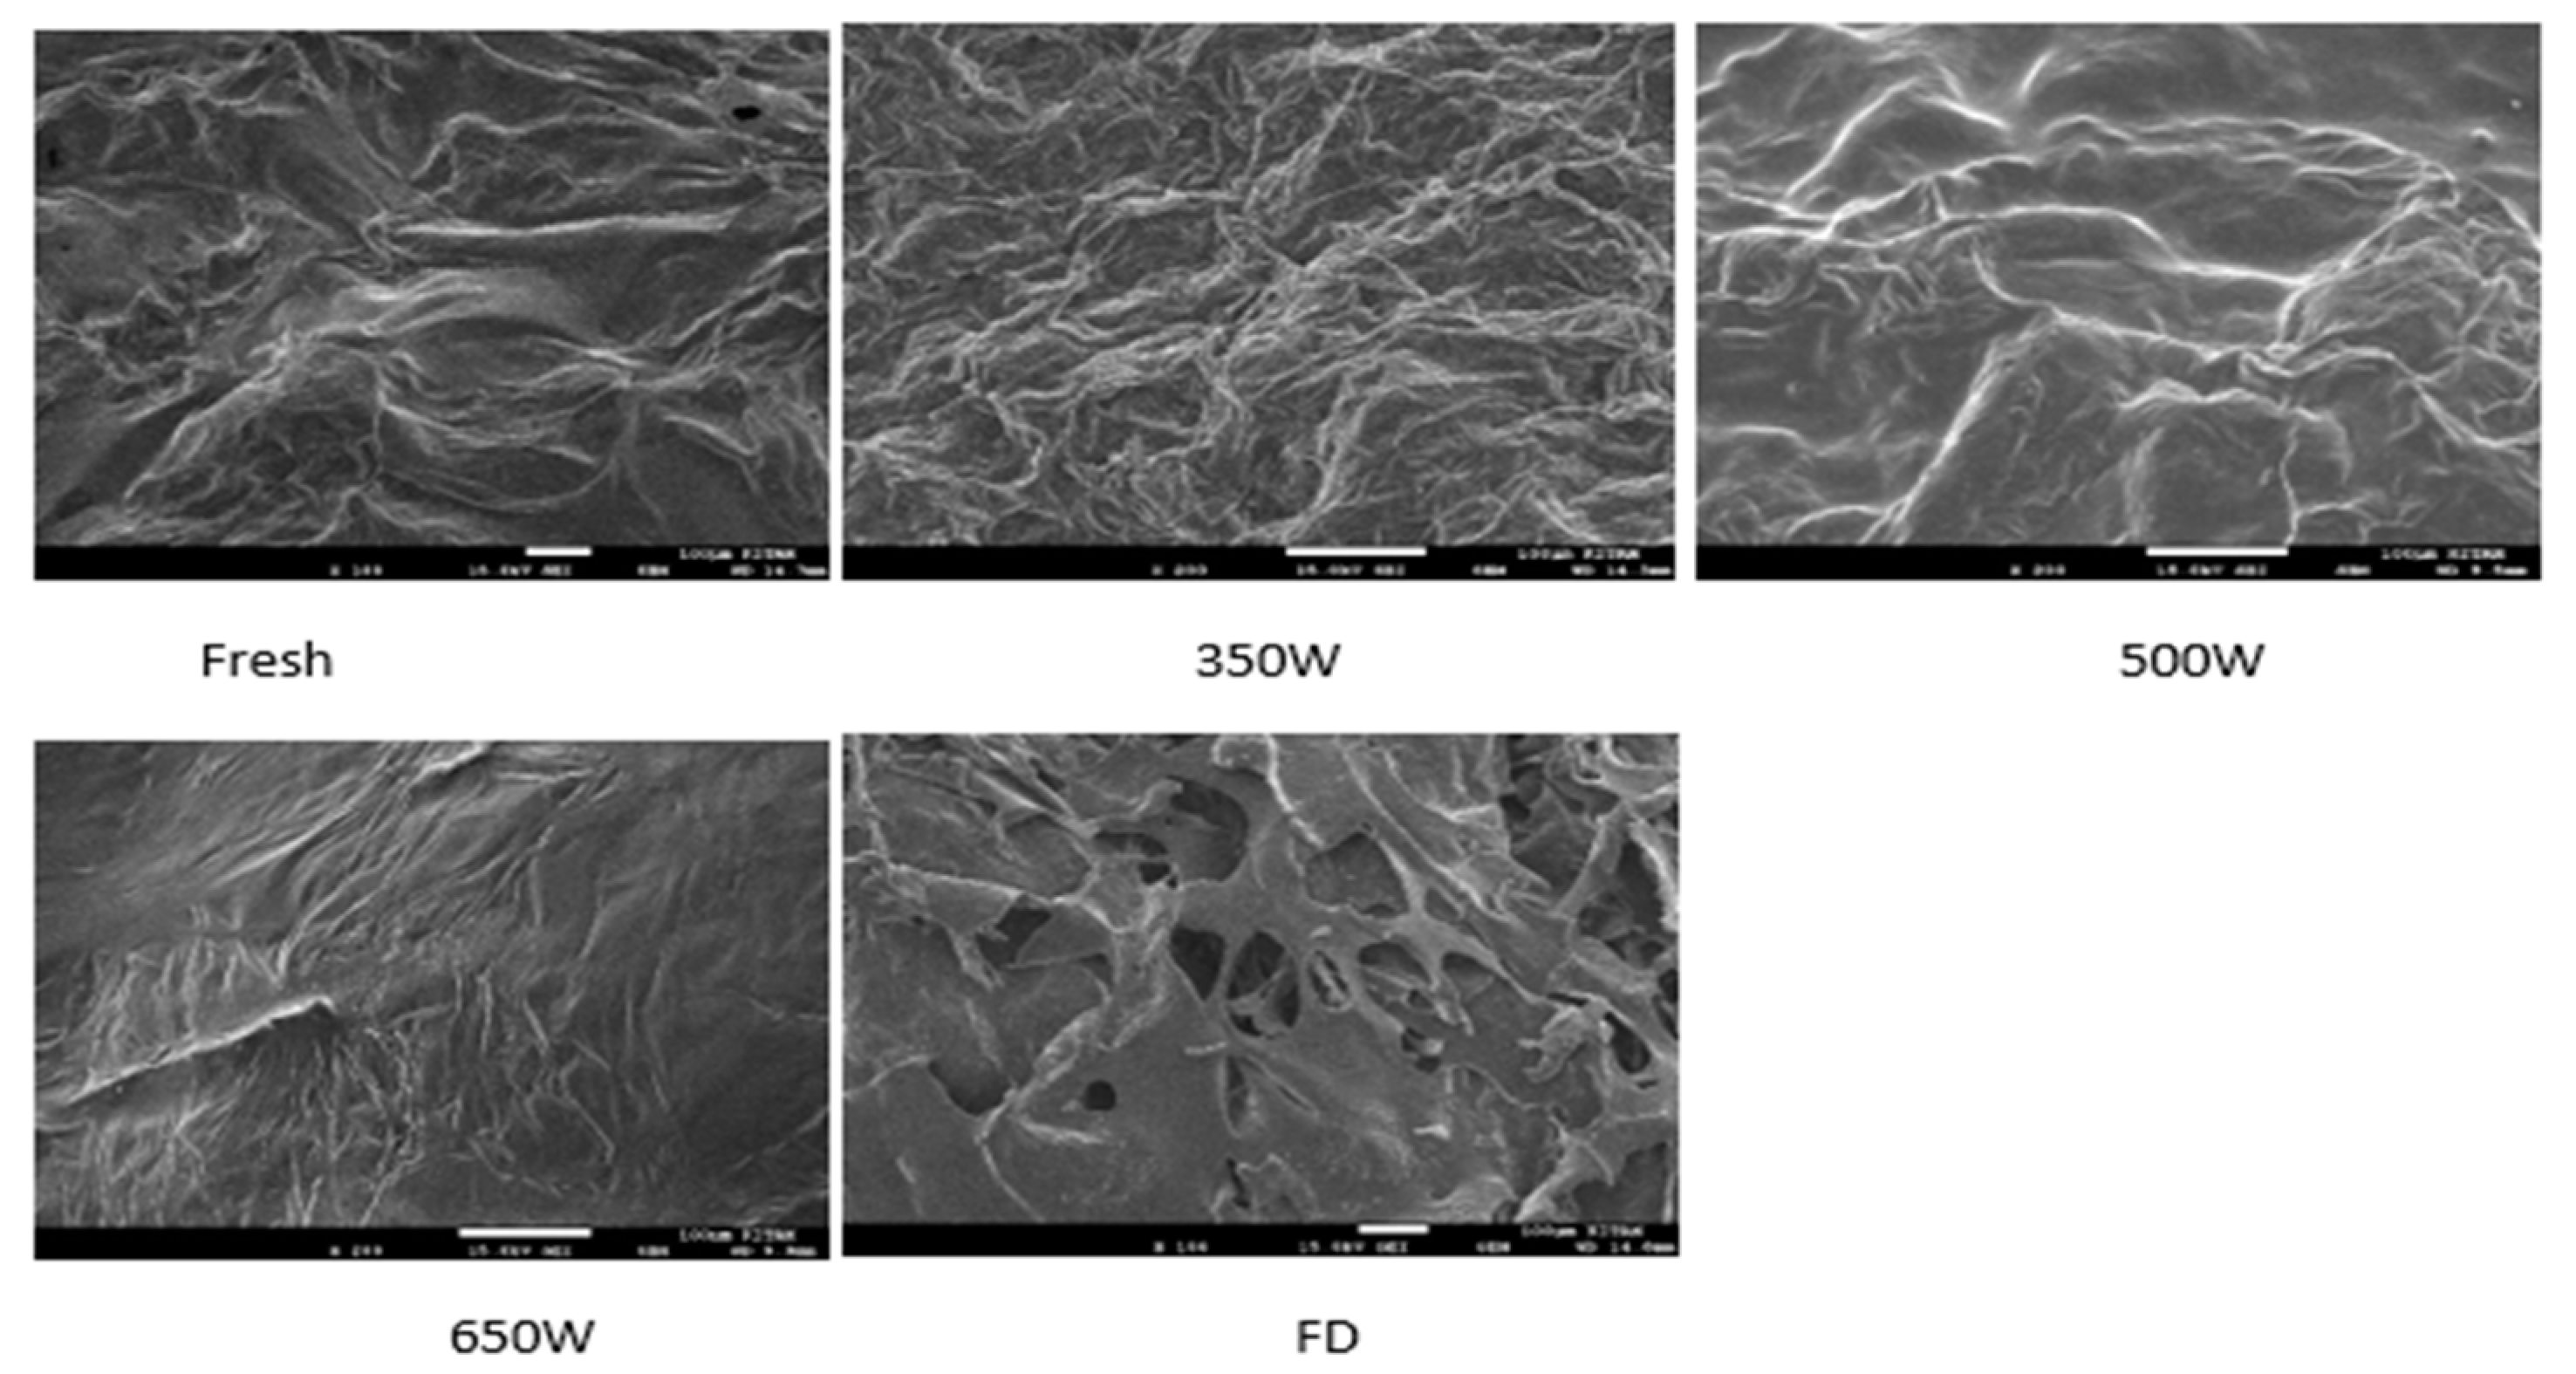
3.1.2. Shrinkage and Surface Morphological Features of Dries Tree Tomatoes

Food drying usually results in product deterioration not only from a sensorial point of view but also from a physicochemical and nutritional one. The surface morphology of tree tomato fruit was examined using Scan Electron microscopy (SEM). The present study revealed that microwave drying affected more than the freeze-drying technique the morphological properties of tree tomato fruit samples, as presented in Figure 1 and Figure 2. In microwave drying technique, as the drying power was increasing, the shrinkage values also increased. This may be due to the reduction of intercellular space. The water molecules evaporated, which may make the fruit tissue shrink. The freeze-drying technique does not affect much the size of the tree tomato fruit as shown in Figure 1 and Figure 2, which may be due to the fact that the tissues are not brutally cracked by the water friction while being forced out by the evaporation process.
In the present study, the highest shrinkage values were observed in the tree tomato fruit dried with microwaves at 650 W followed by those dried with microwaves at 500 W with 35.19% and 31.67%, respectively. Freeze-dried fruit showed a low shrinkage level with 14.34% compared to other tested methods. The freeze-drying process left the pronounced holes as shown in Figure 2 from SEM as the water molecules first condensed in ice and then evaporated as solid. This study is supported by previous studies [19,61,64,65].

3.2. Mathematical Modeling of Dehydration and Rehydration Kinetics

Drying kinetics as expressed by the moisture ratio were modeled according to the models of Page, Two-term Exponential, logarithmic, Wang and Singh, Midilli, and Approximation of Diffusion. According to the results of the present study, the values of coefficient of determination R2 ranged from 0.98–0.99 within all used models, which means the suitability of the used methods to the tested models. The values of the constants in these models were regressed against these variables using multiple regression analysis. Changes in the reduced moisture ratio (MR) as a function of the time spend by the process of microwave drying of tree tomato fruit are summarized in the figures.
As indicated in Figure 3, as the drying power increased, the drying time decreased. The shortest time was observed in tree tomato fruit dried with microwaves at 650 Watts in 35 min while the longest was within the samples dried with microwaves at 350 Watts in 73 min. The all-possible combinations of these variables were tested and were included in the mathematical analysis described in Table 4.
In the modeling of drying kinetics, it is assumed that the model which shows the lower SSE, RMSE, and X2 and highest R2 is the best-suited one for both dehydration and rehydration kinetics. This study suggested mostly the Midilli model for dehydration and Weibull for rehydration which gave the best simulation of the curves of dried tree tomatoes based on the percentage of demonstrated variances. The rehydration kinetics curve is best described by the Peleg Model and is summarized in Figure 4 and Table 5. This study revealed that the time required for rehydration depends on the power used for drying. The longest time was observed in tree tomato fruit dried in microwaves at 650 in 108 min followed by the tree tomatoes dried using microwaves at 500 W in 105 min. The present study is supported by recent studies [66,67,68,69,70].

3.3. Phytochemical Profiles and Antioxidant Activity of Dried Tree Tomatoes

In this study, two types of drying methods, freeze drying and microwaves (at 350 W, 500 W, 650 W), were used and the effects of the drying methods on the antioxidant properties was assessed. The freeze drying preserved more TPC and total carotenoids (TCC) than other tested drying methods with 3.94 ± 0.26 mg GAE/g and 0.48 ± 0.04 μg/g, respectively (Table 6). This amount is significantly higher (p < 0.05) than that of other tested drying methods. This study also revealed that the higher microwaves’ drying power preserved more TPC and TFC than the lower power. The tree tomatoes dried in microwaves at 650 W had significantly (p < 0.05) higher TPC and TFC than other tested drying powers (Table 6). Those results are supported by the study of Hayat et al. [71], which the increase of TPC with the increase of microwaves power. The freeze-drying method well-preserved the anthocyanin compounds and vitamin C significantly (p < 0.05) more than the microwaves drying methods. Our findings were in concordance with previous studies on pomegranate peel and persimmon, which reported that freeze drying retained higher TPC, TFC, and antioxidant capacity than other drying methods, such as vacuum oven and hot air [72,73]. Those findings are also supported by the study performed by Ng. et al. [74], Saifullah et al. [75], and Papoutsis et al. [76]. The antioxidant capacity of the dried tree tomato fruit as indicated by the DPPH and FRAP were statistical significantly (p < 0.05) higher in the tree tomatoes dried by microwaves. DPPH was higher in the tree tomato fruit dried with microwaves at 650 W with 57.48 ± 0.90 mmol trolox/g and the lowest was in the samples dried in freeze dryer with 46.14 ± 1.39 mmol trolox/g.
This study also analyzed the phenolic profile of dried tree tomatoes in which Gallic acid, catechin, epicatechin, p-coumaric acid; sinapic acid, quercetin-3-glucoside, salicylic acid, and resveratrol were analyzed. Epicatechin was the most abundant phenolic compound but mostly in samples dried with microwaves at 500 W which was significantly (p < 0.05) greater than other tested drying methods (Table 7). The value of epicatechin was 2.790 ± 0.038 mg/g in the sample dried with microwaves at 500 W followed by those dried in microwaves at 650 W with 2.615 ± 0.039 mg/g. The present study revealed the lowest concentration of epicatechin in the samples dried in the freeze dryer. In contrast to this study, Çoklar and Akbulut [77] performed a study on the black grapes and revealed a decrease of 25.3% of grapes’ epicatechin content after freeze drying, while sun and oven drying affected more the grapes’ epicatechin. Moreover, freeze drying preserved significantly (p < 0.05) sinapic acid, Resveratrol, and quercetin-3-glucoside more than other tested drying methods (Table 7) while Gallic acid, p-coumaric acid, salicylic acid, and Catechin were better preserved within the samples dried in microwaves at 650 W (Table 7). This indicate the correlation between higher TPC and DPPH radical scavenging activity of the sample dried in microwaves at 650 W.
The anthocyanin profile also was analyzed in the dried tree tomato fruit samples where Cyanin chloride, Cyanidin-3-glucoside, Pelargonidin-3-glucoside were detected. The freeze drying method showed significantly (p < 0.05) to better preserve the all tested anthocyanin compounds (Table 8). There no statistical significance in the concentration of cyanine chlorite found in all microwaves dried samples. Pelargonidine-3-glucosite was the most abundant anthocyanin compound followed by Cyanidin-3-glucoside in all tested dried tree tomato fruit samples (Table 8). The highest amount of Pelargonidine-3-glucosite was tested in samples dried in freeze dryer with 1223.82 ± 5.96 mg/kg followed by samples dried in microwaves at 650 W power. Freeze-dried samples also contained significantly (p < 0.05) highest Cyanidin-3-glucoside and Cyanine chlorite with 99.28 ± 1.51 mg/kg and 19.34 ± 0.8 mg/kg, respectively. This study is in agreement with the study by Wojdyło et al. [60], who revealed a decrease of anthocyanin compound, especially Pelargonidine-3-glucosite, in the strawberry fruit dried with microwaves compared to those dried in freeze dryer.

3.4. The Aroma Profile of the Dried Tree Tomatoes

Fifty-four aroma compounds were analyzed in the dried tree tomato fruit sample with different concentration according to drying method and power. The samples contained distinct types of aroma compound, including alcohol, organic acids, esters, terpenes, aldehydes, and ketones, as well as other organic substances (Table 9). Eucalyptol is one of the most abundant aroma compounds analyzed in dried tree tomato fruit samples whereas it was mostly abundant in samples dried in microwaves at 350 W. This study revealed that some aromatic compounds which may be not heat labile were found to be absent in the samples dried in microwaves but present in the samples dried in the freeze dryer and vice versa. Those include some alcohols, such as 3-Decyn-2-ol, Dodecanol, 3,7-dimethyl-1,7-octanediol, and Aldehydes and ketones, such as cyclohexenone and benzofuranone (Table 9). During drying, new aroma compounds were developed perhaps due to some chemical reaction. Those may include some aldehyde and ketones, which are the product of caramelization of sugars. We can site here some aroma compounds, such as furfural, which were more pronounced when the drying power was increasing as follows: 389.60 ± 11.95 µg/kg, 419.98 ± 52.98 µg/kg, 433.51 ± 14.96 µg/kg and 26.81 ± 5.45 µg/kg for samples dried in microwaves at 350 W, 500 W, 650 W, and FD. respectively. For other aromatic compounds imparted with the drying power, we can cite some aldehyde and ketones such as Decanal, Butanal-2-methyl, Isovaleraldehyde (3-methylbutanal), 5-Ethoxydihydro-2(3H)-furanone, 5-Methyl-2(5H)-furanone, H-pyrrol-2-yl-Ethanone, and Pyran-4-one (Table 9) which are mostly food flavorings. D-Limonene presence contributed to give a pleasant lemon-like odor [78,79] to the dried tree tomato fruit samples. Apart from the citrus aroma, the dried tree tomato fruit also possessed other chemical compositions, such as p-cimene, myrcene, α-pinene, Carene-1S-3R-6R-gamma-terpinene, and phellandrene which gives a herbacious, pine, and woody aroma and flavor [80,81]. The presence of linalool is the aromatic compound which makes the freeze-dried tree tomato fruit have a very nice and distinct fragrance as supported by the previous study of Letizia et al. [82].

4. Conclusions

The general objective of this study was to compare the phytochemical, antioxidant properties and aroma profiles, dehydration and rehydration kinetics, and antioxidant properties of tree tomato fruit dried using microwaves at different powers and a freeze dryer. The results obtained from this study revealed that the increase of drying power in the microwaves’ drying method reduces the time of drying for the tree tomato fruit. The used drying methods well fit with the tested models for both dehydration and rehydration kinetics with the coefficient of variation R2 approximately 0.99. The freeze drying method effects less the physical characteristics such as the color and the shape of the tree tomatoes more than microwaves drying method at different power. The phytochemical contents of phenolic compounds, flavonoids, vitamin C, Carotenoids and anthocyanin compound was changing according to the drying methods. Phenolic and flavonoids compounds increased with the increase of the drying power in microwaves’ drying methods. Anthocyanin compounds were better preserved in the freeze drying method more than in other used methods. Epicatechin was the most abundant phenolic among the tested phenolic compounds. Pelargonidine-3-glucosite was the most abundant anthocyanin compound present in all dried tree tomato fruit samples and was greater in freeze-dried samples. Fifty-four aroma compounds were isolated in the dried tree tomato sample and were different from one another according to the used drying methods. The determined aromatic compounds are playing distinct and/or important roles in giving the distinct flavor and aroma to the dried tree tomato fruit.

Author Contributions

Conceptualization, M.A.N. and I.K.; data curation, M.A.N.; formal analysis, M.A.N.; investigation, M.A.N.; methodology, M.A.N. and I.K.; project administration, I.K.; Supervision, I.K.; writing—original draft, M.A.N.; writing—review & editing, I.K. All authors have read and agreed to the published version of the manuscript.

Funding

This research was funded by [Ondokuz Mayis University project office] grant number [PYO. MUH.1904.20.008]. The APC was funded by the corresponding author.

Institutional Review Board Statement

Not applicable.

Informed Consent Statement

Not applicable.

Data Availability Statement

Not applicable.

Acknowledgments

The authors acknowledge the help of Ondokuz Mayis University whose laboratories were used. The authors acknowledge also the help of Ondokuz Mayis University’s BAP project office for supporting this research (Project No: PYO. MUH.1904.20.008).

Conflicts of Interest

The authors declare no conflict of interest.

References

  1. Jackson, D.; Looney, N.E.; Morley-Bunker, M. The distribution of fruits. In Temperate and Subtropical Fruit Production, 3rd ed.; CABI: Worcester, MA, USA, 2011. [Google Scholar]
  2. Canova, L.; Bobbio, A.; Manganelli, A.M. Predicting fruit consumption: A multi-group application of the Theory of Planned Behavior. Appetite 2019, 145, 104490. [Google Scholar] [CrossRef] [PubMed]
  3. Espin, S.; Gonzalez-Manzano, S.; Taco, V.; Poveda, C.; Ayuda-Durán, B.; Gonzalez-Paramas, A.M.; Santos-Buelga, C. Phenolic composition and antioxidant capacity of yellow and purple-red Ecuadorian cultivars of tree tomato (Solanum betaceum Cav.). Food Chem. 2016, 194, 1073–1080. [Google Scholar] [CrossRef]
  4. Diep, T.; Pook, C.; Yoo, M. Phenolic and Anthocyanin Compounds and Antioxidant Activity of Tamarillo (Solanum betaceum Cav.). Antioxidants 2020, 9, 169. [Google Scholar] [CrossRef] [Green Version]
  5. Zhu, X.; Ge, Y.; Wu, T.; Zhao, K.; Chen, Y.; Wu, B.; Zhu, F.; Zhu, B.; Cui, L. Co-infection with respiratory pathogens among COVID-2019 cases. Virus Res. 2020, 285, 198005. [Google Scholar] [CrossRef] [PubMed]
  6. Chen, C.W.; Ho, C.T. Antioxidant properties of polyphenols extracted from green and black teas. J. Food Lipids 1995, 2, 35–46. [Google Scholar] [CrossRef]
  7. Majidinia, M.; Bishayee, A.; Yousefi, B. Polyphenols: Major regulators of key components of DNA damage response in cancer. DNA Repair 2019, 82, 102679. [Google Scholar] [CrossRef]
  8. Hu, J.; Wang, Z.; Tan, B.K.; Christian, M. Dietary polyphenols turn fat “brown”: A narrative review of the possible mechanisms. Trends Food Sci. Technol. 2020, 97, 221–232. [Google Scholar] [CrossRef]
  9. Changrue, V.; Raghavan, V.G.; Orsat, V.; Vijaya Raghavan, G. Microwave drying of fruits and vegetables. Stewart Postharvest Rev. 2006, 2, 1–7. [Google Scholar]
  10. Onwude, D.; Bahrami, F.; Shrivastava, C.; Berry, T.; Cronje, P.; North, J.; Kirsten, N. Physics driven digital twins to quantify the impact of pre and postharvest variability on the end quality evolution of orange fruit. engrXiv 2022. [Google Scholar] [CrossRef]
  11. Shonte, T.T.; Duodu, K.; de Kock, H.L. Effect of drying methods on chemical composition and antioxidant activity of underutilized stinging nettle leaves. Heliyon 2020, 6, e03938. [Google Scholar] [CrossRef]
  12. Thamburaj, S.; Rajagopal, V.; Palanivel, R.; Pugazhendhi, S. Effect of different drying treatments on total polyphenolics content and in-vitro biological properties of Ficus benghalensis fruit: A comparative study. Biocatal. Agric. Biotechnol. 2022, 39, 102249. [Google Scholar] [CrossRef]
  13. Dziki, D.; Polak, R.; Rudy, S.; Krzykowski, A.; Gawlik-Dziki, U.; Różyło, R.; Miś, A.; Combrzyński, M. Simulation of the process kinetics and analysis of physicochemical properties in the freeze drying of kale. Int. Agrophysics 2018, 32, 49–56. [Google Scholar] [CrossRef]
  14. Chu, Y.; Wei, S.; Ding, Z.; Mei, J.; Xie, J. Application of Ultrasound and Curing Agent during Osmotic De-hydration to Improve the Quality Properties of Freeze-Dried Yellow Peach (Amygdalus persica) Slices. Agriculture 2021, 11, 1069. [Google Scholar] [CrossRef]
  15. Bhatta, S.; Janezic, T.S.; Ratti, C. Freeze-Drying of Plant-Based Foods. Foods 2020, 9, 87. [Google Scholar] [CrossRef] [Green Version]
  16. Fante, L.; Noreña, C.P.Z. Quality of hot air dried and freeze-dried of garlic (Allium sativum L.). J. Food Sci. Technol. 2013, 52, 211–220. [Google Scholar] [CrossRef]
  17. Ciurzyńska, A.; Lenart, A.; Gręda, K.J. Effect of pre-treatment conditions on content and activity of water and colour of freeze-dried pumpkin. LWT-Food Sci. Technol. 2014, 59, 1075–1081. [Google Scholar] [CrossRef]
  18. Farina, V.; Cinquanta, L.; Vella, F.; Niro, S.; Panfili, G.; Metallo, A.; Cuccurullo, G.; Corona, O. Evolution of Carotenoids, Sensory Profiles and Volatile Compounds in Microwave-Dried Fruits of Three Different Loquat Cultivars (Eriobotrya japonica Lindl.). Mater. Veg. 2020, 75, 200–207. [Google Scholar] [CrossRef]
  19. Lv, W.; Li, D.; Lv, H.; Jin, X.; Han, Q.; Su, D.; Wang, Y. Recent development of microwave fluidization technology for drying of fresh fruits and vegetables. Trends Food Sci. Technol. 2019, 86, 59–67. [Google Scholar] [CrossRef]
  20. Sriwichai, T.; Sookwong, P.; Siddiqui, M.W.; Sommano, S.R. Aromatic profiling of Zanthoxylum myri-acanthum (makwhaen) essential oils from dried fruits using different initial drying techniques. Ind. Crops Prod. 2019, 133, 284–291. [Google Scholar] [CrossRef]
  21. Santana, I.; Castelo-Branco, V.N.; Guimarães, B.M.; Silva, L.D.O.; Peixoto, V.O.D.S.; Cabral, L.M.C.; Freitas, S.P.; Torres, A.G. Hass avocado (Persea americana Mill.) oil enriched in phenolic compounds and tocopherols by expeller-pressing the unpeeled microwave dried fruit. Food Chem. 2019, 286, 354–361. [Google Scholar] [CrossRef]
  22. Coklar, H.; Akbulut, M.; Kilinc, S.; Yildirim, A.; Alhassan, I. Effect of Freeze, Oven and Microwave Pretreated Oven Drying on Color, Browning Index, Phenolic Compounds and Antioxidant Activity of Hawthorn (Crataegus orientalis) Fruit. Not. Bot. Horti Agrobot. Cluj-Napoca 2018, 46, 449–456. [Google Scholar] [CrossRef] [Green Version]
  23. Darvishi, H.; Asl, A.R.; Asghari, A.; Azadbakht, M.; Najafi, G.; Khodaei, J. Study of the drying kinetics of pepper. J. Saudi Soc. Agric. Sci. 2014, 13, 130–138. [Google Scholar] [CrossRef] [Green Version]
  24. Viera, W.; Shinohara, T.; Samaniego, I.; Sanada, A.; Terada, N.; Ron, L.; Koshio, K. Phytochemical Composition and Antioxidant Activity of Passiflora spp. Germplasm Grown in Ecuador. Plants 2022, 11, 328. [Google Scholar] [CrossRef] [PubMed]
  25. Llerena, W.; Samaniego, I.; Navarro, M.; Ortíz, J.; Angós, I.; Carrillo, W. Effect of modified atmosphere packaging (MAP) in the antioxidant capacity of arazá (Eugenia stipitata McVaugh), naranjilla (Solanum quitoense Lam.), and tree tomato (Solanum betaceum Cav.) fruits from Ecuador. J. Food Process. Preserv. 2020, 44, e14757. [Google Scholar] [CrossRef]
  26. Pathare, P.; Opara, U.L.; Al-Said, F.A.-J. Colour Measurement and Analysis in Fresh and Processed Foods: A Review. Food Bioprocess Technol. 2012, 6, 36–60. [Google Scholar] [CrossRef]
  27. Bai, J.-W.; Sun, D.-W.; Xiao, H.-W.; Mujumdar, A.; Gao, Z.-J. Novel high-humidity hot air impingement blanching (HHAIB) pretreatment enhances drying kinetics and color attributes of seedless grapes. Innov. Food Sci. Emerg. Technol. 2013, 20, 230–237. [Google Scholar] [CrossRef]
  28. Juan, R.; Pastor, J.; Fernandez, I. SEM and light microscope observations on fruit and seeds in Scrophulariaceae from southwest Spain and their systematic significance. Ann. Bot. 2000, 86, 323–338. [Google Scholar] [CrossRef] [Green Version]
  29. Liu, Z.; He, C.; Guo, C.; Chen, F.; Bhandari, B.; Zhang, M. Dehydration-triggered shape transformation of 4D printed edible gel structure affected by material property and heating mechanism. Food Hydrocoll. 2021, 115, 106608. [Google Scholar] [CrossRef]
  30. Diamante, L.M.; Munro, P.A. Mathematical modelling of hot air drying of sweet potato slices. Int. J. Food Sci. Technol. 2007, 26, 99–109. [Google Scholar] [CrossRef]
  31. Yaldiz, O.; Ertekin, C.; Uzun, H. Mathematical modeling of thin layer solar drying of sultana grapes. Energy 2001, 26, 457–465. [Google Scholar] [CrossRef]
  32. Menges, H.O.; Ertekin, C. Mathematical modeling of thin layer drying of Golden apples. J. Food Eng. 2006, 77, 119–125. [Google Scholar] [CrossRef]
  33. Page, G.E. Factors Influencing the Maximum Rates of Air Drying Shelled Corn in Thin Layers; Purdue University: West Lafayette, IN, USA, 1949. [Google Scholar]
  34. Sharaf-Eldeen, Y.I.; Blaisdell, J.L.; Hamdy, M.Y. A Model for Ear Corn Drying. Trans. ASAE 1980, 23, 1261–1271. [Google Scholar] [CrossRef]
  35. Yagcioglu, A.D.A.C.F. Drying characteristic of laurel leaves under different conditions. In Proceedings of the 7th International Congress on Agricultural Mechanization and Energy, Adana, Turkey, 26–27 May 1999; Faculty of Agriculture, Cukurova University: Adana, Turkey, 1999; pp. 565–569. [Google Scholar]
  36. Singh, T.J.; Wang, J.H. The modulator-dependent protein kinase. A multifunctional protein kinase activatable by the Ca2+-dependent modulator protein of the cyclic nucleotide system. J. Biol. Chem. 1978, 253, 3387–3390. [Google Scholar]
  37. Sharaf-Eldeen, Y.I.; HaMWy, M.Y.; Blaisdell, J.L. Falling rate drying of fully exposed biological materials: A review of mathematical models. ASAE 1979, 79, 6522–6543. [Google Scholar]
  38. Midilli, A.D.N.A.N.; Kucuk, H.A.Y.D.A.R.; Yapar, Z.İ.Y.A. A new model for single-layer drying. Dry. Technol. 2002, 20, 1503–1513. [Google Scholar] [CrossRef]
  39. Aral, S.; Beşe, A.V. Convective drying of hawthorn fruit (Crataegus spp.): Effect of experimental parameters on drying kinetics, color, shrinkage, and rehydration capacity. Food Chem. 2016, 210, 577–584. [Google Scholar] [CrossRef]
  40. Vega-Gálvez, A.; Di Scala, K.; Rodríguez, K.; Lemus-Mondaca, R.; Miranda, M.; López, J.; Perez-Won, M. Effect of air-drying temperature on physico-chemical properties, antioxidant capacity, colour and total phenolic content of red pepper (Capsicum annuum, L. var. Hungarian). Food Chem. 2009, 117, 647–653. [Google Scholar] [CrossRef]
  41. Peleg, M. An Empirical Model for the Description of Moisture Sorption Curves. J. Food Sci. 1988, 53, 1216–1217. [Google Scholar] [CrossRef]
  42. Goula, A.M.; Adamopoulos, K.G. Modeling the Rehydration Process of Dried Tomato. Dry. Technol. 2009, 27, 1078–1088. [Google Scholar] [CrossRef]
  43. Apar, D.K.; Demirhan, E.; ÖZBEK, B.; Dadali, G. Rehydration kinetics of microwave-dried okras as affected by drying conditions. J. Food Process. Preserv. 2009, 33, 618–634. [Google Scholar] [CrossRef]
  44. Saguy, I.S.; Marabi, A.; Wallach, R. New approach to model rehydration of dry food particulates utilizing principles of liquid transport in porous media. Trends Food Sci. Technol. 2005, 16, 495–506. [Google Scholar] [CrossRef]
  45. Vega-Galvez, A.; Notte-Cuello, E.; Lemus-Mondaca, R.; Zura, L.; Miranda, M. Mathematical modelling of mass transfer during rehydration process of Aloe vera (Aloe barbadensis Miller). Food Bioprod. Process. 2009, 87, 254–260. [Google Scholar] [CrossRef]
  46. Noshad, M.; Mohebbi, M.; Shahidi, F.; Mortazavi, S.A. Kinetic modeling of rehydration in air-dried quinces pretreated with osmotic dehydration and ultrasonic. J. Food Process. Preserv. 2011, 36, 383–392. [Google Scholar] [CrossRef]
  47. Benassi, M.D.T.; Antunes, A.J. A comparison of metaphosphoric and oxalic acids as extractants solutions for the determination of vitamin C in selected vegetables. Arq. Biol. Tecnol. 1988, 31, 507–513. [Google Scholar]
  48. AOAC, H.W. International A: Official Methods of Analysis of the AOAC International; The Association: Arlington County, VA, USA, 2000. [Google Scholar]
  49. Singleton, V.L.; Orthofer, R.; Lamuela-Raventós, R.M. Analysis of total phenols and other oxidation substrates and antioxidants by means of folin-ciocalteu reagent. In Methods in Enzymology; Academic Press: London, UK, 1999; Volume 299, pp. 152–178. [Google Scholar]
  50. Grobelna, A.; Kalisz, S.; Kieliszek, M. The Effect of the Addition of Blue Honeysuckle Berry Juice to Apple Juice on the Selected Quality Characteristics, Anthocyanin Stability, and Antioxidant Properties. Biomolecules 2019, 9, 744. [Google Scholar] [CrossRef] [Green Version]
  51. Zhishen, J.; Mengcheng, T.; Jianming, W. The determination of flavonoid contents in mulberry and their scavenging effects on superoxide radicals. Food Chem. 1999, 64, 555–559. [Google Scholar] [CrossRef]
  52. Lee, J.; Durst, R.W.; Wrolstad, R.E. Determination of total monomeric anthocyanin pigment content of fruit juices, beverages, natural colorants, and wines by the pH differential method: Collaborative study. J. AOAC Int. 2005, 88, 1269–1278. [Google Scholar] [CrossRef] [Green Version]
  53. Hernández-Carrión, M.; Hernando, I.; Quiles, A. High hydrostatic pressure treatment as an alternative to pasteurization to maintain bioactive compound content and texture in red sweet pepper. Innov. Food Sci. Emerg. Technol. 2014, 26, 76–85. [Google Scholar] [CrossRef]
  54. Benzie, I.F.; Strain, J.J. The ferric reducing ability of plasma (FRAP) as a measure of “antioxidant power”: The FRAP assay. Anal. Biochem. 1996, 239, 70–76. [Google Scholar] [CrossRef] [Green Version]
  55. Zannou, O.; Koca, I.; Aldawoud, T.; Galanakis, C.M. Recovery and stabilization of anthocyanins and phenolic antioxidants of roselle (Hibiscus sabdariffa L.) with hydrophilic deep eutectic solvents. Molecules 2020, 25, 3715. [Google Scholar] [CrossRef]
  56. Kalisz, S.; Oszmiański, J.; Kolniak-Ostek, J.; Grobelna, A.; Kieliszek, M.; Cendrowski, A. Effect of a variety of polyphenols compounds and antioxidant properties of rhubarb (Rheum rhabarbarum). LWT 2019, 118, 108775. [Google Scholar] [CrossRef]
  57. Zannou, O.; Pashazadeh, H.; Galanakis, C.M.; Alamri, A.S.; Koca, I. Carboxylic acid-based deep eutectic solvents combined with innovative extraction techniques for greener extraction of phenolic compounds from sumac (Rhus coriaria L.). J. Appl. Res. Med. Aromat. Plants 2022, 30, 100380. [Google Scholar] [CrossRef]
  58. Li, H.; Qin, D.; Wu, Z.; Sun, B.; Sun, X.; Huang, M.; Zheng, F. Characterization of key aroma compounds in Chinese Guojing sesame-flavor Baijiu by means of molecular sensory science. Food Chem. 2019, 284, 100–107. [Google Scholar] [CrossRef] [PubMed]
  59. Cserhalmi, Z.; Sass-Kiss, Á.; Tóth-Markus, M.; Lechner, N. Study of pulsed electric field treated citrus juices. Innov. Food Sci. Emerg. Technol. 2006, 7, 49–54. [Google Scholar] [CrossRef]
  60. Wojdyło, A.; Figiel, A.; Oszmianski, J. Effect of drying methods with the application of vacuum micro-waves on the bioactive compounds, color, and antioxidant activity of strawberry fruits. J. Agric. Food Chem. 2009, 57, 1337–1343. [Google Scholar] [CrossRef]
  61. Figiel, A.; Michalska, A. Overall quality of fruits and vegetables products affected by the drying processes with the assistance of vacuum-microwaves. Int. J. Mol. Sci. 2016, 18, 71. [Google Scholar] [CrossRef] [Green Version]
  62. Calín-Sánchez, Á.; Lipan, L.; Cano-Lamadrid, M.; Kharaghani, A.; Masztalerz, K.; Carbonell-Barrachina, A.; Figiel, A. Comparison of Traditional and Novel Drying Techniques and Its Effect on Quality of Fruits, Vegetables and Aromatic Herbs. Foods 2020, 9, 1261. [Google Scholar] [CrossRef]
  63. Kaur, R.; Kaur, K. Effect of processing on color, rheology and bioactive compounds of different sweet pepper purees. Plant Foods Hum. Nutr. 2020, 75, 369–375. [Google Scholar] [CrossRef]
  64. Jeong, H.K.; Lee, D.; Kim, H.P.; Baek, S.H. Structure analysis and antioxidant activities of an amylopectin-type polysaccharide isolated from dried fruits of Terminalia chebula. Carbohydr. Polym. 2019, 211, 100–108. [Google Scholar] [CrossRef]
  65. Abbasi, H.; Layeghiniya, N.; Mohammadi, S.; Karimi, S. Effect of fruit thickness on microwave drying characteristics of Myrtus communis L. Iran. J. Chem. Chem. Eng. 2022. [Google Scholar] [CrossRef]
  66. Simal, S.; Femenia, A.; Garau, M.C.; Rosselló, C. Use of exponential, Page’s and diffusional models to simulate the drying kinetics of kiwi fruit. J. Food Eng. 2005, 66, 323–328. [Google Scholar] [CrossRef]
  67. Toğrul, İ.T.; Pehlivan, D. Modelling of thin layer drying kinetics of some fruits under open-air sun drying process. J. Food Eng. 2004, 65, 413–425. [Google Scholar] [CrossRef]
  68. Castro, A.; Mayorga, E.; Moreno, F. Mathematical modelling of convective drying of fruits: A review. J. Food Eng. 2018, 223, 152–167. [Google Scholar] [CrossRef]
  69. Bassey, E.J.; Cheng, J.H.; Sun, D.W. Improving drying kinetics, physicochemical properties and bioactive compounds of red dragon fruit (Hylocereus species) by novel infrared drying. Food Chem. 2022, 375, 131886. [Google Scholar] [CrossRef] [PubMed]
  70. Roy, M.; Bulbul, A.I.; Hossain, M.A.; Shourove, J.H.; Ahmed, S.; Sarkar, A.; Biswas, R. Study on the drying kinetics and quality parameters of osmotic pre-treated dried Satkara (Citrus macroptera) fruits. J. Food Meas. Charact. 2021, 16, 471–485. [Google Scholar] [CrossRef]
  71. Hayat, K.; Abbas, S.; Hussain, S.; Shahzad, S.A.; Tahir, M.U. Effect of microwave and conventional oven heating on phenolic constituents, fatty acids, minerals and antioxidant potential of fennel seed. Ind. Crops Prod. 2019, 140, 111610. [Google Scholar] [CrossRef]
  72. Mphahlele, R.R.; Fawole, O.A.; Makunga, N.P.; Opara, U.L. Effect of drying on the bioactive compounds, antioxidant, antibacterial and antityrosinase activities of pomegranate peel. BMC Complement. Altern. Med. 2016, 16, 143. [Google Scholar] [CrossRef] [Green Version]
  73. Kamiloglu, S.; Toydemir, G.; Boyacioglu, D.; Beekwilder, J.; Hall, R.D.; Capanoglu, E. A Review on the Effect of Drying on Antioxidant Potential of Fruits and Vegetables. Crit. Rev. Food Sci. Nutr. 2015, 56, S110–S129. [Google Scholar] [CrossRef]
  74. Ng, Z.X.; Yong, P.H.; Lim, S.Y. Customized drying treatments increased the extraction of phytochemicals and antioxidant activity from economically viable medicinal plants. Ind. Crops Prod. 2020, 155, 112815. [Google Scholar] [CrossRef]
  75. Saifullah, M.; McCullum, R.; McCluskey, A.; Vuong, Q. Effects of different drying methods on extractable phenolic compounds and antioxidant properties from lemon myrtle dried leaves. Heliyon 2019, 5, e03044. [Google Scholar] [CrossRef] [Green Version]
  76. Papoutsis, K.; Pristijono, P.; Golding, J.B.; Stathopoulos, C.E.; Bowyer, M.C.; Scarlett, C.J.; Vuong, Q.V. Effect of vacuum-drying, hot air-drying and freeze-drying on polyphenols and antioxidant capacity of lemon (Citrus limon) pomace aqueous extracts. Int. J. Food Sci. Technol. 2017, 52, 880–887. [Google Scholar] [CrossRef] [Green Version]
  77. Oklar, H.; Akbulut, M. Effect of sun, oven and freeze-drying on anthocyanins, phenolic compounds and antioxidant activity of black grape (Ekşikara) (Vitis vinifera L.). S. Afr. J. Enol. Vitic. 2017, 38, 264–272. [Google Scholar]
  78. Mahdavi, S.A.; Sadeghi, R.; Faridi, A.; Hedayati, S.; Shaddel, R.; Dima, C.; Jafari, S.M. Nanodelivery systems for d-limonene; techniques and applications. Food Chem. 2022, 384, 132479. [Google Scholar] [CrossRef] [PubMed]
  79. Lotfabadi, S.V.; Mortazavi, S.A.; Yeganehzad, S. Study on the release and sensory perception of encapsulated d -limonene flavor in crystal rock candy using the time–intensity analysis and HS-GC/MS spectrometry. Food Sci. Nutr. 2020, 8, 933–941. [Google Scholar] [CrossRef]
  80. Li, K.; Zhou, R.; Jia, W.W.; Li, Z.; Li, J.; Zhang, P.; Xiao, T. Zanthoxylum bungeanum essential oil induces apoptosis of HaCaT human keratinocytes. J. Ethnopharmacol. 2016, 186, 351–361. [Google Scholar] [CrossRef]
  81. Tatsadjieu, L.N.; Ngang, J.E.; Ngassoum, M.B.; Etoa, F.X. Antibacterial and antifungal activity of Xylo-pia aethiopica, Monodora myristica, Zanthoxylum xanthoxyloıdes and Zanthoxylum leprieurii from Cameroon. Fitoterapia 2003, 74, 469–472. [Google Scholar] [CrossRef]
  82. Letizia, C.; Cocchiara, J.; Lalko, J.; Api, A. Fragrance material review on linalool. Food Chem. Toxicol. 2003, 41, 943–964. [Google Scholar] [CrossRef]
Figure 1. The shrinkage of tree tomato fruit after drying. MW: Microwaves, FD: Freeze-dried.
Processes 10 01437 g001
Figure 2. Surface morphological structure of fresh and dried tree tomato fruit taken by SEM.
Processes 10 01437 g002
Figure 3. Drying curves of the Microwave drying process of tree tomato fruit.
Processes 10 01437 g003
Figure 4. Rehydration curve of microwaves dried and freeze-dried tree tomato fruit.
Processes 10 01437 g004
Table 1. Mathematical models applied to the drying curves.
Models Name Models FormulaReferences
PageMR = exp(−ktn)[33]
Two-term exponentialMR = a exp(−kt) + (1 − a) exp(−kat)[34]
LogarithmicMR = a exp(−kt) + b[35]
Wang and SinghMR = 1 + at + bt2[36]
Approximation of DiffusionMR = a exp(−kt) + (1 − a) exp(−kbt)[37]
MidilliMR = a exp(−ktn) + bt[38]
MR is the moisture ratio; t is the time; and α, b, c, k, and n are the constants of models.
Table 2. Mathematical models applied to the rehydration curves.
Model Name Model FormulaReferences
Peleg M ( t ) = M 0 + t a + b t [41]
Weibull M ( t ) = M e + ( M 0 M e ) exp [ ( t b ) a ] [42]
First order kinetic M ( t ) = M e + ( M 0 M e ) exp ( a t ) [43]
Exponential ModelM(t) = Me + (M0 − Me) exp(−atk)[44]
Proposed Model M ( t ) = a   exp ( b ( 1 + t ) k ) [45]
Exponential Related EquationM(t) = Me(1 − exp(−at))[46]
M(t) is the moisture ration in the function of time, a, b and k are the constants of models.
Table 3. Color characteristic and morphological characteristics of dried tree tomatoes.
Methods Lab∆EHue AngleChroma
350 W20.58 ± 1.31 b6.86 ± 1.69 a4.28 ± 0.65 b21.56 ± 2.25 a 31.51 ± 6.73 d 8.12 ± 2.04 c
500 W23.37 ± 4.49 ab7.34 ± 1.69 a5.86 ± 0.27 ab20.66 ± 1.51 ab 36.92 ± 1.65 c9.51 ± 3.00 b
650 W21.66 ± 0.34 b6.63 ± 0.22 a7.73 ± 0.65 a19.16 ± 0.43 b 49.33 ± 1.98 a 10.19 ± 0.59 ab
FD27.71 ± 0.47 a8.31 ± 0.21 a8.29 ± 0.26 a13.49 ± 0.27 c 44.93 ± 1.61 b 11.74 ± 0.08 a
There is no statistical difference between the averages shown with the same letter in the same row (p > 0.05).
Table 4. Dehydration kinetics models.
MethodModel NameSSER2RMSEX2Model Constants
MW350Wang and Singh0.100.990.040.00a = −0.015746 b = 2.388 × 10−05
Approximation of Diffusion0.050.990.030.00a = 2.188 b = −2.6626 k = 0.0094144
Page0.010.990.010.00k = 0.0017301 y = 1.7232
Logarithmic0.050.990.030.00a = 2.1816 b = −1.0988 k = 0.0094554
Midilli0.010.990.010.00a = 0.97272 b = −0.053816 k = −0.091877 n = 0.6355
Two-term exponential0.050.990.030.00a = 2.1307 k = 0.042673
MW500Wang and Singh0.030.990.030.00a = −0.01716 b = −9.6673 × 10−05
Approximation of Diffusion0.020.990.020.00a = 8.1429 b = −1.824 k = 0.0029664
Page0.020.990.020.00k = 0.0016625 y = 1.8959
Logarithmic0.010.990.020.00a = 73.5186 b = −72.4614 k = 0.00030639
Midilli0.010.990.010.00a = 0.99761 b = −0.023706 k = −0.052838 n = 0.17678
Two-term exponential0.080.980.040.00a = 2.1606 k = 0.058609
MW650Wang and Singh0.020.990.030.00a = −0.020247 b = −0.00025716
Approximation of Diffusion0.020.990.030.00a = 9.9362 b = 1.7107 k = 0.0032205
Page0.020.990.020.00k = 0.001962 y = 2.0056
Logarithmic0.020.990.020.00a = 94.5642 b = −93.4931 k = 0.00031942
Midilli0.010.990.010.00a = 0.99494 b = −0.03611 k = −0.057308 n = 0.39814
Two-term exponential0.080.980.050.00a = 2.1813 k = 0.076869
α, b, c, k, n, and y are the constants of models.
Table 5. Rehydration kinetics mathematical modeling.
MethodsModelsSSER2RMSEX2Model Constants
MW 350Peleg0.060.990.110.01a = 5.9582 b = 0.37274
First order kinetic0.050.990.090.01a = 0.057467
Exponential related equation0.050.990.090.01a = 0.057466
Exponential model0.040.990.090.01a = 0.041472, k = 1.1014
Weibull0.040.990.090.01a = 1.1019, b = 17.9891
proposed model0.050.990.110.01a = 2.438, b = 19.0225, k = 1.204
MW 500Peleg0.030.980.070.00a = 10.1066, b = 0.62977
First order kinetic0.010.990.040.00a = 0.052314
Exponential related equation0.010.990.040.00a = 0.052315
Exponential model0.010.990.040.00a = 0.028411, k = 1.1927
Weibull0.010.990.040.00a = 1.1934, b = 19.7981
proposed model0.001.000.020.00a = 1.3466, b = 168.7216, k = 1.9786
MW 650Peleg0.011.000.030.00a = 2.4679, b = 0.44546
First order kinetic0.021.000.050.00a = 0.092312
Exponential related equation0.021.000.050.00a = 0.092313
Exponential model0.011.000.030.00a = 0.21323, k = 0.71353
Weibull0.011.000.030.00a = 0.71379, b = 8.7242
proposed model0.011.000.030.00a = 2.1926, b = 7.598, k = 1.1675
FDPeleg0.011.000.040.00a = 0.13338, b = 0.32209
First order kinetic0.011.000.060.00a = 1.491
Exponential related equation0.011.000.060.00a = 1.491
Exponential model0.011.000.050.00a = 1.5407, k = 0.80783
Weibull0.011.000.050.00a = 0.80837, b = 0.58589
proposed model0.021.000.100.01a = 2.7692, b = 4.3711, k = 4.1696
FD: freeze drying, MW: Microwaves, a, b and k are model’s constants.
Table 6. Antioxidant properties of dried tree tomato fruit.
MethodsTPC (mg GAE/g)TCC (μg/g)TFC (mg/g)Anth (mg/g)VitC (mg/g)FRAP (mmol ISE/g)DPPH (mmol Trolox/g)
FD3.94 ± 0.26 a0.48 ± 0.04 a0.95 ± 0.05 b0.85 ± 0.02 a1.671 ± 0.02 ab71.69 ± 1.13 b46.14 ± 1.39 cd
MW350 W2.37 ± 0.34 c0.25 ± 0.09 b1.56 ± 0.10 b0.12 ± 0.00 c1.58 ± 0.02 c71.11 ± 0.44 b51.50 ± 1.74 b
MW500 W2.10 ± 0.31 d0.17 ± 0.07 cd1.26 ± 0.09 d0.11 ± 0.01 c1.15 ± 0.078 d81.34 ± 3.35 a48.09 ± 1.11 c
MW650 W2.90 ± 0.42 b0.15 ± 0.04 d1.82 ± 0.40 a0.25 ± 0.04 b1.78 ± 0.04 a35.17 ± 1.11 c57.48 ± 0.90 a
There is no statistical difference between the averages shown with the same letter in the same row (p > 0.05).
Table 7. Phenolic profile of dried tree tomatoes.
MethGallic Acid (mg/g)p-Coumaric Acid (mg/g)Sinapic Acid (mg/g)Salicylic Acid (mg/g)Resveratrol (mg/g)Q.-3-Glu (mg/g)Catechin (mg/g)Epicatechin (mg/g)
350 W0.602 ± 0.008 a0.003 ± 0.000 b0.057 ± 0.002 cd0.063 ± 0.004 ab0.009 ± 0.000 e0.057 ± 0.002 bc1.071 ± 0.039 b2.596 ± 0.041 b
500 W0.444 ± 0.004 b0.002 ± 0.000 b0.081 ± 0.002 c0.030 ± 0.004 b0.010 ± 0.000 cd0.081 ± 0.003 b0.808 ± 0.026 c2.790 ± 0.038 a
650 W0.649 ± 0.004 a0.013 ± 0.001 a0.038 ± 0.007 b0.074 ± 0.009 a0.009 ± 0.000 e0.038 ± 0.001 c1.448 ± 0.006 a2.615 ± 0.039 ab
FD0.105 ± 0.003 c0.001 ± 0.000 b0.122 ± 0.006 a0.058 ± 0.002 bc0.012 ± 0.002 a0.122 ± 0.008 a0.158 ± 0.013 d0.118 ± 0.00 c
There is no statistical difference between the averages shown with the same letter in the same row (p > 0.05).
Table 8. The anthocyanin profile of dried tree tomatoes.
Drying Methods Cyanine Chlorite (mg/kg)Cyanidin-3-Glucoside (mg/kg)Pelargonidine-3-Glucosite (mg/kg)
350 W2.62 ± 0.01 b8.79 ± 0.22 c71.51 ± 1.26 c
500 W2.34 ± 0.00 b11.02 ± 0.03 b124.29 ± 0.38 c
650 W2.31 ± 0.01 b16.11 ± 0.86 b251.28 ± 3.40 b
FD19.34 ± 0.84 a99.28 ± 1.51 a1223.82 ± 5.96 a
There is no statistical difference between the averages shown with the same letter in the same row (p > 0.05).
Table 9. Aroma compounds isolated from dried tree tomatoes (µg/kg).
Alcohol
Compounds 350 W500 W650 WFD
  • 3-Decyn-2-ol
ndndnd33.62 ± 1.54 a
2.
Dodecanol
nd nd nd 6.12 ± 1.87 a
3.
Eucalyptol
213.84 ± 80.94 a 47.48 ± 20.74 c 54.35 ± 0.27 b 63.58 ± 2.46 b
4.
p-Mentha1,5-dien-8-ol
11.46 ± 0.24 b12.26 ±1.87 b9.82 ± 0.40 c25.82 ±7.22 a
5.
Dehydro-1-8-cineole
nd 1.71 ± 1.41 b nd 7.43 ± 2.67 a
6.
3,7-dimethyl-1,7-octanediol
nd nd nd 29.86 ± 0.00
7.
Furanmethanol
7.03 ± 0.23 b8.34 ± 0.22 a7.46 ± 0.67 bnd
Acids.
8.
Pyridine carboxylic acid
5.62 ± 0.57 and4.17 ± 0.41 bnd
9.
Cyclopentylacetic acid
nd6.28 ± 0.71 a 5.15 ± 1.18 bnd
Esters.
10.
Amyl acetate
nd 2.21 ± 0.46 a 2.99 ± 2.99 a nd
11.
Benzoic acid, methyl ester
nd 1.79 ± 1.79 c 5.02 ± 0.48 b 18.19 ± 0.42 a
12.
Butanedioic acid, methyl-, ester
17.84 ± 17.84 a4.56 ± 0.36 bndnd
13.
Butanoic acid, 4-ethyl ester
30.47 ± 5.22 c47.11 ± 7.70 b51.43 ± 40.58 a7.18 ± 0.88 d
14.
Ethyl Acetate
ndndnd12.75 ± 0.44
15.
Hexanoic acid, methyl ester
49.28 ± 0.21 b37.26 ± 23.84 c 35.87 ± 25.06 c 135.28 ± 1.00 a
16.
Propanoic acid, 2-methyl-, 1-methylethyl ester
5.09 ± 0.51 b6.26 ± 0.47 a4.06 ± 2.46 bnd
17.
Octanoic-acid-ethyl-ester
5.16 ± 1.94 b 2.30 ± 1.31 c 5.33 ± 4.16 b 12.72 ± 6.27 a
18.
Linalyl acetate
ndndnd10.16 ± 0.85
Terpene
19.
Carene-1S-3R-6R-gamma-Terpinene
4.25 ± 2.92 bc 8.37 ± 5.84 a nd 5.97 ± 0.79 b
20.
D-Limonene
11.77 ± 2.16 c 14.25 ± 10.02 b 11.39 ± 6.66 c 17.25 ± 2.49 a
21.
Octane-2-methyl-N-N-Dimethyl piperazine
5.24 ± 1.71 b 1.39 ± 0.74 c 4.82 ± 3.31 bc 7.40 ± 7.40 a
22.
p-cymene
38.16 ± 0.93 a 30.87 ± 5.51 b 35.79 ± 7.09 ab 27.99 ± 1.88 c
23.
Phellandrene
nd 2.61 ± 0.55 and nd
24.
α-Pinene
25.
β-Pinene/beta myrcene
nd 4.48 ± 2.95 b 5.08 ± 3.60 a 3.70 ± 0.08 c
26.
2-Methyl-1,3,5-hexatriene
ndnd4.66 ± 2.05nd
27.
Linalool
ndndnd9.90 ± 6.30 a
Aldehydes and ketones
28.
Acetaldehyde
8.77 ± 0.76 bc9.12 ± 0.01 b8.02 ± 0.08 bc21.73 ± 16.77 a
29.
TATP Butanal
8.22 ± 0.70 c14.29 ± 1.59 b17.00 ± 0.91 and
30.
Pentanal
nd13.82 ± 6.3612.20 ± 1.90nd
31.
Heptanal
nd 1.45 ± 0.86 a nd nd
32.
Octanal
nd 10.68 ± 6.77 a nd 1.84 ± 1.84 b
33.
Nonanone
nd 2.97 ± 1.92 b nd 19.61 ± 19.61 a
34.
Sulcatone (6-methyl-5-hepten-2-one)
nd 14.78 ± 11.61 a nd 4.64 ± 0.01 b
35.
Nonanal
11.25 ± 2.35 c 29.90 ± 4.62 b 12.92 ± 0.75 c 48.35 ± 6.69 a
36.
Decanal
7.57 ± 0.84 b 9.26 ± 0.10 a9.04 ± 0.44 and
37.
Furfural
389.60 ± 11.95 c 419.98 ± 52.98 ab 433.51 ± 14.96 a 26.81 ± 5.45 d
38.
Ethanone
13.39 ± 0.45 c 17.95 ± 1.03 a 17.67 ± 0.84 a 15.73 ± 4.11 b
39.
Butanal-2-methyl
21.78 ± 0.75 c 42.24 ± 9.11 b 56.58 ± 11.76 a nd
40.
Isovaleraldehyde (3-methylbutanal)
53.24 ± 5.62 b 55.04 ± 36.46 b 98.43 ± 16.99 a nd
41.
5-Ethoxydihydro-2(3H)-furanone
52.24 ± 0.87 c 65.51 ± 7.21 b 72.41 ± 3.30 and
42.
5-Methyl-2(5H)-furanone
6.28 ± 0.21 ab 7.45 ± 0.70 a 6.36 ± 0.48 ab nd
43.
2-furan carboxaldehyde 5-methy
44.08 ± 1.04 b 53.70 ± 4.94 a 53.55 ± 7.42 a 6.17 ± 2.10 c
44.
H-pyrrol-2-yl-Ethanone
31.07 ± 8.79 c 37.25 ± 2.02 a 33.57 ± 11.51 b nd
45.
Pyran-4-one
19.31 ± 8.84 a 2.89 ± 2.89 c 16.24 ± 6.10 ab nd
46.
Hydroxymethylfurfural (HMF)
75.74 ± 6.63 a 22.63 ± 1.31 c 45.69 ± 11.16 b nd
47.
2,5-Furandicarboxaldehyde
12.07 ± 3.14 a 6.40 ± 6.40 b 11.72 ± 4.11 a 1.91 ± 1.91 c
48.
Cyclohexenone
ndndnd9.50 ± 5.52 a
49.
Benzofuranone
ndndnd6.60 ± 4.53 a
Others
50.
Carbondioxide
42.00 ± 0.21 b41.12 ± 1.56 b44.25 ± 5.15 a14.20 ± 7.52 c
51.
Borane methyl sulfide complex
5.35 ± 0.30 c 12.63 ± 0.54 a 6.61 ± 0.69 b nd
52.
Tetradecane
30.97 ± 10.35 b 16.83 ± 0.06 d 23.63 ± 1.55 c 34.76 ± 12.03 a
53.
Benzenepropanamine
ndnd4.64 ± 0.56 b 17.96 ± 6.20 a
54.
2,2,4,6,6-pentamethylheptane
ndndnd45.10 ± 3.06 a
There is no statistical difference between the averages shown with the same letter in the same row (p > 0.05). nd: not detected.
Publisher’s Note: MDPI stays neutral with regard to jurisdictional claims in published maps and institutional affiliations.

