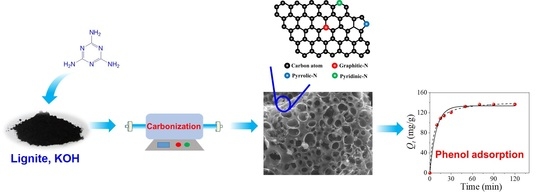
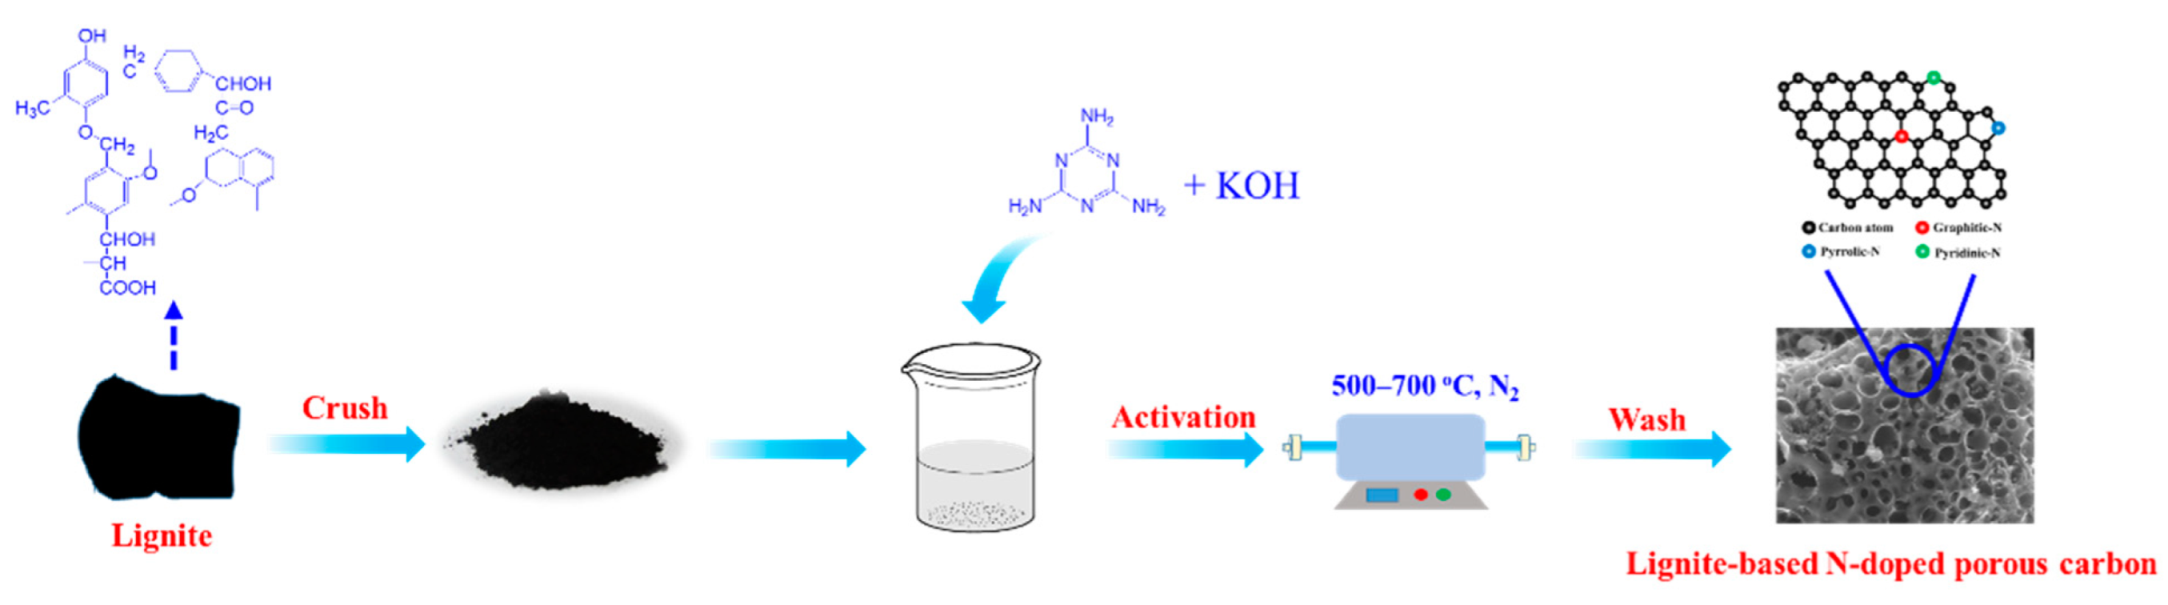
3.1. Characteristics of Lignite-Based Porous Carbon
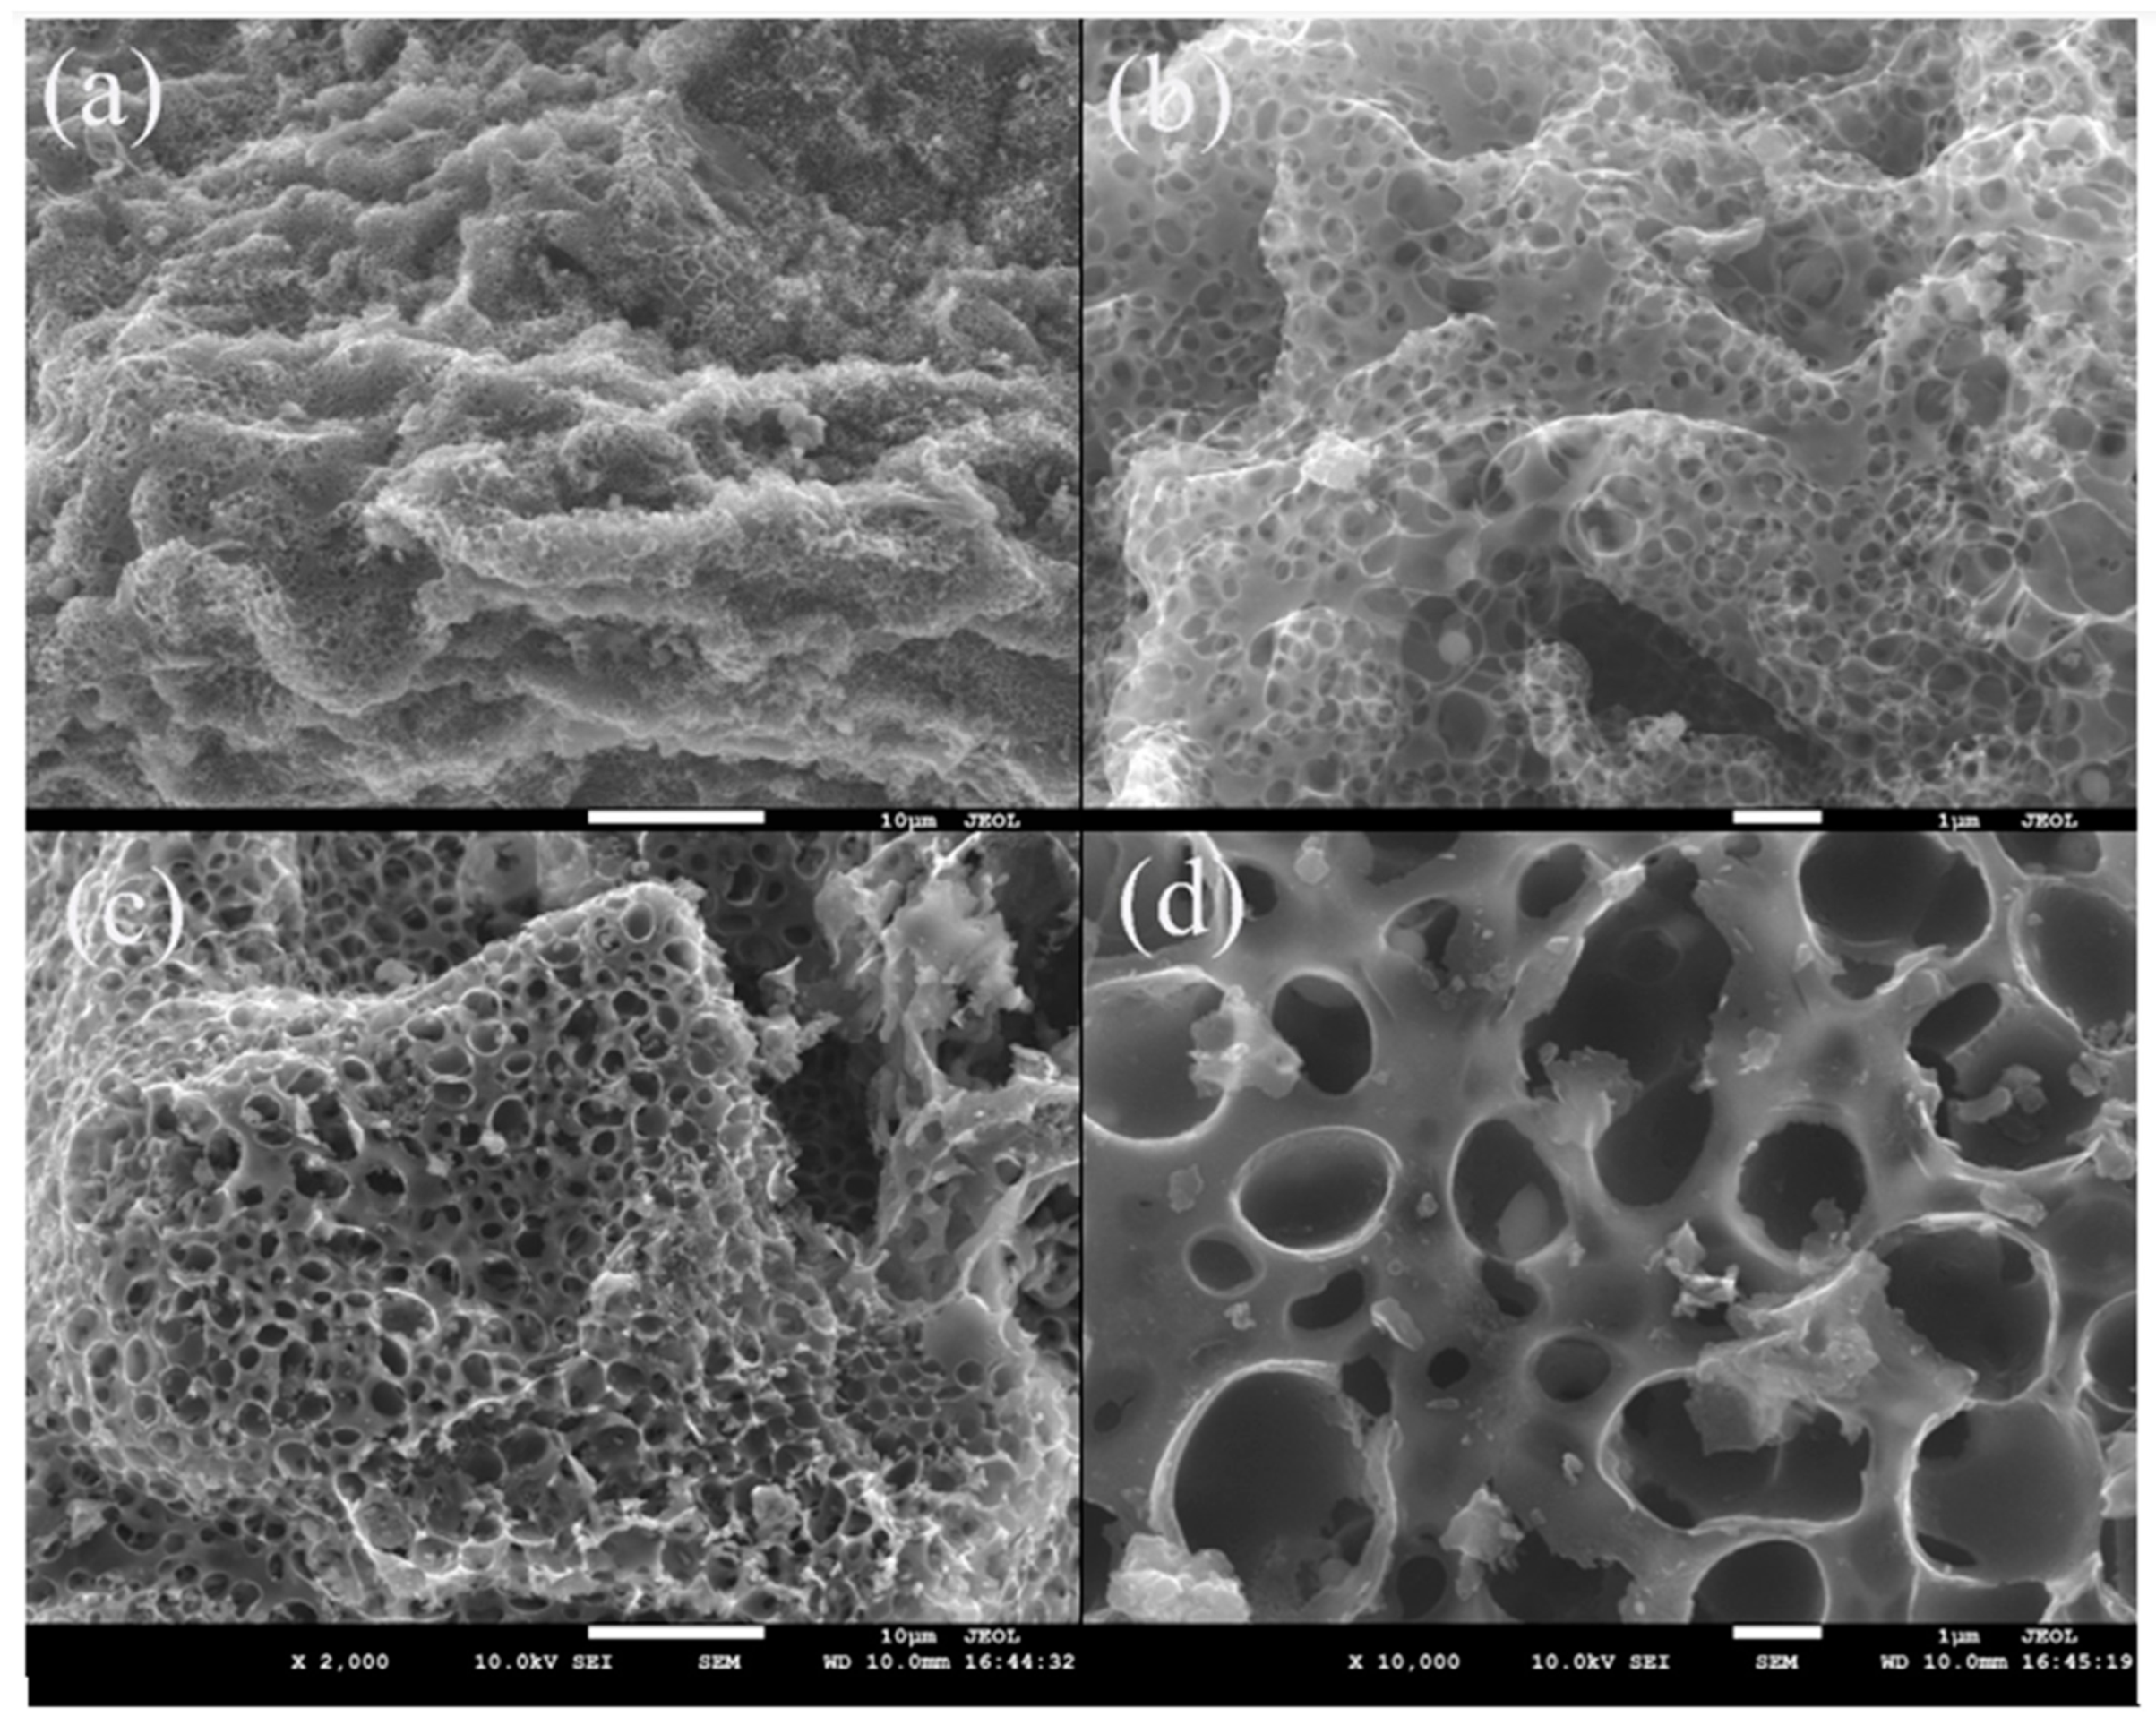
The micro-scale morphology of lignite-based N-doped carbon materials was characterized by SEM measurement. As shown in
Figure 1, L-600 and L-CN-600 are irregular blocky solids with a rough and etched surface. A large number of macropores or cavities are formed over the surface of samples due to the harsh activation by KOH at 600 °C [
30]. However, the L-CN-600 presents an interconnected three-dimensional hollow morphology, with a larger macropore diameter than that of L-600. By contrast, it is observed that the destruction by KOH etching over L-600 mostly occurs on the surface of lignite. These results indicate that the etching process by KOH is intensified by the introduction of tripolycyanamide, probably due to the fact that the decomposition products of tripolycyanamide, such as N
2 and NH
3, contribute to the formation, expansion and connection of pore systems during activation at high temperature (500–700 °C) [
37].
The textural properties of samples were characterized by an N
2 adsorption–desorption isotherms method, and the results are shown in
Figure 2 and
Table 1. All the samples show the typical Type-IV isotherms, indicative of their micro-mesoporous structures. The adsorption volume of N
2 rapidly lifts at relative pressures of P/P
0 < 0.1 in all the samples, indicating that abundant micropores are formed. In addition, all samples present the hysteresis loop in the relative pressure P/P
0 of 0.45–1.0, suggesting a distinct formation of mesopores. The BJH pore size distributions of samples are shown in
Figure 2c,d, which demonstrates that the pore size of mesopores for all samples is centered at around 4 nm.
Table 1 shows that L-500 has a surface area of 424 m
2/g and a total pore volume of 0.25 cm
3/g. A further increase in activation temperature increases the surface area and pore volume, and L-700 gives a surface area of 814 m
2/g and a pore volume of 0.43 cm
3/g. However, with increasing the activation temperature, the average pore size is slightly decreased. The L-CN-500, 600 and 700 samples show a similar trend. Interestingly, the introduction of tripolycyanamide largely improves the surface area and micropore volume (V
micro) of lignite-based carbon materials. The L-CN-500, 600 and 700 samples have a surface area of 762, 1041 and 1630 m
2/g, which are 1.8, 1.9 and 2.0 times that of L-500, 600 and 700, respectively. The total pore volume of L-CN-700 is 0.66 cm
3/g, which is 0.35 cm
3/g larger than L-700. However,
Table 1 discloses that the external surface areas (S
meso) of L-CN-500, 600 and 700 samples are quite comparable with L-500, 600 and 700, respectively, suggesting that the introduction of tripolycyanamide mainly improves the amounts of micropores. The SEM analysis shows that introduction of tripolycyanamide results in a larger macropore diameter over samples, while the N
2 sorption results reveal that the surface area and micropore volume are largely improved with the assistance of tripolycyanamide. Obviously, this micro-meso-macro hierarchical structure of lignite-based N-doped carbon is facilitated to reduce the diffusion resistance of adsorbate, thus enhancing the accessibility of phenol molecules to adsorption sites.
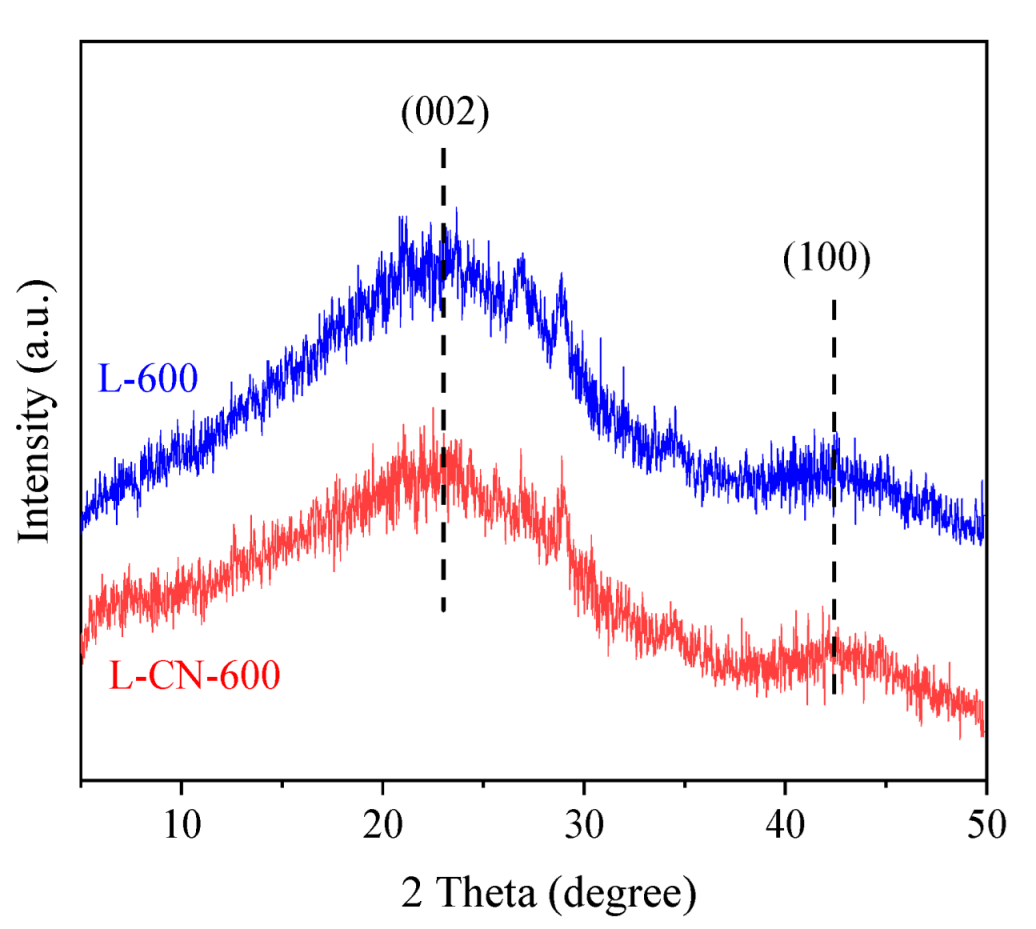
The XRD patterns of L-600 and L-CN-600 are shown in
Figure 3. One broad diffraction peak located at 2θ of ca. 22.9
° corresponding to the (002) plane is observed for both samples, indicating that they are amorphous carbon materials [
31,
38]. In addition, the (100) diffraction peak (2θ of ca. 42.5
°) is also distinct for these two samples, implying that they have a high graphitization degree [
39].
In order to obtain further confirmation on the structure of lignite-based carbon, Raman spectra of all samples were collected, as shown in
Figure 4. All samples show two distinct bands at 1588 (G-band, highly ordered graphitic structure) and 1340 cm
−1 (D-band, disordered structure), indicating that the lignite-based carbon materials are composed of highly ordered graphite and disordered structures, consistent with the XRD results. The intensity ratio of D-band to G-band (I
D/I
G) is often used to estimate the degree of graphitization for carbon materials [
40,
41]. A higher value of I
D/I
G represents a lower graphitization degree with more disordered structures or topological defects.
Figure 4 shows that the I
D/I
G value increases from 0.87 for L-500 to 1.02 for L-700, suggesting that the increase in activation temperature leads to a decline in graphitization degree. This phenomenon can be explained by the fact that a higher activation temperature causes a more serious decomposition of functional groups over the lignite-based carbon materials, thus generating more defects or disordered structures over the carbon matrix.
The chemical compositions of lignite-based porous carbons prepared at different activation temperatures are listed in
Table 2. The samples with no addition of tripolycyanamide have a nitrogen content of 0.90–1.75% because the raw lignite itself contains a certain amount of nitrogen. In addition, sulfur is also included in all samples as an impurity of lignite. With increasing the activation temperature, the N, H and S contents distinctly decrease owing to the decompositions of functional groups over the lignite-based carbons. In addition, the introduction of tripolycyanamide strikingly improves the N content in carbon materials, which increases from 1.75%, 1.64% and 0.90% for L-500, 600, and 700 to 3.49%, 3.50% and 1.53% for L-CN-500, 600 and 700, respectively, indicating that N atoms are successfully doped into lignite-based carbons with tripolycyanamide as the N source.
The presence of surface functional groups over lignite-based porous carbon was evidenced by XPS measurement.
Figure 5 shows the wide scan of the L-CN-600 sample, and it can be seen that some impurity peaks assigned to Ca and K are observed.
Figure 6 shows the N 1s XPS spectra in narrow scans, which can be deconvolved into three groups depending on the binding energies. The N 1s peaks located at 398.6, 400 and 401 eV are assigned to pyridinic-N, pyrrolic-N and graphitic-N groups, respectively [
13,
16,
42].
Table 3 shows that the relative amounts of graphitic-N and pyrrolic-N increase with the activation temperature, implying that the high activation temperature was favorable to the formation of graphitic-N and pyrrolic-N groups, although the total amount of different types of nitrogen species decreased. In contrast, the relative content of the pyridinic-N group steadily decreases from 29.2% for L-500 to 22.0% for L-700, with activation temperature increasing from 500 to 700 °C, while the relative content of pyridinic-N reaches the maximum value of 41.2% over the L-CN-500 sample, then rapidly declines to 14.1% when activation temperature increases to 700 °C. These results suggest that some of the pyridinic-N groups are unstable at high activation temperatures, probably convert into graphitic-N and pyrrolic-N groups or are decomposed during the activation process. As reported previously [
13], these N-containing groups are important functional groups for phenol adsorption despite the fact that their adsorption mechanisms are not fully elucidated.
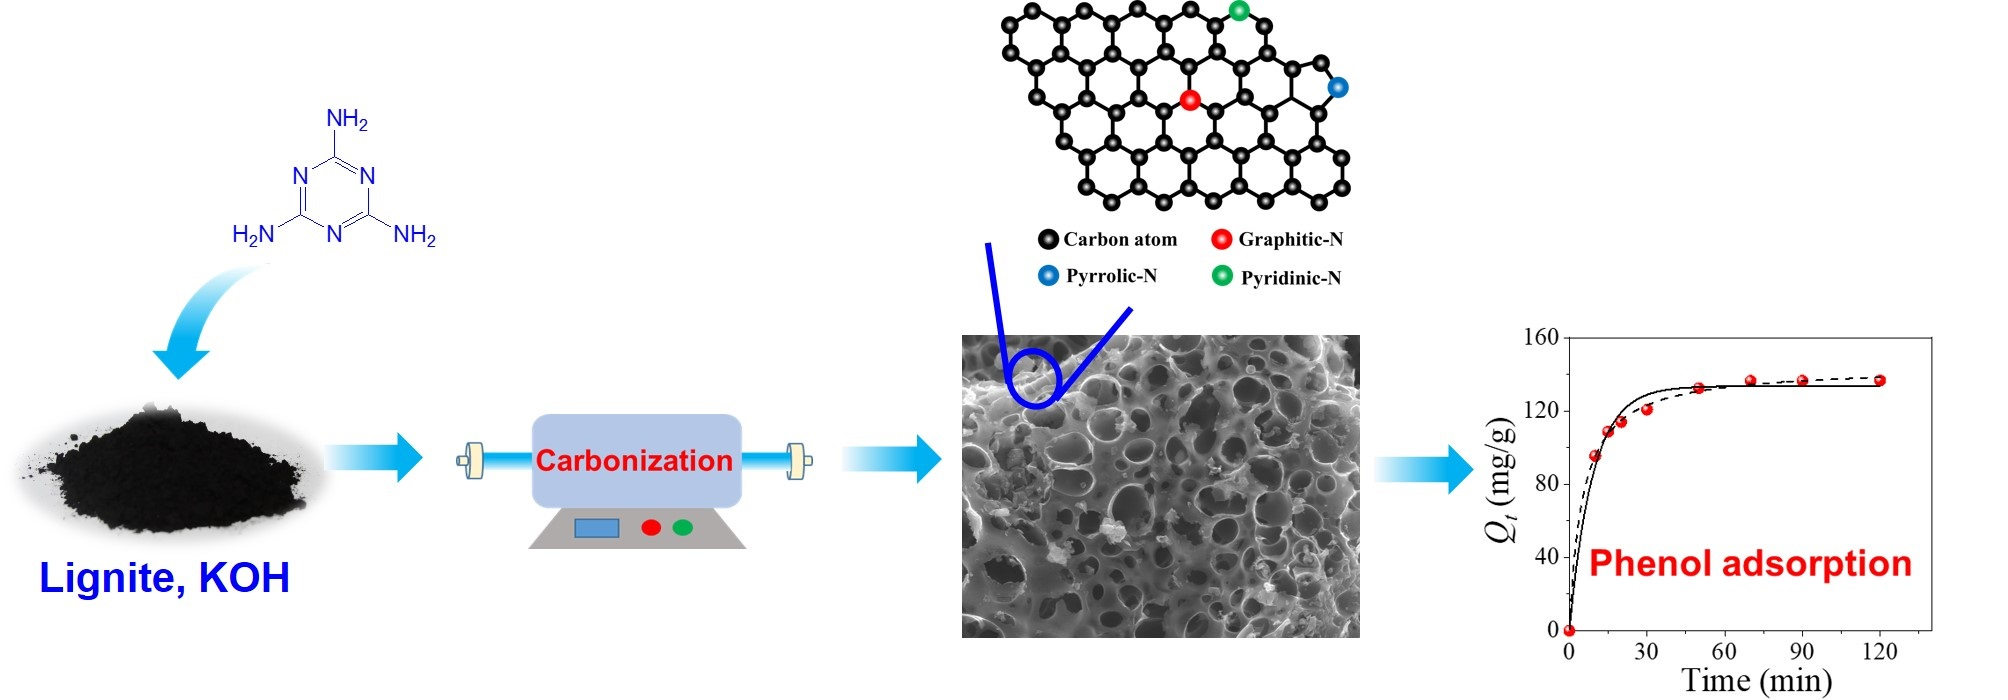
3.3. Theoretical Calculations and Adsorption Mechanism
With the aim of providing a deep understanding of the adsorption mechanism over lignite-based porous carbon, four theoretical models with different functional groups were established, by which the phenol adsorption energies (Eads) over different adsorption sites were calculated. The graphene was used to simulate the base plane of carbon materials in this work, while three N-containing groups (the graphitic-N, pyrrolic-N, and pyridinic-N) were adopted according to the XPS measurements.
Figure 11 shows the
Eads and the optimized geometric structures of phenol adsorbed on these adsorption sites. It can be seen that the adsorption energies between phenol and the N-free graphite layer are as low as −71 kJ/mol (
Figure 11a), suggesting that the phenol molecule can be stably adsorbed on the carbon materials. The value of
Eads over the N-free layer is higher than those of graphitic-N and pyrrolic-N groups, supporting the fact that the interactions between phenol and these N-containing groups are stronger. Nevertheless, it should be mentioned that despite the fact that the
Eads over pyrrolic-N shows the lowest value, the gap of
Eads between pyrrolic-N and N-free graphite layer is only 3 kJ/mol. This means that the adsorption capacity of pyrrolic-N groups is only slightly stronger than the N-free graphite layer. However, the weak advantage of N-containing functional groups should still not be ignored because it could be effectually enlarged by increasing the amount of N-containing groups during application. On the other hand, it should be noted that the value of
Eads over pyridinic-N groups is 1 kJ/mol higher than the N-free graphite layer, which indicates that the contribution of pyridinic-N to phenol adsorption should be not obvious or even negative in contrast to the N-free graphite layer.
It is interesting and worth noting that phenol exhibits different adsorption energies on different N-containing functional groups. The value of
Eads for phenol is in the order of pyridinic-N > N-free graphite layer > graphitic-N > pyrrolic-N groups. The nature of phenol adsorption is primarily caused by the π–π dispersion interactions between the π electrons in aromatic rings and those in graphite layers, as supported by the kinetics results and previous studies [
13,
23]. Thus, it can be inferred that the gaps in the adsorption capacity could be interpreted by the different π electron densities over different functional groups. The pyrrolic-N group should provide the highest π electron density due to its smaller five-membered ring structure. Meanwhile, in comparison to the N-free graphite, the enhanced electron density could be obtained over the graphitic-N group owing to the doping of the electron-rich nitrogen atom. In the case of pyridinic-N groups, the N atom is located at the margin of the carbon plane, where the asymmetrical distribution of the π electron might weaken the π–π conjugated interactions.
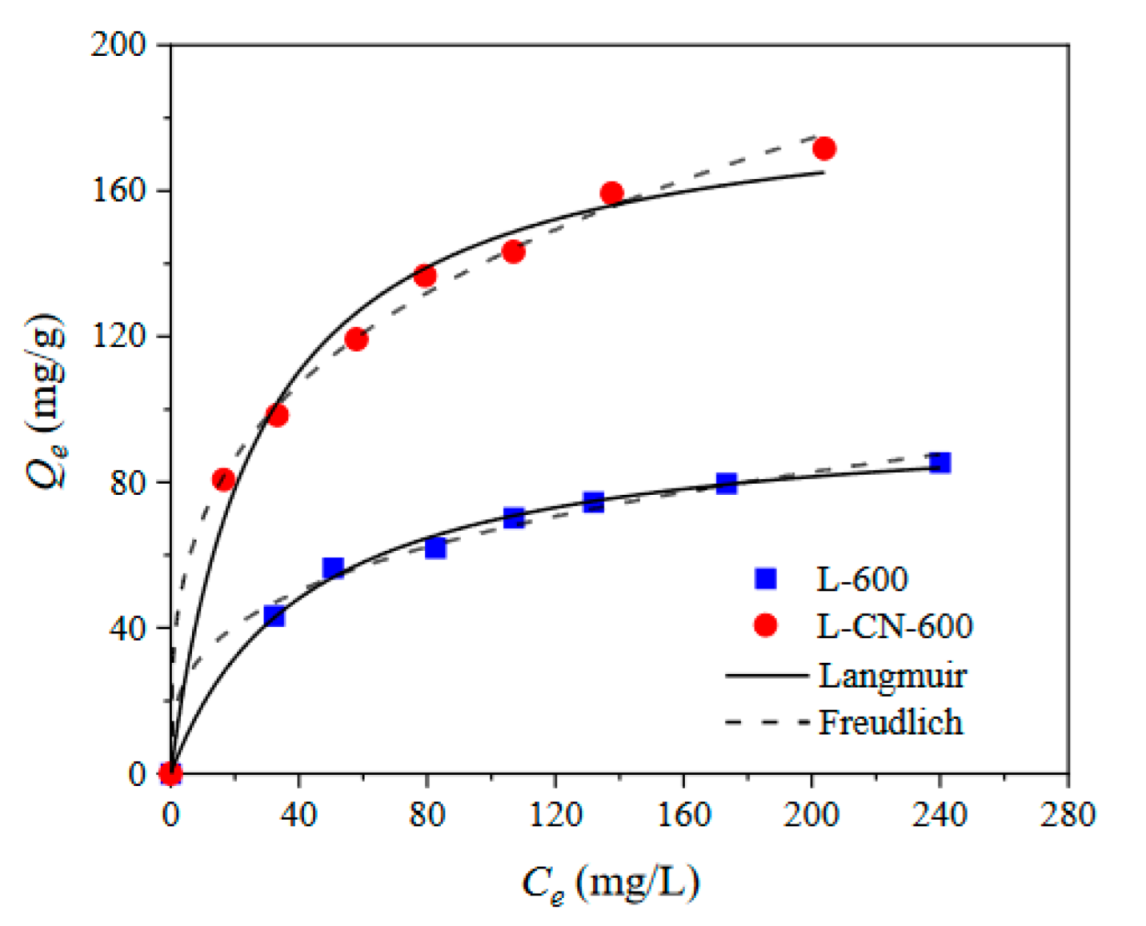
In this work, because the specific surface areas and pore volumes of lignite-based porous carbon exhibit wide variation due to the addition of tripolycyanamide, it is inappropriate to only attribute the enhancement of phenol uptakes to the carbon surface chemistry or the presence of N-containing functional groups. In particular,
Figure 12 shows the good linear relationships between phenol adsorption capacity and the surface area (R
2 = 0.9588) or micropore volume (R
2 = 0.9523), suggesting that the micropore properties of lignite-based porous carbon strongly influence the phenol adsorption. In contrast, the correlation coefficients between the N contents and phenol adsorption capacity were only 0.0009–0.1015. Such low correlation coefficients reveal that N-containing groups in the lignite-based porous carbon may not be the dominant factor in the experimental range, despite the fact that it is usually considered the principal factor influencing phenol adsorption [
13]. Similar results were reported by Cansado and co-workers related to the removal of 4-chloro-2-methyl-phenoxyacetic acid by ACs containing different N contents [
50].


