
Characterization of Flavoured Olive Oils of ‘Madural’ Variety
by
 , ,
, ,
María Helena Chéu-Guedes
1,
M. Dolores La Rubia
2,3,* ,
,
Sebastián Sánchez
2,3,
Natividad Ramos
2,3 and
Rafael Pacheco
2,3,* 1
Education and Community Intervention Research Unit—RECI, Campus of Piaget Institute of Viseu, Estrada do Alto do Gaio, 3515-776 Lordosa, Portugal
2
Department of Chemical, Environmental and Materials Engineering, University of Jaén, 23071 Jaén, Spain
3
University Institute of Research in Olive Grove ans Olive Oils, University of Jaén, GEOLIT Science and Technology Park, 23620 Mengíbar, Spain
*
Authors to whom correspondence should be addressed.
Processes 2023, 11(1), 205; https://0-doi-org.brum.beds.ac.uk/10.3390/pr11010205
Submission received: 13 December 2022
/
Revised: 31 December 2022
/
Accepted: 2 January 2023
/
Published: 9 January 2023
(This article belongs to the Special Issue Innovations and New Processes in the Olive Oil Industry)
Abstract
:Flavoured oils arouse great interest among consumers in many countries due to their variety of flavours and versatility, especially in the culinary field. The aromatization of oils seeks to improve their sensory and nutritional properties, and extend their useful life due to the added substances can be beneficial as antioxidant and antimicrobial agent. In this research, olive oils of the ‘Madural’ variety from Trasos Montes region of Portugal have been obtained and flavoured with different aromatics herbs and condiments (flower of salt and bay leaf, garlic, rosemary and dehydrated lemon peel). The objective is to study the influence of the aromatic herbs and condiments on the physicochemical parameters of the oils: quality, purity, oxidative stability and microbiological analysis. It can be noted that the flavourings do not significantly alter the quality of the monovarietal oil, although, for some parameters, the excessive contact times can affect the category of the oil. On the other hand, the high content of antioxidants provided by flavouring agents can favour its stability and prolong its expiration. In this sense, the flavouring agent that contributes to stop the oxidation of the oil over time is salt + bay leaves, as higher oxidative stability values were detected than those obtained in monovarietal oil. However, oils flavoured with rosemary or lemon show a decrease over time for this parameter, which could indicate that this flavouring accelerates oxidation. In the case of oxidative stability referred to those flavoured with garlic, they present similar values to the monovarietal. The effect exerted by flavourings on the different parameters of the oils is complex, since it is influenced by the method followed and the operating variables established for flavouring.
Keywords:
olive oils; flavoured oils; fleur de sel; bay leaf; garlic; rosemary; lemon; oxidation stability1. Introduction
Nowadays, there is a great demand for innovative and specialized products, of high nutritional quality, with different sensory characteristics, such as flavoured oils.
The origin of these oils seems to come from ancient processing and conservation practices, in which the oils acquired the flavour of the aromatics herbs and condiments used, and they were later used in the preparation of dishes and salads [1]. Their versatility, ease of use, and wide variety of flavours have made flavoured oils staples for regular and unusual consumers in many countries around the world [2].
The aromatization of olive oils seeks to improve their organoleptic and nutritional properties and increase their useful life, since added flavouring agents can provide benefits through their antioxidant and antimicrobial characteristics [3].
In addition, the aromatization of olive oils deals a greater diversity of products in which virgin olive oil is the base product, allowing more choice for the consumer and improving the organoleptic characteristics of the oils [4].
Olive oils have been flavoured with their own phenolics or with phenolic compounds from other vegetable sources. Thus, different matrices have been used, namely spices and aromatic herbs (basil, pepper, garlic, and laurel), fruits (apple, banana, lemon, and orange), mushrooms, and nuts (almonds, and hazelnuts), being evaluated the impact at chemical and sensory levels [5].
The influence of flavourings on the physical-chemical and organoleptic characteristics of the oils are of vital importance to establish the amounts of flavouring to be used and the flavouring times. On the other hand, one of the most important factors in food quality control is the determination of the level of oxidation in food or food products.
The olive oil deterioration is evaluated by the peroxide index, among other quality parameters. The oxidation of fats is one of the main causes of food spoilage. It causes great concerns, mainly of an economic nature in the food industry, because it stimulates the appearance of unpleasant flavours and doors, generally identified as rancidity in foods that contain fat. These unpleasant flavours influence the organoleptic quality of the negatively [6].
The oxidation of fats leads to the formation of hydroperoxides, which are very unstable primary products that, by decomposition, form secondary products. These can include hundreds of individual compounds that negatively affect the flavour of foods. In many cases, these compounds are associated with oxidative rancidity and/or off-flavour formation [7].
Virgin olive oil is resistant to oxidation due to its low content of polyunsaturated fatty acids and the content of natural antioxidants, such as: alpha-tocopherol and phenolic compounds, hydroxytyrosol, tyrosol, and caffeic acid, among others [7].
On the other hand, oxidative stability is not considered a standard quality parameter, and it can be used as an indicator of the useful life of the oil. Normally it is evaluated by the induction time, that is, the time that elapses until the critical point of oxidation is reached, causing a sensory degradation of the oil, due to a sudden acceleration of the oxidative process. Oxidative stability is generally determined by the Rancimat method and reveals the resistance of the product to the initiation of oxidation, characterized by reactions involving free radicals [8,9].
The oxidative stability of olive oils depends on several factors, including the variety and degree of maturity of the olives used in its production. The latter plays a fundamental role in the chemical composition of the olive and, therefore, in its resistance to oxidation. The resistance to oxidation is mainly attributed to two factors: the composition of the fatty acids, which in the case of olive oils is characterized by a high value of the monounsaturated fatty acids/polyunsaturated fatty acids ratio and the presence of minor compounds with high antioxidant activity, mainly tocopherols and polyphenols, but also chlorophylls and carotenoids [10].
Thus, oleic acid (monounsaturated) confers greater resistance to oxidation. However, high percentages of polyunsaturated fatty acids (linoleic and linolenic) can contribute to shortening the useful life of the oil, due to the formation of compounds with conjugated double bonds, from which oxidation volatile products are formed with unpleasant aroma characteristic of rancidity. Being the relative oxidation values, of linolenic, linoleic and oleic acids, of approximately 20:10:1, respectively [10].
Therefore, the incorporation of flavourings into olive oil can be an advantageous procedure since it helps consumers accept olive oils by enhancing known and desirable flavours [11]. On the other hand, the flavouring agents used are usually rich in antioxidant and phenolic compounds, so they can increase shelf life and improve the nutritional, healthy and sensory composition of the oils [12,13,14,15].
However, it should be noted that, although the demand for these flavoured oils is growing regularly, there are currently no specific regulations for them that allow their correct labelling. In 2014, the International Olive Oil Council (IOOC), in its 22nd extraordinary meeting, asked all its members to “adopt the necessary measures to prevent flavoured oils from incorporating the terms “extra virgin olive oil”, “virgin olive oil” and “olive oil”, on their labels, given that these preparations do not comply with the IOC standard” [16], since this standard only allows the use of the aforementioned terms for products whose definition excludes the addition of any additive [17,18].
However, considering the growing interest in these products, this work has studied the variation of the physicochemical properties of olive oils flavoured with different substances. In addition, the oxidation and oxidative stability evolution of the flavoured oils, with respect to the monovarietal olive oils has been evaluated.
2. Materials and Methods
2.1. Preparation of the Samples
Olive oils of the ‘Madural’ (MO) variety were obtained in two successive seasons (2015/2016 and 2016/2017). In addition, natural products for flavouring were added to these oils at the time they were obtained: fleur de sel and dehydrated bay leaves (MOSB), dehydrated rosemary (MOR), dehydrated garlic (MOG) and dehydrated lemon peel (MOL). After 11 months the different flavoured olive oils were obtained. Next, the following parameters were analysed: moisture, acid index, peroxide index, ultraviolet parameter (K232, K268 and ∆K), organoleptic analysis, fatty acid composition, waxes, sterols, erythrodiol+uvaol, phenolic compounds, tocopherols, pH, oxidative stability and microbiological analysis.
2.2. Olives Characterization
The olives of the ‘Madural’ variety from the Mirandela area (Portugal) were characterized by moisture (%) [19], fat content (%) [20], biometric parameters of the fruit and the pulp/stone ratio. The evaluation of these parameters allowed to determine the harvest date of the olives.
The determination of moisture and volatile matter was carried out by drying a portion of the sample (1 g) in an oven at 103 °C until constant weight [19]. The determination of the total fat content was carried out according to the Soxhlet fat extraction method [20]. The dried sample, used in the determination of moisture, is introduced into the Soxhlet extractor and the extraction of the fat with n-hexane takes place for approximately 24 h. Subsequently, in the oven at 105 ± 1 °C, the traces of solvent are eliminated. With the amount of oil recovered, the richness of dry fat is determined, and from this the richness of wet fat. The arithmetic mean of two determinations will be taken as the result.
2.3. Quality Parameters
The acidity index is determined according to the methodology described in the ISO 660:2020 standard, those being oils and fats of animal and vegetable origin, along with determination of acidity or acidity index [21]. The sample (20 g) was dissolved in a mixed solvent of ethanol and diethyl ether in a 1:1 ratio and the free fatty acids present were titrated with potassium hydroxide solution (0.1 M). The titration was carried out in the presence of phenolphthalein solution as indicator. The acidity is expressed as percentage of oleic acid. All the measurements were made in triplicate.
Peroxide value (PV) was expressed as milliequivalent of active oxygen per kilogram of oil and determined according to the methodology described in ISO 3960:2007 [22]. A sample of 1.2–2.0 g of oil was dissolved in a mixture of chloroform and acetic acid (2:3 v/v). Next, 1 mL of KI saturated solution was added and 75 mL of deionized water was also added after stirring and 5 min in darkness. Finally, the sample is titrated with sodium thiosulphate and starch solution as indicator. All the measurements were made in triplicate.
K232 and K268 extinction coefficients were calculated according to analytical methods described in the CEE/2568/91, CEE/1429/92 regulations and subsequent modifications of the European Commission [23,24] by spectrophotometric examination. A sample of 100 mg of oil were dissolved in 25 mL of iso-octane and the extinction of the solution is then determined at the specified wavelengths with reference to pure solvent. Specific extinctions are calculated from the spectrophotometer readings using a quartz cell with a 1 cm optical path. All the measurements were made in triplicate.
The sensorial analysis was made according to COI/T.20/Doc.Nº 5 of 2007 [25]. The testing panel was constituted of 8 testers (6 women and 2 men) of age between 40 and 53 years old. They carried out the sensory characterization and linked the flavour stimuli of the oils with a numeric scale according to the standards [25]. In this analysis the positive perceptions identified were fruity, bitter and spicy and the negative perceptions were mouldy/damp earth, musty, burnt olive and vinegary.
2.4. Purity Parameters
The gas chromatography (GC) technique was used to determine the qualitative and quantitative fatty acid methyl-esters composition [24]. The sample were prepared by shaking a solution of oil in heptane (0.1 g in 2 mL) with 0.2 mL of 2 N methanolic potassium hydroxide stirred during 30 s. The methyl-esters were analysed from the supernatant solution by a gas chromatographer Shimadzu GC-2010 Plus ATF with double injection port of Split/SplitIess capillary columns with digital flow control, detectors (FID, ECD-2010Plus Detector and TCD) and AOC-5000 automatic injector (PAL LHS2-SHIM) for injection of liquids (up to 10 µL) or head-space (up to 2.5 mL). The capillary column was SP-2380 de 60 m × 0.2 mm × 0.2 μm, (Supelco, Pensilvania, EEUU). The oven temperature was set at 185 °C, the injector and detector temperature were set at 220 °C. The chromatograms were read in ascending order of number of carbons and insaturations using “Shimadzu GCsolution” for the treatment of the results.
The wax content was determined according to the methodology described in Regulation No. 2568/91 [24]. The contents of the different waxes and the sum of these contents are expressed in mg/kg of oil. All the measurements were made in triplicate.
2.5. Minor Components
The tocopherols were evaluated by HPLC following the method described by Cunha [26] on a Shimadzu HPLC mod. Prominesce series 20. A Sigma-Aldrich (St. Louis, MO, USA) (250 mg/L) 𝛼-tocopherol in acetonitrile was used as internal pattern. A sample of 0.2 g of oil was dissolved in 10 mL of n-hexane and 20 µL of sample was analysed. As mobile phase hexane was used: isopropanol (97:3 v/v) in isocratic conditions and 1 mL/min of flow rate. The chromatograms were recorded at 275 nm. The results are expressed as mg of α-tocopherol per oil kg. All the measurements were made in triplicate.
The total phenolic compounds were determined following the method described by Vázquez-Roncero [27], using the Folin-Ciocalteau reagent. The absorption of the solution measured at 725 nm. The results were given as mg/kg of caffeic acid. All the measurements were made in triplicate.
2.6. Oxidative Stability
For the determination of the stability of olive oils a Metrohm equipment, mod. Rancimat 743 was used. A sample of 3 g of the oil sample were weighed and then placed on the heating block. The air flow is turned on and passes through the tubes containing the oil samples. The oxidation curves are recorded by ionic conductivity measurement, as a result of stability through time expressed in hours, which corresponds to the induction period. It works at 120 °C, using a volumetric air flow rate of 10 L/h, and all the samples have been performed in duplicate.
2.7. Microbiological Study
2.7.1. Content of Microorganisms at 30 °C
The methodology used in the analytical determination is based on the NP 4405:2002 standard [28].
2.7.2. Content of Coliform Bacteria at 30 °C
These bacteria are a good indicator of the state of hygiene. The determination of coliform bacteria was carried out according to NP 3788:1990 [29].
2.7.3. Coagulase+ Staphylococci Count
The procedure used for the count of coagulase-positive Staphylococci is described in ISO 6888-2:1999 [30].
3. Results
3.1. Olive Determinations
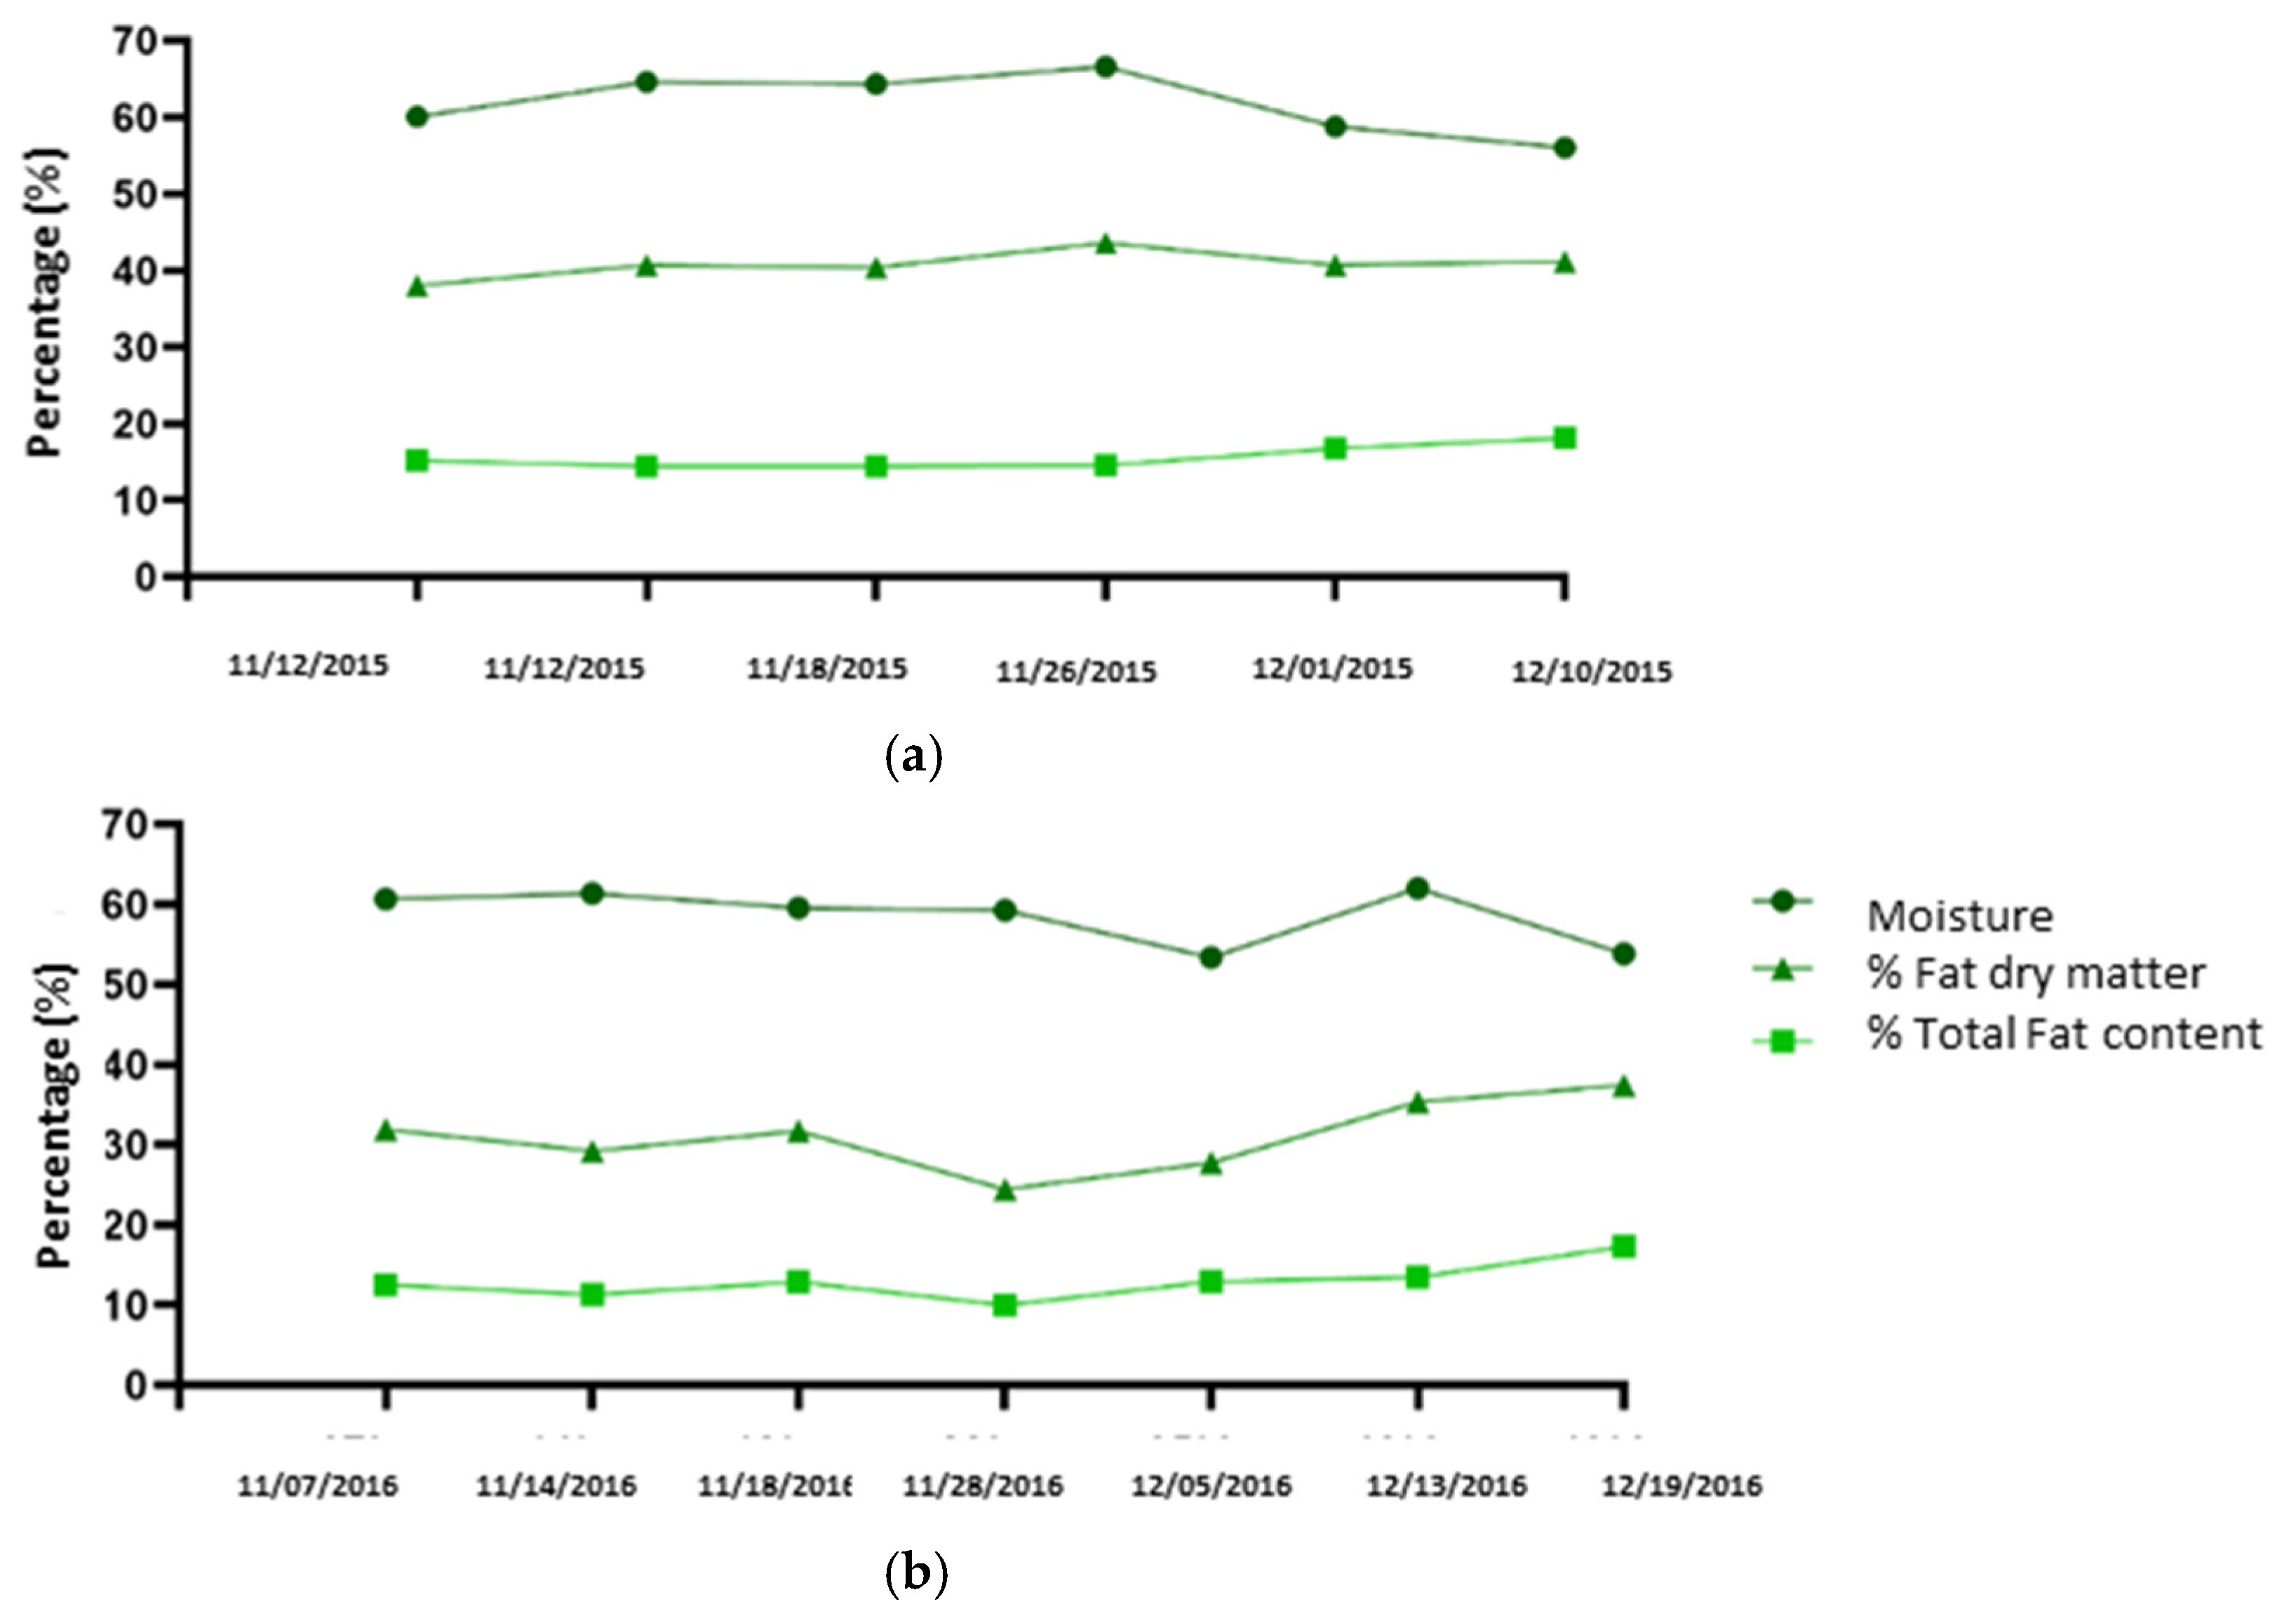
The samples of olives of the ‘Madural’ variety from the Tras-os-Montes region of Portugal, were collected during the 2015/2016 and 2016/2017 seasons and were characterised in terms of moisture (%), fat content (%), fat content in dry matter, biometric parameters of the fruit and the pulp/stone ratio. Figure 1 shows the results.
Figure 1a shows that during the 2015/2016 season, fat levels increase (14.58%) and total content moisture content decreases (66.59%) from 26 November 2015. Regarding the fat content in dry matter, it is observed that lipid synthesis is in a growth phase, with a greater increase from 18 November 2015 (40.39%) and then stabilizes. Next, the selected harvest date was on 7 December 2015.
During 2016/2017 season, the fat content increases from 28 November 2016 (9.95%), reaching a value of 17.28% on 19 December 2016. The total moisture content of the olives drops until 12/5/2016 (53.34%), with a peak on 13 December 2016 (61.95%) and then drops sharply, reaching a value of 53.83% on 19 December 2016. Regarding the fat content in the dry matter, it is observed that lipid synthesis is in the growth phase, with an increase from28 November 2016 (24.41%), then increases at the beginning of December (27.71%) reaching a value of 37.42% on 19 December 2016. Combining the evolution of the different determinations, especially the total fat and the fat content in dry matter, the olives were harvested on 16 December 2016.
Table 1 shows the morphological parameters for the characterization of the biometric parameters of the olives (weight of the pulp and endocarp) and characterization of the pulp/stone ratio.
In both seasons, the average weight of the olives and the pulp/stone ratio were similar. The weight of the olives was considered medium (2–4 g) and the endocarp weight high (0.45–0.7 g).
Barranco et al. [31], consider that the main components of ripe olives are water and oil, and it is in the pulp where more than 95% of the total oil is found. This factor highlights the importance of the pulp/stone ratio in the total fat yield of the olive. Gouveia [32] explains that during the development and maturation of the olives there is a progressive decrease in the humidity of the pulp and, at the same time, an increase in the oil content, weight and volume of the fruit. García et al. [33] considers that the oil content of the olives increases as they mature, reaching its maximum value when the green fruits of the tree disappear. From this moment, the oil content remains practically constant.
3.2. Quality Parameters
The monovarietal and flavoured oils were analysed at the beginning and end of each year (2016 and 2017) to evaluate the evolution of the analytical parameters and the influence of flavouring agents on them. IOOC Regulations have been used as a reference in absence of applicable regulations for flavoured oils [17].
3.2.1. Humidity
The moisture values of the monovarietal and flavoured oils analysed in all the seasons are below 0.10. According to the IOOC standard [17], moisture and volatile matter should be less than 0.2 (% m/m).
3.2.2. Acidity
Table 2 reports the acidity values of the samples. The acidity of the oils increases over the time in all the seasons. However, the oils obtained in 2016 have acidity values higher than those obtained in 2017 and below 0.8%. On the other hand, the flavoured oils obtain similar acidity values to those obtained in monovarietal oil, though the increases over time are greater. Of the flavouring agents used, garlic and lemon produce minor increases in acidity in the two seasons. Considering the values obtained, monovarietal olive oil and flavoured oils correspond to the “Extra Virgin” Olive Oil category.
3.2.3. Peroxide Value
The peroxide value (PV) evaluates the formation of primary oxidation products and the deterioration of natural antioxidants. The maximum limit of the peroxide value of an oil for human consumption is 20 mEq O2/kg [17]. The PV of olive oil can be associated with the olive varieties and the edaphoclimatic conditions of the regions [7].
From Table 2, it can be seen that the monovarietal oils have low PV which increases throughout the year, reaching, in the 2015/2016 season, its highest value in the last month of the study (10.7 mEq O2/kg). Similar behaviour it is observed for the 2016/2017 season, but with a higher value (19 mEq O2/kg), which may be due to the fact that the starting value was also higher. In both cases, the PV is below 20 mEq O2/kg, the maximum value allowed for oil of the “Extra Virgin” category [17].
Regarding flavoured oils, they show the same trend over time as monovarietal do, and in December of the 2015/2016 season the flavoured oils with rosemary (MOR) and with salt + bay leaves (MOSB) obtained the lowest increases, reaching 9.5 and 9.8 mEq O2/kg, respectively. Despite the high values of the rest of the flavourings, they all correspond to the Extra Virgin category according to IOOC [17]. However, at the end of the following season, significant increases were observed in all the oils, being the oil flavoured MOSB the one that obtained the lowest value, as in the previous season, maintaining the category of “Extra Virgin”. On the other hand, those flavoured with rosemary reached the highest value in this season (35.0 mEq O2/kg) and, such as those flavoured with garlic and lemon, which also exceeded 20 mEq O2/kg, all of them can be included. in the “Virgin” category.
The influence of flavouring agents on PV is complex and could be related to chemical effects. The influence of rosemary on PV may be due to its chemical composition, rich in polyphenolic compounds and derivates of caffeic acid (rosmarinic acid). Laurel leaves have antioxidant properties and, fleur de sel is a natural preservative and antibacterial agent, and when it comes to lemon-flavoured oil, it always obtains the highest PV values, regardless of the season under study, with the exception of the oil flavoured with rosemary from December of 2017.
On the other hand, the PV obtained can be related not only to the flavouring agent used, but also with the time of aromatization.
In the literature it can be seen that the influence of flavouring agent on PV is not clear. While some authors reported similar effects for garlic [1] and rosemary [34,35] decreasing PV and increasing the oxidative stability, other authors reported the opposite [36]. However, other authors consider that PV increase with the flavouring agents [1] and the oxidative stability decreases [36]. Regarding dry laurel, some authors [5], state that it decreases PV and increases oxidative stability, and as for dry lemon rind, Ayadi et al. [37] considers that it decreases the PV and increases the oxidative stability.
3.2.4. K232, K270 and ΔK
During the two seasons, K232 values (Table 2), both in monovarietal and flavoured oils, increase over time, but remain below 2.5%, which is the maximum value allowed for the olive oil in the “Extra Virgin” category. Regarding the flavoured oils, it can be seen that, in the two seasons, all the oils correspond to the “Extra Virgin” category. The olive oil flavoured with rosemary obtained the lowest value in the two seasons, while the oil flavoured with lemon reached the highest value.
Similarly, it can be seen that the values of K270, in monovarietal oils, increase over time, but remain below 0.22% (maximum value allowed for olive oil in the “Extra Virgin” category).
For the flavoured oils, in the studied seasons, the lowest values correspond to the oils with garlic and lemon, while the highest are those with salt, laurel leaf and rosemary. Based on the obtained results, it seems that all the oils correspond to the “Extra Virgin” category, with the exception of flavoured oil with salt and laurel leaf, from the 2016/2017 season, which are included in the “Virgin” category.
There is agreement between the results obtained with the bibliographic data consulted, according to which dried rosemary causes increases in the extinction coefficients [38,39] although the amounts of flavouring and contact have been different. Finally, regarding ΔK, in all cases, the values are equal or less than 0.01, so they correspond to “Extra Virgin” category. In the case of flavoured oils, in all cases they are considered “extra virgin” category except the oils with salt and bay leaf from December 2016 and the oils with lemon from the two seasons.
From all of the above, we conclude that monovarietal oils have good protection due to their natural antioxidants, with no significant alterations in their quality. Regarding the flavoured oils, the agents that cause the greatest alteration are salt, bay leaf and lemon, which cause losses of their initial category.
3.2.5. Sensory Evaluation
Table 3 shows the results of sensory evaluation of the monovarietal olive oil.
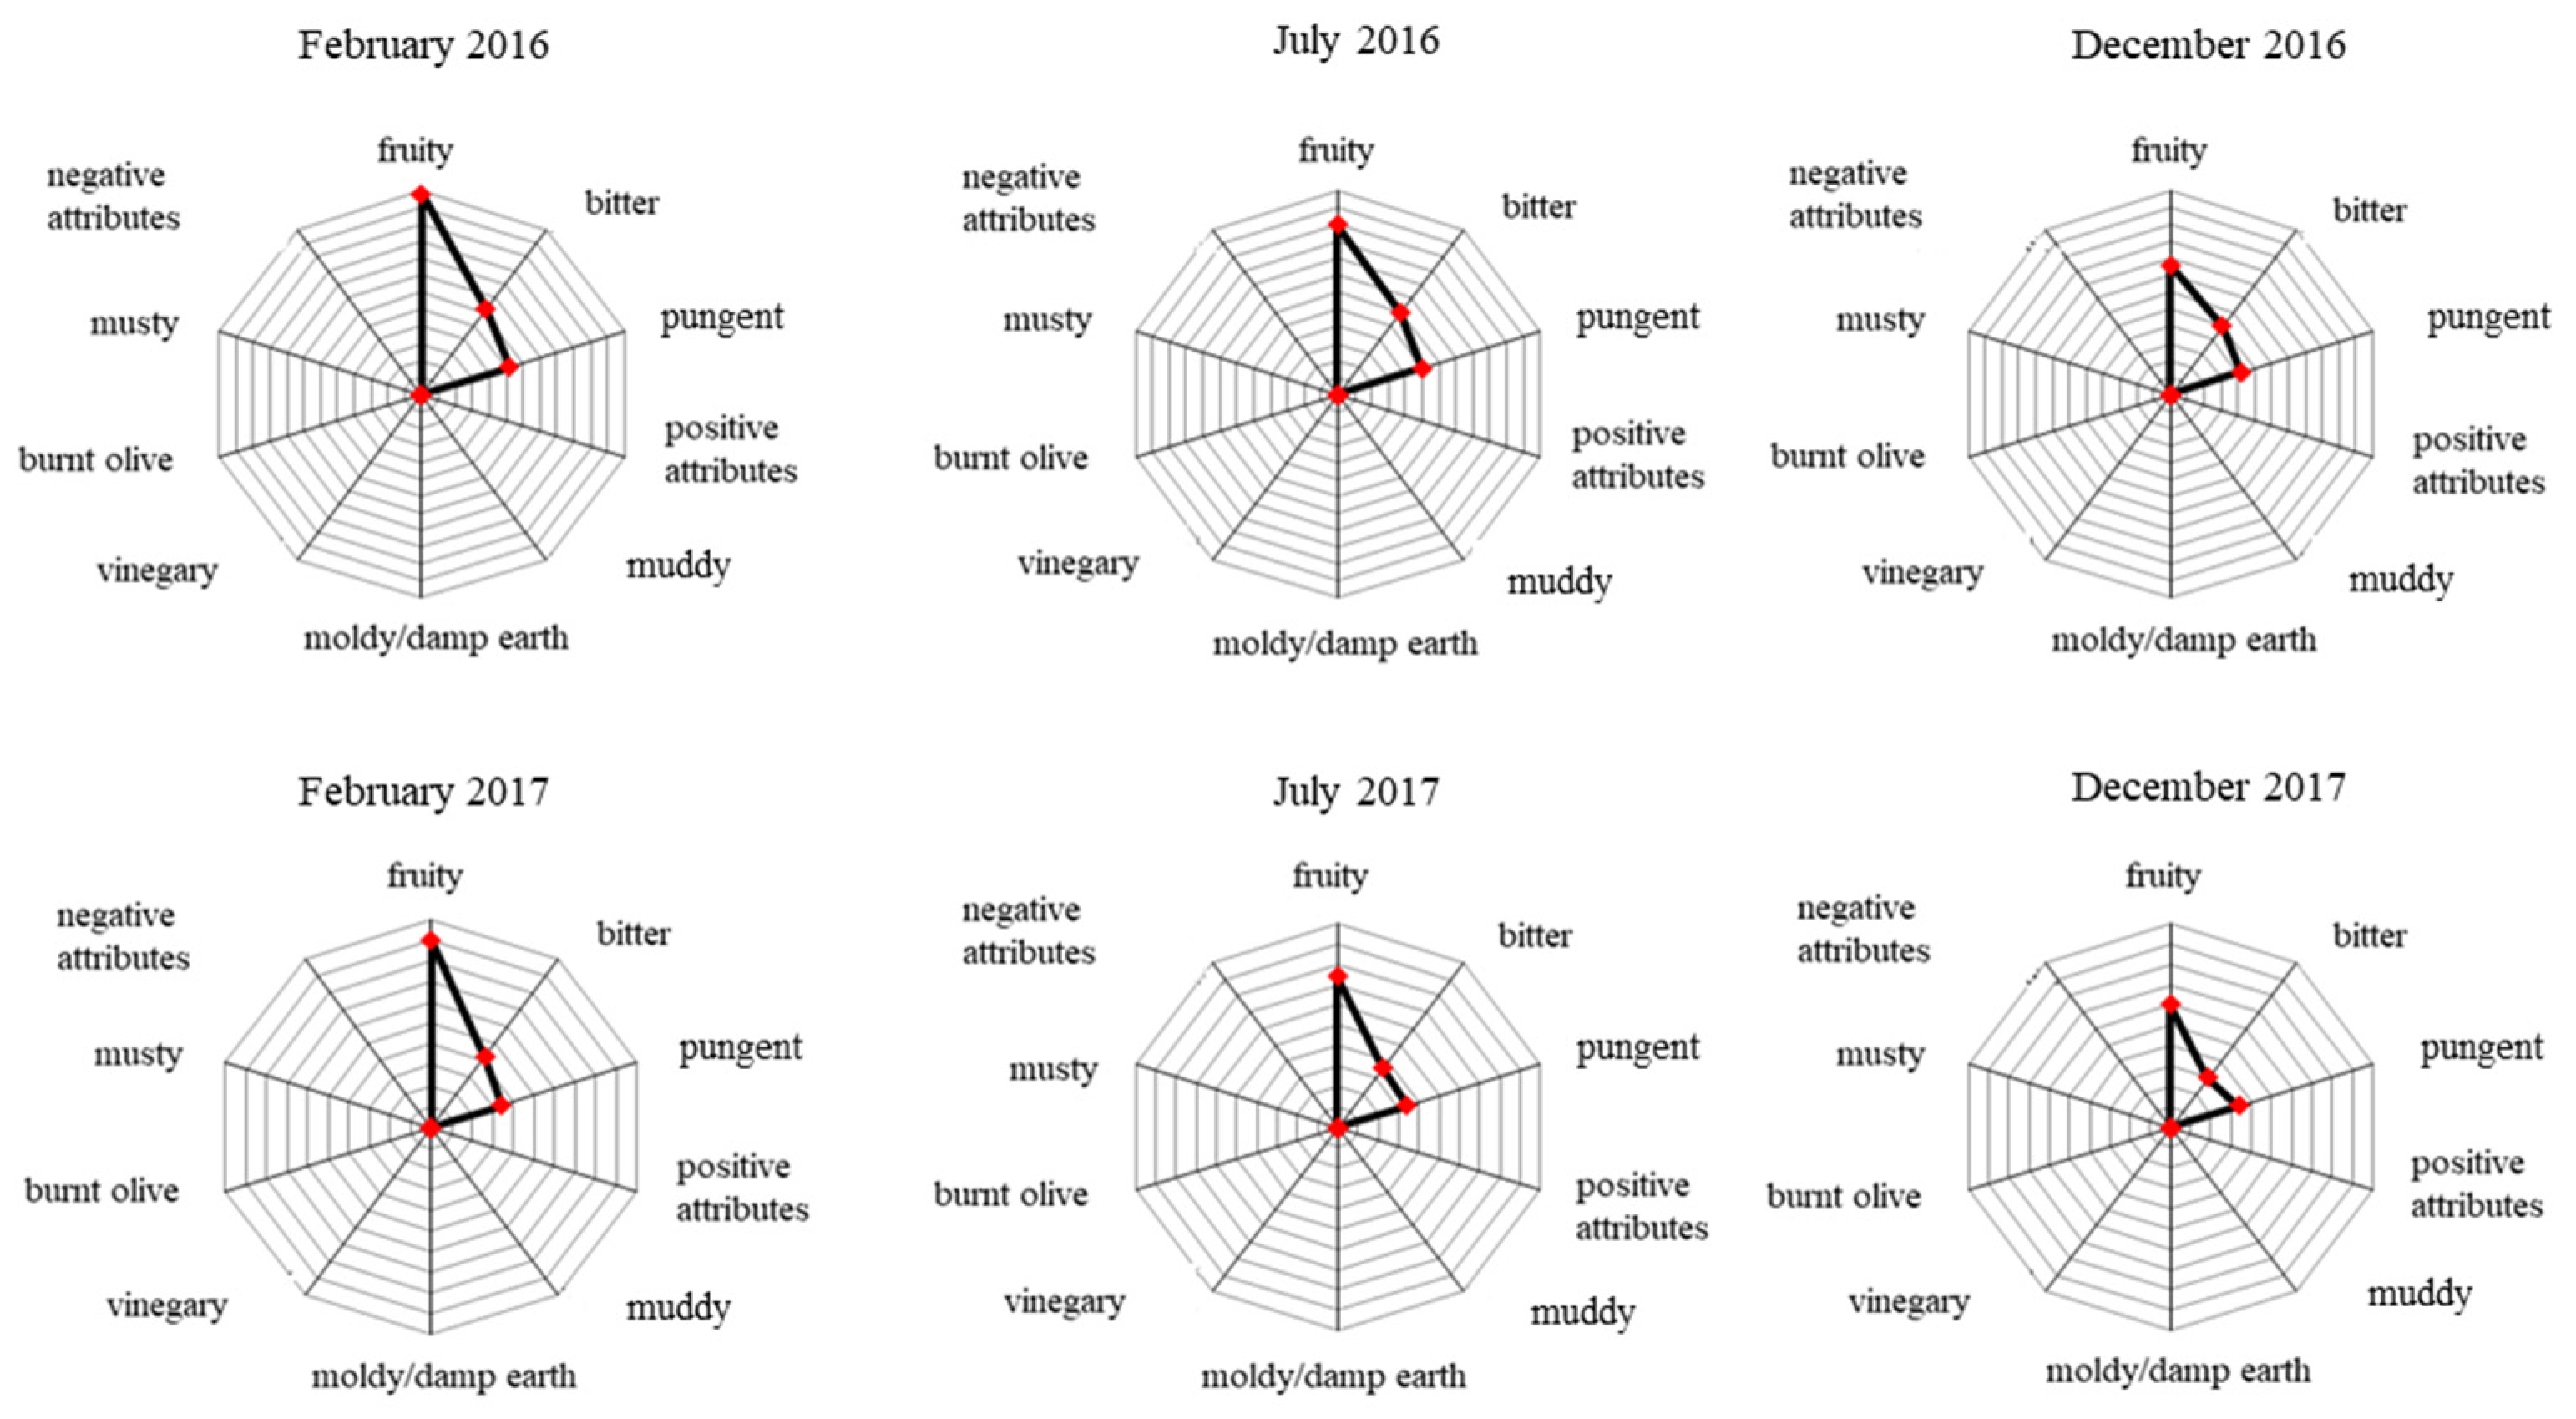
The oils have a score higher than 6.5, which correspond to “Extra Virgin” category. Figure 2 shows the sensory profile of the monovarietal oils at different season.
The oil from the 2015/2016 season has, in February, fruitiness of 5.9, bitterness of 3.1 and pungent of 2.6. In July, there was a slight decrease in fruit intensity (5.0) and, practically, the remaining positive attributes constant at 3.0 and 2.5, respectively. In December, it shows show a small decrease in the intensity of the positive attributes, fruity (3.8), bitter (2.5) and pungent (2.1). Considering that the median fruitiness is greater than zero (Mf > 0) and the median of defects is equal to zero (Md = 0), this oil corresponds to the “Extra Virgin” category.
The oils from the 2016/2017 season have, in February, fruit intensity score of 4.5, bitterness of 2.1 and spiciness of 1.7. In July there was a slight decrease in the positive attributes of fruitiness (3.7) and bitterness (1.8), while the intensity of pungent (1.7) was maintained. In December there was a small decrease in the intensity of the positive attributes, fruity (3.0) and bitter (1.5) and pungent (1.7) remained constant. The median fruitiness is greater than zero (Mf > 0) and the median defects is equal to zero (Md = 0), therefore, this oil falls into the “Extra Virgin” category.
Regarding the organoleptic analysis of the flavoured oils, Table 4 presents the results of the organoleptic characteristics. In all cases, the tasters identified the flavouring agents both in the taste and in the smell of the oils, being this perception lower in the case of rosemary (taste) and lemon (taste and smell). This perception is constant over time in the two seasons. It can be seen that in all cases the bitter and pungent characteristics decrease over time, the highest decrease occurs in the flavoured oil with lemon. Probably the intensity and character of the flavourings condition the perceptions of the superior bitter and pungent attributes. Similarly, the intensity of the flavour decreases over time, with the exception of the garlic oil which is maintained. It should be noted that seems to be a coincidence with Rodrigues et al. [35], for the garlic and rosemary flavourings, when they detect an increase in fruitiness and bitterness in the oils.
3.3. Purity Parameters
3.3.1. Fatty Acid Profile
Table 5 shows the most representative fatty acid composition values, according to the season.
Regarding of monovarietal oil, very similar percentages of palmitic acid (C16:0) were observed in all cases, with a slight decrease, in the different seasons. Regarding palmitoleic acid (C16:1), it remained constant (0.5 and 0.4%) in all seasons. The percentage of stearic acid (2.2%) also remained constant in the 2015/2016 season, with a decrease of 0.2% during the 2016/2017 season. There is a slight decrease in the percentage of oleic acid (C18:1), with the exception of the 2016/2017 season, in which there was an increase in this parameter (2.3%). Linoleic acid (C18:2) has values within the preference limit (3.5–21.0%) stipulated by the IOOC. They suffered a slight decrease, in the seasons under study, over time. Being in the 2015/2016 season when there was a higher value (12.3%). The percentage of linolenic acid (C18:3) is 1%, except for the 2015/2016 season in which the result obtained in February was 1.1%, with a slight decrease throughout of 2016.
All the flavoured oils have similar percentages of palmitic, palmitoleic, stearic, oleic, linoleic and linolenic acid during the two seasons.
Regarding the oleic acid, during the 2016/2017 season, an increase of the value was observed from 2.5 to 2.7, in all the flavoured oils. The rosemary is the most contributing herb to this parameter in 2015/2016 and 2016/2017 seasons (0.1 and 2.7%, respectively).
Sousa et al. [5] consider that rosemary and lemon have a strong influence on the fatty acids profile of the flavoured olive oils. These ingredients increase the oleic acid content and slight decrease of the saturated fatty acid concentration. These results agree with the obtained in this study (Table 5).
In conclusion, the flavoured agents influence the lipidic composition of the flavoured olive oils.
Table 6 shows the fatty acid composition of the olive oils.
All the fatty acid percentages obtained are within the ranges established by the EU Regulations [17], with the exception of the linolenic acid which reach the maximum limit in the monovarietal oil (1%) and in some of the flavoured oils.
Regarding the trans fatty acid values in Table 6, the monovarietal olive oil and the flavoured olive oils have values below of 0.05% which is the limit for the extra virgin category.
For C18:3 trans + C18:2 trans fatty acids, according to Delegated Regulation (EU) 2016/2095 [24] is the sum of the trans forms of linoleic and linolenic acids must be less than 0.05% for olive oil of the “Extra Virgin” category. In this case, the levels are within the legally accepted values, observing the same behaviour and identical values, as in the case of trans-oleic acids. There is now consistent scientific evidence on the harmful effects of consuming industrially produced trans fats. Given this situation, measures have been developed to reduce trans fats in processed foods. Another way is to replace these fats with olive oil, since it has been proven that the results obtained in the levels of fatty acids in the trans forms are within the legally accepted values.
3.3.2. Wax
Table 7 shows the composition of waxes determined in the oil samples of the ‘Madural’ variety and the respective flavoured oils during the campaigns under study.
Table 7 shows a maximum value can be observed for the monovarietal oil in December 2016 (49 mg/kg oil) and the minimum value observed corresponds to the oil analysed in February 2017 (34 mg/kg oil).
The maximum value allowed for the extra virgin category is 150 mg/kg oil, so these oils fall into this category. Finally, in terms of the wax content of the flavoured oils have similar values to those of the monovarietal oil, so they can be included in the same category. The oil flavoured with salt and bay leaf obtained lower values, especially in the 2016/2017 season. It can be concluded that the flavourings have an influence on the presence of waxes in the oils, since there is a decrease in values over time.
3.3.3. Sterols
The qualitative and quantitative analysis of sterols is part of the criteria of purity and authenticity of the quality of olive oil.
Due to its importance, Table 8 and Table 9 show the values of the individual sterols and total sterols, respectively, during the two seasons.
The values of individual sterols are within the permitted legal limits, for olive oil and flavoured oils of the “Extra Virgin” category, in the two seasons. Note that the apparent β-Sitosterol corresponds to: Δ-5,23-stigmastadienol + clerosterol + -sitosterol + sitostanol + Δ-5-avenasterol + Δ-5,24-stigmastadienol and must be ≥93.0% [17].
On the other hand, the percentage of stigmasterol has to be lower than campesterol, which occurs in both seasons. The percentage of β-sitosterol decreases over time, in the samples of monovarietal MO and flavoured oils MOSB and MOR, in the two seasons.
3.3.4. Erythrodiol and Uvaol
Table 10 shows the resulting values from the determination of erythrodiol and uvaol in the monovarietal variety oil and flavoured oils, in the 2015/2016 and 2016/2017 seasons.
The results show that both monovarietal and flavoured olive oils have erythrodiol and uvaol values lower than the maximum limit (4.5%) [17]. These values are within the interval of 1.10 and 3.96% reported by Seabra et al. [38] and they are similar to the values reported by Chéu-Guedes Vaz [9] of 1.26% for ‘Madural’ variety olive oil from Mirandela region.
The flavoured oils have a sharper decrease in values over time, which became more pronounced in the last season. The olive oil flavoured with garlic acquires the highest values and the flavoured with salt and bay leaf obtains the lowest results, in the two seasons.
3.3.5. Phenolic Compounds
The content of total polyphenols in monovarietal oil decreases over time (Table 10). In the 2015/2016 and 2016/2017 seasons, the decreases in total polyphenols are 16 and 15 mg/kg, respectively (7% and 6% reduction, from February to December).
With respect to flavoured oils, in general, the content of total phenolic compounds, in December, increases in relation to the MO, in that month of each season. Although in the case of rosemary flavoured there is a decrease in the 2016/2017 season, and the MOL oil is the one that has the least increase, compared to the MO, in those months.
However, if we consider the periods from February to December, the total polyphenols content increases over the time in MOSB, MOG and MOR in the first season, decreasing in 2016/2017, while polyphenol content decreases in MOL in both seasons.
The fact that MOL shows these decreases compared to monovarietal oil may be due to the contribution of the polyphenols present in the composition of bay, rosemary and garlic. This would be in accordance with what different research groups indicated for garlic [36,38,39,40] and lemon [39] but contrary to what was stated by Sousa et al. [5] for the laurel, when they indicate that it decreases, and according to the results obtained it increases, although the operating variables variety, quantity, time and temperature differ from those of this investigation. As for those flavoured with rosemary, the results for both campaigns are contradictory, since it increases in the first campaign, according to same studies [36,41,42] and decreases in the second, similar to other studies [34,35].
There are several authors and research groups that pay attention to the anti-oxidant effects of polyphenols present in certain aromatic plants. Thus, Mestre et al. [43], mentions that the compounds extracted from aromatic plants are often attributed interesting antioxidant properties. In addition, therefore, the addition of flavourings to olive oil improves its nutritional properties and its beneficial effects on health, especially in terms of preventing oxidation. Furthermore, Middleton et al. [44], indicate that, of all the antioxidants, polyphenols have a wide range of biological effects generally attributed to antioxidant activity. Seabra et al. [38] mention that the antioxidant properties of rosemary extract have received a lot of attention in recent years, because of its antioxidant composition, among other constituents. Finally, Gambacorta et al. [1], consider that the addition of different concentrations (10–40 g/L) of garlic, pepper, oregano and rosemary increased the long-term stability of the oils.
3.3.6. Tocopherols
Table 11 shows the results of the total composition of tocopherols, for the ‘Madural’ monovarietal oil and its flavoured oils, for the different seasons under study. In all cases, the levels are within the established values, although in the 2015/2016 campaign the results obtained were higher.
It should be noted that the results show an increase in the total tocopherol content, going from 313.0 to 355.4 and from 203.0 to 299.2 mg/kg oil, respectively, for the 2015/16 and 2016/17 seasons, mainly due to the contribution of α and γ tocopherols, since the β form has minor influence.
Thus, it is observed that, in the 2015/2016 campaign, the α-tocopherols content [26,27] in MO ranged between 307.0 and 348.2 mg/kg oil, while in the 2016/2017, the values were lower, ranging between 203.0 and 291.2 mg/kg oil.
In this sense, and taking previous studies as a reference, the α-tocopherol content of the oils analysed from the ‘Madural’ variety, in the Mirandela region, varied between 150.9 and 456.2 mg/kg, obtaining mean levels of tocopherols, in the α form, of 285.8 mg/kg oil. It can be deduced that tocopherol content depends on the variety, the location of the olive groves and, most likely, technological factors [9].
On the other hand, in the first season, the β and γ forms evolved with an increase in tocopherols in the γ form, but a decrease in the β form. However, in the second season, tocopherols increased in both forms, obtaining results higher than those of the previous season.
Regarding the flavoured oils, the total tocopherol content increases with respect to MO with the different flavourings, except MOSB, which coincides with the bibliography, which indicates an increase in all the isoforms of vitamin E when rosemary is used [34,35], as it occurs with fresh garlic [5], which differs from the dried garlic used in this research. On the other hand, together with the increase in tocopherols, they also state that there is an increase in the oleic acid content. In this sense, when the fatty acid profile was analysed, a slight increase already appeared, caused by some herbs and spices used in flavouring [5]. Finally, it should be noted that no bibliographical evidence has been found to compare the behaviour obtained with salt and bay leaves or lemon flavourings.
In 2015/2016 season, flavoured oils with garlic, rosemary and lemon obtained increases of 20.30%, 17.03% and 15.43% in α-tocopherol, respectively, compared the MO. In the campaign 2016/2017, oils flavoured with lemon and garlic had an increase in α-tocopherol of 52.36% and 46.15%, respectively. In general, tocopherols, in the α form, increased with time, in all seasons.
Regarding β and γ tocopherols, in the 2015/2016 season, the values are similar to those in MO, with slight decreases with all flavourings. However, in the 2016/20/17 season, these forms of tocopherols obtained higher values than MO, highlighting the olive oil flavoured with garlic.
3.4. Oxidative Stability
Table 12 shows the oxidative stability resistance values for the monovarietal oil and the flavoured oils, determined by Rancimat at 120 °C, in the two seasons.
From the analysis of the Table, it can be deduced that in the two campaigns, the oil of the ‘Madural’ variety has low resistance to oxidation and it decreases during the year.
As in monovarietal oil, oxidative stability of flavoured oils also decreases over time. The oils flavoured with garlic, are similar to MO and it could be said that garlic does not influence this parameter. However, there are some bibliographical references that indicate that garlic increases oxidative stability [36,38,39] perhaps the discrepancies in the results may be due to the operating conditions.
In the case of oils flavoured with lemon, the values are somewhat lower than the monovarietal, indicating that these flavouring agents act by slightly decreasing oxidative stability. However, Ayadi et al. [31] detected an increase in stability for different operating conditions, with contact times of 15 days, which suggests that the contact time used in this investigation was too long.
Regarding the salt + bay leaf flavoured oil, in the two seasons, it can be seen that this flavouring agent slows down oxidation when stability values were observed higher than those obtained in monovarietal oil, which agrees with what was indicated by Sousa et al. [5] for contact times of 90 days, and Taleb et al. [38] who used fresh laurel and contact times very different from those of this research.
Considering the oil flavoured with rosemary, the results indicate that there is a significant decrease in oxidative stability over time, with very similar values in each season, in view of which, it could be said that this flavouring accelerates oxidation. Coinciding with the results indicated by Soares et al. [36], for contact times of 7 and 15 days, but not with what is indicated by other research groups [34,35,36,41], which operate with amounts of rosemary and contact conditions different from those of our research.
3.5. Microbiological Analysis
Considering that in this research dehydrated flavourings were added to the oils we intend to understand if there was any risk of microbial spoilage.
Olive oil does not contain water in its composition [9] which is a vital source for the existence of microorganisms. Nevertheless, determinations were made of microorganism counts at 30 °C (evaluation of hygienic quality) of coliform bacteria at 30 °C (evaluation of the existence of pathogenic microorganisms) and of coagulase + Staphylococci (evaluation of the quality of the products food), in the samples of the first and last campaign of the study to verify the veracity of the results. Table 13 shows the results obtained in the two seasons.
The results indicate that there is no risk of microbial presence in monovarietal and flavoured oils during both seasons because the existence of microorganisms is practically null. This situation also occurs because the flavouring agents used were all dehydrated.
4. Conclusions
The olive oil obtained from olives of the ‘Madural’ variety, in the studied seasons, is a balanced oil in its composition, which complies with current regulations and can be classified as “Extra Virgin olive oil”.
The incorporation of flavouring agents does not significantly affect to the quality of the monovarietal oils. Although flavourings such as garlic, bay leaf, rosemary or lemon usually have negative effects on the acidity of the oils, in this case, the effects are not significant. Regarding to the peroxide value, it can be said that the obtained values may be associated with the flavouring agent used and the aromatization time, since, in general, it can be seen that when the contact times are short (one to three months), the results are close to those of monovarietal oil. However, at longer times, the differences are so high that the category changes for some flavoured oils. In this sense, the ultraviolet absorption parameters allow classifying flavoured oils with the “Extra Virgin” category, except for those flavoured with salt and laurel, which would be “Virgin” category. The sensory profile shows that the aromas, and flavours are correctly detected in all the oils without affecting to others sensory attributes.
The fatty acid profile is not altered by the presence of flavourings and only it is observed an increase in the oleic acid content in all the flavoured oils, the one using rosemary standing out slightly. On the other hand, the total sterol contents show higher values for the oils flavoured with rosemary and garlic, while those flavoured with salt + bay leaf and lemon present less differences, which can be attributed to the composition of said flavourings.
In relation to the phenolic compounds, in general, an increase can be seen with respect to the monovarietal oil, perhaps due to the contribution of the phenolic compounds present in the composition of bay leaves, rosemary and garlic, although in the case of lemon its content decreases in both seasons. On the other hand, the total tocopherol content increases with respect to monovarietal oil with the different flavourings, except with salt + bay leaf, the increases that are mainly due to the α isoform.
Regarding oxidative stability, the flavouring that presents the greatest protection against oxidation is salt and bay leaf, and the least is rosemary, which seems to accelerate oxidation. Garlic and lemon show similar stability values, with small differences between them with respect to the monovarietal oil.
On the other hand, the total sterol contents show higher values for the oils flavoured with rosemary and garlic, while those flavoured with salt and bay leaf and lemon have smaller differences, which can be attributed to the composition of flavouring agents.
With regard to microbial deterioration in monovarietal and flavoured oils, the presence of detected microorganisms is practically null. These results are due to dehydration of the flavouring agents and the hygienic conditions during the obtention and storage of the oils.
Finally, the effect exerted by the flavourings, on the different parameters of the oils, depends on the method and the operating variables established for the flavouring operation: olive variety, quantity, physical characteristics and composition, flavouring, time and temperature of operation.
Author Contributions
Conceptualization, R.P. and N.R.; methodology, S.S., M.D.L.R., R.P. and N.R.; software, validation, and formal analysis, M.H.C.-G. and M.D.L.R.; investigation and data curation, M.H.C.-G., R.P. and N.R.; resources, R.P., N.R. and M.D.L.R.; writing—original draft preparation, M.H.C.-G., R.P., N.R. and M.D.L.R.; writing—review and editing, M.H.C.-G., R.P., N.R. and M.D.L.R.; supervision: S.S., R.P. and N.R. All authors have read and agreed to the published version of the manuscript.
Funding
Research group ‘Bioprocesses TEP-138’ of the Andalusia Regional Government (Spain) and Piaget Institute (Portugal).
Data Availability Statement
Data are contained within the article.
Acknowledgments
The authors acknowledge the Andalusia Regional Government (Spain) for its financial support to our research group ‘Bioprocesses TEP-138′ and Piaget Institute (Portugal).
Conflicts of Interest
The authors declare no conflict of interest.
References
- Gambacorta, G.; Faccia, M.; Pati, S.; Lamacchia, C.; Baiano, A.; La Notte, E. Changes in the chemical and sensorial profile of extra virgin olive oils flavoured with herbs and spices during storage. J. Food Lipids 2007, 14, 202–215. [Google Scholar] [CrossRef]
- Baiano, A.; Gambacorta, G.; La Notte, E. Aromatization of olive oil. Transw. Res. Netw. 2010, 661, 1–29. [Google Scholar]
- Abo, B.; Bevan, J.; Greenway, S.; Healy, B.; McCurdy, S.M.; Peutz, J.; Wittman, G. Acidification of Garlic and Herbs for Consumer Preparation of Infused Oils. Food Prot. Trends 2013, 34, 247–257. [Google Scholar]
- Moustakime, Y.; Hazzoumi, Z.; Joutei, K.A. Aromatization of virgin olive oil by seeds of Pimpinella anisum using three different methods: Physico-chemical change and thermal stability of flavoured oils. Grain Oil Sci. Technol. 2021, 4, 108–124. [Google Scholar] [CrossRef]
- Sousa, A.; Casal, S.; Malheiro, R.; Lamas, R.; Bento, A.; Pereira, J.A. Aromatized olive oils: Influence of flavouring in quality, composition, stability, antioxidants, and antiradical potential. LWT Food Sci. Technol. 2015, 60, 22–28. [Google Scholar] [CrossRef]
- Fennema, O.R. Química de Los Alimentos, 2nd ed.; ACRIBIA: Zaragoza, Spain, 2000. [Google Scholar]
- Morales, M.A.; Przbylski, R. Olive Oil Oxidation. In Chemistry and Technology, 2nd ed.; Boskou, D., Ed.; Department of Chemistry, Aristotle University of Thessaloniki: Thessaloniki, Greece, 2003. [Google Scholar]
- Matos, L.C.; Pereira, J.A.; Andrade, P.; Oliveira, M. Evaluation of a numerical method to predict the polyphenols content in monovarietal olive oils. Food Chem. 2007, 102, 976–983. [Google Scholar] [CrossRef]
- Guedes-Vaz, C. Azeite de Trás-os-Montes. Influência da Localização do Olival e das Cultivares nas Características do Azeite. Instituto Piaget; Colecção Estudos e Documentos: Lisboa, Portugal, 2011. [Google Scholar]
- Custódio, T. Azeites Virgem Extra Comerciais: Composição em Compostos Voláteis e Relação com Parâmetros Químicos de Qualidade. Master’s Thesis, Faculdade de Farmácia da Universidade do Porto, Porto, Portugal, 2009. [Google Scholar]
- Lamas, S.; Rodrigues, N.; Peres, A.M.; Pereira, J.A. Flavoured and fortified olive oils—Pros and cons. Trends Food Sci. Technol. 2022, 124, 108–127. [Google Scholar] [CrossRef]
- Baiano, A.; Terracone, C.; Gambacorta, G.; Notte, E.L. Changes in quality indices, phenolic content and antioxidant activity of flavoured olive oils during storage. JAOCS J. Am. Oil Chem. Soc. 2009, 86, 1083–1092. [Google Scholar] [CrossRef]
- Bittencourt Fagundes, M.; Ballus, C.A.; Perceval Soares, V.; de Freitas Ferreira, D.; Sena Vaz Leães, Y.; Sasso Robalo, S. Characterization of olive oil flavoured with Brazilian pink pepper (Schinus terebinthifolius Raddi) in different maceration processes. Food Res. Int. 2020, 137, 109593. [Google Scholar] [CrossRef]
- Reboredo-Rodríguez, P.; Figueiredo-González, M.; González-Barreiro, C.; Simal-Gándara, J.; Salvador, M.D.; Cancho-Grande, B. State of the art on functional virgin olive oils enriched with bioactive compounds and their properties. Int. J. Mol. Sci. 2017, 18, 668. [Google Scholar] [CrossRef] [Green Version]
- Sena-Moreno, E.; Alvarez-Ortí, M.; Serrano-Díaz, J.; Pardo, J.E.; Carmona, M.; Alonso, G.L. Olive oil aromatization with saffron by liquid–liquid extraction. J. Food Sci. Technol. 2018, 55, 1093–1103. [Google Scholar] [CrossRef] [PubMed]
- International Olive Council Reunión Extraordinaria. Madrid. 2014. Available online: https://www.olimerca.com/noticiadet/el-coi-se-pronuncia-sobre-los-aceites-de-oliva-con-aditivos/62dbad318a564a84781316b96554b9b6 (accessed on 8 July 2014).
- COI/T.15/NC No 3/Rev; Trade Standard Applying to Olive Oils and Olive Pomace Oils. International Olive Council: Madrid, Spain, 18 June 2022.
- Regulation Nº 136/66/EEC Establishing a Common Organization of the Market in Oils and Fats. Off. J. 3025–3066. Available online: https://eur-lex.europa.eu/legal-content/EN/TXT/?uri=celex%3A31966R0136 (accessed on 1 January 2023).
- UNE 55031:1973 Fats; Determination of Humidity and Volatile Matters in Olive Grease. AENOR: Madrid, Spain.
- UNE 55030:1961; Determination of the Content in Total Fat of Olives. AENOR: Madrid, Spain.
- ISO 660:2020; Animal and Vegetable Fats and Oils—Determination of Acid Value and Acidity. International Organization for Standardization: Geneva, Switzerland.
- ISO 3960:2017; Animal and Vegetable Fats and Oils—Determination of Peroxide Value—Iodometric (Visual) End Point Determination. International Organization for Standardization: Geneva, Switzerland.
- Commission Regulation (EEC) No 2568/91 on the Characteristics of Olive Oil and Olive-Residue Oil and on the Relevant Methods of Analysis. Off. J. Eur. Communities 1991, 1–15. Available online: http://extwprlegs1.fao.org/docs/pdf/eur40621.pdf (accessed on 1 January 2023).
- Commission Delegated Regulation (EU) 2016/2095 Amending Regulation (EEC) No. 2568/91 on the Characteristics of Olive Oil and Olive-Residue oil and on the Relevant Methods of Analysis. Available online: https://eur-lex.europa.eu/legal-content/EN/TXT/PDF/?uri=CELEX:32016R2095&rid=5 (accessed on 1 January 2023).
- COI/T.20/Doc.Nº 5 of 2007. Sensory Analysis of Oils. International Olive Council: Madrid, Spain.
- Cunha, S.C.; Amaral, J.S.; Fernandes, J.O.; Oliveira, M.B.P.P. Quantification of tocopherols and tocotrienols in Portuguese olive oils using HPLC with three different detection systems. J. Agric. Food Chem. 2006, 54, 3351–3356. [Google Scholar] [CrossRef] [PubMed]
- Vázquez-Roncero, A.; Janer del Valle, C.; Janer del Valle, M.L. Determinación de polifenoles totales del aceite de oliva. Grasas Y Aceites 1973, 22, 350–355. [Google Scholar]
- NP 4405; Microbiologia alimentar: Regras Gerais para a Contagem de Microrganismos. Contagem de Colónias a 30 °C. Instituto Português da Qualidade, Ministério da Economia, da Inovação e do Desenvolvimento: Caparica, Portugal, 2002.
- NP 3788; Regras Gerais para Contagem de Coliformes a 30°C. Instituto Português da Qualidade, Ministério da Economia, da Inovação e do Desenvolvimento: Caparica, Portugal, 1990.
- ISO 6888–1; Microbiologia dos Alimentos. Método para a Contagem de Estafilococos Coagulase. International Organization for Standardization: Geneva, Switzerland, 1999.
- Barranco, D.; Fernández-Escobar, R.; Rallo, L.; Rallo, L.E.c.d.o. Coedición. Junta de Andalucia—Consejeria de Agricultura y Pesca; Ediciones Mundi-Prensa: Madrid, Spain, 1999; pp. 511–596. [Google Scholar]
- Gouveia, J. Azeites Virgens do Alto Alentejo: Comportamentos Químico, Tecnológico e Sensorial. Dissertação para Obtenção do grau de Doutor; Instituto Superior de Agronomia de Lisboa: Lisboa, Portugal, 1995. [Google Scholar]
- García, J.M.; Yousfi, K. Non-destructive and objective methods for the evaluation of the maturation level of olive fruit. Eur. Food Res Technol. 2005, 221, 538–541. [Google Scholar] [CrossRef]
- Kasimoglu, Z.; Tontul, I.; Soylu, A.; Gulen, K.; Topuz, A. The oxidative stability of flavoured virgin olive oil: The effect of the water activity of rosemary. J. Food Meas. Charact. 2018, 12, 2080–2086. [Google Scholar] [CrossRef]
- Rodrigues, N.; Silva, K.; Veloso, A.C.A.; Pereira, J.A.; Peres, A.M. The use of electronic nose as alternative non-destructive technique to discriminate flavoured and unflavoured olive oils. Foods 2021, 10, 2886. [Google Scholar] [CrossRef]
- Soares, V.P.; Fagundes, M.B.; Guerra, D.R.; Leães YS, V.; Speroni, C.S.; Robalo, S.S. Ultrasound assisted maceration for improving the aromatization of extra-virgin olive oil with rosemary and basil. Food Res. Int. 2020, 135, 109305. [Google Scholar] [CrossRef]
- Ayadi, M.A.; Grati-Kamoun, N.; Attia, H. Physico-chemical change and heat stability of extra virgin olive oils flavoured by selected Tunisian aromatic plants. Food Chem. Toxicol. 2009, 47, 2613–2619. [Google Scholar] [CrossRef]
- Seabra, L.M.J.; Damasceno, K.S.F.S.C.; Andrade, S.A.C.; Dantas, M.M.G.; Soares, N.K.M.; Pedrosa, L.F.C. Effect of Rosemary on the quality characteristics of white shrimp (Litopenaeus Vannemei). J. Food Qual. 2011, 34, 363–369. [Google Scholar] [CrossRef]
- Baiano, A.; Previtali, M.A.; Viggiani, I.; Varva, G.; Squeo, G.; Paradiso, V.M. As oil blending affects physical, chemical, and sensory characteristics of flavoured olive oils. Eur. Food Res. Technol. 2016, 242, 1693–1708. [Google Scholar] [CrossRef]
- Benmoussa, H.; Farhat, A.; Elfalleh, W.; di Maio, I.; Servili, M.; Romdhane, M. A rapid application to flavour the olive oil with dried rosmarinus officinalis L. leaves: Microwave-assisted maceration. J. Food Process. Preserv. 2016, 41, e12885. [Google Scholar] [CrossRef]
- Damechki, M.; Sotiropoulou, S.; Tsimidou, M. Antioxidant and pro-oxidant factors in oregano and rosemary gourmet olive oils. Grasas Y Aceites 2001, 52, 207–213. [Google Scholar]
- Taleb, S.A.; Boutoial, K.; Kzaiber, F.; Oussama, A. Effect of aromatization by aromatic plants on the physicochemical, sensorial and oxidative stability of Moroccan virgin olive oil. Int. J. Chem. Mater. Environ. Res. 2016, 3, 73–77. [Google Scholar]
- Mestre, J.J.M. Extra Virgin Oil Macerated with Tuber Melanosporum, Boletus Edulis and Addition of Edible Gold Particles. Dissertation to obtain the Master’s Degree in Food Engineering presented at the Escola Superior Agrária of the Polytechnic; Institute of Beja: Beja, Portugal, 2017. [Google Scholar]
- Middleton, E.; Kandaswami, C.; Theoharides, T.C. The effects of plant flavonoids on mammalian cells: Implications for inflammation, heart disease, and cancer. Pharmacol. Rev. 2000, 52, 673–751. [Google Scholar] [PubMed]
Figure 1.
Evolution of fat content (%), moisture (%) and fat content in dry matter (%) in olives of the ‘Madural’ variety (a) 2015/2016 season (b) 2016/2017 season.
Figure 1.
Evolution of fat content (%), moisture (%) and fat content in dry matter (%) in olives of the ‘Madural’ variety (a) 2015/2016 season (b) 2016/2017 season.

Figure 2.
The sensory profiles of the olive oils at different seasons.


Table 1.
Mean values and standard deviation of the biometric parameters evaluated in the fruit and the pulp/stone ratio.
Table 1.
Mean values and standard deviation of the biometric parameters evaluated in the fruit and the pulp/stone ratio.
| Season | Average Weight (g) | Average Endocarp Weight (g) | Average Pulp Weight (g) | Pulp/Stone Ratio |
|---|---|---|---|---|
| 2015/2016 | 3.12 ± 0.20 | 0.59 ± 0.10 | 2.52 ± 0.16 | 4.23 ± 0.21 |
| 2016/2017 | 3.17 ± 0.26 | 0.61 ± 0.10 | 2.54 ± 0.22 | 4.15 ± 0.18 |
Table 2.
Quality parameters of all olive oils.
| Samples | February 2016 | March 2016 | April 2016 | December 2016 | February 2017 | March 2017 | April 2017 | December 2017 |
|---|---|---|---|---|---|---|---|---|
| Acidity (% oleic acid) | ||||||||
| MO | 0.24 ± 0.00 | 0.25 ± 0.01 | 0.25 ± 0.00 | 0.31 ± 0.00 | 0.10 ± 0.00 | 0.11 ± 0.00 | 0.13 ± 0.00 | 0.16 ± 0.00 |
| MOSB | 0.24 ± 0.00 | 0.24 ± 0.00 | 0.26 ± 0.00 | 0.32 ± 0.00 | 0.10 ± 0.00 | 0.11 ± 0.00 | 0.12 ± 0.00 | 0.14 ± 0.00 |
| MOR | 0.24 ± 0.00 | 0.24 ± 0.00 | 0.25 ± 0.00 | 0.35 ± 0.01 | 0.10 ± 0.00 | 0.13 ± 0.00 | 0.13 ± 0.00 | 0.16 ± 0.00 |
| MOG | 0.24 ± 0.00 | 0.24 ± 0.00 | 0.23 ± 0.00 | 0.28 ± 0.00 | 0.10 ± 0.00 | 0.15 ± 0.00 | 0.15 ± 0.00 | 0.17 ± 0.00 |
| MOL | 0.24 ± 0.00 | 0.24 ± 0.00 | 0.24 ± 0.00 | 0.28 ± 0.00 | 0.10 ± 0.00 | 0.14 ± 0.00 | 0.14 ± 0.00 | 0.17 ± 0.00 |
| Peroxide value (mEq O2/kg) | ||||||||
| MO | 4.00 ± 0.00 | 6.40 ± 0.00 | 7.10 ± 0.01 | 10.70 ± 0.00 | 6.00 ± 0.00 | 6.20 ± 0.00 | 11.00 ± 0.00 | 19.00 ± 0.00 |
| MOSB | 4.00 ± 0.01 | 5.50 ± 0.00 | 5.90 ± 0.00 | 9.80 ± 0.00 | 6.00 ± 0.00 | 6.50 ± 0.01 | 13.00 ± 0.00 | 20.00 ± 0.00 |
| MOR | 4.00 ± 0.01 | 6.60 ± 0.01 | 6.80 ± 0.00 | 9.50 ± 0.00 | 6.00 ± 0.01 | 5.80 ± 0.00 | 9.00 ± 0.01 | 35.00 ± 0.01 |
| MOG | 4.00 ± 0.00 | 6.60 ± 0.01 | 6.90 ± 0.00 | 15.20 ± 0.01 | 6.00 ± 0.01 | 7.50 ± 0.01 | 9.00 ± 0.00 | 22.00 ± 0.00 |
| MOL | 4.00 ± 0.00 | 7.90 ± 0.00 | 8.40 ± 0.00 | 17.30 ± 0.00 | 6.00 ± 0.00 | 7.70 ± 0.00 | 10.00 ± 0.00 | 25.00 ± 0.00 |
| K232 | ||||||||
| MO | 1.49 ± 0.01 | 1.51 ± 0.03 | 1.62 ± 0.01 | 1.78 ± 0.02 | 1.70 ± 0.01 | 1.81 ± 0.02 | 1.87 ± 0.03 | 2.00 ± 0.12 |
| MOSB | 1.49 ± 0.01 | 1.60 ± 0.02 | 1.64 ± 0.04 | 2.02 ± 0.05 | 1.70 ± 0.01 | 1.80 ± 0.02 | 1.85 ± 0.01 | 2.26 ± 0.03 |
| MOR | 1.49 ± 0.03 | 1.59 ± 0.01 | 1.61 ± 0.03 | 1.91 ± 0.02 | 1.70 ± 0.05 | 1.79 ± 0.03 | 1.81 ± 0.01 | 2.20 ± 0.01 |
| MOG | 1.49 ± 0.02 | 1.61 ± 0.02 | 1.62 ± 0.01 | 1.96 ± 0.01 | 1.70 ± 0.02 | 1.82 ± 0.01 | 1.84 ± 0.05 | 2.27 ± 0.06 |
| MOL | 1.49 ± 0.03 | 1.60 ± 0.02 | 1.69 ± 0.04 | 2.03 ± 0.03 | 1.70 ± 0.01 | 1.81 ± 0.04 | 1.88 ± 0.06 | 2.31 ± 0.02 |
| K270 | ||||||||
| MO | 0.13 ± 0.00 | 0.13 ± 0.00 | 0.13 ± 0.00 | 0.19 ± 0.00 | 0.13 ± 0.00 | 0.15 ± 0.00 | 0.15 ± 0.00 | 0.20 ± 0.00 |
| MOSB | 0.13 ± 0.00 | 0.13 ± 0.00 | 0.13 ± 0.00 | 0.20 ± 0.00 | 0.13 ± 0.00 | 0.16 ± 0.00 | 0.16 ± 0.00 | 0.24 ± 0.00 |
| MOR | 0.13 ± 0.00 | 0.13 ± 0.00 | 0.13 ± 0.00 | 0.20 ± 0.00 | 0.13 ± 0.00 | 0.14 ± 0.00 | 0.14 ± 0.00 | 0.21 ± 0.00 |
| MOG | 0.13 ± 0.00 | 0.13 ± 0.00 | 0.13 ± 0.00 | 0.18 ± 0.00 | 0.13 ± 0.00 | 0.15 ± 0.00 | 0.15 ± 0.00 | 0.19 ± 0.00 |
| MOL | 0.13 ± 0.00 | 0.13 ± 0.00 | 0.13 ± 0.00 | 0.18 ± 0.00 | 0.13 ± 0.00 | 0.15 ± 0.00 | 0.15 ± 0.00 | 0.19 ± 0.00 |
| ΔK | ||||||||
| MO | 0.00 ± 0.00 | 0.00 ± 0.00 | 0.00 ± 0.00 | 0.01 ± 0.00 | 0.00 ± 0.00 | 0.00 ± 0.00 | 0.00 ± 0.00 | 0.01 ± 0.00 |
| MOSB | 0.00 ± 0.00 | 0.01 ± 0.00 | 0.01 ± 0.00 | 0.02 ± 0.00 | 0.00 ± 0.00 | 0.01 ± 0.00 | 0.01 ± 0.00 | 0.01 ± 0.00 |
| MOR | 0.00 ± 0.00 | 0.01 ± 0.00 | 0.00 ± 0.00 | 0.01 ± 0.00 | 0.00 ± 0.00 | 0.01 ± 0.00 | 0.01 ± 0.00 | 0.01 ± 0.00 |
| MOG | 0.00 ± 0.00 | 0.01 ± 0.00 | 0.00 ± 0.00 | 0.01 ± 0.00 | 0.00 ± 0.00 | 0.00 ± 0.00 | 0.00 ± 0.00 | 0.00 ± 0.00 |
| MOL | 0.00 ± 0.00 | 0.01 ± 0.00 | 0.01 ± 0.00 | 0.02 ± 0.00 | 0.00 ± 0.00 | 0.01 ± 0.00 | 0.01 ± 0.00 | 0.02 ± 0.00 |
The results expressed as mean value ± typical deviation.
Table 3.
The organoleptic characteristics of the monovarietal olive oil.
| Samples | February 2016 | July 2016 | December 2016 | February 2017 | July 2017 | December 2017 |
|---|---|---|---|---|---|---|
| MO | 7.5 | 7.4 | 6.7 | 7.0 | 6.7 | 6.6 |
Table 4.
Sensorial profile of the flavoured oils.
| Samples | Description | 2015–2016 | 2016–2017 | ||
|---|---|---|---|---|---|
| July | December | July | December | ||
| MOSB | Aroma (garlic) | VN | VN | VN | VN |
| Taste (garlic) | VN | VN | VN | VN | |
| Bitter and pungent | 3-5 | 3-4 | 3-3 | 2-3 | |
| Flavour intensity | 5 | 3 | 5 | 4 | |
| MOR | Aroma (rosemary) | VN | VN | VN | VN |
| Taste (rosemary) | N | N | N | N | |
| Bitter and pungent | 2-3 | 2-2 | 2-3 | 2-1 | |
| Flavour intensity | 4 | 4 | 4 | 4 | |
| MOG | Aroma (garlic) | VN | VN | VN | VN |
| Taste (garlic) | VN | VN | VN | VN | |
| Bitter and pungent | 3-4 | 2-3 | 3-3 | 2-3 | |
| Flavour intensity | 4 | 4 | 5 | 4 | |
| MOL | Aroma (lemon) | N | N | N | N |
| Taste (lemon) | N | N | N | N | |
| Bitter and pungent | 3-2 | 2-2 | 2-2 | 2-2 | |
| Flavour intensity | 4 | 3 | 4 | 2 | |
Notation: LN: Slightly noticeable; N: noticeable; VN: Very noticeable.
Table 5.
Most representative fatty acids (%) of all olive oils.
| Samples | February 2016 | December 2016 | February 2017 | December 2017 | |
|---|---|---|---|---|---|
| MO | C16:0 | 11.70± 0.12 | 11.3 ± 0.10 | 10.80 ± 0.09 | 10.0 ± 0.05 |
| C16:1 | 0.50± 0.01 | 0.50 ± 0.01 | 0.40 ± 0.02 | 0.40 ± 0.01 | |
| C18:0 | 2.20 ± 0.03 | 2.20 ± 0.02 | 2.70 ± 0.01 | 2.50 ± 0.03 | |
| C18:1 | 71.20 ± 0.02 | 70.60 ± 0.02 | 71.10 ± 0.03 | 73.40 ± 0.08 | |
| C18:2 | 12.30 ± 0.03 | 11.90 ± 0.04 | 12.10 ± 0.02 | 11.70 ± 0.03 | |
| C18:3 | 1.10 ± 0.02 | 1.00 ± 0.01 | 1.00 ± 0.01 | 1.00 ± 0.01 | |
| MOSB | C16:0 | 11.70 ± 0.03 | 11.20 ± 0.02 | 10.8 ± 0.01 | 10.0 ± 0.01 |
| C16:1 | 0.50 ± 0.01 | 0.50 ± 0.06 | 0.40 ± 0.03 | 0.50 ± 0.01 | |
| C18:0 | 2.20 ± 0.02 | 2.20 ± 0.01 | 2.70 ± 0.02 | 2.50 ± 0.01 | |
| C18:1 | 71.20 ± 0.12 | 70.70 ± 0.09 | 71.10 ± 0.01 | 73.60 ± 0.03 | |
| C18:2 | 12.30 ± 0.03 | 11.90 ± 0.02 | 12.10 ± 0.02 | 11.80 ± 0.02 | |
| C18:3 | 1.10 ± 0.01 | 1.00 ± 0.01 | 1.00 ± 0.02 | 1.10 ± 0.03 | |
| MOR | C16:0 | 11.70 ± 0.01 | 11.50 ± 0.02 | 10.80 ± 0.10 | 10.10 ± 0.03 |
| C16:1 | 0.50 ± 0.01 | 0.50 ± 0.01 | 0.40 ± 0.02 | 0.50 ± 0.01 | |
| C18:0 | 2.20 ± 0.03 | 2.20 ± 0.02 | 2.70 ± 0.01 | 2.50 ± 0.01 | |
| C18:1 | 71.20 ± 0.08 | 71.30 ± 0.03 | 71.10 ± 0.02 | 73.80 ± 0.01 | |
| C18:2 | 12.30 ± 0.03 | 11.7 ± 0.01 | 12.10 ± 0.02 | 11.60 ± 0.03 | |
| C18:3 | 1.10 ± 0.01 | 1.00 ± 0.02 | 1.00 ± 0.03 | 1.00 ± 0.02 | |
| MOG | C16:0 | 11.70 ± 0.01 | 11.30 ± 0.03 | 10.80 ± 0.05 | 10.10 ± 0.01 |
| C16:1 | 0.50 ± 0.02 | 0.50 ± 0.05 | 0.40 ± 0.02 | 0.50 ± 0.01 | |
| C18:0 | 2.20 ± 0.02 | 2.20 ± 0.04 | 2.70 ± 0.07 | 2.50 ± 0.01 | |
| C18:1 | 71.20 ± 0.04 | 71.10 ± 0.02 | 71.10 ± 0.01 | 73.60 ± 0.02 | |
| C18:2 | 12.30 ± 0.01 | 11.90 ± 0.02 | 12.10 ± 0.04 | 11.70 ± 0.03 | |
| C18:3 | 1.10 ± 0.02 | 1.00 ± 0.03 | 1.00 ± 0.01 | 1.10 ± 0.02 | |
| MOL | C16:0 | 11.70 ± 0.02 | 11.40 ± 0.02 | 10.80 ± 0.01 | 10.10 ± 0.05 |
| C16:1 | 0.50 ± 0.01 | 0.50 ± 0.01 | 0.40 ± 0.02 | 0.50 ± 0.02 | |
| C18:0 | 2.20 ± 0.03 | 2.20 ± 0.05 | 2.70 ± 0.04 | 2.50 ± 0.01 | |
| C18:1 | 71.20 ± 0.02 | 70.70 ± 0.02 | 71.10 ± 0.05 | 73.70 ± 0.04 | |
| C18:2 | 12.30 ± 0.01 | 11.80 ± 0.01 | 12.10 ± 0.02 | 11.80 ± 0.02 | |
| C18:3 | 1.10 ± 0.04 | 1.00 ± 0.01 | 1.00 ± 0.01 | 1.10 ± 0.01 |
Table 6.
The percentage of fatty acids (%) of all olive oils.
| Samples | February 2016 | December 2016 | February 2017 | December 2017 | |
|---|---|---|---|---|---|
| MO | C14:0 | <0.03 | <0.03 | <0.03 | <0.03 |
| C18:3 | 1.10 ± 0.01 | 1.10 ± 0.02 | 1.10 ± 0.01 | 1.10 ± 0.01 | |
| C20:0 | 0.30 ± 0.00 | 0.30 ± 0.00 | 0.40 ± 0.00 | 0.30 ± 0.00 | |
| C20:1 | 0.30 ± 0.00 | 0.30 ± 0.00 | 0.30 ± 0.00 | 0.30 ± 0.00 | |
| C22:0 | <0.10 | <0.10 | 0.10 ± 0.00 | 0.10 ± 0.01 | |
| C24:0 | <0.1 | <0.10 | 0.10 ± 0.00 | <0.10 | |
| C18:1 trans | <0.02 | <0.02 | <0.02 | <0.02 | |
| C18:3 trans + C18:2 trans | <0.02 | <0.02 | <0.02 | <0.02 | |
| MOSB | C14:0 | <0.03 | <0.03 | <0.03 | <0.03 |
| C18:3 | 1.10 ± 0.01 | 1.00 ± 0.01 | 1.00 ± 0.02 | 1.1 ± 0.03 | |
| C20:0 | 0.30 ± 0.00 | 0.40 ± 0.00 | 0.40 ± 0.00 | 0.40 ± 0.00 | |
| C20:1 | 0.30 ± 0.00 | 0.30 ± 0.00 | 0.30 ± 0.00 | 0.30 ± 0.00 | |
| C22:0 | <0.10 | <0.10 | 0.10 ± 0.00 | 0.10 ± 0.00 | |
| C24:0 | <0.10 | <0.10 | 0.10 ± 0.00 | <0.10 | |
| C18:1 trans | <0.02 | <0.02 | <0.02 | <0.02 | |
| C18:3 trans + C18:2 trans | <0.02 | <0.02 | <0.02 | <0.02 | |
| MOR | C14:0 | <0.03 | <0.03 | <0.03 | <0.03 |
| C18:3 | 1.10 ± 0.02 | 1.00 ± 0.01 | 1.00 ± 0.01 | 1.10 ± 0.01 | |
| C20:0 | 0.30 ± 0.01 | 0.30 ± 0.00 | 0.40 ± 0.00 | 0.40 ± 0.01 | |
| C20:1 | 0.30 ± 0.00 | 0.30 ± 0.00 | 0.30 ± 0.01 | 0.30 ± 0.00 | |
| C22:0 | <0.10 | 0.10 ± 0.00 | 0.10 ± 0.00 | 0.10 ± 0.00 | |
| C24:0 | <0.10 | <0.10 | 0.10 ± 0.00 | <0.10 | |
| C18:1 trans | <0.02 | <0.02 | <0.02 | <0.02 | |
| C18:3 trans + C18:2 trans | <0.02 | <0.02 | <0.02 | <0.02 | |
| MOG | C14:0 | <0.03 | <0.03 | <0.03 | <0.03 |
| C18:3 | 1.10 ± 0.02 | 1.00 ± 0.03 | 1.00 ± 0.12 | 1.10 ± 0.10 | |
| C20:0 | 0.30 ± 0.01 | 0.40 ± 0.01 | 0.40 ± 0.01 | 0.40 ± 0.01 | |
| C20:1 | 0.30 ± 0.00 | 0.30 ± 0.00 | 0.30 ± 0.00 | 0.30 ± 0.01 | |
| C22:0 | <0.10 | 0.10 ± 0.01 | 0.10 ± 0.00 | 0.10 ± 0.01 | |
| C24:0 | <0.10 | <0.10 | 0.1 ± 0.010 | <0.10 | |
| C18:1 trans | <0.02 | <0.02 | <0.02 | <0.02 | |
| C18:3 trans + C18:2 trans | <0.02 | <0.02 | <0.02 | <0.02 | |
| MOL | C14:0 | <0.03 | <0.03 | <0.03 | <0.03 |
| C18:3 | 1.10 ± 0.04 | 1.00 ± 0.02 | 1.00 ± 0.01 | 1.10 ± 0.03 | |
| C20:0 | 0.30 ± 0.00 | 0.40 ± 0.00 | 0.40 ± 0.00 | 0.40 ± 0.00 | |
| C20:1 | 0.30 ± 0.01 | 0.30 ± 0.00 | 0.30 ± 0.00 | 0.20 ± 0.00 | |
| C22:0 | <0.10 | 0.10 ± 0.00 | 0.10 ± 0.00 | 0.10 ± 0.00 | |
| C24:0 | <0.10 | <0.10 | 0.10 ± 0.00 | <0.10 | |
| C18:1 trans | <0.02 | <0.02 | <0.02 | <0.02 | |
| C18:3 trans + C18:2 trans | <0.02 | <0.02 | <0.02 | <0.02 |
Table 7.
Wax content (mg/kg oil) of all olive oils.
| Samples | February 2016 | December 2016 | February 2017 | December 2017 |
|---|---|---|---|---|
| MO | 45.00 ± 0.20 | 49.00 ± 0.21 | 34.00 ± 0.11 | 37.00 ± 0.12 |
| MOSB | 45.00 ± 0.12 | 40.00 ± 0.15 | 34.00 ± 0.20 | 31.00 ± 0.14 |
| MOR | 45.00 ± 0.13 | 42.00 ± 0.13 | 34.00 ± 0.12 | 34.00 ± 0.23 |
| MOG | 45.00 ± 0.10 | 40.00 ± 0.14 | 34.00 ± 0.10 | 32.00 ± 0.11 |
| MOL | 45.00 ± 0.12 | 41.00 ± 0.21 | 34.00 ± 0.22 | 32.00 ± 0.12 |
Table 8.
Individual sterols (%) of all olive oils.
| February 2016 | December 2016 | February 2017 | December 2017 | ||
|---|---|---|---|---|---|
| MO | Cholesterol | 0.10 ± 0.00 | 0.10 ± 0.00 | 0.10 ± 0.00 | 0.00 ± 0.00 |
| Brassicasterol | <0.10 | <0.10 | <0.10 | 0.10 ± 0.01 | |
| Campesterol | 2.20 ± 0.02 | 2.30 ± 0.01 | 2.20 ± 0.01 | 2.40 ± 0.01 | |
| Estigmasterol | 0.50 ± 0.01 | 0.50 ± 0.02 | 0.50 ± 0.01 | 0.40 ± 0.00 | |
| Clerosterol | 1.00 ± 0.01 | 1.00 ± 0.02 | 1.00 ± 0.03 | 0.90 ± 0.01 | |
| β-sitosterol | 84.30 ± 0.20 | 83.40 ± 0.18 | 86.30 ± 0.15 | 84.50 ± 0.21 | |
| 5∆-avenasterol | 10.40 ± 0.20 | 10.60 ± 0.10 | 9.80 ± 0.01 | 10.30 ± 0.11 | |
| 5,24∆-estigmastadienol | 0.40 ± 0.00 | 0.60 ± 0.00 | <0.10 | 0.20 ± 0.00 | |
| 7∆-avenasterol | 0.10 ± 0.01 | 0.20 ± 0.01 | 0.10 ± 0.01 | 0.50 ± 0.01 | |
| MOSB | Cholesterol | 0.10 ± 0.00 | 0.10 ± 0.00 | 0.10 ± 0.00 | 0.10 ± 0.00 |
| Brassicasterol | <0.10 | <0.10 | <0.10 | <0.10 | |
| Campesterol | 2.20 ± 0.02 | 2.30 ± 0.03 | 2.20 ± 0.01 | 2.30 ± 0.02 | |
| Estigmasterol | 0.50 ± 0.01 | 0.40 ± 0.01 | 0.50 ± 0.01 | 0.40 ± 0.01 | |
| Clerosterol | 1.00 ± 0.01 | 0.90 ± 0.01 | 1.00 ± 0.01 | 0.90 ± 0.02 | |
| β-sitosterol | 84.30 ± 0.10 | 83.60 ± 0.17 | 86.30 ± 0.32 | 84.60 ± 0.22 | |
| 5∆-avenasterol | 10.40 ± 0.15 | 10.60 ± 0.21 | 9.80 ± 0.17 | 10.30 ± 0.10 | |
| 5,24∆-estigmastadienol | 0.40 ± 0.01 | 0.60 ± 0.00 | <0.10 | 0.80 ± 0.00 | |
| 7∆-avenasterol | 0.10 ± 0.00 | 0.20 ± 0.00 | 0.10 ± 0.00 | 0.50 ± 0.00 | |
| MOR | Cholesterol | 0.10 ± 0.00 | 0.10 ± 0.00 | 0.10 ± 0.00 | 0.10 ± 0.00 |
| Brassicasterol | <0.10 | <0.10 | <0.10 | <0.10 | |
| Campesterol | 2.20 ± 0.02 | 2.20 ± 0.02 | 2.20 ± 0.02 | 2.50 ± 0.02 | |
| Stigmasterol | 0.50 ± 0.00 | 0.40 ± 0.00 | 0.50 ± 0.00 | 0.40 ± 0.00 | |
| Clerosterol | 1.00 ± 0.01 | 1.00 ± 0.03 | 1.00 ± 0.01 | 0.90 ± 0.01 | |
| β-sitosterol | 84.30 ± 0.11 | 83.10 ± 0.13 | 86.30 ± 0.12 | 83.60 ± 0.14 | |
| 5∆-avenasterol | 10.40 ± 0.12 | 11.00 ± 0.06 | 9.80 ± 0.03 | 10.90 ± 0.12 | |
| 5,24∆-stigmastadienol | 0.40 ± 0.01 | 0.60 ± 0.010 | <0.10 | 0.70 ± 0.02 | |
| 7∆-avenasterol | 0.10 ± 0.00 | 0.20 ± 0.00 | 0.10 ± 0.00 | 0.40 ± 0.00 | |
| MOG | Cholesterol | 0.10 ± 0.00 | 0.10 ± 0.00 | 0.10 ± 0.00 | 0.10 ± 0.00 |
| Brassicasterol | <0.10 | <0.10 | <0.10 | <0.10 | |
| Campesterol | 2.20 ± 0.01 | 2.30 ± 0.02 | 2.20 ± 0.04 | 2.50 ± 0.02 | |
| Stigmasterol | 0.50 ± 0.00 | 0.30 ± 0.00 | 0.50 ± 0.01 | 0.40 ± 0.00 | |
| Clerosterol | 1.00 ± 0.02 | 0.80 ± 0.04 | 1.00 ± 0.01 | 0.80 ± 0.04 | |
| β-sitosterol | 84.30 ± 0.10 | 83.80 ± 0.20 | 86.30 ± 0.06 | 84.00 ± 0.11 | |
| 5∆-avenasterol | 10.40 ± 0.12 | 10.60 ± 0.07 | 9.80 ± 0.02 | 10.70 ± 0.08 | |
| 5,24∆-stigmastadienol | 0.40 ± 0.01 | 0.50 ± 0.01 | <0.10 | 0.60 ± 0.01 | |
| 7∆-avenasterol | 0.10 ± 0.00 | 0.30 ± 0.00 | 0.10 ± 0.00 | 0.40 ± 0.00 | |
| MOL | Cholesterol | 0.10 ± 0.00 | 0.1 ± 0.001 | 0.10 ± 0.00 | 0.1 ± 0.001 |
| Brassicasterol | <0.10 | <0.10 | <0.10 | <0.10 | |
| Campesterol | 2.20 ± 0.02 | 2.10 ± 0.01 | 2.20 ± 0.01 | 2.30 ± 0.01 | |
| Stigmasterol | 0.50 ± 0.00 | 0.50 ± 0.00 | 0.50 ± 0.00 | 0.40 ± 0.00 | |
| Clerosterol | 1.00 ± 0.01 | 0.90 ± 0.02 | 1.00 ± 0.02 | 0.90 ± 0.01 | |
| β-sitosterol | 84.30 ± 0.12 | 83.60 ± 0.11 | 86.30 ± 0.13 | 84.50 ± 0.12 | |
| 5∆-avenasterol | 10.4±00.02 | 10.70 ± 0.03 | 9.80 ± 0.02 | 10.40 ± 0.01 | |
| 5,24∆-stigmastadienol | 0.40 ± 0.00 | 0.50 ± 0.00 | <0.10 | 0.80 ± 0.00 | |
| 7∆-avenasterol | 0.10 ± 0.00 | 0.30 ± 0.00 | 0.10 ± 0.00 | 0.50 ± 0.00 |
Table 9.
Total sterols (mg/kg) of all olive oils.
| Samples | February 2016 | December 2016 | February 2017 | December 2017 |
|---|---|---|---|---|
| MO | 1915 ± 23 | 1978 ± 15 | 1933 ± 11 | 1956 ± 05 |
| MOSB | 1915 ± 11 | 1896 ± 10 | 1933 ± 25 | 1916 ± 19 |
| MOR | 1915 ± 11 | 1954 ± 25 | 1933 ± 17 | 1966 ± 21 |
| MOG | 1915 ± 01 | 1922 ± 05 | 1933 ± 15 | 1947 ± 13 |
| MOL | 1915 ± 03 | 1893 ± 12 | 1933 ± 10 | 1916 ± 05 |
Table 10.
Erythrodiol and uvaol (%) and total phenolic compounds (mg/kg oil) of all olive oils.
| Erythrodiol and Uvaol (%) | ||||
| Samples | February 2016 | December 2016 | February 2017 | December 2017 |
| MO | 1.20 ± 0.01 | 0.90 ± 0.01 | 1.50 ± 0.01 | 0.80 ± 0.01 |
| MOSB | 1.20 ± 0.01 | 0.90 ± 0.02 | 1.50 ± 0.01 | 1.00 ± 0.02 |
| MOR | 1.20 ± 0.03 | 1.10 ± 0.04 | 1.50 ± 0.05 | 1.10 ± 0.03 |
| MOG | 1.20 ± 0.02 | 1.20 ± 0.01 | 1.50 ± 0.02 | 1.10 ± 0.01 |
| MOL | 1.20 ± 0.01 | 1.00 ± 0.03 | 1.50 ± 0.01 | 1.00 ± 0.04 |
| Total Phenolic Compounds (mg/kg oil) | ||||
| February 2016 | December 2016 | February2017 | December 2017 | |
| MO | 222.00 ± 1.01 | 206.00 ± 1.10 | 249.00 ± 1.80 | 234.00 ± 1.23 |
| MOSB | 222.00 ± 1.02 | 237.00 ± 2.33 | 249.00 ± 2.04 | 269.00 ± 1.60 |
| MOR | 222.00 ± 1.12 | 241.00 ± 1.21 | 249.00 ± 1.22 | 200.00 ± 2.02 |
| MOG | 222.00 ± 1.23 | 233.00 ± 2.30 | 249.00 ± 2.23 | 256.00 ± 1.23 |
| MOL | 222.00 ± 1.22 | 208.00 ± 1.20 | 249.00 ± 1.23 | 236.00 ± 1.27 |
Table 11.
Tocopherols (mg/kg oil) of all olive oils.
| Samples | February 2016 | December 2016 | February 2017 | December 2017 | |
|---|---|---|---|---|---|
| MO | Total | 313.00 ± 2.30 | 355.40 ± 2.80 | 203.00 ± 1.70 | 299.20 ± 1.90 |
| α- tocopherol | 307.00 ± 1.30 | 348.20 ± 2.30 | 203.00 ± 2.20 | 291.20 ± 1.30 | |
| β- tocopherol | 3.00 ± 0.03 | 2.30 ± 0.01 | <1.00 | 2.60 ± 0.02 | |
| γ- tocopherol | 3.00 ± 0.02 | 4.90 ± 0.04 | <0.10 | 5.40 ± 0.04 | |
| MOSB | Total | 313.00 ± 3.10 | 344.10 ± 2.40 | 203.00 ± 1.30 | 273.80 ± 1.90 |
| α- tocopherol | 307.00 ± 1.30 | 338.20 ± 1.30 | 203.00 ± 1.30 | 266.10 ± 1.30 | |
| β- tocopherol | 3.00 ± 0.02 | 1.90 ± 0.01 | <1.00 | 2.50 ± 0.01 | |
| γ- tocopherol | 3.00 ± 0.04 | 3.90 ± 0.06 | <1.00 | 5.20 ± 0.02 | |
| MOR | Total | 313.00 ± 1.70 | 366.20 ± 2.30 | 203.00 ± 1.80 | 288.0 ± 1.70 |
| α- tocopherol | 307.00 ± 0.30 | 359.30 ± 1.60 | 203.00 ± 2.30 | 280.10 ± 0.30 | |
| β- tocopherol | 3.00 ± 0.08 | 2.20 ± 0.23 | <1.00 | 2.60 ± 0.02 | |
| γ- tocopherol | 3.00 ± 0.14 | 4.60 ± 0.03 | <1.00 | 5.30 ± 0.01 | |
| MOG | Total | 313.00 ± 1.20 | 376.50 ± 2.30 | 203.00 ± 1.90 | 317.60 ± 1.30 |
| α- tocopherol | 307.00 ± 1.50 | 369.30 ± 3.30 | 203.00 ± 2.30 | 309.30 ± 1.00 | |
| β- tocopherol | 3.00 ± 0.03 | 2.40 ± 0.06 | <1.00 | 2.70 ± 0.02 | |
| γ- tocopherol | 3.00 ± 0.09 | 4.70 ± 0.05 | <1.00 | 5.60 ± 0.03 | |
| MOL | Total | 313.00 ± 1.30 | 361.60 ± 1.30 | 203.00 ± 1.30 | 304.60 ± 1.30 |
| α- tocopherol | 307.00 ± 1.90 | 354.40 ± 0.70 | 203.00 ± 1.50 | 296.70 ± 2.10 | |
| β- tocopherol | 3.00 ± 0.02 | 2.40 ± 0.02 | <1.00 | 2.60 ± 0.02 | |
| γ- tocopherol | 3.00 ± 0.01 | 4.80 ± 0.03 | <1.00 | 5.30 ± 0.04 |
Table 12.
Oxidative stability (h) of all olive oils.
| Samples | February 2016 | December 2016 | February 2017 | December 2017 |
|---|---|---|---|---|
| MO | 8.8 ± 0.1 | 6.0 ± 0.1 | 8.9 ± 0.1 | 6.0 ± 0.2 |
| MOSB | 8.8 ± 0.1 | 7.0 ± 0.2 | 8.9 ± 0.4 | 6.5 ± 0.4 |
| MOR | 8.8 ± 0.2 | 4.3 ± 0.1 | 8.9 ± 0.3 | 4.4 ± 0.1 |
| MOG | 8.8 ± 0.3 | 6.0 ± 0.5 | 8.9 ± 0.1 | 5.9 ± 0.2 |
| MOL | 8.8 ± 0.1 | 5.7 ± 0.1 | 8.9 ± 0.1 | 5.6 ± 0.1 |
Table 13.
Microbiological analysis (CFU/g) of all olive oils.
| Samples | ||||
|---|---|---|---|---|
| MO | February 2015 | December 2015 | February 2017 | December 2017 |
| Microorganisms | <1 | <1 | <1 | <1 |
| Coliform bacteria | <1 | <1 | <1 | <1 |
| coagulase + Staphylococci | <1 | <1 | 1 | <1 |
| MOSB | February 2015 | December 2015 | February 2017 | December 2017 |
| Microorganisms | <1 | <1 | <1 | <1 |
| Coliform bacteria | <1 | <1 | <1 | <1 |
| coagulase + Staphylococci | <1 | <1 | <1 | <1 |
| MOR | February 2015 | December 2015 | February 2017 | December 2017 |
| Microorganisms | <1 | <1 | <1 | <1 |
| Coliform bacteria | <1 | <1 | <1 | <1 |
| coagulase + Staphylococci | <1 | <1 | <1 | <1 |
| MOG | February 2015 | December 2015 | February 2017 | December 2017 |
| Microorganisms | <1 | <1 | <1 | <1 |
| Coliform bacteria | <1 | <1 | <1 | <1 |
| coagulase + Staphylococci | <1 | <1 | <1 | <1 |
| MOL | February 2015 | December 2015 | February 2017 | December 2017 |
| Microorganisms | <1 | <1 | <1 | <1 |
| Coliform bacteria | <1 | <1 | <1 | <1 |
| Coagulase + Staphylococci | <1 | <1 | <1 | <1 |
Disclaimer/Publisher’s Note: The statements, opinions and data contained in all publications are solely those of the individual author(s) and contributor(s) and not of MDPI and/or the editor(s). MDPI and/or the editor(s) disclaim responsibility for any injury to people or property resulting from any ideas, methods, instructions or products referred to in the content. |
© 2023 by the authors. Licensee MDPI, Basel, Switzerland. This article is an open access article distributed under the terms and conditions of the Creative Commons Attribution (CC BY) license (https://creativecommons.org/licenses/by/4.0/).
Share and Cite
MDPI and ACS Style
Chéu-Guedes, M.H.; La Rubia, M.D.; Sánchez, S.; Ramos, N.; Pacheco, R. Characterization of Flavoured Olive Oils of ‘Madural’ Variety. Processes 2023, 11, 205. https://0-doi-org.brum.beds.ac.uk/10.3390/pr11010205
AMA Style
Chéu-Guedes MH, La Rubia MD, Sánchez S, Ramos N, Pacheco R. Characterization of Flavoured Olive Oils of ‘Madural’ Variety. Processes. 2023; 11(1):205. https://0-doi-org.brum.beds.ac.uk/10.3390/pr11010205
Chicago/Turabian StyleChéu-Guedes, María Helena, M. Dolores La Rubia, Sebastián Sánchez, Natividad Ramos, and Rafael Pacheco. 2023. "Characterization of Flavoured Olive Oils of ‘Madural’ Variety" Processes 11, no. 1: 205. https://0-doi-org.brum.beds.ac.uk/10.3390/pr11010205
Note that from the first issue of 2016, this journal uses article numbers instead of page numbers. See further details here.