Article

Determination of Electrogenic Potential and Removal of Organic Matter from Industrial Coffee Wastewater Using a Native Community in a Non-Conventional Microbial Fuel Cell

by
Santiago Erazo
1,* and
Lina María Agudelo-Escobar
2
1
Research Group Biotransformación, University of Antioquia, Medellín 050001, Colombia
2
Professor School of Microbiology, University of Antioquia, Medellín 050001, Colombia
*
Author to whom correspondence should be addressed.
Submission received: 10 November 2022 / Revised: 12 January 2023 / Accepted: 19 January 2023 / Published: 25 January 2023
(This article belongs to the Special Issue Microbial Bioremediation of Environmental Pollution)

Abstract

:
Microbial fuel cells (MFCs) are an alternative to conventional wastewater treatments that allow for the removal of organic matter and cogeneration of electrical energy, taking advantage of the oxidation–reduction metabolism of organic compounds conducted by microorganisms. In this study, the electrogenic potential and the capacity for the reduction of the organic matter of native microbial communities in wastewater from the wet processing of coffee were evaluated using open-cathode MFCs. To determine the electrogenic potential, a factorial experimental design was proposed in which the origin of the residual water and the source of the inoculum were evaluated as factors. The MFCs operated for 21 days in both open-circuit and closed-circuit operation modes. Voltage records, current determinations, and chemical oxygen demand (COD) analyses were used to establish the power reached in the electrochemical system and the degree of the decontamination of the wastewater. During the MFC operation, voltages from 200–400 mV and power and current densities from 300–900 mW·m−2 and 10–22 mA·m−2, respectively, were reached. The inoculum used, with a statistical significance of α < 0.05, influenced the electrogenic performance of the microbial fuel cell. The previous process of adaptation to the operational conditions of the MFCs of the native microbial community positively influenced the current generation in the system. The degradation rates reached 500–600 mg·L−1·day−1, indicating the metabolic capacity of the microbial community in the MFCs to achieve the decontamination of wastewater from the coffee agroindustry. It was shown the implementation of bioelectrochemical systems constituted a viable option for the treatment of agricultural waste in Colombia. In addition, it was observed the capacity to cogenerate electrical energy from the biotransformation of the polluting organic matter in the effluents of the coffee industry.

1. Introduction

In Colombia, agriculture constitutes a fundamental pillar of the regional economy, contributing an estimated USD 6116 million during the first half of 2022 [1]. One of the outstanding Colombian agricultural products is coffee, which is recognized worldwide for its quality. This attribute comes from the cultivated species and the post-harvest process used, known as wet coffee processing [2,3,4]. This process consists of a series of washing, pulping, and mucilage removal stages that require high pure water consumption, estimated at up to 20 L for each kg of processed coffee beans [4]. In Colombia, between 13 and 14 million 60-kg bags of dry parchment coffee are produced annually [5], and pure water consumption of more than 1.7 × 10⁷ m3 is estimated for the different stages of wet processing of coffee [4]. Consequently, a large amount of liquid waste, called agro-industrial wastewater (AWW), is generated. In general, agricultural activities intensify in proportion to a population increase to meet the growing food demand, and consequently, the consumption of resources and the generation of waste also increase.
For the removal of contaminants in liquid waste, systems known as wastewater treatment plants (WWTP) are designed and installed [6]. However, these installations are generally found in urban areas or cities, and they are not distributed in agricultural areas. Only 20% of WW treatment is conducted in these plants, mainly domestic WW [7]. Considering that nearly 95% of the harvest and post-harvest of coffee takes place in the artisanal facilities of small farmers, there is no effective treatment and control of AWW discharges [3,8,9,10]. The difficulties of accessibility and the limitation in the collection of liquid waste from rural areas generate environmental and public health problems due to the dumping of AWW into surface water sources [7].
As an alternative to conventional wastewater treatment processes in WWTP, bio-electrochemical systems (BESs), has been proposed [11,12]. BESs are systems that, through the microbial oxidation–reduction metabolism of organic compounds, remove the contaminant load of WW by cogenerating chemical or electrical energy or biofuels, depending on the type of system implemented or treated waste [13]. BESs can be classified depending on the type of cogenerated energy, and the most widely distributed are (i) microbial electrolysis cells (MECs), from which biofuels, such as methane (CH4) and hydrogen (H2), are recovered [14,15,16], and (ii) microbial fuel cells (MFCs) that generate usable energy in the form of electricity [17,18,19,20]. The implementation of a specific BES depends largely on the composition of the organic matter that is used as a substrate. The implementation of BES has been reported to have the potential to decontaminate agro-industrial effluents, such as, for example, as mentioned in various studies, the AR treatment of coconut crops, food derivatives, and, in general, various residues from the production of raw materials, raw and processed foods, or even from the agricultural inputs industry [19,21,22,23,24,25]. Different microorganisms, consortia, and microbial communities involved in the generation of energy from the degradation of organic matter have been reported; these are known as electrogenic microorganisms [26,27,28,29,30]. MFCs use microbial metabolism, mainly anaerobes, which release electrons derived from the catabolism of the organic molecules required for their growth, reproduction, or cell maintenance [31,32]. In some stages of wet coffee processing, such as mucilage removal, the native microbial communities of the same coffee load are used in a fermentative process to remove the organic film (mucilage) of the fruit to obtain the grain [8,33]. These native microbial communities in WW have an advantage in terms of adaptation to the environment and do not require conditioning or biostimulus to consume organic matter. The purpose of this study was to determine the capability of native microorganisms used as the inoculum in non-conventional MFCs to generate energy and remove organic matter from industrial coffee wastewater.

2. Materials and Methods

Substrate and inoculum. Industrial coffee wastewater (CWW) from a wet coffee processing plant located in the municipality of Andes in Antioquia, Colombia, was used as the substrate for the MFCs. In the experiment, two different wastewaters were used: WW from a fermentation stage (S1) and leachate from a coffee-pulping stage (S2). The inocula used were a mixed native microbial community (I1) obtained from a 1:1 mixture of both CWW substrates and a mature native microbial community (I2) [34] obtained from a previous experiment with non-conventional MFCs. To conserve the inocula, each sample was mixed with a proportion of 15% pure glycerol in 15 mL conical tubes and stored at −80 °C. The substrate samples were stored in plastic containers at 4 °C.
Experimental setup. The open-cathode MFC used in the experiment was fabricated with unconventional materials [34]. The chamber was fabricated with ABS polymeric material. The anode was made of carbon felt (G475, AvCarb®) (0.3 × 6.0 × 12.0 cm). The ion exchange membrane was fabricated with traditional Colombian ceramic materials (Medellín, Colombia) (brick mesh No. 30) (0.5 × 4.0 × 7.0 cm). A carbon cloth (1.77 g·cm−3, CCP-30S, Fuel Cell Earth®), 4.0 × 6.0 cm, was used as a cathode, and it was joined to the ceramic membrane with 99% activated carbon with 1:4 sodium chloride binder. Conventional titanium wire (Gr1, CrazyWire® Warrington, UK) was used as a collector in the MFCs’ circuits. The anodic chamber has an effective volume of 200 mL. Figure 1 shows the experimental assemblies.
Experimental design and operation mode. To determine the electrogenic potential and organic-matter-removal capability of the native microbial communities found in CWW, a 22 factorial experimental design was developed. The sources of substrate (S) and inoculum (I) were evaluated as factors. The levels of inocula were mixed inoculum (I1) and maturated inoculum (I2), and the substrate levels were fermentation CWW (S1) and leached CWW (S2); all these were previously described. The experiment was made in duplicate and with two controls, using an electrogenic medium of reference adapted from Bagchi et al. [35]. The experimental design’s set of conditions are presented in Table 1. For each setup, 185 mL of substrate was poured into the anodic chamber, and 15 mL of inoculum was added. The MFCs were operated at room temperature (approx. 24 °C) in open-circuit and closed-circuit operation modes for 21 days during each stage. The substrate in the anodic chamber was maintained in suspension with magnetic stirring equipment (INTLLAB®) operated at 150 rpm. The MFCs were operated in the fed-batch mode with the addition of 10 mL of substrate per day.
Results register and analysis. Response variables of the experiment were established: the voltage for open-circuit operation, the current determination for closed-circuit operation, and the COD determination for the organic-matter-removal capability. Voltage and current potentials were determined every 24 h with a digital multimeter (UT61C, UNIT® Dongguan City, China). The power and current densities of the MFCs were calculated considering Ohm’s law, as shown in Equations (1)–(4). At the end of each open-circuit and closed-circuit stage, polarization curves were made with resistors between 100 and 15,000 kΩ to establish the internal resistance of the system. A cyclic voltammetry analysis was made vs. Ag.AgCl (KCl 3M, Metrohm Autolab® Utrecht, The Netherlands), the reference electrolyte Fe(CN)6 5 × 10⁻³ M (in KCl 0.1 M), and reference Au and Pt electrodes (CHI102 CH Instruments® Austin, TX, USA) to evaluate the electrochemical performance of each MFC in this study; for the analysis, an M204 Metrohm Autolab® (Utrecht, The Netherlands) was used. COD analysis was completed in samples taken every 72 h, following the method proposed in SM 5220 [36]. The statistical analysis for the experimental design was made by an analysis of variance (ANOVA) and comparison tests (LSD–Tukey’s) with the statistical software R Studio (V. 2022.02.0 + 443 Boston, MA, USA).

3. Results

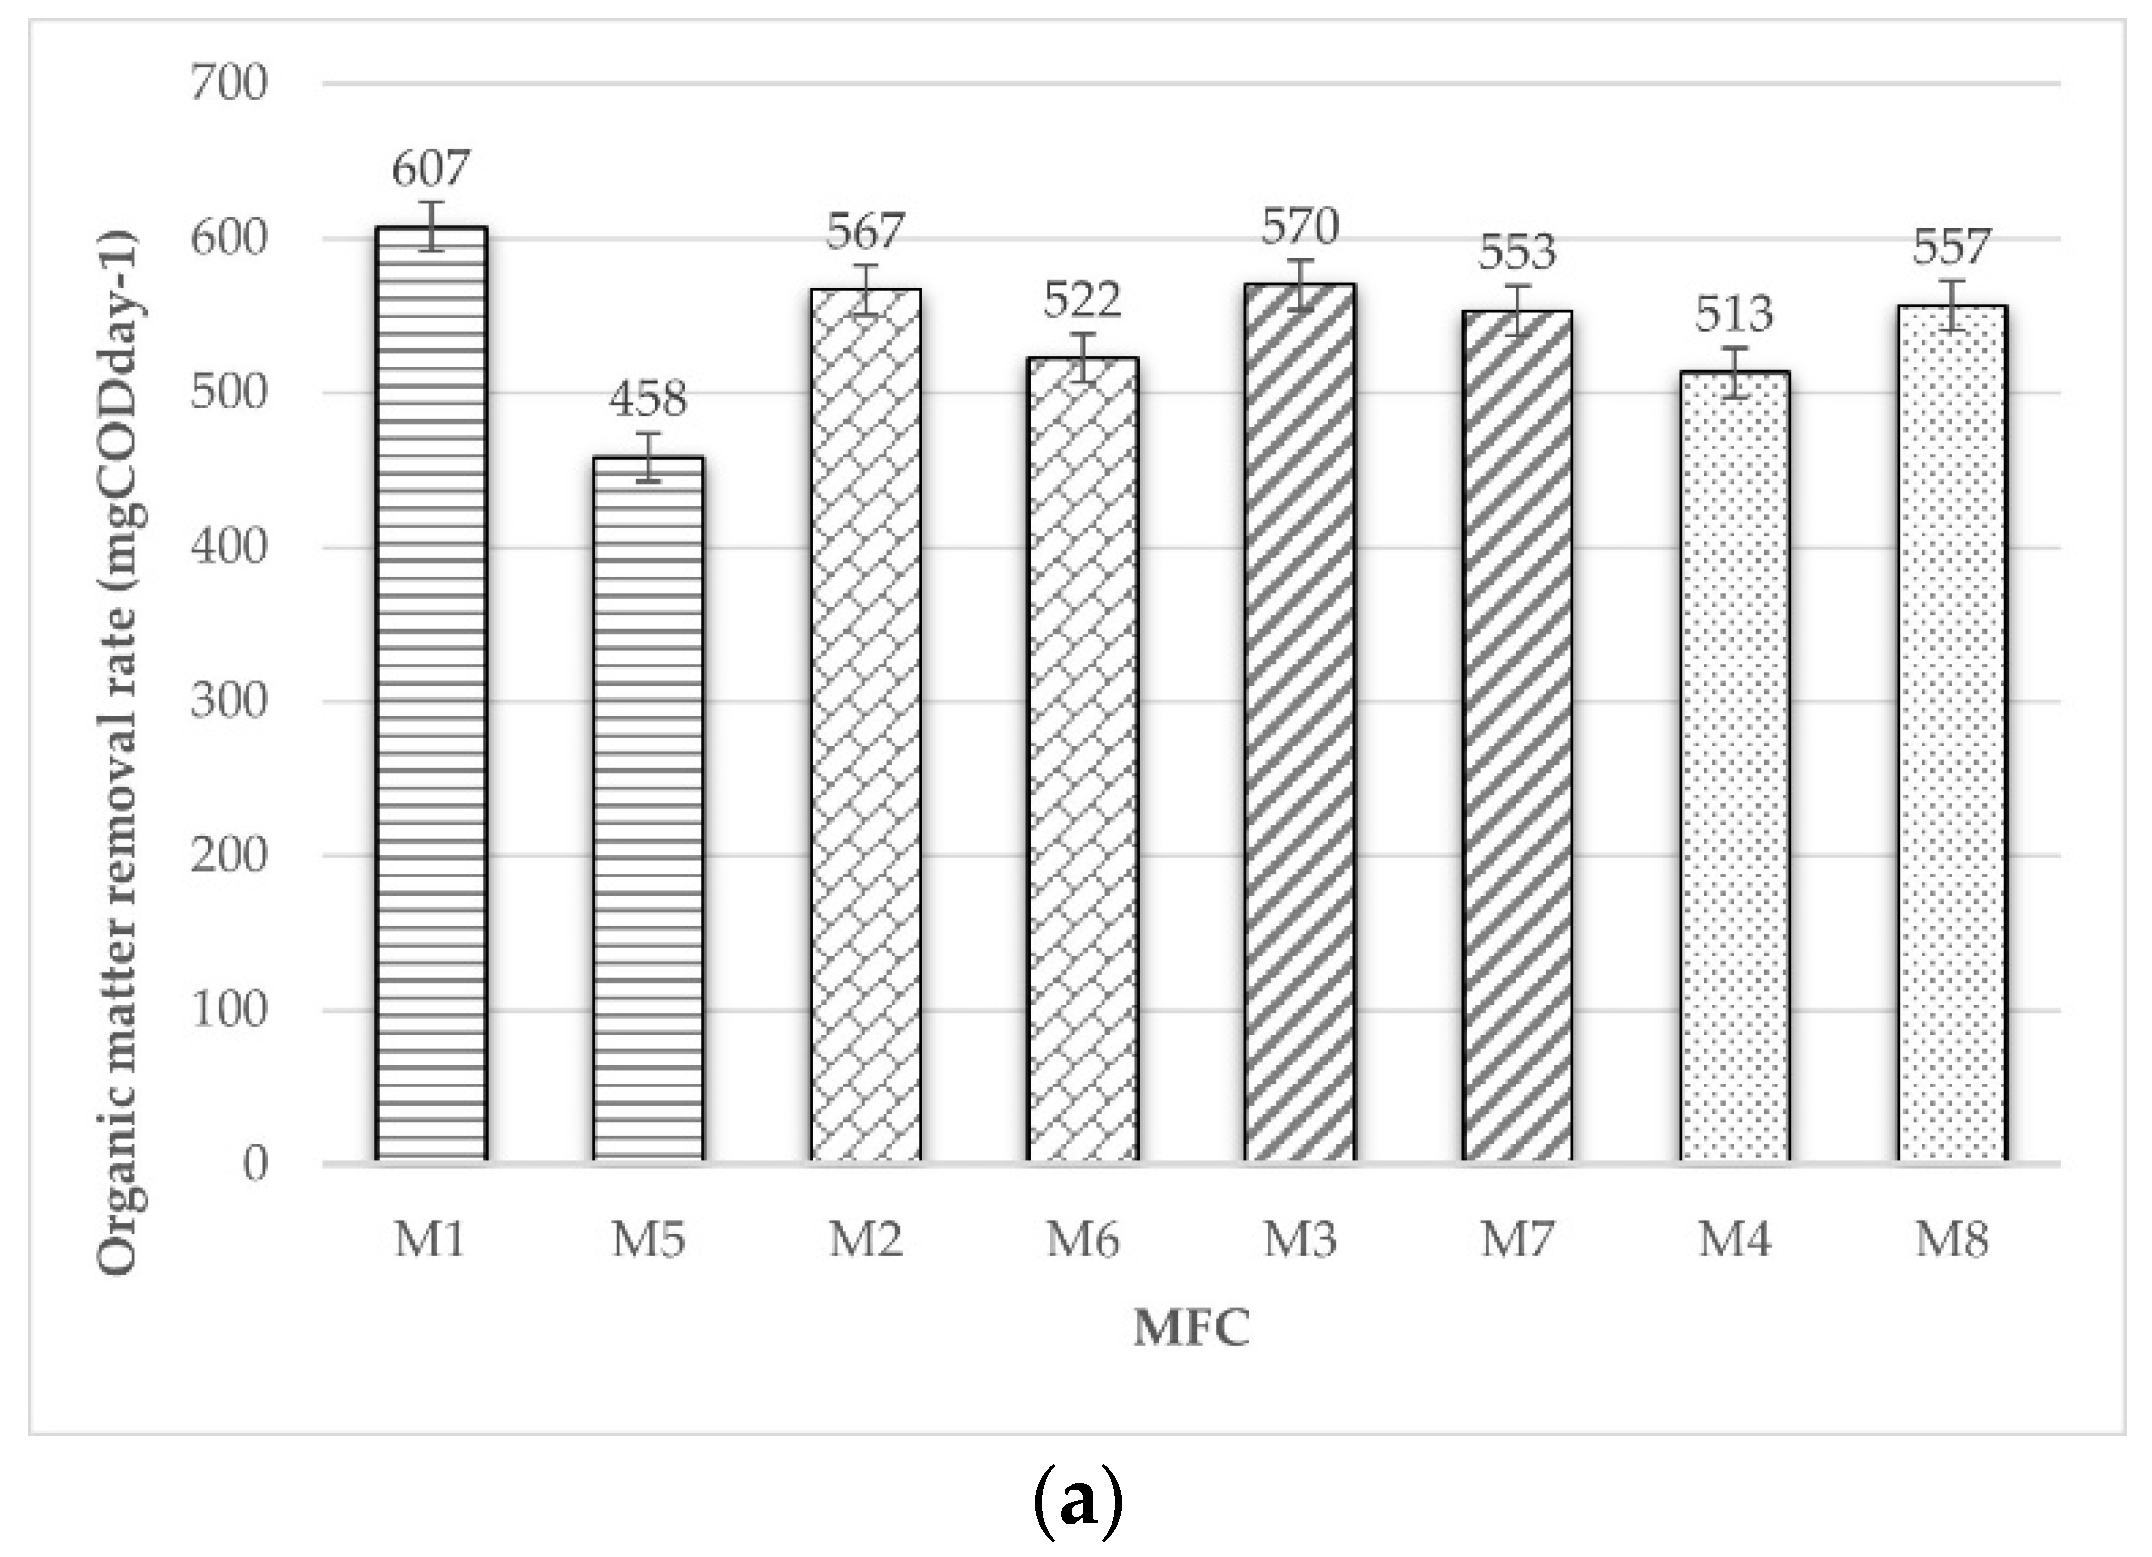
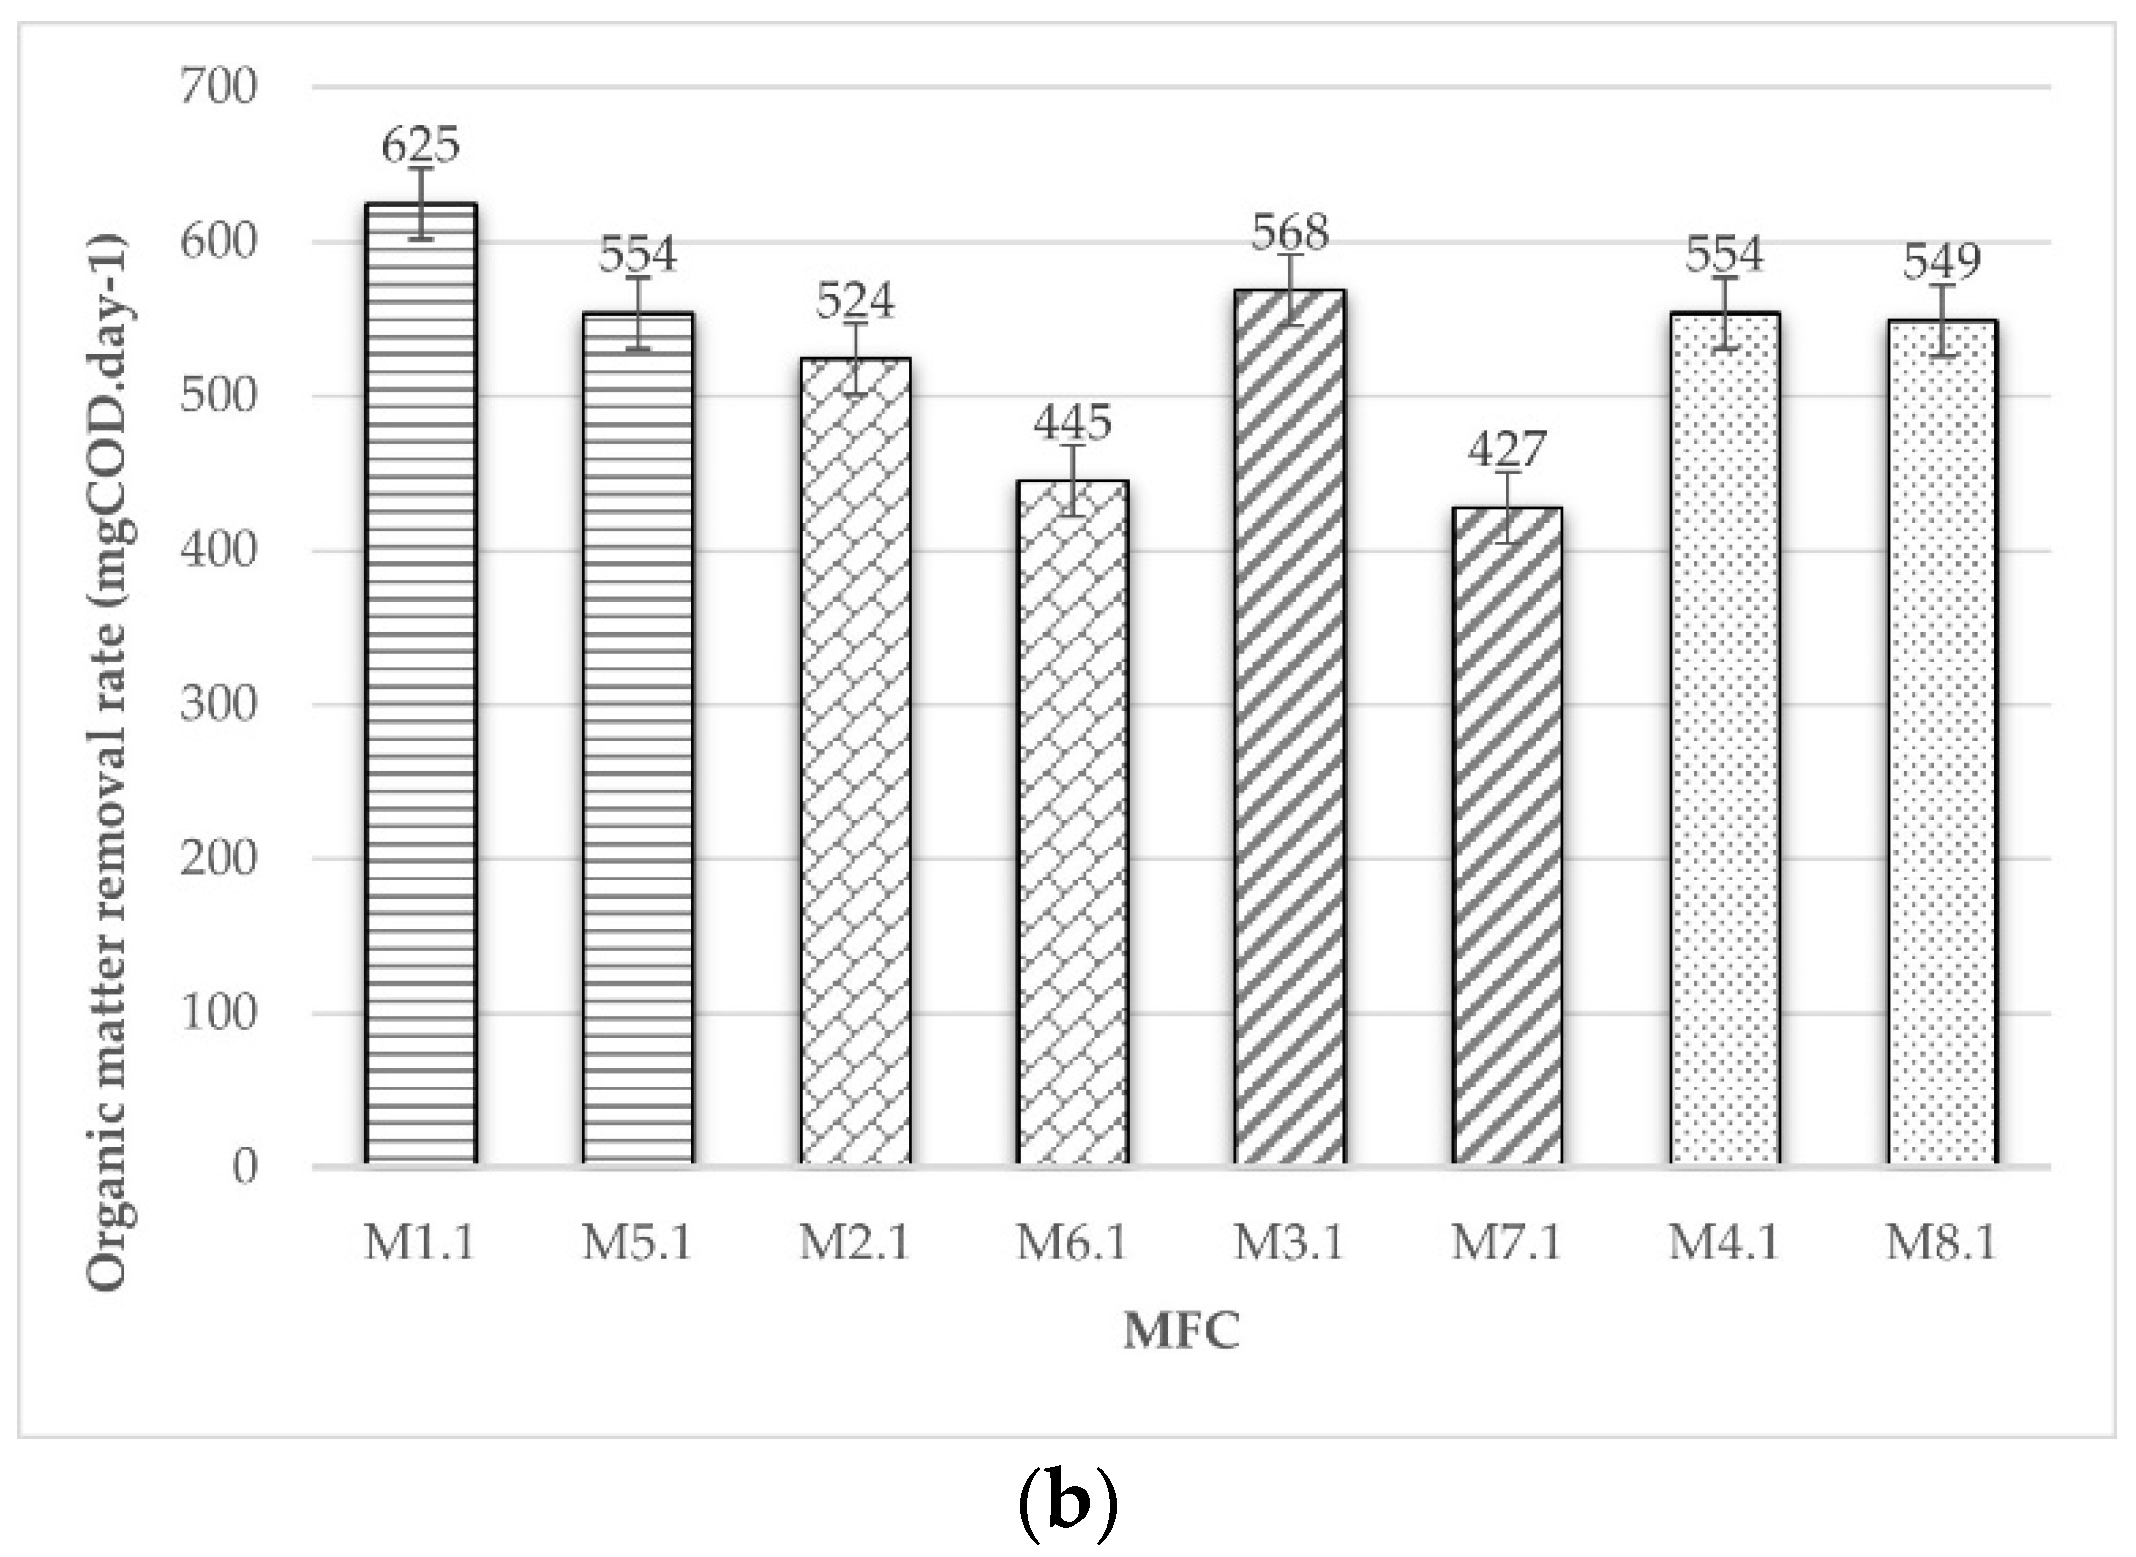
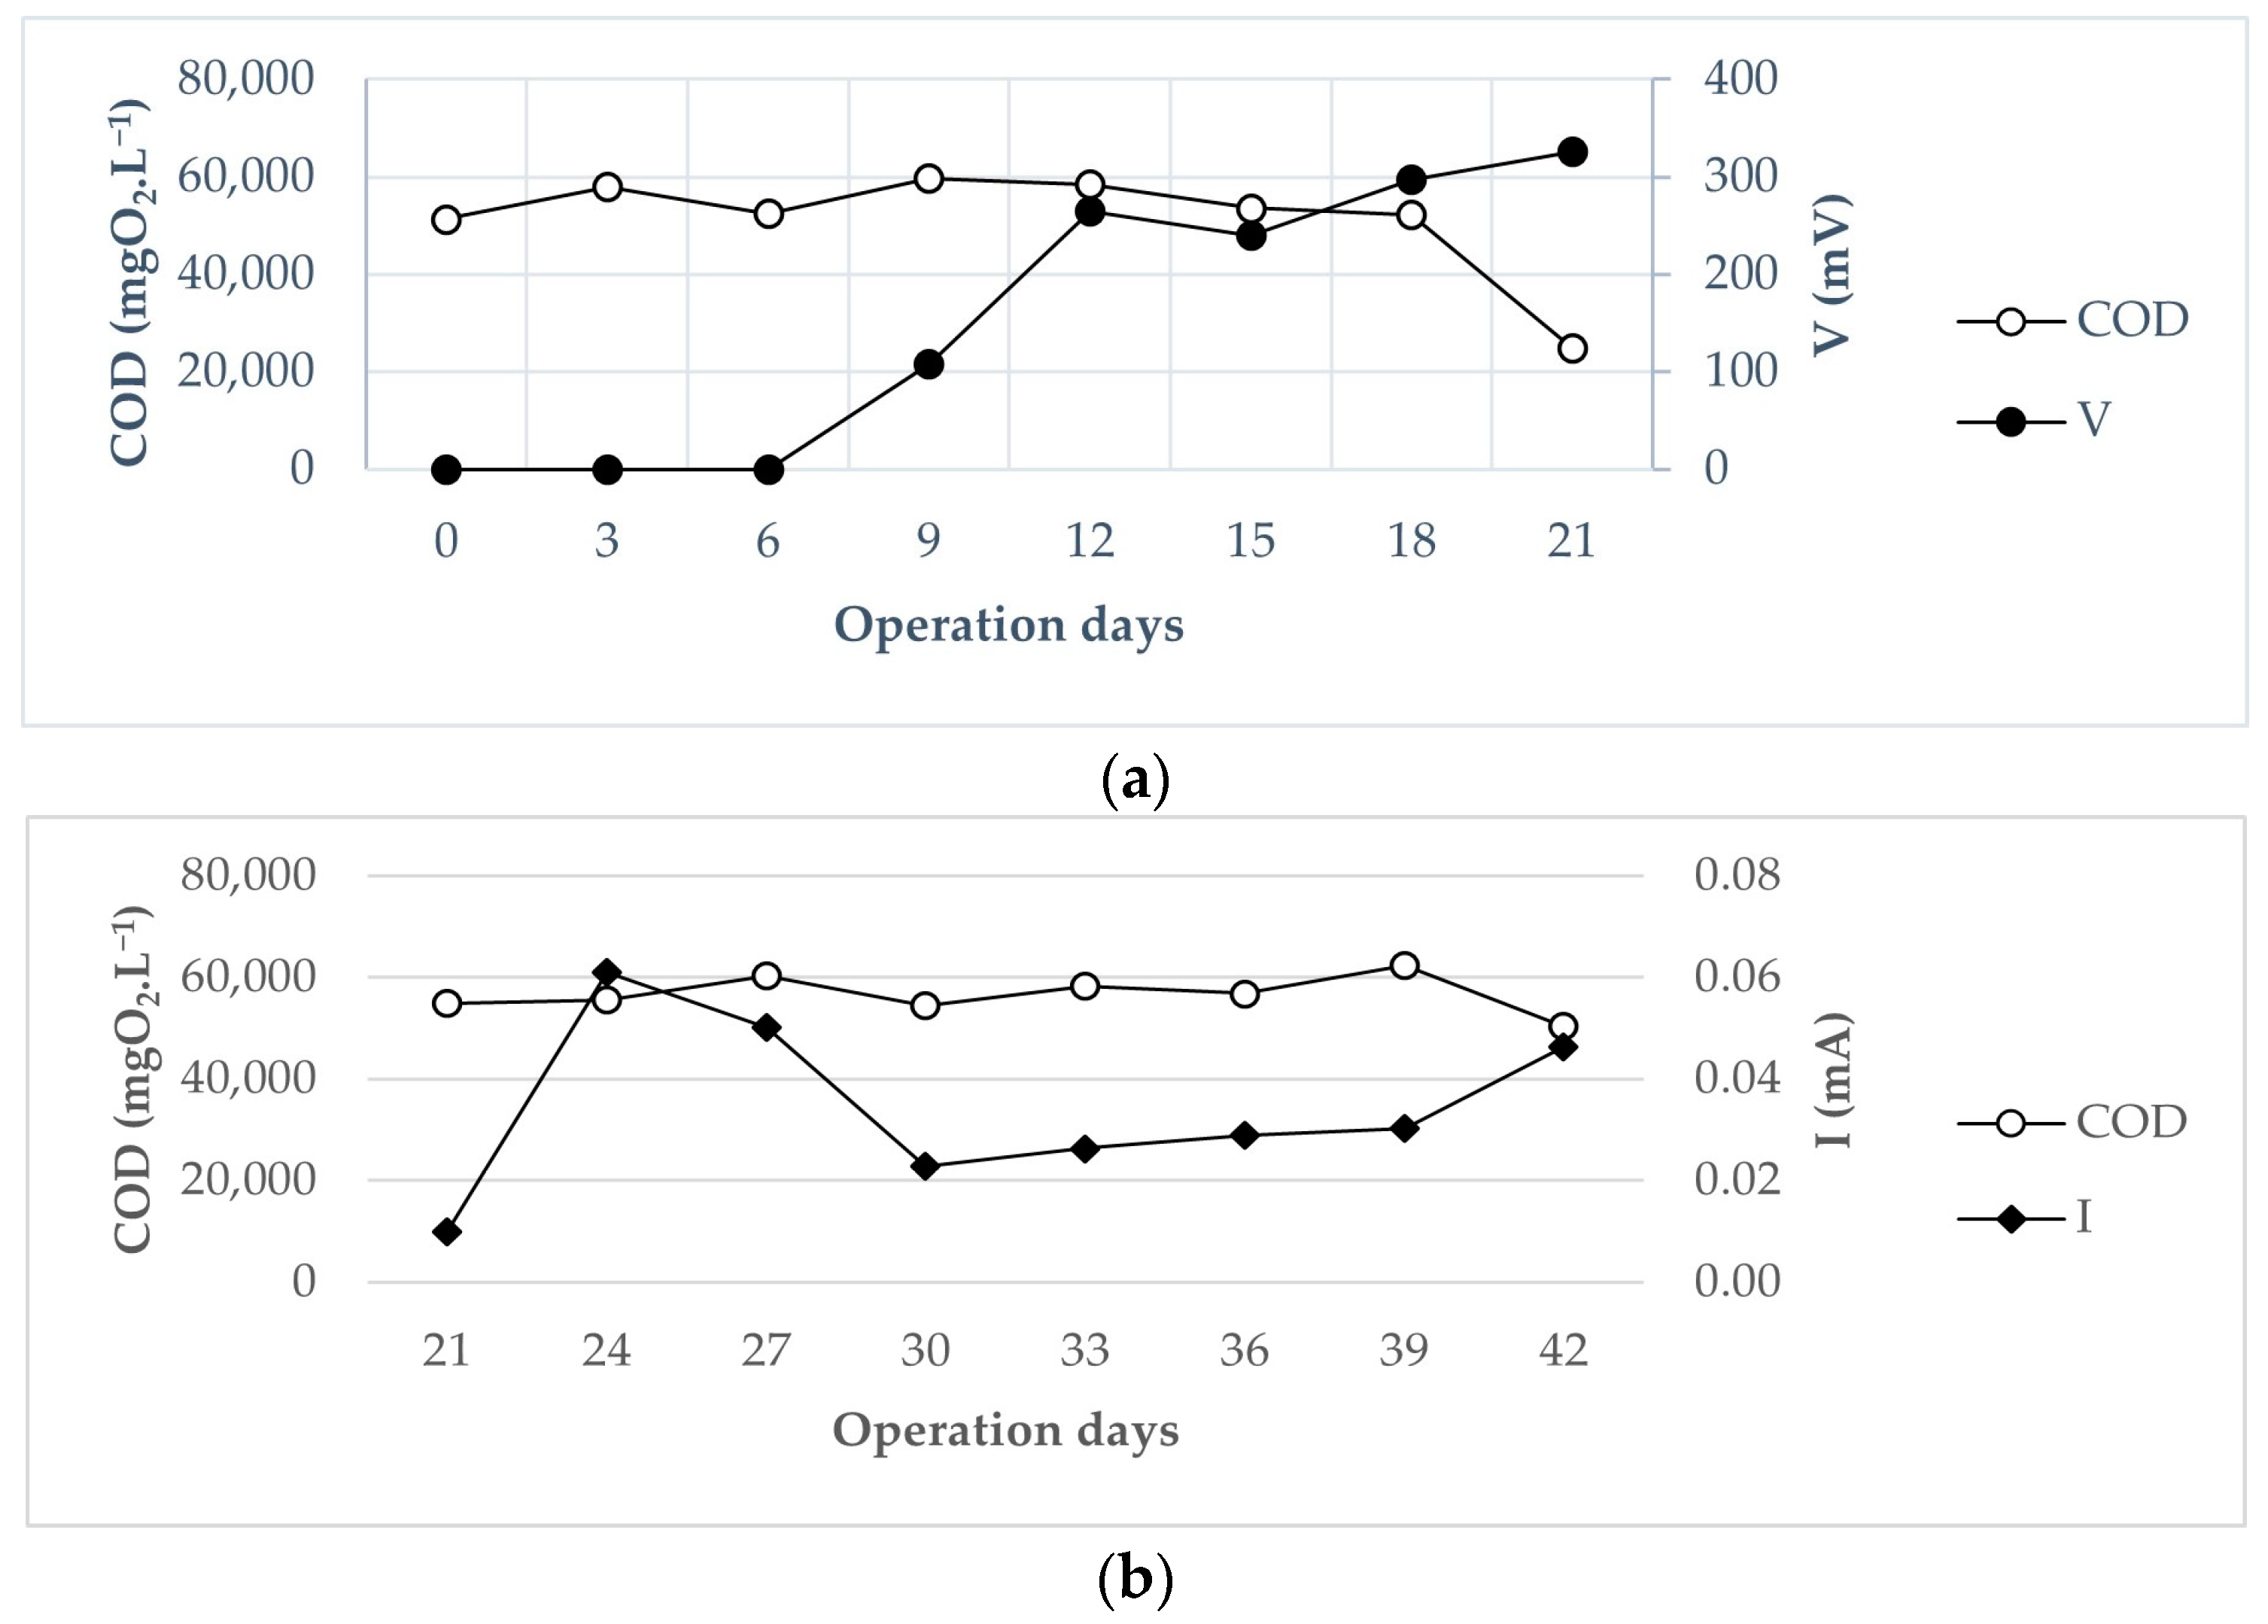
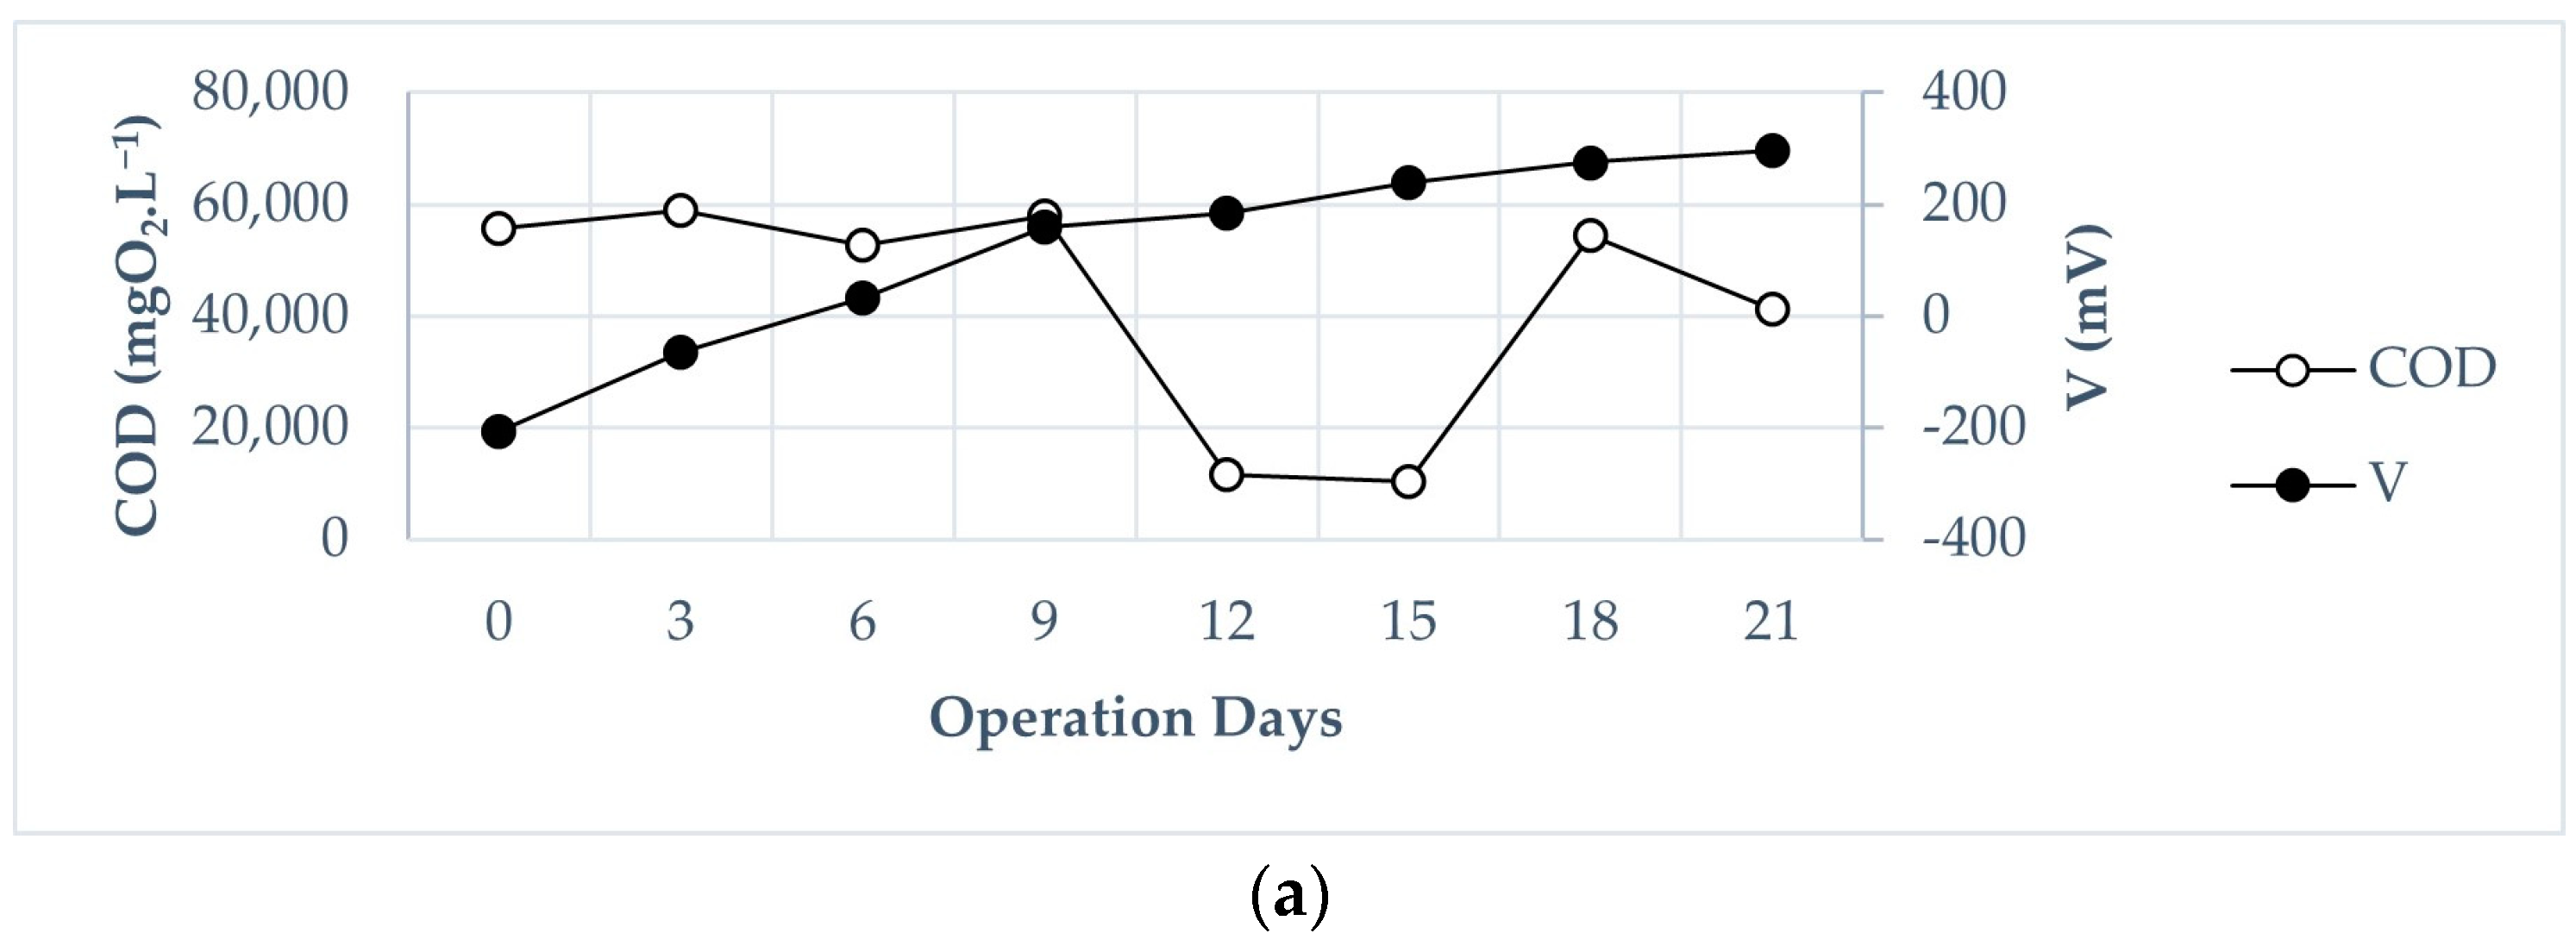
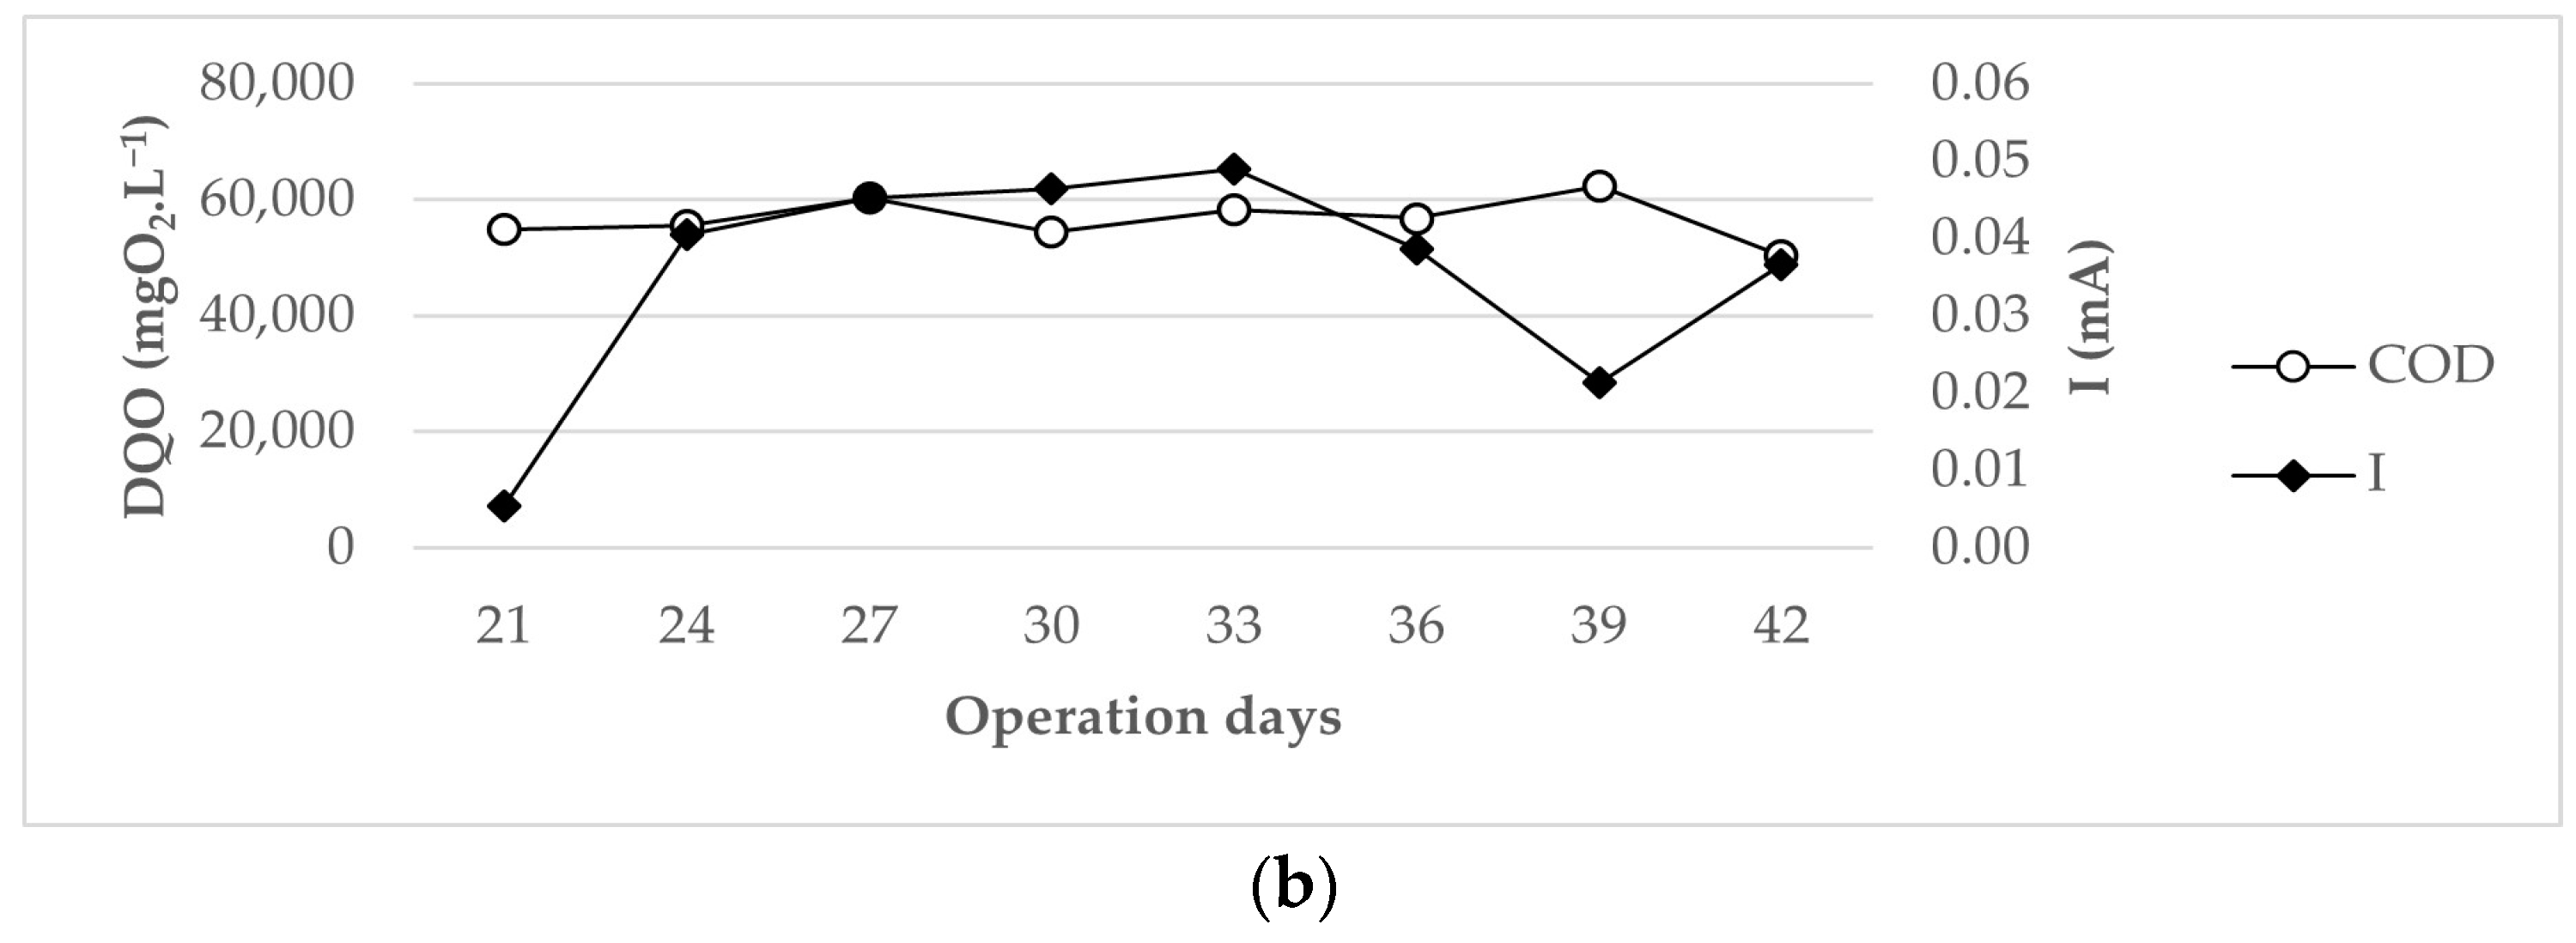
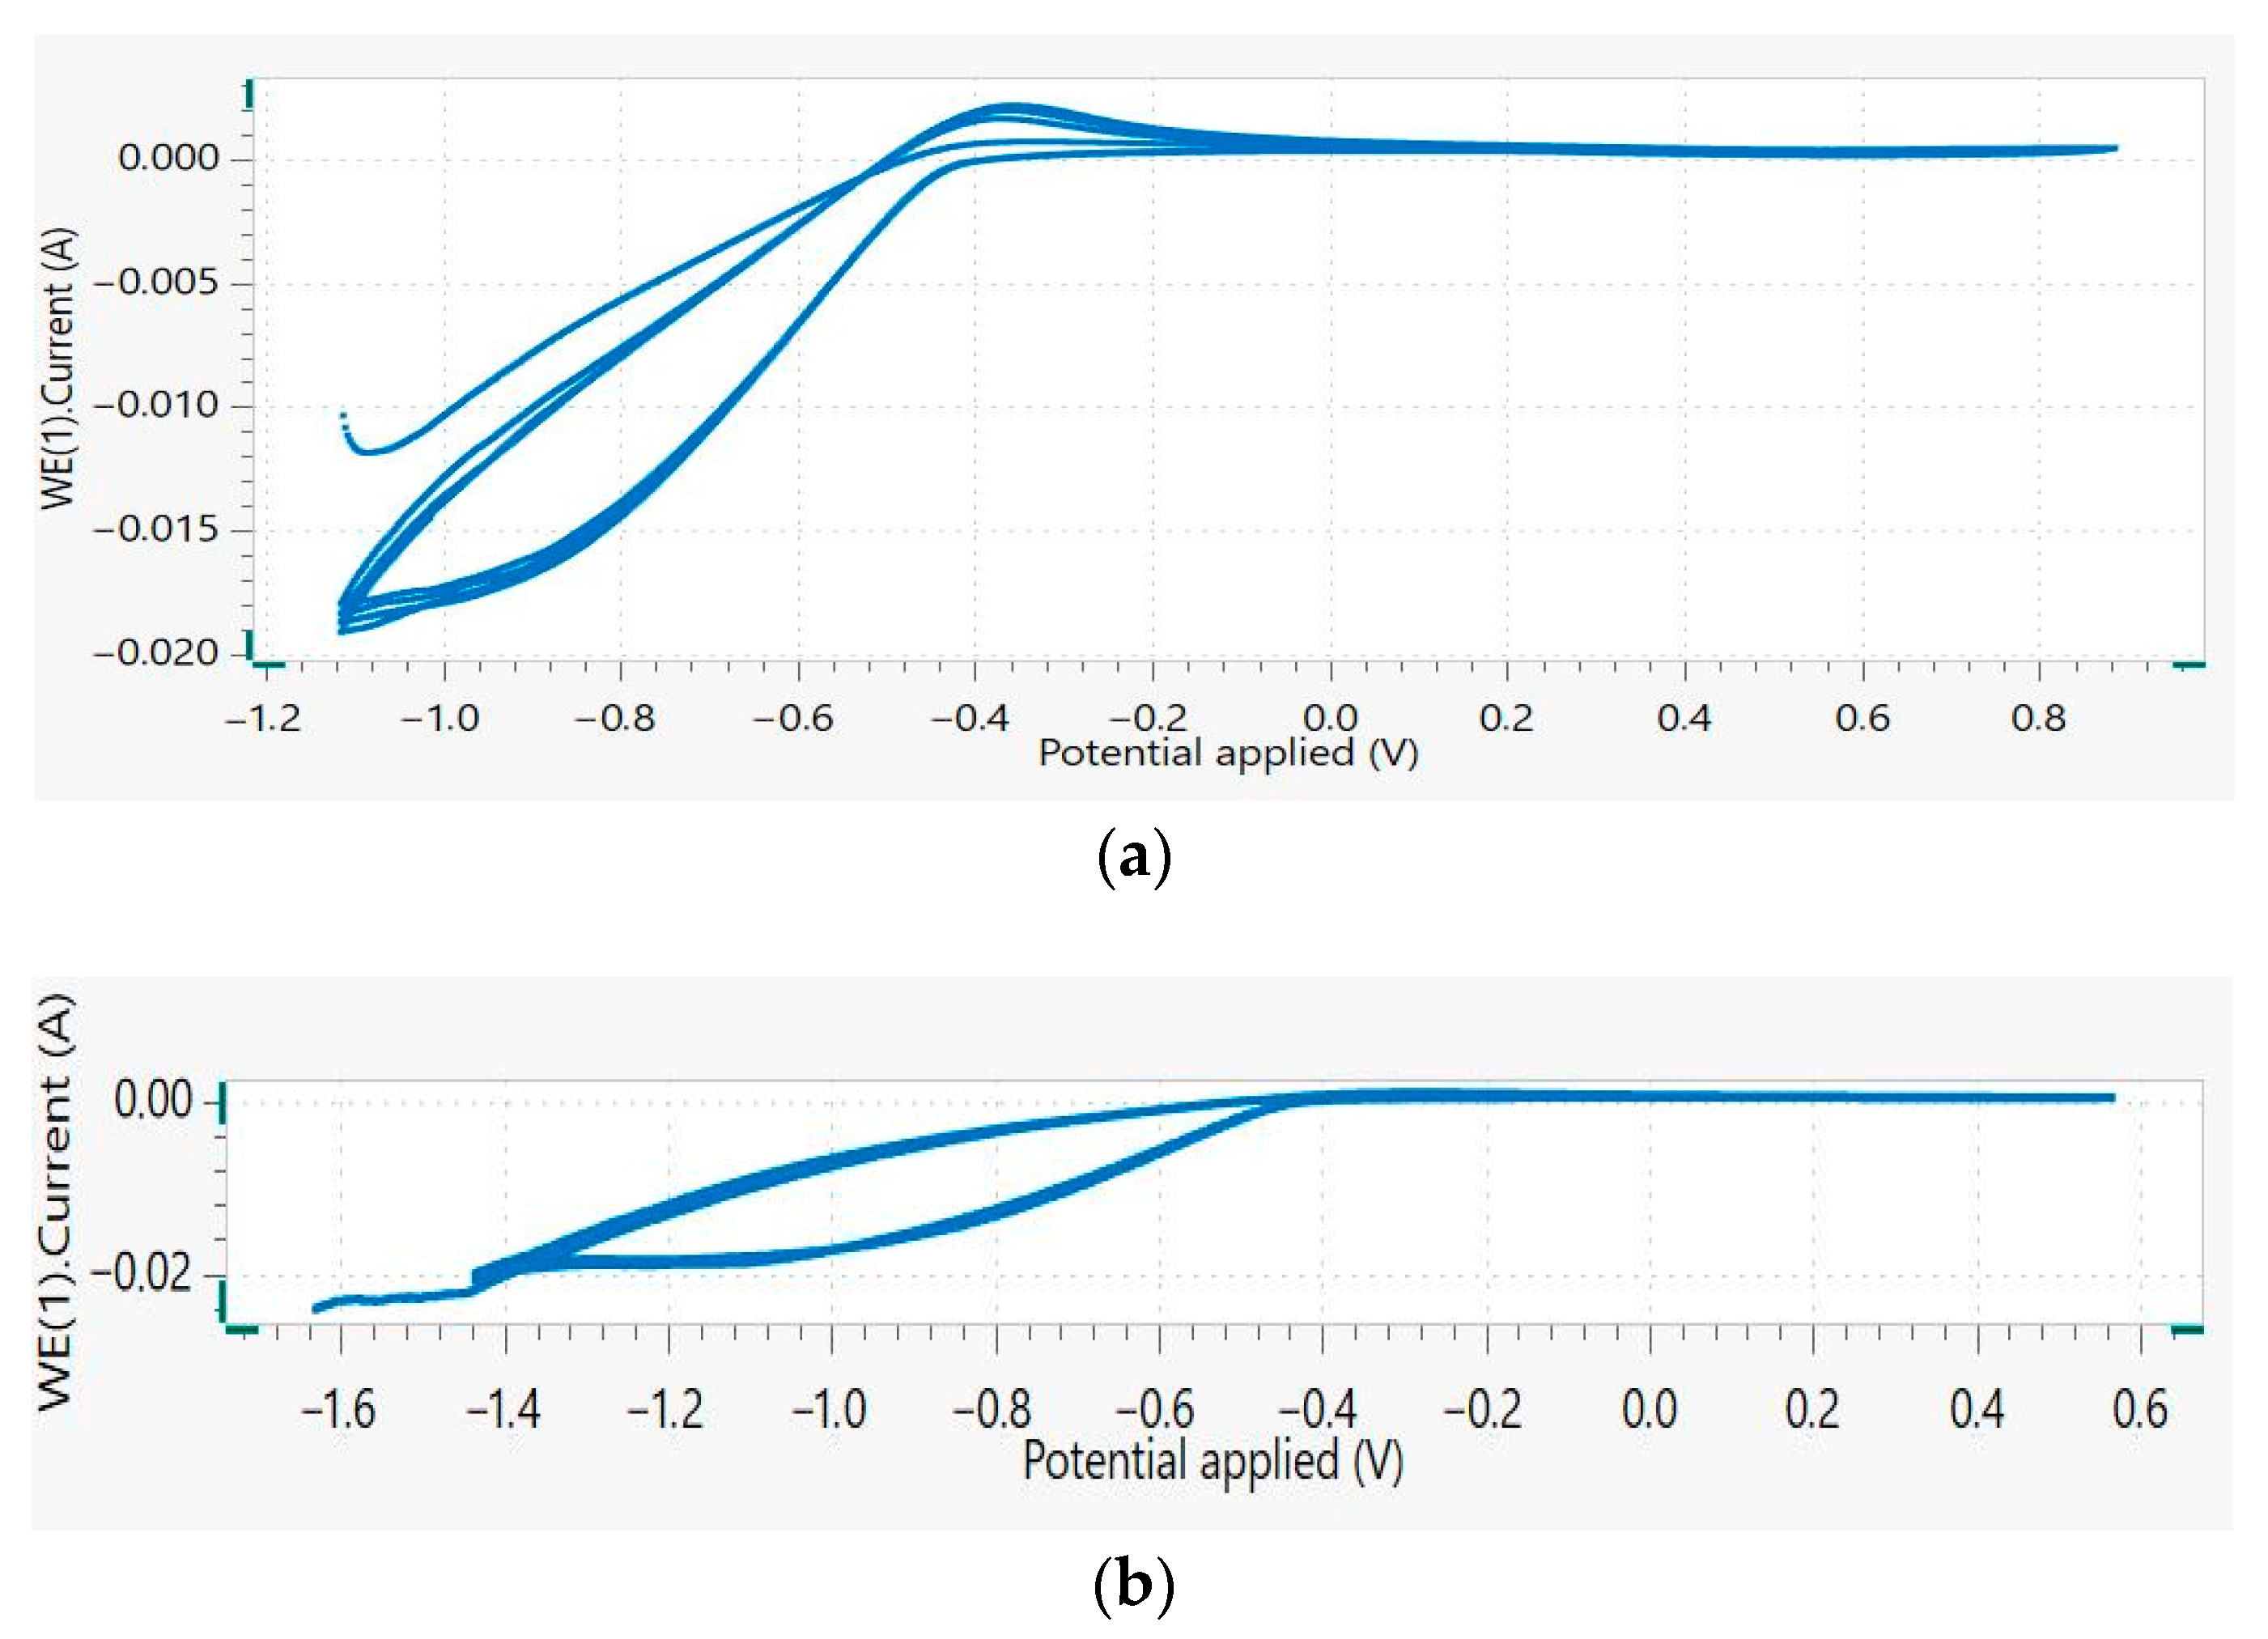
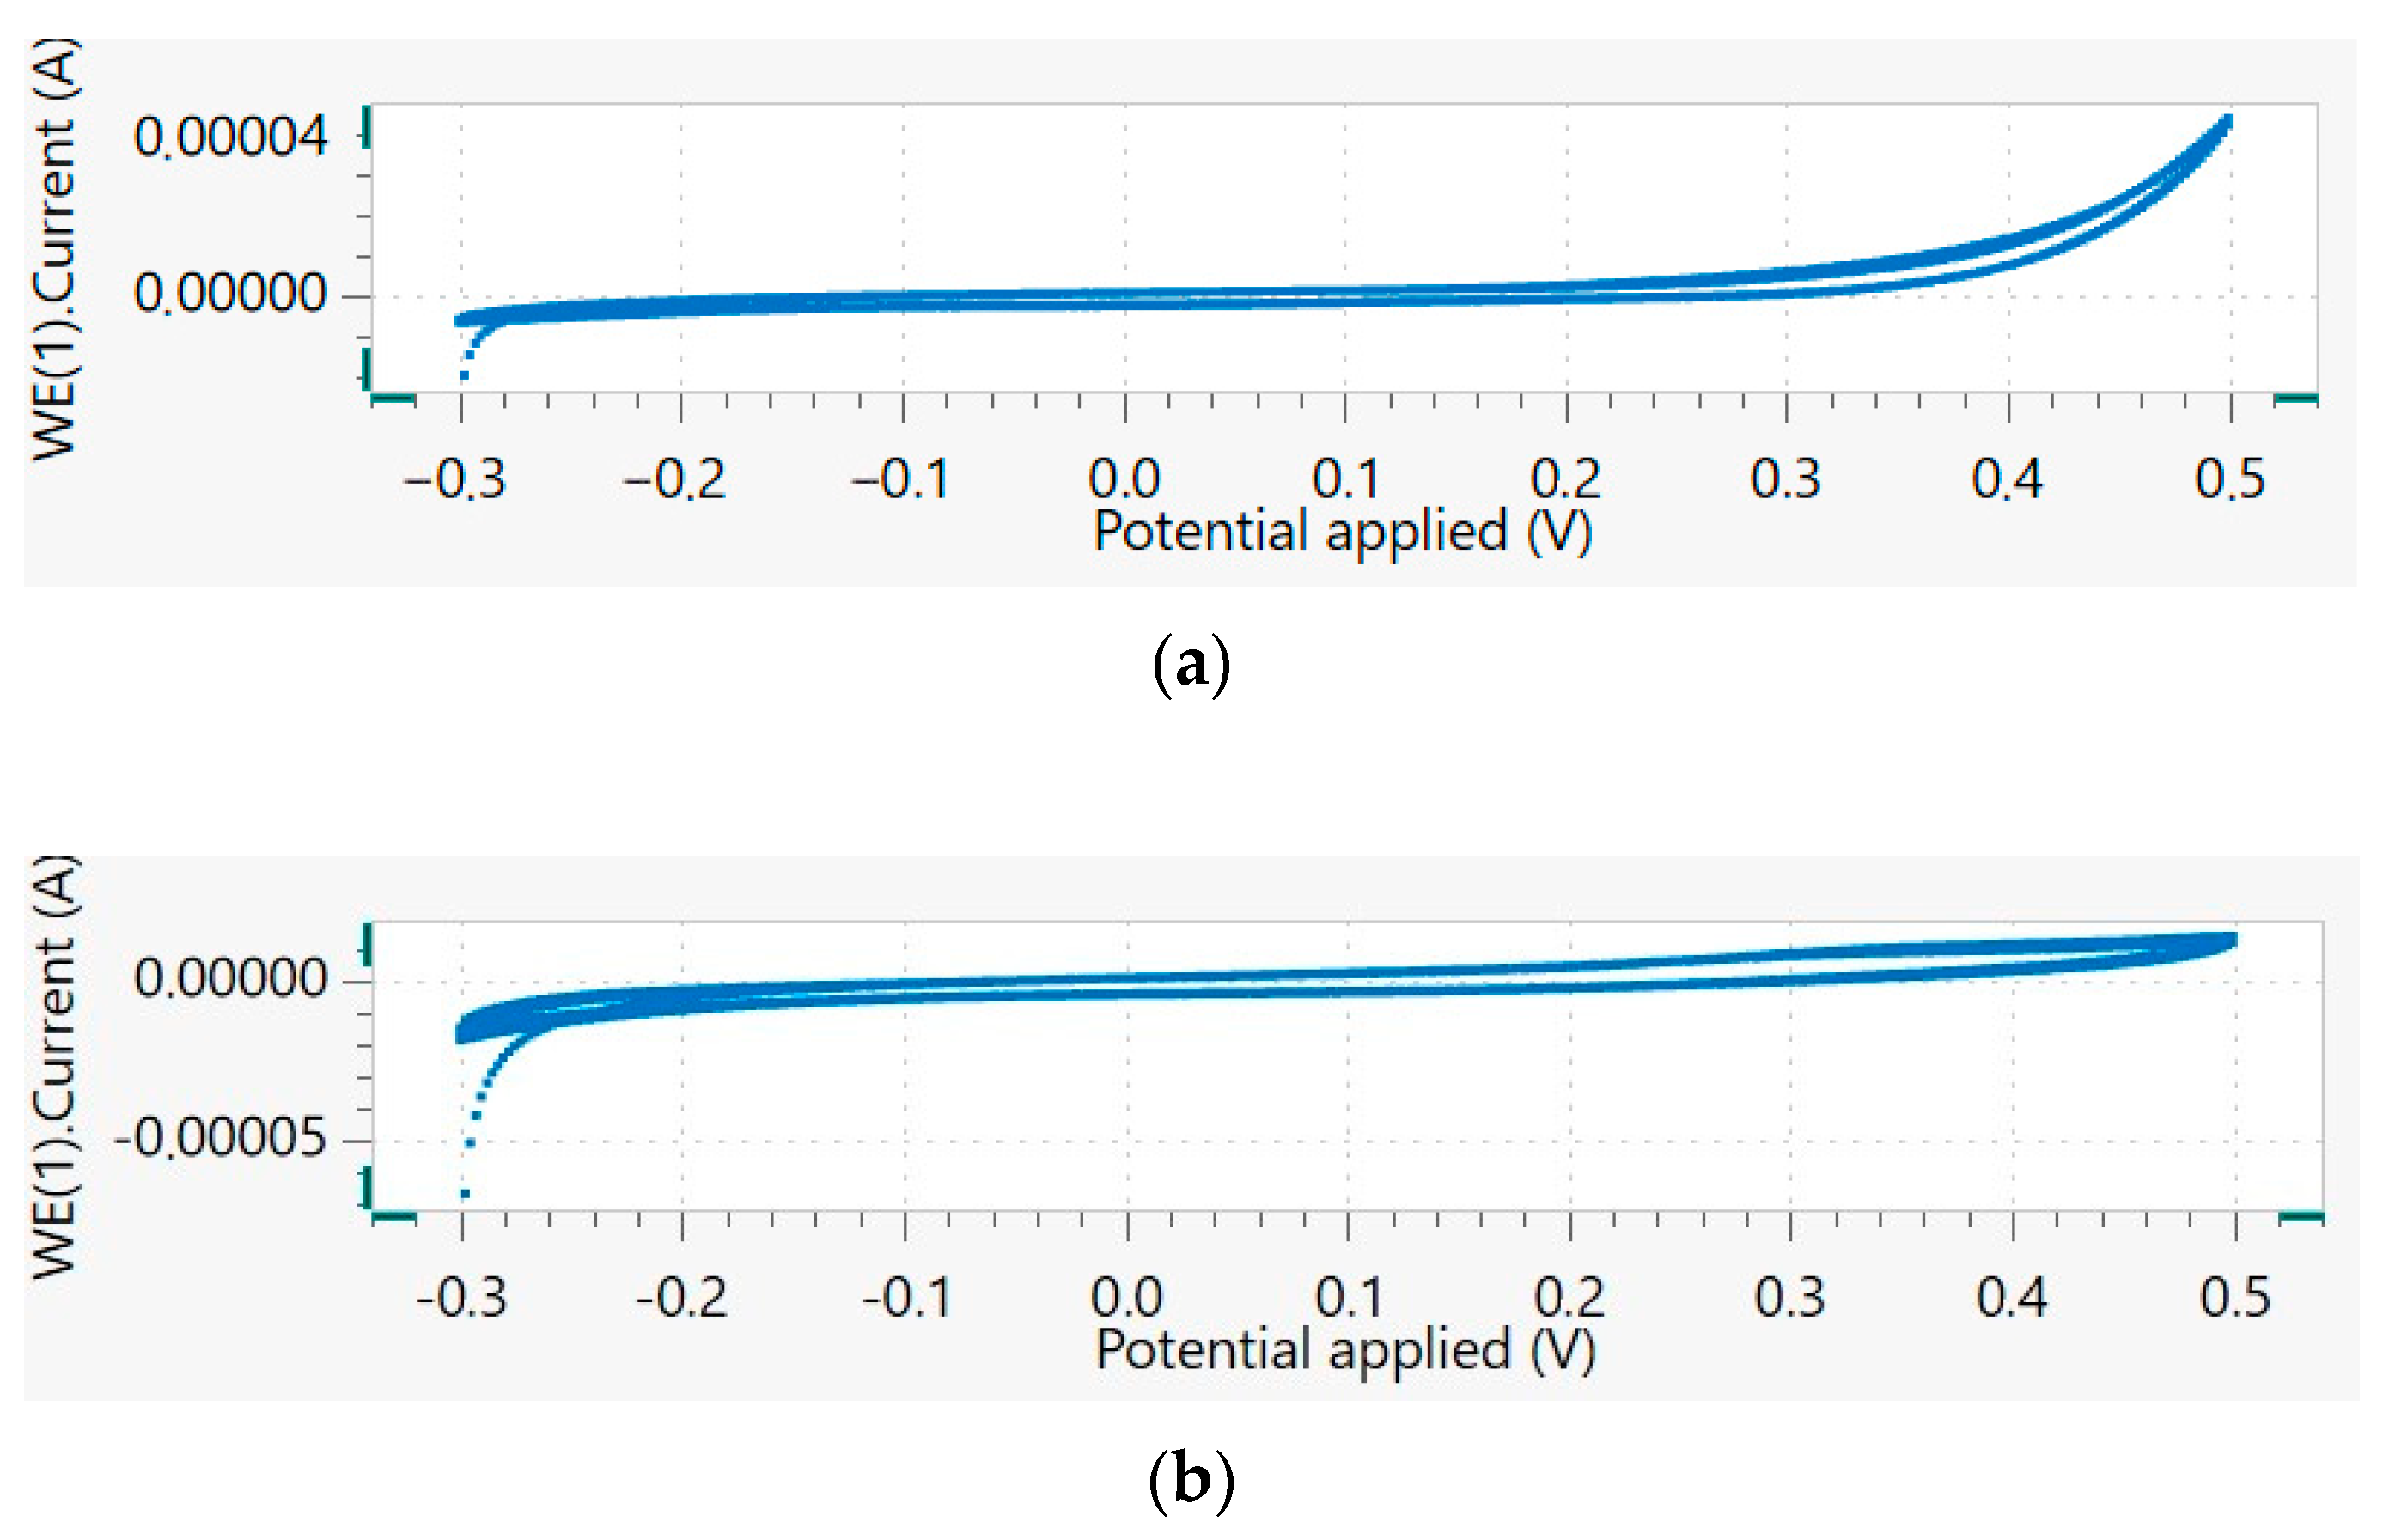
3.1. Determination of Electrogenic Potential and Removal of Organic Matter

The cyclic voltammetry analyses of the reference electrodes and the experimental electrodes were evidence of the system’s ability to transfer electrons (energy generation) in the non-conventional MFCs used in this study. The behavior exhibited in the tests conducted through CV analyses showed the same current peaks for the oxidation of 0.3 mA and −0.3 mA for the reduction of the reference electrolyte (Fe(CN)6) in the tests conducted on the reference electrodes and the carbon electrodes used in the non-conventional MFCs. These results showed a similar magnitude for the redox current, indicating that the MFCs’ electrodes fabricated with carbon felt had electric charge transfer properties suitable for energy recovery without limitations in this BES. The voltammograms are presented in Figure 2 and Figure 3.
The positive voltage measures recorded during the open-circuit operation and positive-current measures obtained during the closed-circuit operation of the MFCs were an indication of the electrogenic potential of the CWW’s native microbial communities. Voltage values between 74 and 350 mV were recorded during open-circuit operation. The highest voltages were present in MFCs M4 and M8, which corresponded to the maturated inoculum (I2). These results suggest an influence by the type of inoculum on the performance of the cells. Even with C2, it was verified in a reference culture medium inoculated with I2 that the electrogenic potential during open-circuit operation was considerably higher. The current in the MFCs during closed-circuit operation was higher in the same experiments for M4, M8, and C2. In general, currents between 0.01 and 0.06 mA were recorded. The MFCs with the mixed inoculum without previous biostimulus (I1) showed lower potentials compared with those with maturated inoculum. However, both the voltage and the current measured directly in these MFCs were positive. The summary of the results of the maximum values reached for V and I at the end of each stage are presented in Figure 4 and Figure 5.
During closed-circuit operation, there were polarization curves between 100 and 15,000 Ω. The electrical resistance for which the MFC registered the highest potential was considered the minimum resistance to overcome the internal resistance of each system. The summary of the results is shown in Table A1 in Appendix A. The power density (DP) and current density (DI) per unit area of the anode electrode, determined using Ohm’s law, are summarized in Figure 6 and Figure 7. In general, the internal resistances of the systems oscillated in the range from 1000–3800 Ω. The resistances of MFCs M3–M7 were superior to 10 kΩ. These results are related to the electrochemical performance of the cells, considering the influence of the culture medium and the microbial biofilms. In Figure A1, presented in the Appendix A, it is possible observe the biofilm formed in the anode. This conformation is a common microbial growth on the surface that could generate transfer mass limitations and affect an MFC’s performance. However, the results of the maximum potential determined by means of the polarization curves for each MFC could be an indication of the specific behavior of the microbial community and the origin of the culture medium used in each experiment. These results show that the native microorganisms have an electrogenic potential associated with the oxidation–reduction metabolism of the organic matter.
The electrogenic potential of MFCs is directly related to the ability of the microorganisms in the anodic chamber to metabolize the organic load. The ability of native CWW microbial communities to reduce water contamination was determined by changes in the COD concentration of the industrial coffee wastewater used as the substrate. A significative reduction in the contained organic matter was registered for each experiment. The rates of COD degradation in the MFCs were approximately similar for the open-circuit and closed-circuit operation modes. COD removal rates between 400 and 600 mg L−1 day−1 were reached, and the results are shown in Figure 8. These results indicated microbial adaptation in a complex substrate, such as CWW, and the ability of the native microbial community to metabolize the organic material in this type of wastewater. Figure 9 and Figure 10 show the behavior of MFCs M4 and M8 in which the highest potentials were obtained. The voltage, current, and COD concentration were tracked as a function of time. A progressive increase in the voltage and current values was obtained. For M4, shown in Figure 9a, a gradually increasing potential was generated from the sixth day until the end of the open-circuit operation. In Figure 9b, after connecting the electrical resistance of the MFCs for closed-circuit operation, a short period of three days of adaptation was observed; after that period, a continuous potential increase was also observed.
For COD concentration, during the first part of open-circuit operation approximately constant values were observed. However, at the end of each operation stage, a reduction in organic matter contained in the substrate occurred. This performance could be explained by the operational mode used in the experiment: the MFCs were operated in feed-batch mode, with a daily substrate addition to maintain a constant volume in the anodic chamber. However, this behavior could be attributed to the microbial specialization of the native microbial community during the MFCs’ operation and the substrate’s transformation as a consequence of microbial metabolic activity. The relationship between these parameters during the MFCs’ performance was inversely proportional, as the organic matter was transformed and consumed by the electrogenic microbial metabolism, while the voltage and current were incremented.
An electrochemical characterization of the wastewater used as the substrate in the anodic chamber was performed by cyclic voltammetry, and the results are presented in Figure 11. The CV voltammograms for S1 and S2 are presented in Figure 11a,b, respectively. A negative current is observed in both substrates, indicating that industrial coffee wastewater is mainly composed of species with reduced potential. The presence of oxidation peaks was not detected in the samples, and the current was greater than 0.0 mA. Considering the results and the origin of the initial substrates, their chemical composition is mainly organic molecules with reducing functional groups. The electrochemical characterization by cyclic voltammetry of the substrate at the end of open-circuit operation for MFCs M6 and M8 is shown in Figure 12. In Figure 12a, a positive potential for the CV of MFC M6 was recorded. This result indicates the presence of oxidated organic compounds in the culture medium. On the other hand, in Figure 12b, a slightly negative potential for the CV of MFC M8 was recorded due to the peak having a negative potential. This result suggests the organic compounds were reduced. The low values obtained at the end of open-circuit operation in MFCs M6 and M8 indicate changes in the organic compounds present in the substrates. These results suggest metabolic differences in the substrates’ transformation are conducted by the mixed native microbial community in M6 and by the matured native microbial community in M8. Moreover, these results could suggest differences in the intermediated compounds obtained from the leached substrate (S2) and from the fermentation substrate (S1). In general, all the MFCs with an experimental design exhibited the same electrochemical behavior associated with the physicochemical changes of the medium and the native microbial community that was used.

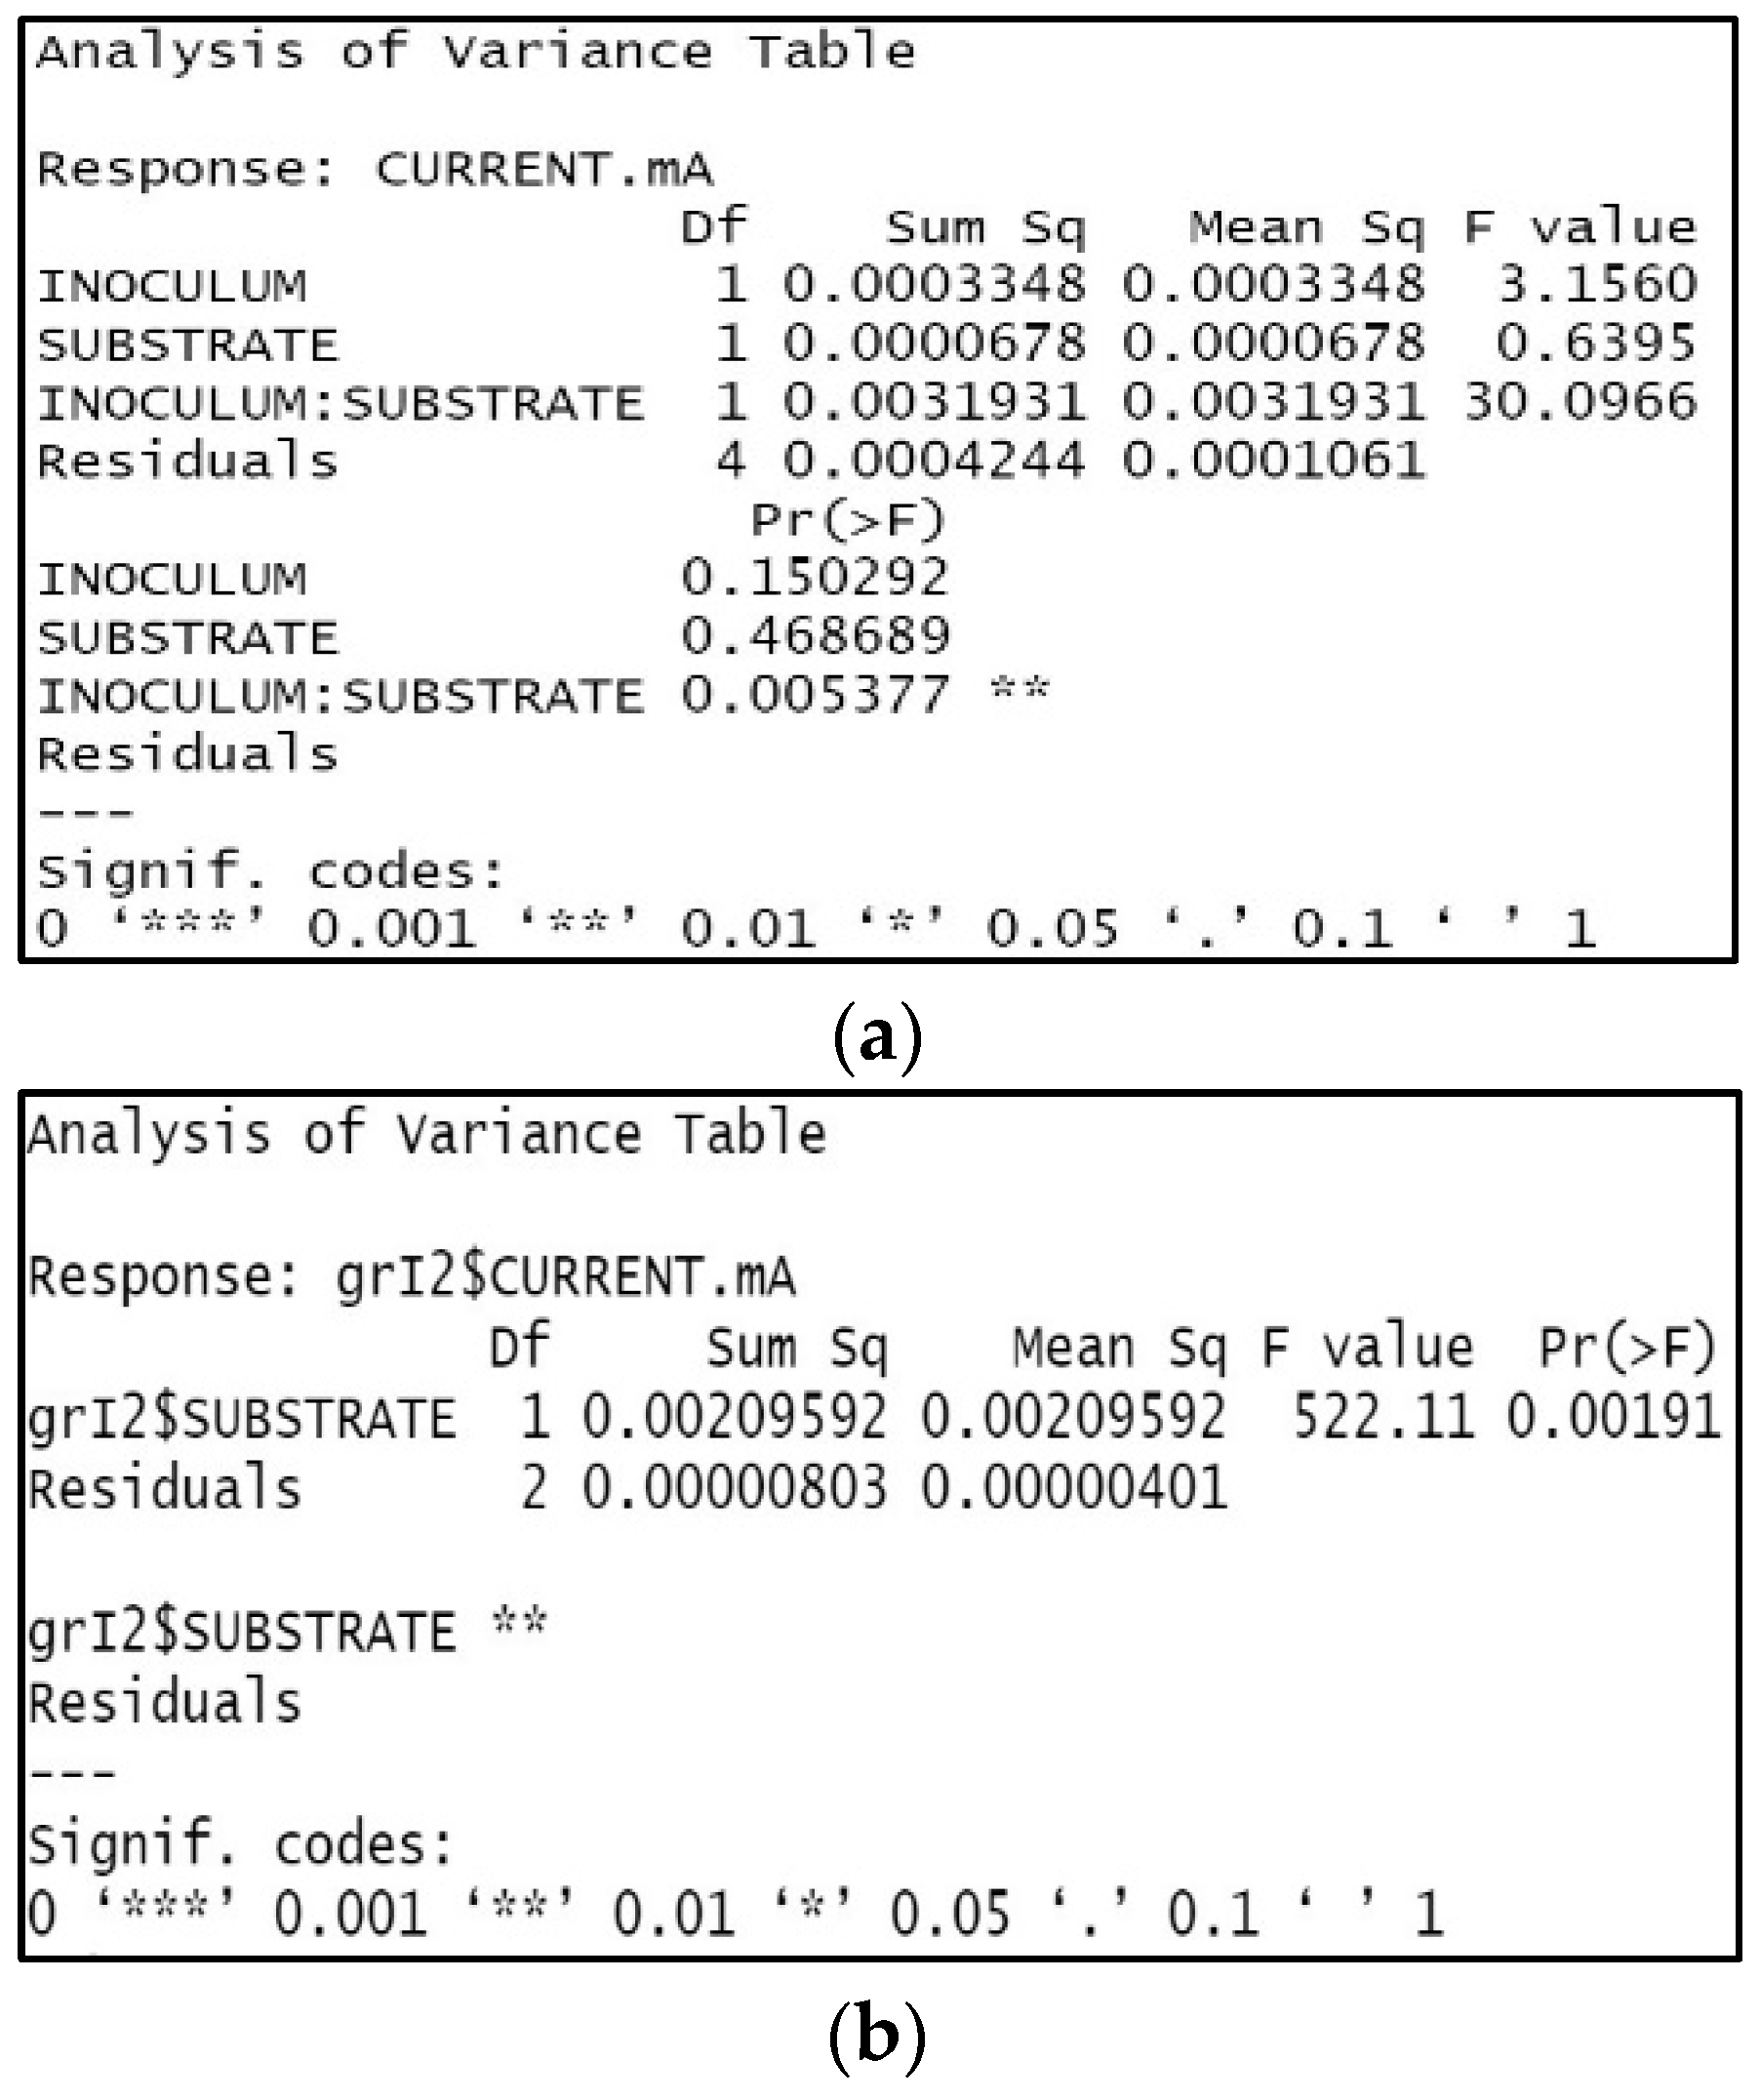
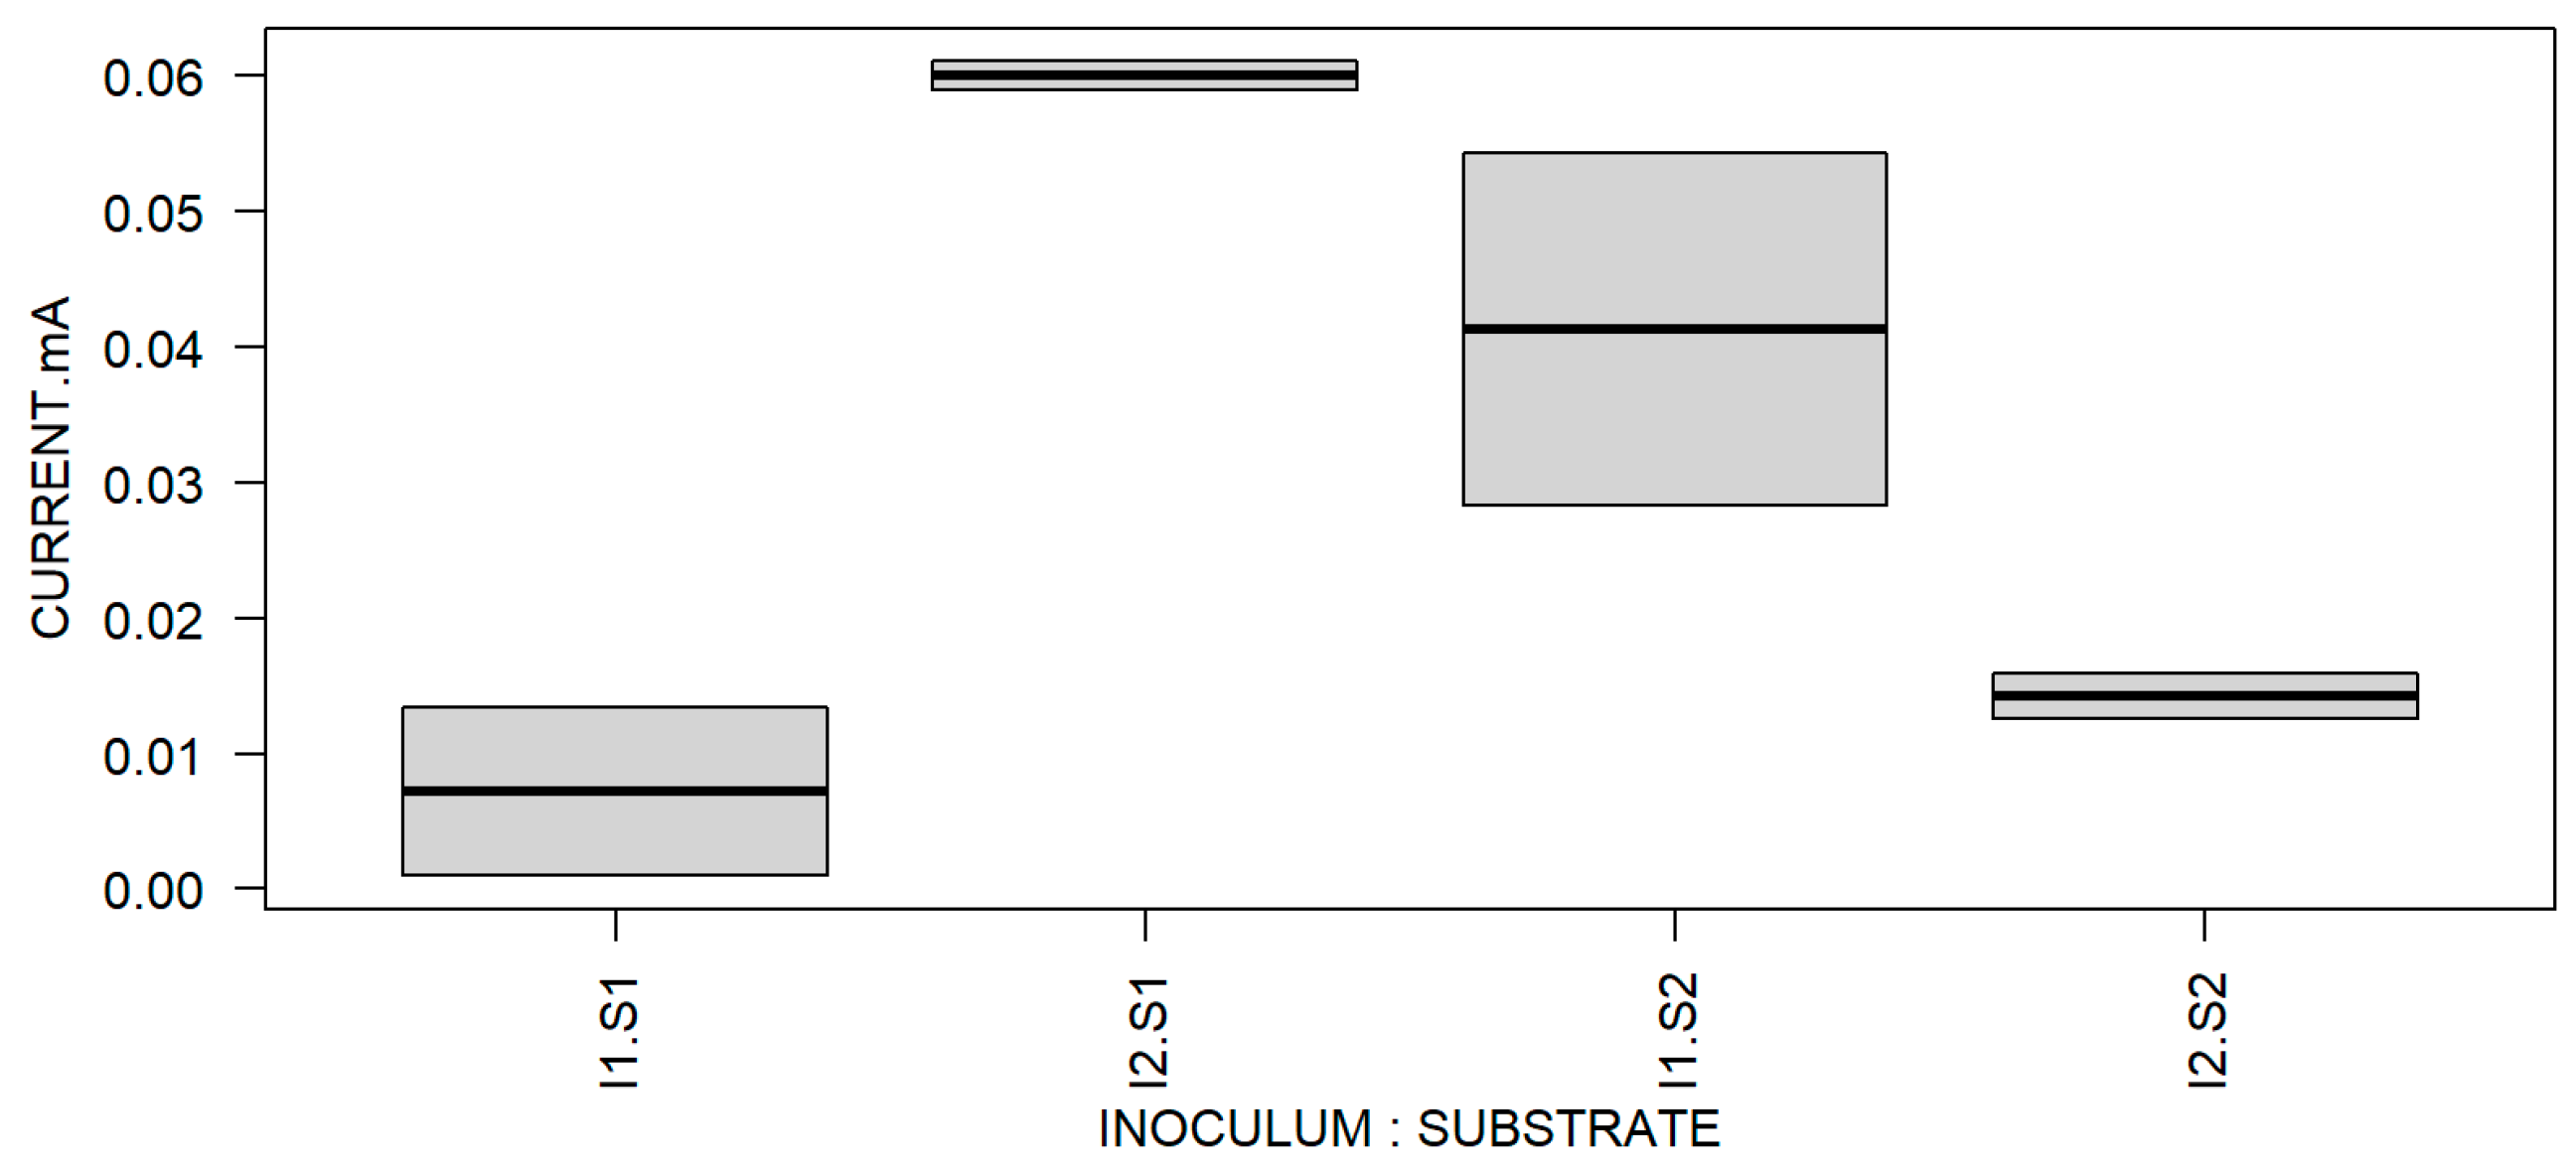
3.2. Statistical Analysis

The results of the multiple variance analysis (ANOVA) shown in Figure 13a indicate that the current obtained using the experimental design, produced by the combination of the inocula and substrates, is statistically significant (α < 0.05). However, the current of each factor individually is not statistically significant. After identifying the effect of the interaction between the inocula and substrates on the generation of the current, each level of the inoculum factor was set, and an ANOVA was performed again; the results are presented in Figure 13b. The statistically significant effect corresponded to the matured inoculum (I2). However, there was no evidence (results not shown) of the effect of the individual factors or their combination on the voltage-response variable during open-circuit operation. Figure 14 presents the LSD and Tukey’s multiple comparison tests. The test was performed to establish which factor majorly influenced on the response variable. The combination of the matured inoculum (I2) and CWW from coffee fermentation (S1) presented the highest effect. These statistical analyses confirm that the experiments with a better performance were M4 and M8, as they had the highest electrogenic potential. It is possible to attribute a positive effect to the biostimulation of the inoculum before it is used in the MFC. The results show that the maturated native microbial communities in CWW are better adapted to a complex substrate and the operational conditions of the BES.

3.3. Formatting of Mathematical Components

I = V/R
DI = I/A
Here, I is the current (mA), V is the voltage (mV), R is the resistance (Ω), DI is the current density (mA.m−2), and A is the anode area (m2).
P = I × V
DP = P/A
Here, P is the power (W), I is the current (mA), V is the voltage (mV), DP is the power density (mW.m−2), and A is the anode area (m2).

4. Discussion

As has been reported in some investigations, MFCs have been evaluated mainly in the treatment of domestic wastewater, with potentials between 100 and 3000 mW.m−2 reported [13,37,38,39,40,41]. According to the results obtained in this study, microbial fuel cells are promising as an alternative to the conventional treatment of agro-industrial wastewater. Proper functioning by non-conventional microbial fuel cells to obtain electrical potentials and organic matter removal of wastewater from wet coffee processing allows for their application as an alternative wastewater treatment in coffee-growing regions. Conventionally, the microbial communities responsible for efficiency in MFCs arise from the adaptation, maturation, enrichment, or biostimulation of the microorganisms settled in activated sludge or other WW treatments [24,42,43,44]. However, there are a few reports on the application of these techniques to the native microbial communities obtained directly from the specific wastewater used as the substrate in an anodic chamber. The obtained results indicate the capacity of the native microbial communities in industrial coffee wastewater to remove polluting organic matter. The biostimulus and bioaugmentation of native microbial communities increase the electrogenic potential of non-conventional MFCs, and the native communities are better adapted to a complex substrate composition. The use of an inoculum maturated under the same operational conditions positively influences power generation. These results coincide with other reports, which show that the specialization of microbial communities with electrogenic potential occurs as a function of time [23,45,46,47] and due to the operational and environmental conditions [42,43,44,48,49,50]. The specialization of the native CWW microbial communities in MFCs showed similar potential to those reported in these studies.
The organic matter degradation rates observed in the non-conventional MFCs evidence that the native microbial communities in CWW are adapted for the catabolism of this complex substrate, and they can remove large amounts of organic matter with a high initial COD load in a short period of time. In general, studies of the electrogenic potential derived from the consumption of organic molecules focus on electrogenic metabolism from simple carbon sources, such as glucose, or salts, such as sodium or potassium acetate [51,52,53]. The organic components of CWW are possibly transformed from large carbohydrates, such as cellulose or starch, to simple sugars, such as glucose and fructose. These compounds are metabolized by microorganisms in routes that release energy in the form of ions. The process is conducted for the native microbial diversity present in the substrate [39,54]. During wet coffee processing, the native microbiota is used during a stage known as the fermentation process to remove the mucilage residues from the surface of the coffee bean [2,3,33]. The mucilage is an organic layer that consists of water, sugars, and pectic substances and has an associated microbiota, mainly yeasts and lactic acid bacteria [8,55]. The native microbiota could be responsible for the early stage of degradation of the complex organic components, transforming them into the intermediates and precursors for the action of microorganisms with electrogenic metabolism and with the potential to release electrons during oxidation–reduction reactions. A diverse microbial community could interact in MFCs and develop a synergistic biological relationship that allows for the specialization of a community with the capability to produce electricity from the degradation of the organic matter in CWW.
Different investigations have addressed the biological diversity associated with the electrogenic potential in BESs, including a large amount of information on electrogenic strains and microbial consortia [27,28,56,57,58,59]. Some studies have reported the performance of BES in the treatment of WW with a considerable organic load, in addition to the presence of nutrients derived from nitrogen and phosphorous, for example, in a mixed system known as MFC-CW (MFC coupled to a constructed wetland). Tao et al. (2020) report that the most abundant phyla in an MFC were proteobacteria, cyanobacteria, bacteroidetes, acidobacteria, chloroflexi, and nitrospirae; in this BES, a >90% reduction of nitrates and a power density of 6.09 mW·m−2 were achieved using xylose as carbon source compared to 10% and 2.91 mW·m−2 using cellulose [60]. In another study using MFC-CW, Ge et al. (2020) recorded a degradation of COD, NO3−-N, total inorganic nitrogen, and total phosphorus of 71.9%, 70.1%, 63.2%, and 91.2%, respectively, as well as current and power densities of 47.77 mA·m−2 and 6.74 mW·m−2, respectively. The predominant microorganisms found were the phyla proteobacteria, actinobacteria, acidobacteria, bacteroidetes and chloroflexi [61]. On the other hand, in studies on the treatment of hydrolyzed food waste, an open COD productivity of 0.97 kWh·kg−1 was found with a cylindrical cathode MFC [37], or, another example, in a residues derived from corn stover treatment, a power density of 296 mW·m−2 will be prolonged by purification with a double-chamber MFC [62]. However, to apply BESs for wastewater treatment, it is necessary to know the microbial communities that are responsible for the oxidation–reduction process of organic matter and energy transformation. For example, within a native microbial community of a complex substrate, such as CWW, there could coexist a great diversity of prokaryotic and eukaryotic microorganisms responsible not only for producing usable energy but also for degrading the carbon sources and complex nutrients during different stages [63,64]. In previous studies [34,45,64] the presence of the genera Acetobacter sp., Bacillus sp., Clostridium sp., and Lactobacillus sp., among others, were associated with, in addition to an electrogenic potential, the anaerobic or fermentative metabolisms that produce the metabolic intermediates used by different electrogenic microorganisms as substrates.

5. Conclusions

The native microbial communities present in wet coffee processing have an electrogenic potential and the ability to remove organic matter from coffee wastewater using non-conventional MFCs. The results are evidence that BESs could be a promising strategy for the treatment of agro-industrial coffee wastewater. Native microbial communities could be adapted and bio-stimulated to favor electrogenic metabolism. Thus, it is necessary to study the microbial composition of the communities involved in the transformation of organic matter and electricity production to understand their behavior within the system, to propose strategies focused on increasing the efficiency of MFCs for the treatment of coffee wastewater, and on exploring the use of MFCs with different agro-industrial residues. Bio-electrochemical systems are limited to the laboratory level, as their application in the field is a challenge due to the cost of materials; however, with an MFC fabricated with non-conventional materials, it is possible to reduce the material costs and create an alternative to more expensive conventional wastewater treatment systems.

Author Contributions

All authors have contributed equally for this article. All authors have read and agreed to the published version of the manuscript.

Funding

This research was funded by the Colombia-UK Newton Prize Award 2018, “Valorisation of agro-industrial waste: A Bioelectrochemical System for waste degradation and energy recovery from industrial coffee waste” (Project Number 1175).

Data Availability Statement

We did not use any genetic data in this publication. The research has the permission to access genetic resources contract No RGE156-10 issued by the Colombian authority Ministry of Environment and Sustainable Development (DTCR01). https://dataverse.harvard.edu/dataset.xhtml?persistentId=doi:10.7910/DVN/DTCR01.

Acknowledgments

The authors would like to thank De los Andes Cooperativa for supplying the wastewater samples and providing access to the coffee-processing plants.

Conflicts of Interest

The authors declare no conflict of interest.

Appendix A

Table A1. Results of polarization curves: maximum potential (DP and DI) for each electrical resistance.
ExperimentElectrical Resistance (Ω)DP (mW·m−2)DI (mA·m−2)
M110009.21.1
M1.1380073.11.5
M2380017.80.8
M2.12200203.73.4
M312,00020.80.5
M3.13800289.63.1
M43800230.22.7
M4.11000286.016.1
M53800372.33.5
M5.11000205.05.1
M63800941.55.5
M6.13800293.13.1
M715,000155.11.1
M7.112,000403.02.1
M8100343.820.1
M8.1620337.58.2
C1100011.00.0
C1.110,000161.01.4
C21000868.610.4
C2.11000247.75.6
Figure A1. Photographs of the interior of the MFC: (a) and (b) initial or day 0, (c) final OC day 21, and (d) final CC day 42.
Processes 11 00373 g0a1

References

  1. APHA. Standard Methods for the Examination of Water and Wastewater, 22nd ed.; Rice, E.W., Baird, R.B., Eaton, A.D., Clesceri, L.S., Eds.; American Public Health Association: Washington, DC, USA, 2012; ISBN 9780875532356. [Google Scholar]
  2. Campos, R.C.; Pinto, V.R.A.; Melo, L.F.; da Rocha, S.J.S.S.; Coimbra, J.S. New sustainable perspectives for “Coffee Wastewater” and other by-products: A critical review. Future Foods 2021, 4, 100058. [Google Scholar] [CrossRef]
  3. Ijanu, E.M.; Kamaruddin, M.A.; Norashiddin, F.A. Coffee processing wastewater treatment: A critical review on current treatment technologies with a proposed alternative. Appl. Water Sci. 2020, 10, 11. [Google Scholar] [CrossRef] [Green Version]
  4. Oliveros, C.; Ramírez, C.; Rodríguez, N.; Sanz, J.; Tibaduiza, C. Manejo y aprovechamiento de las aguas residuales del lavado del café con la tecnología ECOMILL®. Av. Técnicos Cenicafé 2022, 538, 1–8. [Google Scholar] [CrossRef]
  5. Federación Nacional de Cafeteros. Estadísticas Cafeteras. 2021. Available online: https://federaciondecafeteros.org/wp/estadisticas-cafeteras/ (accessed on 17 August 2021).
  6. Rout, P.R.; Zhang, T.C.; Bhunia, P.; Surampalli, R.Y. Treatment technologies for emerging contaminants in wastewater treatment plants: A review. Sci. Total Environ. 2021, 753, 141990. [Google Scholar] [CrossRef]
  7. Rodríguez González, M.A.; González Guzmán, J.M.; Camargo Mayorga, D.A. Avances En El Saneamiento Y La Gestión De Biosólidos En Colombia. Rev. Fac. Cienc. Contab. Econ. Adm.—FACCEA 2019, 9, 113–126. [Google Scholar] [CrossRef]
  8. Martínez, I.; Santiago, C.A.; Limón, R.A.; López, V.; Aguilar, F.A. Tratamiento de agua residual de beneficio de café mediante un biofiltro de bajo costo. Ingeniantes 2021, 1, 60–67. [Google Scholar]
  9. Giannakis, S.; Lin, K.Y.A.; Ghanbari, F. A review of the recent advances on the treatment of industrial wastewaters by Sulfate Radical-based Advanced Oxidation Processes (SR-AOPs). Chem. Eng. J. 2021, 406, 127083. [Google Scholar] [CrossRef]
  10. Martinez-Burgos, W.J.; Bittencourt Sydney, E.; Bianchi Pedroni Medeiros, A.; Magalhães, A.I.; de Carvalho, J.C.; Karp, S.G.; Porto de Souza Vandenberghe, L.; Junior Letti, L.A.; Thomaz Soccol, V.; de Melo Pereira, G.V.; et al. Agro-industrial wastewater in a circular economy: Characteristics, impacts and applications for bioenergy and biochemicals. Bioresour. Technol. 2021, 341, 125795. [Google Scholar] [CrossRef]
  11. Palanisamy, G.; Jung, H.; Sadhasivam, T.; Kurkuri, M.; Kim, S.; Roh, S. A comprehensive review on microbial fuel cell technologies: Processes, utilization, and advanced developments in electrodes and membranes. J. Clean. Prod. 2019, 221, 598–621. [Google Scholar] [CrossRef]
  12. Gul, M.; Ahmad, K. Bioelectrochemical systems: Sustainable bio-energy powerhouses. Biosens. Bioelectron. 2019, 142, 111576. [Google Scholar] [CrossRef]
  13. Chen, H.; Dong, F.; Minteer, S.D. The progress and outlook of bioelectrocatalysis for the production of chemicals, fuels and materials. Nat. Catal. 2020, 3, 225–244. [Google Scholar] [CrossRef]
  14. Dange, P.; Pandit, S.; Jadhav, D.; Shanmugam, P.; Gupta, P.K.; Kumar, S.; Kumar, M.; Yang, Y.-H.; Bhatia, S.K. Recent Developments in Microbial Electrolysis Cell-Based Biohydrogen Production Utilizing Wastewater as a Feedstock. Sustainability 2021, 13, 8796. [Google Scholar] [CrossRef]
  15. Zhao, Z.; Zhang, Y.; Wang, L.; Quan, X. Potential for direct interspecies electron transfer in an electric-anaerobic system to increase methane production from sludge digestion. Sci. Rep. 2015, 5, 11094. [Google Scholar] [CrossRef] [PubMed] [Green Version]
  16. Jain, A.; He, Z. Cathode-enhanced wastewater treatment in bioelectrochemical systems. npj Clean Water 2018, 1, 23. [Google Scholar] [CrossRef] [Green Version]
  17. Pant, D.; Van Bogaert, G.; Diels, L.; Vanbroekhoven, K. A review of the substrates used in microbial fuel cells (MFCs) for sustainable energy production. Bioresour. Technol. 2010, 101, 1533–1543. [Google Scholar] [CrossRef]
  18. Gadkari, S.; Shemfe, M.; Sadhukhan, J. Microbial fuel cells: A fast converging dynamic model for assessing system performance based on bioanode kinetics. Int. J. Hydrogen Energy 2019, 44, 15377–15386. [Google Scholar] [CrossRef]
  19. Kumar, S.S.; Kumar, V.; Malyan, S.K.; Sharma, J.; Mathimani, T.; Maskarenj, M.S.; Ghosh, P.C.; Pugazhendhi, A. Microbial fuel cells (MFCs) for bioelectrochemical treatment of different wastewater streams. Fuel 2019, 254, 115526. [Google Scholar] [CrossRef]
  20. Verma, P.; Daverey, A.; Kumar, A.; Arunachalam, K. Microbial Fuel Cell—A Sustainable Approach for Simultaneous Wastewater Treatment and Energy Recovery. J. Water Process Eng. 2021, 40, 101768. [Google Scholar] [CrossRef]
  21. Sreedharan, S.; Pawels, R. Feasibility study on treatment of coconut industry wastewater and bioenergy production using microbial fuel cell (MFC). Int. J. Environ. Sci. Technol. 2022, 19, 5333–5342. [Google Scholar] [CrossRef]
  22. Sivasankar, P.; Poongodi, S.; Seedevi, P.; Sivakumar, M.; Murugan, T.; Loganathan, S. Bioremediation of wastewater through a quorum sensing triggered MFC: A sustainable measure for waste to energy concept. J. Environ. Manag. 2019, 237, 84–93. [Google Scholar] [CrossRef]
  23. Asefi, B.; Li, S.L.; Moreno, H.A.; Sanchez-Torres, V.; Hu, A.; Li, J.; Yu, C.P. Characterization of electricity production and microbial community of food waste-fed microbial fuel cells. Process Saf. Environ. Prot. 2019, 125, 83–91. [Google Scholar] [CrossRef]
  24. Zhang, L.; Ding, L.; He, X.; Ma, H.; Fu, H.; Wang, J.; Ren, H. Effect of continuous and intermittent electric current on lignin wastewater treatment and microbial community structure in electro-microbial system. Sci. Rep. 2019, 9, 805. [Google Scholar] [CrossRef] [Green Version]
  25. Fang, H.; Zhang, H.; Han, L.; Mei, J.; Ge, Q.; Long, Z.; Yu, Y. Exploring bacterial communities and biodegradation genes in activated sludge from pesticide wastewater treatment plants via metagenomic analysis. Environ. Pollut. 2018, 243, 1206–1216. [Google Scholar] [CrossRef] [PubMed]
  26. Allam, F.; Elnouby, M.; Sabry, S.A.; El-Khatib, K.M.; El-Badan, D.E. Optimization of factors affecting current generation, biofilm formation and rhamnolipid production by electroactive Pseudomonas aeruginosa FA17. Int. J. Hydrogen Energy 2021, 46, 11419–11432. [Google Scholar] [CrossRef]
  27. Almatouq, A.; Babatunde, A.O.; Khajah, M.; Webster, G.; Alfodari, M. Microbial community structure of anode electrodes in microbial fuel cells and microbial electrolysis cells. J. Water Process Eng. 2020, 34, 101140. [Google Scholar] [CrossRef]
  28. Obata, O.; Greenman, J.; Kurt, H.; Chandran, K.; Ieropoulos, I. Microbial Fuel Cell anodic bacterial community and antibacterial agents: Resilience and vulnerability test. Bioelectrochemistry 2020, 134, 107500. [Google Scholar] [CrossRef]
  29. Shen, J.; Du, Z.; Li, J.; Cheng, F. Co-metabolism for enhanced phenol degradation and bioelectricity generation in microbial fuel cell. Bioelectrochemistry 2020, 134, 107527. [Google Scholar] [CrossRef]
  30. Long, X.; Cao, X.; Song, H.; Nishimura, O.; Li, X. Characterization of electricity generation and microbial community structure over long-term operation of a microbial fuel cell. Bioresour. Technol. 2019, 285, 121395. [Google Scholar] [CrossRef]
  31. Zhou, Y.; Xu, D.; Xiao, E.; Xu, D.; Xu, P.; Zhang, X.; Zhou, Q.; He, F.; Wu, Z. Relationship between electrogenic performance and physiological change of four wetland plants in constructed wetland-microbial fuel cells during non-growing seasons. J. Environ. Sci. 2018, 70, 54–62. [Google Scholar] [CrossRef]
  32. Ishii, S.; Suzuki, S.; Tenney, A.; Norden-Krichmar, T.; Nealson, K.; Bretschger, O. Microbial metabolic networks in a complex electrogenic biofilm recovered from a stimulus-induced metatranscriptomics approach. Sci. Rep. 2015, 5, 14840. [Google Scholar] [CrossRef] [Green Version]
  33. Pires, J.F.; Viana, D.C.; Braga, R.A.; Schwan, R.F.; Silva, C.F. Protocol to select efficient microorganisms to treat coffee wastewater. J. Environ. Manag. 2021, 278 Pt 2, 111541. [Google Scholar] [CrossRef]
  34. Agudelo-Escobar, L.; Erazo, S.; Avignone-Rossa, C. A Bioelectrochemical system for waste industrial coffee waste water. Front. Chem. Eng. 2022, 4, 814987. [Google Scholar] [CrossRef]
  35. Bagchi, S.; Behera, M. Bioaugmentation using Pseudomonas aeruginosa with an approach of intermittent aeration for enhanced power generation in ceramic MFC. Sustain. Energy Technol. Assess. 2021, 45, 101138. [Google Scholar] [CrossRef]
  36. APHA/AWWA/WEF. 5220 Chemical Oxygen Demand (COD). Standard Methods for the Examination of Water and Wastewater. 2017. Available online: https://www.standardmethods.org/doi/10.2105/SMWW.2882.103 (accessed on 25 February 2020).
  37. Xin, X.; Hong, J.; Liu, Y. Insights into microbial community profiles associated with electric energy production in microbial fuel cells fed with food waste hydrolysate. Sci. Total Environ. 2019, 670, 50–58. [Google Scholar] [CrossRef]
  38. Wang, H.; Wang, Q.; Li, X.; Wang, Y.; Jin, P.; Zheng, Y.; Huang, J.; Li, Q. Bioelectricity generation from the decolorization of reactive blue 19 by using microbial fuel cell. J. Environ. Manag. 2019, 248, 109310. [Google Scholar] [CrossRef]
  39. Munjal, M.; Tiwari, B.; Lalwani, S.; Sharma, M.; Singh, G.; Sharma, R.K. An insight of bioelectricity production in mediator less microbial fuel cell using mesoporous Cobalt Ferrite anode. Int. J. Hydrogen Energy 2020, 45, 12525–12534. [Google Scholar] [CrossRef]
  40. Liang, P.; Duan, R.; Jiang, Y.; Zhang, X.; Qiu, Y.; Huang, X. One-year operation of 1000-L modularized microbial fuel cell for municipal wastewater treatment. Water Res. 2018, 141, 1–8. [Google Scholar] [CrossRef] [PubMed]
  41. Gajda, I.; Greenman, J.; Ieropoulos, I. Microbial Fuel Cell stack performance enhancement through carbon veil anode modification with activated carbon powder. Appl. Energy 2020, 262, 114475. [Google Scholar] [CrossRef] [PubMed]
  42. Zhang, P.; Yang, C.; Xu, Y.; Li, H.; Shi, W.; Xie, X.; Lu, M.; Huang, L.; Huang, W. Accelerating the startup of microbial fuel cells by facile microbial acclimation. Bioresour. Technol. Rep. 2019, 8, 100347. [Google Scholar] [CrossRef]
  43. Rago, L.; Cristiani, P.; Villa, F.; Zecchin, S.; Colombo, A.; Cavalca, L.; Schievano, A. Influences of dissolved oxygen concentration on biocathodic microbial communities in microbial fuel cells. Bioelectrochemistry 2017, 116, 39–51. [Google Scholar] [CrossRef]
  44. Mei, X.; Xing, D.; Yang, Y.; Liu, Q.; Zhou, H.; Guo, C.; Ren, N. Adaptation of microbial community of the anode biofilm in microbial fuel cells to temperature. Bioelectrochemistry 2017, 117, 29–33. [Google Scholar] [CrossRef] [PubMed]
  45. Chen, J.; Liu, Y.; Yang, Y.; Tang, M.; Wang, R.; Jiang, L.; Tian, Y.; Hu, H.; Zhang, X.; Wei, Y. Bacterial community structure and gene function prediction in response to long-term running of dual graphene modified bioelectrode bioelectrochemical systems. Bioresour. Technol. 2020, 309, 123398. [Google Scholar] [CrossRef]
  46. Toczyłowska-Mamińska, R.; Szymona, K.; Król, P.; Gliniewicz, K.; Pielech-Przybylska, K.; Kloch, M.; Logan, B.E. Evolving microbial communities in cellulose-fed microbial fuel cell. Energies 2018, 11, 124. [Google Scholar] [CrossRef] [Green Version]
  47. Xiao, N.; Selvaganapathy, P.R.; Wu, R.; Huang, J.J. Influence of wastewater microbial community on the performance of miniaturized microbial fuel cell biosensor. Bioresour. Technol. 2020, 302, 122777. [Google Scholar] [CrossRef]
  48. Saratale, G.; Saratale, R.; Shahid, M.; Zhen, G.; Kumar, G.; Shin, H.S.; Choi, Y.G.; Kim, S.H. A comprehensive overview on electro-active biofilms, role of exo-electrogens and their microbial niches in microbial fuel cells (MFCs). Chemosphere 2017, 178, 534–547. [Google Scholar] [CrossRef]
  49. Wang, H.; Qu, Y.; Li, D.; Ambuchi, J.; He, W.; Zhou, X.; Liu, J.; Feng, Y. Cascade degradation of organic matters in brewery wastewater using a continuous stirred microbial electrochemical reactor and analysis of microbial communities. Sci. Rep. 2016, 6, 27023. [Google Scholar] [CrossRef] [Green Version]
  50. Yi, Y.; Xie, B.; Zhao, T.; Li, Z.; Stom, D.; Liu, H. Effect of external resistance on the sensitivity of microbial fuel cell biosensor for detection of different types of pollutants. Bioelectrochemistry 2019, 125, 71–78. [Google Scholar] [CrossRef]
  51. Arkatkar, A.; Mungray, A.K.; Sharma, P. Study of electrochemical activity zone of Pseudomonas aeruginosa in microbial fuel cell. Process Biochem. 2021, 101, 213–217. [Google Scholar] [CrossRef]
  52. Hou, R.; Luo, X.; Liu, C.; Zhou, L.; Wen, J.; Yuan, Y. Enhanced degradation of triphenyl phosphate (TPHP) in bioelectrochemical systems: Kinetics, pathway and degradation mechanisms. Environ. Pollut. 2019, 254, 113040. [Google Scholar] [CrossRef]
  53. Mahmoudi, A.; Mousavi, S.A.; Darvishi, P. Effect of ammonium and COD concentrations on the performance of fixed-bed air-cathode microbial fuel cells treating reject water. Int. J. Hydrogen Energy 2020, 45, 4887–4896. [Google Scholar] [CrossRef]
  54. Salar-García, M.J.; Ortiz-Martínez, V.M.; Gajda, I.; Greenman, J.; Hernández-Fernández, F.J.; Ieropoulos, I.A. Electricity production from human urine in ceramic microbial fuel cells with alternative non-fluorinated polymer binders for cathode construction. Sep. Purif. Technol. 2017, 187, 436–442. [Google Scholar] [CrossRef]
  55. Cárdenas, D.; Villegas, J.R.; Solís, C.; Sanabria-Chinchilla, J.; Uribe, L.; Fuentes-Schweizer, P. Evaluación del desempeño de una celda de combustible microbiana con electrodo de grafito modificado para el tratamiento de agua residual del procesamiento del café. Química Apl. Anal. 2022, 51, 40–47. [Google Scholar] [CrossRef]
  56. Wang, Q.; Lv, R.; Rene, E.R.; Qi, X.; Hao, Q.; Du, Y.; Zhao, C.; Xu, F.; Kong, Q. Characterization of microbial community and resistance gene (CzcA) shifts in up-flow constructed wetlands-microbial fuel cell treating Zn (II) contaminated wastewater. Bioresour. Technol. 2020, 302, 122867. [Google Scholar] [CrossRef] [PubMed]
  57. Modestra, J.A.; Reddy, C.N.; Krishna, K.V.; Min, B.; Mohan, S.V. Regulated surface potential impacts bioelectrogenic activity, interfacial electron transfer and microbial dynamics in microbial fuel cell. Renew. Energy 2020, 149, 424–434. [Google Scholar] [CrossRef]
  58. Zhang, S.; You, J.; Chen, H.; Ye, J.; Cheng, Z.; Chen, J. Gaseous toluene, ethylbenzene, and xylene mixture removal in a microbial fuel cell: Performance, biofilm characteristics, and mechanisms. Chem. Eng. J. 2020, 386, 123916. [Google Scholar] [CrossRef]
  59. Ur, Z.; Fortunato, L.; Cheng, T.; Leiknes, T. Metagenomic analysis of sludge and early-stage biofilm communities of a submerged membrane bioreactor. Sci. Total Environ. 2020, 701, 134682. [Google Scholar] [CrossRef]
  60. Tao, M.; Guan, L.; Jing, Z.; Tao, Z.; Wang, Y.; Luo, H.; Wang, Y. Enhanced denitrification and power generation of municipal wastewater treatment plants (WWTPs) effluents with biomass in microbial fuel cell coupled with constructed wetland. Sci. Total Environ. 2020, 709, 136159. [Google Scholar] [CrossRef]
  61. Ge, X.; Cao, X.; Song, X.; Wang, Y.; Si, Z.; Zhao, Y.; Wang, W.; Tesfahunegn, A.A. Bioenergy generation and simultaneous nitrate and phosphorus removal in a pyrite-based constructed wetland-microbial fuel cell. Bioresour. Technol. 2020, 296, 122350. [Google Scholar] [CrossRef]
  62. Wang, F.; Zhang, D.; Shen, X.; Liu, W.; Yi, W.; Li, Z.; Liu, S. Synchronously electricity generation and degradation of biogas slurry using microbial fuel cell. Renew. Energy 2019, 142, 158–166. [Google Scholar] [CrossRef]
  63. Deng, Q.; Su, C.; Lu, X.; Chen, W.; Guan, X.; Chen, S.; Chen, M. Performance and functional microbial communities of denitrification process of a novel MFC-granular sludge coupling system. Bioresour. Technol. 2020, 306, 123173. [Google Scholar] [CrossRef]
  64. Liu, S.; Feng, X.; Xue, H.; Qiu, D.; Huang, Z.; Wang, N. Bioenergy generation and nitrogen removal in a novel ecological-microbial fuel cell. Chemosphere 2021, 278, 130450. [Google Scholar] [CrossRef] [PubMed]
Figure 1. MFC assembly: (a) anode and cathode (internal view); (b) closed-circuit resistance connection.
Processes 11 00373 g001
Figure 2. CV voltammogram vs. Ag.AgCl de Fe(CN)6 5 × 10⁻³ M (in KCl 0.1 M) with commercial Pt and Au as counter electrode and working electrode, respectively.
Processes 11 00373 g002
Figure 3. CV voltammogram vs. Ag.AgCl de Fe(CN)6 5 × 10⁻³ M (in KCl 0.1 M) with electrodes used in non-conventional MFC assemblies.
Processes 11 00373 g003
Figure 4. Maximum voltage recorded in each MFC during open-circuit operation; each bar corresponds to an experiment using the experimental design.
Processes 11 00373 g004
Figure 5. Maximum current recorded in each MFC during closed-circuit operation; each bar corresponds to an experiment using the experimental design.
Processes 11 00373 g005
Figure 6. Polarization curves of each MFC at the end of open-circuit operation.
Processes 11 00373 g006
Figure 7. Polarization curves of each MFC at the end of closed-circuit operation: (a) experiments M1.1, M2.1, M3.1, M5.1, M6.1, M7.1, and M8.1; (b) experiment M4.1.
Processes 11 00373 g007aProcesses 11 00373 g007b
Figure 8. COD rate results for each experiment using the experimental design: (a) MFC in open-circuit operation; (b) MFC in closed-circuit operation.
Processes 11 00373 g008aProcesses 11 00373 g008b
Figure 9. Performance of MFC M4 during 21 days of (a) open-circuit operation and (b) closed-circuit operation.
Processes 11 00373 g009
Figure 10. Performance of MFC M8 during 21 days of (a) open-circuit operation and (b) closed-circuit operation.
Processes 11 00373 g010aProcesses 11 00373 g010b
Figure 11. CV voltammograms of CV vs. Ag.AgCl for (a) M6 and (b) M8 at the end of open-circuit operation.
Processes 11 00373 g011
Figure 12. CV voltammograms of CV vs. Ag.AgCl for (a) M6 and (b) M8 at the end of closed-circuit operation.
Processes 11 00373 g012
Figure 13. ANOVA analysis of response variable current in experimental design: (a) general ANOVA; (b) ANOVA fixing the factor maturated inoculum (I2) as group (grI2).
Processes 11 00373 g013
Figure 14. Results of LSD–Tukey’s tests.
Processes 11 00373 g014
Table 1. Experimental design.
ExperimentInoculumCulture Media/Substrate
M1 and M5Mixed inoculum (I1)Fermentation CWW (S1)
M2 and M6Mixed inoculum (I1)Leached CWW (S2)
M3 and M7Maturated inoculum (I2)Leached CWW (S2)
M4 and M8Maturated inoculum (I2)Fermentation CWW (S1)
Control 1 (C1)Mixed inoculum (I1)Reference electrogenic medium
Control 2 (C2)Maturated inoculum (I2)Reference electrogenic medium
Disclaimer/Publisher’s Note: The statements, opinions and data contained in all publications are solely those of the individual author(s) and contributor(s) and not of MDPI and/or the editor(s). MDPI and/or the editor(s) disclaim responsibility for any injury to people or property resulting from any ideas, methods, instructions or products referred to in the content.

