Article

Study on Mechanical Properties of Composite Foundation with Rigid Pile Based on the Cushion and Strength Adjustor Control

1
School of Infrastructure Engineering, Nanchang University, Nanchang 330031, China
2
JiangXi Jiye Science and Technology Group Co., Ltd., Nanchang 330013, China
*
Author to whom correspondence should be addressed.
Submission received: 18 January 2023 / Revised: 29 January 2023 / Accepted: 8 February 2023 / Published: 10 February 2023
(This article belongs to the Special Issue Design, Control, and Evaluation of Advanced Engineered Materials)

Abstract

:
Settlement of the pile ends in end-bearing rigid pile composite foundations is generally minimal, so only relying on the cushion to coordinate the pile soil deformation may result in insufficient deformation adjustment capacity. Using a deformation adjustor with a specific stiffness on the top of the pile is a method to coordinate pile–soil deformation, and the stiffness value of the deformation adjustor depends on the accurate calculation of soil deformation; however, the calculation of soil deformation is not mature at present. A new deformation adjustor based on strengths used in composite foundations is proposed, in which foam slabs with different yield strengths are placed on the top of the pile to coordinate the pile–soil deformation. Five tests are used to study the mechanical and deformation properties of a composite foundation with a foam slab. The test results show that when the stress at the top of the pile is less than the yield strength of the foam slab, the coordination of the pile–soil deformation mainly depends on the cushion. When the stress of a rigid pile exceeds the yield strength of foam concrete, the foam slab begins to yield and coordinate the deformation of pile and soil, and the settlement coordination ability of a rigid pile composite foundation with a foam slab is significantly improved. Finally, an engineering case is used to simulate the pile–soil stress sharing when the actual settlement is greater than the calculated settlement. The case analysis shows that the pile-top stress can be well controlled by the successive yielding of foam concrete slabs of different strengths, which reduces the influence of settlement error on the pile–soil stress sharing, and further promotes the engineering application of end-bearing rigid pile composite foundations.

1. Introduction

The friction pile is generally used in a rigid pile composite foundation, which coordinates the pile–soil deformation through the settlement of the pile toe and the upward penetration into cushion. Cushion is the core technology of a composite foundation, and many characteristics of a composite foundation are related to cushion. The core idea of a composite foundation is to make use of the bearing capacity of the soil between piles, and the insufficient bearing capacity is borne by piles [1,2,3,4]. Miao Linchang [5] argues that the interaction of pile and soil should be considered in the design of a composite foundation, and the rational design of the pile–soil stress ratio is the key to a composite foundation. When the thickness of cushion is appropriate, it cannot only ensure that the piles and soil work together, but also adjust the pile–soil stress ratio, so that rigid piles and the soil can share the load according to the design proportions [6,7,8].
In many karst areas in South China, the overlying soil of moderately weathered limestone is generally silty clay or completely (strongly) weathered rock. Although the bearing capacity of the overlying soil is good, it cannot meet the requirements of the bearing capacity of high-rise buildings. Due to the influence of beaded karst caves in moderately weathered rock, it is difficult to find a suitable-thickness bearing stratum for pile foundation. The rigid pile of a composite foundation can make full use of the bearing capacity of the overlying soil layer [9,10,11,12]. Compared with the pile foundation, the pressure of the rigid pile in the composite foundation is relatively small, and the stability of the roof stratum of a small karst cave is easy to meet [13,14,15]. Because the surface of moderately weathered bedrock is usually fluctuating and the thickness of the overlying soil is not enough at the shallow rock surface, the friction pile cannot meet the requirements of bearing capacity, and so end-bearing rigid piles are used in composite foundations. Because the end-bearing rigid pile can only rely on the cushion to achieve the pile–soil deformation coordination, previous research has shown that the cushion has a maximum adjustment thickness beyond which the adjustment capacity of the cushion cannot continue to increase. [16].
In order to solve the lack of cushion, Zhou Feng [17,18,19,20] has invented a deformation adjustor device instead of cushion to coordinate the pile–soil deformation of an end-bearing rigid pile, which has been successfully applied in engineering. The adjustment device is similar to a spring, and the rigid pile is connected in series to coordinate the pile–soil deformation; the stiffness of the spring is determined according to the pile–soil stress sharing and soil deformation. The disadvantage of the method is that when the actual settlement of the soil has a large error with the calculated settlement, the adjustment effect will be significantly affected.
Since the settlement of soil is difficult to calculate accurately, this paper proposes a new adjustment method based on the stiffness of the cushion and the strength of the foam slab. When the stress at the top of the rigid pile does not reach the yield strength of a foam slab under vertical load, the coordination of the pile–soil deformation mainly depends on the cushion. When the stress at the top of the rigid pile exceeds the yield strength of the foam concrete slab, the foam concrete slabs of different strengths buckle successively, causing yield deformation to coordinate the pile–soil deformation continuously. As the current settlement calculation theory is not mature, the method can reduce the influence of settlement error on the stress sharing of piles and soil, which is conducive to further developing the engineering practice of a composite foundation with end-bearing rigid piles.

2. Composite Foundation Tests

2.1. Test Materials

2.1.1. XPS Slab

Extruded polystyrene foam slab (XPS slab) is a high-density foam slab with closed-cell structures, which is made of polystyrene or its copolymer as the main component, with a small added amount of additives. It is a sustainable material with high compression resistance, low thermal conductivity, low water absorption, moisture-proofing, airtightness, anti-aging and other excellent properties.
Low-strength XPS slab has been widely used in building wall and roof insulation, cold chain logistics and low temperature storage. In recent years, 500~900 kPa high-strength XPS slab has been successfully applied to high-speed railway roadbeds, such as China’s Beijing–Shanghai Railway, the Shijiazhuang–Wuhan Railway, the Beijing–Shijiazhuang Railway and the Shanghai–Hangzhou Railway [21].
The XPS slab used in this test was purchased from Huamei Thermal Insulation Material Co., Ltd. The thickness of the XPS slab is 20 mm and the compressive strength is 700 kPa.

2.1.2. Foam Concrete Slab Restrained by Steel Hoops

500~900 kPa high-strength XPS slab cannot meet the requirements of the pile top stress of a composite foundation in high-rise buildings, but the strength of foam concrete slab can meet the requirements in high-rise buildings. The ordinary foam concrete slab has the phenomenon of negative stiffness after yielding, which is not suitable for the adjustment of deformation [22]. In this paper, the foam concrete slab confined by steel hoops is used to improve the post-yield performance of foam concrete. The steel hoop used in this test is made of Q345 steel plate, with a thickness of 3 mm and an inner diameter of 300 mm, which is the same as the diameter of the rigid pile.
There are two main foaming methods for foam concrete: physical foaming and chemical foaming. The physical foaming method refers to the method of using a foaming machine to pressurize or mechanically mix the foaming agent to make foam, and then mix it into the slurry to further mix and pour foam concrete. The chemical foaming method refers to the method of adding chemical agents to the slurry to make it react chemically, produce gas expansion slurry, and then obtain foam concrete after hardening. In this test, the foam concrete slab is prepared by the physical foaming method. The thickness of the foam concrete slab is 30 mm, and the standard compressive strength is 1.0 MPa and 1.5 MPa. The specific preparation process is as follows:
(a)
The physical foaming method is adopted in this test, and the highly concentrated plant foaming agent is adopted. The plant foaming agent and water are mixed evenly according to the volume ratio of 1:40 and are then injected into the foaming machine for pressurized foaming to generate fine, uniform, good-viscosity and stable foam. The pressure of air is controlled to about 0.5 MPa.
(b)
The cement is Grade 42.5 Portland cement, and the water-cement ratio is 0.6. The mix proportion of foam concrete is shown in Table 1.
(c)
Portland cement and water are added to the mixing pot and stirred slowly for about 60 s; the prepared foam is poured slowly into the slurry that has been stirred evenly, and then stirred at 285 revolutions per minute for about 60 s by the mortar mixer to make the uniform fluid foam concrete slurry.
(d)
The fluid foam concrete slurry is poured into the steel hoops. After the steel hoops are filled with slurry, the overflow parts at the top and edge are smoothed with a steel ruler, and then the foam slabs are placed in the standard curing room for 28 days.
Test photos of foam concrete slabs restrained by steel hoops are shown in Figure 1.

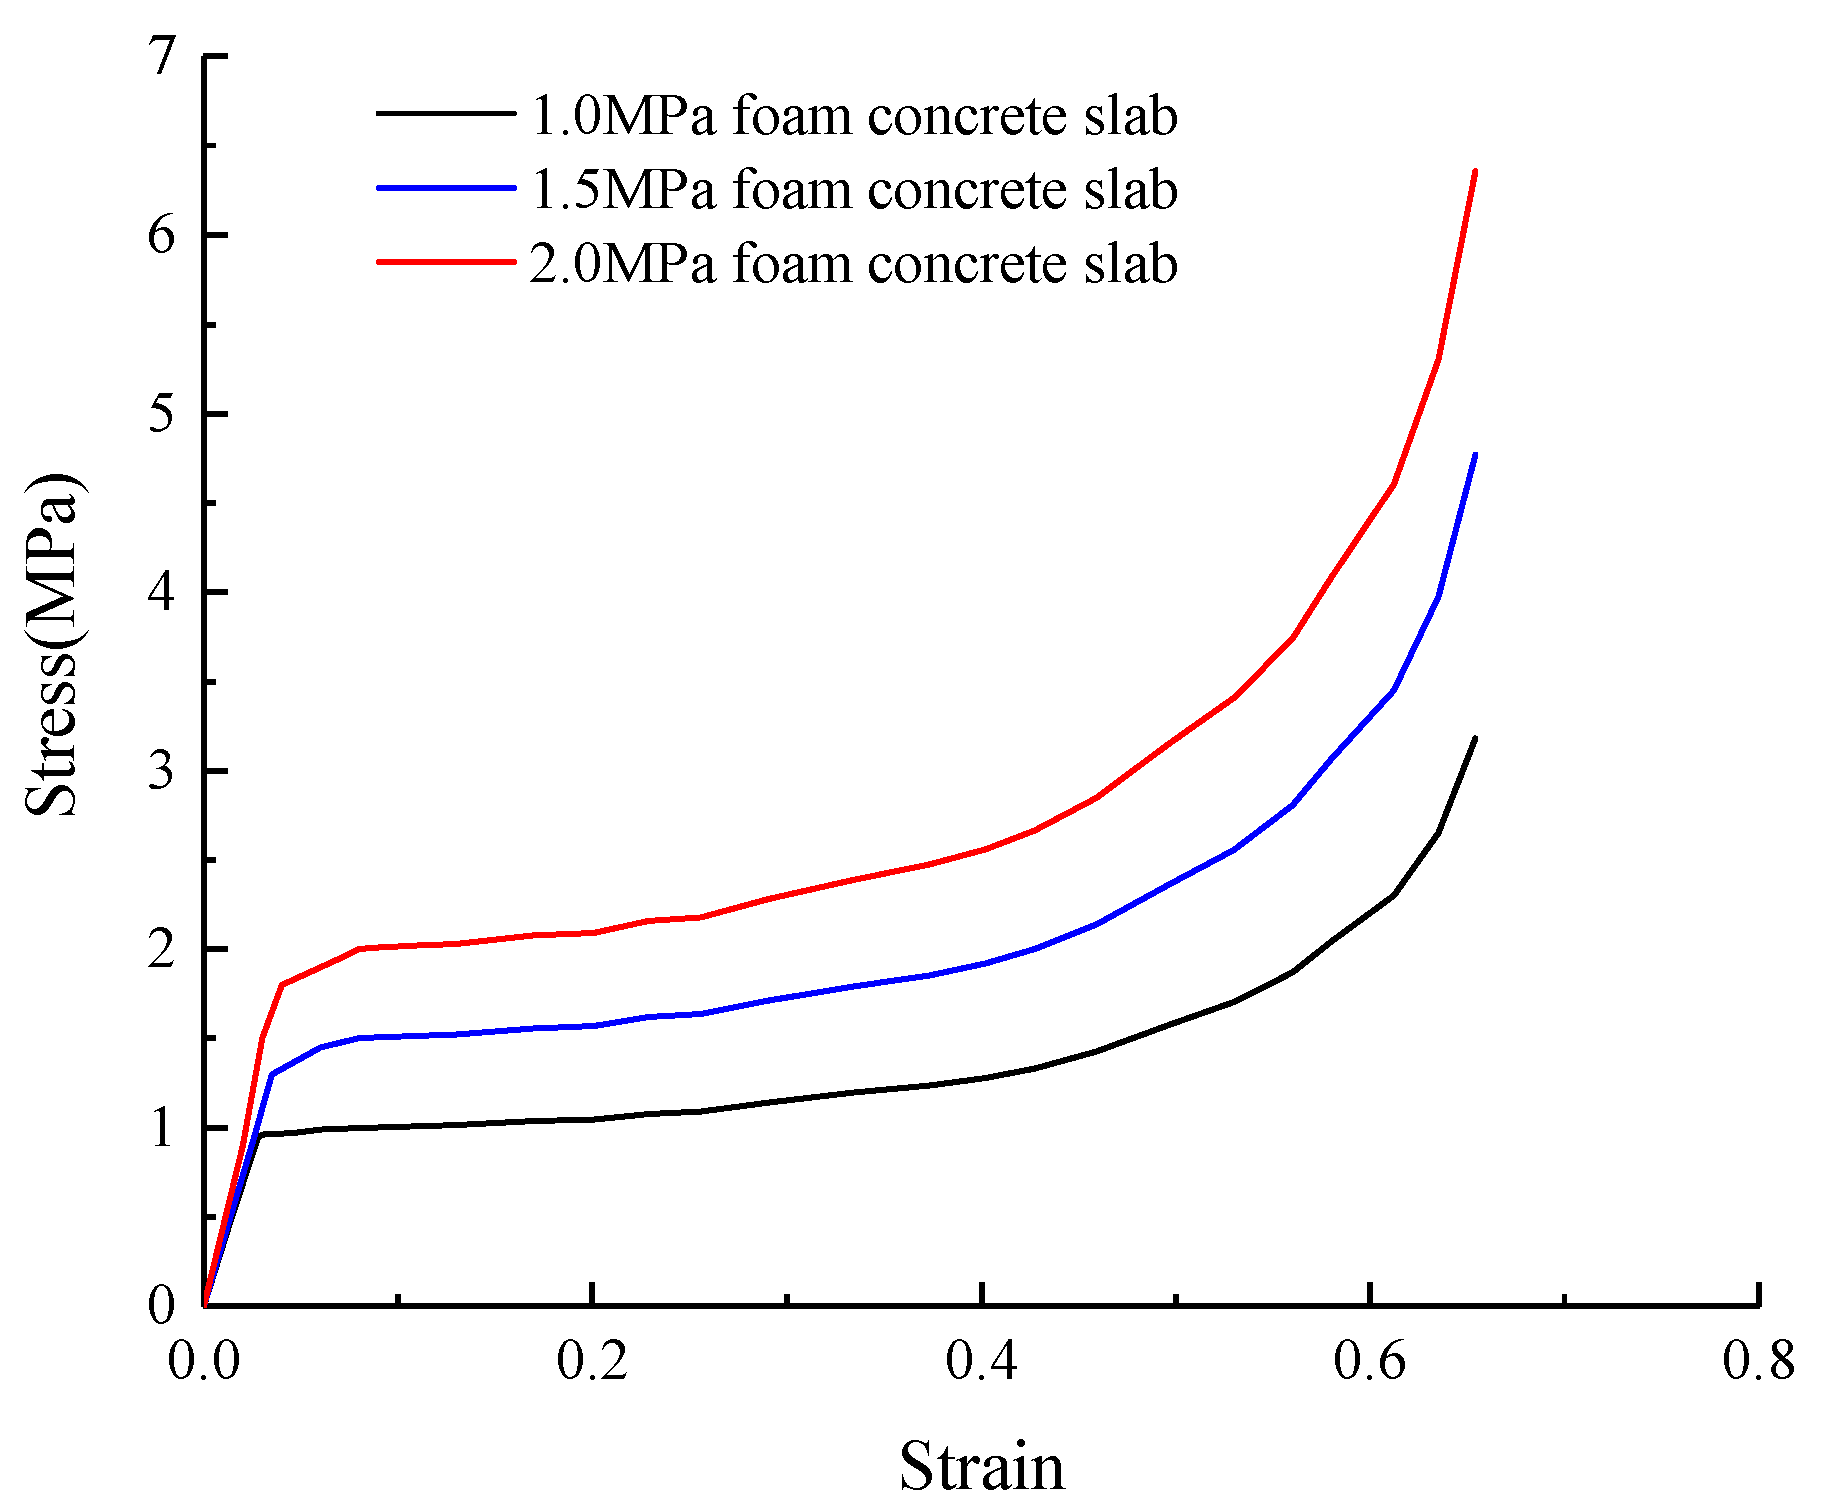
2.1.3. Compression Performance Test of XPS Slab and Foam Concrete Slab Restrained by Steel Hoops

The compression tests of XPS slab and twelve foam concrete slabs restrained by steel hoops were carried out on the universal testing machine at a loading rate of 50 N/s, and a steel cover plate of 5 mm thickness was placed on the top of the foam concrete slab during loading. The stress–strain curves of a typical XPS slab and a foam concrete slab in the loading process are shown in Figure 2.
It can be seen from Figure 2 that both the XPS slab and foam concrete slab have obvious three-stage stress characteristics, namely an elastic stage, a yield plateau stage and a densification stage. In the elastic stage, the relationship between stress and strain is close to a straight line, and the elastic modulus of the XPS and the foam concrete slab is about 13.4 MPa and 37.3 MPa, respectively. In the yield plateau stage, the stress of the XPS slab is essentially constant under increasing strain, with a plastic strain rate of about 0.7, and the stress of the foam concrete slab restrained by steel hoops increases slightly under increasing strain, with a plastic strain rate of about 0.5, which may be related not only to the restraint of steel hoops, but also to the restraint of the upper steel cover plate. In the densification stage, owing to most of the internal pores of the two foam slabs being crushed and the pore walls contacting each other, the stress increases sharply with the increase of strain, and the stiffness is close to that of the elastic deformation stage.

2.2. Test Setup

The indoor model test of a composite foundation with a single rigid pile was carried out in the structure laboratory of Nanchang University. This test simulates the environmental conditions of the middle pile in a composite foundation under the large-size raft foundation; the full lateral confinement is used to prevent the cushion from extruding from the side. The test loading device and photos are shown in Figure 3.
A vertical load is applied on the load plate by using a jack (electro-hydraulic servo loading system) and reaction frame, and earth pressure boxes are buried on the top of rigid pile and the surface of the soil to measure pile and soil pressure. The displacement meter is used to measure the settlement of the load plate and the sandy soil in the whole loading process, and the settlement of the sandy soil is measured by the settlement mark buried on the interface between cushion and the soil layer. During the test, a circle of PVC pipe with an inner diameter of 2 cm is sleeved on the settlement mark to ensure that the measurement accuracy is not affected by the gravel of cushion.
The main equipment and materials required for this test are as follows:
(a)
Electro-hydraulic servo loading system and universal testing machine.
(b)
Test chamber: Square steel tubes are welded into a box shape; the size of the test box is 1.10 m × 0.83 m × 1.05 m (length × width × height), the inner size is 0.90 m × 0.63 m × 1.05 m, and a 15 mm tempered glass retaining wall is embedded.
(c)
Model pile: circular steel pipe is filled with concrete, with a diameter of 300 mm and height of 770 mm.
(d)
Load plate: the plane size is 0.80 m × 0.57 m, and the stiffening plate is set on it to improve the overall stiffness of the load plate.
(e)
Cushion: gravel and coarse sand are selected; the maximum particle size of gravel is not more than 20 mm, and the ratio of gravel to coarse sand is 7:3.
(f)
Foam slab: XPS slabs and foam concrete slabs restrained by steel hoops are adopted. During the test, a 2 mm steel plate is placed on the foam slab to prevent it from being locally crushed by the upper cushion.
(g)
Sandy soil: medium sand with a particle size of 0.2~2 mm.
(h)
Earth pressure box: the range of 2 MPa and 4 MPa is used to measure the stress of the pile, and the range of the earth pressure box is 800 kPa.
(i)
A static data acquisition instrument is used for data acquisition.

2.3. Test Cases

Five tests of a composite foundation with an end-bearing rigid pile were carried out. There is only cushion on the top of the pile in test-1 and test-2, and the thickness of cushion is 120 mm and 170 mm, respectively. In test-3 and test-4, 0.7 MPa XPS slabs are placed on the top of the pile, and 1.0 MPa foam concrete slabs are placed on the top of the pile in test-5. The model test scheme is detailed in Table 2.

2.4. Load and Test

Graded loading is adopted in this test. The settlement of load plate, soil settlement, pile top stress and soil pressure are measured in the whole loading process. The specific test steps are as follows:
(a)
The rigid pile is placed in the middle of the test chamber, and the soil is filled 20 cm~30 cm each time, using a 5-kg iron block to fall freely from a height of 30 cm and tamp the sand twice.
(b)
A pressure box is placed on the top of the pile to measure the stress of the pile, and four earth pressure boxes are placed on the top of the sandy soil to measure the soil pressure. The average value of four soil pressure boxes is taken as the measurement result.
(c)
The 14 levels of loading are carried out, with loading pressures of 33 kPa, 66 kPa, 100 kPa, 200 kPa, 250 kPa, 300 kPa, 350 kPa, 400 kPa, 450 kPa, 500 kPa, 550 kPa, 600 kPa, 700 kPa and 800 kPa, respectively. The loading rate is 0.5 kN/s. The loading pressure shall be maintained for 20 min after each level of loading is completed. The loading termination is controlled by settlement without convergence, or the output of the jack meets the design requirements.

3. Test Results

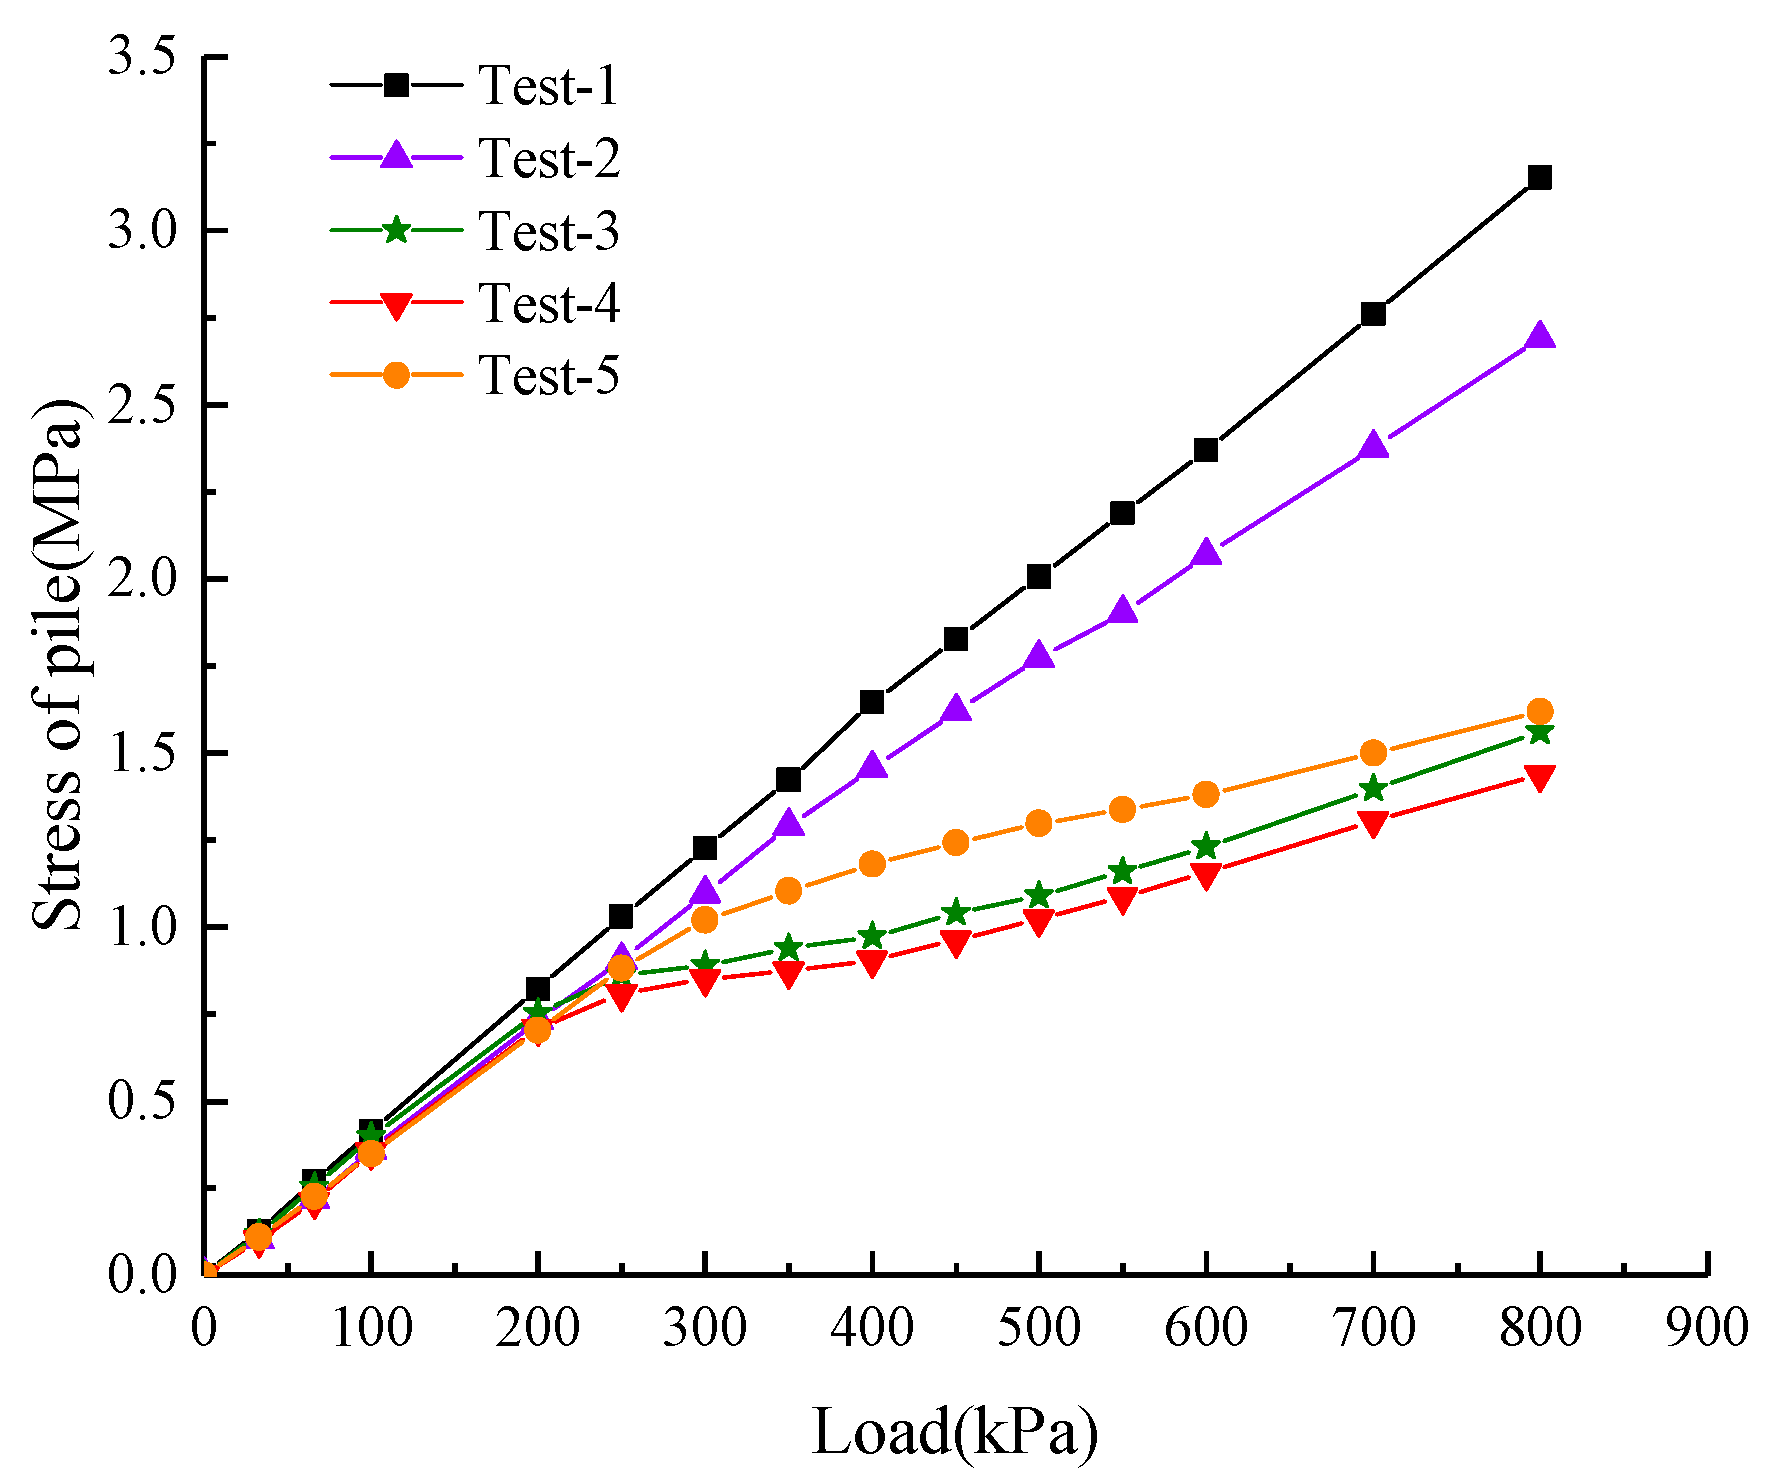
3.1. Relationship between Load and Pile Top Stress

Figure 4 shows the curve of load–pile top stress from test-1 to test-5. When the load is less than 200~250 kPa, five groups of test curves are basically the same because both cushion and foam slab are in the elastic stage. The thickness of cushion in test-1 is 120 mm, and the load–pile top stress curve is basically linear. The thickness of cushion in test-2 is 170 mm, and the pile top stress under the same load is slightly less than that of test-1. The yield strength of the XPS slab at the top of the pile in test-3 and test-4 is 700 kPa, and the yield strength of the foam concrete slab at the top of the pile in test-5 is 1000 kPa. When the pile top stress exceeds 700 kPa, the XPS slabs of test-3 and test-4 begin to yield, the curve of load–pile top stress reveals obvious bending, and the pile top stress growth slows down significantly. When the pile top stress exceeds 1000 kPa, the foam concrete slab of test-5 begins to yield. The curve of load–pile top stress also reveals obvious bending, and the pile top stress growth slows down significantly, which indicates that the stress level of rigid piles can be well controlled by the yield of foam materials on the top of the pile.

3.2. Relationship between Load and Soil Pressure

Figure 5 shows the curve of load–soil pressure from test-1 to test-5. It can also be seen from Figure 5 that when the load is less than 200~250 kPa, five groups of test curves are basically consistent, which is basically the same as the curve of the load–pile top stress of Figure 4. When the load is larger than 200~250 kPa, the elastic-plastic foam slab on the top of the pile begins to yield, and the rate of increase of soil pressure from test-3 to test-5 is significantly greater than that in test-1 and test-2. In test-1 and test-2, the load–pile top stress curves are basically linear, indicating that the elastic modulus of the cushion and soil changed very little during the loading process.

3.3. Relationship between Pile Top Stress and Soil Pressure

Figure 6 shows the curve of pile top stress–soil pressure during the whole loading process. It can be seen from Figure 6 that the pile–soil stress curve of test-1 is basically linear, and the stress is distributed based on their stiffness, respectively. There is a nonlinear relationship between pile–soil stress in test-2, and the growth rate of soil pressure is faster than that of pile top stress in the later stage of loading. The pile top stress–soil pressure curves from test-3 to test-5 also show that after the foam plates are placed on top of the pile, when the pile top stress exceeds the yield strength of the foam plate, the pile top stress grows slowly, while the soil pressure grows faster. The pile–soil stress curve shows obvious non-linear characteristics, and the growth rate of soil pressure is obviously larger than the growth rate of pile top stress.

3.4. Relationship between Load and Settlement

Figure 7 shows the curve of load–total settlement of five groups of tests. It can be seen that the settlement increases rapidly at the initial stage of loading due to the initial gap of gravel in the cushion. When the loading pressure exceeds 100 kPa, the growth rate of the curve of load–total settlement slows down significantly because the initial void of gravel and sand in the cushion has been basically compacted. When the thickness of cushion increases from 120 mm to 170 mm, more loads are carried by the soil, so the settlement of test-2 is larger than that of test-1.
Unlike the load–pile top stress curve, there is no obvious inflection point in the load–total settlement curve after the foam slab is placed on top of the pile, and the curve shape is smooth. This is mainly because when the foam slab yields, although the stress at the top of the pile grows slowly, the soil bears more load, so the load–total settlement curve changes smoothly. It can also be seen from Figure 7 that when the load reaches 200~250 kPa, the settlement of the composite foundation in test-3 to test-5 is significantly larger than that of test-1 and test-2, indicating that the foam concrete slab has a better role in coordinating the settlement.

3.5. Relationship between Stress and Strain of the Soil between Piles

Figure 8 shows the curve of stress–strain of the soil from test-1 to test-5. Since the soil between piles is compacted by the same standard in five groups of tests, the stress–strain curves of the soil in the other four sets of tests are basically close, except for a small error in the curve of test-1. A small amount of error may come from the manual uneven compaction process of soil and the measurement error of earth pressure boxes.

4. Numerical Results

The ABAQUS finite element software was used to simulate the five tests, and the finite element simulation results were compared with the measured results to verify the feasibility and accuracy of the finite element simulation.

4.1. Numerical Model

4.1.1. Finite Element Model and Boundary Conditions

According to the symmetry of the test model, the 1/4 finite element model is used for calculation, and the finite element model is shown in Figure 9.
The linear elastic model is used for the load plate and the rigid pile. The elastic modulus of the load plate is 2.06 × 10⁵ MPa, and the Poisson’s ratio is 0.3. The elastic modulus of rigid pile is 3.0 × 10⁴ MPa, and the Poisson’s ratio is 0.2. A nonlinear elastic model is used for soil and cushion, with a Poisson’s ratio of 0.3. An elastic–plastic constitutive model based on crushable foam yield criterion is adopted for the XPS slab and the foam concrete slab, and the elastic modulus of the XPS slab and the foam concrete slab are 13.4 MPa and 37.3 MPa, respectively. A solid element C3D8R is used for the load plate, cushion, rigid pile, soil between piles, XPS slab and foam concrete slab. The bottom of the model is constrained in three directions. The side of the model is constrained in the normal direction and free in the vertical direction.
The contact element is used to simulate a rigid pile and the soil, the soil and cushion, rigid pile and foam material slab, foam material slab and cushion, cushion and load plate. Surface-to-surface contact is adopted for contact. A small sliding is adopted to track the relative movement of the contact surface. The surface with larger stiffness is used as master surface, and the surface with smaller stiffness is used as slave surface. In the mechanical model of contact interaction, hard contact is adopted in Normal Behavior, and penalty function is adopted in Tangential Behavior.

4.1.2. Crushable Foam Plastic Model

The crushable foam plasticity model is used to model the difference between a foam material’s compressive strength and its much smaller tensile bearing capacity resulting from cell wall breakage under tension. For the plastic part of the behavior, the yield surface is a Mises circle in the deviatoric stress plane and an ellipse in the meridional (pq) stress plane.
The volume hardening model is adopted in the finite element simulation of XPS slab and foam concrete slab. In this model, compression yield stress ratio k = σ c 0 / p c 0 , and hydrostatic yield stress ratio k t = p t / p c 0 . Where σ c 0 is the uniaxial compression initial yield stress, p c 0 is the initial yield stress in hydrostatic compression, and p t is the hydrostatic tensile yield stress. k = 1 , k t = 0.1 .

4.1.3. Determination of Parameters of Cushion and Soil

The elastic modulus of soil and cushion under each level of load was calculated according to the measured settlement, and the nonlinear elastic modulus was adopted during the finite element simulation. The nonlinear elastic modulus of cushion and the soil was input by field variable in ABAQUS software.
As can be seen from Figure 7, the settlement increased rapidly at the initial stage of loading due to the initial gap of cushion. When the load exceeded 100 kPa, the tangent slope of the load–settlement curve was basically stable. By unloading and reloading to 100 kPa test, it can be seen that the initial gap was about 3.7 mm. In order to simulate the initial void of cushion truly, a crushable foam material with a thickness of 1 cm was placed under the load plate in the finite element analysis. The yield strength of the foam material was 100 kPa, and the plastic strain was set at 0.37. When the loading reached 100 kPa, the settlement of plastic material was about 3.7 mm, which can simulate the initial gap of cushion.
Table 3 shows the elastic modulus of cushion and the soil in each loading stage of test-1. It can be seen that after deducting the initial gap of the cushion, the elastic modulus of the cushion varies little in each loading stage.

4.2. Comparison of the Test and Numerical Results

Figure 10 shows the measured values and the simulated values in test-1. It can be seen that the measured stress and settlement value are basically consistent with the simulated values, and the simulation accuracy is relatively high, which indicates that the method of using field variables to input the varied elastic modulus is feasible.
Figure 11 is the settlement contour and stress contour in test-1 when loaded to 800 kPa. The settlement of cushion on the top of the pile is significantly smaller than that on the soil, and the stress of the cushion on the pile and soil is also obviously different. The pressure of pile top cushion has reached 2.0~3.2 MPa, while the pressure of other cushions is only 350 kPa.

4.3. Case

4.3.1. Establishment of Model

The soil layer is composed of gravels and completely and moderately weathered rocks. The thickness of the gravels and completely weathered rocks is 7 m and 8 m, respectively. There are beaded karst caves under the moderately weathered rock stratum, and it is difficult to find a complete bearing stratum if a pile foundation is adopted, so a composite foundation with a rigid pile is proposed to be adopted. The characteristic value of the bearing capacity of the upper gravel layer is about 205 kPa, which cannot meet the requirement of bearing capacity. The characteristic value of the bearing capacity of a composite foundation must reach 400 kPa, and the pile–soil stress ratio is controlled within 25.
The size of the bearing platform under the shear wall is 4.5 m × 4.5 m, with a thickness of 1.5 m. Nine piles each 0.5 m in diameter are arranged under the bearing platform at a pile spacing of 1.5 m. The pile length is 15 m, with the moderately weathered rock as the bearing stratum. The thickness of cushion is 25 cm, which is half of the diameter of the pile. The mechanical parameters of soil layer 1 and soil layer 2 are shown in Table 4. For soil layer 1, two elastic moduli of 20 MPa and 14 MPa are used to simulate the possible error between the actual settlement and the calculated.
The finite element model of the engineering case is shown in Figure 12. The length, width and height of the finite element model are 34.5 m × 34.5 m × 15 m, respectively. The platform and rigid pile are simulated as an elastic model, and the cushion and soil are simulated as an elasto-plastic constitutive model based on the Mohr-Coulomb criterion. The concrete foam slab is simulated as a crushable foam model. A C3D8R element is used for the platform, rigid pile, cushion and soil. The finite element boundary conditions and contact element are the same as in Section 4.
Four cases are simulated by the finite element analysis, which are shown in Table 5. In Case 1 and Case 3, the pile top is only regulated by 25 cm of cushion, and the modulus of elasticity of the soil layer 1 is 20 MPa in Case 1 and 14 MPa in Case 3, respectively. In Case 2 and Case 4, three foam concrete slabs with 1.0 MPa, 1.5 MPa and 2.0 MPa yield strength are placed on the pile top, respectively. The thickness of each foam concrete slab is 10 mm. The stress–strain curves of three foam concrete slabs are shown in Figure 13.

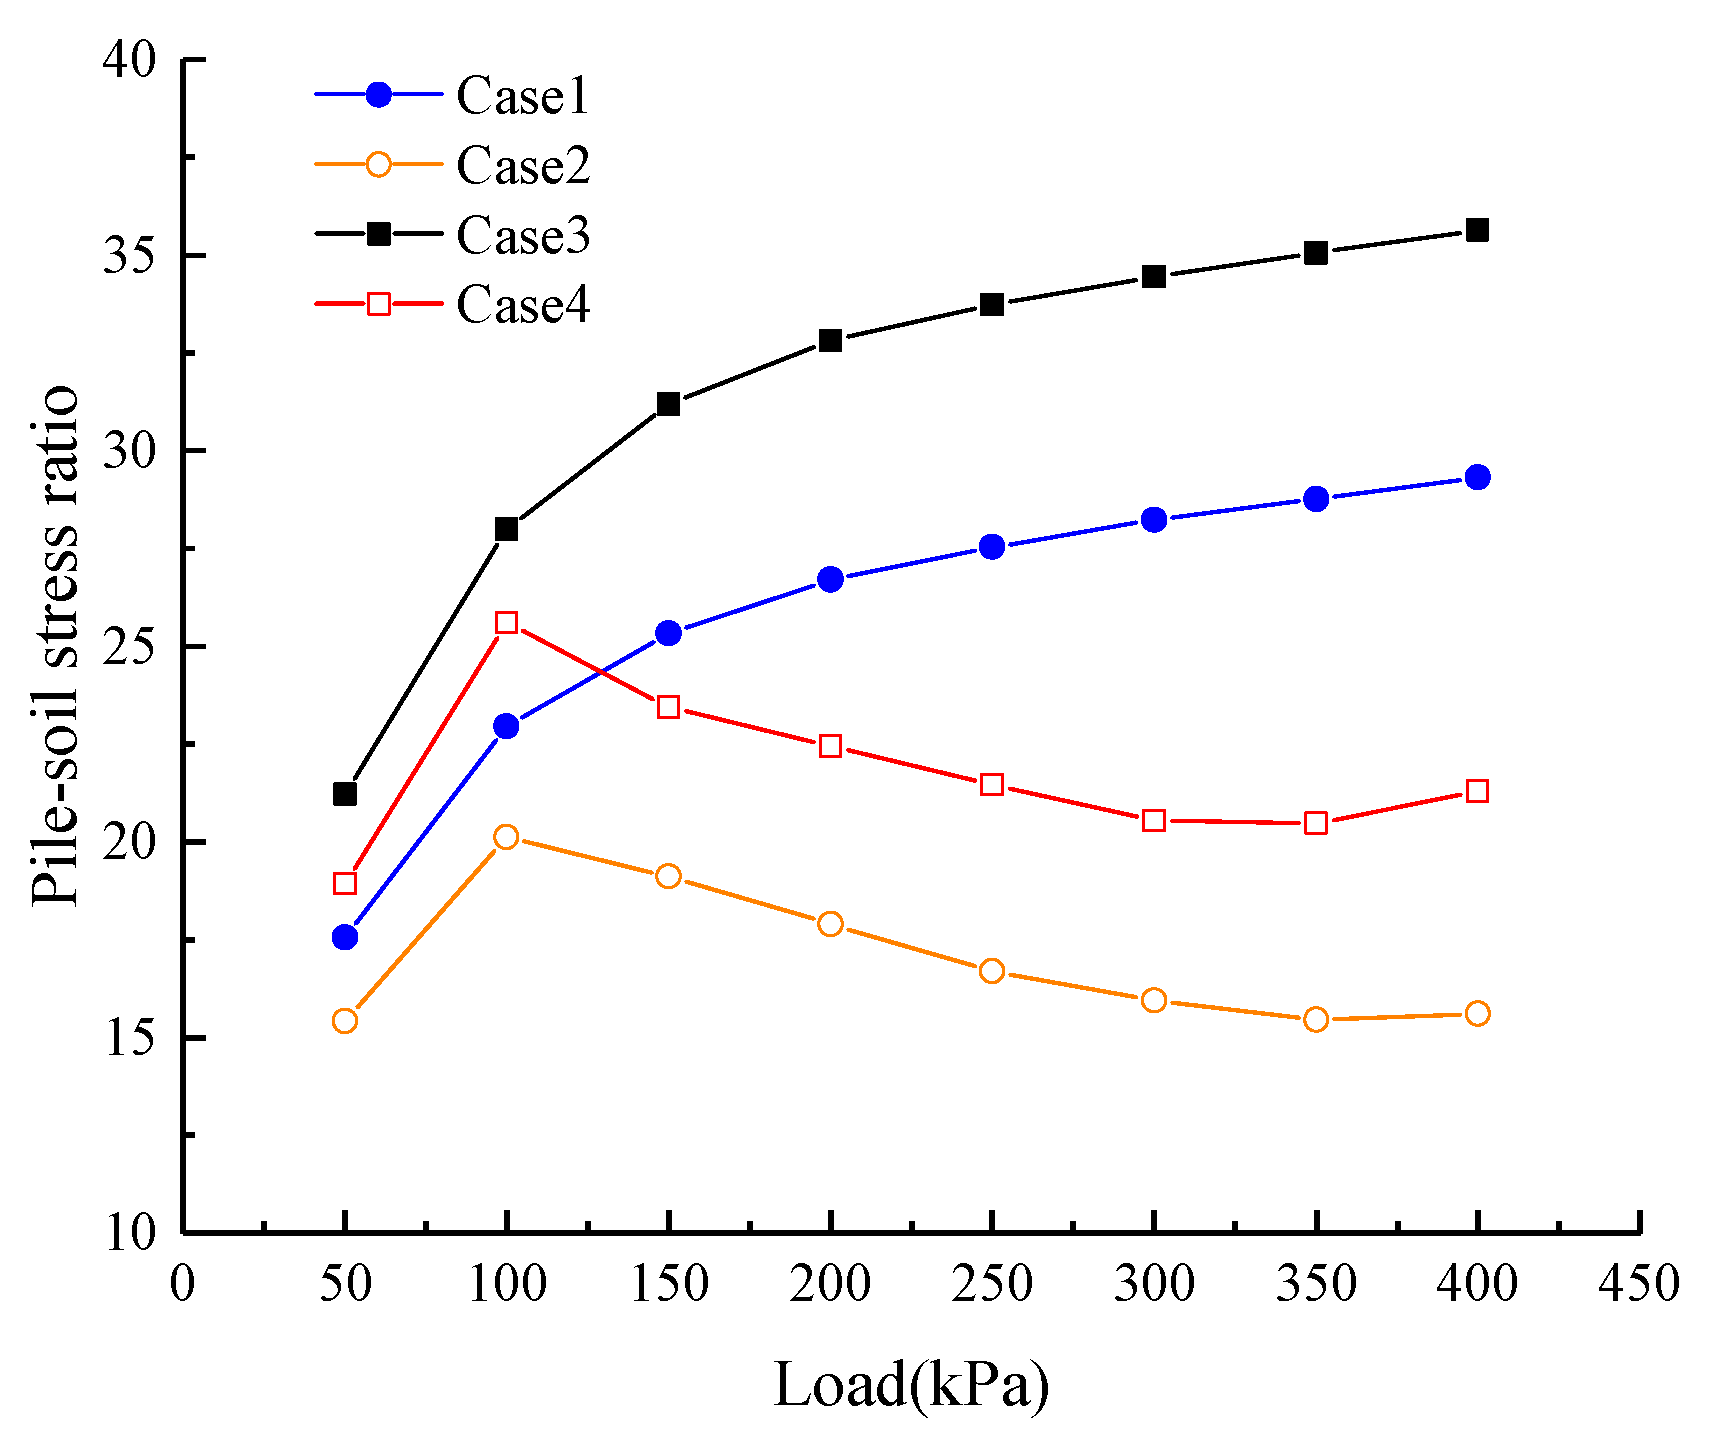
4.3.2. Analysis of Simulation Results

Figure 14 shows the load–settlement curve of a composite foundation in four cases. Although the elastic modulus of soil1 in Case 3 is obviously smaller than that in Case 1, the settlement change of the composite foundation under the two cases is very small, which indicates that the regulating ability of the cushion is limited. From the load–settlement curve of Case 2 and Case 4, it can be seen that the load–settlement curve shows obvious bending deformation when the loading reaches 100 kPa. When the load reaches 400 kPa, the final settlement of the composite foundation is 27.25 mm in Case 2 and 30.76 mm in Case 4, which indicates that the foam concrete slabs have yielded, and the settlement of a composite foundation is regulated by foam concrete yield deformation.
Figure 15 is the simulated settlement contours of the soil in Case 3 and Case 4 when the composite foundation is loaded to 400 kPa. The deformation shapes of soil in the two cases are basically similar, but the settlement of Case 4 is significantly larger than that of Case 3.
Figure 16 shows the load–soil pressure curves in four cases. It can be seen that the soil pressures in Case 2 and Case 4 increase by nearly 40% compared to the corresponding Case 1 and Case 3 when loaded to 400 kPa, which indicates that the foam concrete slabs play a better role in regulating the bearing capacity of the soil.
Figure 17 shows the load–pile stress curves in four cases. When the load reaches 100 kPa, the stress of the rigid pile exceeds 1.0 MPa, and the low-strength foam concrete slab first yields and starts to coordinate the deformation of pile and soil. When the load reaches 300~350 kPa, the stress of the rigid pile reaches 2.0 MPa, the yield deformation of the three foam concrete slabs is basically completed, and the slope of the load–pile top stress curve is basically the same.
Figure 18 is the simulated stress contours of the soil in Case 3 and Case 4 when the load reaches 400 kPa. It can be clearly seen that the distribution of soil pressure along the depth. The additional load of the bearing platform mainly affects the stress of the upper soil layer and has little effect on the lower soil layer.
Figure 19 is the pile–soil stress ratio in four cases. It can be seen that before the load reaches 100 kPa, the pile–soil stress ratio increases with the increase of load. When the load exceeds 100 kPa, the pile–soil stress ratio continues to increase with the increase of load in Case 1 and Case 3. However, in Case 2 and Case 4, the foam concrete slabs on the top of the pile yield successively and begin to coordinate the deformation of the pile and soil. The pile–soil stress ratio begins to decrease with the increase of load, which effectively controls the pile–soil stress ratio.
Figure 20 shows the plastic strain contour of the foam concrete slab when a composite foundation is loaded to 400 kPa in Case 4. It can be seen that the plastic strain is 0.57 for the 1.0 MPa foam concrete slab, 0.51 for the 1.5 MPa foam concrete slab, and 0.42 for the 2.0 MPa foam concrete slab, which indicates that all the foam concrete slabs have yielded deformation, and the foam concrete slabs play an important role in coordinating the deformation of pile and soil.
In this case, two elastic moduli of soil1 are used to simulate the occurrence of unpredictable settlement (such as the settlement caused by precipitation or post-construction settlement). It can be seen that when the stress of the pile is less than the yield strength of the foam concrete, the foam concrete slab can be ignored. When the stress of the pile is larger than the yield strength of the foam concrete slab, the foam concrete slabs with different strengths yield successively, and settlement is continuously coordinated through yield deformation. The pile–soil stress ratio can be well controlled by the method.
In this paper, a new method is proposed to comprehensively coordinate the settlement of a composite foundation based on cushion stiffness and the yield strength of a foam slab. In an engineering application, the strength of a foam concrete slab can be determined according to the characteristic value of a rigid pile’s bearing capacity, and how to reasonably determine the strength and thickness of multiple foam concrete needs to be further studied.

5. Conclusions

  • In the south of China, there is a large market demand for composite foundations with end-bearing rigid piles. The end-bearing rigid pile cannot penetrate downward to coordinate the pile–soil deformation as the friction pile. When the soil settlement is large, the coordination capacity of the cushion is insufficient.
  • The existing pile–soil deformation adjustment device can solve the problem of pile–soil deformation coordination of a composite foundation with an end-bearing rigid pile to a certain extent, but the stiffness of the current deformation adjustment device cannot be changed after installation, and the adjustment effect depends on the accurate calculation of soil deformation.
  • As the current settlement calculation theory is still immature, the pile–soil stress ratio of a composite foundation can be well controlled by the comprehensive control with cushion stiffness and foam concrete slab strength, and the adaptability of the end-bearing rigid pile composite foundation to settlement changes has been improved.

Author Contributions

Conceptualization, Y.L. and C.Y.; methodology, Y.L.; software, C.Y.; validation, Y.L. and C.Y.; formal analysis, Y.L. and C.Y.; resources, Y.L., X.L. and C.Y.; data curation, C.Y., L.Y. and J.W.; writing—original-draft preparation, C.Y., J.W. and L.Y.; writing—review and editing, Y.L., L.Y. and C.Y.; visualization, Y.L.; supervision, Y.L. and C.Y.; project administration, Y.L.; funding acquisition, Y.L. and X.L. All authors have read and agreed to the published version of the manuscript.

Funding

This research was funded by JiangXi Jiye Science and Technology Group Co.,Ltd. [Grant No. 2022006].

Institutional Review Board Statement

Not applicable.

Informed Consent Statement

Not applicable.

Data Availability Statement

The data used to support the findings of this study are available from the authors upon request.

Conflicts of Interest

The authors declare no conflict of interest.

References

  1. Fioravante, V. Load transfer from a raft to a pile with an interposed layer. Géotechnique 2011, 61, 121–132. [Google Scholar] [CrossRef]
  2. Halder, P.; Manna, B. Large scale model testing to investigate the influence of granular cushion layer on the performance of disconnected piled raft system. Acta Geotech. 2021, 16, 1597–1614. [Google Scholar] [CrossRef]
  3. Zheng, G.; Liu, S.G.; Wu, Z.C. Study on behavior of rigid pile composite ground with different cushion thicknesses. Rock Soil Mech. 2006, 27, 1357–1360. (In Chinese) [Google Scholar]
  4. Han, X.; Li, Y.; Ji, J.; Ying, J.; Li, W.; Dai, B. Numerical simulation on the seismic absorption effect of the cushion in rigid-pile composite foundation. Earthq. Eng. Eng. Vib. 2016, 15, 369–378. [Google Scholar] [CrossRef]
  5. Miao, L.; Wang, F.; Lv, W. A Simplified Calculation Method for Stress Concentration Ratio of Composite Foundation with Rigid Piles. KSCE J. Civ. Eng. 2018, 22, 3263–3270. [Google Scholar] [CrossRef]
  6. Hakro, M.R.; Kumar, A.; Almani, Z.; Ali, M.; Aslam, F.; Fediuk, R.; Klyuev, S.; Klyuev, A.; Sabitov, L. Numerical Analysis of Piled-Raft Foundations on Multi-Layer Soil Considering Settlement and Swelling. Buildings 2022, 12, 356. [Google Scholar] [CrossRef]
  7. Jiménez, G.A.L.; Dias, D. Dynamic Soil–Structure Interaction Effects in Buildings Founded on Vertical Reinforcement Elements. CivilEng 2022, 3, 573–593. [Google Scholar] [CrossRef]
  8. Van Pham, H.; Dias, D. 3D Numerical Modeling of Rigid Inclusion-Improved Soft Soils Under Monotonic and Cyclic Loading—Case of a Small-Scale Laboratory Experiment. Appl. Sci. 2021, 11, 1426. [Google Scholar] [CrossRef]
  9. Jiang, C.; Liu, L.; Wu, J.P. A new method determining safe thickness of karst cave roof under pile tip. J. Cent. South Univ. 2014, 21, 1190–1196. [Google Scholar] [CrossRef]
  10. El-Garhy, B.M. A Simplified Method for the Nonlinear Analysis of Composite Piled Raft Foundation. Geotech. Geol. Eng. 2022, 40, 4357–4375. [Google Scholar] [CrossRef]
  11. Wang, X.Z.; Zheng, J.J.; Yin, J.H. On composite foundation with different vertical reinforcing elements under vertical loading: A physical model testing study. J. Zhejiang Univ. Sci. A 2010, 11, 80–87. [Google Scholar] [CrossRef]
  12. Yang, M.; Liu, S. Field tests and finite element modeling of a Prestressed Concrete Pipe pile-composite foundation. KSCE J. Civ. Eng. 2015, 19, 2067–2074. [Google Scholar] [CrossRef]
  13. Li, D.; Ma, D.; Su, D.; Rao, S.; Wang, W.; Hong, C. Monitoring Axial Force Development in a Super-Long Pile during Construction Using BOFDA and Data Interpretation Approaches: A Case Study. Buildings 2022, 12, 1462. [Google Scholar] [CrossRef]
  14. Oh, D.-W.; Kong, S.-M.; Lee, Y.-J.; Park, H.-J. Prediction of Change Rate of Settlement for Piled Raft Due to Adjacent Tunneling Using Machine Learning. Appl. Sci. 2021, 11, 6009. [Google Scholar] [CrossRef]
  15. Cai, J.; Du, G.; Xia, H.; Sun, C. Model Test and Numerical Simulation Study on Bearing Characteristics of Pervious Concrete Pile Composite Foundation. KSCE J. Civ. Eng. 2021, 25, 3679–3690. [Google Scholar] [CrossRef]
  16. Le, Q.; Jian-yong, S.; Qian, H. Research on pile penetration into cushion of composite ground. Rock Soil Mech. 2011, 32, 815–819. (In Chinese) [Google Scholar]
  17. Zhou, F. Engineering practice of composite end-bearing pile foundation based on settlement control. Chin. J. Rock Mech. Eng. 2015, 34, 1071–1079. [Google Scholar]
  18. Zhou, F.; Lin, C.; Zhang, F.; Lin, S.Z.; Wang, X.D. Design and Field Monitoring of Piled Raft Foundations with Deformation Adjustors. J. Perform. Constr. Facil. 2016, 30, 04016057. [Google Scholar] [CrossRef]
  19. Zhu, R.; Zhou, F.; Wan, Z.; Deng, S.; Dong, X.; Zhou, Z.; Xing, W. Improving the Performance of Piled Raft Foundations Using Deformation Adjustors: A Case Study. Buildings 2022, 12, 1903. [Google Scholar] [CrossRef]
  20. Zhou, F.; Lin, C.; Wang, X.D.; Chen, J. Application of deformation adjustors in piled raft foundations. Proc. Inst. Civ. Eng.-Geotech. Eng. 2016, 169, 527–540. [Google Scholar] [CrossRef]
  21. Wang, Y.; Wang, X.D.; Li, Y. Research on Properties and Applications of XPS Boards. China Plast. 2011, 25, 75–80. (In Chinese) [Google Scholar]
  22. Luo, X.; XU, J.; Zhang, H. Comparative study on the mechanical properties of low strength and high porosity porous materials. Prot. Eng. 2017, 39, 14–19. (In Chinese) [Google Scholar]
Figure 1. Test photos of foam concrete slabs restrained by steel hoops: (a) preparation; (b) photo of foam concrete slab after loading.
Processes 11 00539 g001
Figure 2. Typical stress–strain curve of XPS slab and foam concrete slab.
Processes 11 00539 g002
Figure 3. Test loading system: (a) diagram of test; (b) test photo.
Processes 11 00539 g003
Figure 4. Curve of load–pile top stress.
Processes 11 00539 g004
Figure 5. Curve of load–soil pressure.
Processes 11 00539 g005
Figure 6. Curve of pile top stress–soil pressure.
Processes 11 00539 g006
Figure 7. Curve of load–total settlement.
Processes 11 00539 g007
Figure 8. Curve of stress–strain of the soil between piles.
Processes 11 00539 g008
Figure 9. Finite element model of indoor tests: (a) model with size; (b) mesh.
Processes 11 00539 g009
Figure 10. Comparison between measured value and simulated value in test-1: (a) stress; (b) settlement.
Processes 11 00539 g010
Figure 11. Finite element simulation results in test-1: (a) settlement contour (m); (b) stress contour (Pa).
Processes 11 00539 g011
Figure 12. Finite element model of engineering case: (a) FEA model; (b) platform and pile model.
Processes 11 00539 g012
Figure 13. Stress-strain curves of three foam concrete slabs.
Processes 11 00539 g013
Figure 14. Load–total settlement curve.
Processes 11 00539 g014
Figure 15. Settlement of a composite foundation(m): (a) Case 3; (b) Case 4.
Processes 11 00539 g015
Figure 16. Curve of load–soil pressure.
Processes 11 00539 g016
Figure 17. Load–stress curve of pile.
Processes 11 00539 g017
Figure 18. Soil pressure of a composite foundation (Pa): (a) Case 3; (b) Case 4.
Processes 11 00539 g018
Figure 19. Curve of pile–soil stress ratio.
Processes 11 00539 g019
Figure 20. Plastic strain contour of foam concrete slab.
Processes 11 00539 g020
Table 1. Mix proportion of foam concrete.
Trial StrengthCement/kgWater/kgFoam Agent/kgBubble Rate
1.0 MPa3752251.1266%
1.5 MPa4182501.2561%
Table 2. Model test scheme.
TestDiameter of Rigid Pile/mmThickness of Cushion/mmType of Foam SlabStrength of Slab
Test-1300120
Test-2300170
Test-330012020 mm XPS slab0.7 MPa
Test-430017020 mm XPS slab0.7 MPa
Test-530012030 mm foam concrete slab1.0 MPa
Table 3. Nonlinear elastic modulus of cushion and the soil between piles of test-1.
Loading ConditionThe Soil between Piles E/MPaCushion on the Top of Pile E/MPa
100 kPa20.2020.26
200 kPa21.2421.31
300 kPa21.6421.82
400 kPa22.1522.99
500 kPa22.7823.19
600 kPa23.3723.73
700 kPa23.8924.53
800 kPa24.3925.13
Table 4. Mechanical parameters of soil layer.
Soil LayerThickness/mModulus of Elasticity/MPaPoisson’s RatioCohesion/kPaAngle of Internal Friction
cushion0.25400.3235°
soil1720 (14)0.31032°
soil283000.35032°
Table 5. Summary of cases.
CaseDescription
Case 125 cm cushion, elastic modulus of soil layer 1 is 20 MPa
Case 2On the basis of Case 1, three foam concrete slabs are placed on the top of pile
Case 325 cm cushion, elastic modulus of soil layer 1 is 14 MPa
Case 4On the basis of Case 3, three foam concrete slabs are placed on the top of pile
Disclaimer/Publisher’s Note: The statements, opinions and data contained in all publications are solely those of the individual author(s) and contributor(s) and not of MDPI and/or the editor(s). MDPI and/or the editor(s) disclaim responsibility for any injury to people or property resulting from any ideas, methods, instructions or products referred to in the content.

