Article

Effect of Packing Structure Evolution on the Flow Characteristics in a Binary Composite Packed Bed Based on DEM-CFD Method

College of Materials Science and Engineering, Shenyang University of Technology, Shenyang 110870, China
*
Authors to whom correspondence should be addressed.
Submission received: 19 January 2023 / Revised: 23 February 2023 / Accepted: 26 February 2023 / Published: 1 March 2023
(This article belongs to the Special Issue Chemical Engineering and Technology)

Abstract

:
The evolution of mesoscale structures of particle packing in binary composite packed beds and their effects on flow characteristics and wall effects were investigated using the discrete element method (DEM) and computational fluid dynamics (CFD). The DEM model was used to build a series of randomly mixed packing structures of particles in accordance with the dynamic change of mass ratio between particles in two size ranges, which were then confirmed by the findings of an X-ray tomography (CT) scan. The results show that the packing structure of b25s75 was conducive to reducing the influence of wall effect in packed bed reactors. For b25s75, the dimensionless distance of radial porosity fluctuation from the wall is 0.3705, which is the smallest among the five packing models, indicating that this structure plays a suppressive role on the wall effect. In addition, the uniformity of velocity and temperature distributions in both the radial and axial directions of different packing structures were compared. The standard deviations of radial relative velocity distributions in the packed beds of b100, b75s25, b25s75 and s100 are 0.28, 0.178, 0.139 and 0.156, respectively, indicating that the stacking mode of b25s75 can make the fluid flow and the gas–solid interactions more uniform.

1. Introduction

Fixed bed reactors, as the standard industrial catalytic reaction equipment, with the advantages of simple structure, low cost and easy operation, have been widely studied [1,2,3]. The packed beds of particles are usually designed based on the mechanism of fluid flow and heat transfer [4,5], which is closely related to the interaction between the fluid inside the packed bed and the packing structure (mesoscale structure) of particles [6,7,8]. Since most packed beds use random filling to generate a filler layer, the internal structure of the bed layer is not uniform. This structural inhomogeneity can lead to wall effects and localized reflux, which may have important effects on mass transfer, heat transfer and chemical reactions inside the packed bed [9,10,11], reducing the uniformity of fluid flow and reaction rate in packed bed reactors [12,13,14]. For a better understanding, the effect of mesoscale structure characteristics of particle packing on the fluid flow and gas–solid interactions should be incorporated at a pore scale. The combined method of the discrete element method and computational fluid dynamics (DEM-CFD) is considered to be one of the most beneficial methods to solve this problem [15,16,17].
The DEM-CFD method, which can reflect both the local heterogeneous structure and the transfer behavior in packed and fluidized beds, has attracted significant attention [18,19,20,21] and has been applied to many different particulate systems in recent years [22,23,24]. For example, Gan et al. reported an extended DEM-CFD coupling approach to examine the effect of particle shape on heat transfer in fluidized beds with different aspect ratios of ellipsoids, which can provide better understanding and control of coupled fluid flow and heat transfer in fluid bed reactors [25]. Niu and Wang studied temperature distribution in a randomly packed pebble bed reactor using the DEM-CFD method and confirmed the reliability of the DEM-CFD method [26]. Wang et al. comprehensively studied the effects of operating parameters on heat transfer performance in a bubbling fluidized bed using a DEM-CFD method coupled with heat exchange [27]. For a particle vertical moving bed (PVMB) with different particle size distributions, Zhang et al. established a mathematical model of gas–solid heat transfer based on the DEM-CFD coupling method and investigated the effects of particle mass flow rate and inlet air mass flux on the recovery characteristics of waste heat [28].
In addition, the wall effect in reactors can be tracked by this model. Chen et al. demonstrated that porosity and fluid velocity near the side wall fluctuate considerably by using a DEM-CFD method [29]. They found that temperature distribution, concentration distribution and reaction rate were heterogeneous near the wall. Since the wall effect is one of the main reasons for the reduction of chemical reaction efficiency and thermal stability within packed bed reactors [30,31,32], a suitable method is still required to weaken the wall effect and enhance the gas–solid interactions by optimizing the packing structure of beds. To reveal the influence of the wall effect in different packing structures, Yang et al. studied and compared the flow and heat transfer performances numerically in both the composite and uniform packed beds of spheres [33]. They found that the radially layered composite packing structure including smaller pores formed close to the tube wall and big channels formed in the inner-tube region would be beneficial to restrain the wall effect and improve the uniformity of the internal flow field and temperature field, but this radially layered composite packing structure is challenging to implement in practical technology.
As demonstrated by many studies, the wall effect is strongly related to the diameter ratio of reactor to particle (D/d) [34,35], and the fluid flow characteristics of the packed bed can be improved by controlling the size ranges of composite particles [36]. To study the relationship between flow velocity and porosity at different ratios of D/d, multiple stacked structures of particles of different sizes were formed by Mohanty et al. [37]. Peng et al. noted that the uniformity of the velocity distribution in the central region increases with the increase of D/d, while the flow quantity in the region near the wall decreases [38]. Erdim et al. found that a filling of small particles will increase the specific surface area and the contact area between the fluid and solid particles, resulting in the enhancement of heat and mass transfer in the packed beds [39]. Feng et al. studied the packing structure, porosity and radial distribution function of a binary pebble bed [40]. Their results show that the wall has a great influence on the local porosity distribution in the pebble layer of binary particle size. In addition, compared with the single particle size pebble bed, the influence area of the wall was obviously reduced by using the double particle size pebble bed.
Considering the enhanced performance of heat and mass transfer in composite packed beds, further research is still required to better elucidate the construction of different mixed stacking structures and their effect on flow characteristics. Recent research by Ma et al. showed that the radially layered composite packed model (constructed of two kinds of particles with different particle sizes) has obvious inhibition on the wall effect [41]. However, less attention has been paid to the dynamic evolution of randomly mixed packing structures and its effects on the wall effect and channel flow phenomena in a binary composite packed bed.
In this work, a random stacking method that can reduce the wall effect and the inhomogeneity of fluid flow by adjusting the binary composite packing layer with different mass ratio between particles in two size ranges was carried out. Compared with other filling structures, this method has the advantages of simple operation and high practicability. Different composite packing structures of fixed beds were constructed using the DEM method. Further, the accuracy of the constructed structure was verified by comparing the porosity and fractal dimension of the stacking model with the experimental data obtained by the CT technique. The effects of the mass ratio between particles in different size ranges on the flow characteristics and wall effect were considered, and the calculated pressure drop was compared with the Ergun results to verify the accuracy of the flow field. By combining the flow characteristics with temperature distributions in different packed beds, the optimal stacking structure was chosen, which is useful for the design and optimization of fixed bed reactors.

2. Model Description

2.1. Mathematical Model

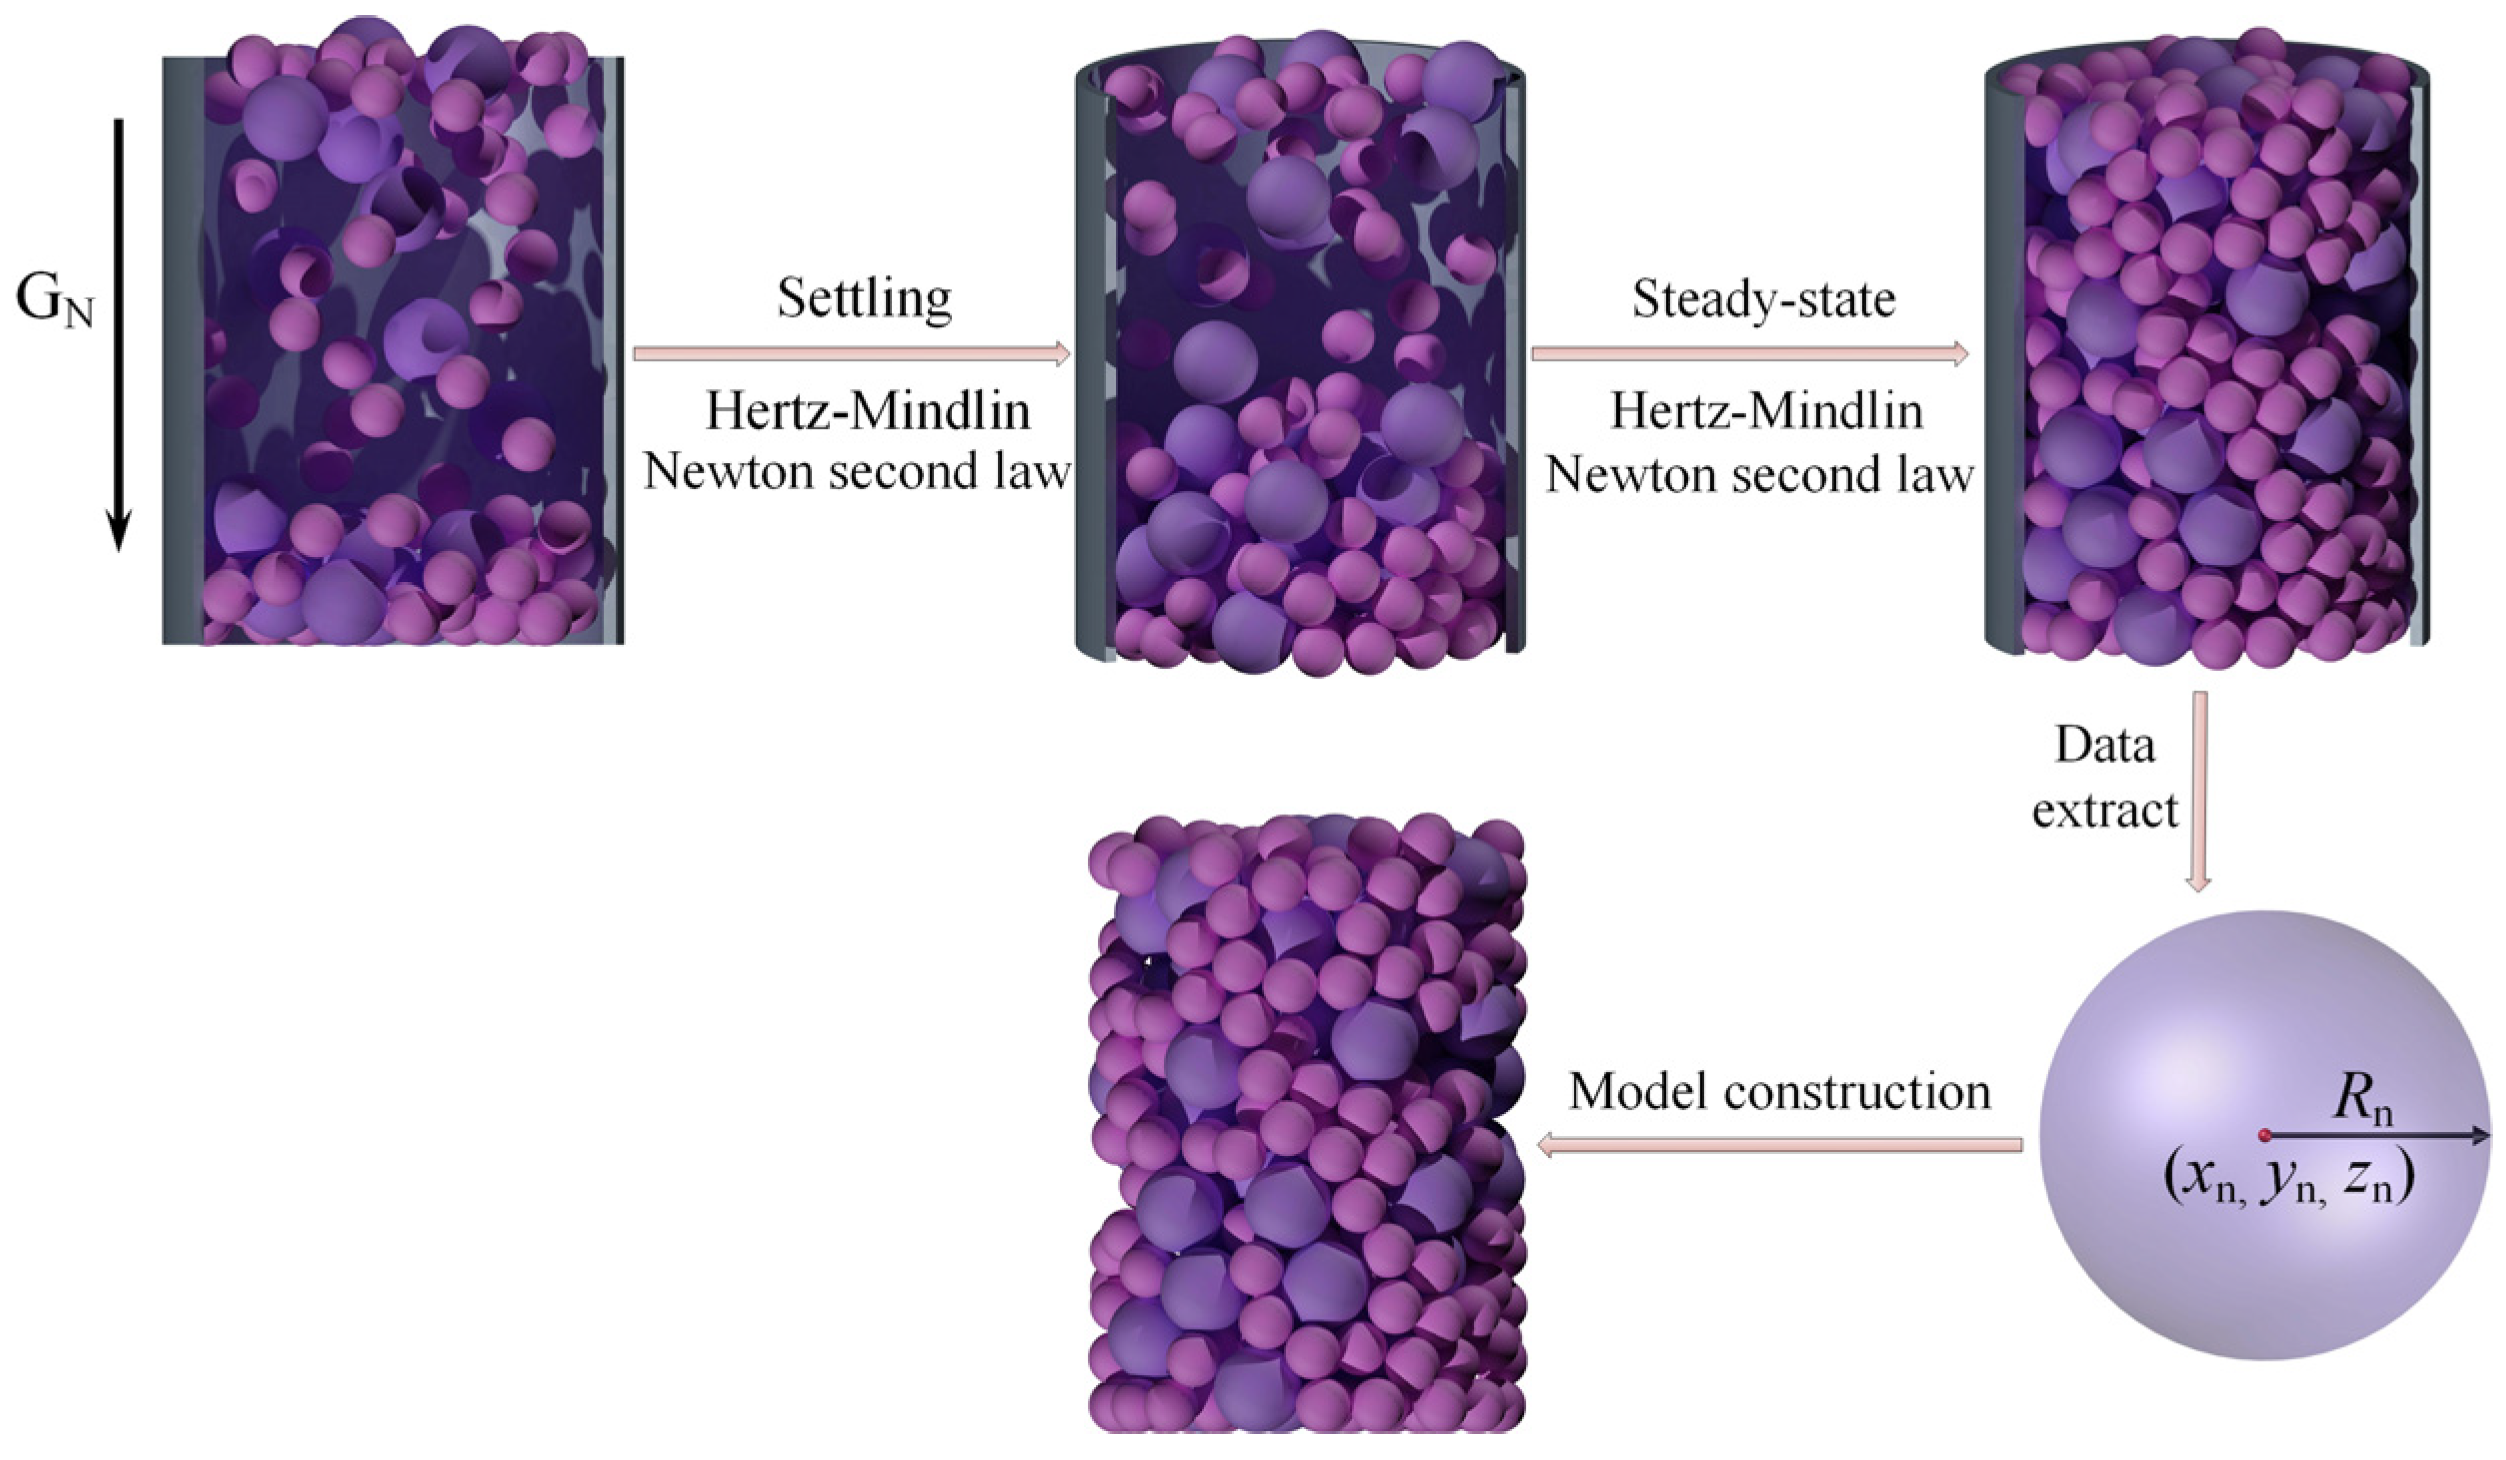
2.1.1. Discrete Element Method

The discrete element method regards each particle as an independent individual unit and tracks each unit. According to the contact model between particles and Newton’s second law, the forces and displacements of all cells were determined, updating the position of each particle cell. The free-falling motion without the influence of air resistance was used in this work for the accumulation of particles, and only the effect of gravity and contact force on the system was considered. The particle translation equation and rotation equation are given as [42]
m i d v i d t =   m i g +   j ( F n i j +   F t i j )
I i d ω i d t = j ( M s i j +   M r i j )
where mi and Ii are the mass and moment of inertia of particle i, respectively. Vi and wi are the velocity and angular velocity of particle i, and g is the acceleration of gravity. Fnij and Ftij are the tangential force and normal contact force between particles i and j, respectively. Msij and Mrij are the tangential contact torque and rolling friction torque generated by particle j to particle i, respectively.
The contact forces between particles and the contact forces between particles and walls can be calculated using the Hertz–Mindlin (no slip) soft-sphere contact model. The solution formulas of the regular contact force Fnij and tangential contact force Ftij between particles are given as
F n j = k n δ n 3 / 2 + C n v i j n i j n i j
F t i j = min ( μ s F nij , k t δ t + C t v i j t i j ) t i j
k n = 4 3 1 ν i 2 E i + 1 ν j 2 E j 1 r i + r j r i r j 1 / 2
k t = 8 δ n 1 / 2 1 ν i 2 G i + 1 ν j 2 G j 1 r i + r j r i r j 1 / 2
where kn and Cn are the normal elastic and damping coefficients of particle i, respectively. δn is the normal overlap quantity, vij is the velocity of particle i relative to particle j, μs is the static friction coefficient and kt and Ct are the tangential elastic coefficient and damping coefficient of particle i, respectively. Ei and Ej are the elastic modulus of particle i and particle j, respectively, and νi and νj are the Poisson’s ratio of particle i and particle j, respectively. Gi and Gj are the shear modulus of particle i and particle j, respectively. Ri and rj are the radius of particles i and j contacting each other.

2.1.2. Computational Fluid Mechanics

For gas flow in porous packed bed with gas–solid interaction, the flow gas can be regarded as incompressible [43]. The continuity, momentum, and energy conservation equations are as follows.
The continuity equation is expressed as
ρ t + ( ρ u ) = 0
The momentum conservation equation is given by
( ρ u ) t + ( ρ u u ) = p + ( τ ) + ρ g + f
The energy conservation equation is given by
( ρ E ) t + ( u ( ρ E + p ) ) = k eff T j h j J j + τ eff u + S h
where ρ and u are the fluid density and fluid velocity, respectively. p is the static pressure. t and f represent time and other external volume forces, respectively. τ is the viscous stress tensor. E denotes the sum of internal energy and kinetic energy. keff and Sh represent the effective thermal conductivity and heat source term, respectively. hj and Jj represent the enthalpy and diffusion flux of component j, respectively.

2.2. Composite Packed Beds and Numerical Methods

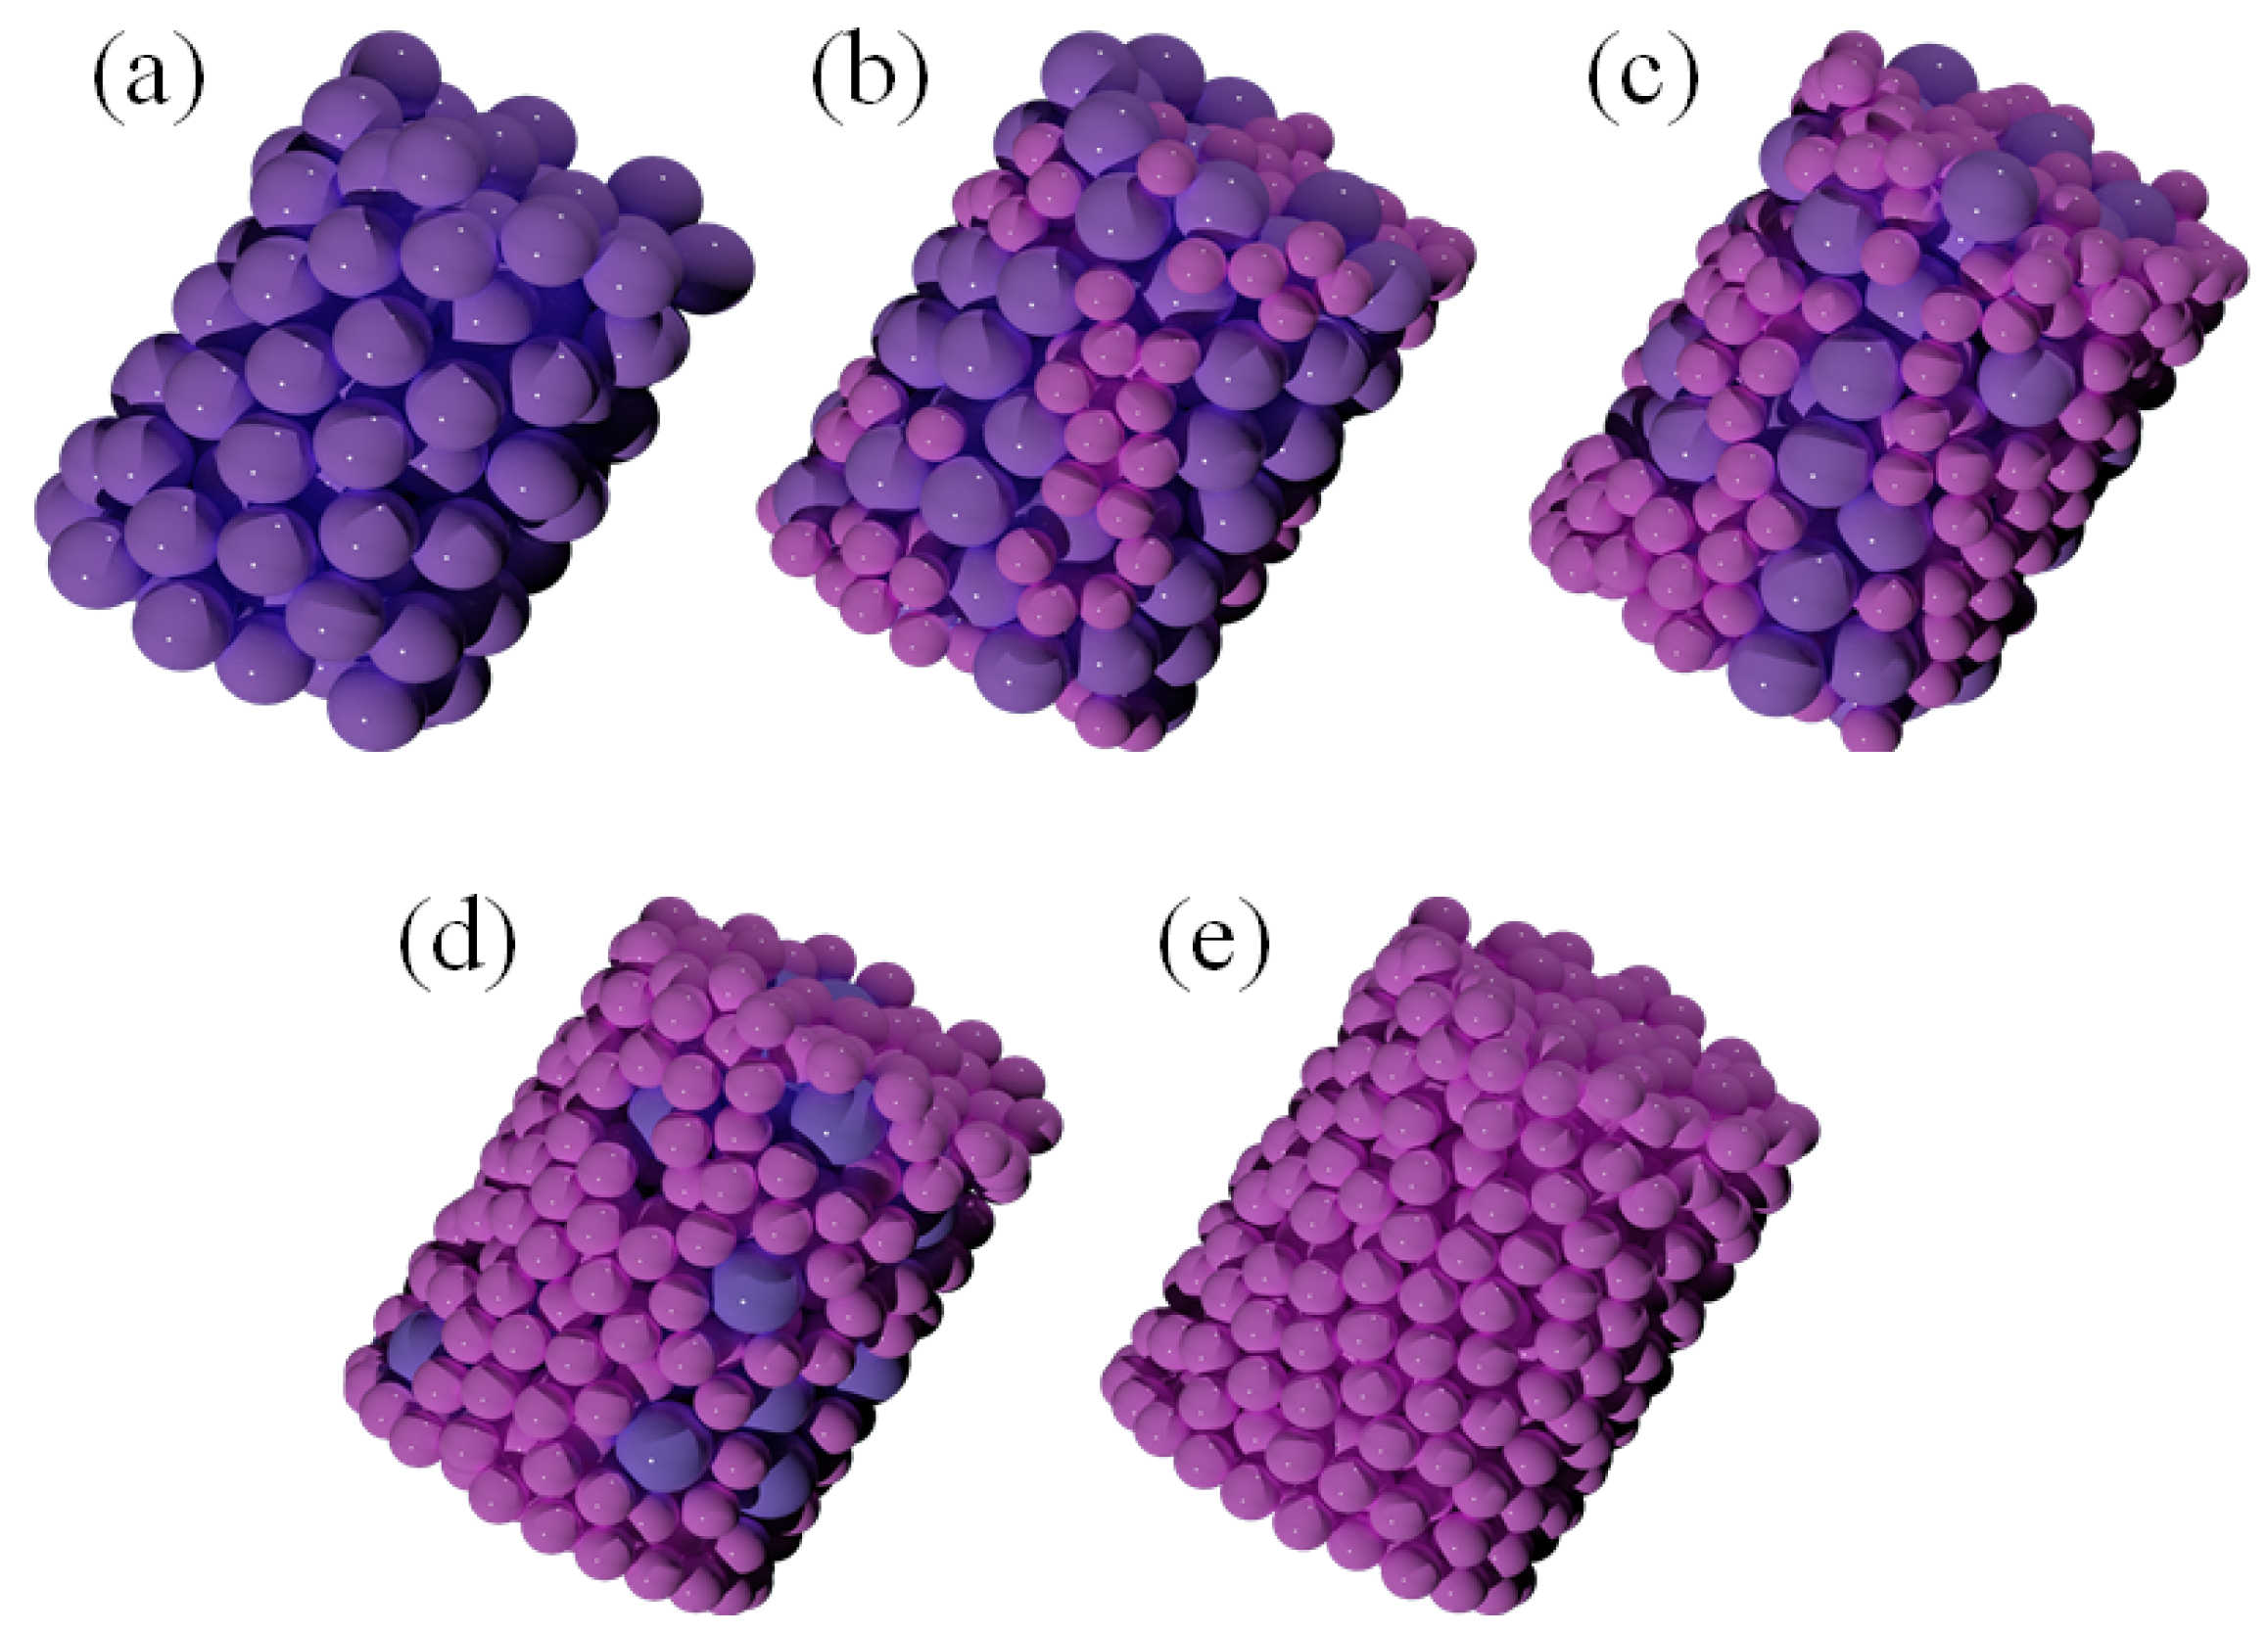
2.2.1. Composite Packed Beds

A series of mixed packed beds of binary-sized particles were generated using the DEM method. A typical particle filling process of the packed bed with a mass ratio of 1:1 between particles in two size ranges is shown in Figure 1, after setting the particle properties in the EDEM software. First, a certain mass of binary-sized particles was generated at the top of the bed, which will fall to the bottom of the bed under the action of gravity (GN) and other external forces, as shown in Figure 1. During this period, the state of the particles changed continuously due to the particle–particle and particle–wall interactions. Using the Hertz–Mindlin (no slip) model and Newton’s second law, the force and displacement of all particles in each time step can be calculated, and the position of the particles can be updated accordingly. When the number and relative position of the particles remains stable, it can be considered that the packing process reaches a steady state. The Cartesian coordinate system of the particles and the radius (Rn) of the particles were extracted for the construction of the composite packed bed. Then, the model was imported into ANSYS fluent 16.0 for the next flow field calculation. The key input parameters for both the DEM model and the CFD simulation are listed in Table 1 and Table 2.
The structural features of different stacking models can be seen in Figure 2. The packing height (L) and diameter (D) of the constructed cylindrical beds are all consistent. For the binary particles, the diameter of larger particles (db) is 0.004 m, and the diameter of small particles (ds) is 0.0025 m. According to the mass ratio (1:0, 3:1, 1:1, 1:3 and 0:1) between the binary particles (db/ds), the constructed five stacking models were denoted as b100, b75s25, b50s50, b25s75 and s100, respectively. The corresponding equivalent diameter ratio range is 5 ≤ D/d ≤ 8.

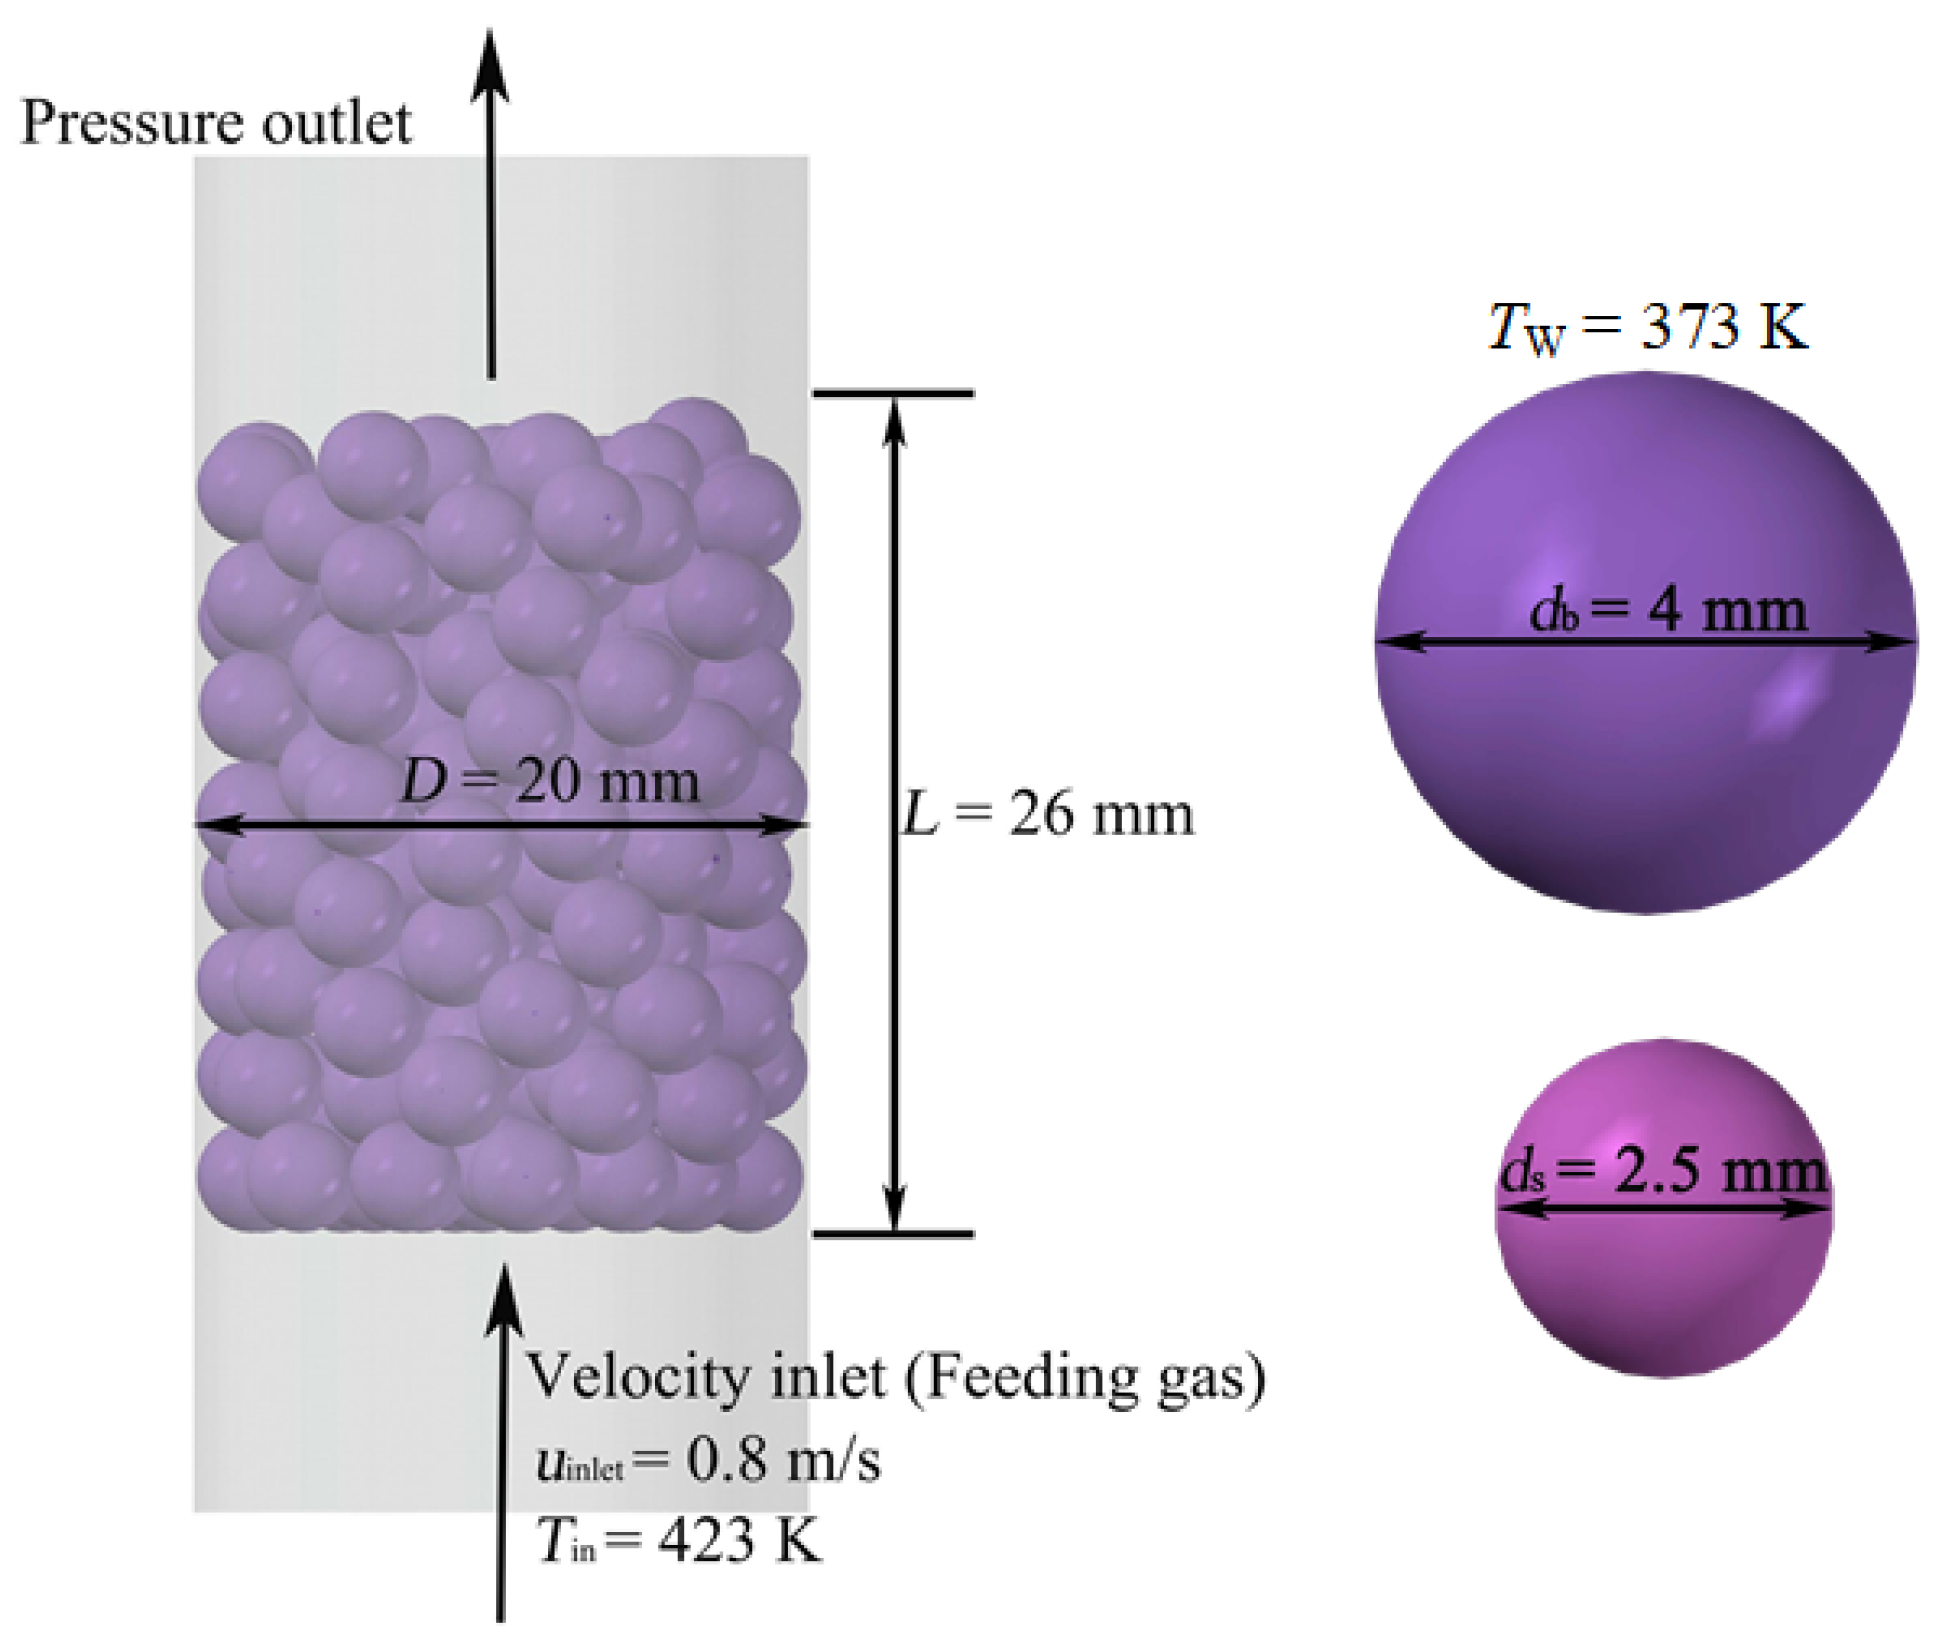
2.2.2. Boundary Condition and Numerical Calculation Method

Figure 3 presents the computational physical mode of the packed bed with gas–solid interaction. The height and diameter of the filling bed are L = 0.026 m and D = 0.02 m, respectively. The feeding gas flows through the cylindrical bed by forced convective from the bed inlet with a constant inlet temperature of Tin = 423 K, exchanging heat with the solid matrix. The average static pressure outlet boundary condition was used, and the outlet relative pressure was set to the same as the surrounding atmospheric pressure. The filling bed wall and particle surface were assigned as a nonslip, nonpermeable solid wall. The wall of the packed bed adopted adiabatic boundary conditions, and the particle surface was set to a constant wall temperature of Tw = 373 K. When the absolute residuals of all governing equations in the computational domain were less than 10−6 and the governing equations of the packed bed system were conserved, the iterative computation converged. The SIMPLE algorithm was adopted to solve the velocity and pressure coupling equations with a second-order upwind scheme.

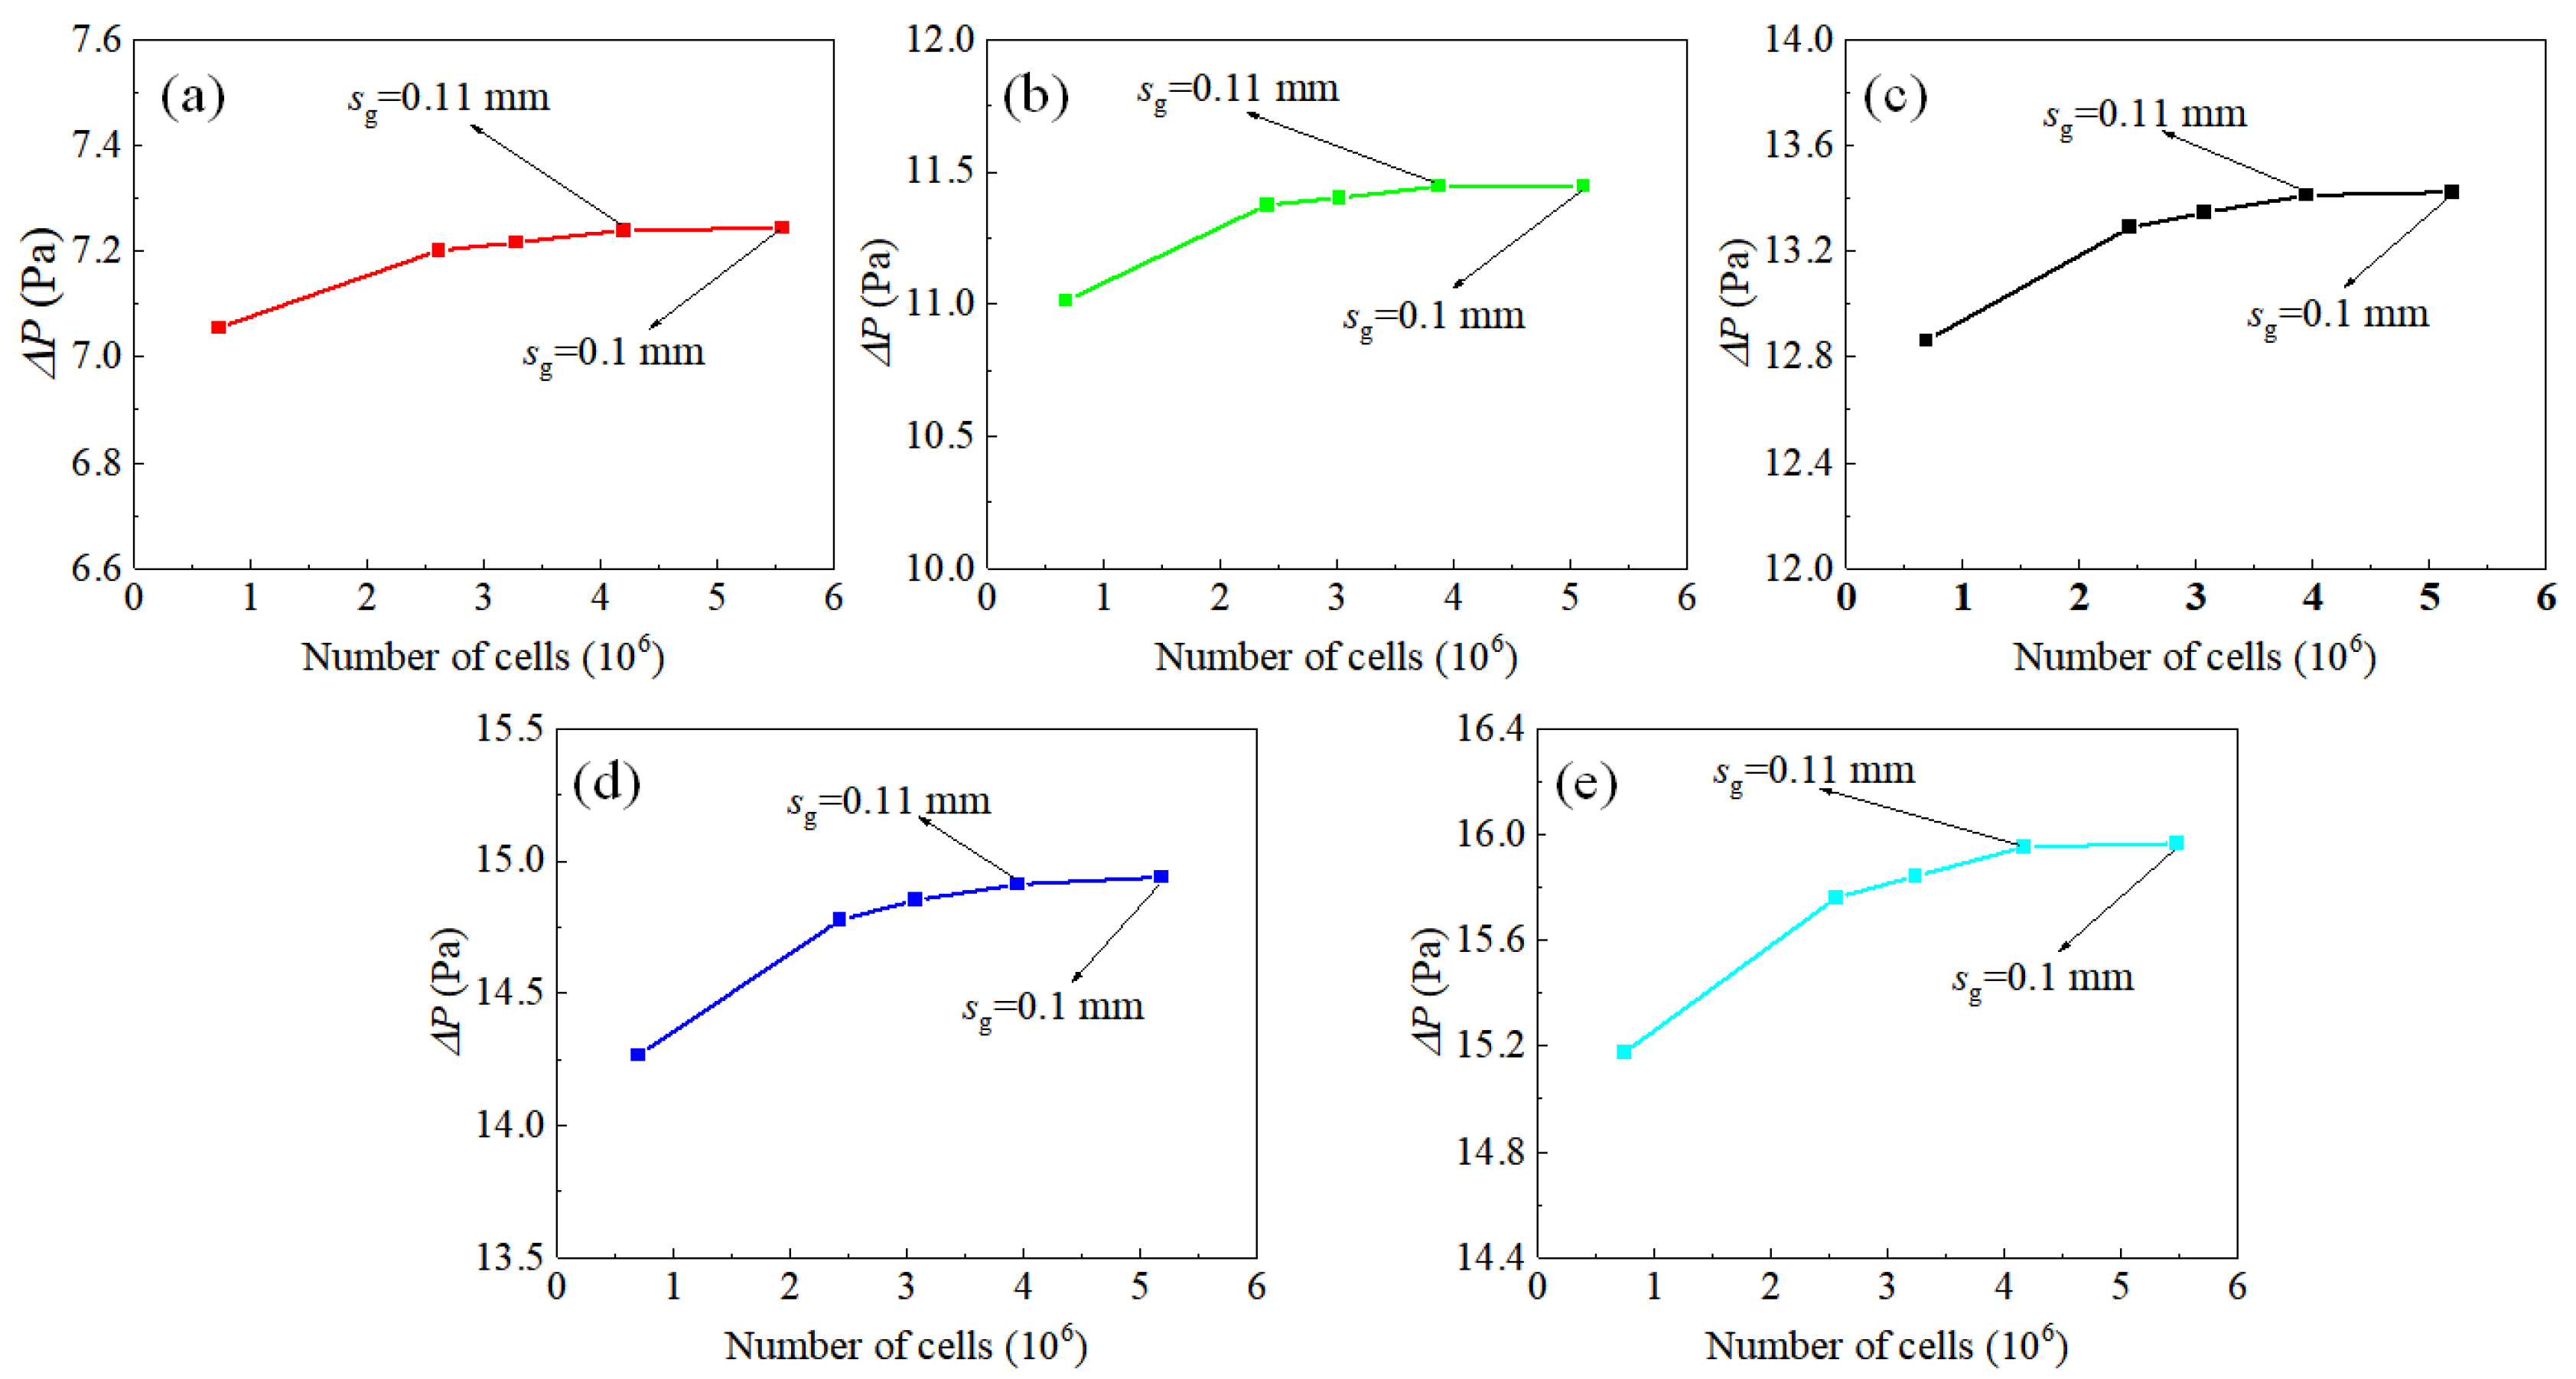
2.2.3. Grid Independence Test

In order to ensure the accuracy of the simulation results, the influence of different mesh sizes on the pressure drop in the five constructed packed beds was carefully evaluated at the inlet velocity of 0.3 m/s, as shown in Figure 4. The grid size (sg) was set to 0.2 mm, 0.13 mm, 0.12 mm, 0.11 mm and 0.1 mm, respectively, to verify the grid-independent simulation in the five stacking structures. It can be seen from Figure 4 that when the grid size is less than 0.11 mm, the simulated results of pressure drop in all five packing structures are basically stable, and the relative error between the simulated results with mesh sizes of 0.11 mm and 0.1 mm is less than 0.5%. Considering the simulation accuracy and computer time consumption, the grid size of 0.11 mm was selected for meshing. When the mesh size is 0.11 mm, the number of grids of the five groups of stacking models is 4.195 million (b100), 3.876 million (b25s75), 3.948 million (b50s50), 3.946 million (b25s75) and 4.168 million (s100), respectively.

3. Model Verification

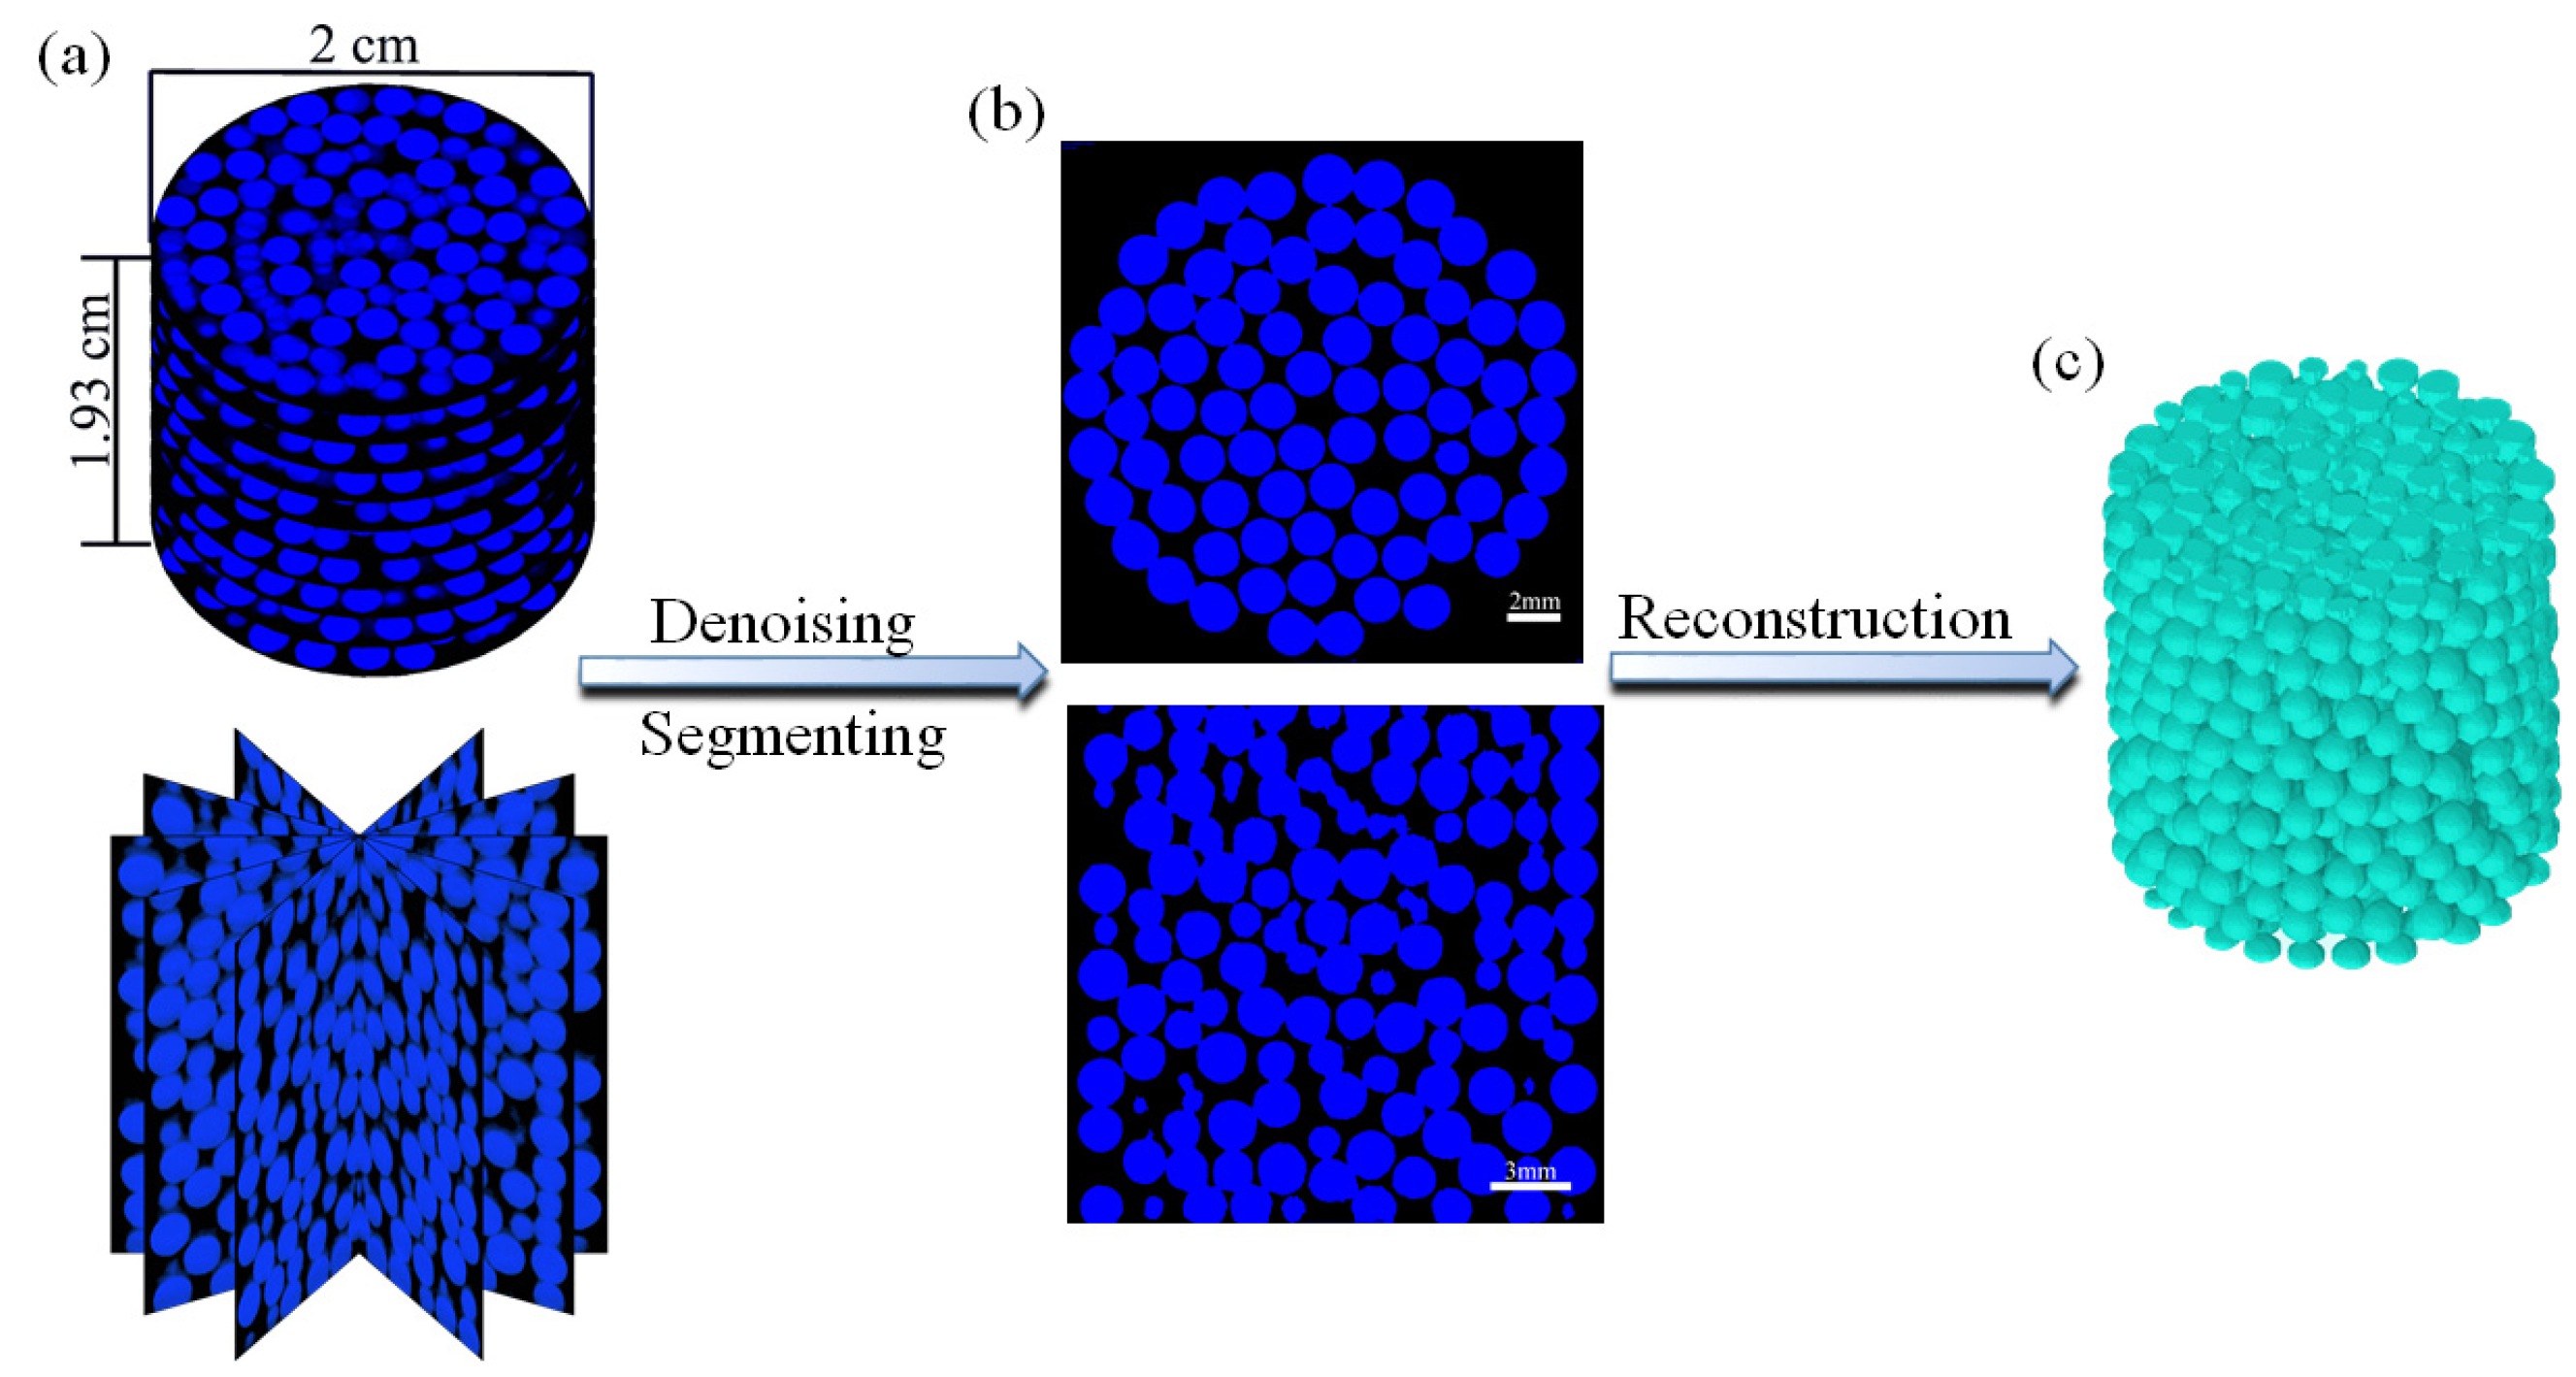
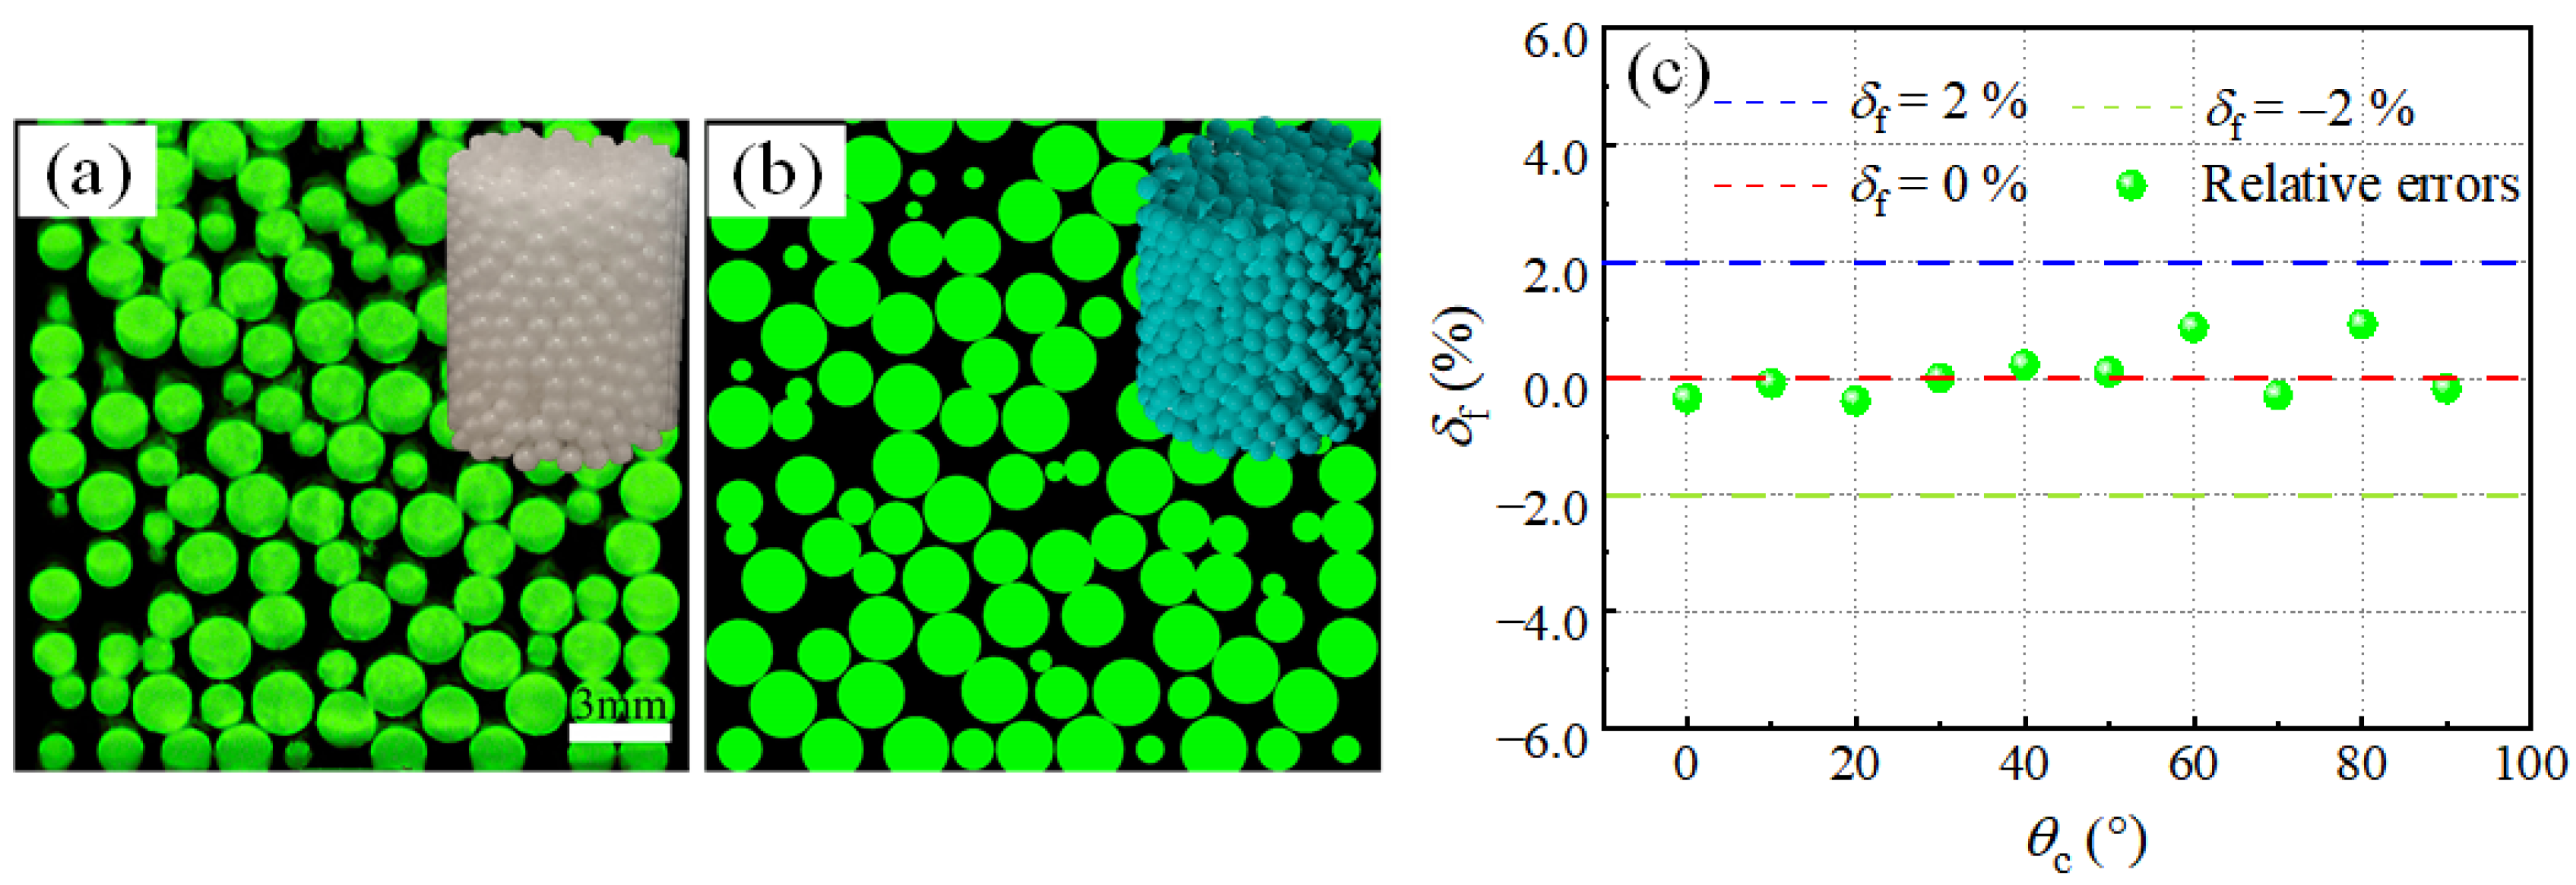
3.1. Experimental Verification

It was necessary to verify the constructed packing structure based on DEM. Under the conditions of the constant diameter ratio of D/d of 10, a cylindrical packed bed (D = 2 cm) formed by randomly stacking zirconia particles (d = 0.2 cm) was constructed in this study, and its structural characteristics were tested by using X-ray tomography technology. The local area of the tested packed bed was intercepted for tomography. A total of 198 grayscale images were acquired (resolution 10.1 μm). As shown in Figure 5a, the black and blue parts of the image represent pores and particles, respectively. After denoising and segmenting (see Figure 5b), a three-dimensional model of the tested packed bed was reconstructed as shown in Figure 5c. Then, the experimental data of the structural characteristics of the packed bed can be obtained.
Under the same packing conditions as the CT test, a randomly packed bed was achieved using the DEM method shown in Figure 6a. The extracted pore model of the filler structure can be seen in Figure 6b. Radial porosity was characterized as a structural property of the packing system with values ranging from 0 to 1. The radial pore structure model (Figure 6c) was obtained by Boolean operations using spherical particles and radial annular cylindrical layers. The distribution of radial porosity (εr) can be obtained by calculating the percentage of pores in each radial annular cylindrical layer. The calculation formula is as follows:
ε r = V void , r V total , r
where Vtotal,r is the total volume of the radial annular cylindrical layer. Vvoid,r is the void volume of the radial annular cylindrical layer.
The data calculated by the above equation were compared with the radial porosity distribution calculated using the Mueller and de Klerk empirical formulas [44,45]. The relative error δεr between the two was calculated by the following formula:
δ ε r = ε rm ε rd ε rm
where εrm is the radial porosity distribution calculated by Ergun, and εrd is the radial porosity distribution of the DEM stacking structure.
As shown in Figure 7, the simulation results of the radial porosity distribution of the model are in good agreement with the de Klerk empirical formula, with a maximum relative error of only 6.757%.
Further, comparisons were made between the extracted average porosity (εzc) at different axial sections based on the scanned images and the corresponding calculated average porosity (εzd) based on DEM, and the relative errors (δεz) obtained at different dimensionless heights of the packed bed are shown in Figure 8a. It can be seen from Figure 8a that the maximum relative error is less than 7.55% (corresponding to the axial section of the dimensionless height Z/L = 0.24). In addition, a comparison of the average porosity at different radial sections between the CT results and the DEM model is made in Figure 8b. It can be observed from Figure 8b that the relative error (δθ) of the two is smaller. The maximum relative error (δθ,max) between the two groups of porosity (εd) at different radial sections is less than 10%, indicating the constructed packing structure based on DEM is in good agreement with the practical randomly stacking structure. δεz and δθ are obtained from the following equations:
δ ε z = ε zc ε zd ε zc
δ θ = ε θ c ε θ d ε θ c
where εzc and εzd are the cross-sectional porosities at different heights for the realized stacking model and DEM stacking model, respectively. εθc and εθd are the cross-sectional porosities at different rotation angles (θc) for the realized stacking model and DEM stacking model, respectively.
The fractal dimension (Df) can also characterize the pore structure and complexity of porous media [46]. To compare the fractal dimensions of stacked model images and CT images, it is necessary to consider the color patterns of the images and convert the two sets of images into binary images, in which the grayscale has only two possible values (0 or 1). By adjusting the grayscale of the pixel point of pores to 0, the color of pores becomes black. A series of grids with side length (s) were divided in the image, after which the number of grids (N) containing pixels with a gray value of 0 was counted. The fractal dimension of the pores was calculated with the following equation [47]:
D f = lim s 0 lg N ( s ) lg ( 1 / s )
Then, the fractal dimension of the pore structure obtained from experiments and simulations can be compared to verify the complexity of the stacking structure. Figure 9a,b show the cross-sectional images obtained from the CT result and DEM model, respectively. To verify the credibility of the calculated results, the relative error between the two δf was calculated using the following formula:
δ f = D fc D fd D fc
where Dfc and Dfd are the fractal dimensions of the CT images and the cross-section images of the DEM model, respectively.
The relative error between the two groups of pore fractal dimension (δf) at different rotational sections was calculated and is presented in Figure 9c, and the maximum value is less than 1%. This shows that the packed structure constructed using DEM has similar complexity and fractal structure to the practical randomly stacking structure of particles.

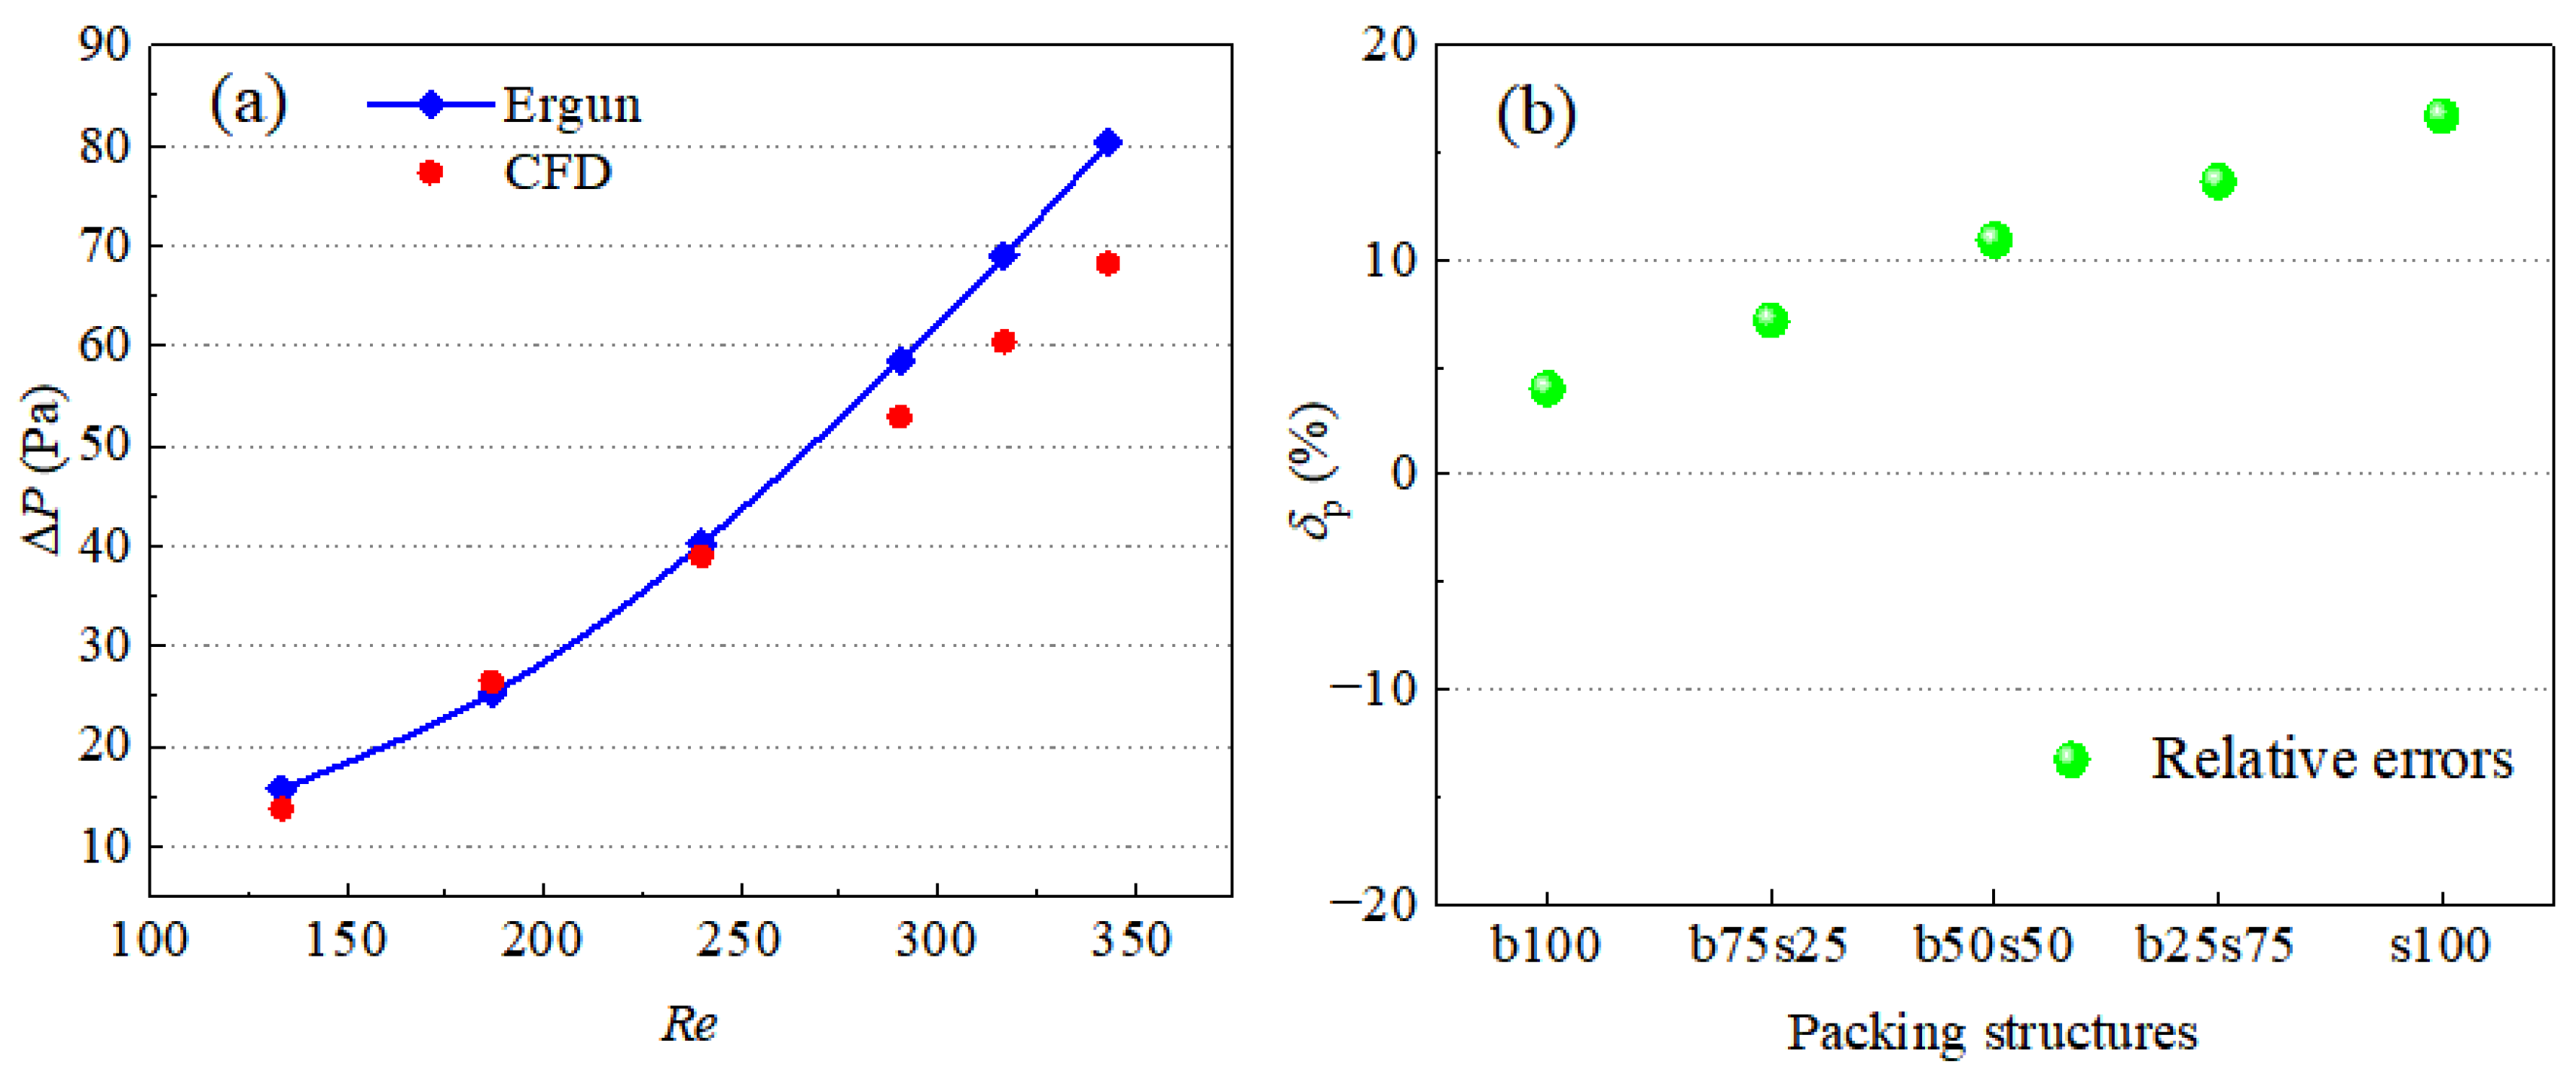
3.2. Verification of Pressure Drop

In this work, the Ergun equation was used to verify the simulated pressure drop in a packed bed [48], which is generally accepted and commonly used with CFD results.
The comparison is defined as follows:
Δ P L = 150 μ ( 1 ε ) 2 ε 3 u d 2 + 1.75 ρ ( 1 ε ) ε 3 u 2 d
The formula for the relative error of pressure drop δp is defined as
δ p = Δ P E Δ P F Δ P E
The particle Reynolds number is defined as [31]
R e = ρ u d μ
where ΔP represents the pressure drop in a packed bed. u and µ are the velocity and viscosity of the fluid, respectively. d is the diameter of the particle. ΔPE and ΔPF are the pressure drops calculated by the Ergun equation and CFD, respectively.
To verify the stability of the packing model under different Reynolds numbers (Re), a comparison of the pressure drop (ΔP) in packed bed b100 was made for the results obtained from the DEM-CFD model and the Ergun equation, respectively, as shown in Figure 10a. It can be seen from Figure 10a that the two groups of data are in good agreement. However, the difference between the CFD results and the Ergun results increases as the Reynolds number exceeds 301.3, and the maximum relative error between the two groups of results reaches 14.9% at Re = 356.1. In addition, under the same inlet velocity (uinlet = 0.8 m/s), the effect of packing structure characteristics (b100, b75s25, b50s50, b25s75 and s100) on the relative error of the pressure drop between the simulated results based on the DEM-CFD model and the data calculated by the Ergun equation is presented in Figure 10b. As can be seen from Figure 10b, all the relative errors for the five packing beds are within 17.0%, indicating the simulated results obtained from the five groups of filler models are reliable.

4. Results and Discussion

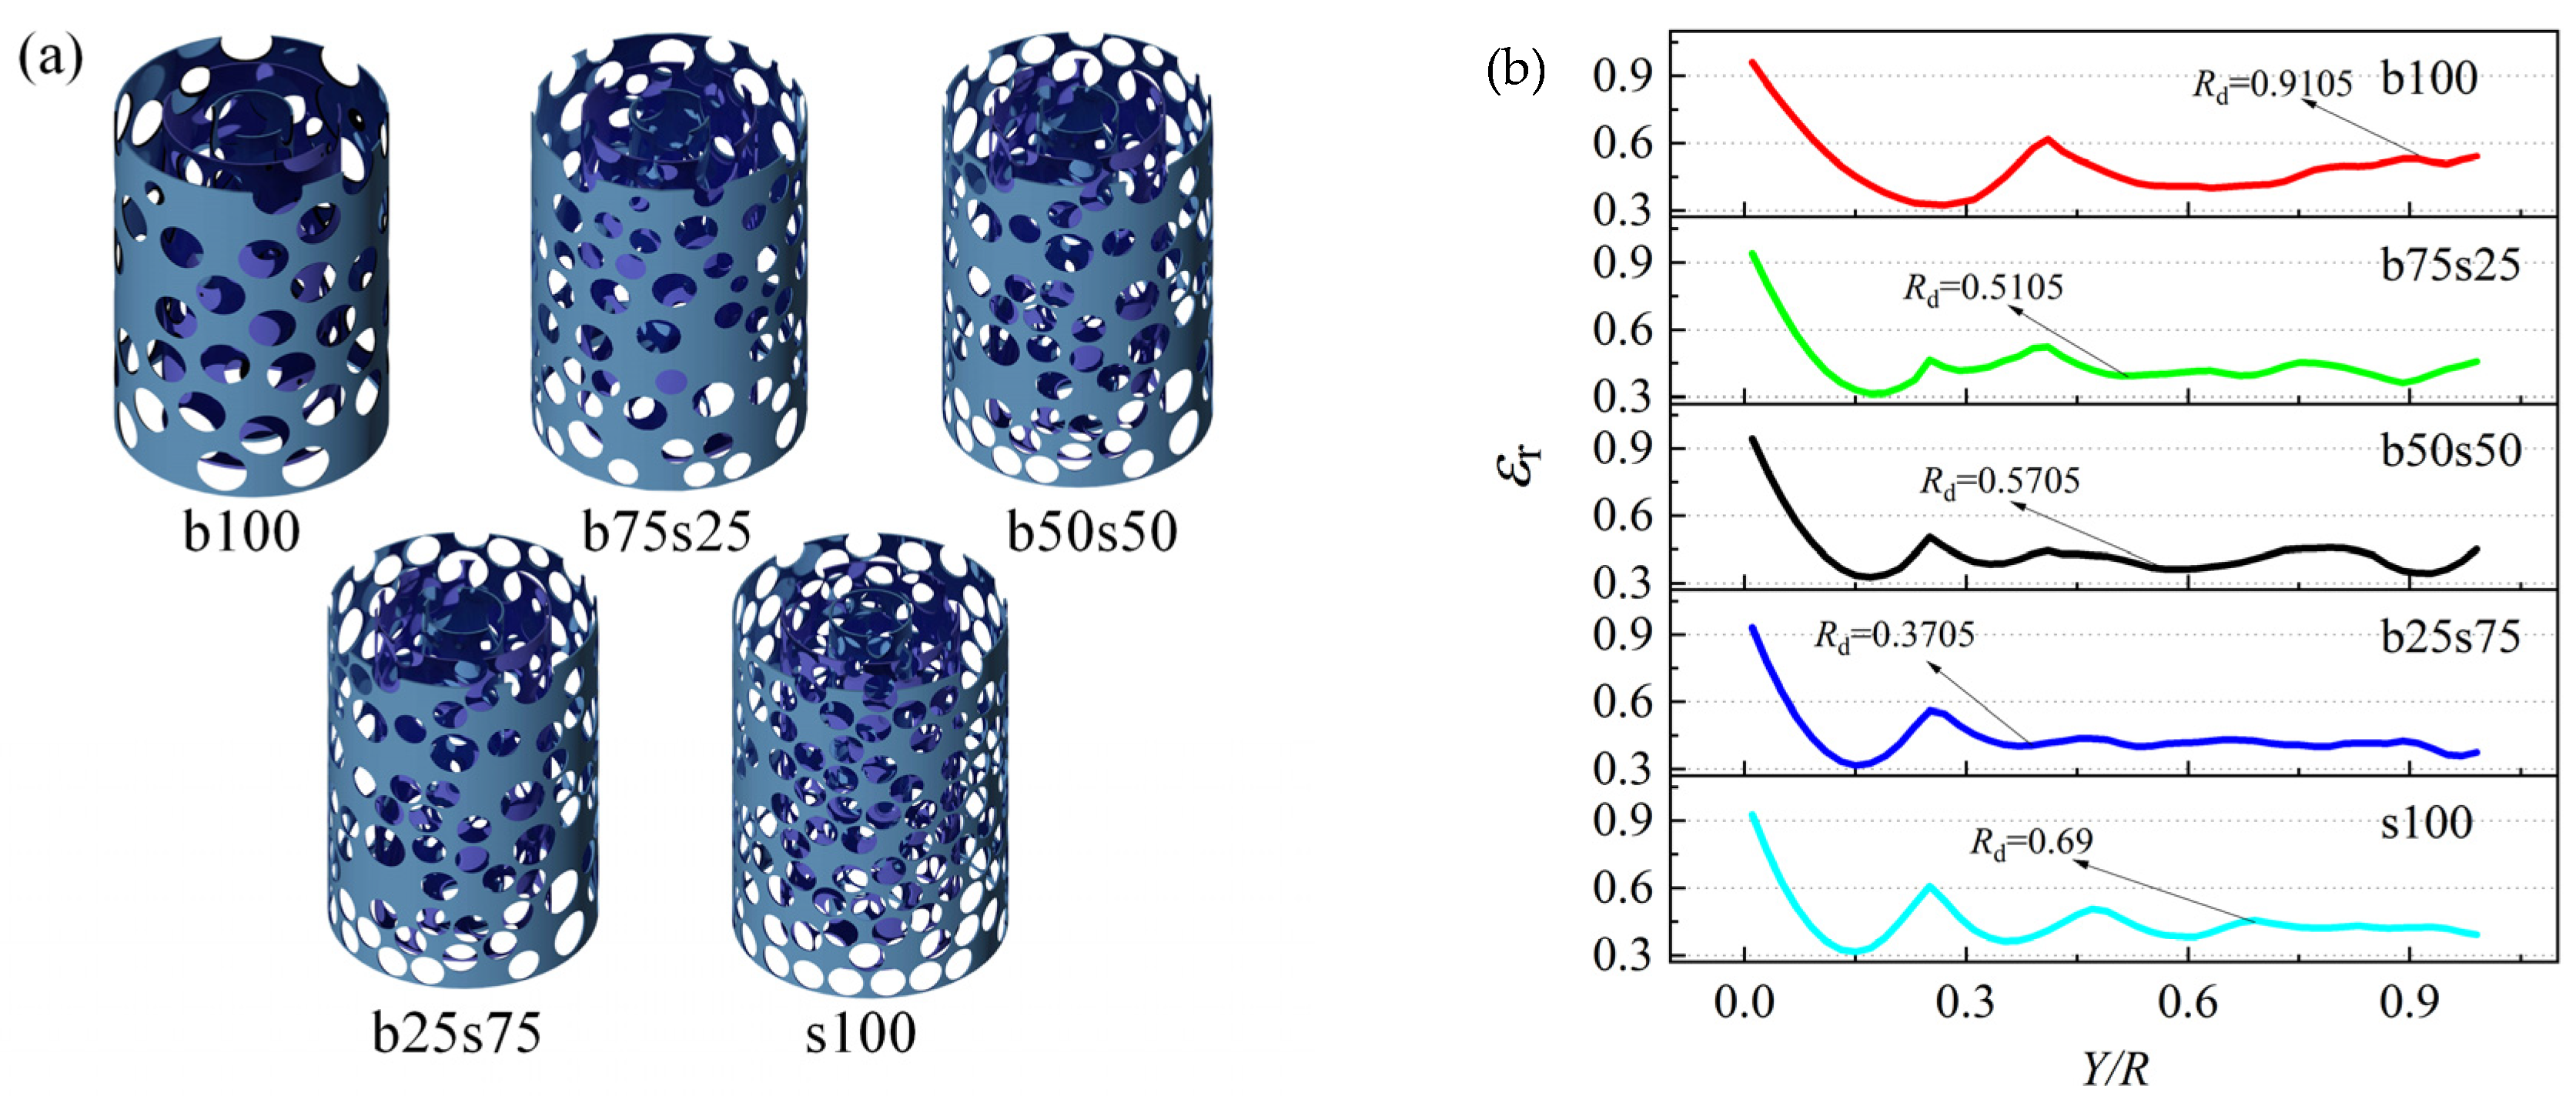
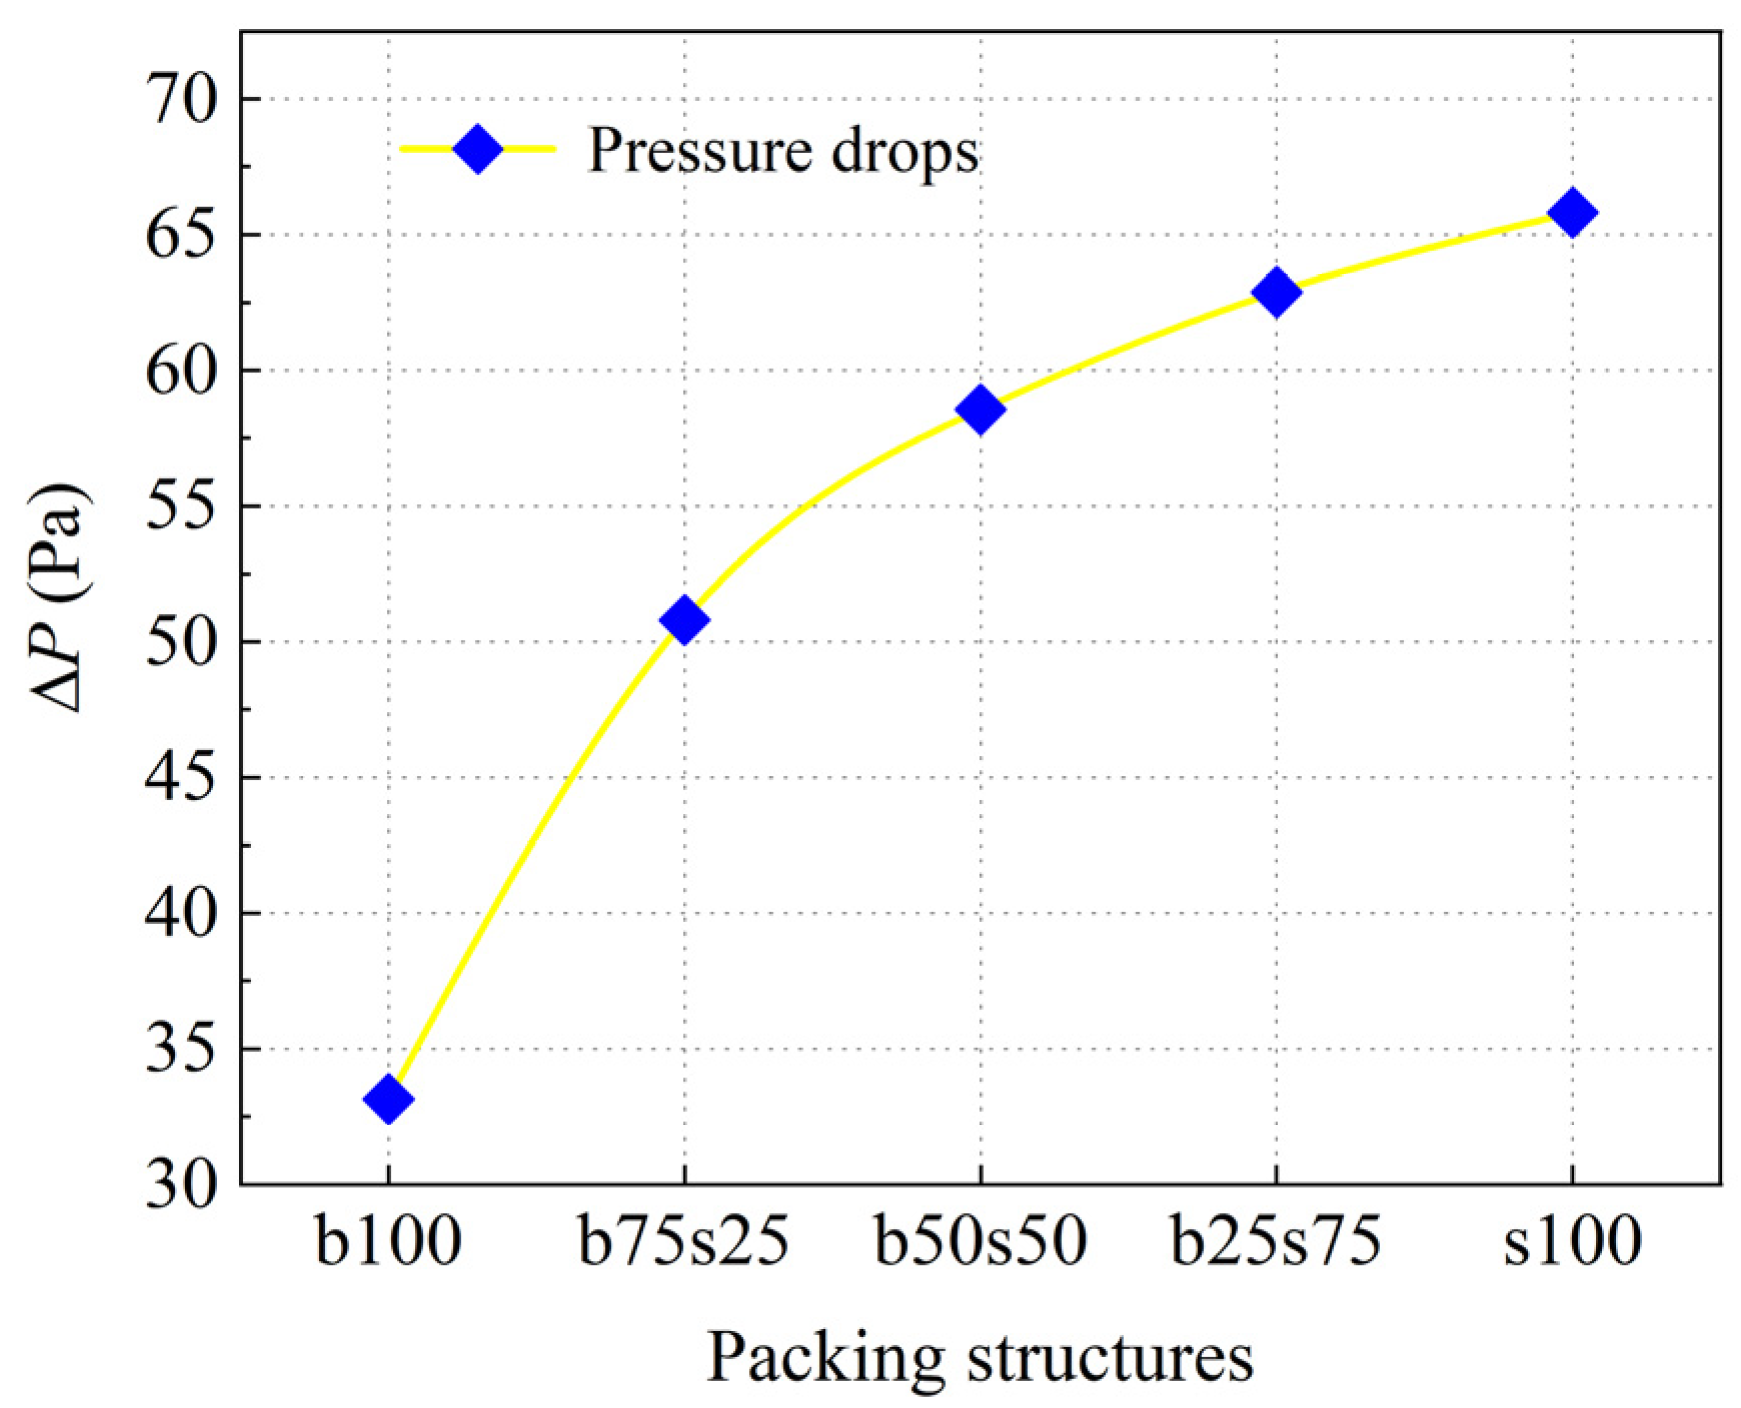
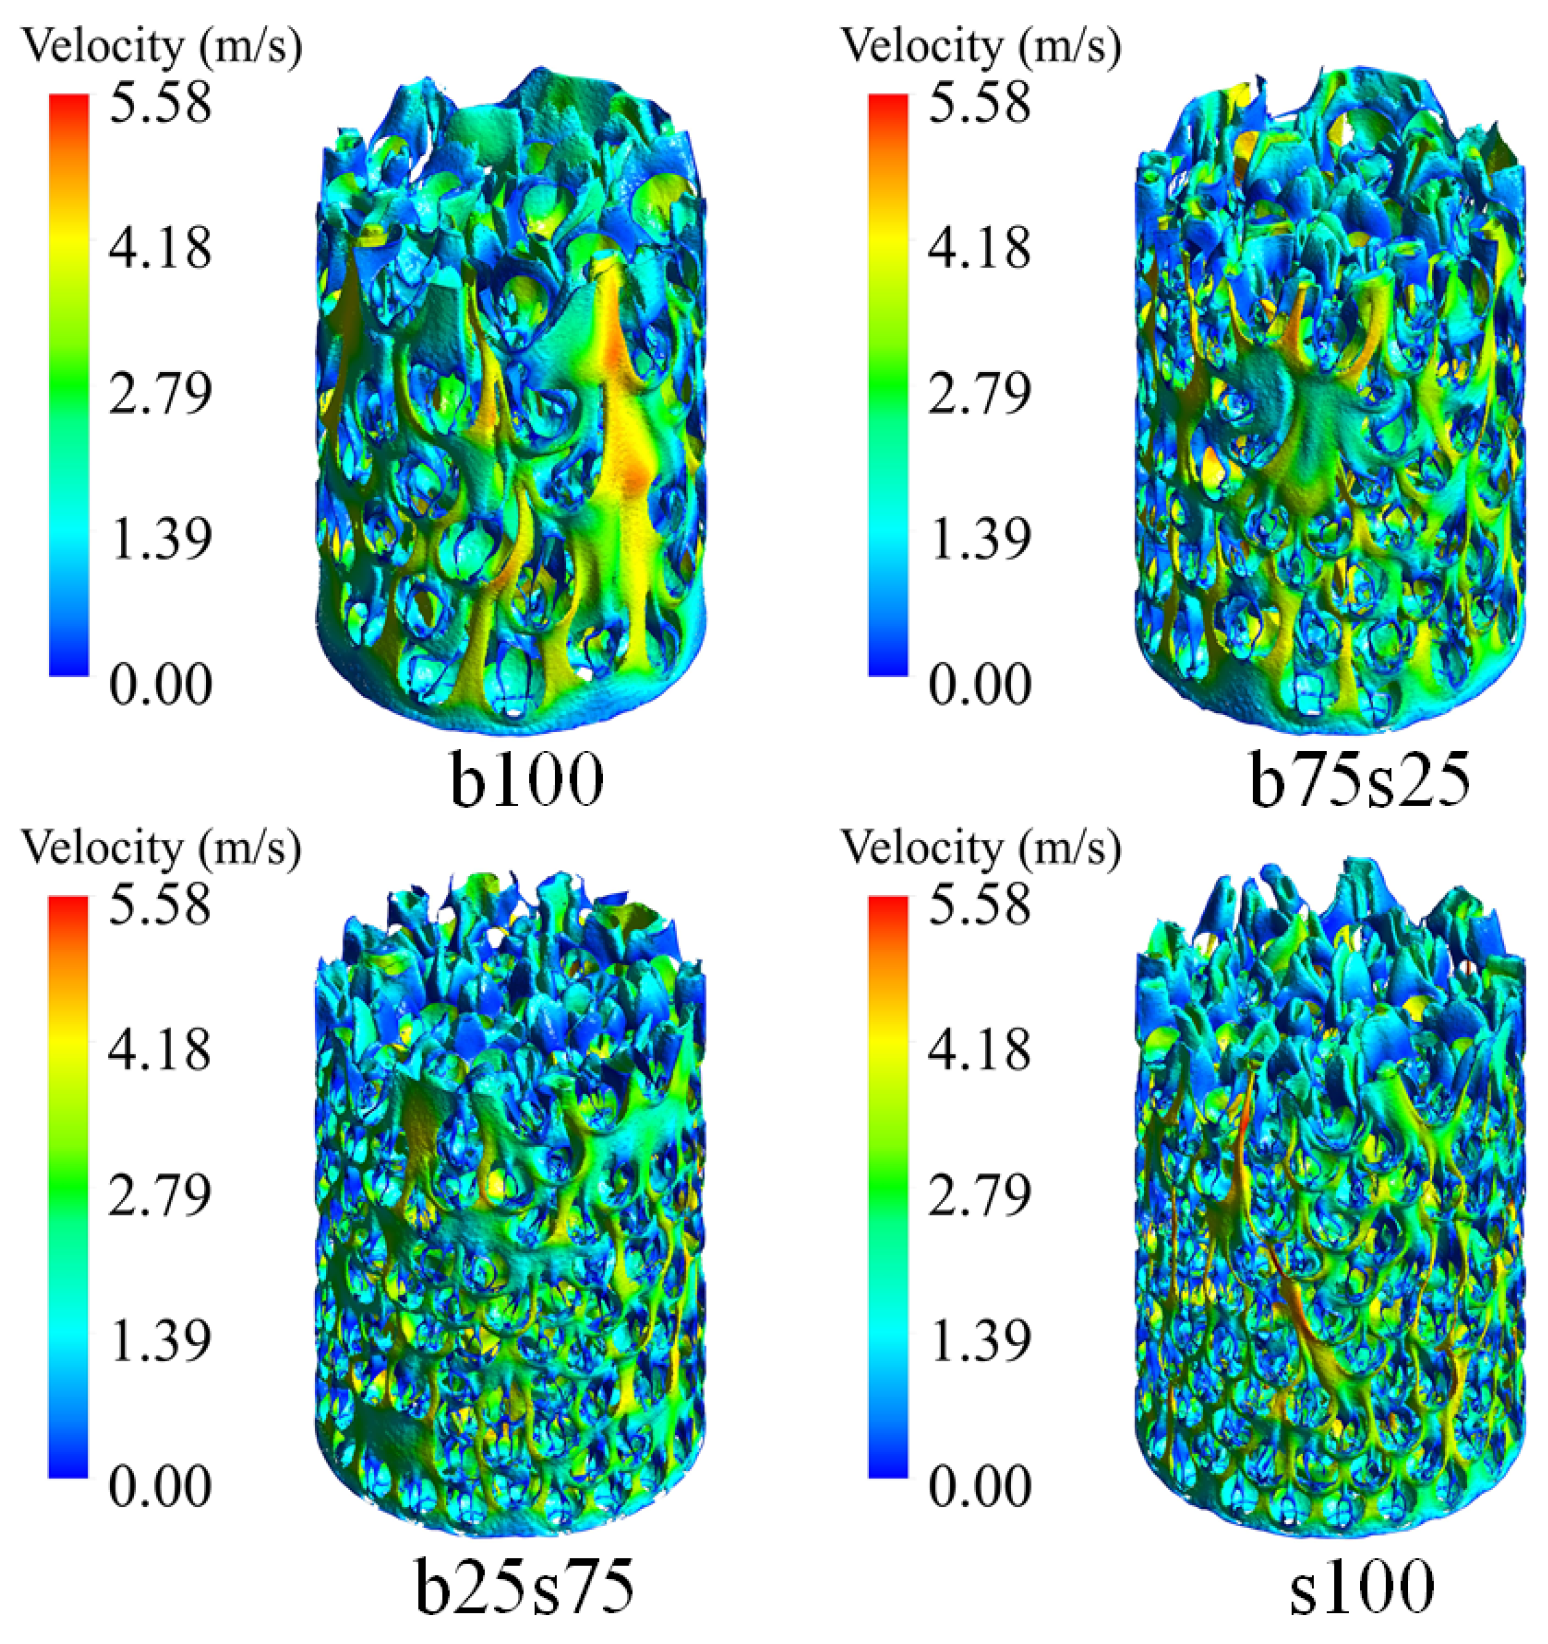
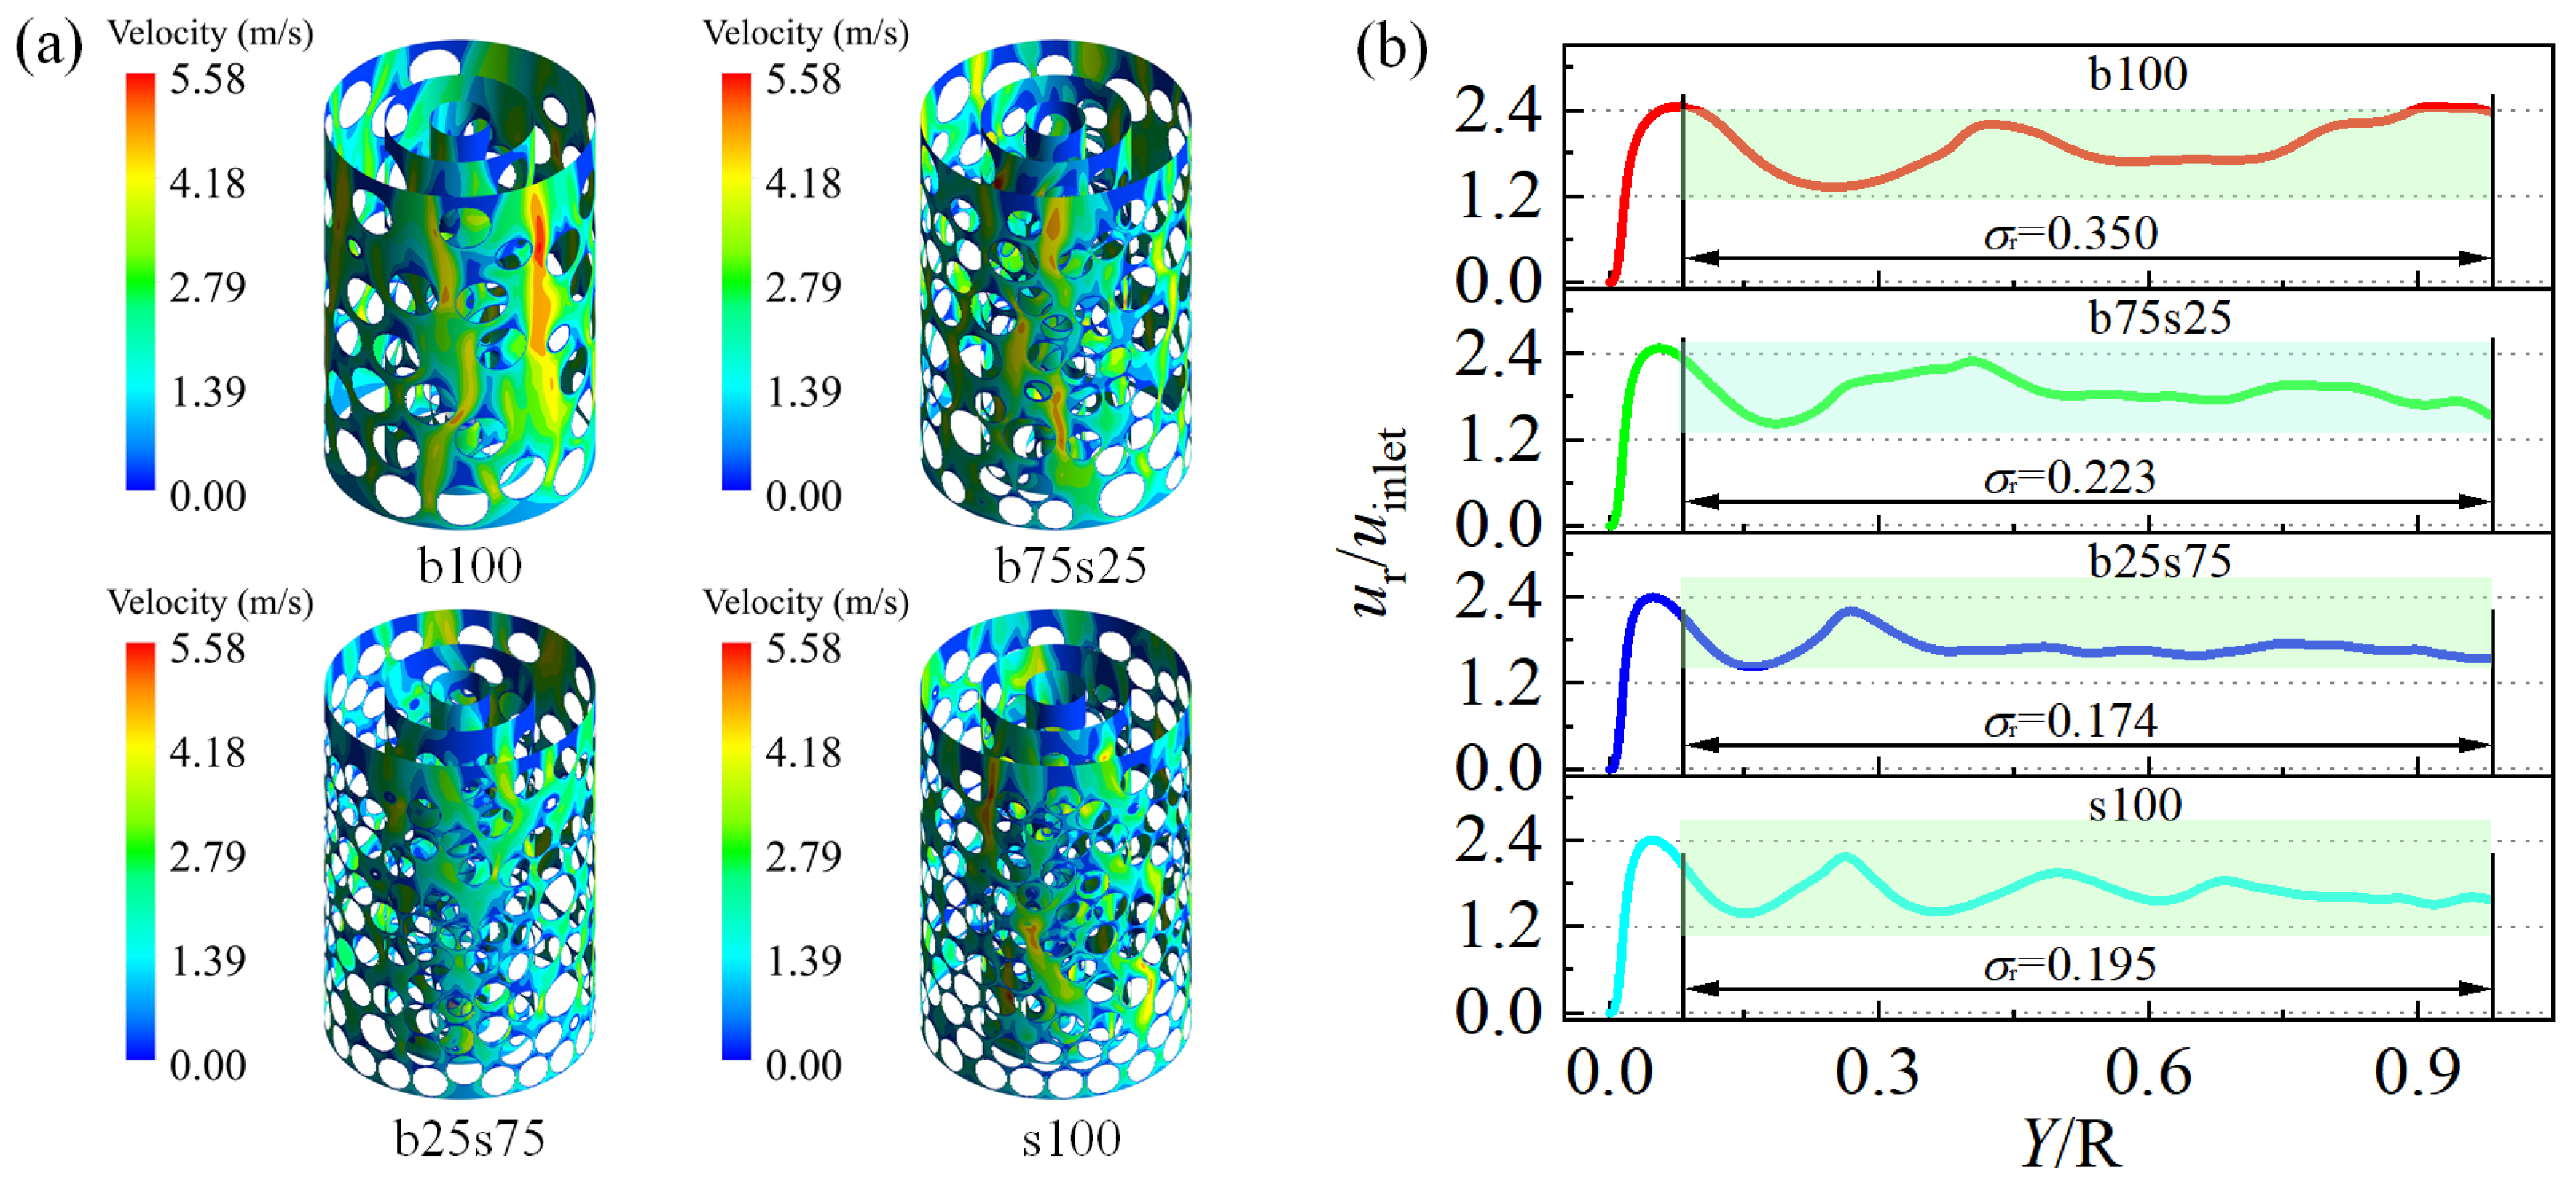
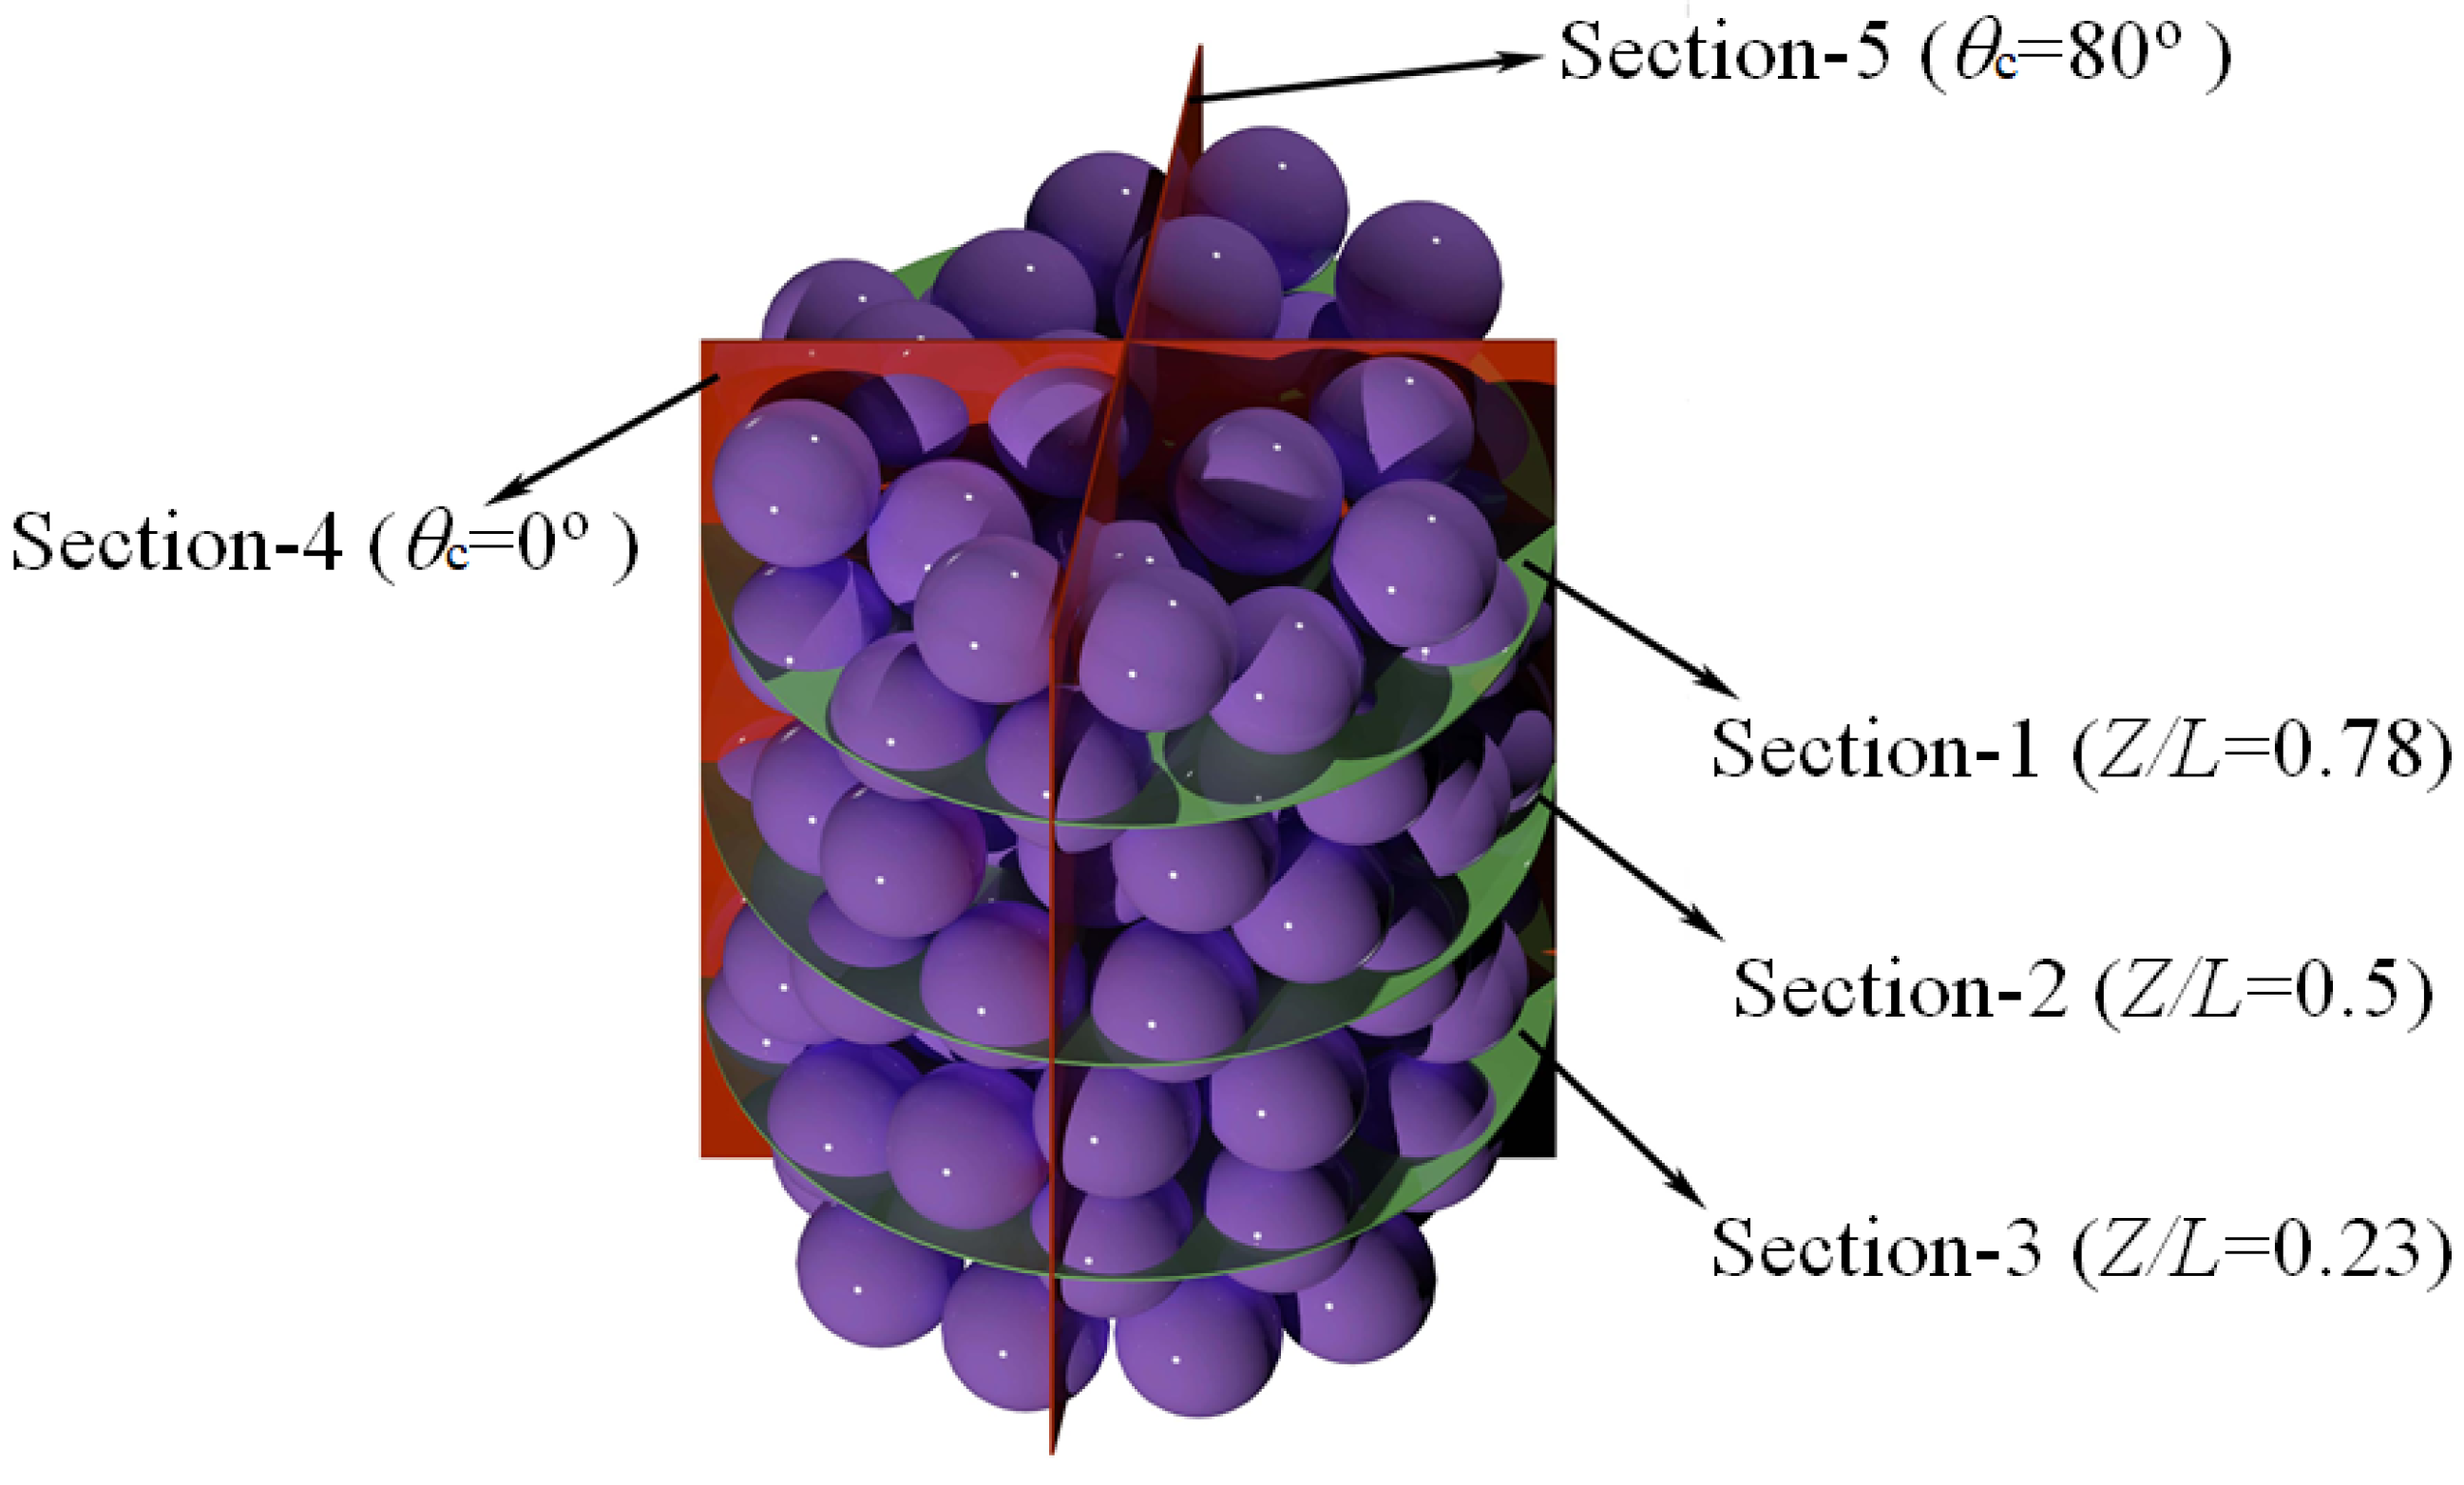
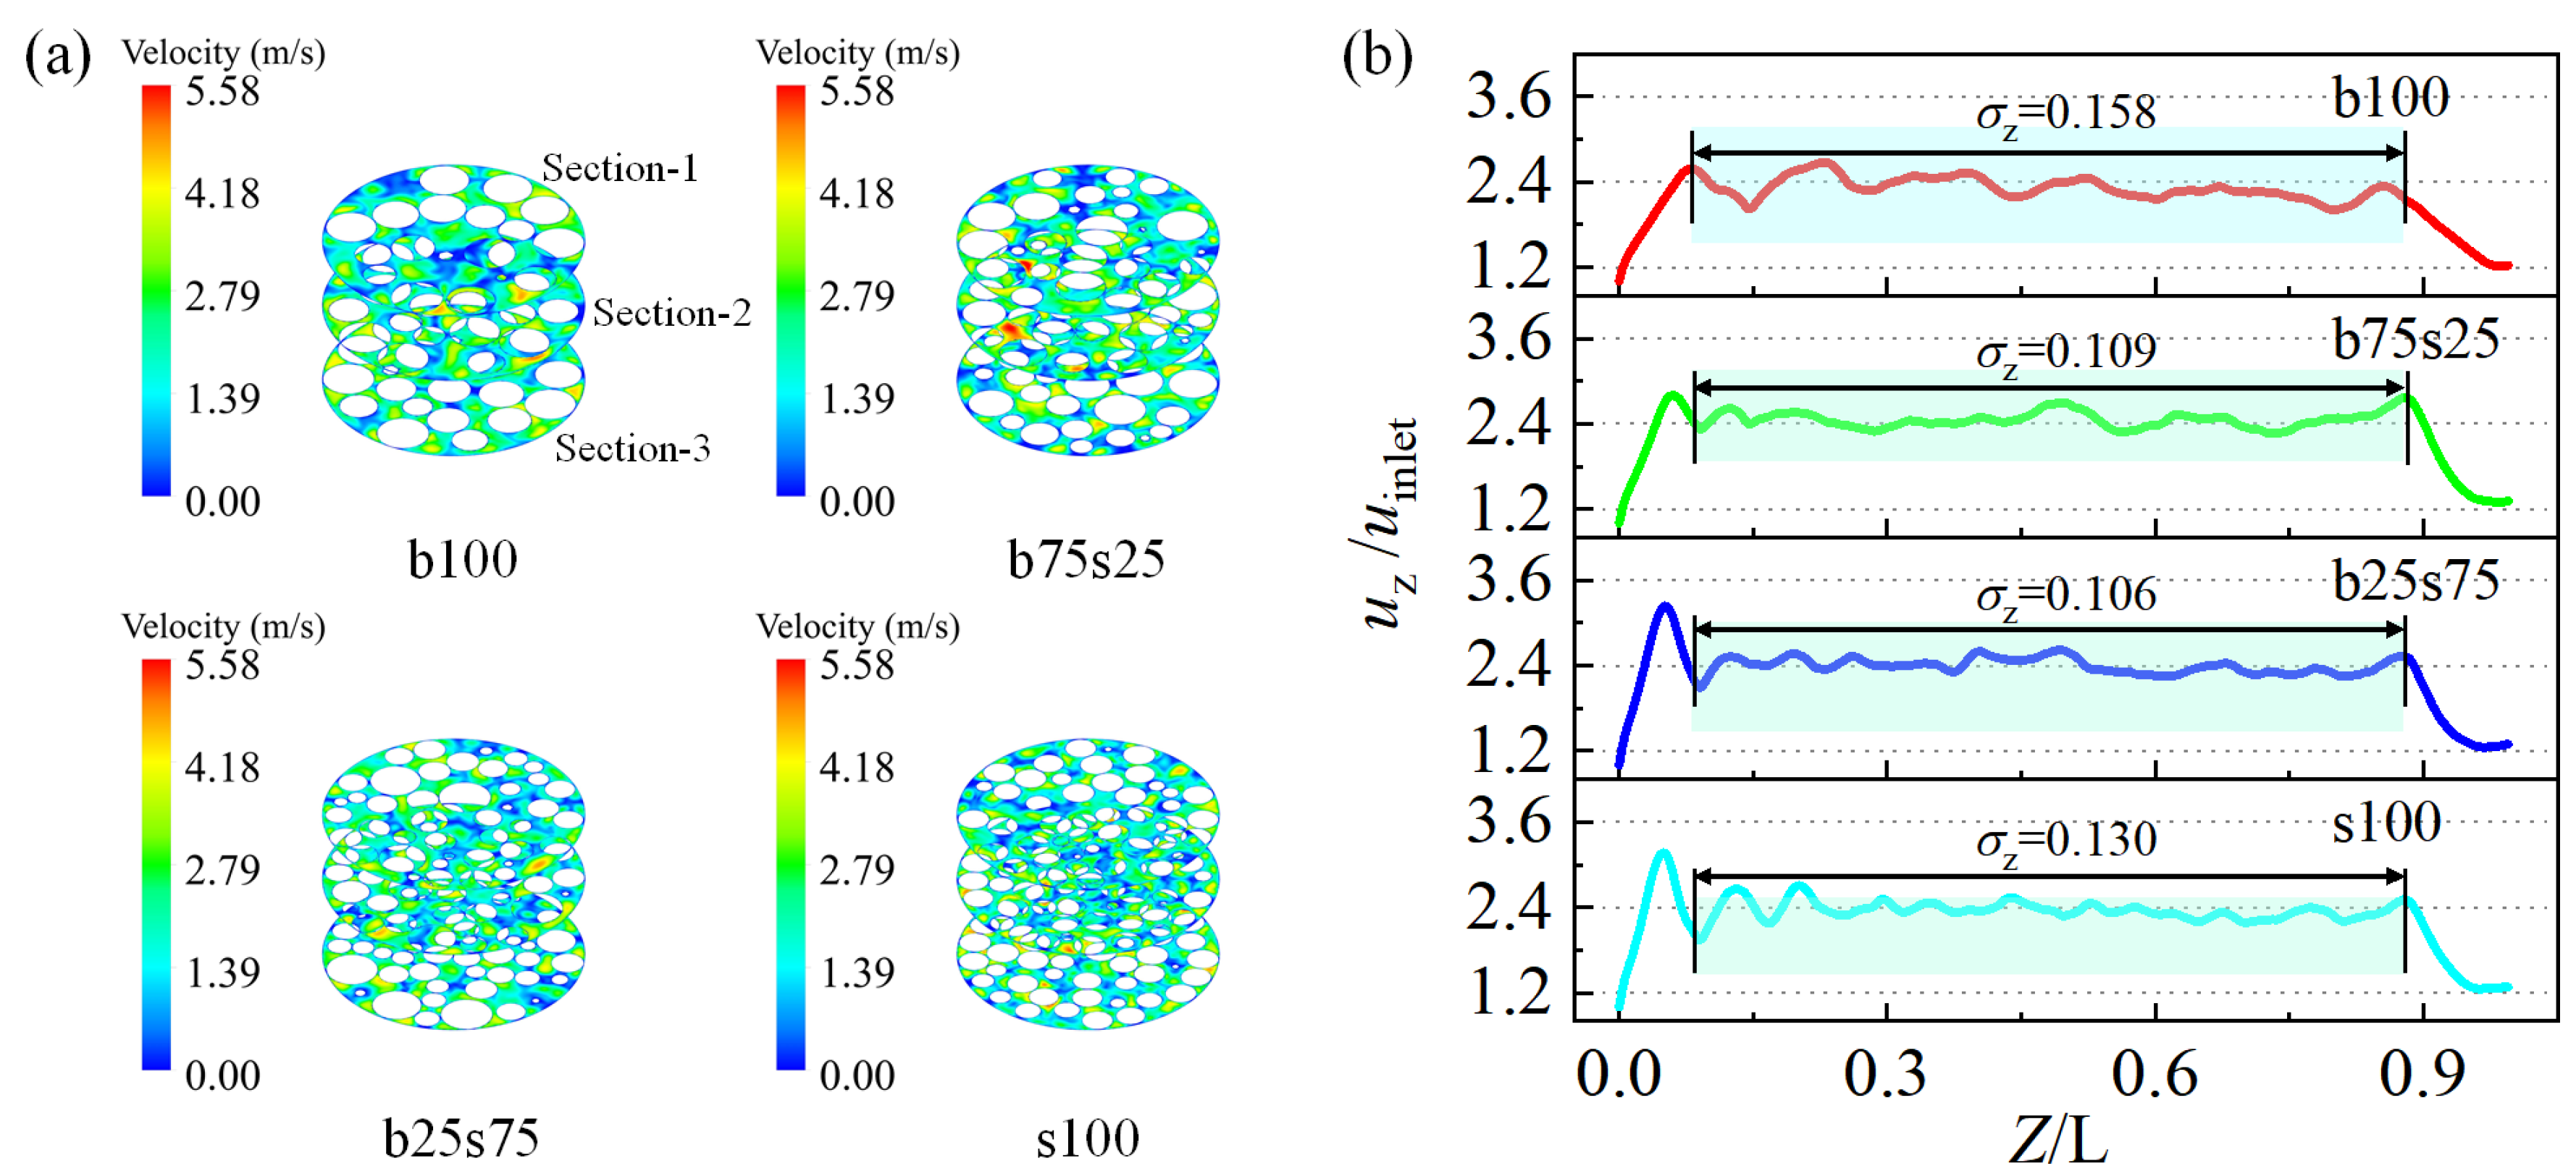
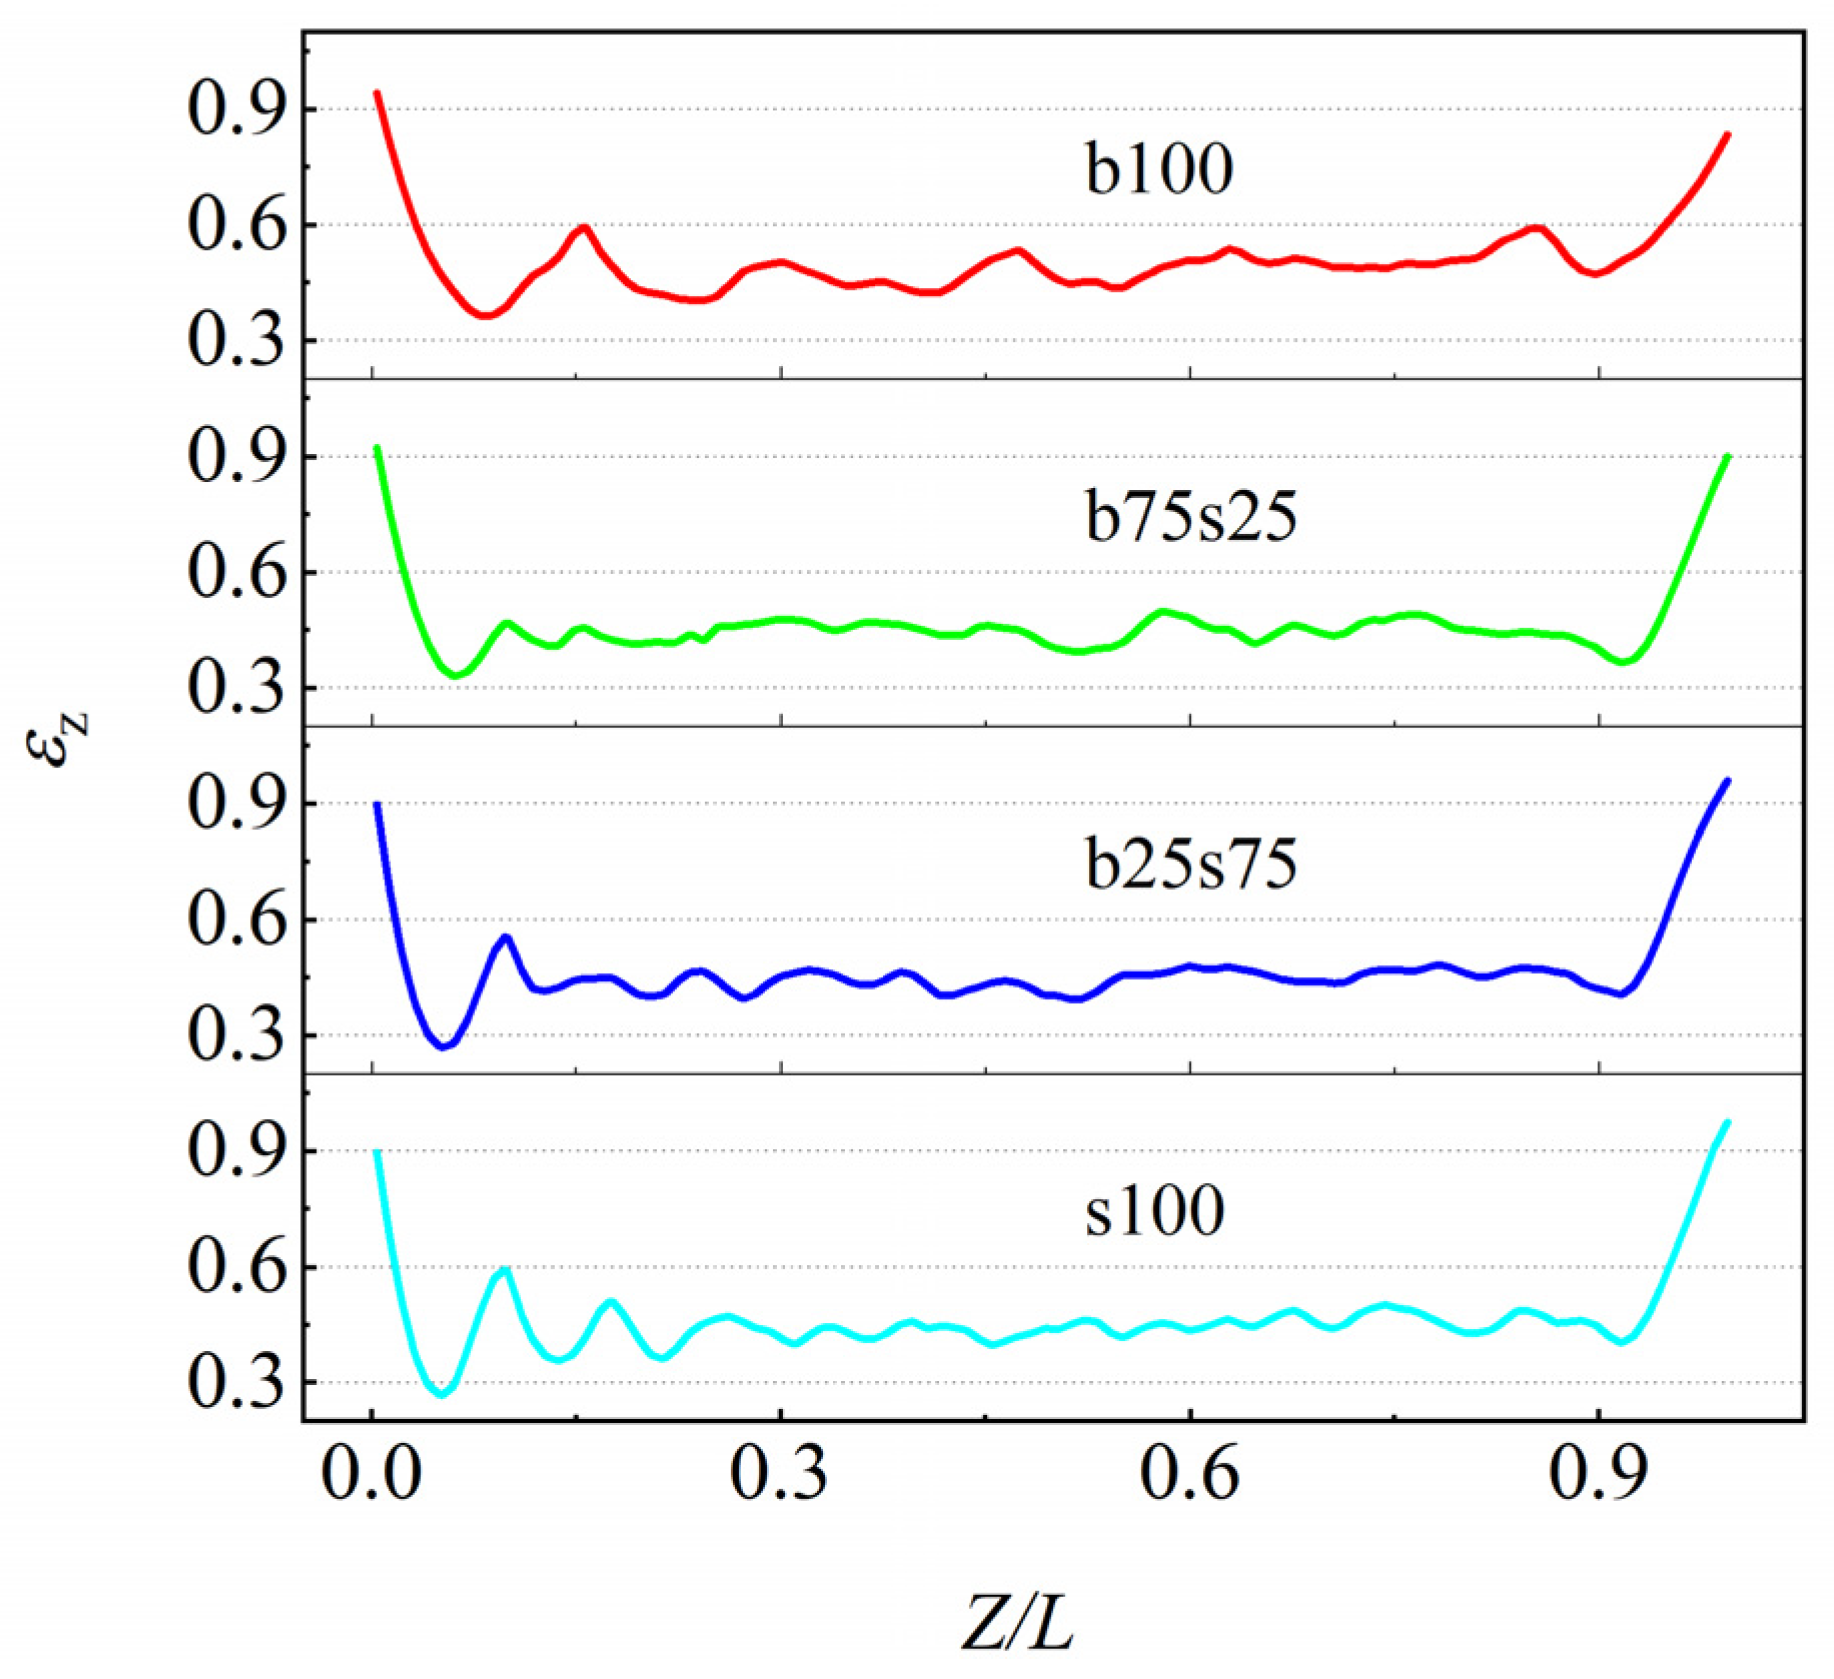
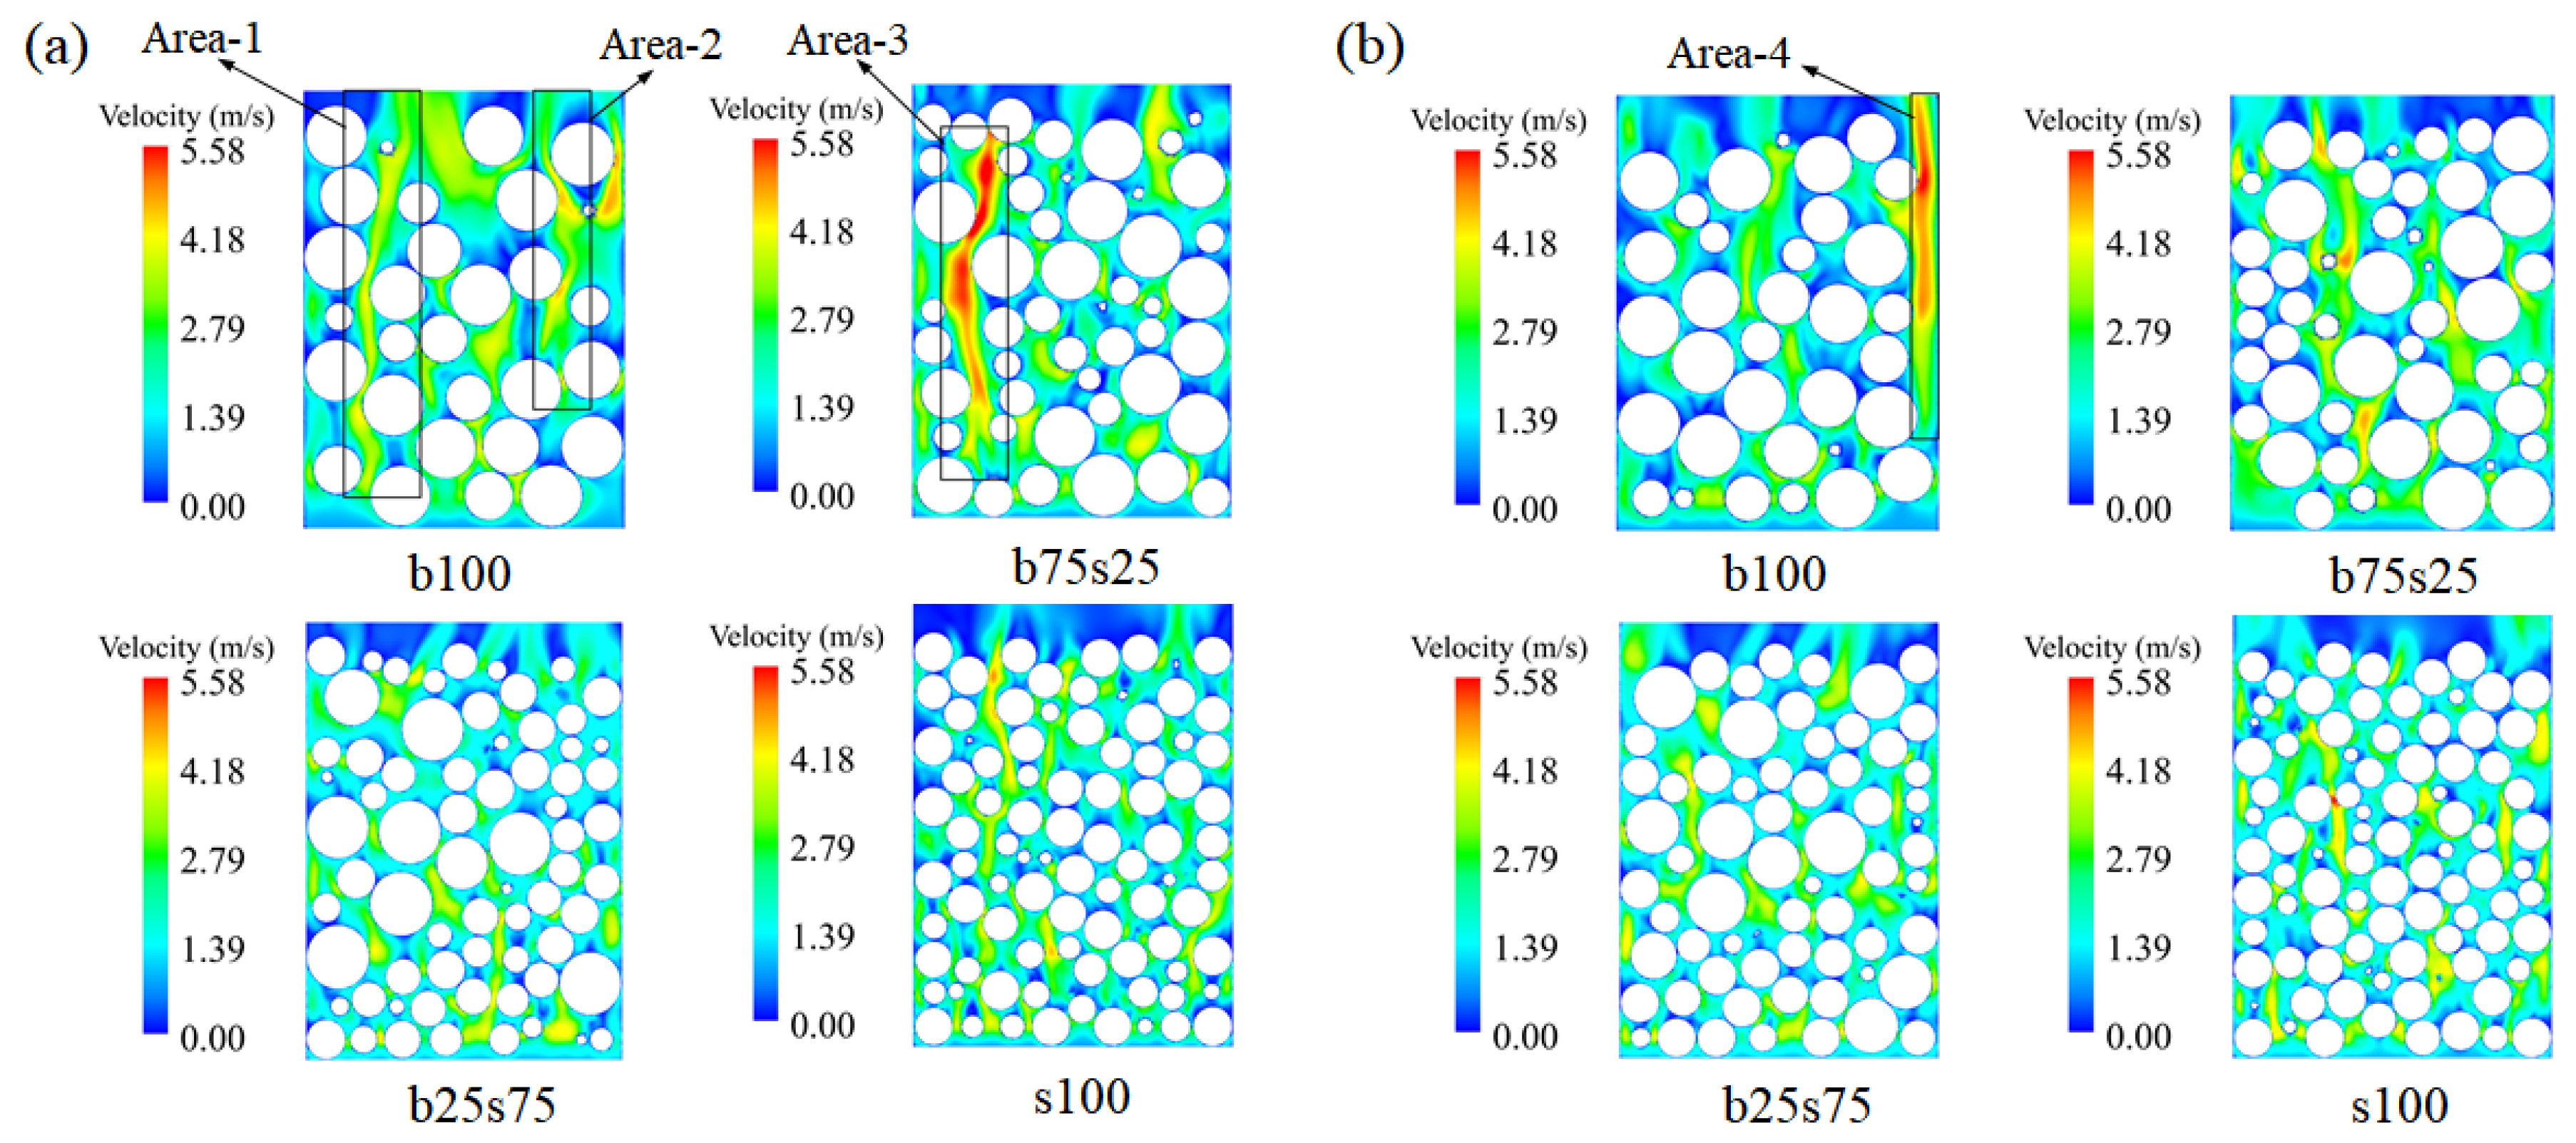
4.1. Wall Effect and Flow Characteristics
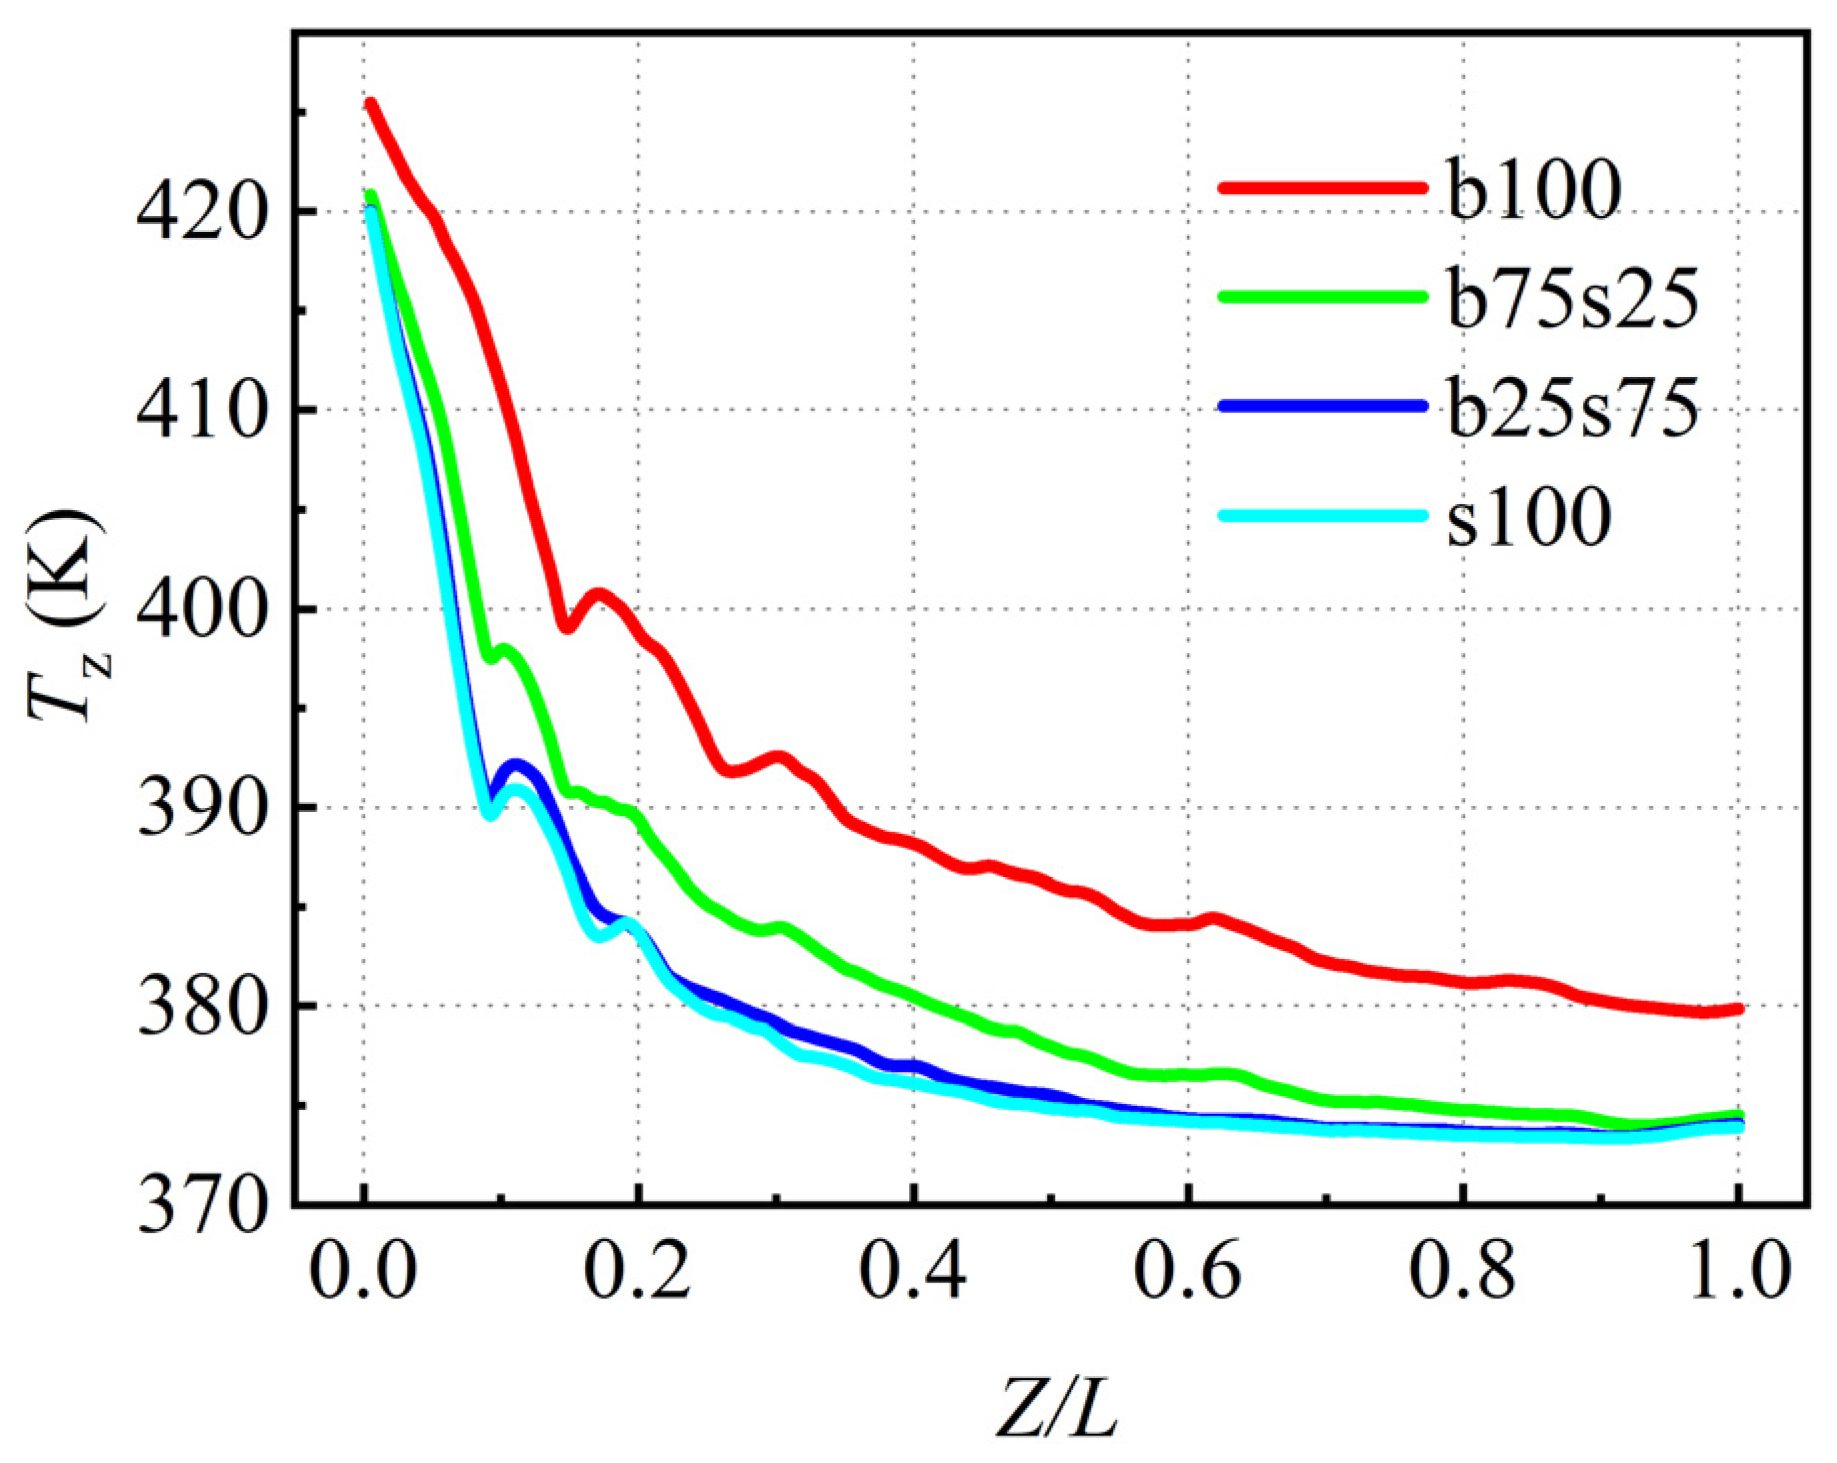
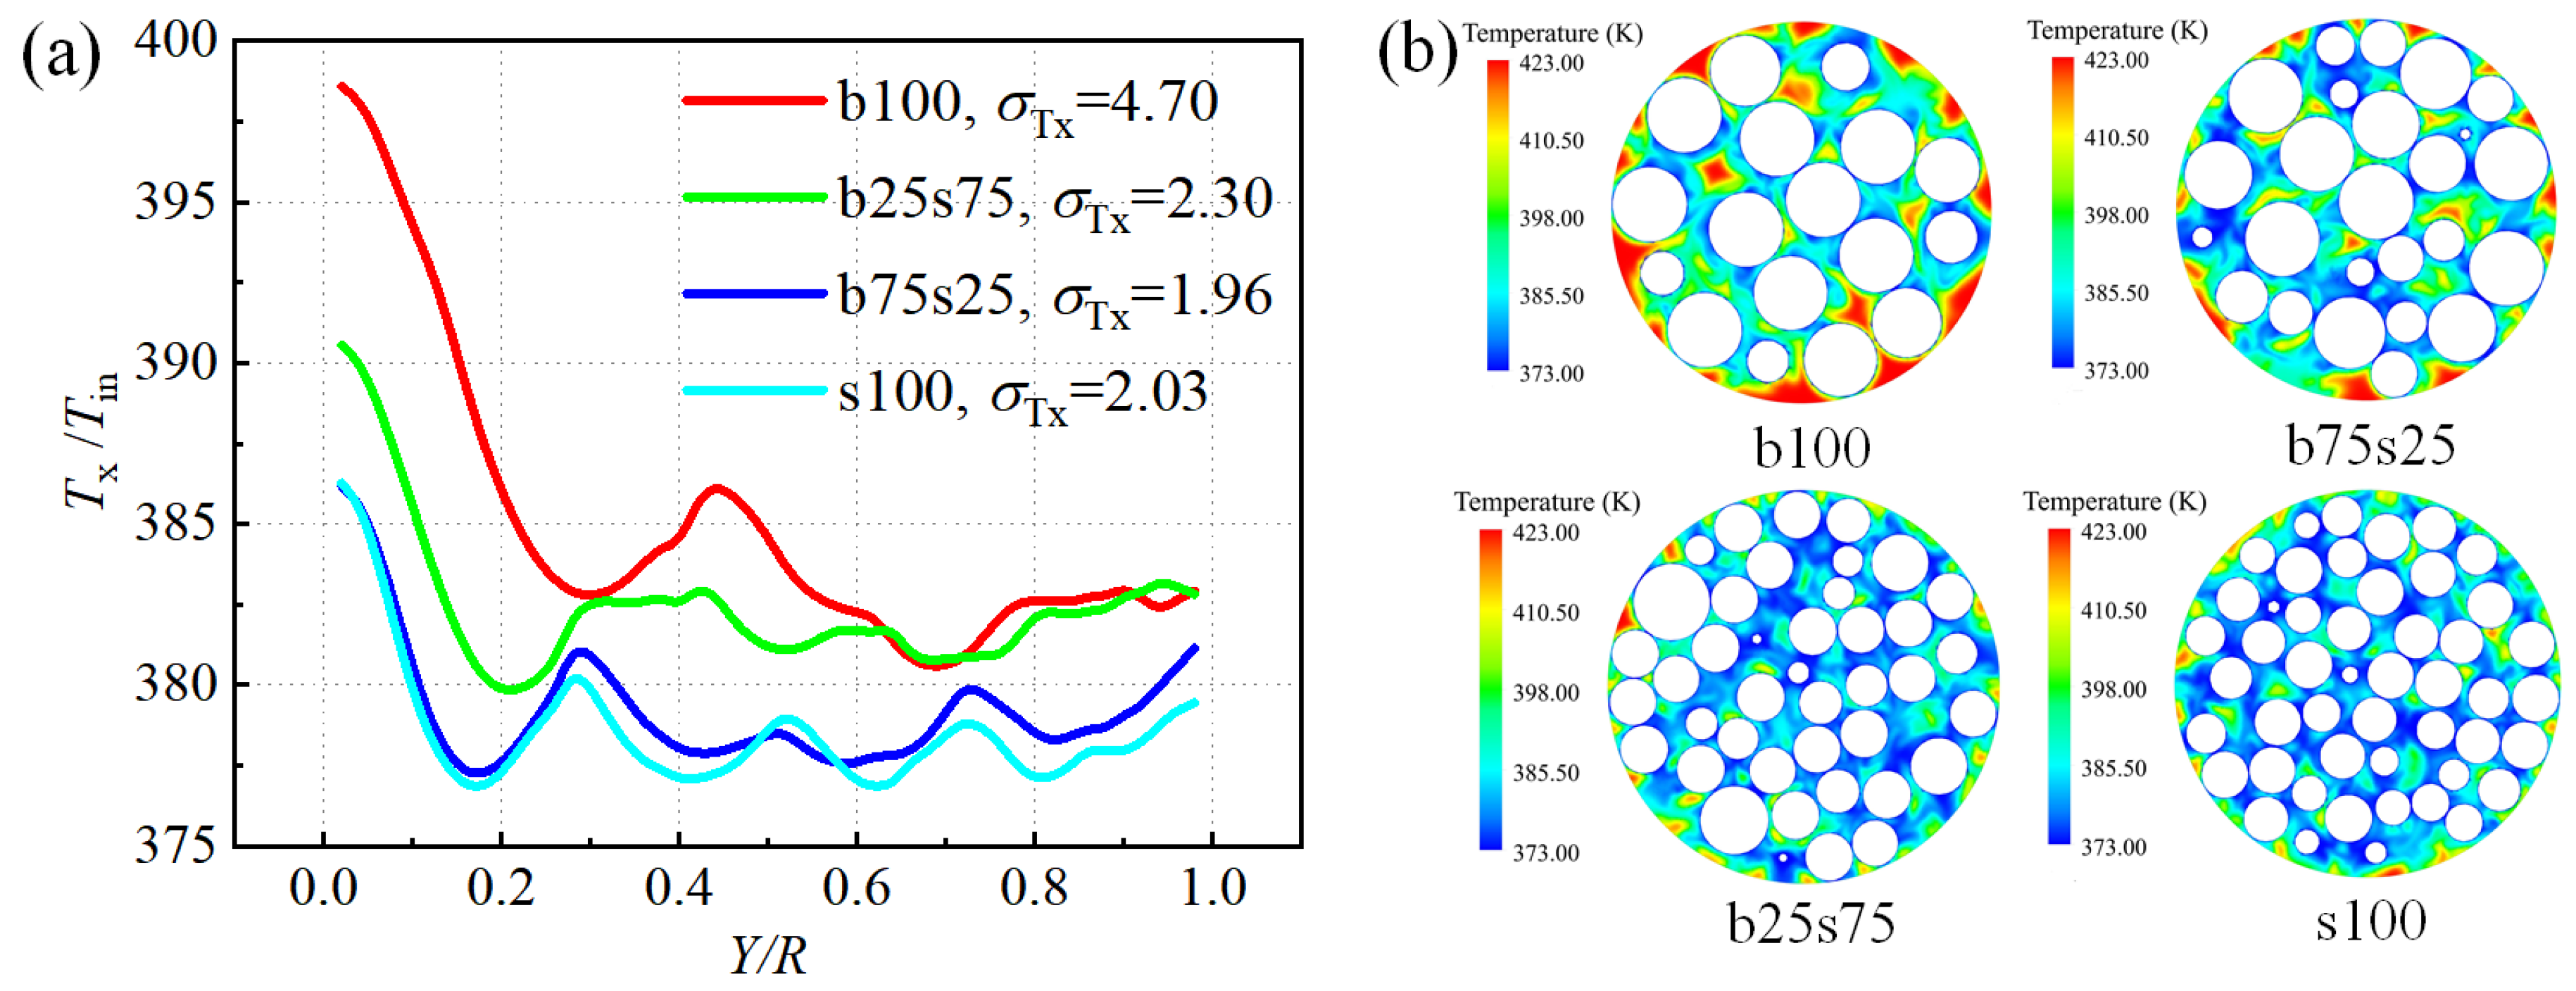
Figure 11 shows the influence of the wall effect in different packed beds (b100, b75s25, b50s50, b25s75 and s100). By intercepting fifty radial annular cylindrical layers along the radial direction of the packed bed (Figure 11a), the radial distribution of porosity from the bed wall surface to the center was obtained, as shown in Figure 11b. It can be seen that due to the existence of the wall effect, the porosity of the five groups of filler structure oscillates near the wall, then decays gradually. Packed bed b100 displays the largest oscillation amplitude of porosity near the wall, and the impact of this even extends to the center of bed. As the mass ratio between the binary particles (ds/db) increases, the oscillation frequency of radial porosity tends to decrease with the increasing ratio of small particles, and the critical nodes that correspond to the uniformity of porosity from the wall are 0.5105, 0.5705 and 0.3705 in packed beds b75s25, b50s50 and b25s75, respectively. The radial porosity oscillation distance of b25s75 is the shortest. However, for packed bed s100, containing only single small particles, the oscillation frequency of radial porosity increases again, and the critical node increases to 0.69. This result shows that the binary composite packing structure is beneficial for restraining the wall effect, the influence of which can be controlled by adjusting the mass ratio between the binary particles.
The distribution of fluid flow pressure drop (ΔP) in the five packed beds is shown in Figure 12. Fluid flow in a packed bed is hindered by the presence of packing particles. In order to overcome this resistance, energy loss will occur, resulting in a decrease in pressure. Hence, the packing arrangement is important for packed bed pressure drop. In Figure 12, packed bed b100, composed of single large particles, shows the lowest pressure drop. As the mass ratio of small particles increases from 0:1 to 0.33:1, the pressure drop increases obviously. However, as the mass ratio of small particles exceeds 1:1, the effect on the pressure drop is not significant. This shows that the binary composite packing structure may offer the advantage of a longer interaction time between the fluid flow and solid particles, which is beneficial for packed beds with gas–solid reactions. It can be seen from Figure 11a and Figure 12 that b50s50 has a small optimization degree for both radial porosity and pressure drop of the packed bed. Therefore, the four typical packing structures of b100, b75s25, b25s75 and s100 were selected for further discussions about flow characteristics and heat transfer.
The 3D velocity distributions in the four packed beds of b100, b75s25, b25s75 and s100 are shown in Figure 13 under the same conditions of inlet velocity (uinlet = 0.8 m/s). For packed bed b100, high velocity and an obvious short circuit phenomenon near the side walls can be observed in Figure 13, meaning much fluid flows through the packed bed near the border. For the binary composite packing structures, it can be seen from the figure that with an increase in the mass ratio of small particles, the fluid short circuit and local inhomogeneity are inhibited gradually, and packed bed b25s75 shows a similar homogeneity of 3D velocity distribution to packed bed s100. As the wall effect has a pronounced influence on the flow inside a packed bed with a low tube-to-particle diameter ratio [49,50], the control of this is of great significance to improve the efficiency of the packed bed reactor.
The average velocity distributions along the radial direction of the four packed beds are shown in Figure 14 at the same inlet velocity of 0.8 m/s. As can be seen from Figure 14b, corresponding to the radial porosity distribution in Figure 11b, the radial velocity distribution also shows an oscillatory behavior, but the two groups of curves show a strong negative correlation. That means a higher velocity occurs at a lower porosity in the packed bed (see Figure 14a). Comparing the four curves in Figure 14b, the standard deviations (σr) of the radial distribution curves in packed bed b25s75 is about 0.174, which is smaller than that of packed beds b100 (0.350), b75s25 (0.223) and s100 (0.195). Thus, the fluid velocity of the packing structure of b25s75 is less affected by the wall effect, and the radial distribution of velocity in packed bed b25s75 is more uniform, which is conducive to the optimal design of a packed bed with gas–solid interaction.
To further analyze the effect of packing structure on the local distribution characteristics of fluid velocity, five typical sections (section-1, section-2, section-3, section-4 and section-5) in the packed beds were selected as shown in Figure 15. The two-dimensional (2D) velocity distributions at the radial cross sections (section-1, section-2 and section-3) in different stacking structures can be seen in Figure 16a. It can be seen from the figure that the homogeneity of fluid velocity distribution at different radial cross sections of b100 and b75s25 is poor, and the velocity distributions at the three sections in packed beds b25s75 and s100 are more uniform than others, without an obvious nonuniform velocity profile. Figure 16b shows the average velocity distribution along the axial direction. Larger velocity fluctuations near the inlet can be found in all four packed beds. The standard deviation (σz) was calculated by taking the average axial velocity from 0.1 to 0.9 per unit height (Z/L) from the bottom of the packed bed, the obtained values of which are 0.158, 0.109, 0.106 and 0.130 for packed beds b100, b75s25, b25s75 and s100. By comparison, the standard deviation of the stacking structure of b25s75 is the smallest, which proves that the axial velocity inside bed b25s75, with binary composite structure, is relatively uniform. This result is consistent with the axial porosity distributions (see Figure 17) in different packed structures.
Figure 18 compares the velocity distribution clouds at the axial cross sections (section-4 and section-5) in the four stacking structures of b100, b75s25, b25s75 and s100. As shown in Figure 18, larger pore channels (see the selected areas 1, 2, 3 and 4) can be observed in the packed beds of b100 and b75s25 due to the looser particle accumulation, resulting in poor uniformity of the accumulation. The selected areas 1 and 3 of connected channels in Figure 18a exist almost from the inlet to the outlet of packed beds b100 and b75s25, producing obvious gully flow phenomena during the fluid flow process, which may reduce the utilization efficiency of feeding gas and inhibit the heat transfer between fluid flow and solid particles. In addition, fluid short-circuiting (selected area 4 in Figure 18b) occurs at the wall of packed bed b100, with a sudden increase in the velocity of the fluid. This uneven flow rate distribution will make the gas–solid interaction inadequate in the bed, which is not conducive to applying packed beds with catalytic or heterogeneous particles.

4.2. Heat Transfer

Most of the reactions in the packed bed are high-temperature catalytic reactions [51]. Therefore, it is necessary to discuss the effect of packing structure characteristics on temperature distributions and heat transfer efficiency in the packed beds. Figure 19 shows the axial temperature (Tz) distributions of fluid flow in different packed beds. Under the same initial conditions, the temperature fields of fluid flow in packed beds b25s75 and s100 are similarly lower than packed beds b100 and b75s25, indicating a higher heat transfer efficiency between the fluid flow and solid particles can be achieved in packed beds b25s75 and s100.
Figure 20 shows the radial temperature (Tx) distributions in the four packed beds of b100, b75s25, b25s75 and s100 under the same initial conditions. It can be observed from Figure 20a that the temperature distributions of the fluid flow near the wall all increase obviously in the four packed beds. Since the contact area between the particles and the fluid in the near-wall region is less than that of the internal particles, the heat transfer efficiency is reduced, resulting in a relatively high fluid temperature near the wall, especially for packed beds b100 and b75s25. In addition, the lower flow velocity and the retention phenomenon near the wall are also factors that affected the temperature distribution. It should be noted that the influence of this wall effect on the homogeneity of the temperature profile along the radial direction decreases with the increasing mass ratio of small particles. Figure 20b compares the 2D temperature distributions at the radial cross sections of Z/L = 0.23 in different stacking structures. As shown in Figure 20a, the homogeneity of radial temperature distribution in packed beds b25s75 and s100 is significantly higher than that of the other packed beds, and the standard deviation of the temperature distribution curve in packed bed b25s75 is the smallest (about 1.96), meaning that the introduction of a suitable binary composite packing structure is conducive to the radial uniformity of the temperature field. Combined with the results in Figure 19, it can be concluded that the packing structure of b25s75 is more favorable for the improvement in both heat transfer efficiency and the uniformity of temperature field in packed beds.

5. Conclusions

In this paper, a series of stacking structures of randomly packed beds were established by the DEM method, and the structural evolution of these was performed by adjusting the mass ratio between binary particles. The structural characteristics of the randomly packed beds were tested and verified by using X-ray tomography technology. Using a combination of DEM and CFD methods, the effects of the mesoscale structure evolution on the wall effect and heat transfer efficiency in mixed packed beds of binary-sized particles were studied.
(1) The results show that the constructed packing structure based on DEM is in good agreement with the practical randomly stacking structure, and the maximum relative error between the simulated porosity and the tested results at different sections is less than 10%.
(2) The radial porosity distributions of the five constructed stacking models were compared. The results show that b25s75 has the shortest oscillation distance near the wall, and the dimensionless distance of radial porosity fluctuation from the wall is 0.3705, proving that the wall effect on this stacking structure is minimal.
(3) The standard deviations of radial velocity, axial velocity and radial temperature distribution of b25s75 are all the smallest of the four stacking models (b100, b75s25, b25s75, s100), the values of which are 0.174, 0.106 and 1.96, respectively. Therefore, the stacking mode of b25s75 can make the fluid flow and the gas–solid interactions in randomly mixed beds more uniform.

Author Contributions

Conceptualization, C.S. and M.L.; methodology, C.S.; validation, C.S.; investigation, C.S., M.L., J.J., X.Y., L.L. and Y.W.; formal analysis, C.S. and M.L.; data curation, C.S.; writing—original draft preparation, C.S.; review and editing, C.S. and M.L.; supervision, C.S. All authors have read and agreed to the published version of the manuscript.

Funding

The authors gratefully acknowledge the financial support from the National Natural Science Foundation of China (51874200) and Liaoning Revitalization Talents Program (XLYC1907080 and XLYC2008014).

Data Availability Statement

Not applicable.

Conflicts of Interest

The authors declare no conflict of interest.

References

  1. Bale, S.; Sathe, M.; Ayeni, O.; Berrouk, A.S.; Joshi, J.; Nandakumar, K. Spatially resolved mass transfer coefficient for moderate Reynolds number flows in packed beds: Wall effects. Int. J. Heat Mass Transf. 2017, 110, 406–415. [Google Scholar] [CrossRef]
  2. Jiang, L.S.; Liu, H.S.; Suo, S.Y.; Xie, M.Z.; Wu, D.; Bai, M.L. Pore-scale simulation of flow and turbulence characteristics in three-dimensional randomly packed beds. Powder Technol. 2018, 338, 197–210. [Google Scholar]
  3. Ghosh, R. Cuboid Packed-Beds as Chemical Reactors. Processes 2018, 6, 44. [Google Scholar] [CrossRef] [Green Version]
  4. Li, Y.H.; Wang, M.K.; Cao, X.X.; Geng, Z.F. Particle resolved CFD simulation on vapor-phase synthesis of vinyl acetate from ethylene in fixed-bed reactor. Korean J. Chem. Eng. 2020, 37, 839–849. [Google Scholar] [CrossRef]
  5. Reddy, R.K.; Joshi, J.B. CFD modeling of pressure drop and drag coefficient in fixed and expanded beds. Chem. Eng. Res. Des. 2008, 86, 444–453. [Google Scholar] [CrossRef]
  6. Dong, Y.; Sosna, B.; Korup, O.; Rosowski, F.; Horn, R. Investigation of radial heat transfer in a fixed-bed reactor: CFD simulations and profile measurements. Chem. Eng. J. 2017, 317, 204–214. [Google Scholar] [CrossRef]
  7. Dai, W.; Hanaor, D.; Gan, Y. The effects of packing structure on the effective thermal conductivity of granular media: A grain scale investigation. Int. J. Heat Mass Transf. 2019, 142, 266–279. [Google Scholar] [CrossRef] [Green Version]
  8. Lee, Y.; Yu, S.; Ahn, M.Y.; Park, Y.H.; Cho, S.; Sohn, D. Numerical investigation of mechanical and thermal characteristics of binary-sized pebble beds using discrete element method. Fusion Eng. Des. 2019, 146, 2285–2291. [Google Scholar] [CrossRef]
  9. Gorman, J.M.; Zheng, A.; Sparrow, E.M. Bounding wall effects on fluid flow and pressure drop through packed beds of spheres. Chem. Eng. J. 2019, 373, 519–530. [Google Scholar] [CrossRef]
  10. Bale, S.; Tiwari, S.; Sathe, M.; Berrouk, A.S.; Nandakumar, K.; Joshi, J. Direct numerical simulation study of end effects and D/d ratio on mass transfer in packed beds. Int. J. Heat Mass Transf. 2018, 127, 234–244. [Google Scholar] [CrossRef]
  11. Desu, R.K.; Moorthy, A.; Annabattula, R.K. DEM simulation of packing mono-sized pebbles into prismatic containers through different filling strategies. Fusion Eng. Des. 2018, 127, 259–266. [Google Scholar] [CrossRef]
  12. Zhang, K.; Du, S.Q.; Sun, P.; Zheng, B.; Liu, Y.Q.; Shen, Y.K.; Chang, R.Z.; Han, X.B.A. The effect of particle arrangement on the direct heat extraction of regular packed bed with numerical simulation. Energy 2021, 42, 120244. [Google Scholar] [CrossRef]
  13. Beaulieu, C.; Vidal, D.; Yari, B.; Chaouki, J.; Bertrand, F. Impact of surface roughness on heat transfer through spherical particle packed beds. Chem. Eng. Sci. 2018, 231, 116256. [Google Scholar] [CrossRef]
  14. Wu, Z.X.; Wu, Y.W.; Tang, S.M.; Liu, D.; Qiu, S.Z.; Su, G.H.; Tian, W.X. DEM-CFD simulation of helium flow characteristics in randomly packed bed for fusion reactors. Prog. Nucl. Energy 2018, 109, 29–37. [Google Scholar] [CrossRef]
  15. Zhang, B.; Wang, B.J.; Yan, S.L.; Bai, Z.S.; Hu, Z.Q.; Lu, Z.J. CFD-DEM coupling simulation of fixed bed reactor with small diameter ratio. J. Dispers. Sci. Technol. 2021, 42, 1747–1755. [Google Scholar] [CrossRef]
  16. Capozzi, L.C.; Barresi, A.A.; Pisano, R. Supporting data and methods for the multi-scale modelling of freeze-drying of microparticles in packed-beds. Data Brief 2019, 343, 834–846. [Google Scholar] [CrossRef]
  17. Zhang, S.J.; Zhao, X.; Yang, Z. Flow Simulations in a Pebble Bed Reactor by a Combined DEM-CFD Approach. Nucl. Sci. Eng. 2018, 189, 135–151. [Google Scholar] [CrossRef]
  18. Natsui, S.; Takai, H.; Nashimoto, R.; Kikuchi, T.; Suzuki, R.O. Model study of the effect of particles structure on the heat and mass transfer through the packed bed in ironmaking blast furnace. Int. J. Heat Mass Transf. 2015, 91, 1176–1186. [Google Scholar] [CrossRef]
  19. Chen, L.; Chen, Y.H.; Huang, K.; Liu, S.L. Investigation of effective thermal conductivity for pebble beds by one-way coupled CFD-DEM method for CFETR WCCB. Fusion Eng. Des. 2016, 106, 1–8. [Google Scholar] [CrossRef]
  20. Pichler, M.; Haddadi, B.; Jordan, C.; Norouzi, H.; Harasek, M. Effect of particle contact point treatment on the CFD simulation of the heat transfer in packed beds. Chem. Eng. Res. Des. 2021, 165, 242–253. [Google Scholar] [CrossRef]
  21. She, X.F.; Liu, S.H.; Liu, Y.J.; Zhao, W.S.; Wang, Y.J.; Zhou, H. Dynamic analysis of blockage behavior of fine particles in a packed bed by discrete element method. Ironmak. Steelmak. 2021, 48, 860–867. [Google Scholar] [CrossRef]
  22. Xie, Z.Z.; Wang, S.; Shen, Y.S. CFD-DEM modelling of the migration of fines in suspension flow through a solid packed bed. Chem. Eng. Sci. 2021, 231, 116261. [Google Scholar] [CrossRef]
  23. Tan, Y.; Rackl, M.; Fottner, J.; Kessler, S. Study on the importance of bed shape in combined DEM-CFD simulation of fixed-bed Biomass gasifiers. Powder Technol. 2022, 412, 117971. [Google Scholar] [CrossRef]
  24. Lian, G.Q.; Zhong, W.Q. CFD-DEM modeling of oxy-char combustion in a fluidized bed. Powder Technol. 2022, 407, 117698. [Google Scholar] [CrossRef]
  25. Gan, J.Q.; Zhou, Z.Y.; Yu, A.B. Particle scale study of heat transfer in packed and fluidized beds of ellipsoidal particles. Chem. Eng. Sci. 2016, 144, 201–215. [Google Scholar] [CrossRef]
  26. Niu, Q.; Wang, N.X. Study of heat transfer by using DEM-CFD method in a randomly packed pebble-bed reactor. Nucl. Sci. Tech. 2019, 30, 28. [Google Scholar] [CrossRef]
  27. Wang, S.; Luo, K.; Hu, C.S.; Lin, J.J.; Fan, J.R. CFD-DEM simulation of heat transfer in fluidized beds: Model verification, validation, and application. Chem. Eng. Sci. 2019, 197, 280–295. [Google Scholar] [CrossRef]
  28. Zhang, S.; Zhao, L.; Feng, J.S.; Dong, H. Numerical investigation of the air-particles heat transfer characteristics of moving bed-effect of particle size distribution. Int. J. Heat Mass Transf. 2022, 182, 122036. [Google Scholar] [CrossRef]
  29. Chen, Y.H.; Chen, L.; Liu, S.L.; Luo, G.N. Flow characteristics analysis of purge gas in unitary pebble beds by CFD simulation coupled with DEM geometry model for fusion blanket. Fusion Eng. Des. 2017, 114, 84–90. [Google Scholar] [CrossRef]
  30. Tallarek, U.; Scheenen, T.W.J.; Van, A.H. Macroscopic heterogeneities in electroosmotic and pressure-driven flow through fixed beds at low column-to-particle diameter ratio. J. Phys. Chem. B. 2001, 105, 8591–8599. [Google Scholar] [CrossRef]
  31. Zhang, M.H.; Dong, H.; Geng, Z.F. Computational study of flow and heat transfer in fixed beds with cylindrical particles for low tube to particle diameter ratios. Chem. Eng. Res. Des. 2018, 132, 149–161. [Google Scholar] [CrossRef]
  32. Nijemeisland, M.; Dixon, A.G. CFD study of fluid flow and wall heat transfer in a fixed bed of spheres. AICHE J. 2004, 50, 906–921. [Google Scholar] [CrossRef]
  33. Yang, J.; Wu, J.Q.; Zhou, L.; Wang, Q.W. Computational study of fluid flow and heat transfer in composite packed beds of spheres with low tube to particle diameter ratio. Nucl. Eng. Des. 2016, 300, 85–96. [Google Scholar] [CrossRef]
  34. Bai, H.; Theuerkauf, J.; Gillis, P.A.; Witt, P.M. A Coupled DEM and CFD Simulation of Flow Field and Pressure Drop in Fixed Bed Reactor with Randomly Packed Catalyst Particles. Ind. Eng. Chem. Res. 2009, 48, 4060–4074. [Google Scholar] [CrossRef]
  35. Eppinger, T.; Seidler, K.; Kraume, M. DEM-CFD simulations of fixed bed reactors with small tube to particle diameter ratios. Chem. Eng. J. 2011, 166, 324–331. [Google Scholar] [CrossRef]
  36. Ma, X.T.; Wang, J.C.; Cui, Z. Analysis and intensification of the thermal performance in packed beds based on simulation and experiment. Chem. Eng. Process. 2019, 142, 107541. [Google Scholar] [CrossRef]
  37. Mohanty, R.; Mohanty, S.; Mishra, B.K. Study of flow through a packed bed using discrete element method and computational fluid dynamics. J. Taiwan Inst. Chem. Eng. 2016, 63, 71–80. [Google Scholar] [CrossRef]
  38. Peng, W.P.; Xu, M.; Huai, X.L.; Liu, Z.G. CFD study on local fluid-to-wall heat transfer in packed beds and field synergy analysis. J. Therm. Sci. 2016, 25, 167–170. [Google Scholar]
  39. Erdim, E.; Akgiray, O.; Demir, I. A revisit of pressure drop-flow rate correlations for packed beds of spheres. Powder Technol. 2015, 283, 488–504. [Google Scholar] [CrossRef]
  40. Feng, Y.J.; Gong, B.P.; Cheng, H.; Wang, L.; Wang, X.Y. Effects of fixed wall and pebble size ratio on packing properties and contact force distribution in binary-sized pebble mixed beds at the maximum packing efficiency state. Powder Technol. 2021, 390, 504–520. [Google Scholar] [CrossRef]
  41. Guo, Z.H.; Sun, Z.N.; Zhang, N.; Ding, M.; Shi, S. CFD analysis of fluid flow and particle-to-fluid heat transfer in packed bed with radial layered configuration. Chem. Eng. Sci. 2019, 197, 357–370. [Google Scholar] [CrossRef]
  42. Dun, H.C.; Yue, P.; Huang, N.; Zhang, J. Discrete Element Simulation on Sand-Bed Collision Considering Surface Moisture Content. Processes 2022, 10, 52. [Google Scholar] [CrossRef]
  43. Qian, Y.A.; Han, Z.N.; Zhan, J.H.; Liu, X.X.; Xu, G.G. Comparative evaluation of heat conduction and radiation models for CFD simulation of heat transfer in packed beds. Int. J. Heat Mass Transf. 2018, 127, 573–584. [Google Scholar] [CrossRef]
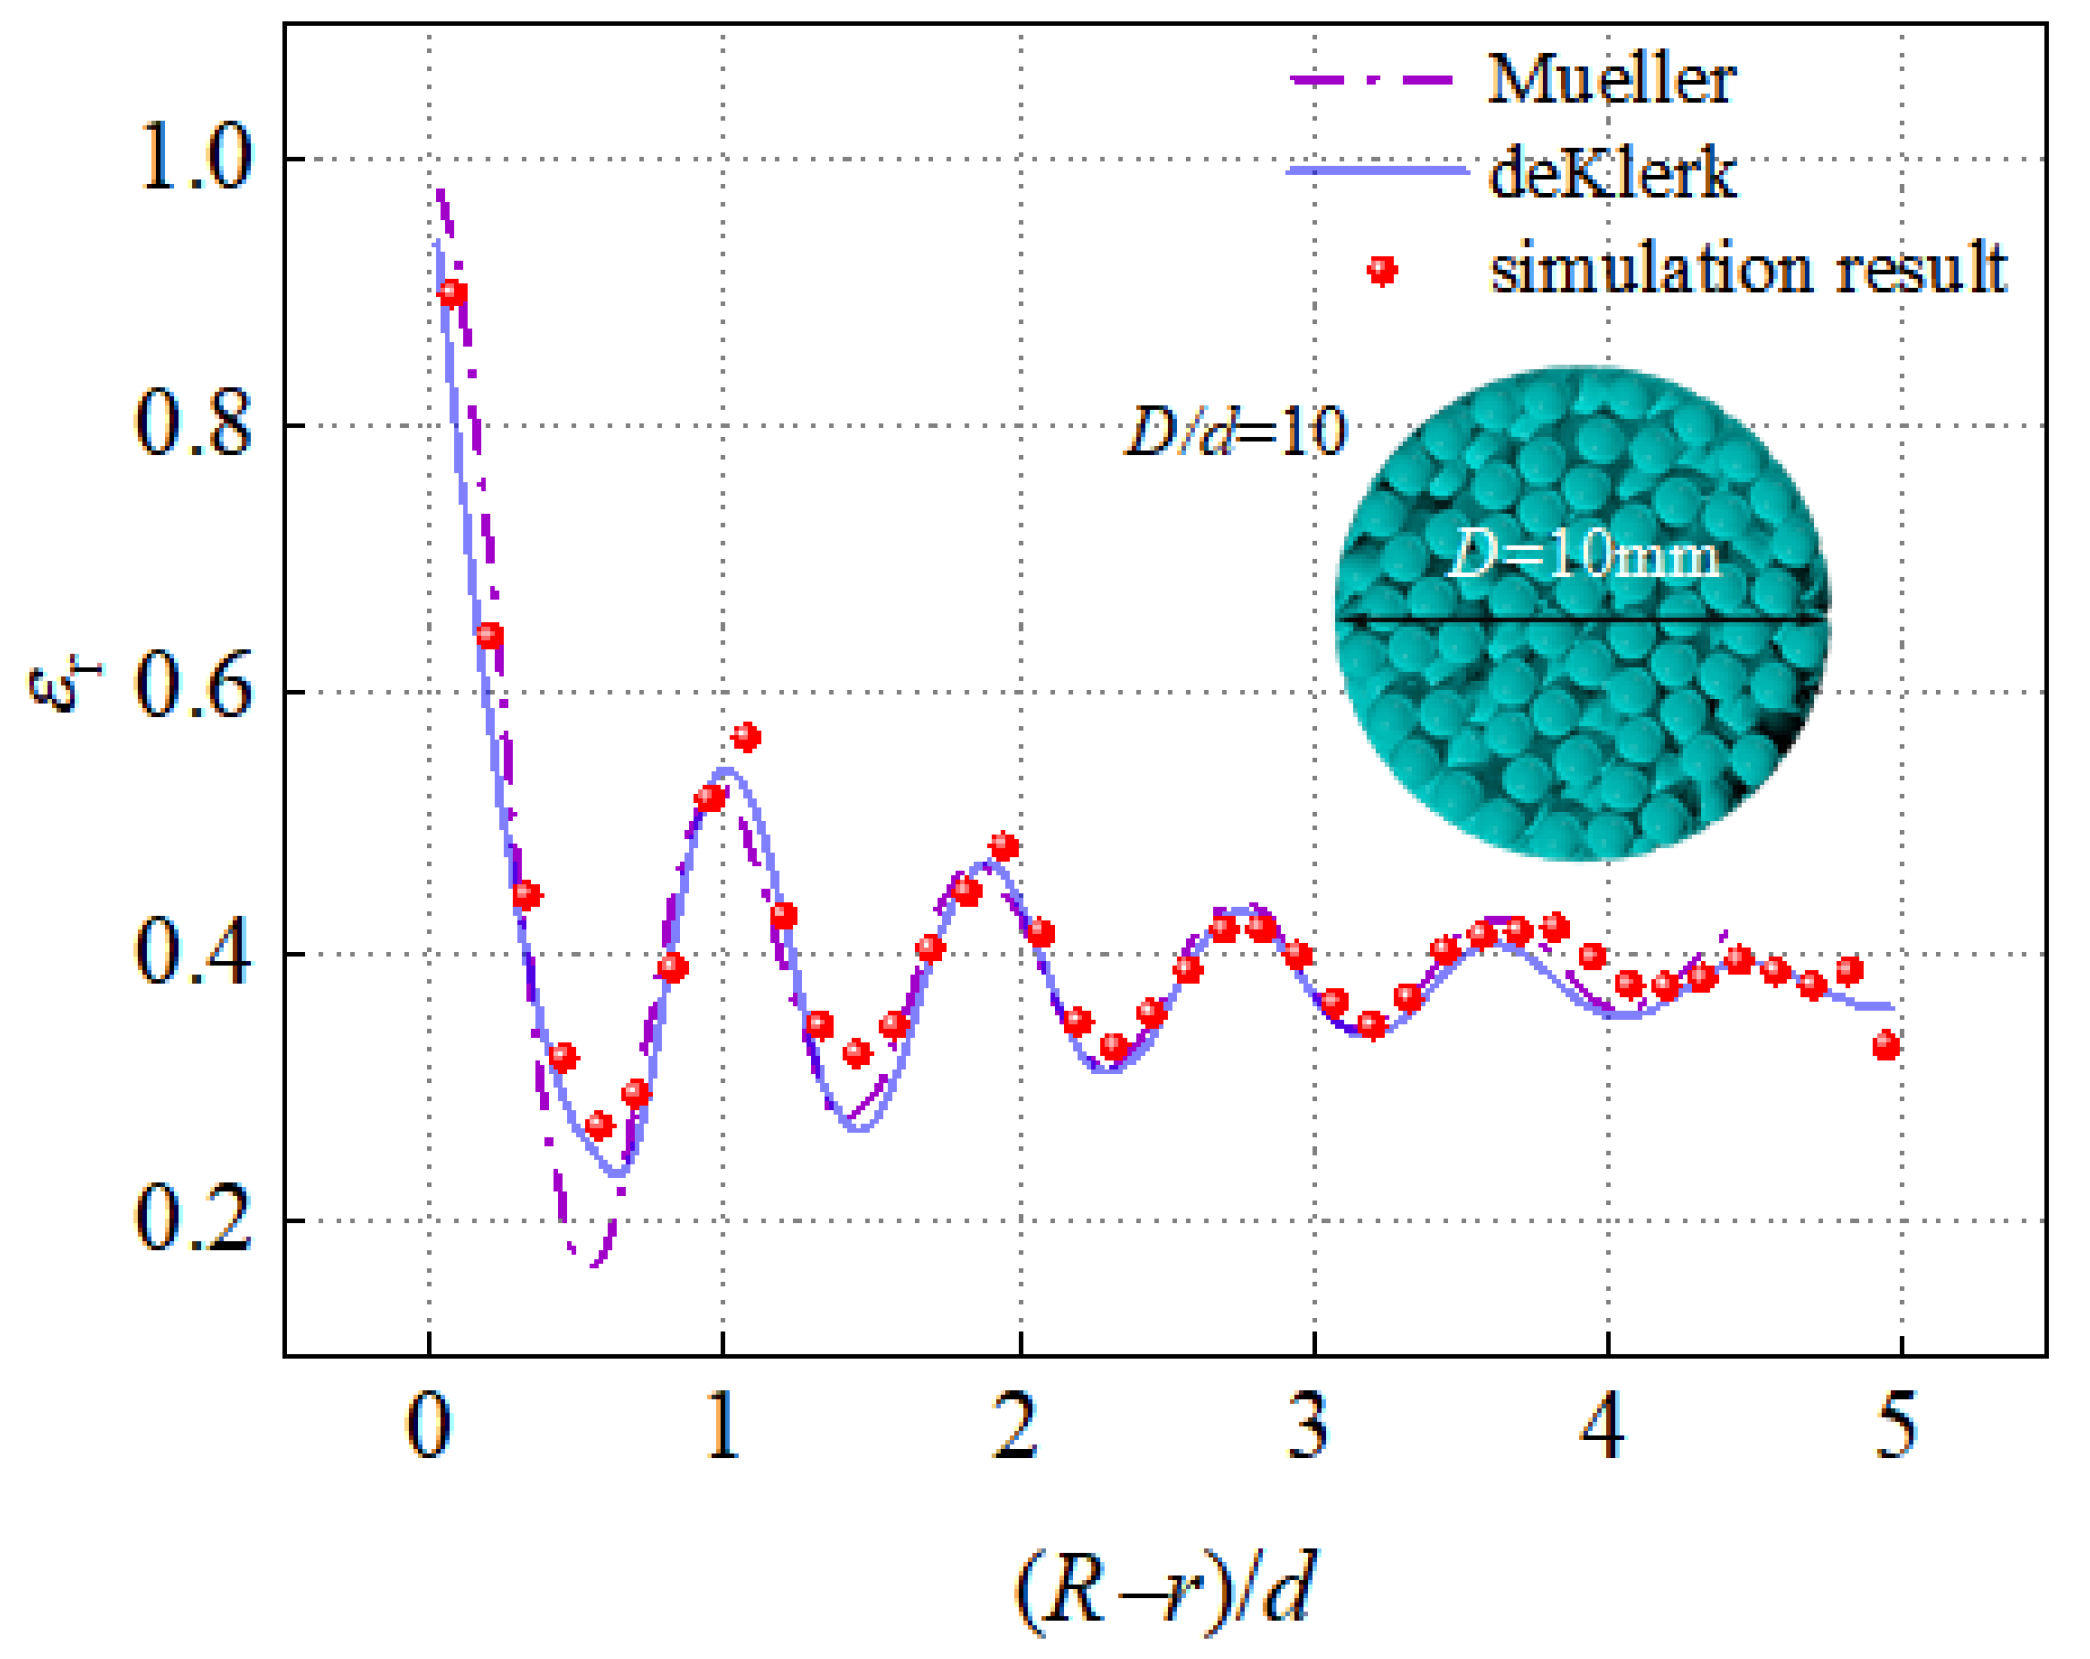
  44. Mueller, G.E. Radial void fraction distributions in randomly packed fixed beds of uniformly sized spheres in cylindrical containers-sciencedirect. Powder Technol. 1992, 72, 269–275. [Google Scholar] [CrossRef]
  45. de Klerk, A. Voidage variation in packed beds at small column to particle diameter ratio. AICHE J. 2003, 49, 2022–2029. [Google Scholar] [CrossRef]
  46. Li, X.B.; Wei, W.; Wang, L.; Ding, P.B.; Zhu, L.Q.; Cai, J.C. A new method for evaluating the pore structure complexity of digital rocks based on the relative value of fractal dimension. Mar. Pet. Geol. 2022, 141, 105694. [Google Scholar] [CrossRef]
  47. Peng, R.D.; Yang, Y.C.; Ju, Y.; Mao, L.T.; Yang, Y.M. Computation of fractal dimension of rock pores based on gray CT images. Chin. Sci. Bull.-Chin. 2011, 56, 3346–3357. [Google Scholar] [CrossRef] [Green Version]
  48. Tsotsas, E. The influence of confining walls on the pressure drop in packed beds. Chem. Eng. Sci. 2002, 57, 1827. [Google Scholar] [CrossRef]
  49. Romero-Limones, A.; Poissonnier, J.; Thybaut, J.W.; Castillo-Araiza, C.O. A pseudo-local heat transfer approach in a low tube to particle diameter ratio packed bed catalytic reactor: Oxidative dehydrogenation of ethane as a case study. Chem. Eng. J. 2023, 454, 140392. [Google Scholar] [CrossRef]
  50. Wehinger, G.D.; Scharf, F. Thermal radiation effects on heat transfer in slender packed-bed reactors: Particle-resolved CFD simulations and 2D modeling. Chem. Eng. Res. Des. 2022, 184, 24–38. [Google Scholar] [CrossRef]
  51. Li, Q.; Guo, S.; Wang, S.; Zou, Z.S. CFD-DEM Investigation on Pressure Drops of Heterogeneous Alternative-Layer Particle Beds for Low-Carbon Operating Blast Furnaces. Metals 2022, 12, 1507. [Google Scholar] [CrossRef]
Figure 1. Simulation steps for the construction of the randomly packed bed using the DEM method.
Processes 11 00732 g001
Figure 2. Binary mixed packing beds: (a) b100; (b) b75s25; (c) b50s50; (d) b25s75; (e) s100.
Processes 11 00732 g002
Figure 3. Computational physical mode.
Processes 11 00732 g003
Figure 4. Influence of mesh size on the bed pressure drop in different packed beds: (a) b100; (b) b75s25; (c) b50s50; (d) b25s75; (e) s100.
Processes 11 00732 g004
Figure 5. Reconstruction of stacking model: (a) scanned images; (b) images obtained after filtering, denoising and segmenting; (c) 3D model of reconstruction.
Processes 11 00732 g005
Figure 6. (a) Random packing bed based on DEM; (b) extraction of pore structure; (c) radial annular cylindrical layer.
Processes 11 00732 g006
Figure 7. Comparison of radial porosity distribution resulting from the DEM model and de Klerk equation.
Processes 11 00732 g007
Figure 8. Comparison of porosity between the experimental data and the simulated results: (a) at different dimensionless heights; (b) at different radial sections.
Processes 11 00732 g008
Figure 9. Verification of DEM model by fractal dimension: (a) CT image; (b) cross-section image of simulated model; (c) relative error of fractal dimension.
Processes 11 00732 g009
Figure 10. (a) Comparison of pressure drop between the simulated results based on the DEM-CFD model and the data calculated by the Ergun equation; (b) relative errors in different packed beds at uinlet = 0.8 m/s.
Processes 11 00732 g010
Figure 11. (a) Construction of radial pore structure; (b) radial porosity distribution.
Processes 11 00732 g011
Figure 12. Pressure drops along the axial direction of different packed beds.
Processes 11 00732 g012
Figure 13. The 3D velocity distributions in different packing structures.
Processes 11 00732 g013
Figure 14. (a) Construction of radial velocity distribution; (b) relative velocity distributions along the radial direction in different packed beds.
Processes 11 00732 g014
Figure 15. Schematic diagram of the selected sections in a packed bed.
Processes 11 00732 g015
Figure 16. (a) Velocity distributions at different radial cross sections; (b) relative velocity distributions along the axial direction in different packed beds.
Processes 11 00732 g016
Figure 17. Axial porosity distribution.
Processes 11 00732 g017
Figure 18. Velocity distributions at different axial cross sections: (a) section-4; (b) section-5.
Processes 11 00732 g018
Figure 19. Temperature distributions along the axial direction of different packed beds.
Processes 11 00732 g019
Figure 20. (a) Relative radial temperature distributions in different packed beds; (b) 2D radial temperature distributions at section-3 in different packed beds.
Processes 11 00732 g020
Table 1. Parameters for DEM simulation.
ParametersValue
Bed diameter [mm]20
Bed height [mm]26
Particle diameter [mm]2.5, 4.0
Density of particles [kg/m3]2700
Young’s modulus [GPa]70
Poisson’s ratio of particle0.25
Coefficient of restitution of particle0.5
Time step (s)1.0 × 10⁻⁸
Table 2. Parameters for CFD simulation.
Parameters Value
Inlet velocity of bed [m/s]0.8
Inlet temperature of bed [K]423
Outlet pressure of bed [bar]1.013
Particle surface temperature [K]373
Density (kg/m3)1.225
Viscosity [kg/(m·s)]1.8 × 10−5
Gravitational accelerating [m/s2]9.81
Time step (s)1.0 × 10⁻³
Disclaimer/Publisher’s Note: The statements, opinions and data contained in all publications are solely those of the individual author(s) and contributor(s) and not of MDPI and/or the editor(s). MDPI and/or the editor(s) disclaim responsibility for any injury to people or property resulting from any ideas, methods, instructions or products referred to in the content.

