Article

What about the Arsenic? Health Risk Assessment in Canned Tuna Commercialized in Northern Spain

by
Carlos Valiente-Diaz
,
Alejandra del Valle
,
Eva Garcia-Vazquez
,
Gonzalo Machado-Schiaffino
and
Alba Ardura
*,†
Department of Functional Biology, University of Oviedo, 33006 Oviedo, Spain
*
Author to whom correspondence should be addressed.
These authors contributed equally to this work.
Submission received: 24 February 2023 / Revised: 7 March 2023 / Accepted: 8 March 2023 / Published: 9 March 2023

Abstract

:
The incorrect labeling, as well as the bioaccumulation of heavy metals in seafood, represent a recurring problem worldwide, not only for natural resources but also for the consumers’ health. Heavy metals can be accumulated through the food chain and transferred to the final human consumer. Despite its toxicology, arsenic does not have a concentration limit on food, unlike other heavy metals like cadmium, mercury, and lead. Tuna species, with a worldwide distribution and high per capita consumption, represent a well-known toxicological issue caused by heavy metals. In this context, 80 samples of canned tuna were analyzed to check if the information contained in the label was correct and complete. Genetic identification was made by sequencing a fragment of 16S rDNA from 80 samples. For the heavy metal quantification, only those samples with the complete FAO fishing area information on the label were analyzed. Only 29 out of 80 samples presented enough information on the labels for the analysis. Some of the canned tuna commercialized in Spanish markets surpassed the safety standard levels established by the Joint FAO/WHO Expert Committee on Food Activities (JECFA) under the consumption rates of 300 g and 482 g per week. However, the carcinogenic risk (CRlim) for arsenic in all cans and all scenarios was higher than the safety levels.

1. Introduction

The World Health Organization (WHO) has established that “a healthy diet helps us protect against malnutrition in all its forms, as well as non-communicable diseases (NCDs), including such as diabetes, heart disease, stroke, and cancer”. To achieve this, it is important to guarantee food safety measures to ensure access to enough safe food to satisfy the nutritious needs of the individual to reach an active and healthy lifestyle [1]. A correct label is mandatory for responsible consumption and sustainable exploitation. Therefore, international organisms, such as the European Union, have established certain rules that all canned fish products must follow. In the European region, UE labeling rules (UE 1379/2013) determine that labels must include the scientific name of the species, the commercial name, the capturing method, the capture zone, and the expiration date, being the date compulsory only when the product is packed. However, this norm is often not followed, usually because of incomplete information presented on the labels [2]. Nevertheless, the correct species identification of the product can be difficult, especially with processed food, due to the loss of diagnostic traits during processing. In these cases, DNA-based technologies, especially DNA barcoding, come in handy to identify the species and maintain correct traceability throughout the process [3,4].
Due to the rising awareness of consumers toward eating healthy food [5], there has been an increase in fish consumption over the past years [6]. Fish constitute an essential food in the healthy diets of most European countries because its flesh has high-quality protein and vitamins [7]. Fish flesh also provides essential amino acids and omega-3 fatty acids, which protect against coronary heart diseases [7]. Despite their high nutritive value, fish, along with shellfish, are considered one of the types of food that contributes the most to the total intake of heavy metals for humans [8,9]. Heavy metals can cause serious pathologies if the daily intake exceeds the safety limits established by health organizations (e.g., World Health Organization, WHO) [10], even at low levels of exposure [11].
Although heavy metals arise naturally from the earth’s crust through weathering and volcanic eruptions [12], most of the heavy metals present in the ocean waters have an anthropogenic origin [13], being agriculture, industrial use and production, and mining, the most relevant [14]. Some of those metals, such as copper, chromium, nickel, and zinc, have an important role in the development of organisms [15]. However, some others, such as arsenic, cadmium, lead, and mercury, are toxic and have no part in metabolism reactions [16]. Therefore, the world health organization classified them as the top ten chemicals of major public health concern [17]. Nowadays, there are laws that limit the quantity of cadmium, lead, and mercury that certain foods can have, as in the EU regulations EC No 1881/2006; however, there is no limit established for arsenic. Furthermore, there is not even a safety limit established by the WHO, as the previous one was removed due to not being health-protective under the new studies about the toxicity of this element [18]. Arsenic in ocean waters have two origins: natural processes as rock weathering and geothermal activities, and anthropogenic processes as mining and smelting [19]. Arsenic does not degrade over time and is very soluble in aquatic environments, which facilitates its bioaccumulation [20].
There are differences between fish species regarding the content of heavy metals [21]. For example, herbivorous species tend to have lower contents than many carnivorous [22,23]. The reason is that, as heavy metals are not biodegradable, their accumulation can be magnified at the top of the food chain, where big fishes like tunas are placed [24]. Moreover, different bioaccumulation patterns have been reported for distinct species from the same genus, such as tuna species, for example [25]. The capture zone is also a determinant regarding pollutant bioaccumulation on fish [26]. Several studies have found differences in the concentration of heavy metals in fish from the same species but different capture zones ([26] and references therein). However, regional differences within tuna species have also been reported; as an example, Thunnus albacares from the northwest Pacific Ocean contain less mercury than those caught in the middle of the North Pacific or in the Atlantic Ocean [27]. Thus, bioaccumulation is also affected by the environmental concentration of the pollutant that, as in the case of mercury, differs between oceanic regions [28]. Another factor that may contribute to fish’s heavy metal content is commercial processing. Several studies have demonstrated that canned fish contain fewer heavy metals than fresh fish [29,30], perhaps because of the species or the size used in these processed products [31].
This study focuses on canned tuna because it has been widely studied before due to it being the most consumed processed fish [32]. The main objective was to assess if there is a risk in consuming canned tuna from Spanish markets. For this purpose, the concentration of arsenic, cadmium, chromium, copper, lead, mercury, nickel, and zinc was determined. Target hazard quotients (THQs), total target hazard quotients (TTHQs), and consumption rate limits (CRlims) were calculated for three different scenarios and compared with recommended values provided by health organizations (JEFCA, WHO). From the literature above, we expected that the tunas from more polluted zones, such as tunas from African waters (FAOs 34, 47, and 51), would have more heavy metals bioaccumulated than those from less contaminated waters, e.g., tunas from the Pacific Ocean (FAOs 71 and 77), therefore, posing a bigger risk to human health.

2. Material and Methods

2.1. Sampling

A total of 80 tuna cans were collected from local supermarkets in Asturias, Northern Spain in 2021. The information contained in the labels was digitally recorded. According to the European legislation (European Commission, 2015; European Regulation 2013), commercial designation, scientific name, production method, fishing gear, capture zone and identification mark must be displayed on the label (Supplementary Table S1).

2.2. DNA Extraction and Identification

DNA from 80 cans (Supplementary Table S1) was extracted using the GeneMATRIX Food-Extract DNA purification kit, following the manufacturer’s instructions. This kit is specifically designed to use in processed products, such as canned food [33]. A 102 bp fragment of 16S rDNA, used previously in highly processed food [34], was amplified by PCR using a combination of one forward primer and two reverse primers, following Horreo et al. [34]: 16S-HF (5′-ATAACACGAGAAGACCCT-3′), 16S-HR1 (5′-CCCACGGTCGCCCCAAC-3′) and 16S-HR2 (5′-CCCGCGGTCGCCCCAAC-3′). PCR amplification was carried out in a total volume of 40 µL, containing 1X buffer GoTaq® DNA Polymerase, 2.5 mM Mg2, 0.25mM dNTPs, 20 pmol of each 16S-H primer, 20 ng of DNA template, and 1 U of GoTaq® DNA Polymerase. PCR amplifications were carried out with the following conditions: an initial denaturalization step at 95 °C for 5 min, followed by 35 cycles of an initial denaturalization step at 95 °C for 10 s, an annealing phase at 61 °C for 20 s, and an extension phase at 72 °C for 30 s, with a final extension phase of 72 °C for 20 min.
PCR success was measured by visualizing the PCR products using 2% agarose gel stained with 10 mg/µL of SympleSafeTM (EURx, Gdansk, Poland). Amplicons were sent to Macrogen Spain, Inc. (Madrid, Spain) for Sanger sequencing.
Outcome sequences were trimmed and edited with the program BioEdit Sequence Alignment Editor [35]. Finally, edited sequences were identified by comparing them with the references of GenBank database through the BLAST (Basic Local Alignment Search Tool) algorithm (http://0-www-ncbi-nlm-nih-gov.brum.beds.ac.uk/genbank/; accessed on 5 December 2022).

2.3. Heavy Metal Content Analysis

Following Steinhausen et al. [36], 0.5 mg from each sample was digested with a mixture of HNO3 (7 mL) and H2O2 (1 mL) in a microwave digestion system (Milestone HPR-FO-20) at 15,000 W for 0.5 h. The concentrations of eight heavy metals: arsenic (As), cadmium (Cd), chromium (Cr), copper (Cu), lead (Pb), mercury (Hg), nickel (Ni), and zinc (Zn), were measured in the Severo Ochoa Scientific–Technologic Center in the University of Oviedo (Oviedo, Spain) using inductively coupled plasma mass spectrometry in Agilent 7900 Series ICP-MS. The sensitivity of this method was determined according to the detection limits from this spectrometer, which were 0.0124 μg/kg for Cr, 0.009031 μg/kg for Co, 0.01331 μg/kg for Ni, 0.01454 μg/kg for Cu, 0.08849 μg/kg for Zn, 0.04129 μg/kg for As, 0.01523 μg/kg for Cd, 0.02804 μg/kg for Hg, and 0.007041 μg/kg for Pb.
For better validation, an analysis of five metals in fish muscle was performed on the certified European Reference Material ERM® BB422 (fish muscle from saithe Pollachius virens) ([36] and references therein). The measurements obtained for that sample were within the validation range of 15% related to the certified value for four elements. In mg/kg, the results were: 0.0076 (0.0075 certified) for Cd, 1.6 (1.67 certified) for Cu, 0.64 (0.601) for Hg, and 16 (16 certified) for Zn. From the results of the certified sample, the measured value of As (16 mg kg−1) deviated 26% from the certified value of 12.7, being outside of the 15% validation range (10.795–14.605). Although corrections are not made in other studies [37,38], this datum will be corrected, reducing by 26% the value obtained.

2.4. Health Risk Parameters

Following the USEPA guidelines [39,40,41], this study assumed that the metals are completely adsorbed and that the concentration of the heavy metals is not affected by the cooking process. Besides, following the precautionary approach implemented in other studies [37,38], we assumed that the metals are abundant in their most harmful forms: arsenic as inorganic arsenic, chromium as chromium (VI), and mercury as organic mercury (methylmercury). Three different scenarios were considered: a conservative scenario, with a consumption of 100 g of canned tuna per week, following Miedico et al. [42]; an intermediate scenario with two servings (300 g) of tuna per week, following the European Commission recommendations [43]; and a scenario where all the fish protein comes from canned tuna (482 g), following Lofstedt et al.’s [44] fish intake estimations for Spain, as all samples are commercialized in this country.

2.5. Determination of the Target Hazard Quotient (THQ)

THQ is a ratio between a determined dose of a pollutant and the dose level (RfDo). It is commonly used to determine the carcinogenicity of a certain food. If the THQ value is smaller than one, there will be no adverse effect on the consumers. The THQ formula applied was previously validated in several studies [10,36,45,46].
THQ = 10−3 × EF × ED × FIR × CM/(RfDo × Bwa × ATn)
where EF = the frequency of exposure (365 days/year), ED = the period of exposure (the age of the consumers, in our case, adults = 70 years), FIR = food intake rate (kg/day), CM = the concentration of heavy metal present on the sample (μg/kg), RfDo = the oral reference dose for each heavy metal (mg/kg/day), BWa = the average body weight (70.8 kg for adults [47]), and ATn = the period of exposure for non-carcinogens (number of exposure days, in our case 70 years * 365 days/year).

2.6. Determination of the Total Target Hazard Quotient (TTHQ)

In food, more than one metal is ingested at the same time, therefore, it is necessary to calculate a global risk. The TTHQ calculates the risks taking into consideration the additive effect of the heavy metals. If the TTHQ value is smaller than one, there will be no adverse effect on the consumers. The formula consists of the addition of the THQ of each metal [45,48].
TTHQ = THQAs + THQCd + THQCr + THQCu + THQHg + THQNi + THQPb + THQZn

2.7. Determination of the Maximum Allowable Fish Consumption Rate (CRlim)

The toxicity of a pollutant depends on the concentration and the quantity consumed. The maximum allowable fish consumption rate (CRlim) for non-carcinogenic heavy metals was calculated with the following formula [39,49,50]:
CRlim = RfD × BWa/CM
where RfD = oral reference dose (Table 1) [51,52], BWa = the average body weight (70.8 kg for adults [39]), and CM = the concentration of heavy metal present in the sample (mg/kg).
For heavy metals with a carcinogenic effect, such as Cr, As, and Pb [36,39], the maximum allowable fish consumption rate (CRlim) was calculated with the formula [36,53].
CRlim = ARL × BWa/(CM × CSF)
where ARL = the maximum acceptable cancer risk level (10−5) [34], BWa = the average body weight (70.8 kg for adults, [47]), CM = the concentration of heavy metal present on the sample (mg/kg), and CSF = the carcinogenic slope factor (Table 1) [37].

2.8. Statistical Analysis

To assess the best criteria to compare the data, and due to the lack of homoscedasticity shown by the Levene test, non-parametric tests were made. Interaction between the genus and capture zone was measured by performing a Permanova analysis. Next, samples were divided into groups according to the genus, genetically identified, and the capture zone provided on the label. The Kruskal–Wallis non-parametric test was used to assess the differences between groups, followed by a Mann–Whitney U non-parametric test for paired comparisons. A significance level of 0.05 was set for all comparisons. Data were analyzed using PAST software [54]. Boxplots were generated using Excel Software [55].

3. Results

3.1. Genetic Identification

In this study, 80 canned tuna samples were genetically identified using DNA barcoding. DNA amplification and PCR amplification were successful in all samples. Only one out of the 80 samples (sample 31) were presumably mislabeled, considering the reduced number of nucleotides (102 bp) analyzed (Supplementary Table S2). Most of the samples gathered in this study had incomplete information on the label (Figure 1).
From the 80 cans analyzed, 27 (33.75%) did not provide the capture zone, while 23 (28.75%) provided several capture zones. Therefore, only 29 out of 80 samples (31.25%) had all the information required on the label for the study. Still, one can (sample 31) had an incorrect species name on the label, and four out of those 29 samples (samples 17, 19, 24, and 25) presented incomplete information on the labels about the species identification, according to the UE 1379/2013 labeling rules (Supplementary Table S1), as they did not provide the scientific name of the species, only the common name.

3.2. Heavy Metals Concentrations

The mean concentrations and the standard deviation of the eight heavy metals studied were calculated for all samples with complete information on the labels (29 samples; Figure 2, Supplementary Table S3). EU regulations (EC No 1881/2006, available at https://eur-lex.europa.eu/legal-content/ES/TXT/HTML/?uri=CELEX:32006R1881&from=ES; accessed on 23 January 2023) of contaminant concentrations in food products establish a limit of 0.1 mg/kg of Cd, 1 mg/kg of Hg, and 0.3 mg/kg of Pb in marine predator fish, which includes Thunnus spp. and Katsuwonus spp. Using these limits, one can (sample 58) was above the limit for Cd (0.117 mg/kg).

3.3. Statistics

All samples were divided into groups based on the genus and their capture zone. The Kruskal–Wallis non-parametric test found significant differences for cadmium (H = 12.1; p = 0.033), copper (H = 11.09; p = 0.050), mercury (H = 16.99; p = 0.005), and zinc (H = 13.83; p = 0.017). When performing paired comparisons, all heavy metals had at least two populations that were significantly different, except for lead (Supplementary Table S4). No general pattern could be inferred from the differences.
According to the Permanovas performed, mercury was the only heavy metal influenced exclusively by the capture zone (F = 2.582, d.f. = 4, p = 0.040). Arsenic was influenced by the genus (F = 3.895, d.f. = 1, p = 0.037) and was the only heavy metal that exhibited a significant interaction effect between the genus and the capture zone (F = 2.120, d.f. = 4, p = 0.001). Cadmium, copper, and zinc were influenced by both the genus (cadmium F = 5.215, d.f. = 1, p = 0.006, copper F = 4.772, d.f. = 1, p = 0.026, zinc F = 5.875, d.f. = 1, p = 0.011), and the capture zone (cadmium F = 2.802, d.f. = 4, p = 0.028, copper F = 2.304, d.f. = 4, p = 0.049, zinc F = 2.835, d.f. = 4, p = 0.025). Neither the genus nor the capture zone, nor the interaction between both was significant for chromium, lead, and nickel.

3.4. Health Risk Assessment

All health risk parameters calculated in this study are gathered in Table 2.
None of the THQs calculated in this study for the conservative scenario of 100 g/week was higher than one, being considered a non-risk for humans over a lifetime exposure [56,57]. However, for the 300 g/week scenario, two cans (sample 30 and 60) surpassed the safety levels for Hg. For the last scenario of 482 g/week, six cans (samples 30, 60, 61, 76, 78, and 79) had more concentration of Hg than the safety recommendations, as did two cans (samples 51 and 61) for As.
According to TTHQ values, none of the cans for the conservative case scenario of 100 g/week surpassed the safety levels of 1. Two cans (sample 30 and 60) surpassed the safety limit. However, for the 482 g/week scenario, 15 cans surpassed the safety limit (samples 14, 30, 31, 32, 51, 54, 55, 59, 60, 61, 76, 77, 78, 79, and 80).
Regarding the consumption rate limits, none of the CRlims were inferior to the safety levels for the conservative scenario of 100 g per week, which places them as a “non-hazardous” food. However, samples 30 and 60 exceeded the safety levels for mercury for the intermediate scenario of 300 g per week, and for the 482 g scenario, sample 51 exceeded the safety levels for arsenic, and sample 30, 60, and 79 for mercury.
For carcinogenic risks, all cans surpassed the safety limit for carcinogenic arsenic in all scenarios proposed in this study. Samples 15, 23, and 79 for carcinogenic chromium surpassed the safety levels of the conservative scenario of 100 g per week, which represents a risk for human health. Four cans (samples 15, 23, 78, and 79) exceeded the safety levels for carcinogenic chromium for the intermediate scenario of 300 g per week. For the 482 g scenario, samples 15, 20, 23, 24, 30, 59, 78, and 79 surpassed the safety levels for chromium. None of the samples surpassed the safety levels for carcinogenic lead in any scenario proposed in this study.

4. Discussion

The results from this study provide insights into two main issues concerning food safety: traceability by species authentication and a health risk assessment based on the heavy metal content of the canned tuna. Regarding traceability, most tuna cans studied did not follow the European labeling rules. Breaking the labeling rules may result in a risk for both the environment and the consumer. With regard to the consumer, mislabeling is considered fraud, as it affects the consumers’ right to choose the species they buy. This is especially important for allergic consumers and for those concerned about species conservation issues [2,58,59]. Regarding the environment, mislabeling contributes to bad population monitoring, making it impossible to know the actual exploitation rate of the species. It also makes difficult any type of conservation effort that could be needed [58] due to inaccurate estimations of the populations, risking the sustainability of the stock [59] and enabling possible local extinctions caused by overfishing [60]. Some of the cans included more than one capture zone, which does not break the UE 1379/2013 labeling rules but makes it impossible to know the exact capture zone, so impeding informed consumer’s choice.
Regarding the heavy metal accumulation, from the three heavy metals with legal limits established (Cd, Hg, and Pb), mercury was the most abundant, followed by cadmium and lead (Figure 2). Other studies, such as Pappalardo et al. [61], found a similar bioaccumulation pattern for both brine and oil-canned tuna. However, these results contradict, at least partially, the results found in other studies about heavy metal concentration in canned tuna. For example, Russo et al. [62] found that Pb was the most abundant heavy metal, followed by Hg and Cd. This trend seems to be a general pattern for most canned tuna commercialized in different countries such as Saudi Arabia, Libya, and the United States [63,64,65]. One explanation may be that canned tuna from both Pappalardo et al. [61] and our study were from the same or similar capture zones, while canned tuna from the other studies were from a different area.
The Kruskal–Wallis test results showed differences in heavy metal concentrations for cadmium, copper, mercury, and zinc. The significant differences found for cadmium can be explained by the tendency of this metal to bind weakly under reducing conditions, making it very mobile in the ocean and relatively easy to bioaccumulate [66]. Copper significance was marginal (p = 0.050), and more samples would be needed to verify if there are real differences between the cans or if the differences found in this study were due to a sample size effect. Mercury levels in tunas are known to be highly variable [67] and driven mainly by anthropogenic activities [68], which can explain significant differences between the groups. Zinc is a heavy metal often found in manufactured pesticides and agricultural residues [69]. It also arrives in the sea as ZnSO4, an anthropogenic residue that appears in batteries, trash bins, air-conditioning pipes, and car tires [70]; therefore; coasts with those types of e-wastes, such as the African coasts of FAOs 34 and 47 [71], would tend to bioaccumulate more zinc.
No significant difference between populations has been shown for lead concentration (Supplementary Table S4). This is an unexpected result, as previous studies have shown that lead bioaccumulation tends to be very variable in tuna species [72]. A possible explanation is that the concentration of lead could be considerably reduced during tuna processing [73], eliminating the differences in the process. It can also be due to the limited sample size caused by the exclusion of samples with incomplete information on the labels. Further studies should consider this when verifying these results.
According to the Permanova analysis, mercury bioaccumulation seems to be influenced only by the capture zone and not by the genus. This goes against the literature, where differences in mercury bioaccumulation of tuna have been widely reported, even at the species level (e.g., [25,74,75]). Arsenic was influenced by the genus but not by the capture zone. Previous studies found significant differences in the bioaccumulation of mercury caused by the capture zone [26,27], but there is no previous literature on arsenic. Furthermore, arsenic was the only heavy metal that showed an interaction effect between the capture zone and the genus. All this could be caused by a sample size effect. More samples are needed to work on these results.
Despite Zn being the most abundant heavy metal in the samples analyzed, it is not the most concerning metal. Even though zinc in high concentrations can be harmful, it constitutes a metabolic heavy metal, taking a key role in the growth and immune system functions [76], in contrast with other heavy metals such as mercury, which is way more dangerous for human health [42,77], especially during fetuses’ development [78]. This concept is better seen when analyzing the TTHQs results. Most of the contribution to the TTHQ comes from arsenic and mercury (more than 85% of all cans studied). High mercury levels are expected in tuna products, as these species tend to bioaccumulate mercury at high rates [77]. Recently, several studies are finding high arsenic levels in tuna species [72,79]. These results enhanced the importance of considering arsenic as a rising contamination issue and the need to establish regulations to limit its concentration in food products, as is the case for cadmium, mercury, and lead.
A similar case happened with the Crlims calculated. Crlims for mercury were the most concerning ones among all the heavy metals studied. Again, this was expected and consistent with previous literature, as tunas tend to bioaccumulate high amounts of mercury [80]. Still, two cans were over the safety limits for mercury for two of the scenarios proposed in this study. Better monitoring of the mercury concentration in tuna cans is advised, as high mercury intake encompasses health risks such as cancer or neurodevelopmental effects [81].
Regarding carcinogenic Crlims, calculations were made assuming that all the arsenic present was in the carcinogenic form and according to the USEPA guidelines [39,40,41], which assumes that the metals are completely adsorbed and that the cooking process does not affect the concentration of the heavy metals. It is possible that if the carcinogenic CRlims were based only on the carcinogenic forms rather than the total amount of arsenic and chromium, they could be safe to eat. Even so, pregnant women should be aware of canned tuna consumption, as they represent the most sensitive group of the population to carcinogenic arsenic [81]. Exposure to arsenic during pregnancy is linked to fetal loss and birth weight, and the cancer effects for children can manifest even several years after birth [82].

5. Conclusions

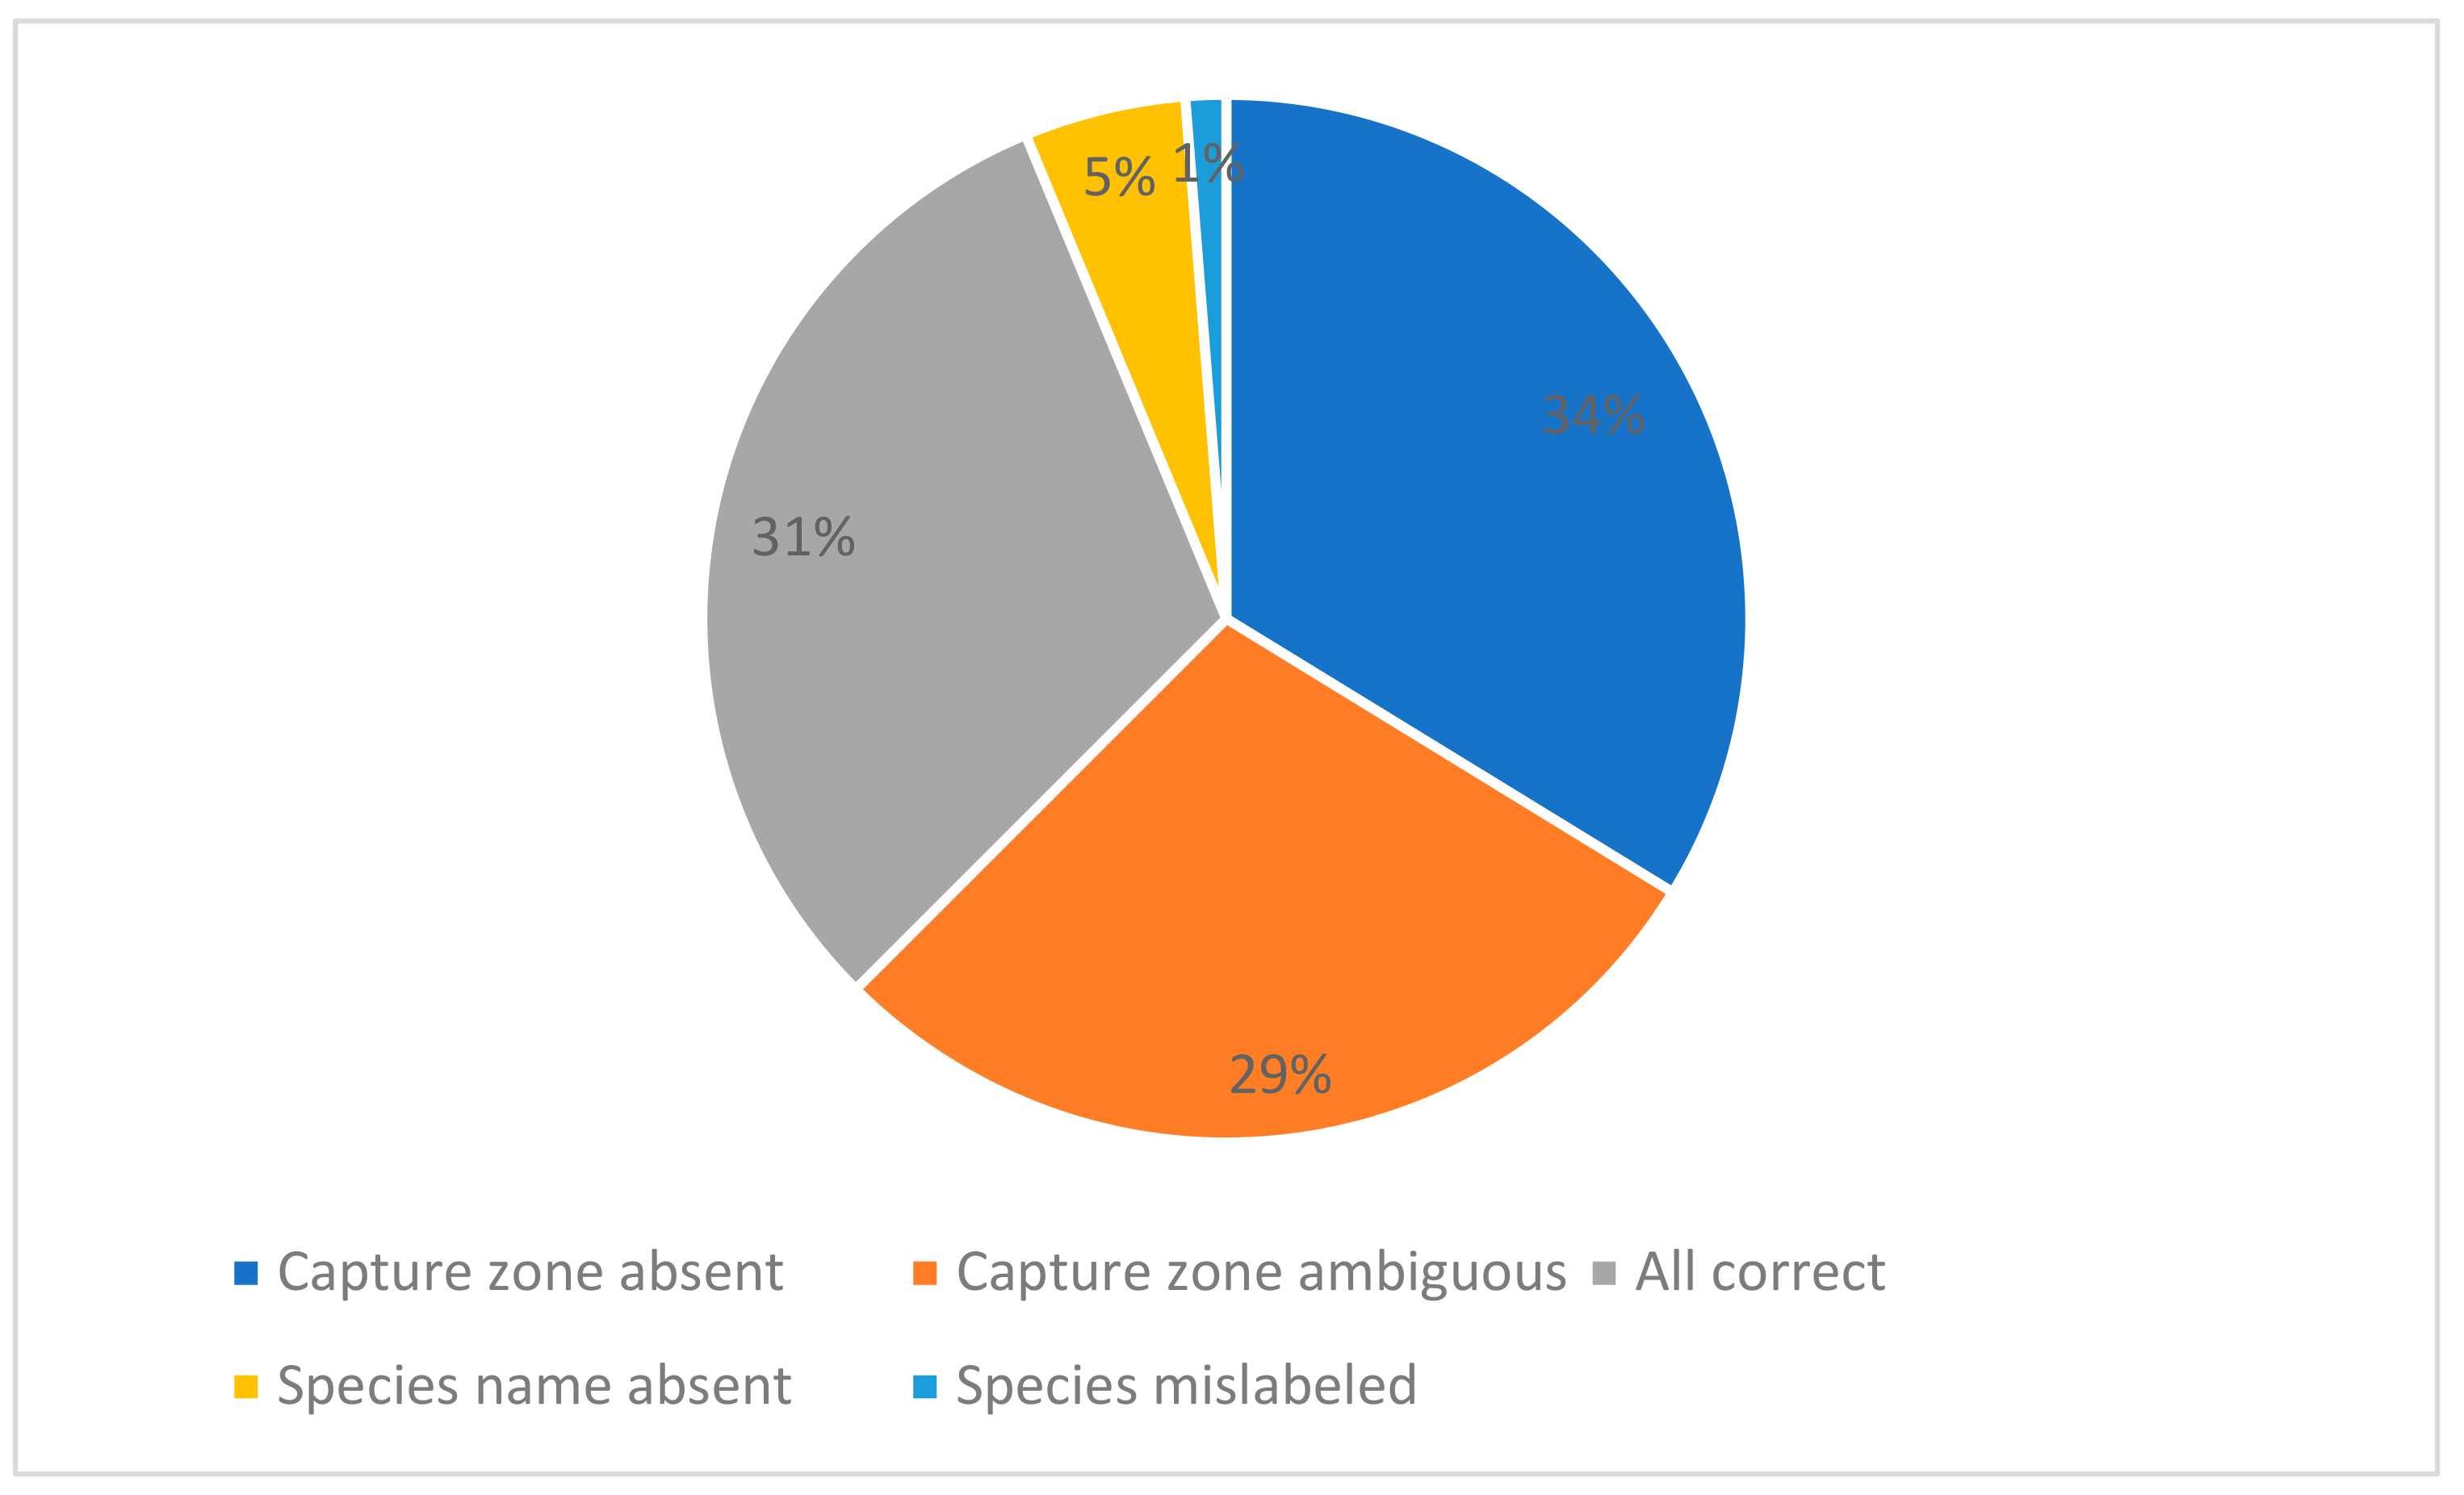
  • Most of the canned tuna samples were incompletely labeled (68.75%). A correct label is mandatory for responsible consumption and sustainable exploitation.
  • All the canned tuna from this study, except samples from Thunnus 71, surpassed the safety standard levels of TTHQ under the consumption rate of 482g per week, which represents a risk to human health.
  • The carcinogenic risk (CRlim) for arsenic in all cans and the carcinogenic chromium for three cans (samples 15, 23, and 79) surpassed the safety limits for all scenarios proposed in this study, which represents a high risk for human health.
  • Stricter control measures and concentration monitoring of arsenic are needed to ensure food safety.

Supplementary Materials

The following supporting information can be downloaded at: https://0-www-mdpi-com.brum.beds.ac.uk/article/10.3390/pr11030824/s1. Table S1: General information about samples. Table S2: BLAST algorithm output for species identification. Table S3: Mean concentration of heavy metals for each sample. Table S4: Mean and standard deviations of heavy metal concentrations (μg/kg), EWIs (μg/kg/day), TTHQs, TTHQs, CRlims (kg/day), and carcinogenic CRlims (kg/day) of each heavy metals for each population. Table S5: Information about the combination of populations for the statistical analysis. Figure S1. Mann-Whitney test results of the concentration of each heavy metal (μg/kg) for all populations studied.

Author Contributions

Conceptualization, E.G.-V., A.A. and G.M.-S.; Methodology, E.G.-V., A.A. and A.d.V.; formal analysis, A.A., G.M.-S., C.V.-D.; investigation, A.d.V.; data curation, E.G.-V.; writing—original draft preparation, C.V.-D.; writing—review and editing, A.A. and G.M.-S.; supervision, A.A., G.M.-S. and E.G.-V. All authors have read and agreed to the published version of the manuscript.

Funding

This study has been supported from the Asturias Government, Grant SV-PA-21-AYUD/2021/50967.

Data Availability Statement

All the data is available though the article, including Tables, Figures and Supplementary data.

Conflicts of Interest

The authors declare no conflict of interest.

References

  1. FAO. Cumbre mundial sobre la alimentación: 13–17 de noviembre de. In Cumbre Mundial Sobre la Alimentación; FAO: Rome, Italy, 1996. [Google Scholar]
  2. Delpiani, G.; Delpiani, S.; Antoni, M.D.; Ale, M.C.; Fischer, L.; Lucifora, L.; de Astarloa, J.D. Are we sure we eat what we buy? Fish mislabelling in Buenos Aires province, the largest sea food market in Argentina. Fish. Res. 2019, 221, 105373. [Google Scholar] [CrossRef]
  3. Waugh, J. DNA barcoding in animal species: Progress, potential and pitfalls. Bioessays 2007, 29, 188–197. [Google Scholar] [CrossRef] [PubMed]
  4. DeSalle, R.; Goldstein, P. Review and Interpretation of Trends in DNA Barcoding. Front. Ecol. Evol. 2019, 7, 10. [Google Scholar] [CrossRef] [Green Version]
  5. Ghidini, S.; Varrà, M.O.; Zanardi, E. Approaching Authenticity Issues in Fish and Seafood Products by Qualitative Spectroscopy and Chemometrics. Molecules 2019, 24, 1812. [Google Scholar] [CrossRef] [Green Version]
  6. FAO. The State of World Fisheries and Aquaculture. In The State of World Fisheries and Aquaculture; FAO: Rome, Italy, 2020. [Google Scholar] [CrossRef]
  7. Pieniak, Z.; Verbeke, W.; Scholderer, J. Health-related beliefs and consumer knowledge as determinants of fish consumption. J. Hum. Nutr. Diet. 2010, 23, 480–488. [Google Scholar] [CrossRef]
  8. Bae, H.-S.; Kang, I.-G.; Lee, S.-G.; Eom, S.-Y.; Kim, Y.-D.; Oh, S.-Y.; Kwon, H.-J.; Park, K.-S.; Kim, H.; Choi, B.-S.; et al. Arsenic exposure and seafood intake in Korean adults. Hum. Exp. Toxicol. 2016, 36, 451–460. [Google Scholar] [CrossRef]
  9. Bosch, A.C.; O’Neill, B.; Sigge, G.O.; Kerwath, S.E.; Hoffman, L.C. Heavy metals in marine fish meat and consumer health: A review. J. Sci. Food Agric. 2015, 96, 32–48. [Google Scholar] [CrossRef]
  10. Varol, M.; Kaya, G.K.; Alp, A. Heavy metal and arsenic concentrations in rainbow trout (Oncorhynchus mykiss) farmed in a dam reservoir on the Firat (Euphrates) River: Risk-based consumption advisories. Sci. Total. Environ. 2017, 599–600, 1288–1296. [Google Scholar] [CrossRef]
  11. Duffus, J.H. Heavy metals, a meaningless term? Pure Appl. Chem. 2002, 74, 793–807. [Google Scholar] [CrossRef] [Green Version]
  12. Bradl, H. Heavy Metals in the Environment: Origin, Interaction and Remediation; Academic Press: London, UK, 2002; Volume 6. [Google Scholar]
  13. Grecco, L.E.; Gómez, E.A.; Botté, S.E.; Marcos, A.O.; Marcovecchio, J.; Cuadrado, D.G. Natural and antropogenic heavy metals in estuarine cohesive sediments: Geochemistry and bioavailability. Dtsch. Hydrogr. Z. 2011, 61, 285–293. [Google Scholar]
  14. He, Z.L.; Yang, X.E.; Stoffella, P.J. Trace elements in agroecosystems and impacts on the environment. J. Trace Elem. Med. Biol. 2005, 19, 125–140. [Google Scholar] [CrossRef] [PubMed]
  15. Chiesa, L.M.; Ceriani, F.; Procopio, A.; Bonacci, S.; Malandra, R.; Panseri, S.; Arioli, F. Exposure to metals and arsenic from yellow and red tuna consumption. Food Addit. Contam. Part A 2019, 36, 1228–1235. [Google Scholar] [CrossRef]
  16. Chen, P.; Miah, M.R.; Aschner, M. Metals and Neurodegeneration. F1000Research 2016, 5, 366. [Google Scholar] [CrossRef] [Green Version]
  17. World Health Organization (WHO). 10 Chemicals of Public Health Concern. Available online: https://www.who.int/news-room/photo-story/photo-story-detail/10-chemicals-of-public-health-concern (accessed on 26 January 2023).
  18. Evaluations of the Joint FAO/WHO Expert Committee on Food Activities (JEFCA). Arsenic. Available online: https://apps.who.int/food-additives-contaminants-jecfa-database/Home/Chemical/1863 (accessed on 26 January 2023).
  19. Nordstrom, D.K. Worldwide Occurrences of Arsenic in Ground Water. Science 2002, 296, 2143–2145. [Google Scholar] [CrossRef] [PubMed]
  20. Wang, N.; Ye, Z.; Huang, L.; Zhang, C.; Guo, Y.; Zhang, W. Arsenic Occurrence and Cycling in the Aquatic Environment: A Comparison between Freshwater and Seawater. Water 2022, 15, 147. [Google Scholar] [CrossRef]
  21. Lowenstein, J.H.; Burger, J.; Jeitner, C.W.; Amato, G.; Kolokotronis, S.-O.; Gochfeld, M. DNA barcodes reveal species-specific mercury levels in tuna sushi that pose a health risk to consumers. Biol. Lett. 2010, 6, 692–695. [Google Scholar] [CrossRef] [PubMed] [Green Version]
  22. Yi, Y.; Zhang, S. Heavy metal (Cd, Cr, Cu, Hg, Pb, Zn) concentrations in seven fish species in relation to fish size and location along the Yangtze River. Environ. Sci. Pollut. Res. 2012, 19, 3989–3996. [Google Scholar] [CrossRef]
  23. Wijnhoven, S.; Leuven, R.S.E.W.; van der Velde, G.; Jungheim, G.; Koelemij, E.I.; de Vries, F.T.; Eijsackers, H.J.P.; Smits, A.J.M. Heavy-Metal Concentrations in Small Mammals from a Diffusely Polluted Floodplain: Importance of Species- and Location-Specific Characteristics. Arch. Environ. Contam. Toxicol. 2007, 52, 603–613. [Google Scholar] [CrossRef] [Green Version]
  24. Khansari, F.; Ghazi-Khansari, M.; Abdollahi, M. Heavy metals content of canned tuna fish. Food Chem. 2005, 93, 293–296. [Google Scholar] [CrossRef]
  25. Besada, V. Mercury, cadmium, lead, arsenic, copper and zinc concentrations in albacore, yellowfin tuna and bigeye tuna from the Atlantic Ocean. Cienc. Mar. 2006, 32, 439–445. [Google Scholar] [CrossRef]
  26. García, M.; Núñez, R.; Alonso, J.; Melgar, M.J. Total mercury in fresh and processed tuna marketed in Galicia (NW Spain) in relation to dietary exposure. Environ. Sci. Pollut. Res. 2016, 23, 24960–24969. [Google Scholar] [CrossRef] [PubMed]
  27. Nicklisch, S.C.; Bonito, L.T.; Sandin, S.; Hamdoun, A. Mercury levels of yellowfin tuna (Thunnus albacares) are associated with capture location. Environ. Pollut. 2017, 229, 87–93. [Google Scholar] [CrossRef] [PubMed] [Green Version]
  28. Lamborg, C.H.; Hammerschmidt, C.R.; Bowman, K.L.; Swarr, G.J.; Munson, K.M.; Ohnemus, D.C.; Lam, P.J.; Heimbürger, L.E.; Rijkenberg, M.J.A.; Saito, M.A. A global ocean inventory of anthropogenic mercury based on water column measurements. Nature 2014, 512, 65–68. [Google Scholar] [CrossRef]
  29. Olmedo, P.; Pla, A.; Hernández, A.F.; Barbier, F.; Ayouni, L.; Gil, F. Determination of toxic elements (mercury, cadmium, lead, tin and arsenic) in fish and shellfish samples. Risk assessment for the consumers. Environ. Int. 2013, 59, 63–72. [Google Scholar] [CrossRef] [PubMed]
  30. Rasmussen, R.S.; Nettleton, J.; Morrissey, M.T. A Review of Mercury in Seafood. J. Aquat. Food Prod. Technol. 2005, 14, 71–100. [Google Scholar] [CrossRef]
  31. European Food Safety Authority (EFSA). EFSA Provides Advice on the Safety and Nutritional Contribution of Wild and Farmed Fish. Available online: https://www.efsa.europa.eu/en/news/efsa-provides-advice-safety-and-nutritional-contribution-wild-and-farmed-fish (accessed on 22 January 2023).
  32. Hosseini, S.V.; Sobhanardakani, S.; Miandare, H.K.; Harsij, M.; Mac Regenstein, J. Determination of toxic (Pb, Cd) and essential (Zn, Mn) metals in canned tuna fish produced in Iran. J. Environ. Health Sci. Eng. 2015, 13, 1–6. [Google Scholar] [CrossRef] [Green Version]
  33. Jarocki, P.; Targoński, Z. Genetic Diversity of Bile Salt Hydrolases Among Human Intestinal Bifidobacteria. Curr. Microbiol. 2013, 67, 286–292. [Google Scholar] [CrossRef] [Green Version]
  34. Horreo, J.L.; Ardura, A.; Pola, I.G.; Martinez, J.L.; Garcia-Vazquez, E. Universal primers for species authentication of animal foodstuff in a single polymerase chain reaction. J. Sci. Food Agric. 2013, 93, 354–361. [Google Scholar] [CrossRef]
  35. Hall, T.A. BioEdit: A user-friendly biological sequence alignment editor and analysis program for Windows 95/98/NT. Nucleic Acids Symp. Ser. 1999, 41, 95–98. [Google Scholar]
  36. Steinhausen, S.; Agyeman, N.; Turrero, P.; Ardura, A.; Garcia-Vazquez, E. Heavy metals in fish nearby electronic waste may threaten consumer’s health. Examples from Accra, Ghana. Mar. Pollut. Bull. 2021, 175. [Google Scholar]
  37. Ackah, M. Chemosphere soil elemental concentrations, geoaccumulation index, non- carcinogenic and carcinogenic risks in functional areas of an informal e-waste recycling area in Accra, Ghana. Chemosphere 2019, 235, 908–917. [Google Scholar] [CrossRef]
  38. Liu, Q.; Xu, X.; Zeng, J.; Shi, X.; Liao, Y.; Du, P.; Bay, X. Heavy metal concentrations in commercial marine organisms from Xiangshan Bay, China, and the potential health risks. Mar. Pollut. Bull. 2019, 141, 215–226. [Google Scholar] [CrossRef] [PubMed]
  39. USEPA. Risk Assessment Guidance for Superfund, Human Health Evaluation Manual (Part A), Interim Final; EPA 540/1-89/; United States Environmental Protection Agency: Washington, DC, USA, 1989; Volume 1. Available online: http://www.epa.gov/spc/pdfs/rchandbk.pdf (accessed on 10 January 2023).
  40. USEPA. Risk-based Concentration Table; United States Environmental Protection Agency: Philadelphia, PA, USA, 2000. Available online: http://www.epa.gov/spc/pdfs/rchandbk.pdf (accessed on 10 January 2023).
  41. USEPA. Guidance for Assessing Chemical Contaminant Data for Use in Fish Advisories Volume United States Environmental Protection Agency; United States Environmental Protection Agency: Philadelphia, PA, USA, 2000. Available online: https://www.epa.gov/sites/default/files/2015-06/documents/volume2.pdf (accessed on 10 January 2023).
  42. Miedico, O.; Pompa, C.; Moscatelli, S.; Chiappinelli, A.; Carosielli, L.; Chiaravalle, A.E. Lead, cadmium and mercury in canned and unprocessed tuna: Six-years monitoring survey, comparison with previous studies and recommended tolerable limits. J. Food Compos. Anal. 2020, 94, 103638. [Google Scholar] [CrossRef]
  43. European Commission. Food—Based Dietary Guidelines in Europe—Table. Available online: https://knowledge4policy.ec.europa.eu/health-promotion-knowledge-gateway/food-based-dietary-guidelines-europe-table-9_en#ES (accessed on 26 January 2023).
  44. Lofstedt, A.; de Roos, B.; Fernandes, P.G. Less than half of the European dietary recommendations for fish consumption are satisfied by national seafood supplies. Eur. J. Nutr. 2021, 60, 4219–4228. [Google Scholar] [CrossRef]
  45. Chien, L.-C.; Hung, T.-C.; Choang, K.-Y.; Yeh, C.-Y.; Meng, P.-J.; Shieh, M.-J.; Han, B.-C. Daily intake of TBT, Cu, Zn, Cd and As for fishermen in Taiwan. Sci. Total. Environ. 2002, 285, 177–185. [Google Scholar] [CrossRef]
  46. Copat, C.; Arena, G.; Fiore, M.; Ledda, C.; Fallico, R.; Sciacca, S.; Ferrante, M. Heavy metals concentrations in fish and shellfish from eastern Mediterranean Sea: Consumption advisories. Food Chem. Toxicol. 2013, 53, 33–37. [Google Scholar] [CrossRef]
  47. Walpole, S.C.; Prieto-Merino, D.; Edwards, P.; Cleland, J.; Stevens, G.; Roberts, I. The weight of nations: An estimation of adult human biomass. BMC Public Health 2012, 12, 439. [Google Scholar] [CrossRef] [Green Version]
  48. Yang, C.-P.; Liu, Y.; Shan, B.-B.; Xu, J.; Yu, W.; Sun, D.-R.; Zhang, Z.-W. Heavy metal concentrations and associated health risks in edible tissues of marine nekton from the outer Pearl River Estuary, South China Sea. Environ. Sci. Pollut. Res. 2020, 28, 2108–2118. [Google Scholar] [CrossRef]
  49. Gbogbo, F.; Arthur-Yartel, A.; Bondzie, J.A.; Dorleku, W.-P.; Dadzie, S.; Kwansa-Bentum, B.; Ewool, J.; Billah, M.K.; Lamptey, A.M. Risk of heavy metal ingestion from the consumption of two commercially valuable species of fish from the fresh and coastal waters of Ghana. PLoS ONE 2018, 13, e0194682. [Google Scholar] [CrossRef]
  50. Pinzón-Bedoya, C.H.; Pinzón-Bedoya, M.L.; Pinedo-Hernández, J.; Urango-Cardenas, I.; Marrugo-Negrete, J. Assessment of Potential Health Risks Associated with the Intake of Heavy Metals in Fish Harvested from the Largest Estuary in Colombia. Int. J. Environ. Res. Public Health 2020, 17, 2921. [Google Scholar] [CrossRef] [Green Version]
  51. Nahar, J.; Rakib, M.; Sakib, M. Impact of industrially affected soil on humans: A soil-human and soil-plant-human exposure assessment. Toxics 2022, 10, 347. [Google Scholar]
  52. Živković, N.; Takić, L.; Djordjević, L.; Djordjević, A.; Mladenović-Ranisavljević, I.; Golubović, T.; Božilov, A. Concentrations of Heavy Metal Cations and a Health Risk Assessment of Sediments and River Surface Water: A Case Study from a Serbian Mine. Pol. J. Environ. Stud. 2019, 28, 2009–2020. [Google Scholar] [CrossRef] [PubMed]
  53. Sadeghi, M.; Noroozi, M. Carcinogenic and Non-Carcinogenic Risk Assessment of Heavy Metals in Water Resources of North East of Iran in 2018. J. Environ. Health Sustain. Dev. 2021, 6, 1321–1329. [Google Scholar] [CrossRef]
  54. Hammer, Ø.; Harper, D.A.T.; Ryan, P.D. PAST: Paleontological statistics software package for education and data analysis. Palaeontol. Electron. 2001, 4, 1–9. [Google Scholar]
  55. Microsoft Corporation. Microsoft Excel Retrieved. Available online: https://office.microsoft.com/excel (accessed on 10 December 2022).
  56. Ihedioha, J.N.; Atiatah, I.M.; Ekere, N.R.; Asegbeloyin, J.N. Levels of Heavy Metals in Pasta Available in the Nigerian Market: Assessing the Human Health Implications. J. Chem. Health Risks 2018, 8, 95. [Google Scholar] [CrossRef]
  57. Tajdar-Oranj, B.; Shariatifar, N.; Alimohammadi, M.; Peivasteh-Roudsari, L.; Khaniki, G.J.; Fakhri, Y.; Khaneghah, A.M. The concentration of heavy metals in noodle samples from Iran’s market: Probabilistic health risk assessment. Environ. Sci. Pollut. Res. 2018, 25, 30928–30937. [Google Scholar] [CrossRef] [PubMed]
  58. Galal-Khallaf, A.; Ardura, A.; Borrell, Y.J.; Garcia-Vazquez, E. PCR-based assessment of shellfish traceability and sustainability in international Mediterranean seafood markets. Food Chem. 2016, 202, 302–308. [Google Scholar] [CrossRef]
  59. Blanco-Fernandez, C.; Erzini, K.; Rodriguez-Diego, S.; Alba-Gonzalez, P.; Thiam, N.; Sow, F.N.; Diallo, M.; Viðarsson, J.R.; Fernández-Vidal, D.; Gonçalves, J.M.S.; et al. Two Fish in a Pod. Mislabelling on Board Threatens Sustainability in Mixed Fisheries. Front. Mar. Sci. 2022, 9. [Google Scholar] [CrossRef]
  60. Agnew, D.J.; Pearce, J.; Pramod, G.; Peatman, T.; Watson, R.; Beddington, J.R.; Pitcher, T.J. Estimating the Worldwide Extent of Illegal Fishing. PLoS ONE 2009, 4, e4570. [Google Scholar] [CrossRef] [Green Version]
  61. Pappalardo, A.M.; Copat, C.; Ferrito, V.; Grasso, A.; Ferrante, M. Heavy metal content and molecular species identification in canned tuna: Insights into human food safety. Mol. Med. Rep. 2017, 15, 3430–3437. [Google Scholar] [CrossRef] [Green Version]
  62. Russo, R.; Voi, A.L.; De Simone, A.; Serpe, F.; Anastasio, A.; Pepe, T.; Cacace, D.; Severino, L. Heavy Metals in Canned Tuna from Italian Markets. J. Food Prot. 2013, 76, 355–359. [Google Scholar] [CrossRef] [PubMed] [Green Version]
  63. Ashraf, W.; Seddigi, Z.; Abulkibash, A.; Khalid, M. Levels of Selected Metals in Canned Fish Consumed in Kingdom of Saudi Arabia. Environ. Monit. Assess. 2006, 117, 271–279. [Google Scholar] [CrossRef] [PubMed]
  64. Capar, S.G. Survey of Lead and Cadmium in Adult Canned Foods Eaten by Young Children. J. AOAC Int. 1990, 73, 357–364. [Google Scholar] [CrossRef]
  65. Voegborlo, R.; El-Methnani, A.; Abedin, M. Mercury, cadmium and lead content of canned tuna fish. Food Chem. 1999, 67, 341–345. [Google Scholar] [CrossRef]
  66. Neff, J. Cadmium in the Ocean. In Bioaccumulation in Marine Organisms; Elsevier: Amsterdam, The Netherlands, 2002; pp. 89–102. [Google Scholar] [CrossRef]
  67. Norhazirah, A.A.; Shazili, N.A.M.; Kamaruzzaman, Y.; Sim, S.F.; Ahmad, A.; Ong, M.C. Heavy metals in tuna species meat and potential consumer health risk: A review. IOP Conf. Series Earth Environ. Sci. 2020, 494, 012013. [Google Scholar] [CrossRef]
  68. Semeniuk, K.; Dastoor, A. Development of a global ocean mercury model with a methylation cycle: Outstanding issues. Glob. Biogeochem. Cycles 2017, 31, 400–433. [Google Scholar] [CrossRef]
  69. Badr, N.B.E.; El-Fiky, A.A.; Mostafa, A.R.; Al-Mur, B.A. Metal pollution records in core sediments of some Red Sea coastal areas, Kingdom of Saudi Arabia. Environ. Monit. Assess. 2008, 155, 509–526. [Google Scholar] [CrossRef]
  70. El-Sorogy, A.S.; Tawfik, M.; Almadani, S.A.; Attiah, A. Assessment of toxic metals in coastal sediments of the Rosetta area, Mediterranean Sea, Egypt. Environ. Earth Sci. 2016, 75, 1–11. [Google Scholar] [CrossRef]
  71. Garcia-Vazquez, E.; Geslin, V.; Turrero, P.; Rodriguez, N.; Machado-Schiaffino, G.; Ardura, A. Oceanic karma? Eco-ethical gaps in African EEE metal cycle may hit back through seafood contamination. Sci. Total. Environ. 2020, 762, 143098. [Google Scholar] [CrossRef]
  72. Núñez, R.; García, M.; Alonso, J.; Melgar, M.J. Arsenic, cadmium and lead in fresh and processed tuna marketed in Galicia (NW Spain): Risk assessment of dietary exposure. Sci. Total. Environ. 2018, 627, 322–331. [Google Scholar] [CrossRef]
  73. Ganjavi, M.; Ezzatpanah, H.; Givianrad, M.H.; Shams, A. Effect of canned tuna fish processing steps on lead and cadmium contents of Iranian tuna fish. Food Chem. 2010, 118, 525–528. [Google Scholar] [CrossRef]
  74. Cammilleri, G.; Vazzana, M.; Arizza, V.; Giunta, F.; Vella, A.; Dico, G.L.; Giaccone, V.; Giofrè, S.V.; Giangrosso, G.; Cicero, N.; et al. Mercury in fish products: What’s the best for consumers between bluefin tuna and yellowfin tuna? Nat. Prod. Res. 2017, 32, 457–462. [Google Scholar] [CrossRef] [PubMed]
  75. Burger, J.; Gochfeld, M. Mercury in canned tuna: White versus light and temporal variation. Environ. Res. 2004, 96, 239–249. [Google Scholar] [CrossRef] [PubMed]
  76. Hambidge, M.K.; Krebs, N.F. Zinc Metabolism. In Fetal and Neonatal Physiology, 5th ed.; Saunders Elsevier: Amsterdam, The Netherlands, 2017. [Google Scholar]
  77. Tseng, C.-M.; Ang, S.-J.; Chen, Y.-S.; Shiao, J.-C.; Lamborg, C.H.; He, X.; Reinfelder, J.R. Bluefin tuna reveal global patterns of mercury pollution and bioavailability in the world’s oceans. Proc. Natl. Acad. Sci. USA 2021, 118, e2111205118. [Google Scholar] [CrossRef] [PubMed]
  78. World Health Organization (WHO). Mercury and Health. Available online: https://www.who.int/news-room/fact-sheets/detail/mercury-and-health (accessed on 10 January 2023).
  79. Andayesh, S.; Hadiani, M.R.; Mousavi, Z.; Shoeibi, S. Lead, cadmium, arsenic and mercury in canned tuna fish marketed in Tehran, Iran. Food Addit. Contam. Part B 2015, 8, 93–98. [Google Scholar] [CrossRef]
  80. National Research Council (US). Committee on the Toxicological Effects of Methylmercury; National Academies Press: Washington, DC, USA, 2000.
  81. National Research Council (US). Arsenic in Drinking Water; National Academies Press: Washington, DC, USA, 1999.
  82. Tofail, F.; Vahter, M.; Hamadani, J.D.; Nermell, B.; Huda, S.N.; Yunus, M.; Rahman, M.; Grantham-McGregor, S.M. Effect of Arsenic Exposure during Pregnancy on Infant Development at 7 Months in Rural Matlab, Bangladesh. Environ. Health Perspect. 2009, 117, 288–293. [Google Scholar] [CrossRef]
Figure 1. Circular graphic of the label incompletion for all samples studied, according to the European labeling rules (UE 1379/2013). Capture zone absent (n = 27) where cans were without information about the capture zone on the label. Capture zone ambiguous (n = 23) where cans had more than one capture zone present on the label. Species name absent (n = 4) where cans had no species name on the label. Species mislabeled (n = 1) where cans had an incorrect species name labeled. All correct (n = 25) were cans with all the specific information required on the label.
Processes 11 00824 g001
Figure 2. Boxplots of the concentration of each heavy metal (μg/kg) for all groups studied. The mean heavy metal concentrations and their standard deviations for each can are gathered in Supplementary Table S3. Thunnus 71 represents individuals from the species Thunnus albacares caught in the FAO 71; Thunnus 51 Thunnus albacares from FAO 51; Thunnus 77 Thunnus albacares and Thunnus alalunga from FAO 77; Katsuwonus 71 Katsuwonus pelamis from FAO 71; Katsuwonus 34 Katsuwonus pelamis from FAO 34; Thunnus 47 Thunnus alalunga from FAO 47.
Processes 11 00824 g002
Table 1. Thresholds of tolerable ingestion values for the eight heavy metals analyzed. n/a, not applicable.
Tabulated VariablesAsCdCrCuHgNiPbZn
Oral reference dose (mg/kg/day)0.00030.00100.00300.04000.00030.02000.00350.300
Carcinogenic slope factor (mg/kg/day)1.500n/a0.500n/an/an/a0.0085n/a
Table 2. Means and standard deviations of THQs, TTHQs, CRlims (kg/day), and carcinogenic CRlims (kg/day) of each heavy metal for each group. The 1st scenario corresponds with an ingestion rate of 100 g/week. The 2nd scenario corresponds with an ingestion rate of 300 g/week. The 3rd scenario corresponds with an ingestion rate of 482 g/week. Values shaded in grey exceed the safety levels for all scenarios. Values shaded in green exceed the safety levels for the 3rd scenario proposed.
AsCdCuCrPbHgNiZn
Thunnus 71
THQ
1st scenario0.080 (0.037)0.003 (0.002)0.002 (0.001)0.004 (0.005)0.000 (0.001)0.074 (0.049)0.002 (0.001)0.004 (0.001)
2nd scenario0.240 (0.111)0.009 (0.007)0.005 (0.002)0.011 (0.014)0.001 (0.000)0.221 (0.147)0.005 (0.002)0.011 (0.002)
3rd scenario0.386 (0.179)0.015 (0.011)0.008 (0.003)0.017 (0.022)0.001 (0.001)0.355 (0.236))0.008 (0.003)0.018 (0.003)
TTHQ
1st scenario0.1670.1670.1670.1670.1670.1670.1670.167
2nd scenario0.5020.5020.5020.5020.5020.5020.5020.502
3rd scenario0.8070.8070.8070.8070.8070.8070.8070.807
CRlim0.217 (0.100)6.757 (4.303)10.117 (4.017)8.810 (4.843)72.370 (35.106)0.289 (0.174)10.267 (4.043)4.018 (0.791)
CRlim carc0.005 (0.002)N.A.N.A.0.059 (0.032)24.326 (11.800)N.A.N.A.N.A.
Thunnus 51
THQ
1st scenario0.093 (0.033)0.002 (0.000)0.001 (0.000)0.001 (0.001)0.000 (0.000)0.180 (0.183)0.001 (0.000)0.003 (0.000)
2nd scenario0.278 (0.099)0.007 (0.001)0.004 (0.001)0.004 (0.002)0.000 (0.000)0.541 (0.549)0.003 (0.001)0.010 (0.000)
3rd scenario0.447 (0.159)0.011 (0.001)0.007 (0.001)0.006 (0.003)0.000 (0.000)0.869 (0.882)0.005 (0.002)0.017 (0.000)
TTHQ
1st scenario0.2820.2820.2820.2820.2820.2820.2820.282
2nd scenario0.8470.8470.8470.8470.8470.8470.8470.847
3rd scenario1.3611.3611.3611.3611.3611.3611.3611.361
CRlim0.169 (0.063)6.583 (0.938)10.797 (1.956)12.994 (5.939)166.410 (92.610)0.140 (0.090)15.049 (6.557)4.117 (0.057)
CRlim carc0.004 (0.001)N.A.N.A.0.087 (0.040)55.936 (31.129)N.A.N.A.N.A.
Thunnus 77
THQ
1st scenario0.128 (0.114)0.003 (0.001)0.001 (0.000)0.001 (0.000)0.000 (0.000)0.186 (0.124)0.001 (0.001)0.004 (0.001)
2nd scenario0.385 (0.341)0.008 (0.002)0.003 (0.002)0.003 (0.001)0.000 (0.000)0.557 (0.373)0.003 (0.001)0.011 (0.002)
3rd scenario0.618 (0.548)0.014 (0.002)0.006 (0.003)0.005 (0.002)0.001 (0.000)0.894 (0.600)0.006 (0.002)0.018 (0.004)
TTHQ
1st scenario0.3240.3240.3240.3240.3240.3240.3240.324
2nd scenario0.9710.9710.9710.9710.9710.9710.9710.971
3rd scenario1.5601.5601.5601.5601.5601.5601.5601.560
CRlim0.185 (0.138)5.200 (1.047)15.884 (9.077)16.161 (4.750)134.131 (51.135)0.106 (0.070)13.571 (4.369)4.052 (0.888)
CRlim carc0.006 (0.003)N.A.N.A.0.108 (0.032)53.639 (12.099)N.A.N.A.N.A.
Katsuwonus 71
THQ
1st scenario0.187 (0.028)0.003 (0.001)0.002 (0.000)0.001 (0.000)0.000 (0.000)0.017 (0.004)0.001 (0.000)0.004 (0.000)
2nd scenario0.561 (0.084)0.008 (0.002)0.006 (0.000)0.003 (0.001)0.000 (0.000)0.052 (0.012)0.003 (0.001)0.013 (0.001)
3rd scenario0.901 (0.134)0.013 (0.004)0.009 (0.001)0.004 (0.001)0.001 (0.000)0.083 (0.020)0.005 (0.001)0.021 (0.002)
TTHQ
1st scenario0.2150.2150.2150.2150.2150.2150.2150.215
2nd scenario0.6460.6460.6460.6460.6460.6460.6460.646
3rd scenario1.0381.0381.0381.0381.0381.0381.0381.038
CRlim0.078 (0.012)5.582 (1.756)7.591 (0.599)16.024 (3.131)113.584 (58.413)0.858 (0.167)15.877 (4.396)3.320 (0.273)
CRlim carc0.002 (0.000)N.A.N.A.0.107 (0.021)38.179 (19.635)N.A.N.A.N.A.
Katsuwonus 34
THQ
1st scenario0.077 (0.041)0.009 (0.008)0.002 (0.001)0.001 (0.001)0.000 (0.000)0.177 (0.165)0.001 (0.001)0.005 (0.001)
2nd scenario0.231 (0.123)0.028 (0.025)0.005 (0.002)0.004 (0.002)0.001 (0.000)0.531 (0.496)0.003 (0.002)0.015 (0.004)
3rd scenario0.371 (0.198)0.045 (0.040)0.008 (0.003)0.006 (0.003)0.001 (0.000)0.853 (0.798)0.005 (0.002)0.024 (0.006)
TTHQ
1st scenario0.2720.2720.2720.2720.2720.2720.2720.272
2nd scenario0.8160.8160.8160.8160.8160.8160.8160.816
3rd scenario1.3111.3111.3111.3111.3111.3111.3111.311
CRlim0.234 (0.119)2.544 (1.768)8.851 (2.679)14.459 (7.478)86.780 (30.539)0.150 (0.132)18.844 (10.234)3.039 (0.681)
CRlim carc0.005 (0.003)N.A.N.A.0.096 (0.050)29.170 (10.265)N.A.N.A.N.A.
Thunnus 47
THQ
1st scenario0.066 (0.012)0.002 (0.001)0.001 (0.000)0.003 (0.005)0.000 (0.000)0.203 (0.030)0.001 (0.001)0.005 (0.000)
2nd scenario0.199 (0.036)0.005 (0.002)0.003 (0.001)0.010 (0.014)0.001 (0.001)0.609 (0.090)0.004 (0.003)0.014 (0.001)
3rd scenario0.320 (0.058)0.009 (0.003)0.005 (0.001)0.017 (0.022)0.001 (0.001)0.979 (0.145)0.006 (0.005)0.022 (0.002)
TTHQ
1st scenario0.2820.2820.2820.2820.2820.2820.2820.282
2nd scenario0.8450.8450.8450.8450.8450.8450.8450.845
3rd scenario1.3581.3581.3581.3581.3581.3581.3581.358
CRlim0.221 (0.039)8.797 (3.587)16.016 (4.742)9.792 (5.910)61.663 (48.983)0.072 (0.012)15.797 (8.086)3.108 (0.302)
CRlim carc0.005 (0.001)N.A.N.A.0.065 (0.039)20.727 (16.465)N.A.N.A.N.A.
Disclaimer/Publisher’s Note: The statements, opinions and data contained in all publications are solely those of the individual author(s) and contributor(s) and not of MDPI and/or the editor(s). MDPI and/or the editor(s) disclaim responsibility for any injury to people or property resulting from any ideas, methods, instructions or products referred to in the content.

