
Dried Droplets of Diluted Blood to Detect a High Concentration of Lipids
by
 and
and
Monserrat Ancheyta-Palacios
,
Iris G. Velasco-Terán
,
Yojana J. P. Carreón
* and
Jorge González-Gutiérrez
* Facultad de Ciencias en Física y Matemáticas, Universidad Autónoma de Chiapas, Tuxtla Gutiérrez 29050, Chiapas, Mexico
*
Authors to whom correspondence should be addressed.
Processes 2023, 11(7), 2047; https://0-doi-org.brum.beds.ac.uk/10.3390/pr11072047
Submission received: 9 February 2023
/
Revised: 2 July 2023
/
Accepted: 6 July 2023
/
Published: 9 July 2023
(This article belongs to the Special Issue Advanced in Dewatering and Drying Processes)
Abstract
:Hyperlipidemia is the elevated concentration of lipids in the blood, and it increases the probability of arterial obstruction, infarctions, and other complications of the circulatory system. While there are indications that qualitative analysis of blood stains could potentially identify patients with this pathology, the efficacy of this method remains uncertain. In this paper, we report an experimental study that investigates the formation of patterns in dried blood droplets with varying concentrations of ultrapure water. Two blood samples, one healthy and one with moderate hyperlipidemia, were examined to determine the ideal water and blood mixtures for detecting high lipid concentrations. Numerous intricate patterns were observed throughout the central region and periphery of the dried droplet. These patterns encompass various forms, such as plaques, bump-like patterns, and a range of cracks including random, radial, and ortho-radial configurations. By calculating the entropy of the Gray Level Co-occurrence Matrix (GLCM) and analyzing ROC curves, we determined that solutions with 4% and 12% hematocrit (indicating a high percentage of ultrapure water) exhibit over 95% accuracy in differentiating high lipid concentrations. These findings provide a promising outlook for the development of diagnostic methods based on the study of diluted blood coatings.
1. Introduction
The morphological characterization of structures resulting from droplet drying has garnered significant interest in various technological applications, particularly in the field of biosensors [1,2,3,4,5], quality control of liquid consumables [6,7,8], forensic applications [9,10], protein analysis [11,12,13] and diagnosis of pathologies [14,15]. Under controlled evaporation conditions, water removal from a sessile droplet gives rise to a deposit exhibiting intriguing morphological characteristics [16,17]. The ingredients responsible for the formation of a great diversity of patterns result from the competition between capillary flows and Marangoni flows, and complex aggregation processes [18]. Capillary flows are generated from inside the drop to move radially outward towards the edge. In cases where the sessile drop fluid contains nonvolatile particles, these are pushed outward by capillary flows, forming a ring-shaped structure known as a “coffee ring” [19,20]. On the other hand, the Marangoni flows depend on the concentration gradients and induce the fluid to recirculate towards the interior of the drop, generating a homogeneous stain [21,22,23].
The characterization of patterns in dried blood droplets is an interesting alternative to develop diagnostic strategies [24,25,26]. In general, these patterns are made up of a “central region” where plaques and random cracks are found. A large “crown” with wide white cracks and mobile plaques surrounds the central region, while a third region is formed by a thin peripheral belt of blood serum. Interestingly, the crown, which emerge by the accumulation of a high concentration of red cells, does not adhere to the substrate. In contrast, the central and periphery regions adhere more strongly due to the absence of erythrocytes. This occurs because the glycoproteins, contained in the red cells, prevent the covering of the walls [25,27]. The formation of the thin peripheral belt occurs due to the receding of the gel front induced by a change in internal flow that transports red blood cells from the inner to the periphery of the droplet [28].
Elevated blood lipid levels pose a risk for atherosclerosis and cardiovascular disease, potentially leading to fatal outcomes [29]. Recently, Brutin et al. [25] introduced a novel approach to identify hyperlipidemia by analyzing dried blood droplets. Interestingly, they found that the presence of high lipid concentrations correlates with the formation of small plaques in the central region. Although this study represents a significant advance in the search for alternatives to unveil hyperlipidemia, the effectiveness of dried droplet analysis as a diagnostic tool is unknown. Furthermore, despite intensive research on blood droplet drying, it is still unknown how blood lipid concentration affects the mechanisms of mass transport and aggregation processes involved in structure formation. A better understanding of such processes and the development of techniques for pattern identification could help to develop strategies that result in a highly effective methodology for the diagnosis of hyperlipidemia.
The gray level co-occurrence matrix (GLCM) is a measure of texture evaluation of an object and it is related to the spatial distribution of pixel intensities in a region of interest. The main characteristic of the GLCM parameters is that they act as indices of the frequency of gray level combinations in an image [30]. This metric is used to classify cancer types [31,32], characterize morphological changes in the organization of collagen tissues caused by some pathology [33], among other relevant systems [34,35]. On the other hand, different techniques have been used to evaluate classification algorithms such as receiver operating characteristic (ROC). ROC curves are used to quantify the accuracy of a test to discriminate between elements of two groups [36,37]. The use of GLCM in combination with ROC curve analysis has been successfully used to analyze patterns in dried droplets in the contexts such as drug quality control [6], protein folding detection [38], and biofluid characterization [39].
In this paper, we report an experimental study on the formation of patterns in dried blood droplets with different concentrations of ultrapure water. Two blood samples, one healthy and one with moderate hyperlipidemia, were investigated to identify optimal water and blood mixtures for detecting high lipid concentrations. Through the Entropy of the Gray Level Co-occurrence Matrix (GLCM), we performed texture analyses on two areas: one encompassing the central region and the corona (entire deposit), and the other focusing solely on the central region. By employing ROC curve analysis, we have ascertained that diluted solutions with 4% and 12% hematocrit (HCT) achieve an accuracy of over 95% in differentiating blood samples with a high lipid concentration.
2. Experimental Details
2.1. Sample Collection and Storage
Blood samples were collected from donors by medical personnel and informed consent was received from the volunteers. To determine specific parameters of their blood composition, volunteers underwent clinical laboratory (refer to Table 1 for details). All the samples were collected and stored inside a 4 mL vacutainer tube (EDTA.K2, Golden Vac). Ultrapure water was used to dilute the blood samples. Five dilutions (4%, 12%, 20%, 28% and 36% HCT) were made from whole blood samples (40% HCT).
2.2. Drop Evaporation
The evaporation substrate was brand new Poly(methyl methacrylate) (PMMA) which was thoroughly cleaned prior to being used. Eighteen droplets of the solution, with a volume of 3 L, were placed on PMMA. The experiments were repeated three times at each experimental condition, i.e., at least 50 dried droplets in total were produced for each concentration (18 deposits in 3 different PMMA substrates). The drops were dried under controlled temperature at T = 21–27 C and Relative Humidity (RH) of 30–35%. The relative humidity was controlled using the effect of water activity , where is the vapor pressure of water in a substance and is the pressure of pure water vapor at the same temperature. The RH value was measured with a temperature and humidity sensor (Xiaomi NUN4126GL). The average evaporation times for the various erythrocyte concentrations were as follows: 47.15 min (4% HCT), 44.33 min (12% HCT), 43 min (20% HCT), 41.09 min (28% HCT), 40.3 min (35% HCT), and 38.3 min (40% HCT).
2.3. Image Acquisition
The deposits were observed after evaporation in ambient conditions using a microscope (Velab, VE-M4, 4×, and 10×) coupled with a Nikon camera (D3200). The resolution of the images was chosen to be 300 dpi, creating images of approximately 4000 pixels in length for the longest side.
2.4. Texture Analysis of Dried Drop Patterns
Gray Level Co-Occurrence Matrix (GLCM)
We use Entropy based on gray level co-occurrence matrix (GLCM) to measure the texture of patterns in dried droplets. Higher (lower) entropy values indicate large (small) heterogeneous regions in an image. Texture analysis based on GLCM has been used successfully in characterizing protein films containing complex crack patterns [40] and salt crystals [39].
A gray level co-occurrence matrix (GLCM) is a matrix where the number of rows and columns is equal to the number of gray levels in an image. Its analysis is based on the correlation among pixels in an image. Mathematically, the matrix element is the probability values for changes between gray level i and j at a particular displacement distance (d) and angle () on an image. This probability can be defined as:
where is the number of occurrences of gray levels i and j within the window, at a particular () pair. The denominator is the total number of gray level pairs within the window and is bounded by an upper limit of × . The mean and the standard deviation for the columns and rows of the matrix, using the above equation, can be defined as follows:
where and are the mean for the columns and rows, respectively; and and represent the standard deviation for the columns and rows, respectively. Now, using these equations, we can define the entropy H as follows:
2.5. The Receiver Operating Characteristic (ROC) Curve
A receiver operating characteristic (ROC) graph is a method used to organize and select classifiers based on their efficiency [36,37,41]. The ability of a classifier to provide a good relative instance score is measured by ROC plots. The ROC curve is obtained by plotting the True Positive rate (Sensitivity) as a function of the False Positive rate (1-Specificity) for each possible threshold value on the confidence score [36,42]. The Sensitivity represents the positive correctly classified samples to the total number of positive samples. Mathematically, this quantity is written as Equation (5). Whereas the Specificity (True Negative rate) represents the negative correctly classified samples to the total number of negative samples, this quantity is defined as Equation (5). The False Positive rate (1-Specificity) represents incorrectly classified negative samples to the total number of negative samples as in Equation (6). Specificity and 1-Specificity are complements since the first considers the actual negative samples and the second refers the negative samples that were incorrectly classified.
A ROC curve is a two-dimensional depiction of classifier performance. Therefore, the ROC curve is a two-dimensional depiction of the relationship between the True Positive rate and the False Positive rate. Each point on the ROC curve is a cutoff point used to designate test-positive. Finally, to compare different classifiers in ROC curve is used the area under the curve ROC (AUC) metric. The AUC is the probability that the algorithm of a classifier ranks a randomly chosen positive instance higher than a randomly chosen negative instance. The detailed procedure of ROC curve analysis can be found in [36,42].
3. Results
3.1. Pattern Formation in Dried Blood Drops
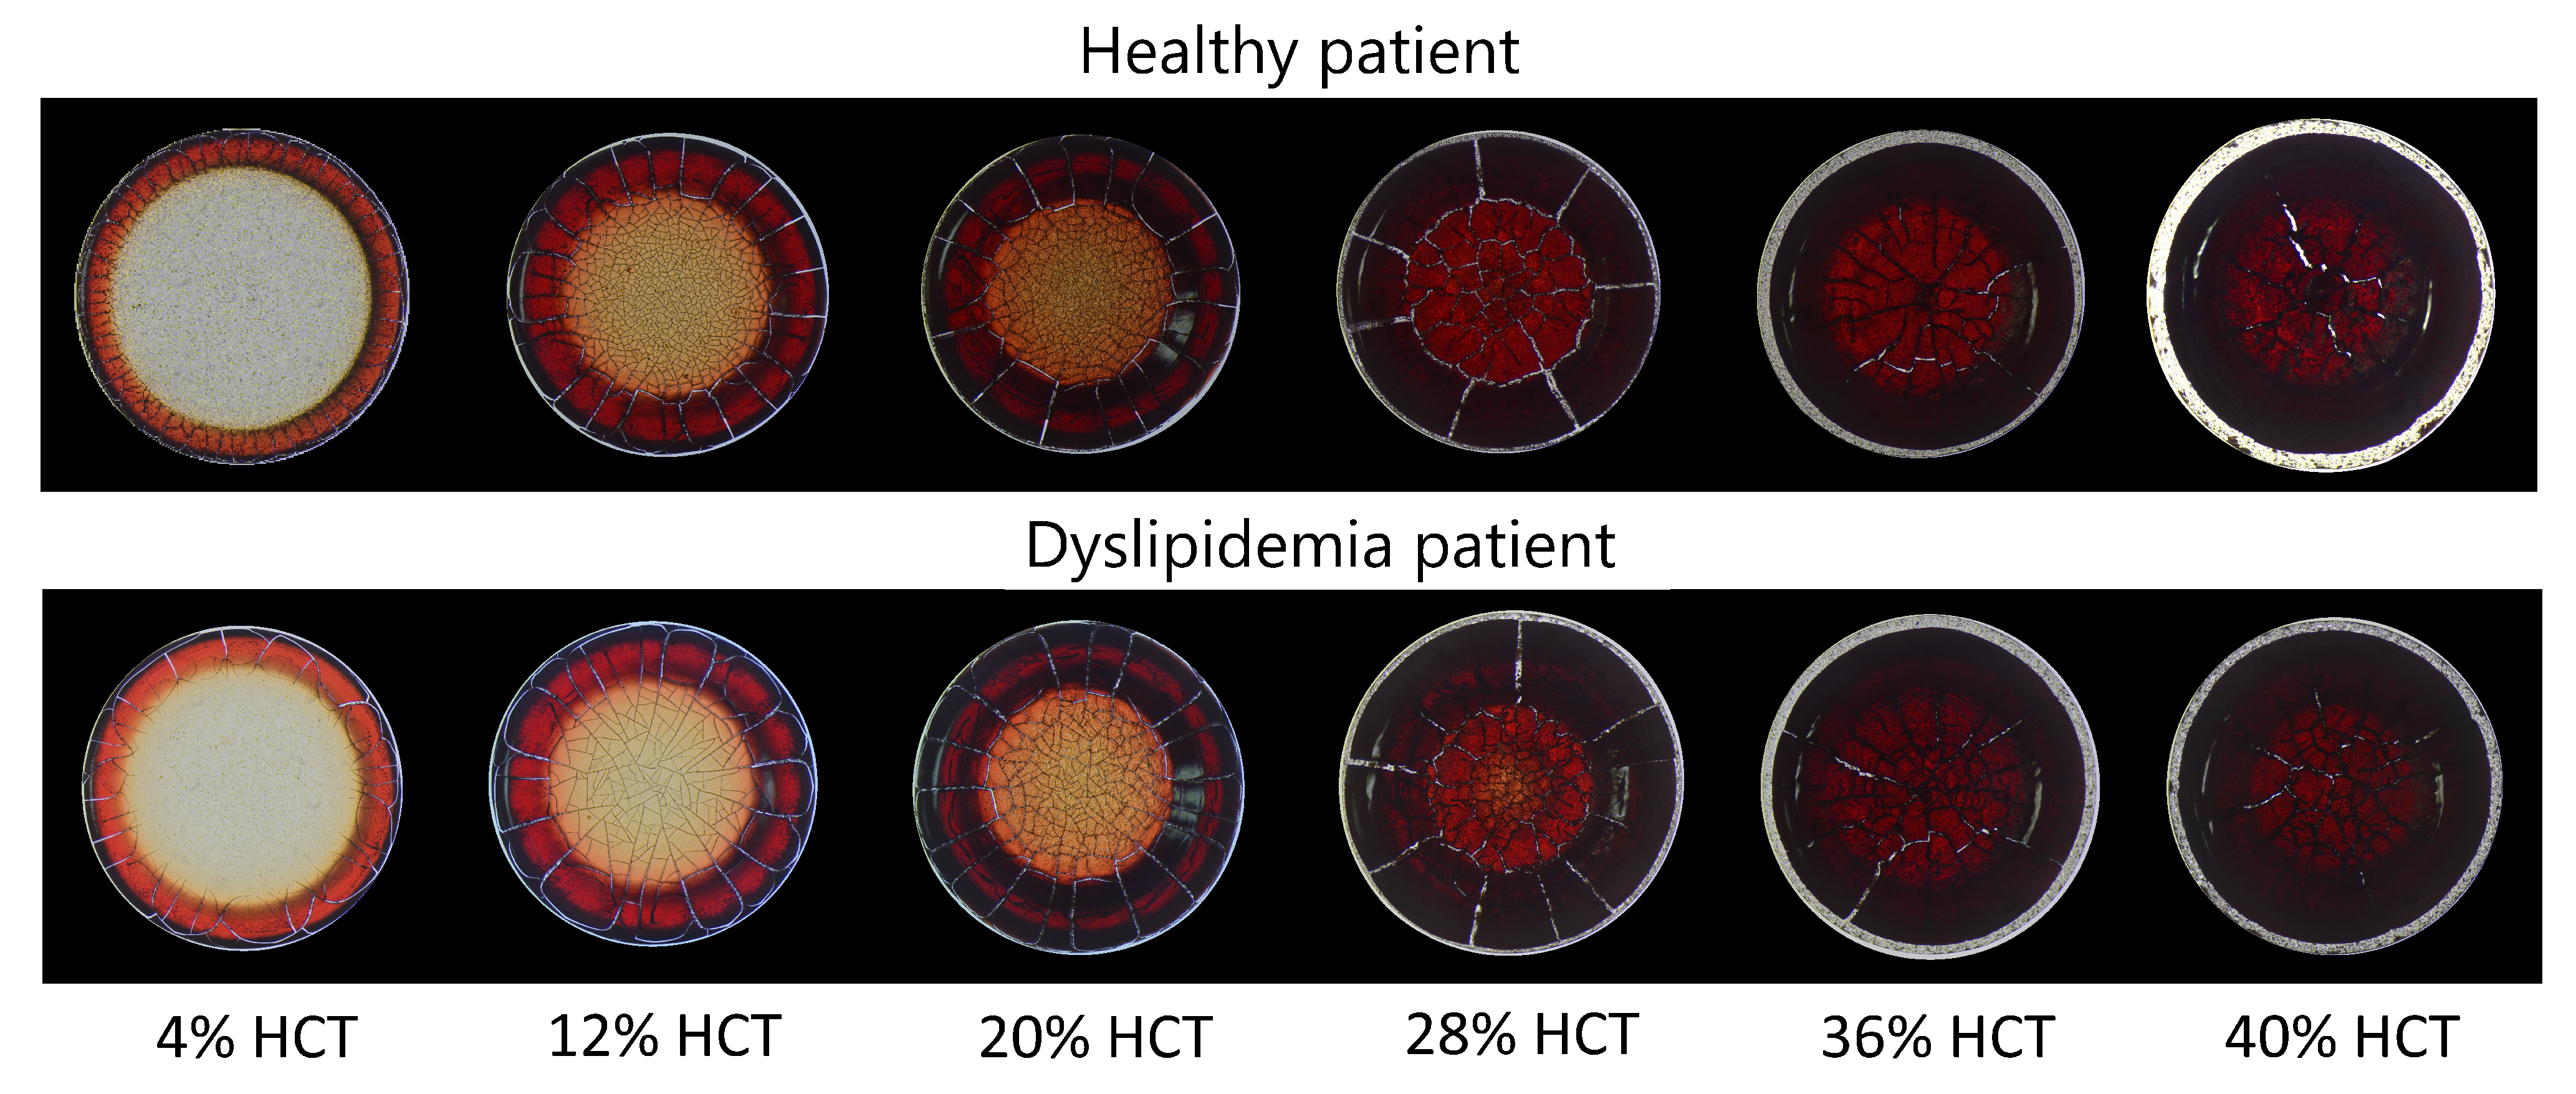
At first glance, dried droplets of dilute blood with both normal and elevated lipid concentrations display apparent morphological similarities. However, closer scrutiny reveals significant distinctions in the interior structures that compose the patterns. Figure 1 shows the deposits with the diluted blood (4–36% HCT) and whole blood (40% HCT) samples. A close-up of the dried blood drops for the different concentrations of HCT is shown in Figure 2.
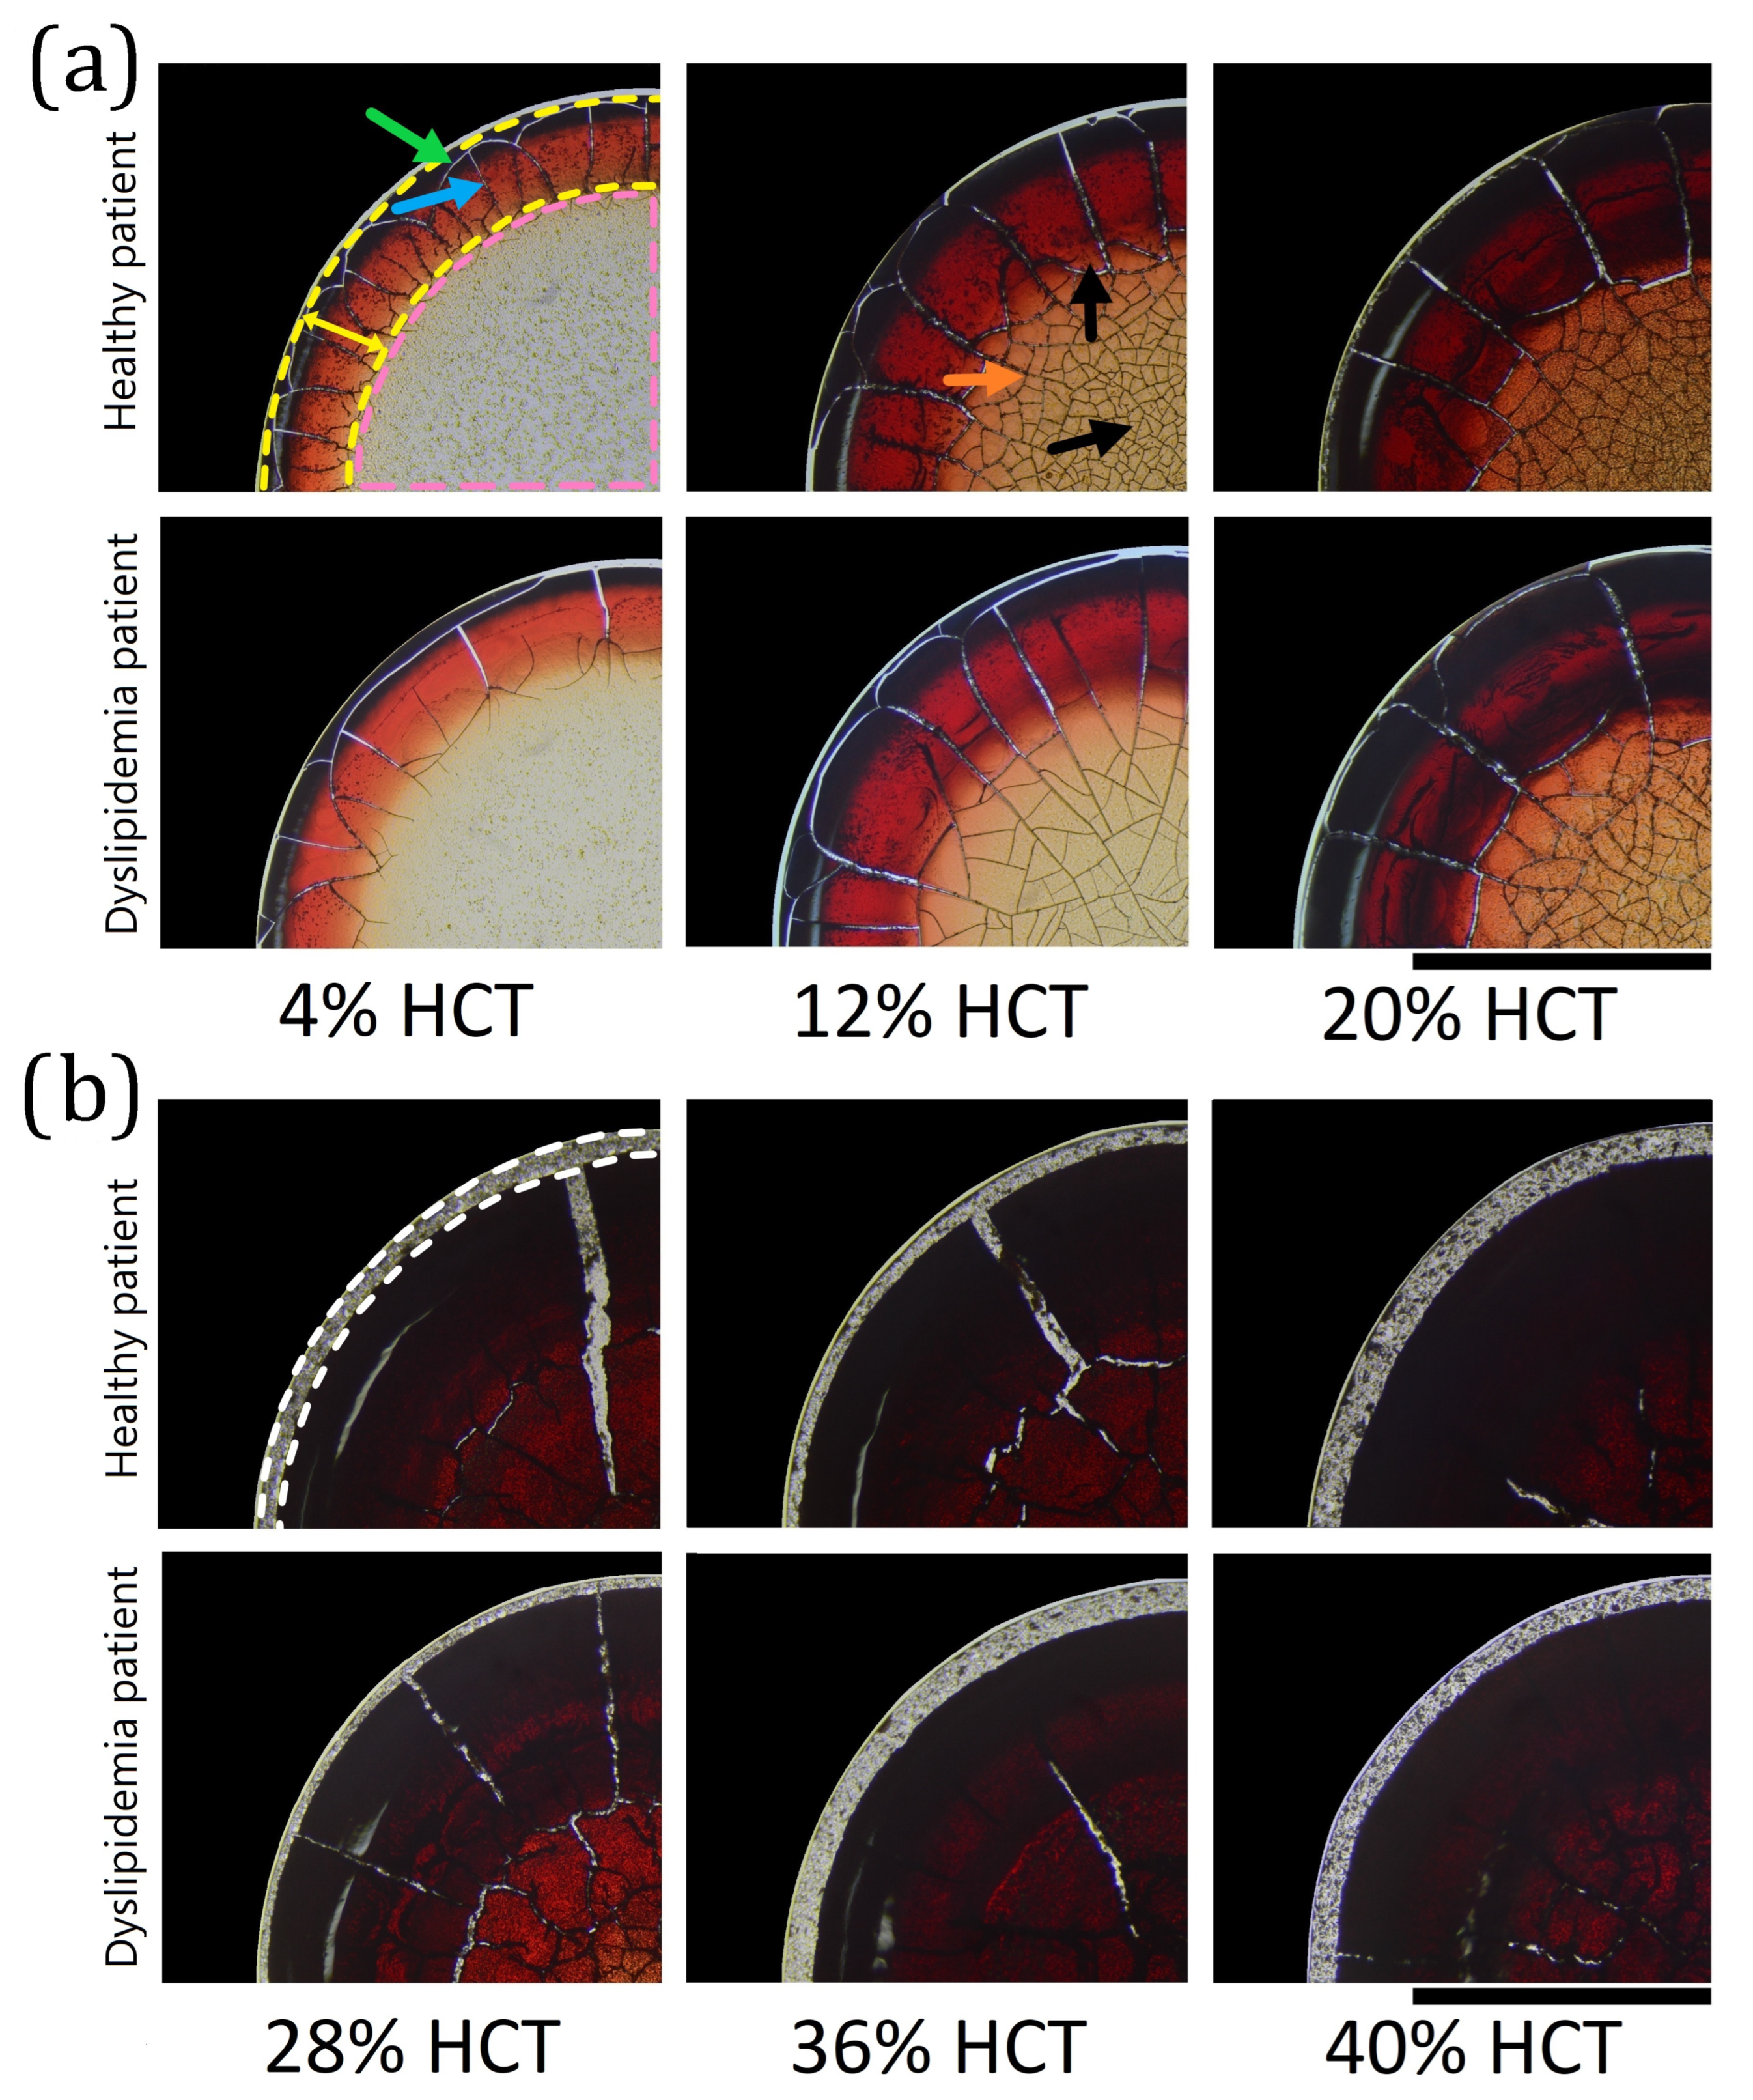
Deposits with low erythrocyte concentration (4% HCT) and normal lipid levels display a crown with clearly defined borders (yellow line in Figure 2a), accompanied by a high occurrence of radial cracks (blue arrow) and ortho-radial cracks (green arrow). Additionally, the central region (pink line in Figure 2a) contains numerous small aggregates, resulting in a granular surface texture. Conversely, a high lipid concentration produces a thicker crown with less defined borders and a reduced number of cracks.
Dried droplets with 12% HCT exhibit a crown lacking well-defined borders and display radial and orthoradial cracks with similar characteristics, as shown in Figure 2a. Droplets with normal lipid concentration produce a higher occurrence of random cracks (orange arrow) and mobile plaques (black arrow) in the central region compared to those from patients with dyslipidemia. Furthermore, the size of the plaques is significantly larger in the latter. Patterns in deposits from both the healthy patient and the patient with dyslipidemia, with a 20% HCT, are very similar to each other. They feature a crown with minimal radial and orthoradial cracks, along with a central region characterized by random cracks and plaques.
Samples with a hematocrit of 28% produce random cracks and large plaques in the central region (Figure 2b). Distinct radial cracks are observed in both the central region and the crown of deposits obtained from the healthy patient (Figure 2b—top). In contrast, samples from the patient with Dyslipidemia generated a greater concentration of cracks confined to the crown region (Figure 2b—bottom). Notably, droplets with hematocrit concentrations greater than or equal to 28% do not induce the formation of ortho-radial cracks in the corona region.
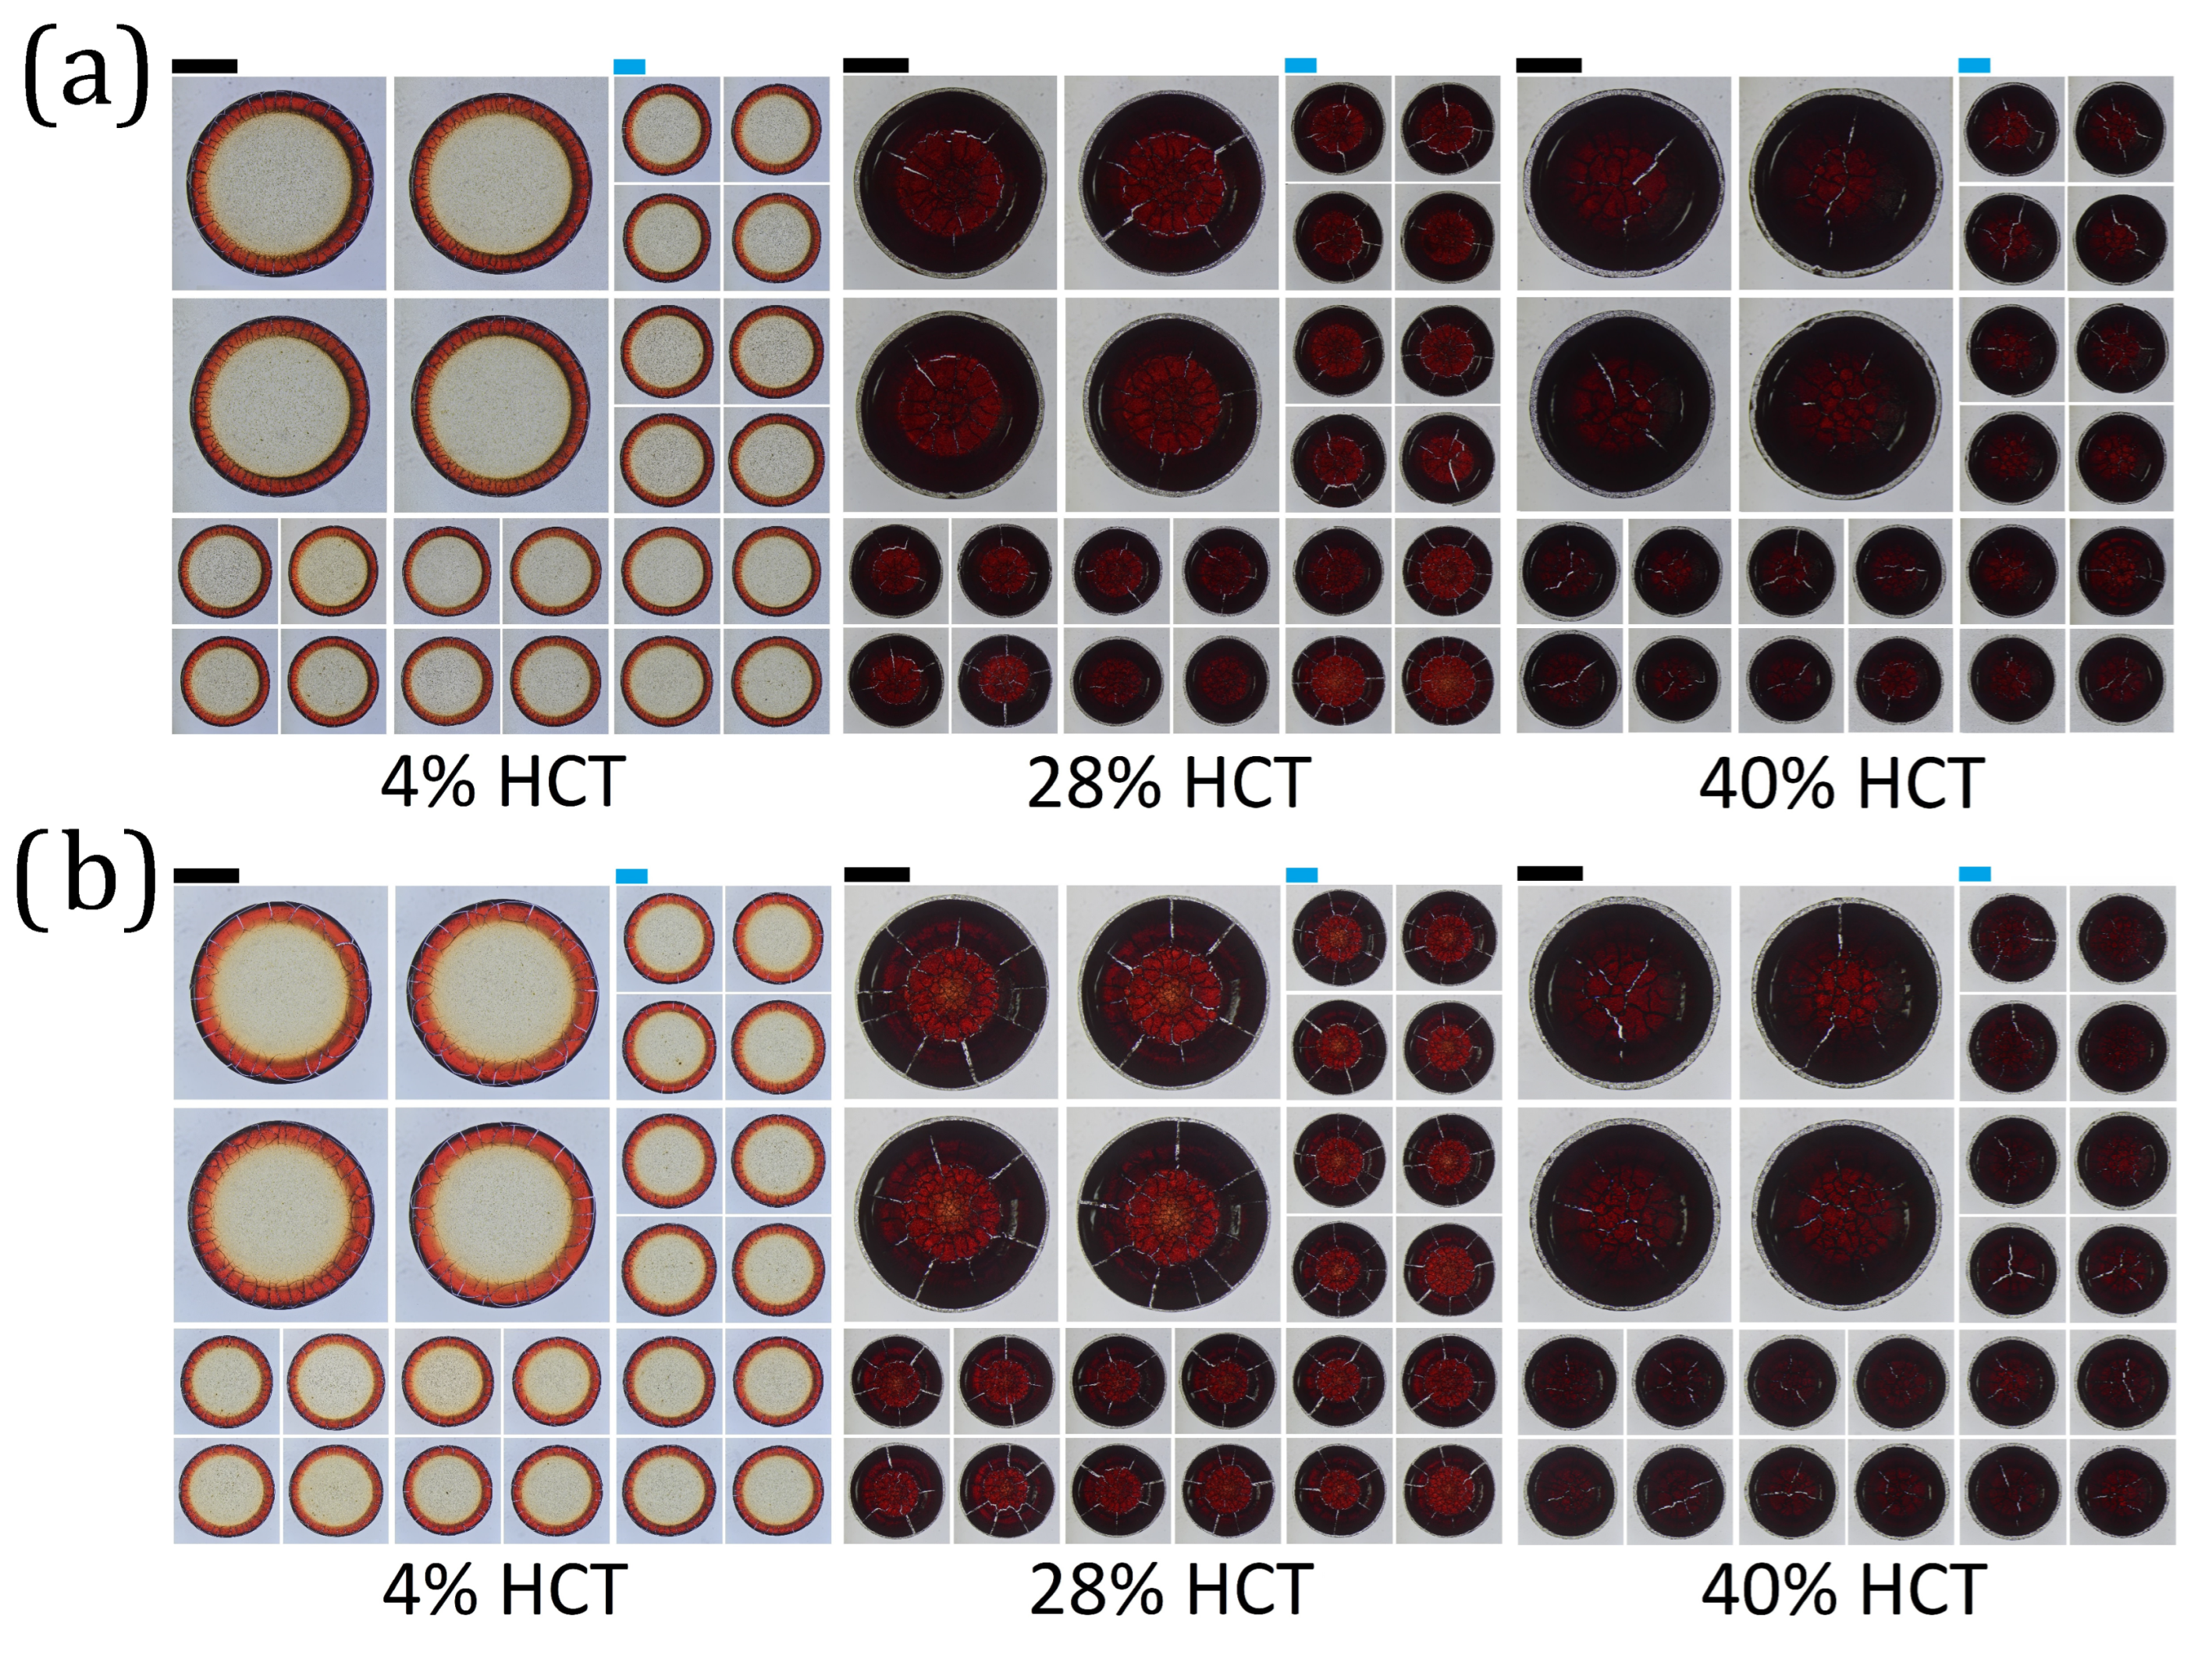
Droplets with hematocrit levels of 36% and 40% generate a crown characterized by the formation of a minimal number of radial cracks (Figure 2b). Within the central region, a mixture of radial and random cracks extends beyond its boundaries. Moreover, noticeable variations in morphology are observed for the large, mobile plaques. Interestingly, the outer boundary of the corona exhibits a peripheral erythrocyte exclusion band, where the deposition of these cells is not possible (see white dotted line in Figure 2b). To demonstrate the high reproducibility of pattern formation in dried droplets of diluted blood, Figure 3 shows 24 deposits for each hematocrit (HCT) concentration, all generated under similar conditions of temperature and relative humidity.
3.2. Texture Analysis of Dried Blood Droplets
We employed Gray Level Co-occurrence Matrix (GLCM) Entropy as a comprehensive approach to capture the intricate texture of dried droplets from both healthy and Dyslipidemia patients. Furthermore, in our pursuit of distinguishing between the groups of dried drops, we conducted the analysis on two distinct areas: one composed of the central region and the corona (entire deposit), and another considering only the central region.
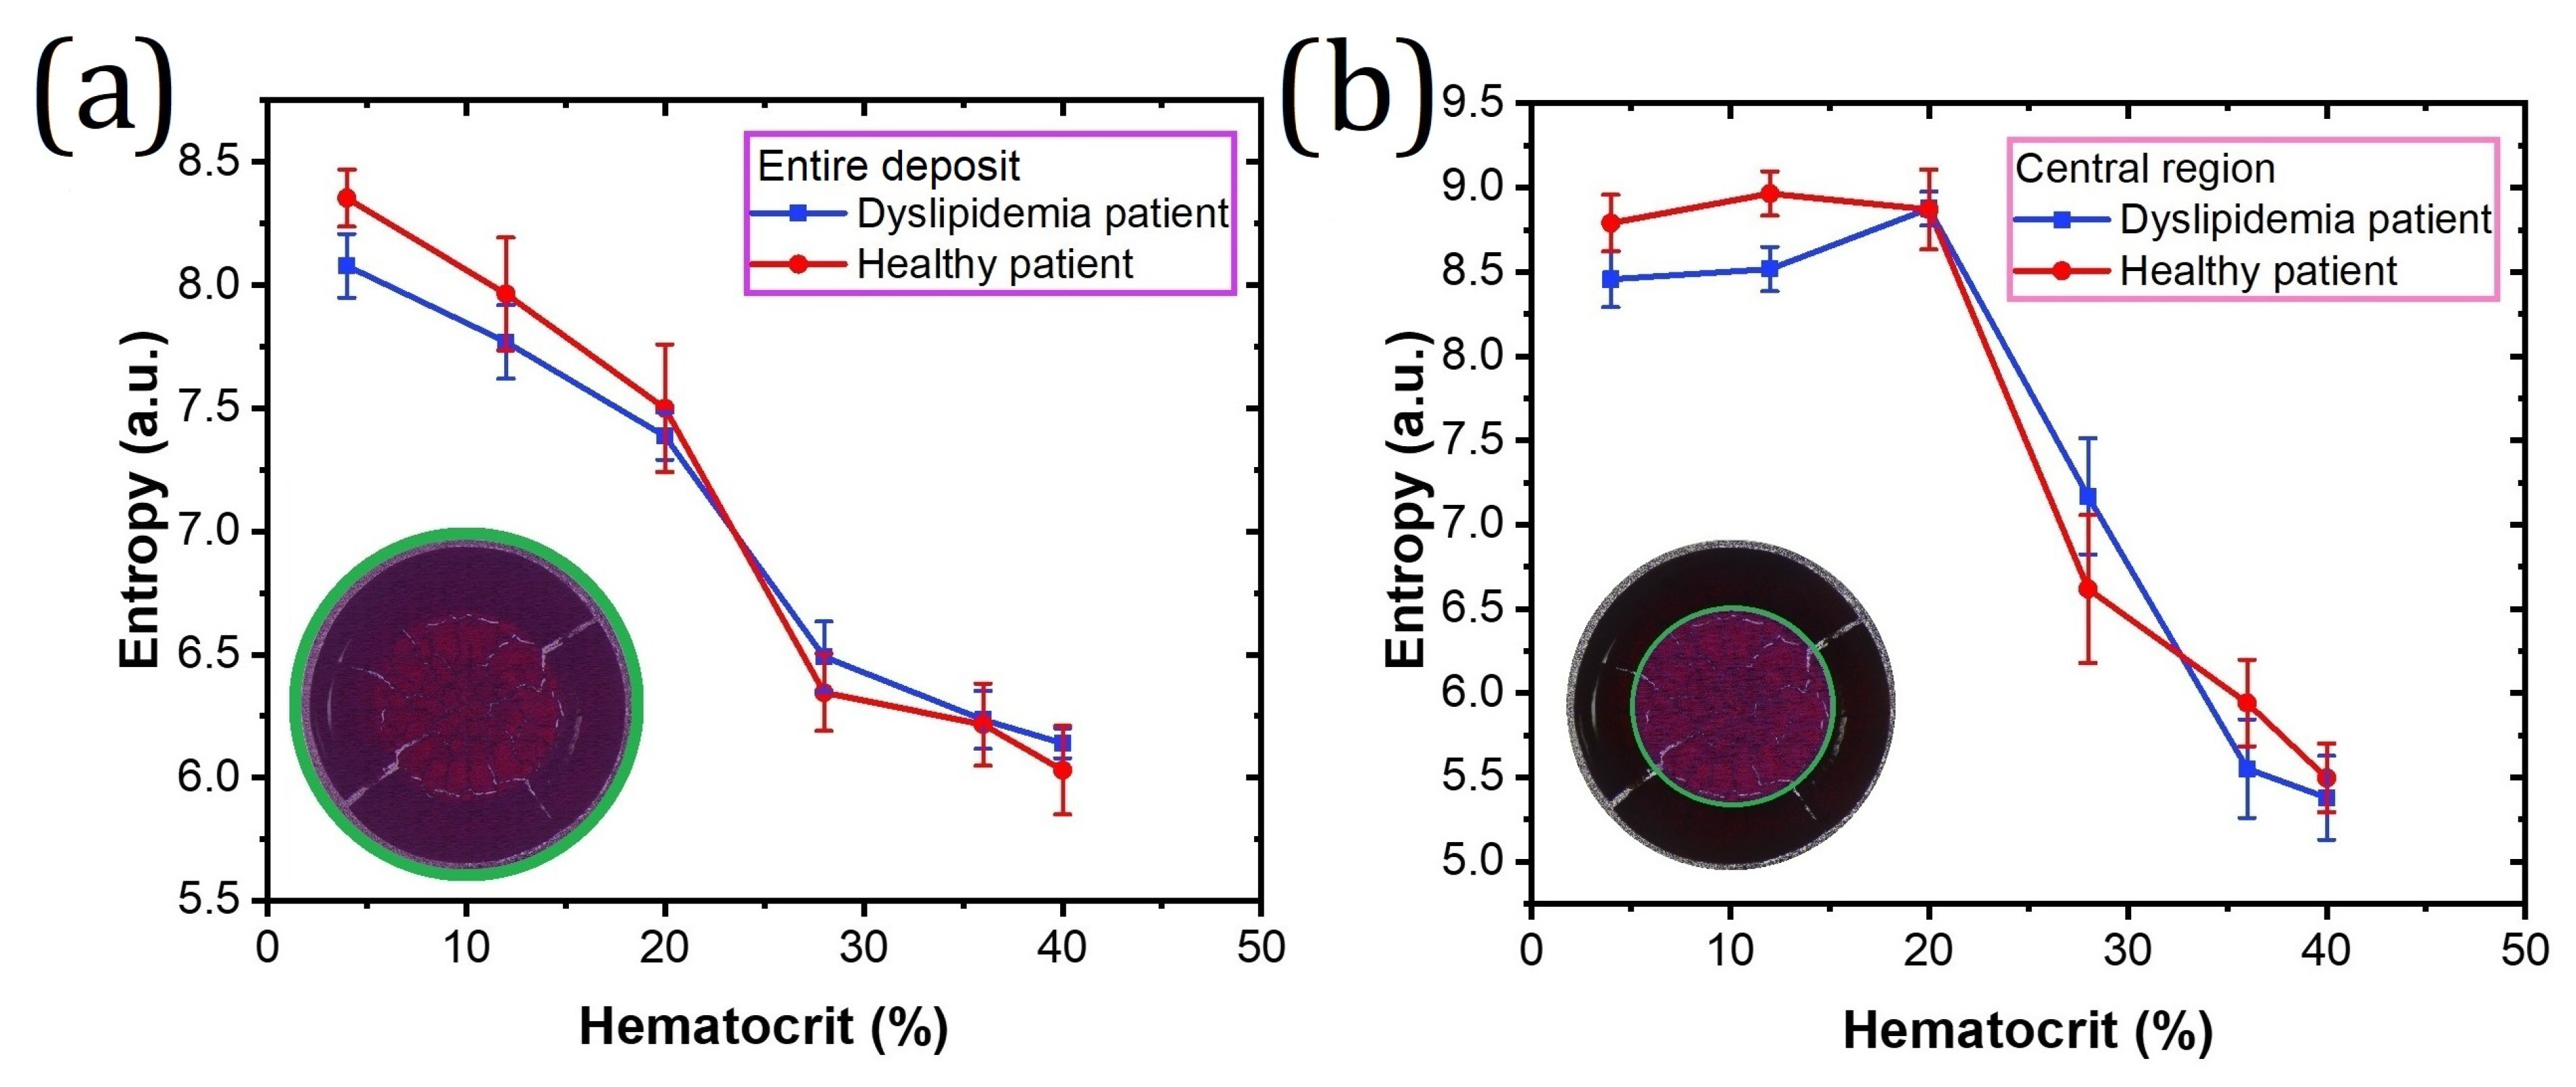
Figure 4a shows the values of Entropy for entire deposits as a function of hematocrit concentration. The red and blue profiles correspond to dried drops of healthy and dyslipidemic patients, respectively. The image of the dried drop in the graph shows a deposit outlined by a green line indicating the analyzed region. Observe that concentrations of HCT < 20% give high Entropy values. In contrast, concentrations of HCT > 28% give low values of this parameter. This indicates that at high HCT concentrations, there are small heterogeneous regions in entire deposits. It should be noted that at 4% HCT the error bars indicate that it is possible to distinguish the dried blood drops of the healthy patient from those of the patient with Dyslipidemia. Entropy values calculated in the central region of the deposits are shown in Figure 4b. Deposits formed with HCT < 20% concentrations reach high Entropy values, while in those formed with HCT > 28% reach low values. This is because, at low HCT concentrations, cracks and plaques produce greater heterogeneity in the central region of the deposits compared to those generated with high concentrations. Comparing the error bars estimated from the standard deviation of the Entropy values of dried blood droplets with normal and high lipid concentrations, we observe the highest difference at 12% HCT, while the lowest at 20% HCT.
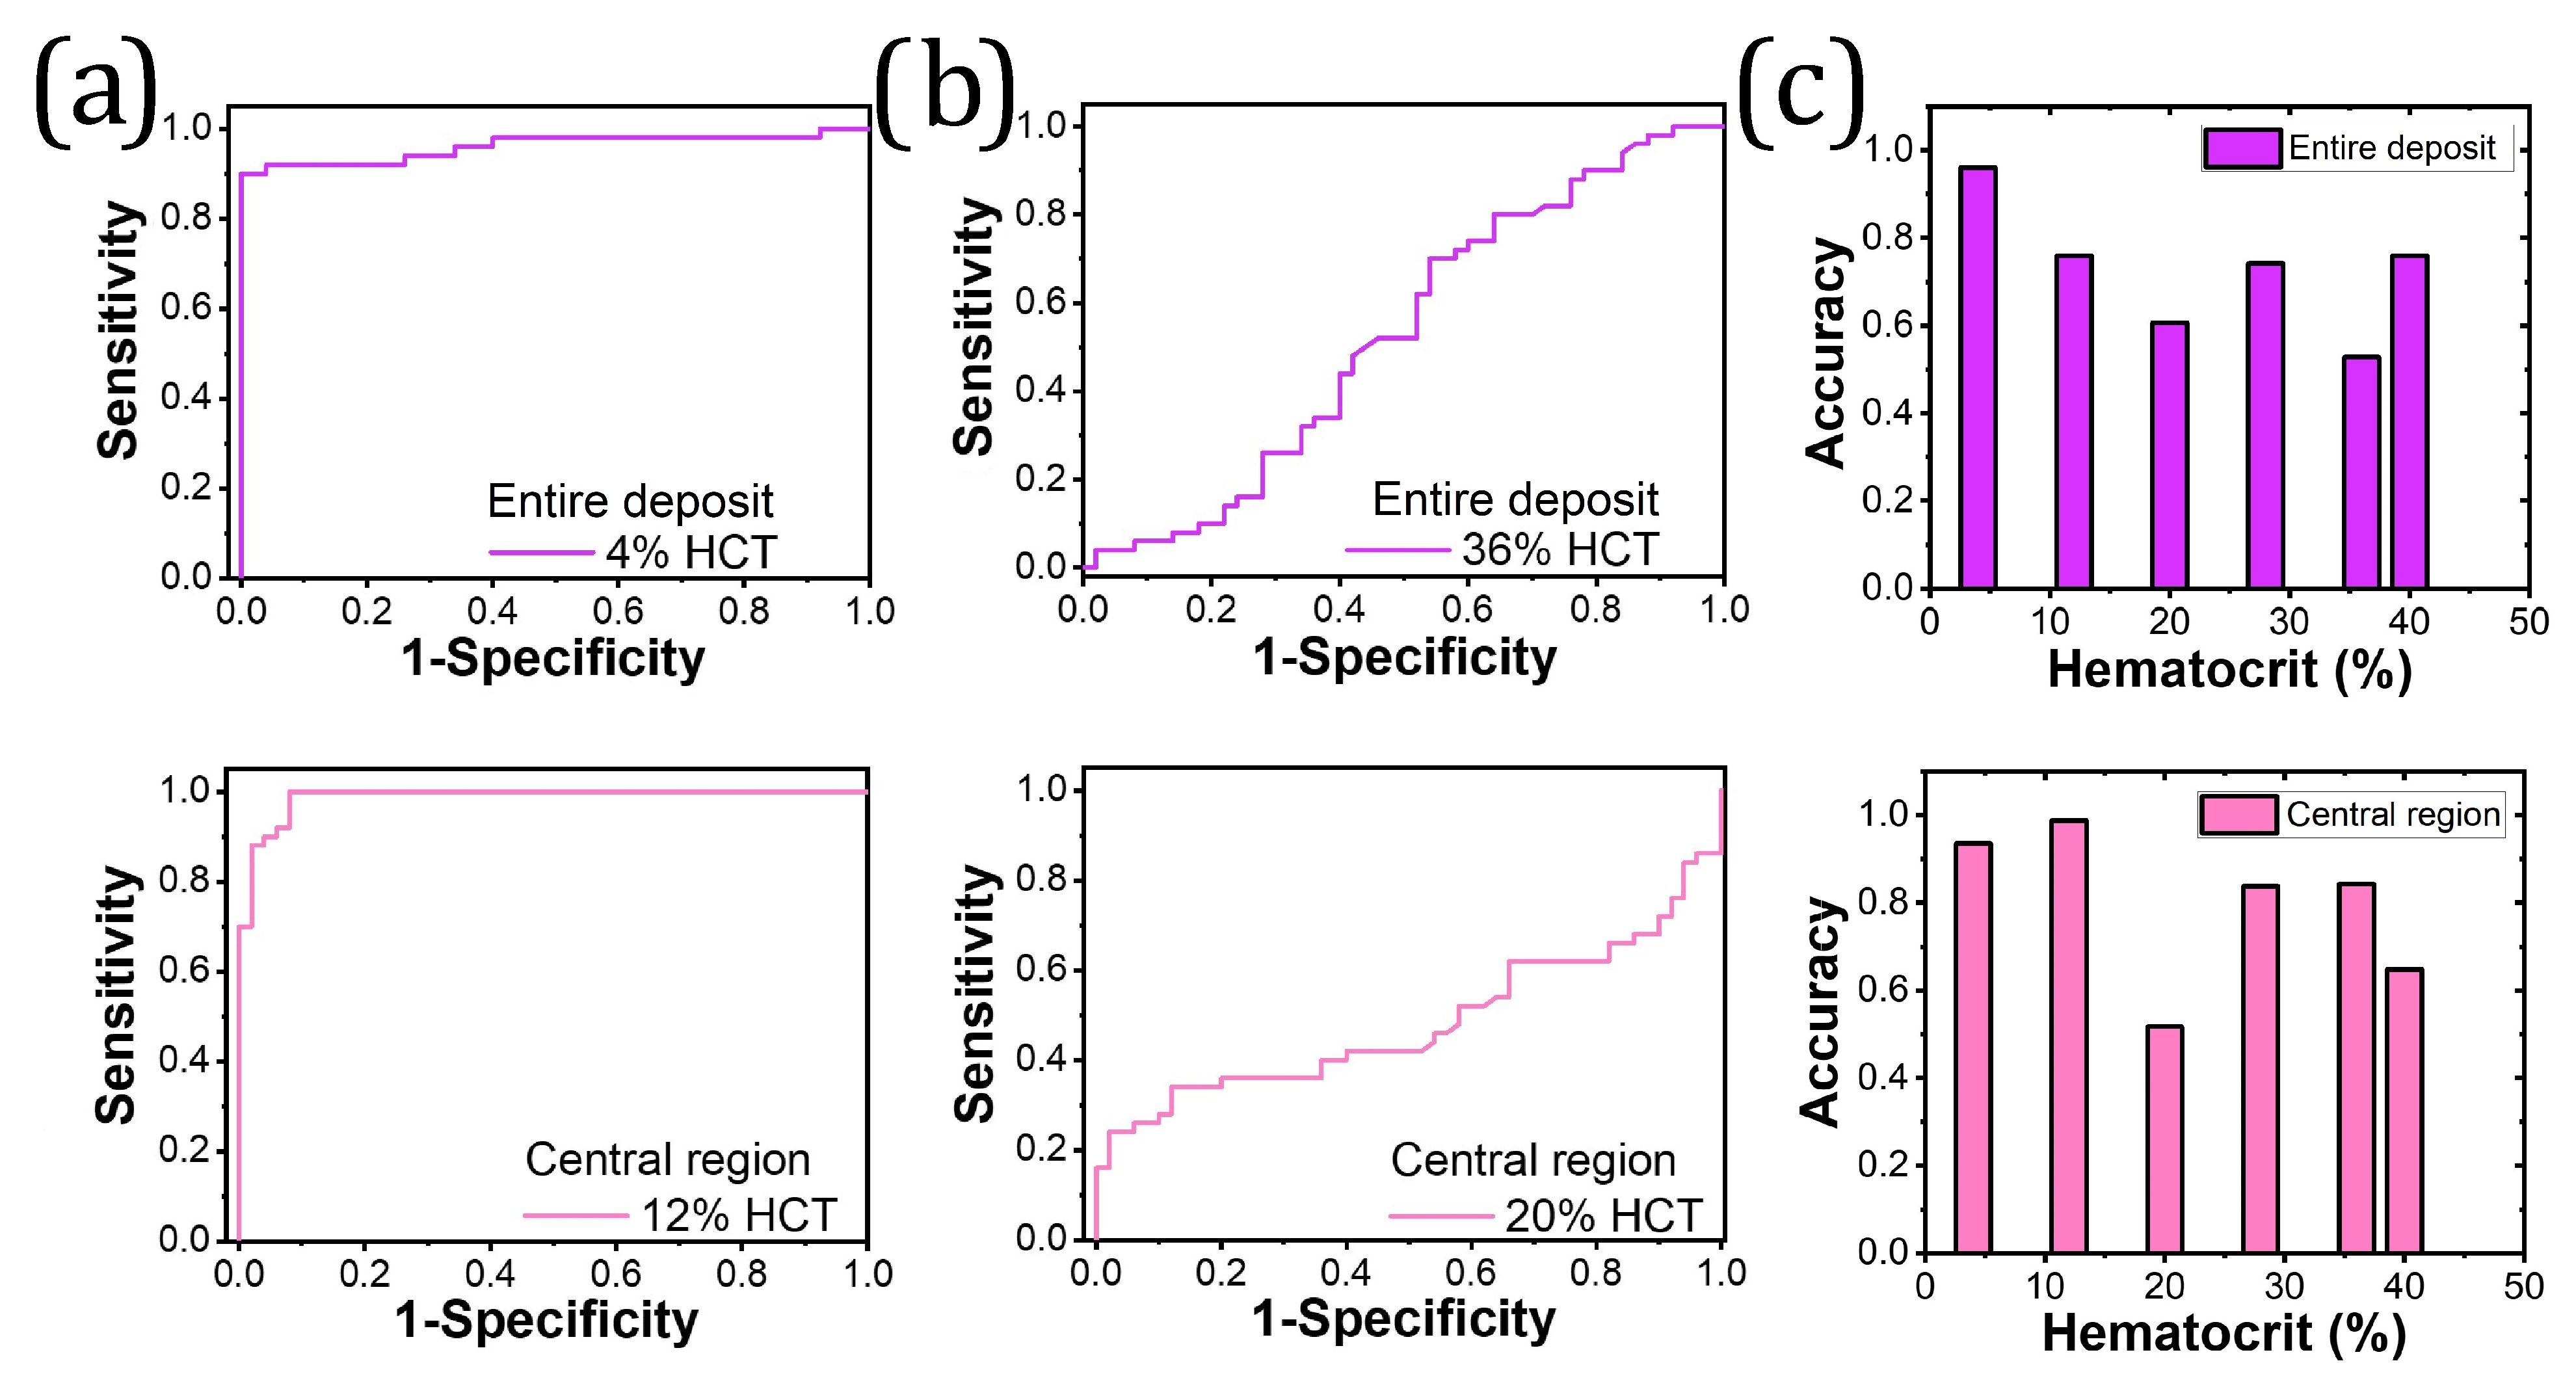
We used the Entropy values to perform a discriminant analysis based on Receiver Operating Characteristic (ROC curves). The ROC curves for 4% and 12% HCT, based on entropy values calculated in both regions (entire deposit and central region), exhibit a typical behavior of an excellent sensitivity to 1-specificity ratio, see Figure 5a. In contrast, the shape of the ROC curves for 36% and 20% HCT show a deficient analysis for the differentiation of elements of two groups, see Figure 5b.
The area under the ROC curve (AUC) is a quantity that shows the accuracy, of a classification method in differentiating between two groups. The area under the ROC curve (AUC) gives the probability that a deposit produced from a patient sample can be correctly classified as a dried drop of blood with elevated lipid levels. Figure 5c shows the accuracy of the texture analysis method in dried blood drops to differentiate between two groups. Entropy estimation on the entire deposit exhibits the highest accuracy at lower hematocrit concentrations (4%), whereas analyzing the central region yields superior accuracy for those formed with 12% HCT. In contrast, this quantity falls sharply for concentrations of 36% and 20% HCT, respectively.
4. Discussion
In this study, we examined patterns in dried droplets of diluted blood with ultrapure water to identify morphological features and distinguish between healthy blood and a blood sample with moderate hyperlipidemia. Through the analysis of GLCM-estimated entropy and ROC curves, we have identified that a high lipid concentration can be efficiently detected in deposits formed with low hematocrit concentrations, specifically in samples with a high weight percentage of ultrapure water. Ultrapure water reduces biomolecule concentration, promoting the formation of distinct aggregates, plaques, and cracks [43,44]. Previous studies have established a correlation between decreased blood analytes and increased structural diversity [45,46,47]. Higher dilutions have been found to enhance deposit adhesion to the substrate [45,47], and the presence of a prominent annular phenomenon has been observed as an indicator of water dilution in whole blood solutions [46]. Our findings align with these reports, indicating that reducing the saturation of blood elements in a patient with a high lipid concentration correlates with greater structural diversity.
The ability to detect and analyze patterns in dried blood droplets opens up possibilities for real-time monitoring of lipid concentrations. By leveraging this technique, it may be feasible to develop portable devices or smartphone apps that can capture images of dried blood droplets and perform pattern analysis on-site. This could enable individuals with hiperlipidemia or healthcare professionals to monitor lipid levels conveniently and promptly, allowing for timely interventions or adjustments in treatment plans. Moreover, the contactless nature of analyzing dried blood droplets for lipid concentration determination is a significant advantage. Traditional blood tests often require invasive procedures like venipuncture to collect samples, which can be uncomfortable. However, if the analysis of dried blood droplet patterns proves to be a reliable diagnostic method, it could offer a non-invasive alternative for diagnosing and monitoring hiperlipidemia. The study’s results can serve as a starting point for the design and development of specialized devices or algorithms that can automate the analysis of dried blood droplet patterns, enabling faster and more precise diagnosis. For example, artificial intelligence (AI) and machine learning (ML) can play a significant role in improving the technique described in the provided information. These algorithms could identify specific characteristics or combinations of characteristics that are most indicative of high lipid concentrations. By focusing on these features, the diagnostic method can be optimized for accuracy and efficiency. AI and ML models can be deployed on portable devices or integrated into smartphone apps, allowing for real-time analysis of dried blood droplets. This means that users can capture an image of the dried blood droplet and receive immediate feedback on their lipid levels. AI and ML models can continuously learn from new data, enabling ongoing improvement of the diagnostic method. As more samples and patterns are analyzed, the algorithms can refine their understanding and adapt to new patterns or variations.
Other techniques involve diluting whole blood samples [47,48], as well as plasma and blood serum [49,50,51], to evaluate test sensitivity and minimize interference from other blood components. Studies within this context have demonstrated that diluting blood serum with water does not affect the chemical composition and molecular structure of proteins in dried droplets [50,51]. Consequently, there are no changes in the components of the diluted serum that affect the formation of dried droplet patterns.
Different methods are available for measuring Lipid/cholesterol levels in blood and serum samples, including advanced chemistry analyzers, quantitative meters or novel biosensors. Routine chemistry analyzers utilize spectrophotometry, enzymatic reactions, fluorometric, or immunoassays to detect and quantify fatty substances accurately, making them suitable for precise clinical assessment [52]. However, Point-of-Care (POC) tests have made significant advancements, yet challenges remain in terms of improving accuracy, reliability, and limits of detection [53,54,55]. Our study aims to highlight the potential of analyzing dried droplets from diluted blood samples as a diagnostic alternative for moderate dyslipidemia. Table 2 provides an overview of measurement methods for cholesterol, triglycerides, low-density lipoprotein, and high-density lipoprotein.
Prior to employing the analysis of dried droplets of diluted blood to detect a high lipid concentration, it is imperative to address critical considerations. Firstly, prompt capture of deposit images after drop drying is crucial to prevent oxidation-induced darkening. Secondly, the rapid degradation of dried drop samples with high hematocrit concentrations needs to be acknowledged. Lastly, this methodology still does not allow for the determination of triglyceride and cholesterol concentrations in the blood. However, the identification of certain advantages of the dried droplet texture analysis is evident.
The presented results highlight the potential of analyzing dried droplets of diluted blood samples in creating a diagnostic method for moderate dyslipidemia, suggesting its potential utility in diagnosing severe stages of the disease. The method requires low blood volumes, and further sample dilution may reduce the required blood sample volume even more. Furthermore, the calculated configurational entropy, both in the central region and the entire deposits, demonstrates high efficiency in differentiating between groups, eliminating the need to empirically observe specific morphological features in the deposits.
Patterns in dried drops depend on many parameters, such as moisture, viscosity, initial drop volume, and substrate type [60,61]. Since the initial droplet volume and relative humidity determine the drying time, the idea of knowing the effectiveness of this methodology using blood droplets of volumes less than 3 microliters and relative humidity less than 30% is very attractive. Moreover, creating a relationship between lipid concentration and texture parameters could provide a tool for patient monitoring and follow-up. We plan to perform such measurements in the future and report the results.
5. Conclusions
We present an experimental study analyzing the texture of dried droplet patterns from two diluted blood samples: one healthy and one with moderate hyperlipidemia. Our objective was to determine the optimal water-to-blood ratios for detecting a high lipid concentration. The observed patterns in dried droplets demonstrate a diverse range of complex structures, including plaques, random and radial cracks, granular patterns, and a peripheral erythrocyte exclusion band. These structural features vary across different regions and are influenced by the hematocrit concentration in the solution. Notably, the reduction of blood elements resulted in the generation of well-defined and reproducible patterns. The complexity of the patterns is quantified using Gray Level Co-occurrence Matrix Entropy (GLCM). Texture analysis of dried droplets achieves over 95% accuracy in detecting a high lipid concentration in solutions with 4% and 12% HCT.
Overall, we have probed that decreasing blood component concentrations can serve as an alternative approach for generating intricate patterns that function as indicators of pathology.
Author Contributions
M.A.-P.: Investigation, Methodology, Formal analysis. I.G.V.-T.: Investigation, validation. Y.J.P.C.: Supervision, Visualization, Writing—Original Draft. J.G.-G.: Conceptualización, Supervision, Project administration, Writing—Original Draft, Writing—Review and Editing. All authors have read and agreed to the published version of the manuscript.
Funding
This research received no external funding.
Institutional Review Board Statement
All subjects gave their informed consent for inclusion before they participated in the study. The study was conducted in accordance with the Declaration of Helsinki, and the protocol was approved by the Internal Ethics Committee of Collegiate Research Group Dynamical Systems and Complexity of the Autonomous University of Chiapas (01/FYM/RPR/016/23).
Data Availability Statement
Not applicable.
Acknowledgments
Y.J.P.C. wishes to acknowledge financial support by the CONACyt Postdoctoral fellowship.
Conflicts of Interest
The authors declare no competing interest.
References
- Yakhno, T.; Pakhomov, A.; Sanin, A.; Kazakov, V.; Ginoyan, R.; Yakhno, V. Drop drying on the sensor: One more way for comparative analysis of liquid media. Sensors 2020, 20, 5266. [Google Scholar] [CrossRef]
- Gulka, C.P.; Swartz, J.D.; Trantum, J.R.; Davis, K.M.; Peak, C.M.; Denton, A.J.; Haselton, F.R.; Wright, D.W. Coffee rings as low-resource diagnostics: Detection of the malaria biomarker plasmodium falciparum histidine-rich protein-ii using a surface-coupled ring of ni (ii) nta gold-plated polystyrene particles. ACS Appl. Mater. Interfaces 2014, 6, 6257–6263. [Google Scholar] [CrossRef] [PubMed]
- Wen, J.T.; Ho, C.M.; Lillehoj, P.B. Coffee ring aptasensor for rapid protein detection. Langmuir 2013, 29, 8440–8446. [Google Scholar] [CrossRef]
- Trantum, J.R.; Wright, D.W.; Haselton, F.R. Biomarker-mediated disruption of coffee-ring formation as a low resource diagnostic indicator. Langmuir 2012, 28, 2187–2193. [Google Scholar] [CrossRef]
- Kim, J.; Dowling, V.; Datta, T.; Pershin, Y.V. Whisky-born memristor. Phys. Status Solidi (a) 2022, 220, 2200643. [Google Scholar] [CrossRef]
- Carreón, Y.J.; Díaz-Hernández, O.; Escalera Santos, G.J.; Cipriano-Urbano, I.; Solorio-Ordaz, F.J.; González-Gutiérrez, J.; Zenit, R. Texture Analysis of Dried Droplets for the Quality Control of Medicines. Sensors 2021, 21, 4048. [Google Scholar] [CrossRef]
- González-Gutiérrez, J.; Pérez-Isidoro, R.; Ruiz-Suárez, J. A technique based on droplet evaporation to recognize alcoholic drinks. Rev. Sci. Instruments 2017, 88, 074101. [Google Scholar] [CrossRef] [PubMed]
- Carrithers, A.D.; Brown, M.J.; Rashed, M.Z.; Islam, S.; Velev, O.D.; Williams, S.J. Multiscale self-assembly of distinctive weblike structures from evaporated drops of dilute american whiskeys. ACS Nano 2020, 14, 5417–5425. [Google Scholar] [CrossRef] [PubMed]
- Peschel, O.; Kunz, S.; Rothschild, M.; Mützel, E. Blood stain pattern analysis. Forensic Sci. Med. Pathol. 2011, 7, 257–270. [Google Scholar] [CrossRef]
- Wang, F.; Gallardo, V.; Michielsen, S.; Fang, T. Fundamental study of porcine drip bloodstains on fabrics: Blood droplet impact and wicking dynamics. Forensic Sci. Int. 2021, 318, 110614. [Google Scholar] [CrossRef]
- Sett, A.; Ayushman, M.; Dasgupta, S.; DasGupta, S. Analysis of the distinct pattern formation of globular proteins in the presence of micro-and nanoparticles. J. Phys. Chem. B 2018, 122, 8972–8984. [Google Scholar] [CrossRef]
- Carreón, Y.J.; González-Gutiérrez, J.; Pérez-Camacho, M.; Mercado-Uribe, H. Patterns produced by dried droplets of protein binary mixtures suspended in water. Colloids Surf. B Biointerfaces 2018, 161, 103–110. [Google Scholar] [CrossRef]
- Pal, A.; Gope, A.; Iannacchione, G.S. A comparative study of the phase separation of a nematic liquid crystal in the self-assembling drying protein drops. MRS Adv. 2019, 4, 1309–1314. [Google Scholar] [CrossRef]
- Sefiane, K.; Duursma, G.; Arif, A. Patterns from dried drops as a characterisation and healthcare diagnosis technique, potential and challenges: A review. Adv. Colloid Interface Sci. 2021, 298, 102546. [Google Scholar] [CrossRef] [PubMed]
- Yakhno, T.A.; Yakhno, V.G.; Sanin, A.G.; Sanina, O.A.; Pelyushenko, A.S.; Egorova, N.A.; Terentiev, I.G.; Smetanina, S.V.; Korochkina, O.V.; Yashukova, E.V. The informative-capacity phenomenon of drying drops. IEEE Eng. Med. Biol. Mag. 2005, 24, 96–104. [Google Scholar] [CrossRef] [PubMed]
- Misyura, S. Different modes of heat transfer and crystallization in a drop of NaCl solution: The influence of key factors on the crystallization rate and the heat transfer coefficient. Int. J. Therm. Sci. 2021, 159, 106602. [Google Scholar] [CrossRef]
- Pal, A.; Gope, A.; Iannacchione, G. Temperature and concentration dependence of human whole blood and protein drying droplets. Biomolecules 2021, 11, 231. [Google Scholar] [CrossRef]
- Misyura, S. The dependence of drop evaporation rate and wettability on corrosion kinetics. Colloids Surf. A Physicochem. Eng. Asp. 2021, 610, 125735. [Google Scholar] [CrossRef]
- Deegan, R.D.; Bakajin, O.; Dupont, T.F.; Huber, G.; Nagel, S.R.; Witten, T.A. Capillary flow as the cause of ring stains from dried liquid drops. Nature 1997, 389, 827. [Google Scholar] [CrossRef]
- Pal, A.; Gope, A.; Iannacchione, G.S. Hierarchical Exploration of Drying Patterns Formed in Drops Containing Lysozyme, PBS, and Liquid Crystals. Processes 2022, 10, 955. [Google Scholar] [CrossRef]
- Kim, H.; Boulogne, F.; Um, E.; Jacobi, I.; Button, E.; Stone, H.A. Controlled uniform coating from the interplay of Marangoni flows and surface-adsorbed macromolecules. Phys. Rev. Lett. 2016, 116, 124501. [Google Scholar] [CrossRef] [Green Version]
- Misyura, S. The influence of key factors on the movement of a crystal and a non-crystalline particle on a free droplet surface. Exp. Therm. Fluid Sci. 2019, 109, 109883. [Google Scholar] [CrossRef]
- Perrin, L.; Akanno, A.; Guzman, E.; Ortega, F.; Rubio, R.G. Pattern Formation upon Evaporation of Sessile Droplets of Polyelectrolyte/Surfactant Mixtures on Silicon Wafers. Int. J. Mol. Sci. 2021, 22, 7953. [Google Scholar] [CrossRef] [PubMed]
- Chao, T.C.; Trybala, A.; Starov, V.; Das, D.B. Influence of haematocrit level on the kinetics of blood spreading on thin porous medium during dried blood spot sampling. Colloids Surf. A Physicochem. Eng. Asp. 2014, 451, 38–47. [Google Scholar] [CrossRef] [Green Version]
- Brutin, D.; Sobac, B.; Loquet, B.; Sampol, J. Pattern formation in drying drops of blood. J. Fluid Mech. 2011, 667, 85–95. [Google Scholar] [CrossRef] [Green Version]
- Mukhopadhyay, M.; Ray, R.; Ayushman, M.; Sood, P.; Bhattacharyya, M.; Sarkar, D.; DasGupta, S. Interfacial energy driven distinctive pattern formation during the drying of blood droplets. J. Colloid Interface Sci. 2020, 573, 307–316. [Google Scholar] [CrossRef]
- Brutin, D. Droplet Wetting and Evaporation: From Pure to Complex Fluids; Academic Press: Cambridge, MA, USA, 2015. [Google Scholar]
- Zeid, W.B.; Brutin, D. Influence of relative humidity on spreading, pattern formation and adhesion of a drying drop of whole blood. Colloids Surf. A Physicochem. Eng. Asp. 2013, 430, 1–7. [Google Scholar] [CrossRef]
- Jain, K.S.; Kathiravan, M.; Somani, R.S.; Shishoo, C.J. The biology and chemistry of hyperlipidemia. Bioorg. Med. Chem. 2007, 15, 4674–4699. [Google Scholar] [CrossRef]
- Bevk, M.; Kononenko, I. A statistical approach to texture description of medical images: A preliminary study. In Proceedings of the Proceedings of 15th IEEE Symposium on Computer-Based Medical Systems (CBMS 2002), Maribor, Slovenia, 4–7 June 2002; pp. 239–244. [Google Scholar]
- Jain, S. Brain cancer classification using GLCM based feature extraction in artificial neural network. Int. J. Comput. Sci. Eng. Technol. 2013, 4, 966–970. [Google Scholar]
- Tahir, M.A.; Bouridane, A.; Kurugollu, F. An FPGA based coprocessor for GLCM and Haralick texture features and their application in prostate cancer classification. Analog Integr. Circuits Signal Process. 2005, 43, 205–215. [Google Scholar] [CrossRef]
- Mostaço-Guidolin, L.B.; Ko, A.C.T.; Wang, F.; Xiang, B.; Hewko, M.; Tian, G.; Major, A.; Shiomi, M.; Sowa, M.G. Collagen morphology and texture analysis: From statistics to classification. Sci. Rep. 2013, 3, 2190. [Google Scholar] [CrossRef] [Green Version]
- Lombardi, J.; Pellegrino, J.M.; Soazo, M.; Corrêa, A.P.F.; Brandelli, A.; Risso, P.; Boeris, V. Mineral fortification modifies physical and microstructural characteristics of milk gels coagulated by a bacterial enzymatic pool. Colloids Surf. B Biointerfaces 2018, 161, 296–301. [Google Scholar] [CrossRef] [PubMed] [Green Version]
- Xie, C.; Shao, Y.; Li, X.; He, Y. Detection of early blight and late blight diseases on tomato leaves using hyperspectral imaging. Sci. Rep. 2015, 5, 16564. [Google Scholar] [CrossRef] [PubMed] [Green Version]
- Fawcett, T. An introduction to ROC analysis. Pattern Recognit. Lett. 2006, 27, 861–874. [Google Scholar] [CrossRef]
- Munir, K.; Elahi, H.; Ayub, A.; Frezza, F.; Rizzi, A. Cancer diagnosis using deep learning: A bibliographic review. Cancers 2019, 11, 1235. [Google Scholar] [CrossRef] [Green Version]
- Carreón, Y.J.; Gómez-López, M.L.; Díaz-Hernández, O.; Vazquez-Vergara, P.; Moctezuma, R.E.; Saniger, J.M.; González-Gutiérrez, J. Patterns in dried droplets to detect unfolded BSA. Sensors 2022, 22, 1156. [Google Scholar] [CrossRef]
- Carreón, Y.J.; Ríos-Ramírez, M.; Moctezuma, R.; González-Gutiérrez, J. Texture analysis of protein deposits produced by droplet evaporation. Sci. Rep. 2018, 8, 9580. [Google Scholar] [CrossRef] [Green Version]
- Pal, A.; Gope, A.; Kafle, R.; Iannacchione, G.S. Phase separation of a nematic liquid crystal in the self-assembly of lysozyme in a drying aqueous solution drop. MRS Commun. 2019, 9, 150–158. [Google Scholar] [CrossRef]
- Shultz, E.K. Multivariate receiver-operating characteristic curve analysis: Prostate cancer screening as an example. Clin. Chem. 1995, 41, 1248–1255. [Google Scholar] [CrossRef]
- Tharwat, A. Classification assessment methods. Appl. Comput. Inform. 2020, 17, 168–192. [Google Scholar] [CrossRef]
- Gorr, H.M.; Zueger, J.M.; Barnard, J.A. Lysozyme pattern formation in evaporating drops. Langmuir 2012, 28, 4039–4042. [Google Scholar] [CrossRef] [PubMed]
- Chen, G.; J Mohamed, G. Complex protein patterns formation via salt-induced self-assembly and droplet evaporation. Eur. Phys. J. E 2010, 33, 19–26. [Google Scholar] [CrossRef] [PubMed]
- Pal, A.; Gope, A.; Obayemi, J.D.; Iannacchione, G.S. Concentration-driven phase transition and self-assembly in drying droplets of diluting whole blood. Sci. Rep. 2020, 10, 18908. [Google Scholar] [CrossRef] [PubMed]
- Ramsthaler, F.; Schlote, J.; Wagner, C.; Fiscina, J.; Kettner, M. The ring phenomenon of diluted blood droplets. Int. J. Leg. Med. 2016, 130, 731–736. [Google Scholar] [CrossRef]
- Iqbal, R.; Shen, A.Q.; Sen, A. Understanding of the role of dilution on evaporative deposition patterns of blood droplets over hydrophilic and hydrophobic substrates. J. Colloid Interface Sci. 2020, 579, 541–550. [Google Scholar] [CrossRef]
- Bialkower, M.; Manderson, C.A.; McLiesh, H.; Tabor, R.F.; Garnier, G. Paper diagnostic for direct measurement of fibrinogen concentration in whole blood. ACS Sensors 2020, 5, 3627–3638. [Google Scholar] [CrossRef]
- Huang, J.; Ali, N.; Quansah, E.; Guo, S.; Noutsias, M.; Meyer-Zedler, T.; Bocklitz, T.; Popp, J.; Neugebauer, U.; Ramoji, A. Vibrational spectroscopic investigation of blood plasma and serum by drop coating deposition for clinical application. Int. J. Mol. Sci. 2021, 22, 2191. [Google Scholar] [CrossRef]
- Esmonde-White, K.A.; Esmonde-White, F.W.; Morris, M.D.; Roessler, B.J. Characterization of biofluids prepared by sessile drop formation. Analyst 2014, 139, 2734–2741. [Google Scholar] [CrossRef] [Green Version]
- Lovergne, L.; Clemens, G.; Untereiner, V.; Lukaszweski, R.A.; Sockalingum, G.D.; Baker, M.J. Investigating optimum sample preparation for infrared spectroscopic serum diagnostics. Anal. Methods 2015, 7, 7140–7149. [Google Scholar] [CrossRef] [Green Version]
- Schaefer, E.J.; Tsunoda, F.; Diffenderfer, M.; Polisecki, E.; Thai, N.; Asztalos, B. The Measurement of Lipids, Lipoproteins, Apolipoproteins, Fatty Acids, and Sterols, and Next Generation Sequencing for the Diagnosis and Treatment of Lipid Disorders; MDText.com, Inc.: South Dartmouth, MA, USA, 2000; Available online: http://0-dx-doi-org.brum.beds.ac.uk/10.1039/C3AN02175K (accessed on 5 July 2023).
- Kurstjens, S.; Gemen, E.; Walk, S.; Njo, T.; Krabbe, J.; Gijzen, K.; Elisen, M.G.; Kusters, R. Performance of commercially-available cholesterol self-tests. Ann. Clin. Biochem. 2021, 58, 289–296. [Google Scholar] [CrossRef]
- Bastianelli, K.; Ledin, S.; Chen, J. Comparing the accuracy of 2 point-of-care lipid testing devices. J. Pharm. Pract. 2017, 30, 490–497. [Google Scholar] [CrossRef]
- Lee, W.C.; Ng, H.Y.; Hou, C.Y.; Lee, C.T.; Fu, L.M. Recent advances in lab-on-paper diagnostic devices using blood samples. Lab Chip 2021, 21, 1433–1453. [Google Scholar] [CrossRef]
- Zong, L.; Han, Y.; Gao, L.; Du, C.; Zhang, X.; Li, L.; Huang, X.; Liu, J.; Yu, H.D.; Huang, W. A transparent paper-based platform for multiplexed bioassays by wavelength-dependent absorbance/transmittance. Analyst 2019, 144, 7157–7161. [Google Scholar] [CrossRef] [PubMed]
- Li, C.G.; Joung, H.A.; Noh, H.; Song, M.B.; Kim, M.G.; Jung, H. One-touch-activated blood multidiagnostic system using a minimally invasive hollow microneedle integrated with a paper-based sensor. Lab A Chip 2015, 15, 3286–3292. [Google Scholar] [CrossRef] [PubMed]
- Lee, Y.J.; Eom, K.S.; Shin, K.S.; Kang, J.Y.; Lee, S.H. Enzyme-loaded paper combined impedimetric sensor for the determination of the low-level of cholesterol in saliva. Sens. Actuators B Chem. 2018, 271, 73–81. [Google Scholar] [CrossRef]
- Park, C.; Kim, H.R.; Kim, S.K.; Jeong, I.K.; Pyun, J.C.; Park, S. Three-dimensional paper-based microfluidic analytical devices integrated with a plasma separation membrane for the detection of biomarkers in whole blood. ACS Appl. Mater. Interfaces 2019, 11, 36428–36434. [Google Scholar] [CrossRef]
- Wang, M.; Zhu, J.; Zi, Y.; Huang, W. 3D MXene sponge: Facile synthesis, excellent hydrophobicity, and high photothermal efficiency for waste oil collection and purification. ACS Appl. Mater. Interfaces 2021, 13, 47302–47312. [Google Scholar] [CrossRef]
- Wang, M.; Zi, Y.; Zhu, J.; Huang, W.; Zhang, Z.; Zhang, H. Construction of super-hydrophobic PDMS@ MOF@ Cu mesh for reduced drag, anti-fouling and self-cleaning towards marine vehicle applications. Chem. Eng. J. 2021, 417, 129265. [Google Scholar] [CrossRef]
Figure 1.
Different hematocrit concentrations. Dried blood drops with different HCT concentrations of a healthy patient (upper) and a patient with high levels of lipids (bottom). The diameters of the deposits are as follows: 2.86 ± 0.13 mm (4% HCT), 2.79 ± 0.11 mm (12% HCT), 2.84 ± 0.14 mm (20% HCT), 2.72 ± 0.12 mm (28% HCT), 2.68 ± 0.15 mm (36% HCT), 2.66 ± 0.13 mm (40% HCT) for the healthy patient and 2.93 ± 0.10 mm (4% HCT), 2.98 ± 0.15 mm (12% HCT), 2.92 ± 0.12 mm (20% HCT), 2.80 ± 0.13 mm (28% HCT), 2.62 ± 0.16 mm (36% HCT), 2.80 ± 0.14 mm (40% HCT) for a patient with high levels of lipids.

Figure 2.
Patterns of dried blood droplets. (a) Deposits with low HCT concentration (4%, 12%, and 20%) from a healthy patient (top) and a patient with high lipid concentration (bottom). The yellow and pink lines determine the crown and central region, respectively. Radial cracks are denoted by the blue arrow, while ortho-radial cracks are indicated by the green arrow. Random cracks and mobile plaques are shown by the orange arrow and black arrows, respectively. (b) Dried droplets with elevated HCT concentrations (28%, 36%, and 40%) from a healthy patient (top) and a patient with high lipid concentration (bottom). The white line indicates the erythrocyte exclusion zone. The black bar indicates 1 mm.

Figure 3.
Reproducibility of patterns in dried blood drops. (a) Deposits from a healthy patient with different HCT concentrations (4%, 28%, and 40%). (b) Dried blood droplets from a patient with high lipid concentration with different HCT concentrations (4%, 28%, and 40%). The black and blue bar indicates 1 mm.

Figure 4.
Texture analysis of dried blood drops. Entropy as a function of different HCT concentrations analyzed on two distinct areas: (a) entire deposits and (b) central region. The green circles enclosed area on the dried drops show the region analyzed. The error bars correspond to standard deviations from .

Figure 5.
Receiver Operating Characteristic (ROC) and Accuracy. (a) ROC curve with excellent ratio sensitivity and 1-specificity at 4% HCT (upper) and 12% HCT (bottom). (b) ROC curve with deficient differentiation of elements of two groups at 36% HCT (upper) and 20% HCT (bottom). (c) Accuracy for identifying deposits with a high lipid concentration by Entropy analysis on the entire deposit (upper) and the central region (bottom).


Table 1.
Complete blood count.
| Hematic Biometry | Healthy Patient | Dyslipidemic Patient | Unit |
|---|---|---|---|
| Leukocytes | 4.5 | 8.74 | /L |
| Erythrocytes | 4.3 | 4.63 | /mm |
| Hemoglobin | 129 | 138 | g/L |
| Hematocrit | 40 | 39.3 | % |
| Mean Corpuscular Volume | 93 | 84.9 | fL |
| Mean Corpuscular Hb | 1.8617 | 1.8493 | fmol |
| Mean Corpuscular Hb Concentration | 20.0447 | 21.7823 | mmol/L |
| Platelet | 310 | 313 | L |
| Mean platelet volume | 7.1 | 9 | fL |
| Lymphocyte | 2.07 | 3.59 | L |
| Neutrophils | 1.89 | 4.01 | L |
| Monocytes | 0.54 | 0.8 | L |
| Eosinophils | 0 | 0.24 | L |
| Basophils | 0 | 0.05 | L |
| Lymphocyte | 46 | 41.1 | % |
| Neutrophils | 42 | 45.8 | % |
| Monocytes | 12 | 9.2 | % |
| Eosinophils | 0 | 2.7 | % |
| Basophils | 0 | 0.6 | % |
| Biochemistry | |||
| Glucose | 5.1621 | 8.9809 | mmol/L |
| Urea | 4.995 | 4.8452 | mmol/L |
| Urea Nitrogen | 5.0286 | 4.8571 | mmol/L |
| Serum Creatinine | 0.0522 | 0.076 | mmol/L |
| Total Cholesterol | 3.3364 | 4.7899 | mmol/L |
| Triglyceride | 0.7458 | 2.765 | mmol/L |
| Cholesterol HDL | 1.2285 | 1.1018 | mmol/L |
| Cholesterol LDL | 1.7284 | 3.0958 | mmol/L |
Table 2.
Briefly list of measurement methods of cholesterol, triglycerides, low-density lipoprotein, and high-density lipoprotein.
Table 2.
Briefly list of measurement methods of cholesterol, triglycerides, low-density lipoprotein, and high-density lipoprotein.
| Materials and Structures | Detection Methods | Sample Type | Target | Detection Limit or Accuracy | Refs. |
|---|---|---|---|---|---|
| Strip-based meter | N/A | finger-stick blood | Cholesterol, HDL, TG, LDL | 96% | [53] |
| Strip-based meter | N/A | finger-stick blood | Cholesterol, HDL, TG, LDL | 40% | [53] |
| Strip-based meter | N/A | finger-stick blood | Cholesterol, TG | 92% | [53] |
| Single-use strip | N/A | finger-stick blood | Cholesterol | 85% | [53] |
| Single-use strip | N/A | finger-stick blood | Cholesterol | 80% | [53] |
| Chromatogr. paper, 2-D | Colorimetric + Reagent | Serum Centrifuge | Cholesterol | 0.1 mM | [56] |
| PDMS + NC membrane, 3-D | Colorimetric + biomarker | Whole blood | Cholesterol | 11 mg dL | [57] |
| NC paper, 3-D | Electrochem + modified ED | Saliva | Cholesterol | 0.5 g dL | [58] |
| Filter paper, 3-D | Colorimetric + biomarker | Whole blood | Cholesterol | N/A | [59] |
| flower-shaped lab-on-paper | Colorimetric + biomarker | Whole blood | Cholesterol, TG, LDL, HDL | 50 mg dL, 70 mg dL, 70 mg dL, 60 mg dL | [59] |
| PMMA | Image Analysis | Diluted blood | Lipid | 95% | ** |
Triglycerides(TG), Low-density lipoprotein (LDL), and high-density lipoprotein (HDL), Polydimethylsiloxane (PDMS), Nitrocellulose (NC), Polymethyl methacrylate (PMMA). ** This report.
Disclaimer/Publisher’s Note: The statements, opinions and data contained in all publications are solely those of the individual author(s) and contributor(s) and not of MDPI and/or the editor(s). MDPI and/or the editor(s) disclaim responsibility for any injury to people or property resulting from any ideas, methods, instructions or products referred to in the content. |
© 2023 by the authors. Licensee MDPI, Basel, Switzerland. This article is an open access article distributed under the terms and conditions of the Creative Commons Attribution (CC BY) license (https://creativecommons.org/licenses/by/4.0/).
Share and Cite
MDPI and ACS Style
Ancheyta-Palacios, M.; Velasco-Terán, I.G.; Carreón, Y.J.P.; González-Gutiérrez, J. Dried Droplets of Diluted Blood to Detect a High Concentration of Lipids. Processes 2023, 11, 2047. https://0-doi-org.brum.beds.ac.uk/10.3390/pr11072047
AMA Style
Ancheyta-Palacios M, Velasco-Terán IG, Carreón YJP, González-Gutiérrez J. Dried Droplets of Diluted Blood to Detect a High Concentration of Lipids. Processes. 2023; 11(7):2047. https://0-doi-org.brum.beds.ac.uk/10.3390/pr11072047
Chicago/Turabian StyleAncheyta-Palacios, Monserrat, Iris G. Velasco-Terán, Yojana J. P. Carreón, and Jorge González-Gutiérrez. 2023. "Dried Droplets of Diluted Blood to Detect a High Concentration of Lipids" Processes 11, no. 7: 2047. https://0-doi-org.brum.beds.ac.uk/10.3390/pr11072047
Note that from the first issue of 2016, this journal uses article numbers instead of page numbers. See further details here.