
Optimizing the Extraction Process of Value-Added Products from Olive Cake Using Neuro-Fuzzy Models
 , , and
Abstract
:
1. Introduction
2. Materials and Methods
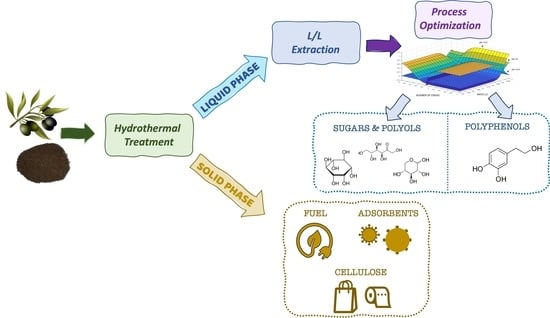
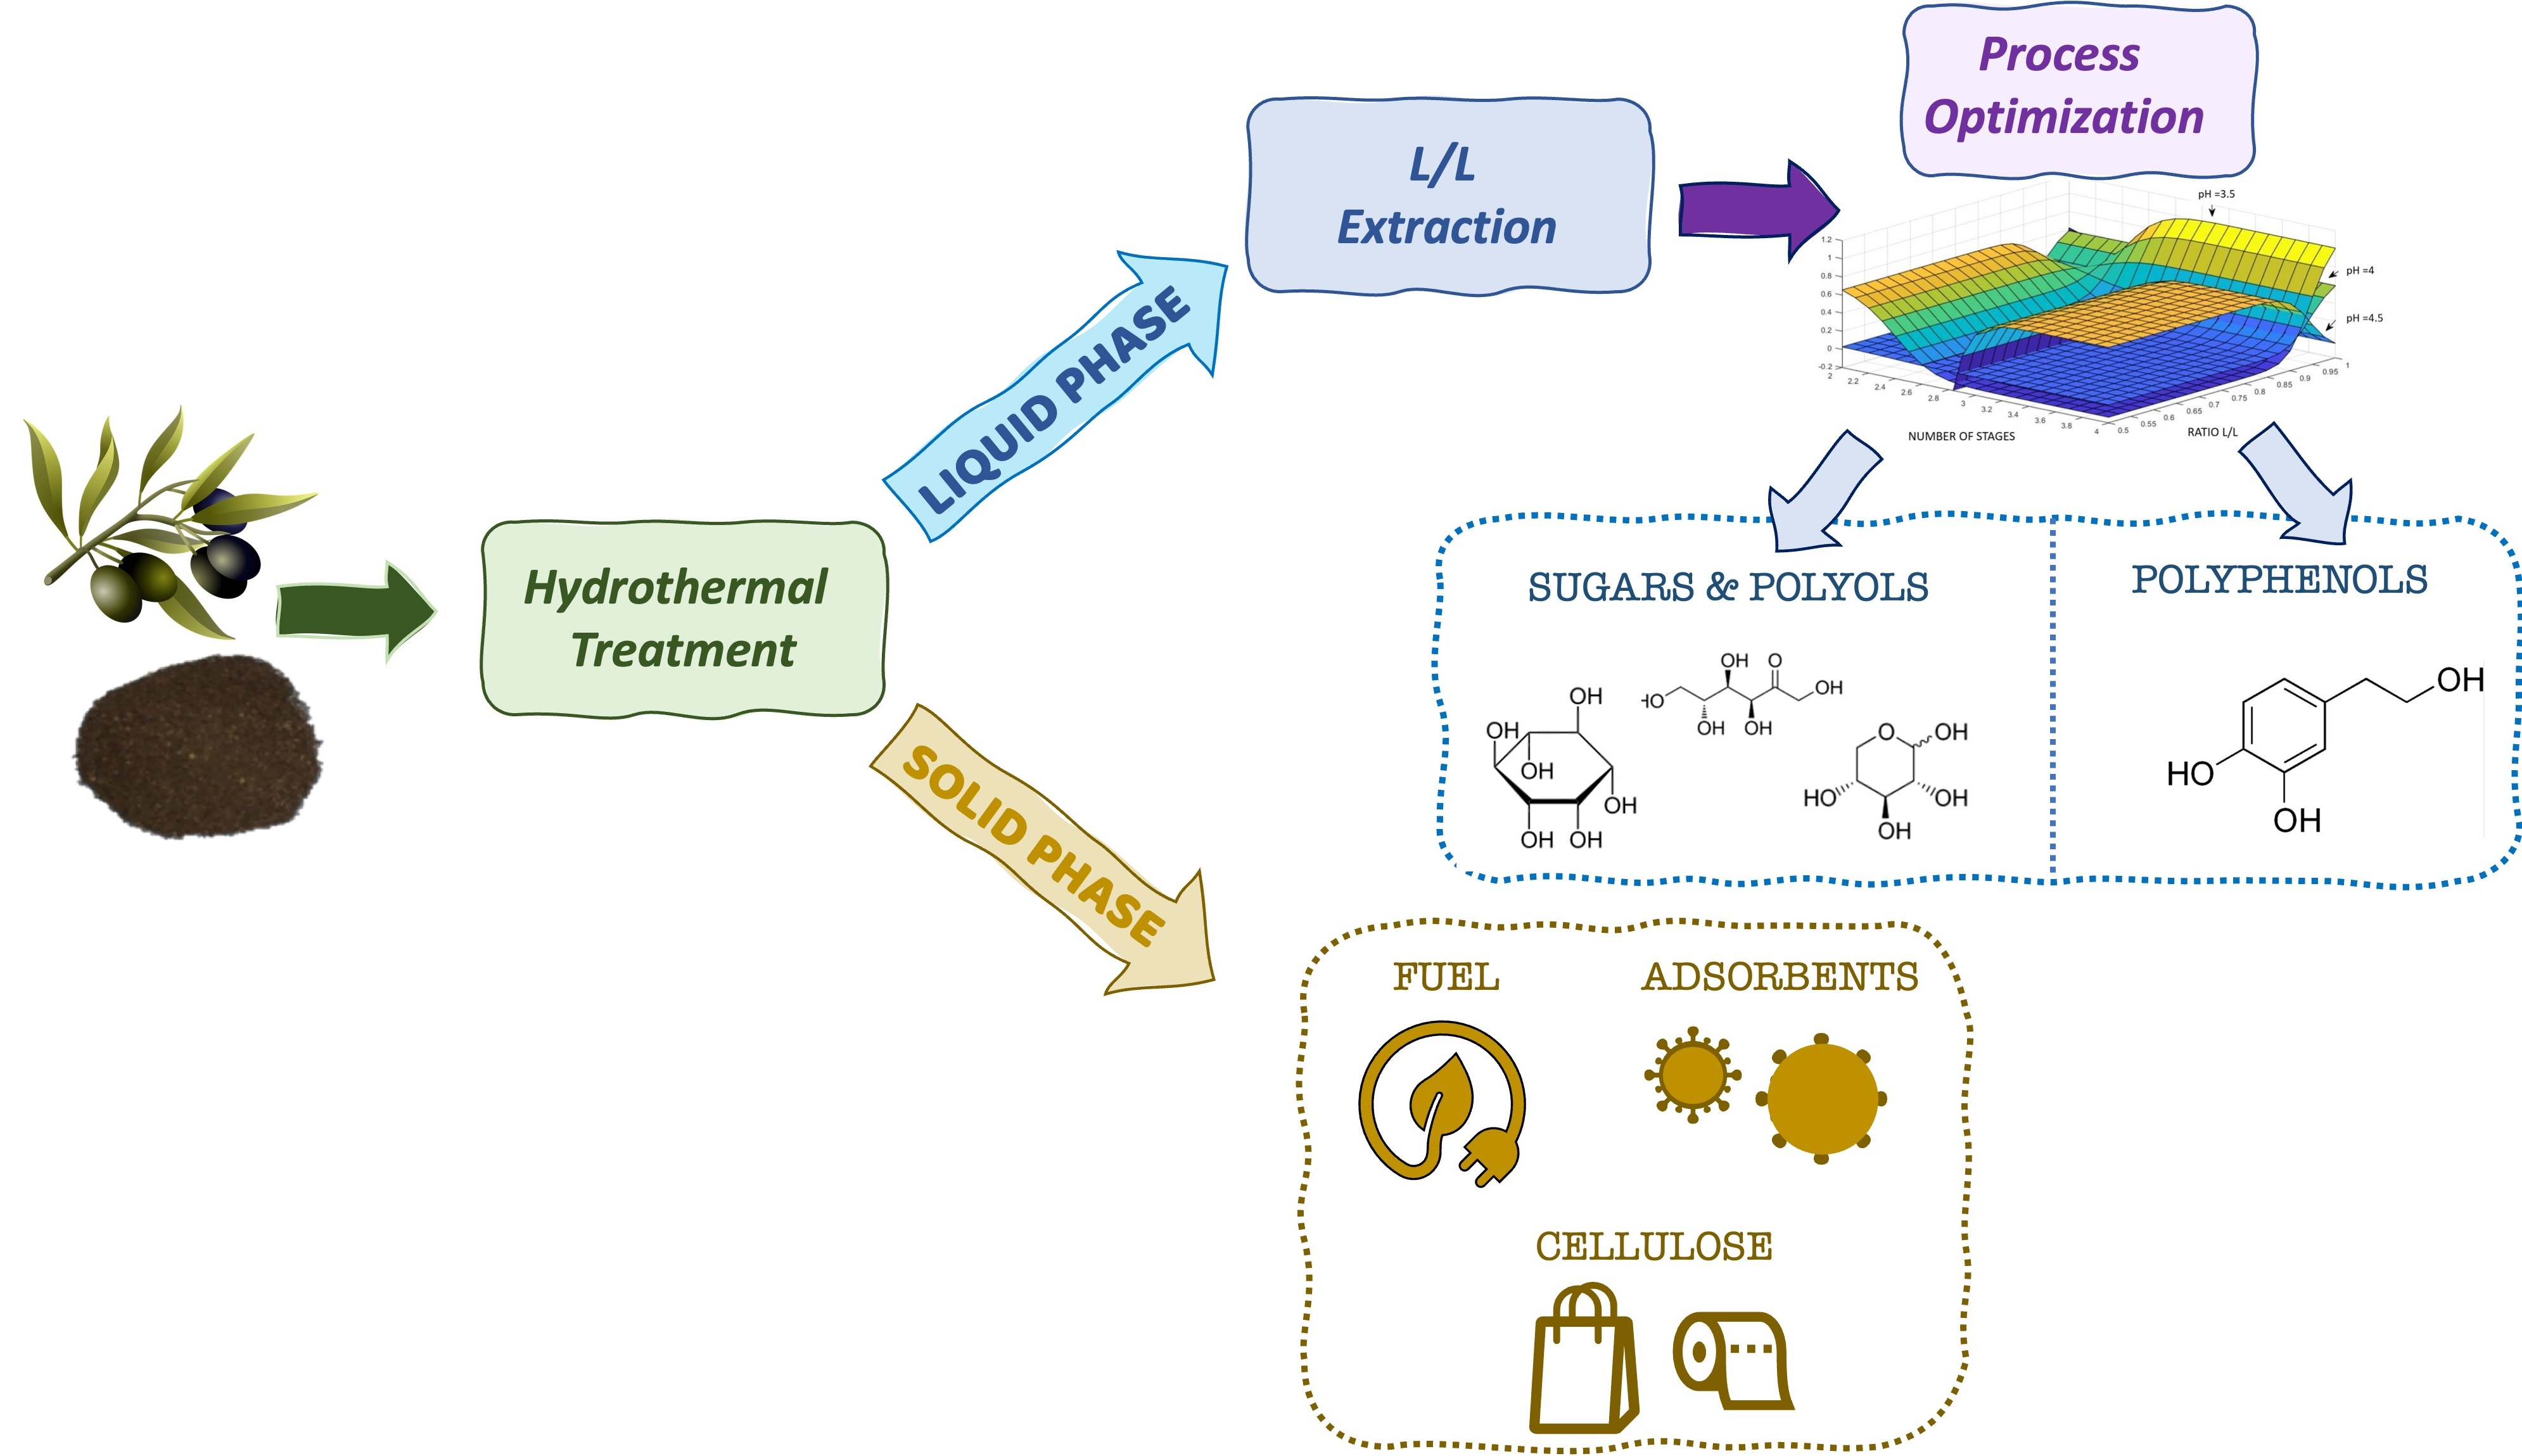
2.1. Raw Material and Work Scheme
2.2. Hydrothermal Treatment (Washing)
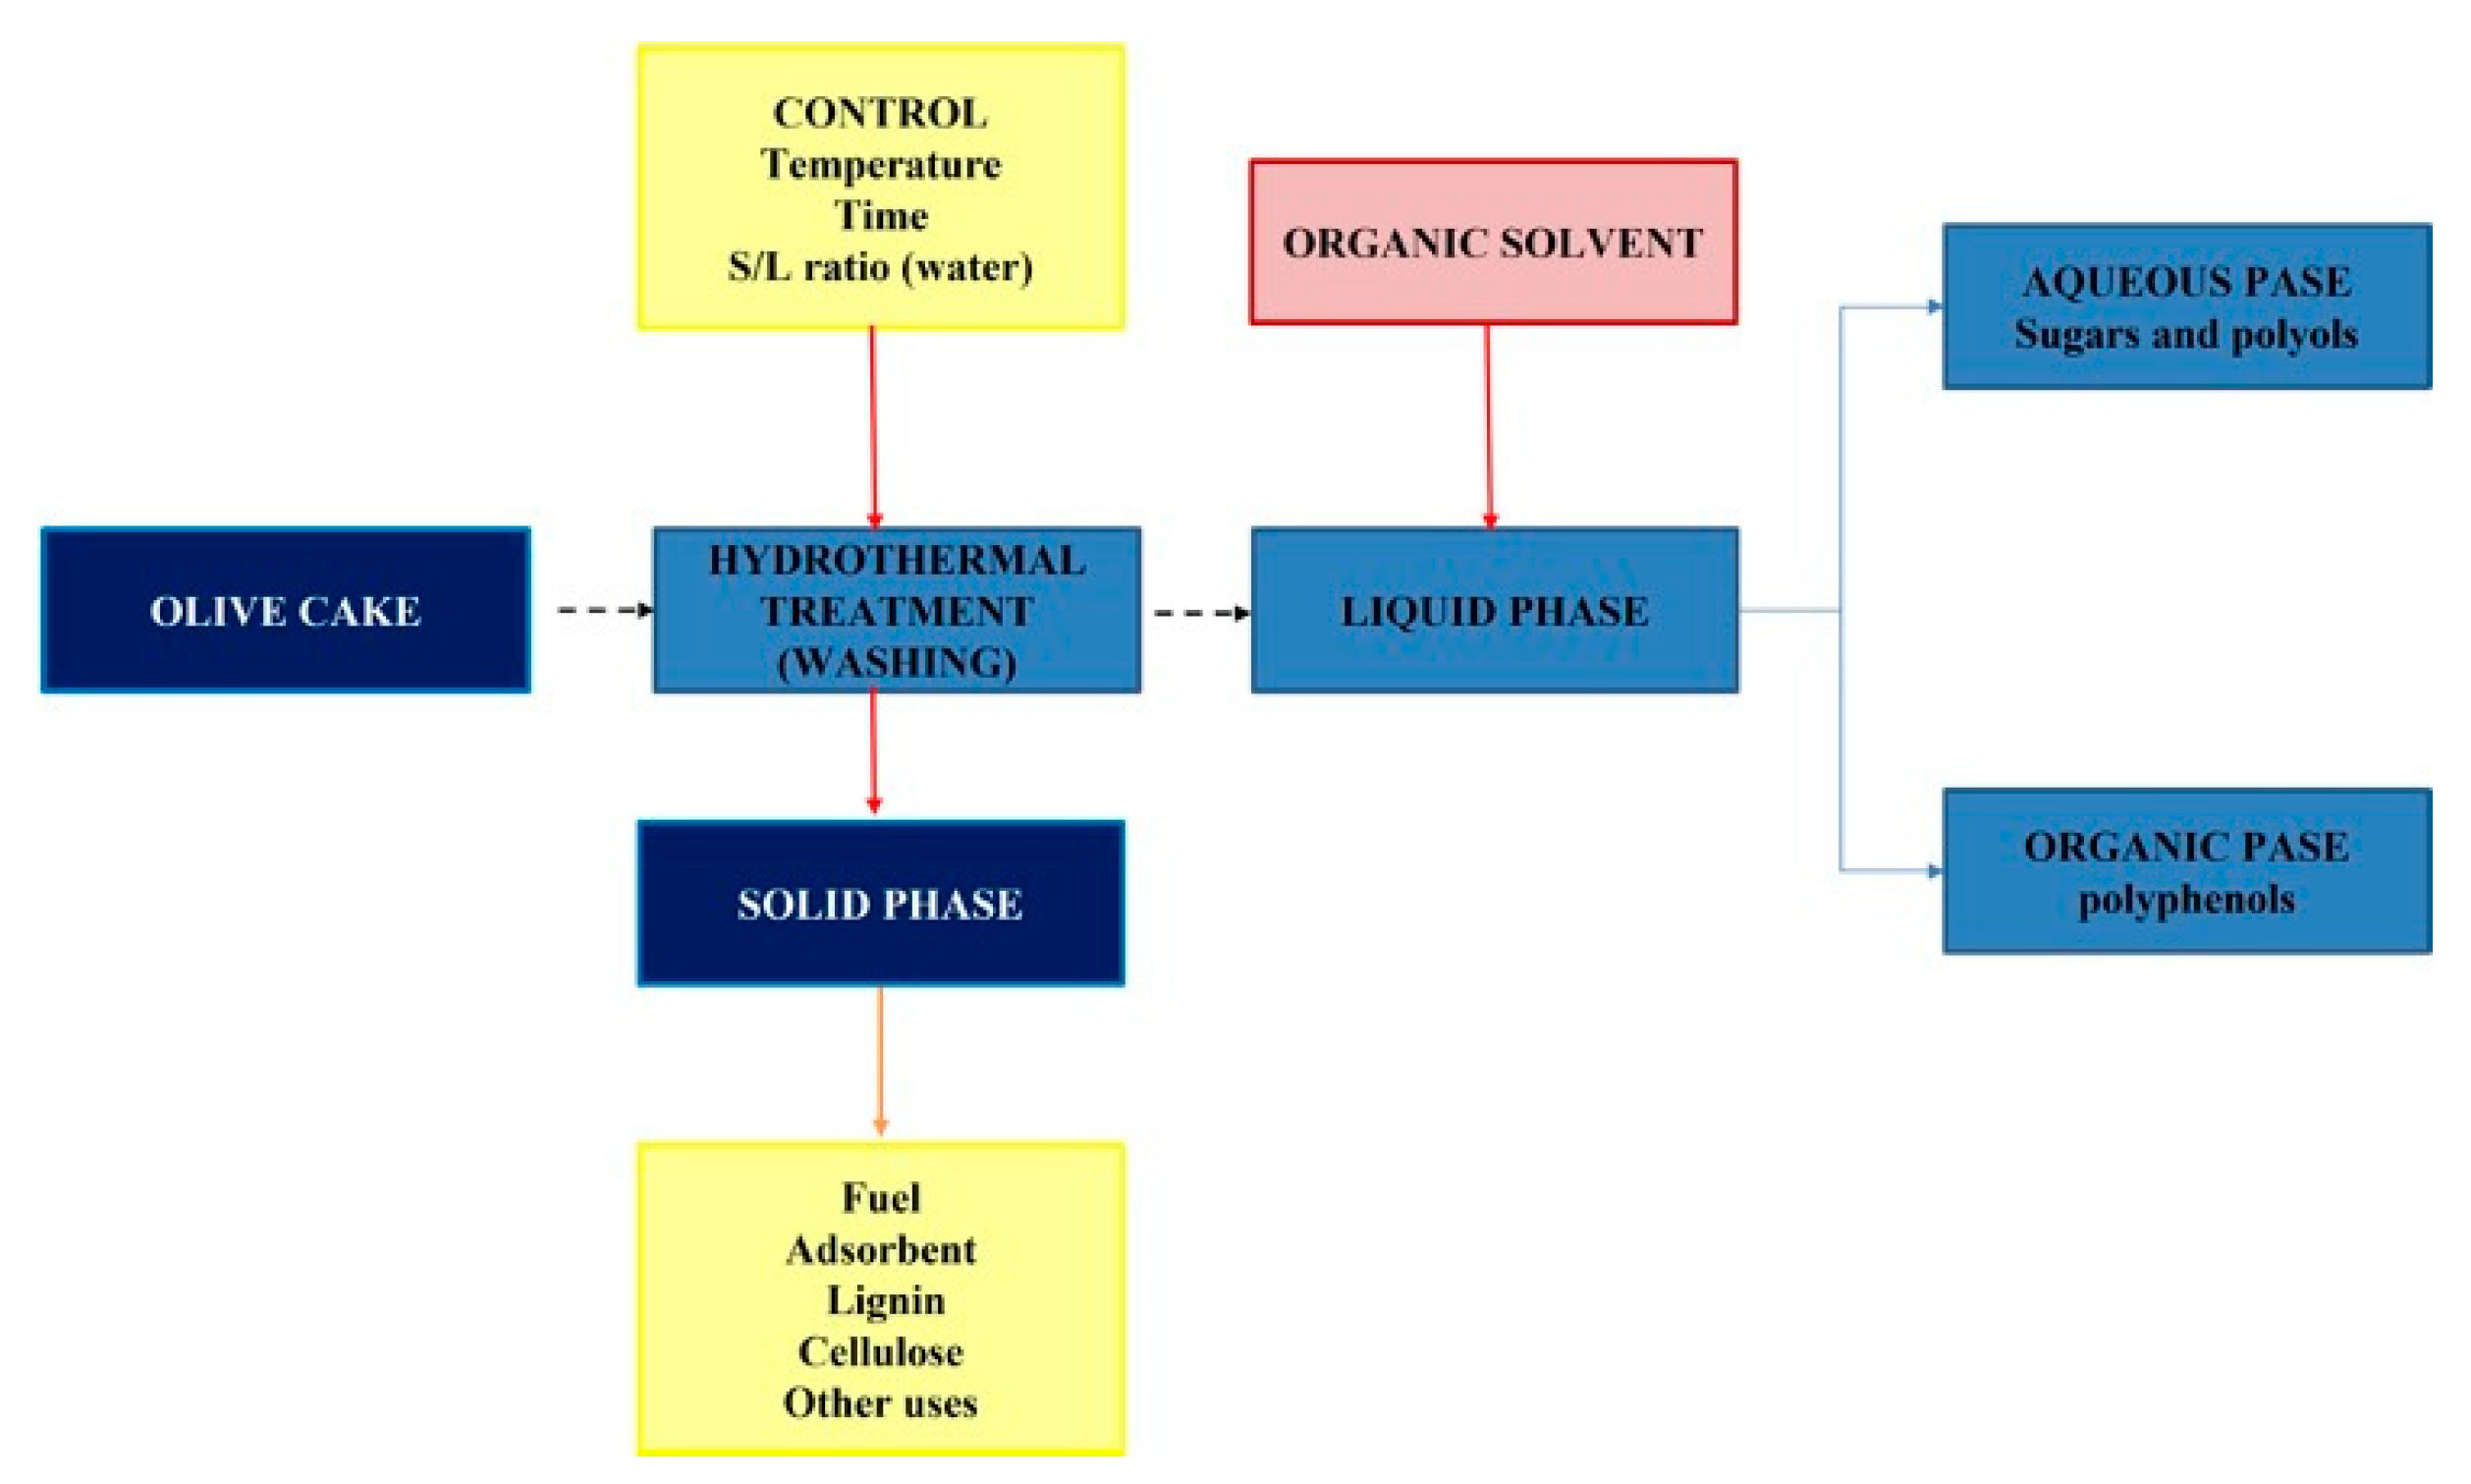
2.3. Liquid/Liquid Extraction
Liquid/Liquid Extraction: Optimization Extraction Process
2.4. Neuro-Fuzzy Model
Relative Value and Relative Increase
2.5. Determination of Sugars and Oligomers
2.6. Determination of Polyphenols: Folin–Ciocalteu Method
3. Results and Discussion
3.1. Hydrothermal Treatment
3.2. Liquid/Liquid Extraction
3.3. Study of the Variables of the Extraction Process
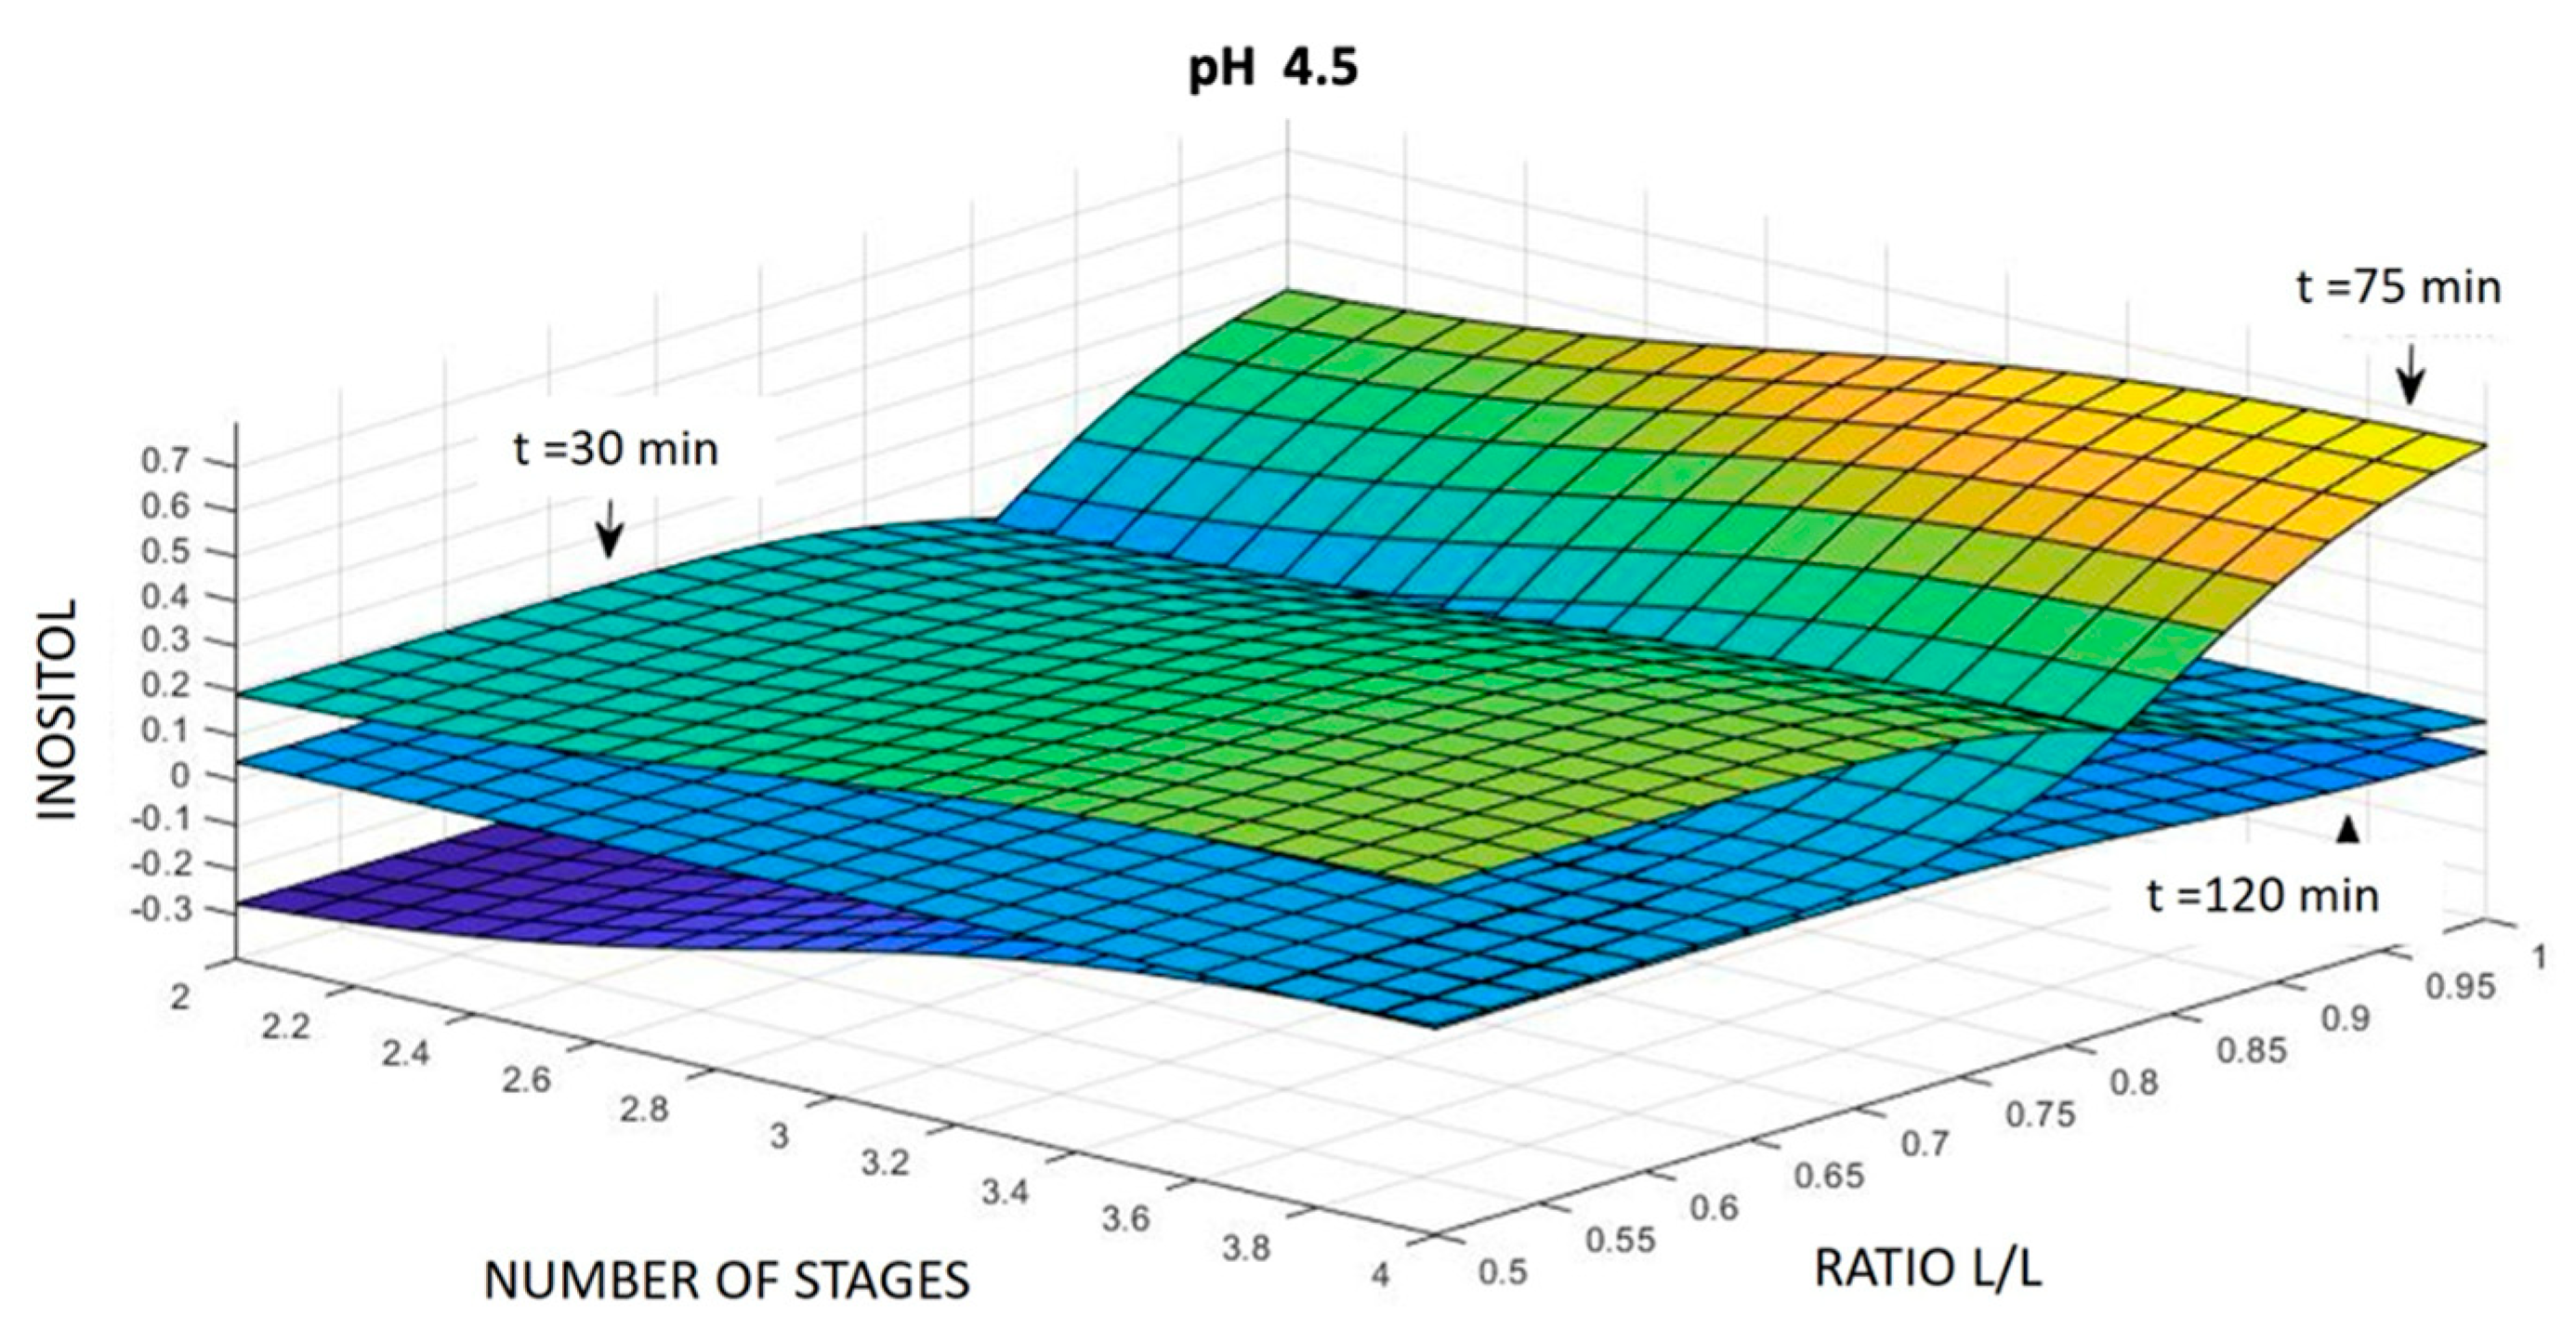
3.3.1. Inositol
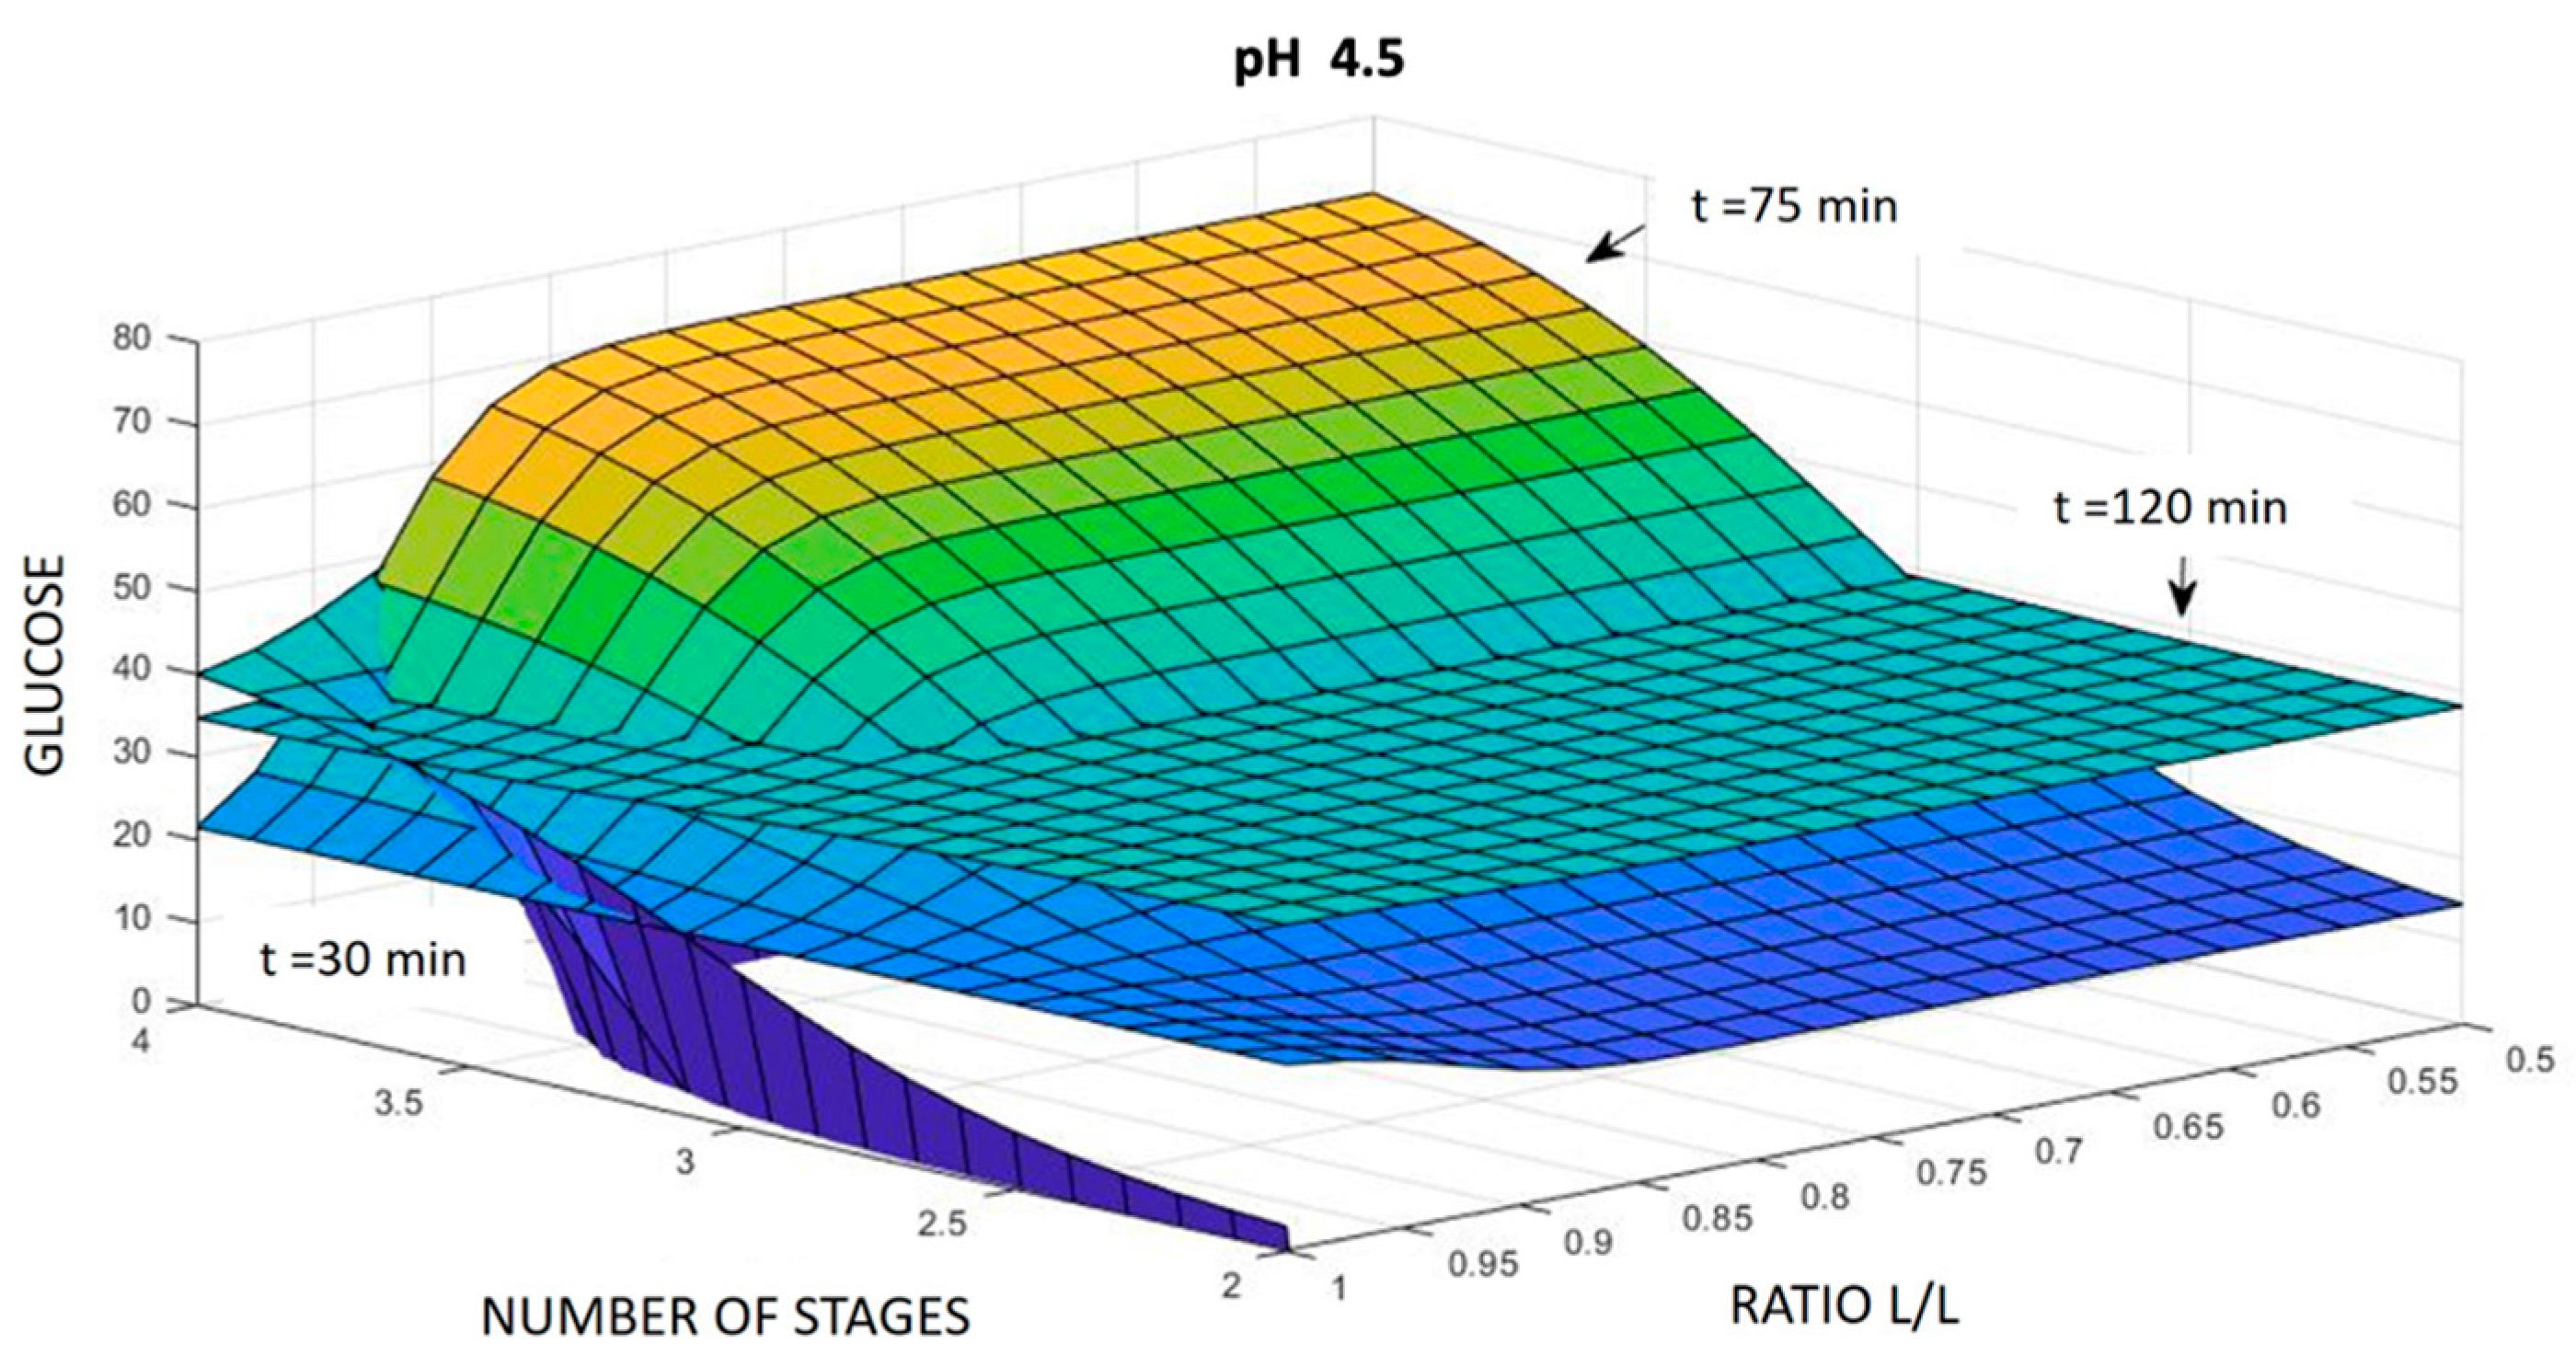
3.3.2. Glucose

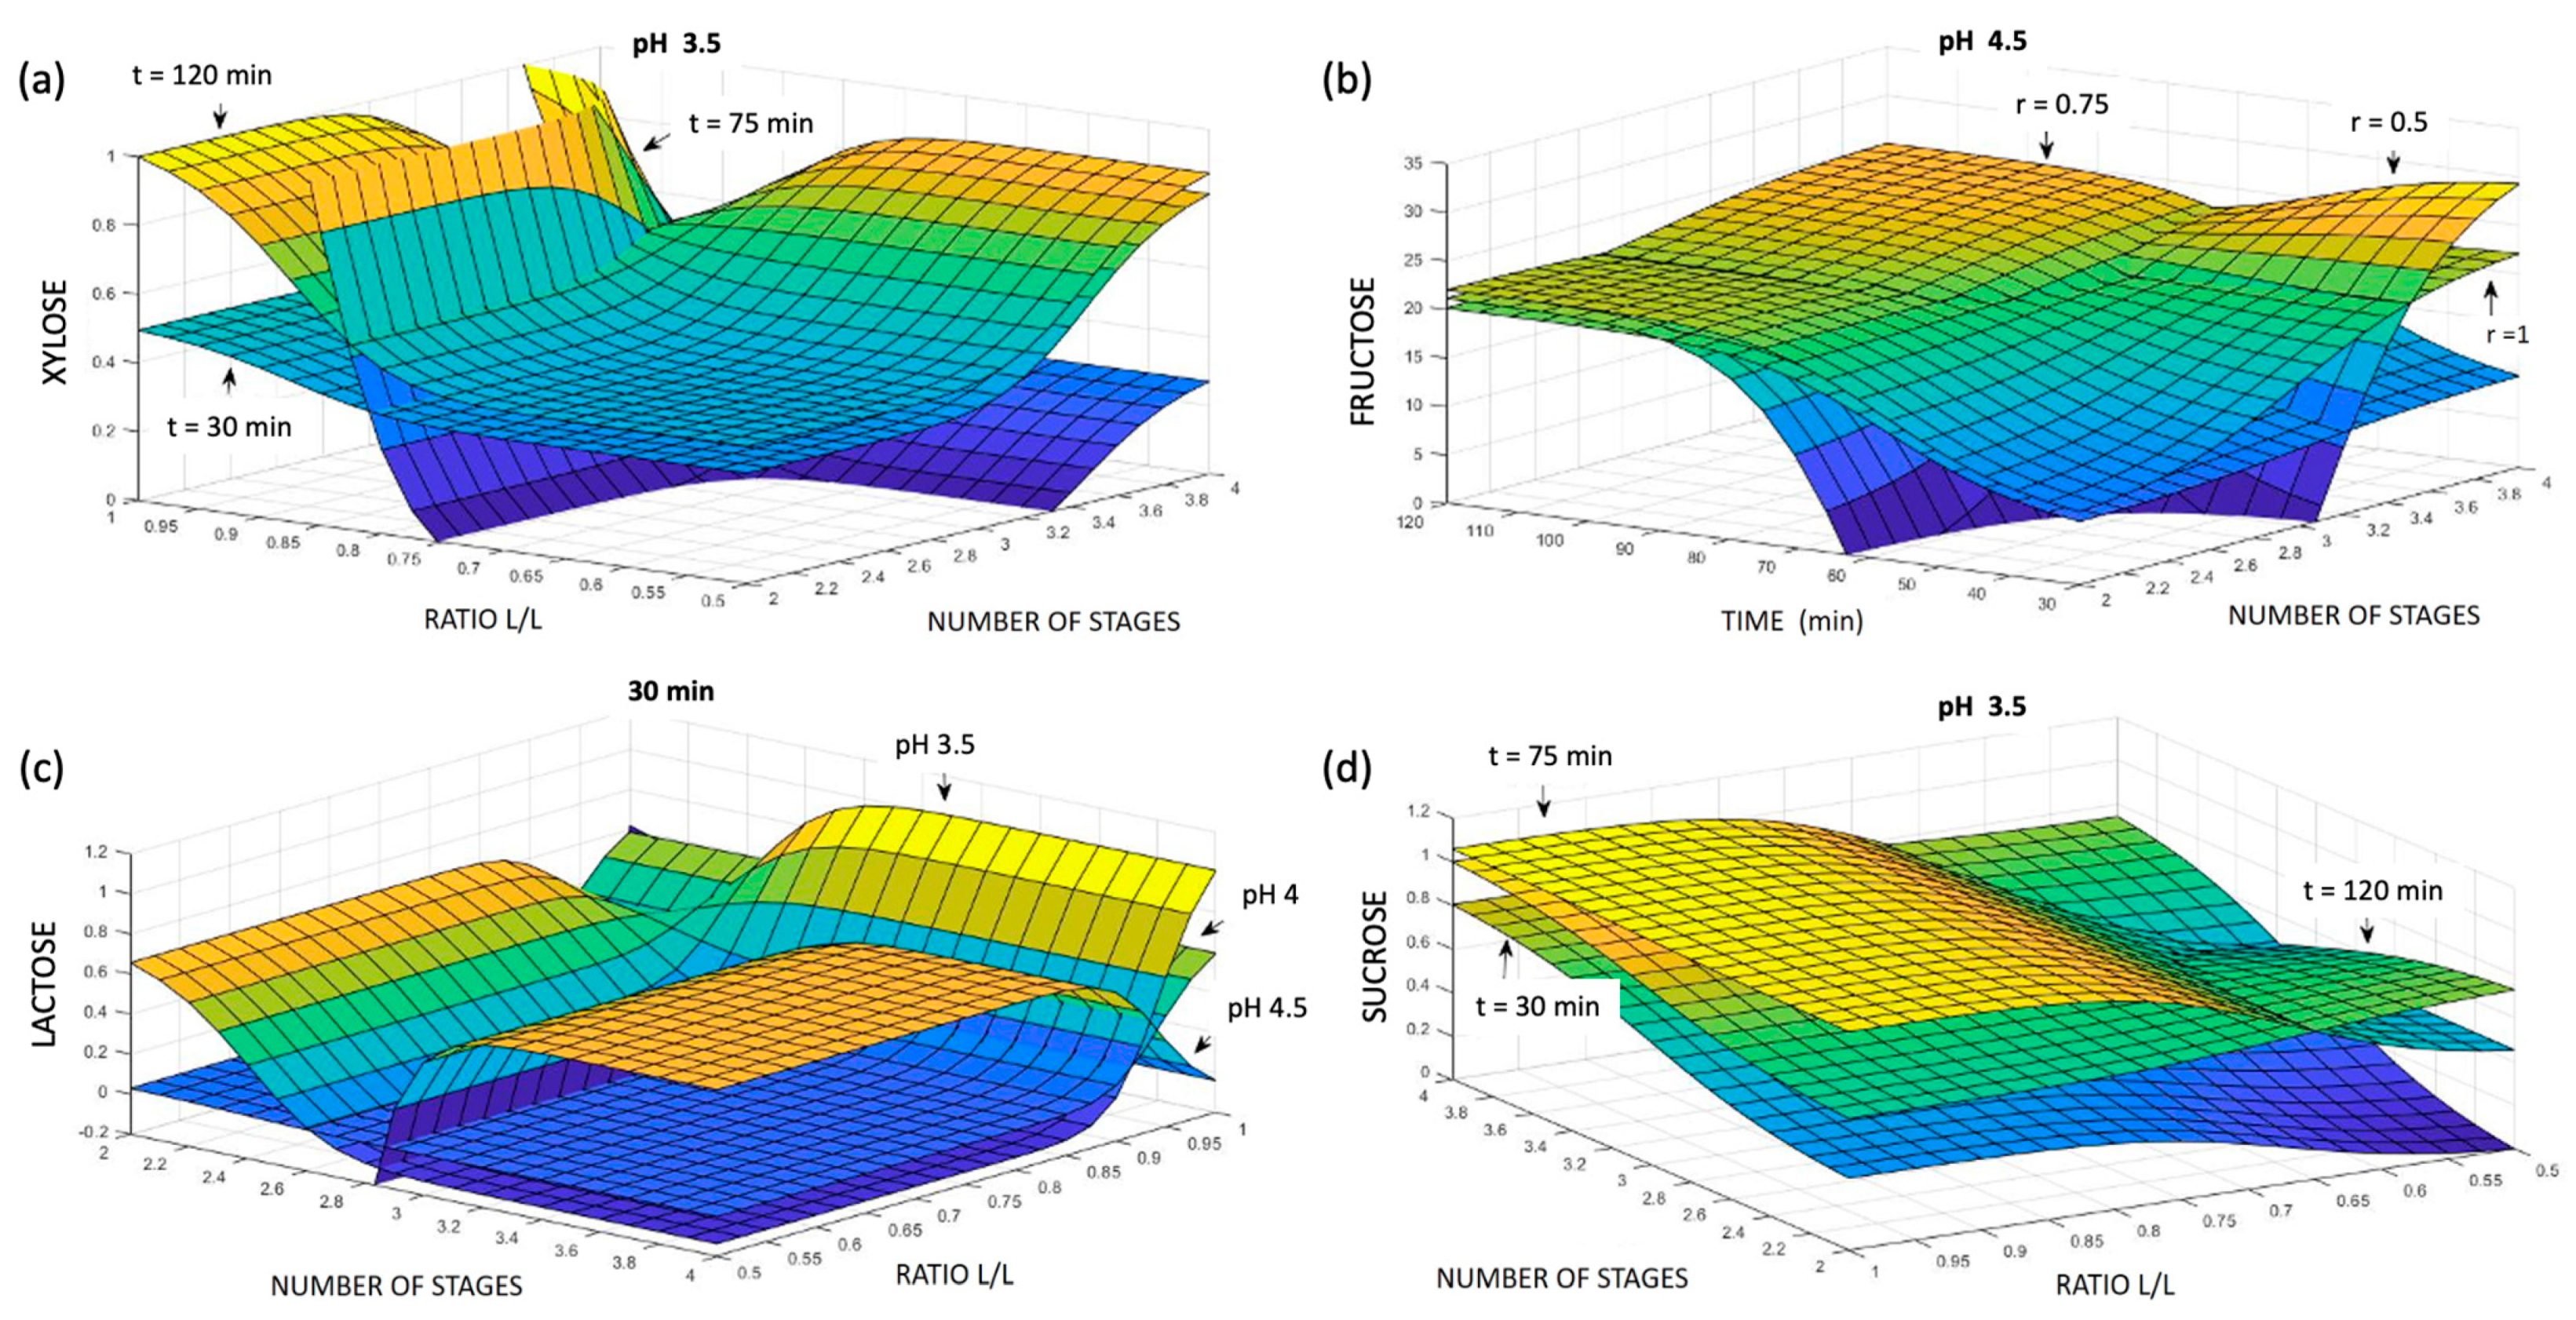
3.3.3. Xylose, Fructose, Lactose, and Sucrose
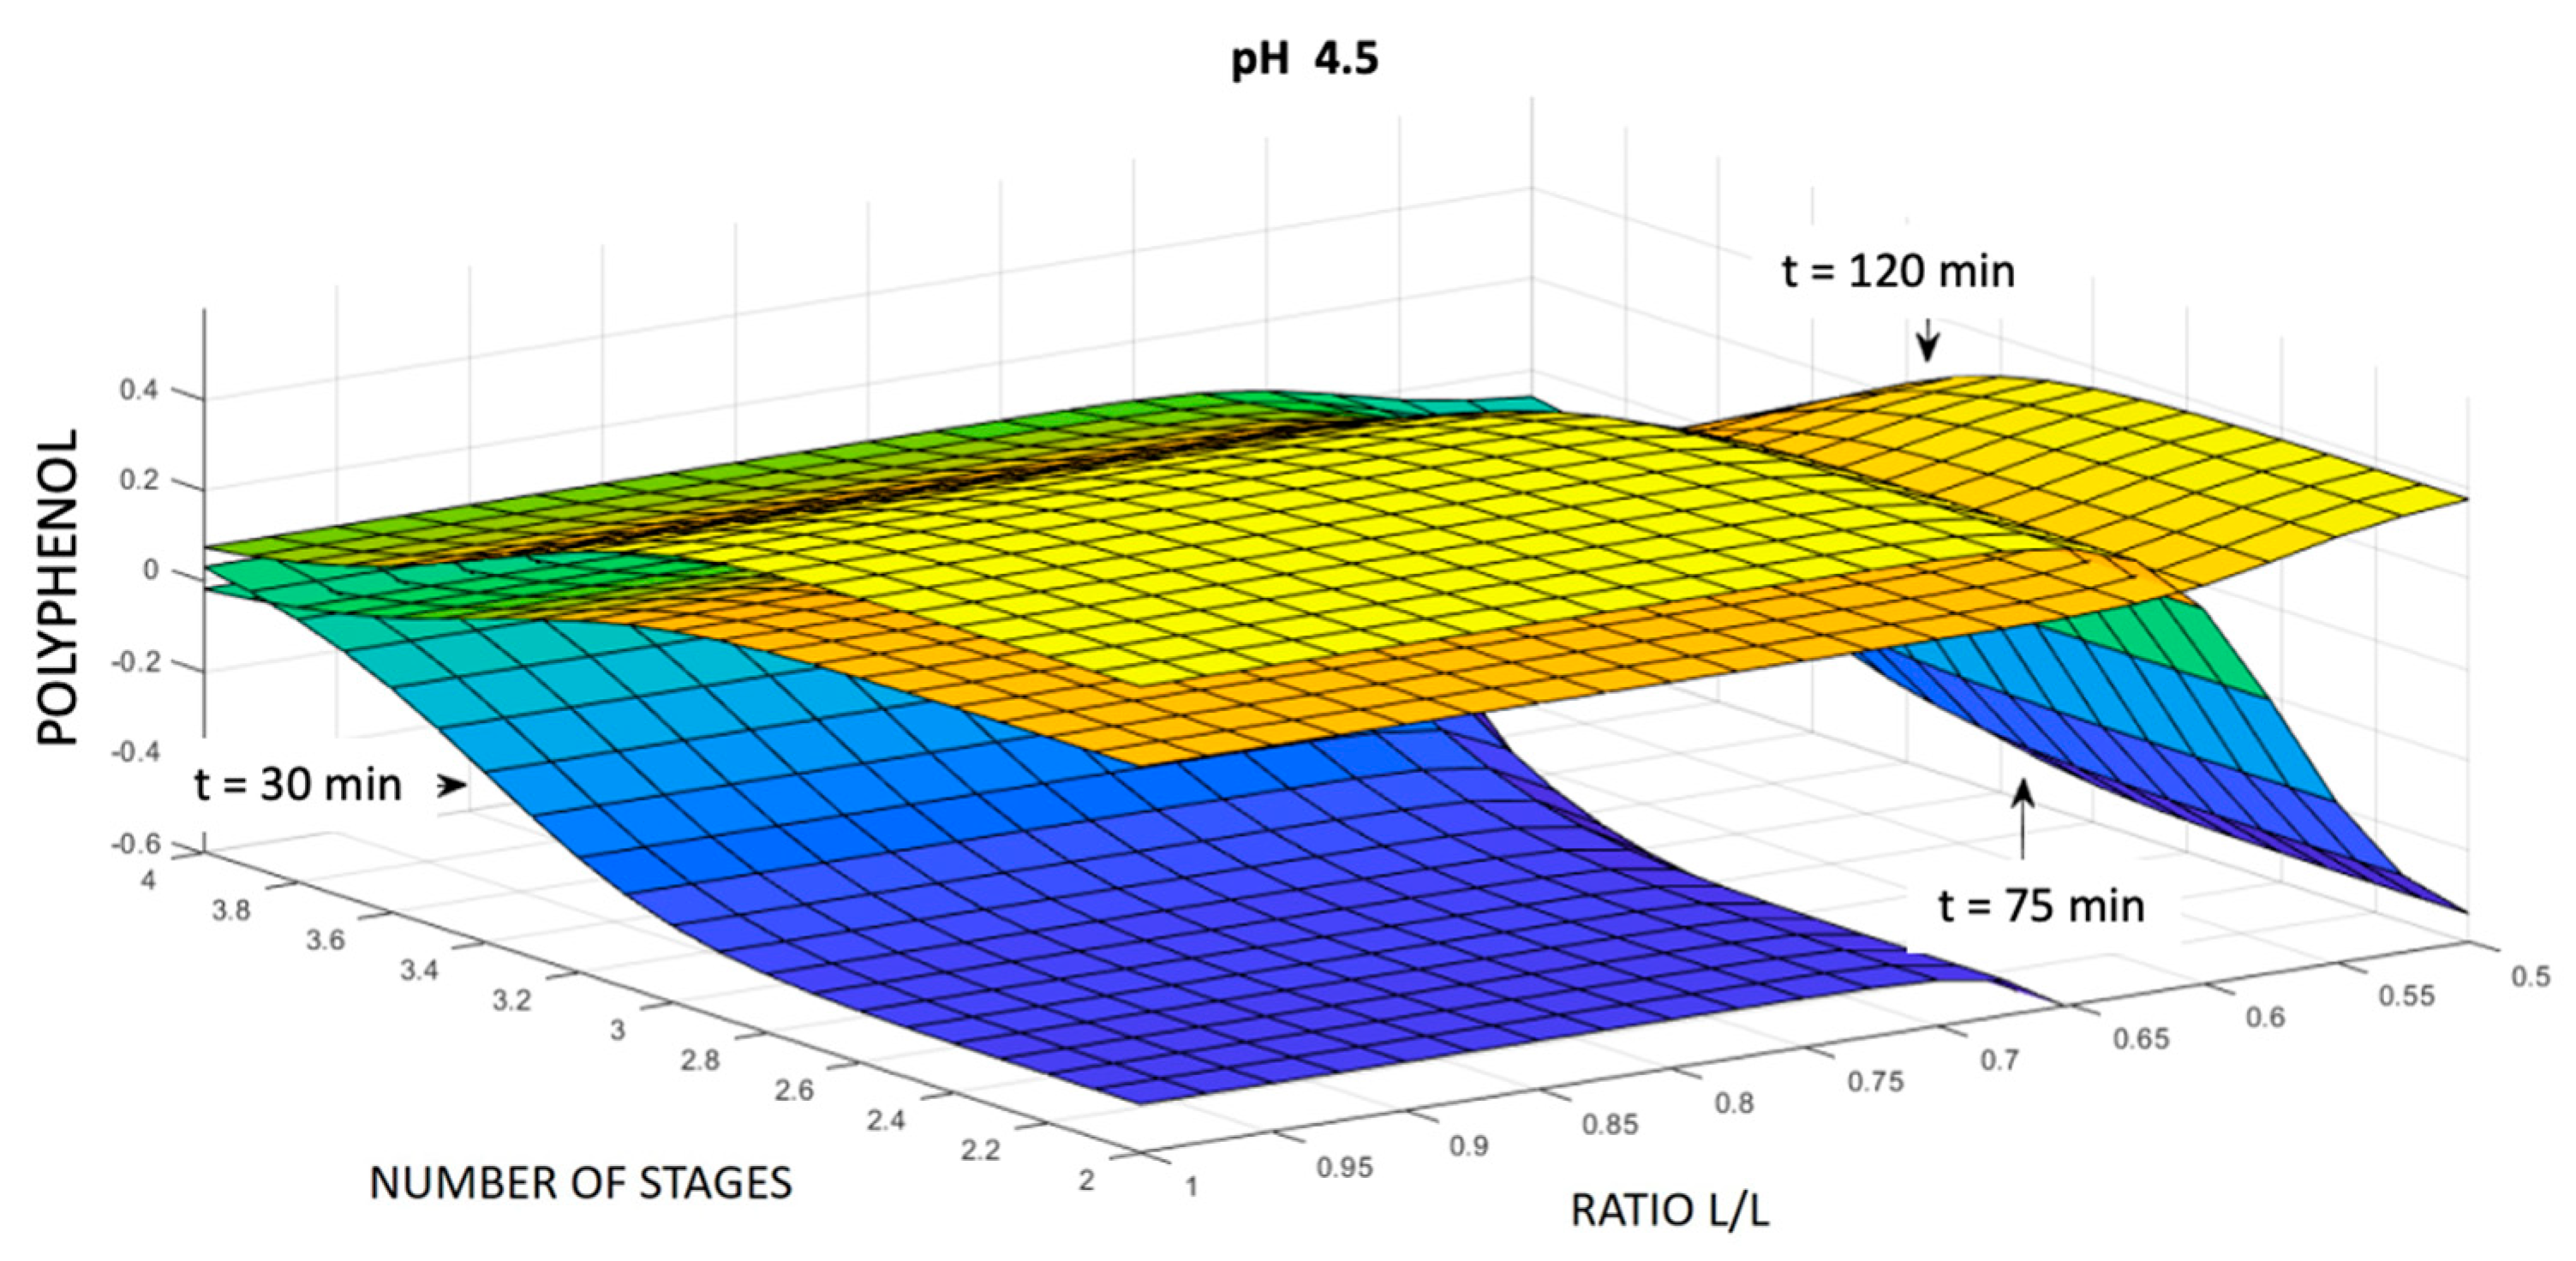
3.3.4. Polyphenols
4. Conclusions
Supplementary Materials
Author Contributions
Funding
Data Availability Statement
Conflicts of Interest
References
- Oliveras-López, M.J.; Berná, G.; Jurado-Ruiz, E.; de la Serrana, H.L.G.; Martín, F. Consumption of extra-virgin olive oil rich in phenolic compounds has beneficial antioxidant effects in healthy human adults. J. Funct. Foods 2014, 10, 475–484. [Google Scholar] [CrossRef]
- Souilem, S.; El-Abbassi, A.; Kiai, H.; Hafidi, A.; Sayadi, S.; Galanakis, M. Olive Oil Production Sector: Environmental Effects and Sustainability Challenges; Galanakis, C., Ed.; Olive Mill Waste; Academic Press: Cambridge, MA, USA, 2017; pp. 1–28. [Google Scholar]
- Melgar, R.; Benitez, E.; Nogales, R. Bioconversion of wastes from olive oil industries by vermicomposting process using the epigeic earthworm Eisenia andrei. J. Environ. Sci. Health Part B 2009, 44, 488–495. [Google Scholar] [CrossRef] [PubMed]
- Jeguirim, M.; Goddard, M.L.; Tamosiunas, A.; Berrich-Betouche, E.; Azzaz, A.A.; Praspaliauskas, M.; Jellali, S. Olive mill wastewater: From a pollutant to green fuels, agricultural water source and bio-fertilizer. Renew. Energy 2020, 149, 716–724. [Google Scholar] [CrossRef]
- Al-Harthi, M.A. The efficacy of using olive cake as a by-product in broiler feeding with or without yeast. Ital. J. Anim. Sci. 2016, 15, 512–520. [Google Scholar] [CrossRef]
- Demirbas, A. Producing bio-oil from olive cake by fast pyrolysis. Energy Sources Part A Recovery Util. Environ. Eff. 2007, 30, 38–44. [Google Scholar] [CrossRef]
- Rajpoot, L.; Tagade, A.; Deshpande, G.; Verma, K.; Geed, S.R.; Patle, D.S.; Sawarkar, A.N. An overview of pyrolysis of de-oiled cakes for the production of biochar, bio-oil, and pyro-gas: Current status, challenges, and future perspective. Bioresour. Technol. Rep. 2022, 19, 101205. [Google Scholar] [CrossRef]
- Ko, K.; Dadmohammadi, Y.; Abbaspourrad, A. Nutritional and Bioactive Components of Pomegranate Waste Used in Food and Cosmetic Applications: A Review. Foods 2021, 10, 657. [Google Scholar] [CrossRef]
- Caballero, B.M.; López-Urionabarrenechea, A.; Pérez, B.; Solar, J.; Acha, E.; de Marco, I. Potentiality of “orujillo” (olive oil solid waste) to produce hydrogen by means of pyrolysis. Int. J. Hydrogen Energy 2020, 45, 20549–20557. [Google Scholar] [CrossRef]
- Gálvez-Pérez, A.; Pérez, A.; Calero, M.; Martín-Lara, M.A.; Blázquez, G. Integral exploitation from olive cake for energy production in a biorefinery scheme. Process Saf. Environ. Prot. 2019, 131, 135–143. [Google Scholar] [CrossRef]
- Lemes, A.C.; Álvares, G.T.; Egea, M.B.; Brandelli, A.; Kalil, S.J. Simultaneous production of proteases and antioxidant compounds from agro-industrial by-products. Bioresour. Technol. 2016, 222, 210–216. [Google Scholar] [CrossRef]
- Pérez, A.; Blázquez, G.; Iáñez Rodríguez, I.; Osegueda, O.; Calero, M. Optimization of the sugar hydrothermal extraction process from olive cake using neuro-fuzzy models. Bioresour. Technol. 2018, 268, 81–90. [Google Scholar] [CrossRef]
- Yoshimitsu, U.; Akira, H.; TSuneki, T. Isolation of 0-methyl-styllo-inositol from mung bean seeds. Carbohydr. Res. 1973, 29, 520–521. [Google Scholar]
- Zuluaga, A.M.; Mena-García, A.; Chito-Trujillo, D.; Rada-Mendoza, M.; Sanz, M.L.; Ruiz-Matute, A.I. Development of a microwave-assisted extraction method for the recovery of bioactive inositols from lettuce (Lactuca sativa) byproducts. Electrophoresis 2020, 41, 1804–1811. [Google Scholar] [CrossRef]
- Nauck, D.; Rudolf, K. Neuro–Fuzzy Systems. In Handbook of Fuzzy Computation; CRC Press: Boca Raton, FL, USA, 2020. [Google Scholar]
- Rubio-Senent, F.; Fernández Bolaños, J.; García-Borrego, A.; Lama Muñoz, A.; Rodríguez Gutiérrez, G. New phenolic compounds hydrothermally extracted from the olive oil by product alperujo and their antioxidative activities. J. Agric. Food Chem. 2012, 60, 1175–1186. [Google Scholar] [CrossRef] [PubMed]
- Rubio-Senent, F.; Fernández Bolaños, J.; García-Borrego, A.; Lama Muñoz, A.; Rodríguez Gutiérrez, G. Chemical characterization and properties of a polymeric phenolic fraction obtained from olive oil waste. Food Res. Int. 2013, 54, 2122–2129. [Google Scholar] [CrossRef]
- Real Decreto 1101/2011, de 22 de Julio, Por el Que se Aprueba la Lista Positiva de los Disolventes de Extracción Que se Pueden Utilizar en la Fabricación de Productos Alimenticios y de Sus Ingredientes. Available online: https://www.boe.es/buscar/pdf/2011/BOE-A-2011-14223-consolidado.pdf (accessed on 1 October 2023).
- Folin, O.; Ciocalteu, V. On tyrosine and tryptophane determinations in proteins. J. Biol. Chem. 1927, 73, 627–650. [Google Scholar] [CrossRef]
- Montgomery, D.C. Diseño y Análisis de Experimentos, 2nd ed.; Wiley: México, 2004. [Google Scholar]
- Rubio-Senent, F.; Fernández Bolaños, J.; García Borrego, A.; Lama Muñoz, A.; Rodríguez Gutiérrez, G. Influence of pH on the antioxidant phenols solubilised from hydrothermally treated olive oil by-product (alperujo). Food Chem. 2017, 219, 339–345. [Google Scholar] [CrossRef] [PubMed]
- de Campos Souza, P.V. Fuzzy neural networks and neuro-fuzzy networks: A review the main techniques and applications used in the literature. Appl. Soft Comput. 2020, 92, 106275. [Google Scholar] [CrossRef]
- Ruiz-Aceituno, L.; Rodríguez-Sánchez, S.; Sanz, J.; Sanz, M.L.; Ramos, L. Optimization of pressurized liquid extraction of inositols from pine nuts (Pinus pinea L.). Food Chem. 2014, 153, 450–456. [Google Scholar] [CrossRef] [PubMed]
- López, F.; García, J.C.; Pérez, A.; Feria, M.J.; Zamudio, M.A.M.; Gil, G. Chemical and energetic characterization of species with a high-biomass production: Fractionation of their components. Environ. Prog. Sustain. 2010, 29, 499–509. [Google Scholar]
- Casas-Godoy, L.; Campos-Valdez, A.R.; Alcázar-Valle, M.; Barrera-Martínez, I. Comparison of Extraction Techniques for the Recovery of Sugars, Antioxidant and Antimicrobial Compounds from Agro-Industrial Wastes. Sustainability 2022, 14, 5956. [Google Scholar] [CrossRef]
- Zoubiri, F.Z.; Rihani, R.; Bentahar, F. Golden section algorithm to optimise the chemical pretreatment of agro-industrial waste for sugars extraction. Fuel 2020, 266, 117028. [Google Scholar] [CrossRef]
- Gagić, T.; Perva-Uzunalić, A.; Knez, Ž.; Škerget, M. Hydrothermal treatment of sugars to obtain high-value products. J. Serbian Chem. Soc. 2020, 85, 97–109. [Google Scholar] [CrossRef]


| Time (t) | S/E Ratio (r) | No. Stages (e) | pH (p) | Code |
|---|---|---|---|---|
| 30 min | 100/100 | 2 | 3.5 | −1 |
| 75 min | 75/100 | 3 | 4 | 0 |
| 120 min | 50/100 | 4 | 4.5 | +1 |
| Exp. | Time min | S/E Ratio | Number Stages | pH | Exp. | Time min | S/E Ratio | Number Stages | pH |
|---|---|---|---|---|---|---|---|---|---|
| 1 | 30 | 100/100 | 2 | 4.5 | 15 | 75 | 75/100 | 4 | 4 |
| 2 | 30 | 100/100 | 2 | 3.5 | 16 | 75 | 75/100 | 2 | 4 |
| 3 | 30 | 75/100 | 3 | 4 | 17 * | 75 | 75/100 | 3 | 4 |
| 4 | 30 | 50/100 | 4 | 4.5 | 18 | 120 | 50/100 | 4 | 4.5 |
| 5 | 30 | 50/100 | 4 | 3.5 | 19 | 120 | 50/100 | 4 | 3.5 |
| 6 | 30 | 100/100 | 4 | 3.5 | 20 | 120 | 75/100 | 3 | 4 |
| 7 | 30 | 100/100 | 4 | 4.5 | 21 | 120 | 50/100 | 2 | 4.5 |
| 8 | 30 | 50/100 | 2 | 4 | 22 | 120 | 50/100 | 2 | 3.5 |
| 9 | 30 | 50/100 | 2 | 3.5 | 23 | 120 | 100/100 | 4 | 3.5 |
| 10 * | 75 | 75/100 | 3 | 4 | 24 | 120 | 100/100 | 4 | 4.5 |
| 11 | 75 | 75/100 | 3 | 4.5 | 25 | 120 | 100/100 | 2 | 4.5 |
| 12 | 75 | 75/100 | 3 | 3.5 | 26 | 120 | 100/100 | 2 | 3.5 |
| 13 | 75 | 50/100 | 3 | 4 | 27 * | 75 | 75/100 | 3 | 4 |
| 14 | 75 | 100/100 | 3 | 4 |
| Compound | Retention Times (min) |
|---|---|
| Inositol | 5.242 |
| Glucose | 16.284 |
| Xylose | 17.183 |
| Fructose | 19.381 |
| Lactose | 27.923 |
| Sucrose | 33.357 |
| Temperature °C | Time min | Inositol mg/L | Glucose mg/L | Xylose mg/L | Fructose mg/L | Sucrose mg/L |
|---|---|---|---|---|---|---|
| 20 | 30 | 645.6 | 257.9 | 51.7 | 182.5 | 162.2 |
| 25 | 30 | 657.1 | 218.3 | 43.1 | 188.1 | 186.1 |
| 30 | 30 | 661.8 | 228.3 | - | 185.6 | 168.7 |
| 20 | 60 | 627.7 | 208.7 | - | 298.3 | 220.1 |
| 25 | 60 | 661.1 | 218.3 | - | 310.7 | 215.9 |
| 30 | 60 | 655.2 | 213.1 | - | 297.9 | 203.5 |
| Solvent | S/E Ratio | Absorbance | Phenol Concentration mg/L |
|---|---|---|---|
| None | 0.681 | 4792 | |
| Ethyl acetate | 100/100 | 0.25 | 1713 |
| Ethyl acetate | 100/50 | 0.444 | 3099 |
| Ethyl acetate | 100/33.3 | 0.468 | 3270 |
| Dichloromethane | 100/100 | 0.332 | 2299 |
| Dichloromethane | 100/50 | 0.636 | 4470 |
| Dichloromethane | 100/33.3 | 0.66 | 4642 |
| Hexane | 100/100 | 0.351 | 2435 |
| Hexane | 100/50 | 0.662 | 4656 |
| Hexane | 100/33.3 | 0.695 | 4892 |
| Exp. | S/E Ratio | Stage | Time h | pH | Absorbance | [Phenol] mg/L |
|---|---|---|---|---|---|---|
| 1 | 100/100 | 1 | 1 | 5.18 | 0.417 | 2906 |
| 2 | 1 | 5.19 | 0.404 | 2813 | ||
| 3 | 1 | 5.35 | 0.381 | 2649 | ||
| 2 | 100/33.3 | 1 | 1 | 5.37 | 0.42 | 2927 |
| 2 | 1 | 5.54 | 0.422 | 2942 | ||
| 3 | 1 | 5.73 | 0.473 | 3306 | ||
| 3 | 100/100 | 1 | 3 | 5.07 | 0.501 | 3506 |
| 2 | 3 | 5.15 | 0.419 | 2920 | ||
| 3 | 3 | 5.28 | 0.44 | 3070 | ||
| 4 | 100/33.3 | 1 | 3 | 5.3 | 0.425 | 2963 |
| 2 | 3 | 5.48 | 0.443 | 3092 |
| Exp. | Experimental mg/L | Relative Value | Estimation ANFIS | % Error | Exp. | Experimental mg/L | Relative Value | Estimation ANFIS | % Error |
|---|---|---|---|---|---|---|---|---|---|
| 1 | 641 | −0.03 | −0.03 | 1.14 | 15 | 719 | 0.09 | 0.09 | 0.92 |
| 2 | 561 | −0.15 | −0.15 | 0.54 | 16 | 524 | −0.21 | −0.21 | 0.29 |
| 3 | 823 | 0.24 | 0.25 | 1.81 | 18 | 698 | 0.05 | 0.06 | 15.01 |
| 4 | 916 | 0.38 | 0.38 | 0.54 | 19 | 671 | 0.01 | 0.01 | 5.64 |
| 5 | 618 | −0.07 | −0.07 | 0.52 | 20 | 703 | 0.06 | 0.04 | 31.82 |
| 6 | 962 | 0.45 | 0.45 | 0.19 | 21 | 685 | 0.03 | 0.04 | 16.32 |
| 7 | 690 | 0.04 | 0.04 | 1.80 | 22 | 630 | −0.05 | −0.05 | 3.31 |
| 8 | 794 | 0.20 | 0.20 | 1.08 | 23 | 754 | 0.14 | 0.14 | 0.02 |
| 9 | 823 | 0.24 | 0.24 | 0.02 | 24 | 644 | −0.03 | −0.03 | 2.78 |
| 11 | 652 | −0.02 | −0.02 | 0.24 | 25 | 700 | 0.06 | 0.06 | 0.37 |
| 12 | 588 | −0.11 | −0.11 | 0.43 | 26 | 694 | 0.05 | 0.05 | 0.49 |
| 13 | 608 | −0.08 | −0.08 | 0.23 | 10 * 17 * 27 * | 637.49 | −0.04 | −0.03 | 8.40 |
| Constants | Variables | Value L | Molecule | ||||||
| a1 | 0.314 | a13 | 0.051 | t (min) | 30 | 19.1097 |  | ||
| a2 | 0.205 | a14 | 0.512 | 75 | 19.1097 | ||||
| a3 | −0.132 | a15 | 0.167 | 120 | 19.1097 | ||||
| a4 | 0.407 | a16 | 0.848 | r | 0.5 | 0.2298 | |||
| a5 | −0.326 | a17 | −0.059 | 1 | 0.1261 | ||||
| a6 | −0.104 | a18 | 0.063 | e | 2 | 0.7648 | |||
| a7 | 0.641 | a19 | 0.022 | 4 | 0.8928 | ||||
| a8 | −0.055 | a20 | 0.063 | p | 3.5 | 0.2778 | |||
| a9 | −0.150 | a21 | 0.049 | 4.5 | 0.4594 | ||||
| a10 | −0.366 | a22 | 0.042 | Coefficient of determination R2 | |||||
| a11 | −0.172 | a23 | 0.184 | 0.999 | |||||
| a12 | 0.061 | a24 | −0.096 | ||||||
| Exp. | Glucose mg/L | Relative Value | Estimation ANFIS | % Error | Exp. | Glucose mg/L | Relative Value | Estimation ANFIS | % Error |
|---|---|---|---|---|---|---|---|---|---|
| 1 | 755 | 2.31 | 3.04 | 31.59 | 15 | 10,029 | 42.93 | 42.93 | 0.01 |
| 2 | 672 | 1.94 | 1.88 | 3.20 | 16 | 6679 | 28.26 | 28.24 | 0.06 |
| 3 | 1031 | 3.52 | 3.48 | 1.14 | 18 | 9376 | 40.07 | 40.03 | 0.09 |
| 4 | 12,798 | 55.06 | 55.42 | 0.67 | 19 | 7720 | 32.81 | 32.50 | 0.94 |
| 5 | 8582 | 36.59 | 36.58 | 0.04 | 20 | 7901 | 33.61 | 34.43 | 2.45 |
| 6 | 13,078 | 56.28 | 56.34 | 0.09 | 21 | 8983 | 38.35 | 38.29 | 0.13 |
| 7 | 9351 | 39.96 | 39.95 | 0.01 | 22 | 8284 | 35.28 | 34.86 | 1.21 |
| 9 | 11,368 | 48.79 | 48.79 | 0.01 | 23 | 9692 | 41.45 | 41.47 | 0.03 |
| 11 | 8900 | 37.98 | 37.98 | 0.01 | 24 | 8144 | 34.67 | 34.66 | 0.04 |
| 12 | 8040 | 34.21 | 33.97 | 0.71 | 25 | 9228 | 39.42 | 39.42 | 0.01 |
| 13 | 8316 | 35.43 | 34.41 | 2.88 | 26 | 8353 | 35.59 | 35.58 | 0.00 |
| 14 | 8954 | 38.22 | 38.22 | 0.00 | 10 * 17 * 27 * | 7779 | 33.08 | 34.41 | 4.03 |
| Constants | Variables | Value L | Molecule | ||||||
| a1 | 50.548 | a13 | 46.5 | t (min) | 30 | 19.1097 |  | ||
| a2 | −735.60 | a14 | 14.997 | 75 | 19.1094 | ||||
| a3 | 35.061 | a15 | 36.887 | 120 | 19.1097 | ||||
| a4 | 127.85 | a16 | 7.227 | r | 0.5 | 0.2221 | |||
| a5 | −10.921 | a17 | 35.357 | 1 | 0.0737 | ||||
| a6 | 119.23 | a18 | 37.515 | e | 2 | 0.888 | |||
| a7 | 67.376 | a19 | 31.718 | 4 | 0.7697 | ||||
| a8 | 29.409 | a20 | 38.647 | p | 3.5 | 0.4412 | |||
| a9 | 27.995 | a21 | 34.806 | 4.5 | 0.2602 | ||||
| a10 | 56.012 | a22 | 41.797 | Coefficient of determination R2 | |||||
| a11 | 41.325 | a23 | 43.996 | 0.999 | |||||
| a12 | 79.067 | a24 | 33.736 | ||||||
Disclaimer/Publisher’s Note: The statements, opinions and data contained in all publications are solely those of the individual author(s) and contributor(s) and not of MDPI and/or the editor(s). MDPI and/or the editor(s) disclaim responsibility for any injury to people or property resulting from any ideas, methods, instructions or products referred to in the content. |
© 2024 by the authors. Licensee MDPI, Basel, Switzerland. This article is an open access article distributed under the terms and conditions of the Creative Commons Attribution (CC BY) license (https://creativecommons.org/licenses/by/4.0/).
Share and Cite
Lozano, E.J.; Blázquez, G.; Calero, M.; Martín-Lara, M.Á.; Pérez-Huertas, S.; Pérez, A. Optimizing the Extraction Process of Value-Added Products from Olive Cake Using Neuro-Fuzzy Models. Processes 2024, 12, 317. https://0-doi-org.brum.beds.ac.uk/10.3390/pr12020317
Lozano EJ, Blázquez G, Calero M, Martín-Lara MÁ, Pérez-Huertas S, Pérez A. Optimizing the Extraction Process of Value-Added Products from Olive Cake Using Neuro-Fuzzy Models. Processes. 2024; 12(2):317. https://0-doi-org.brum.beds.ac.uk/10.3390/pr12020317
Chicago/Turabian StyleLozano, Emilio J., Gabriel Blázquez, Mónica Calero, María Ángeles Martín-Lara, Salvador Pérez-Huertas, and Antonio Pérez. 2024. "Optimizing the Extraction Process of Value-Added Products from Olive Cake Using Neuro-Fuzzy Models" Processes 12, no. 2: 317. https://0-doi-org.brum.beds.ac.uk/10.3390/pr12020317