Energy Analysis of the S-CO2 Brayton Cycle with Improved Heat Regeneration


Mechanical Engineering Department, King Abdulaziz University, Jeddah 21589, Saudi Arabia
*
Author to whom correspondence should be addressed.
Processes 2019, 7(1), 3; https://0-doi-org.brum.beds.ac.uk/10.3390/pr7010003
Submission received: 28 November 2018
/
Revised: 11 December 2018
/
Accepted: 17 December 2018
/
Published: 20 December 2018
(This article belongs to the Special Issue Advances in Supercritical Fluid Extraction)
Abstract
:Supercritical carbon dioxide (S-CO2) Brayton cycles (BC) are promising alternatives for power generation. Many variants of S-CO2 BC have already been studied to make this technology economically more viable and efficient. In comparison to other BC and Rankine cycles, S-CO2 BC is less complex and more compact, which may reduce the overall plant size, maintenance, and the cost of operation and installation. In this paper, we consider one of the configurations of S-CO2 BC called the recompression Brayton cycle with partial cooling (RBC-PC) to which some modifications are suggested with an aim to improve the overall cycle’s thermal efficiency. The type of heat source is not considered in this study; thus, any heat source may be considered that is capable of supplying temperature to the S-CO2 in the range from 500 °C to 850 °C, like solar heaters, or nuclear and gas turbine waste heat. The commercial software Aspen HYSYS V9 (Aspen Technology, Inc., Bedford, MA, USA) is used for simulations. RBC-PC serves as a base cycle in this study; thus, the simulation results for RBC-PC are compared with the already published data in the literature. Energy analysis is done for both layouts and an efficiency comparison is made for a range of turbine operating temperatures (from 500 °C to 850 °C). The heat exchanger effectiveness and its influence on both layouts are also discussed.
1. Introduction
Rapid technological advancements and increasing industry all around the world have significantly increased the demand of energy. On the other side, fossil reserves are depleting rapidly, resulting in global warming and issues relating to environmental pollution. Because of this, the development of more efficient power cycles needs attention. One step towards efficiency improvement may be the utilization of industrial waste heat [1]. The supercritical carbon dioxide (S-CO2) Brayton cycle (BC) has been extensively studied in the last decade and is considered promising for exploiting low- to medium-grade heat for power generation [2]. No commercial S-CO2 power plant has yet been installed; however, some pilot small-scale units are currently present [3,4,5].
Carbon dioxide as a working fluid is non-toxic, stable, and non-combustible [2]. A power block utilizing S-CO2 has many benefits due to its compactness, low maintenance and running costs, and structural simplicity [6,7]. Another advantage which makes the utilization of CO2 worthy in supercritical BC is the rapid change in its thermo-physical properties near its critical point. The density of CO2 near its critical point is similar to that of its liquid form and reduces the compressor work significantly. Secondly, S-CO2 is almost twofold as dense as steam, resulting in a power block with high power density in comparison to the steam Rankine cycle (RC). Aside from certain benefits, RC has many disadvantages over S-CO2, like poor thermal efficiency due to phase change and huge plant size.
Feher [8] and Angelino [9] proposed the supercritical carbon dioxide cycle in the 1960s. They achieved a cycle thermal efficiency of close to 55% under ideal conditions. However, this cycle came back into the limelight in 2004 after the refined version was proposed by Dostal [10] with its application to next-generation nuclear reactors. Since then, different configurations for the S-CO2 Brayton cycle have been reported in the literature, including the simple cycle, the pre-compression cycle, the re-compression cycle with a partial cooling cycle, the intercooling cycle, and the split expansion cycle [11,12].
The integration of various types of heat sources into S-CO2 BC has been studied in the last decade. Sarkar [13] performed an energy and exergy analysis of the S-CO2 recompression Brayton cycle (RBC) utilizing nuclear waste heat and performed a sensitivity analysis. He concluded that the irreversibilities of heat exchangers are considerably greater in comparison to those of turbo-machineries. Sarkar and Bhattacharyya [14] performed an exergy analysis for the RBC and optimized its performance. They found that the differences in specific heat capacities at the compressor outlet and the turbine outlet play an important role in the optimization of the cycle’s pressure ratio and intermediate pressure. Ahn et al. [15] investigated various configurations of the S-CO2 BC for application to nuclear reactors and identified an RBC layout more efficient for a mild turbine inlet temperature range (450 °C to 600 °C).
The integration of concentrating solar power (CSP) with S-CO2 Brayton cycles has also been investigated. Turchi [16] studied an S-CO2 RBC integrated with CSP and found that it could offer efficiencies higher than those of supercritical or superheated steam Rankine cycles. Padilla [17] performed an energy and exergy analysis of eight different configurations of S-CO2 with the heat source being a solar receiver. He concluded that the recompression Brayton cycle with main compressor intercooling has the best thermal and exergetic performance. This was achieved by introducing an intercooling stage in the main compressor, which is claimed to decrease the compressor work and, eventually, the net power output of the cycle. The literature also reports the utilization of cold energy of liquefied natural gas (LNG) as a heat sink in proposing new configurations for the CO2 power cycle with an ultimate goal of improving the thermodynamic performance of the cycle [18,19,20,21].
The literature reports numerous thermodynamic analyses carried out for S-CO2 power cycles utilizing either waste heat, nuclear, or CSP systems. Various configurations have been proposed to achieve the maximum possible thermal efficiencies. In this paper, we propose modifications to the standard recompression Brayton cycle with partial cooling (RBC-PC) which target maximum recovery of heat from within the cycle to minimize external heat input, thus maximizing the overall cycle’s thermal efficiency. No specific type of heat input to the cycle is considered; thus, the proposed configuration may be integrated with any suitable heat source working within the range of the turbine inlet temperature of interest. The effect of heat exchanger effectiveness on the cycle’s performance is also examined for both configurations.
2. Cycle Configurations
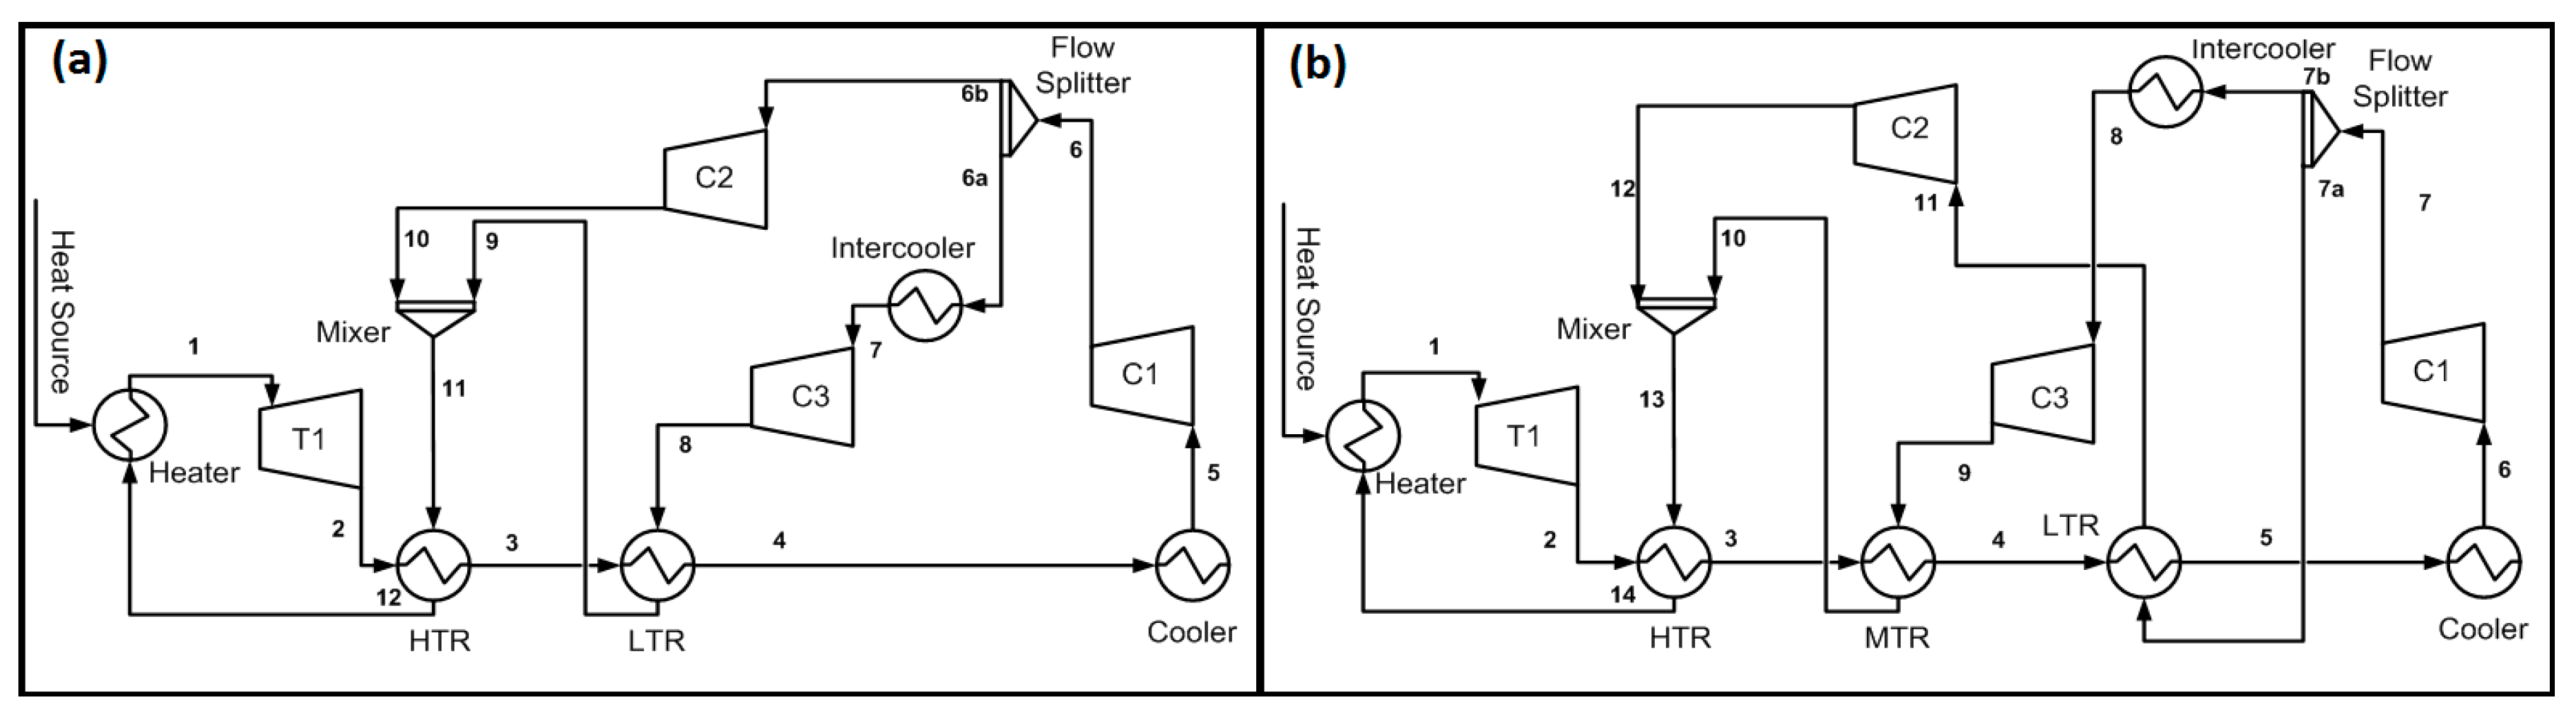
In this paper, we investigate two variants of S-CO2 Brayton cycles. One is the recompression Brayton cycle with partial cooling (RBC-PC), and the second is the modified version of RBC-PC with improved heat regeneration (RBC-PC-IHR). Many researchers have already studied the RBC-PC [11,16,17]; thus, it can serve as a basis for comparison of the proposed layout performance. Figure 1 presents the configurations of both cycles.
Figure 1a presents the layout of the RBC with partial cooling. In this configuration, the stream leaving low-temperature recuperator (State 4), denoted by LTR, is cooled and compressed (State 6) to the intermediate pressure of the cycle using main compressor C1. The stream is then divided into two; one is cooled and compressed to the high pressure of the cycle (State 8) which later recovers heat in LTR, whereas the second stream is compressed to the high pressure of the cycle (State 10) and mixed with the first stream leaving LTR (State 9). The mixed stream (State 11) recovers heat in high-temperature recuperator (HTR) and then flows to the heat source, where it is heated to the cycle’s high temperature. The high-temperature and high-pressure stream (State 1) is expanded in the expander (T1).
Figure 1b presents the proposed configuration (RBC-PC-IHR); it is very similar to the RBC-PC but with a third heat recuperator for improved heat regeneration. In this configuration, the stream leaving the LTR (State 5) is cooled (State 6) and compressed (State 7) to the intermediate pressure of the cycle. The stream is then divided into two; one stream (stream 7b) is cooled and compressed to the cycle’s high pressure, then flows to a medium-temperature recuperator (MTR) to recover the heat, whereas the other stream (stream 7a) receives heat in LTR before it is compressed to the high pressure of the cycle in C2. The streams leaving the compressor C2 and MTR are mixed and flow to HTR to recover heat before heating in the Heater.
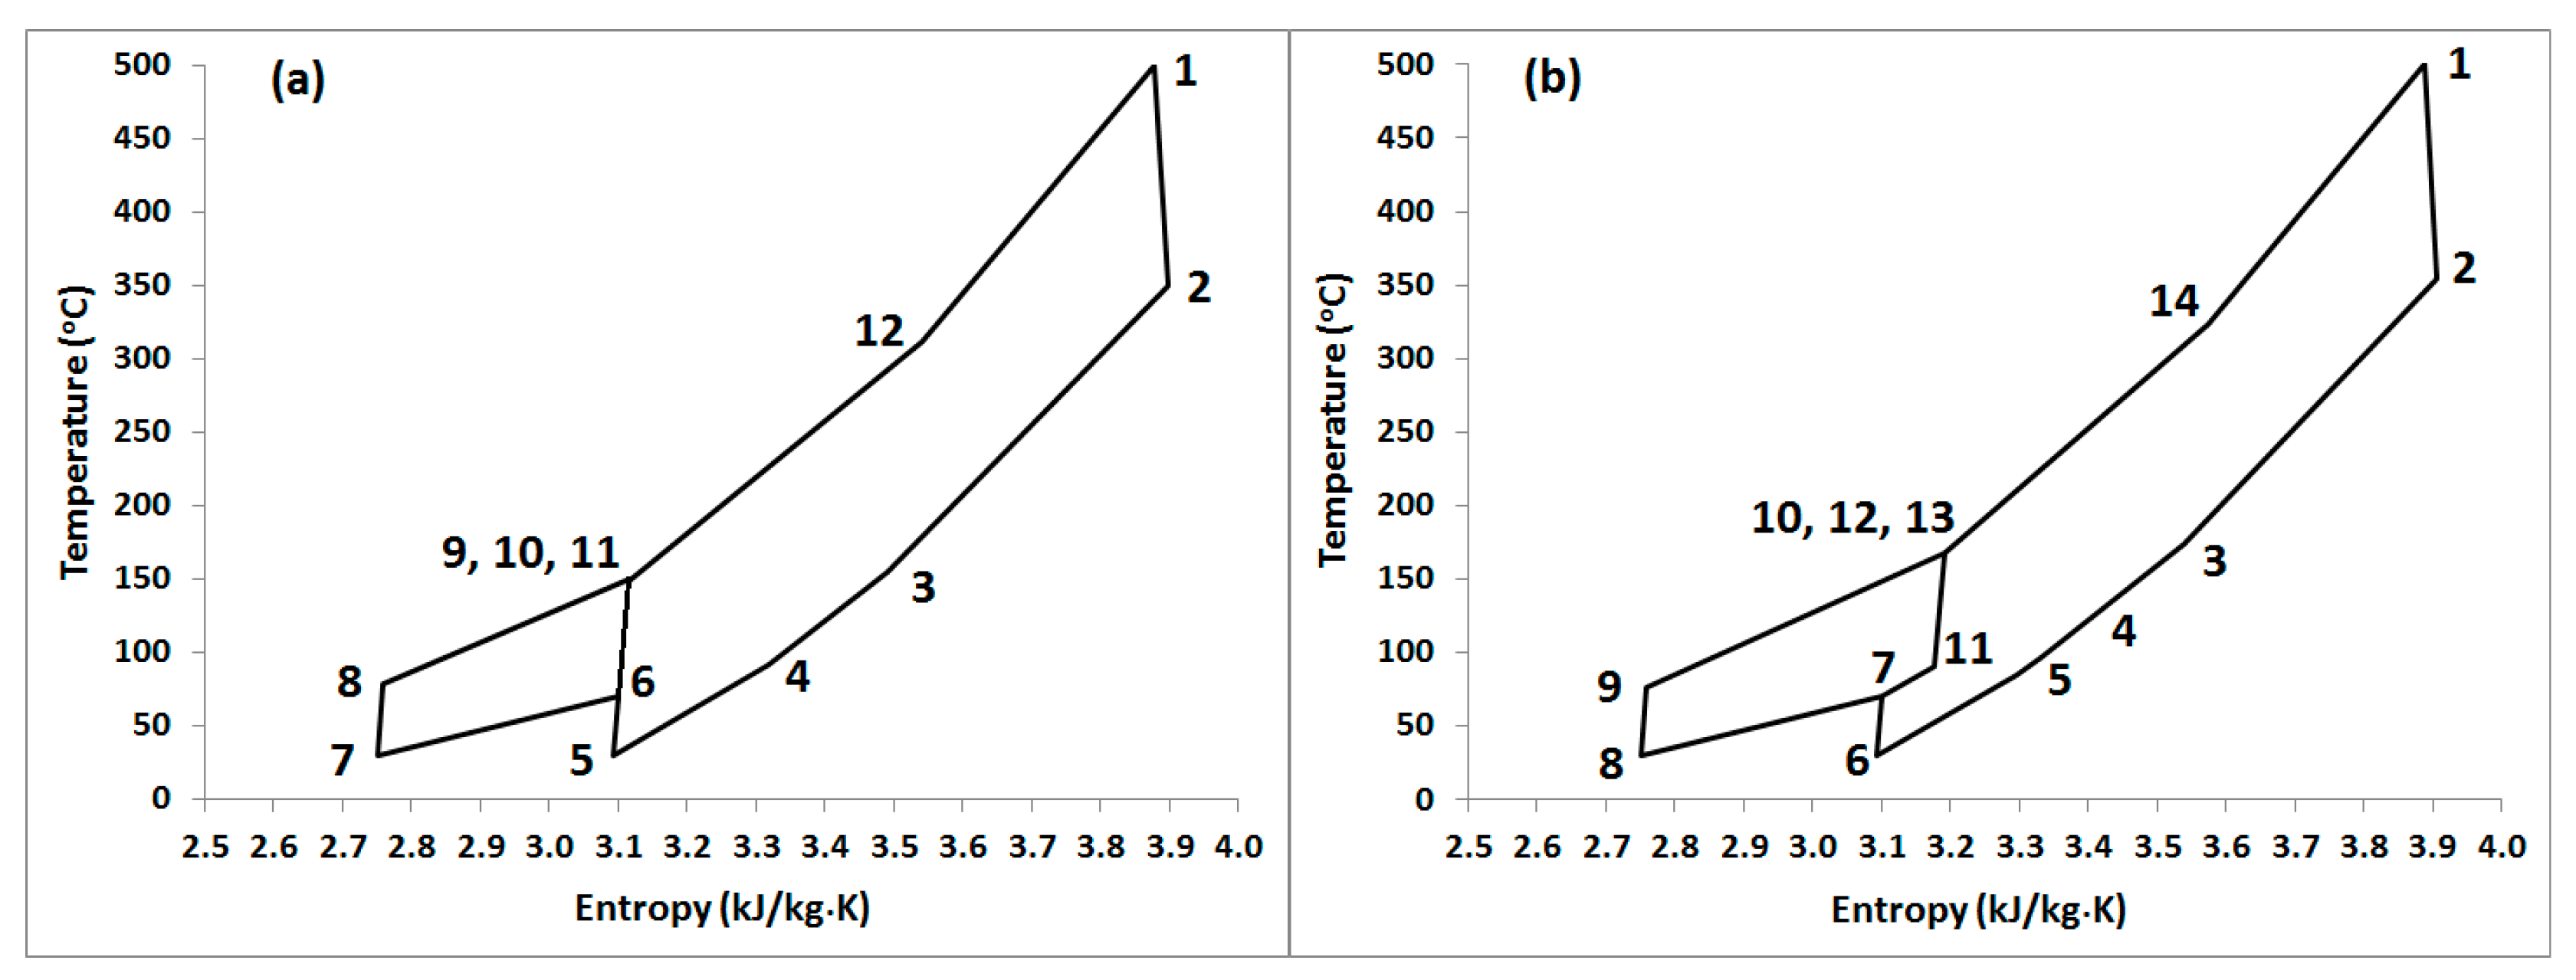
Figure 2a,b display the temperature–entropy plots for the RBC-PC and RPC-PC-IHR, respectively, at a turbine inlet temperature of 500 °C. In the proposed layout (RBC-PC-HR), the S-CO2 stream after the compression process between States 6 and 7 splits into two; one is cooled down to State 8, and the second recovers heat in LTR and reaches State 11 prior to compression between States 11 and 12. Because of the heat recuperation in LTR (between States 7 and 11), the temperature of the S-CO2 prior to HTR (between States 13 and 14) is higher than that which could be achieved at the same location in RBC-PC. Eventually, due to higher heat recuperation with the RBC-PC-IHR layout, the temperature of the S-CO2 before the heat source is higher in RBC-PC-IHR, which requires less heat input in the Heater in comparison to the RBC-PC layout.
3. Energy Model
The first-law efficiency, the thermal efficiency (), of the cycle is calculated as
where is the work output of the turbine and is the net compression work input to the cycle. is the heat input given to the cycle via the heat source. The heat exchanger effectiveness, , is considered for the total hot stream [17,22] and is defined as
where and are the enthalpies of the hot streams at the inlet of the high-temperature recuperator and the outlet of the low-temperature recuperator, respectively. is the enthalpy of the hot stream at the outlet of the low-temperature recuperator calculated based on the minimum temperature that it could achieve [23] (T8 for RBC-PC and T7 for RBC-PC-IHR). Since in both configurations the flow stream splits into two, another important parameter called the split ratio (SR) is introduced, which is defined as the ratio of mass flow rate of the cold stream entering LTR to the total mass flow rate of the cycle. It is equal to for RBC-PC and for RBC-PC-IHR, where is the cycle’s total mass flow rate.
4. Simulation Environment
The commercial software Aspen HYSYS V9 (Aspen Technology, Inc., Bedford, MA, USA) was used to configure and simulate the S-CO2 Brayton cycles. We used the Peng–Robinson model for the state properties calculation. The investigation assumes the following conditions:
- The heat exchanger effectiveness is 95% (except in Section 7.2, where we investigate its effect on cycle performance) with a minimum pinch point temperature of 5 °C for all heat exchangers [11,16,17];
- The turbine inlet temperature varies from 500 °C to 850 °C;
- The cycle intermediate pressure is 7.5 MPa;
- The split ratio (SR) is 0.5.
5. Parametric Adjustments
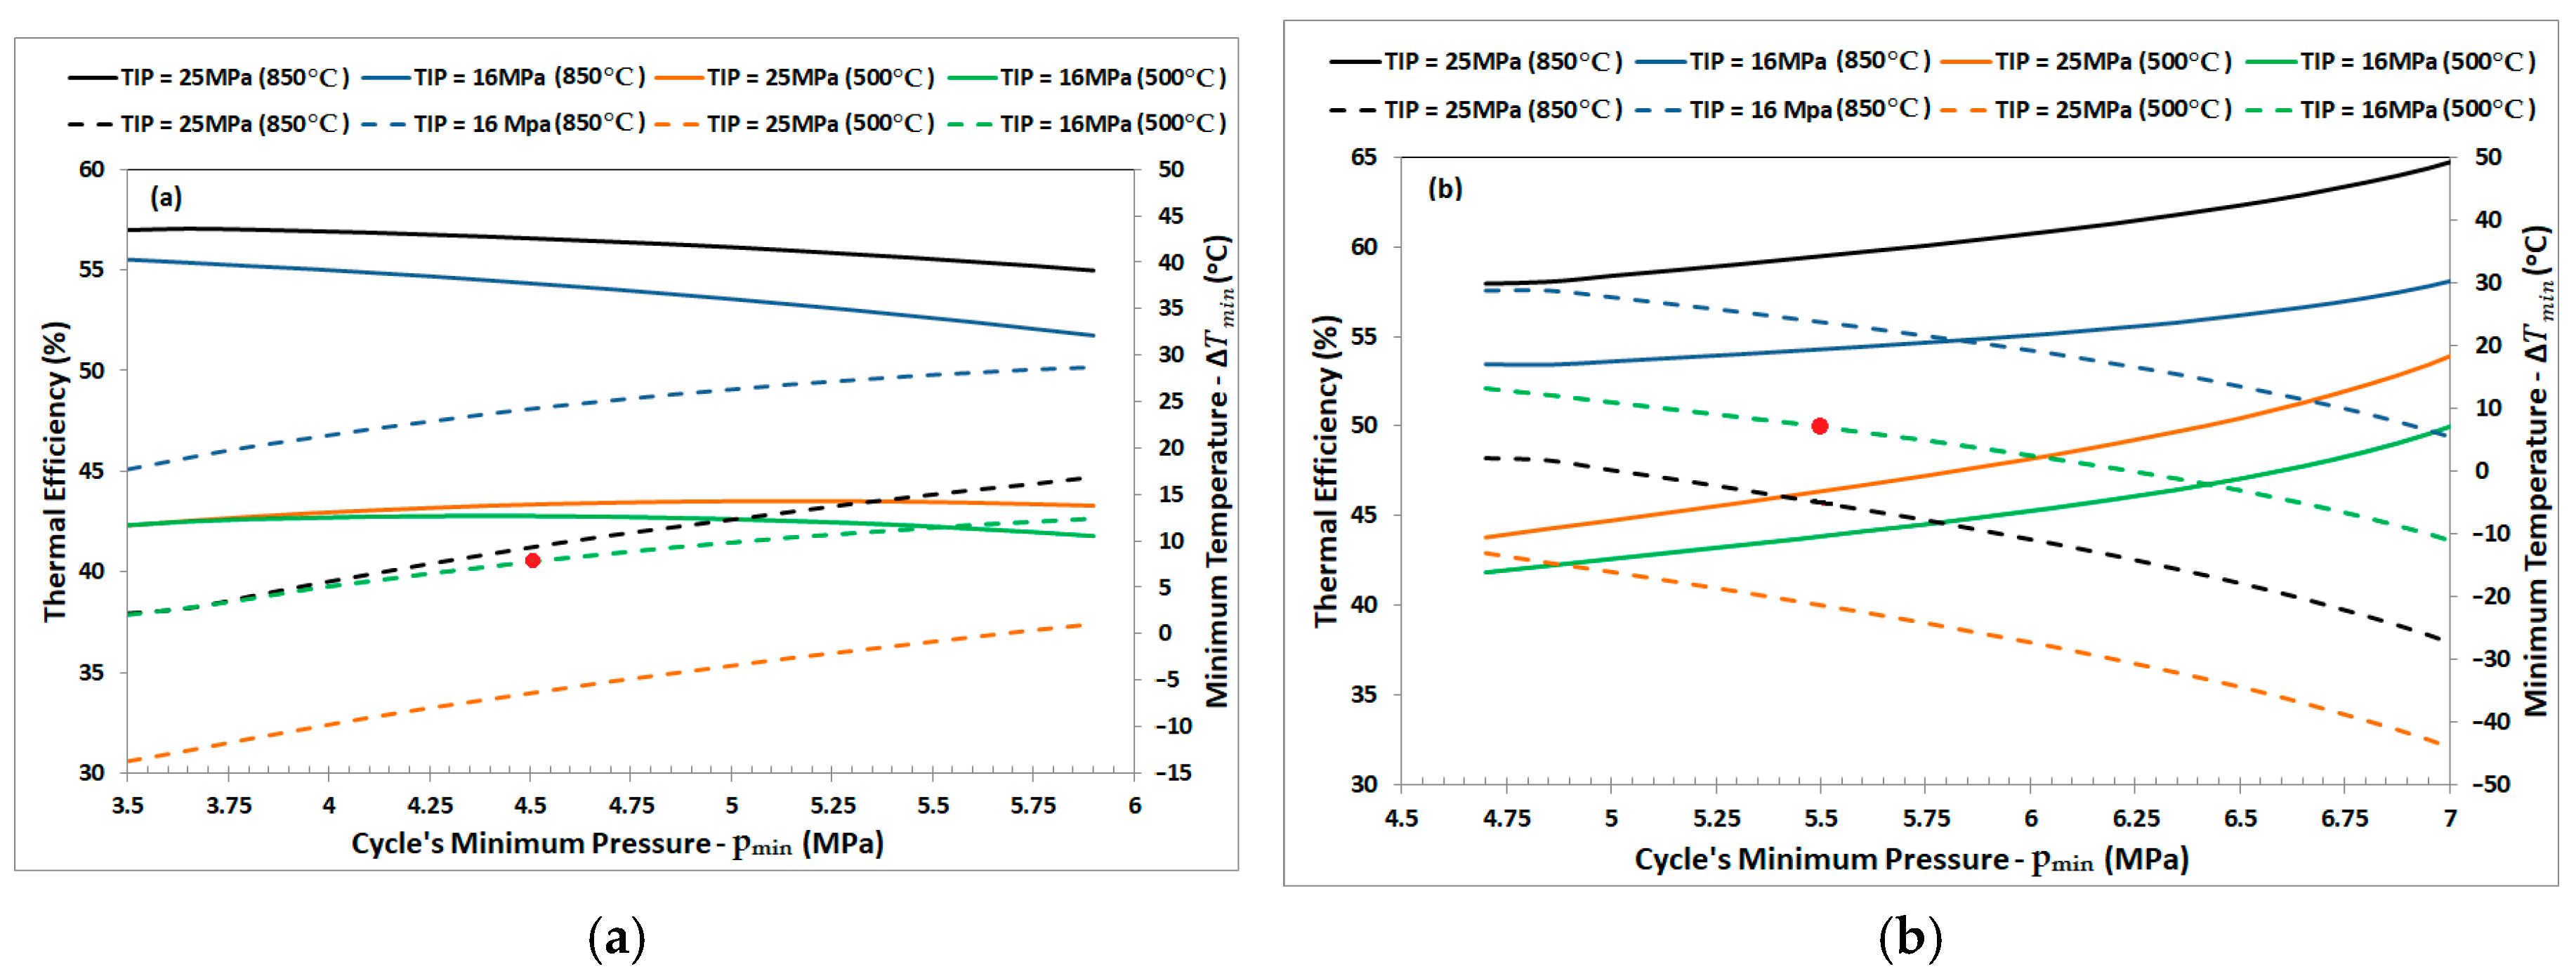
The thermodynamic performance of S-CO2 recompression Brayton cycles is greatly influenced by a number of parameters, such as the turbine inlet temperature, cycle pressure ratio, split ratio, heat exchanger effectiveness, and the minimum allowed temperature in the heat exchangers [8,9,10,24,25]. To compare our results with the published data, we kept some of the parameters constant, as mentioned in Section 4. Some parameters were adjusted to operate the cycle at near-optimal conditions. We investigated the performance of each configuration, shown in Figure 1, against the cycle’s minimum pressure, , (p5 for RBC-PC and p6 for RBC-PC-IHR). The turbine inlet pressure (TIP) values considered were 16 MPa and 25 MPa (which is the maximum allowable in this study).
Figure 3 presents the cycle’s thermal efficiency and minimum pinch temperature plotted against the cycle’s minimum pressure for RBC-PC and RCB-PC-IHR. Considering RBC-PC (Figure 3a) with a turbine inlet temperature of 850 °C, the cycle’s thermal efficiency decreases continuously with the increase of for a turbine inlet pressure of 16 MPa or 25 MPa, whereas the minimum allowable pinch temperature , i.e., 5 °C, occurs at close to 3.8 MPa for a TIP of 25 MPa. For a turbine inlet temperature of 500 °C with a TIP of 25 MPa, the temperature remains crossed in the heat exchanger. However, with a TIP of 16 MPa, the minimum pinch temperature of 5 °C occurs for approximately equal to 4.3. Thus, the cycle’s minimum pressure (p5) was set to 4.5 MPa for RBC-PC. Similarly, the near-optimal value of the cycle’s minimum pressure was set to 5.5 MPa for RBC-PC-IHC.
6. Model Validation
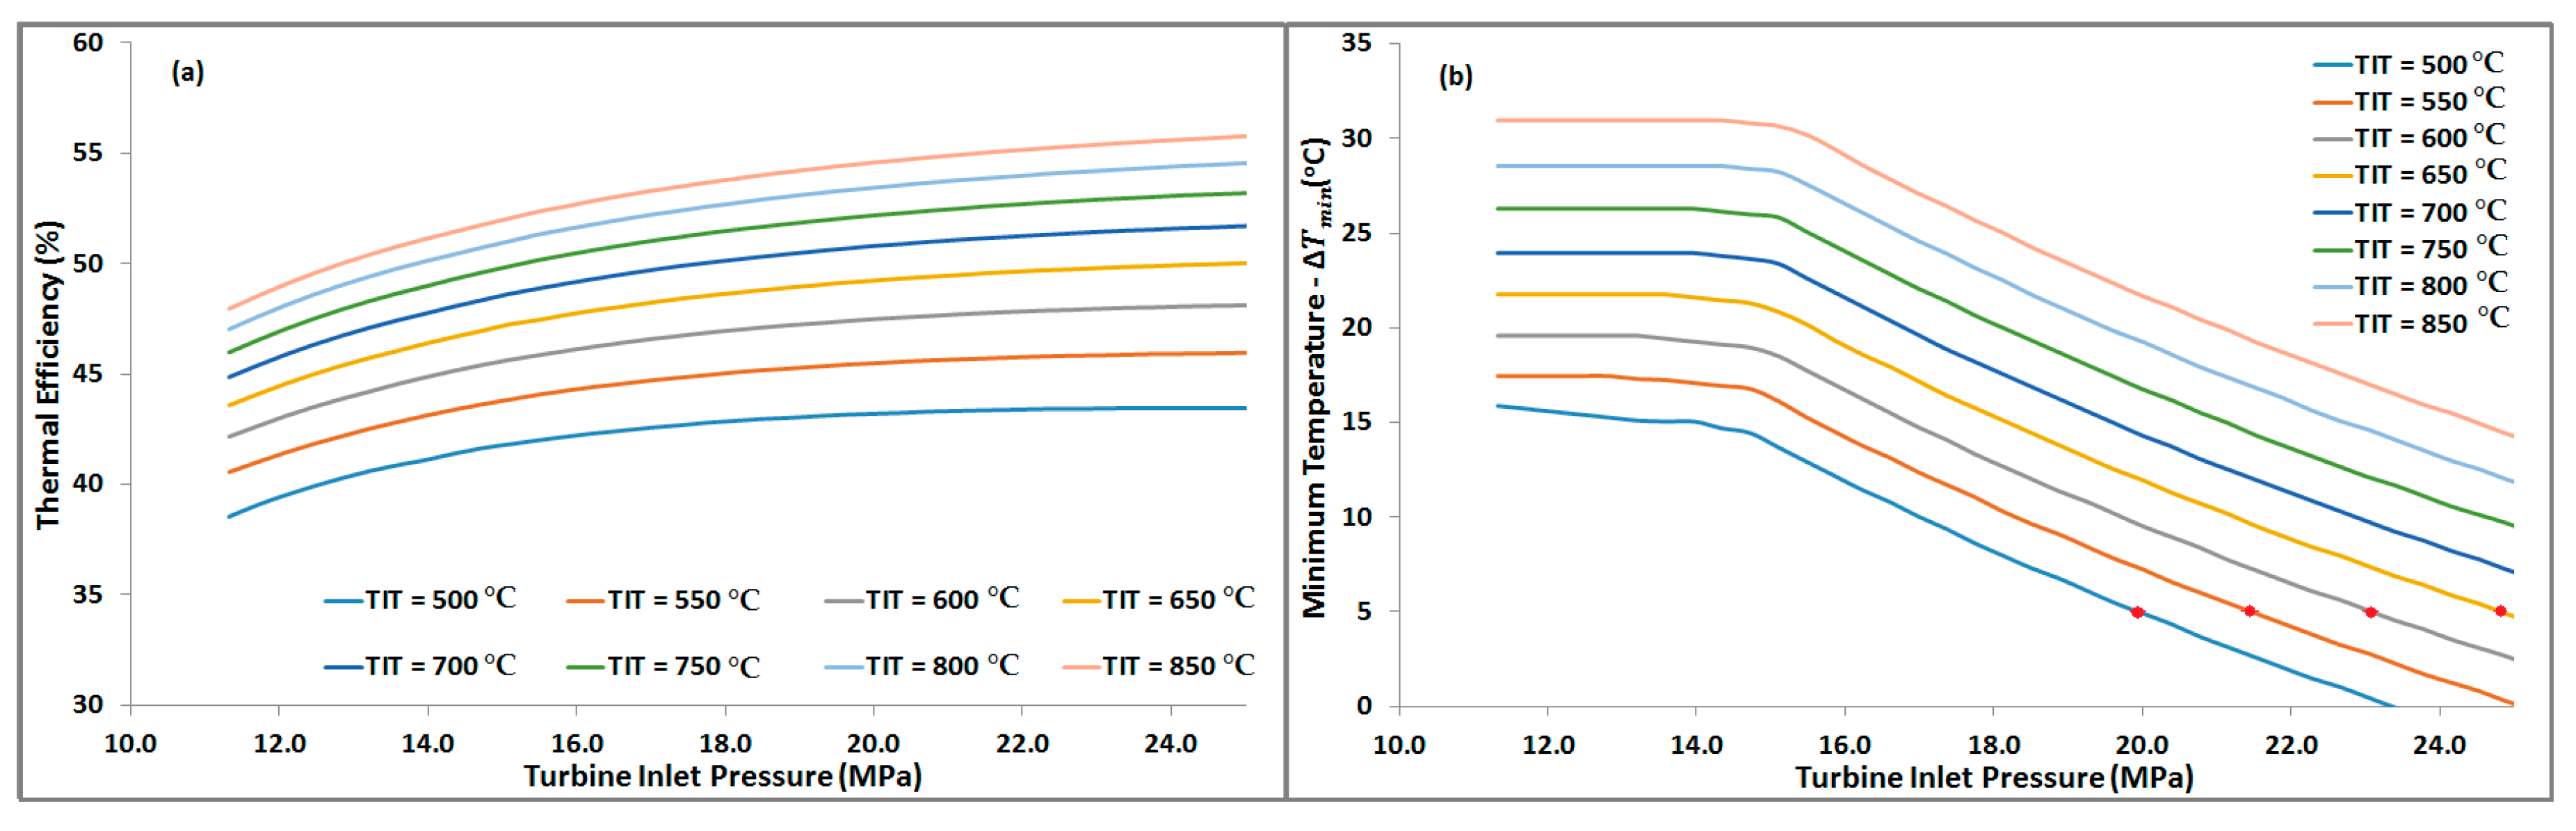
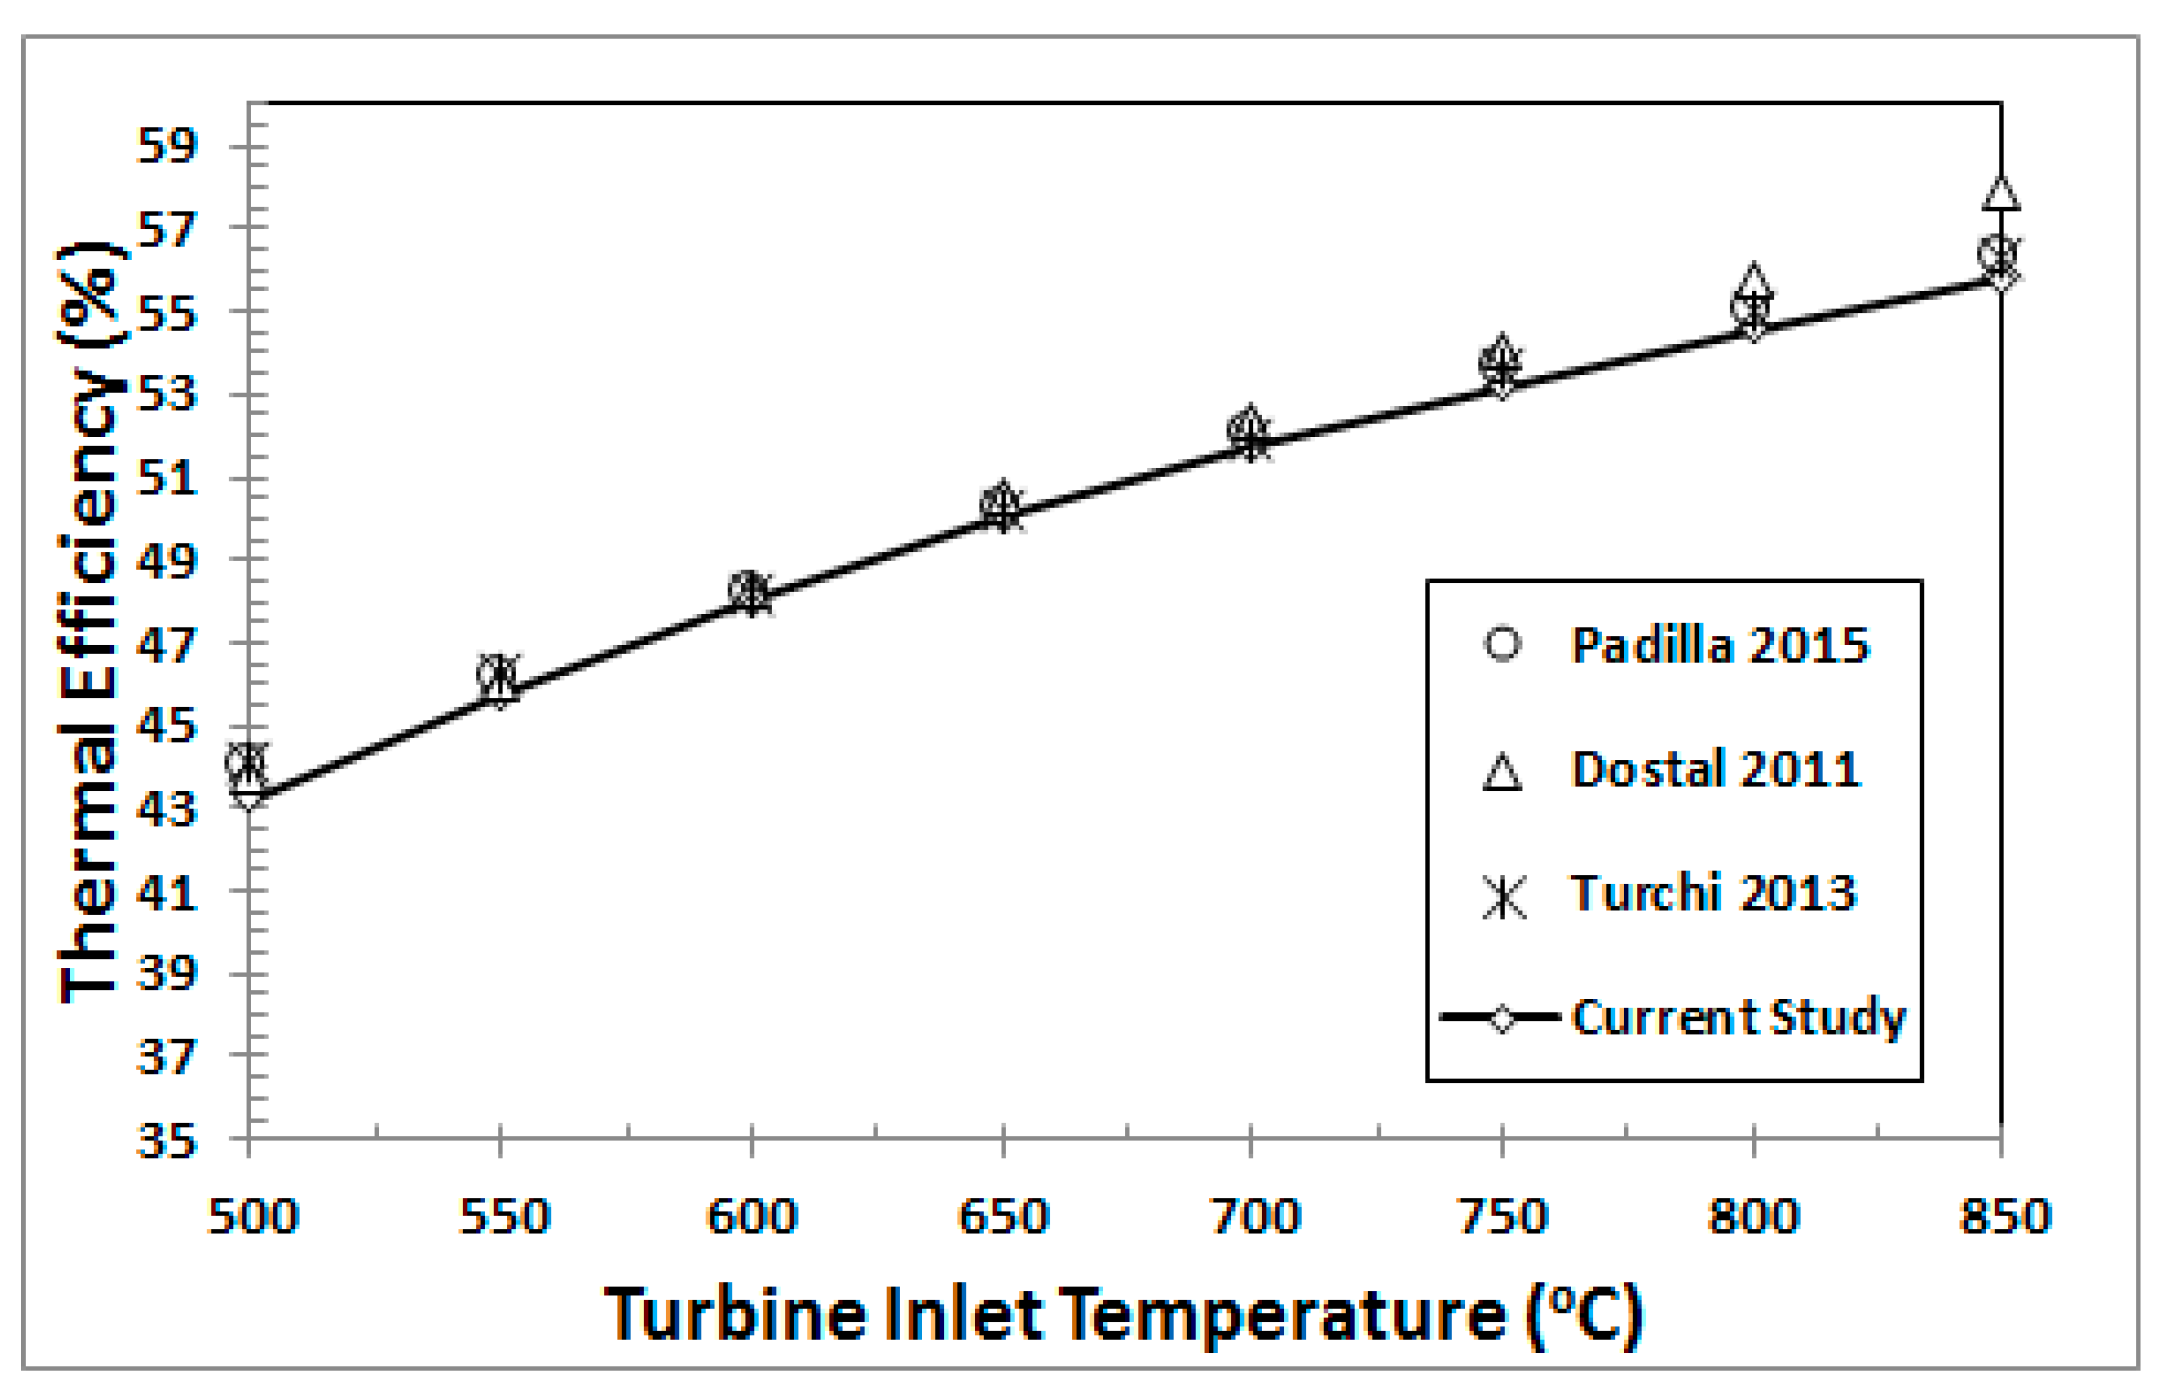
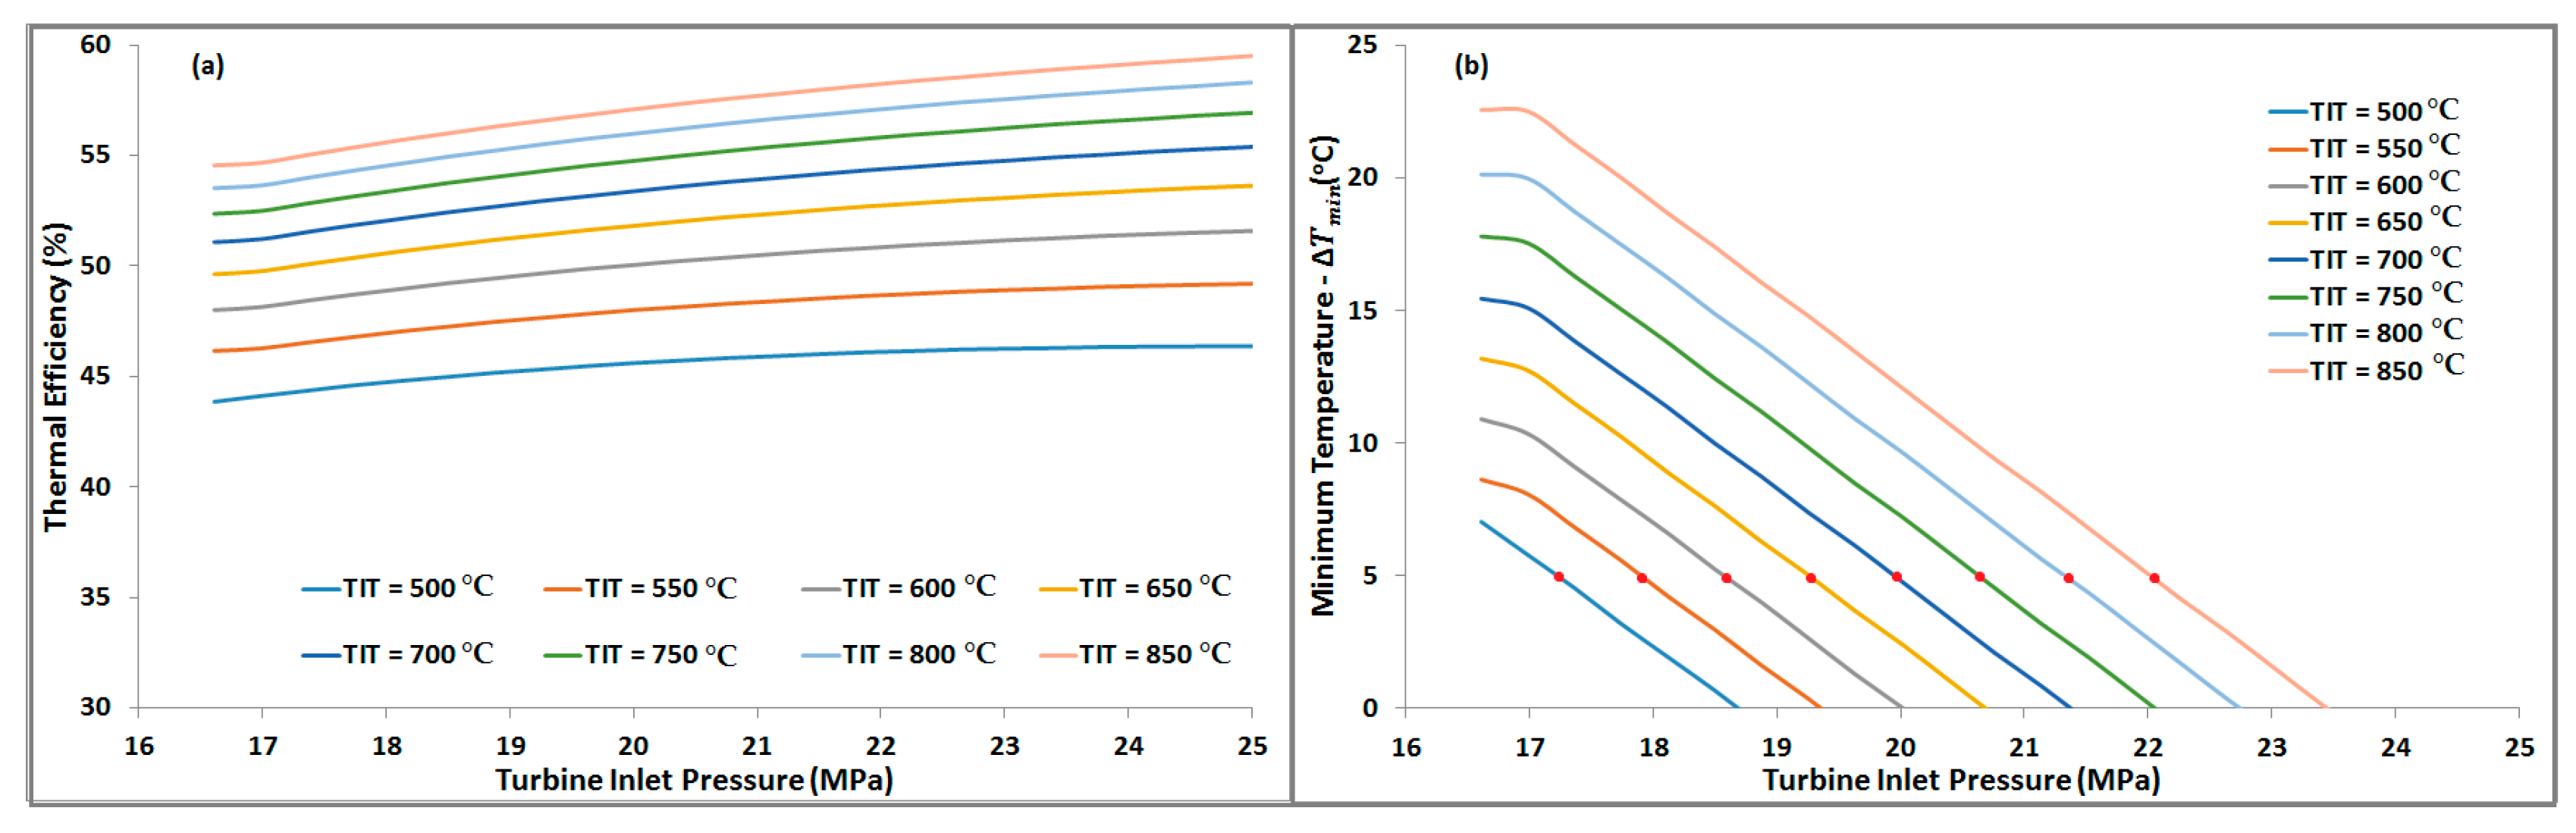
The simulation results for the base cycle, i.e., RBC-PC, were validated using data already published by Kulhánek and Dostál [11], Turchi et al. [16], and Padilla et al. [17]. Figure 4 presents the effect of the turbine inlet pressure on the efficiency and minimum pinch temperature at different turbine inlet temperatures from 500 °C to 850 °C. The thermal efficiency increases monotonically with increasing turbine inlet pressure and temperature, as shown in Figure 4a. For a given turbine inlet temperature, the minimum pinch temperature decreases linearly for a turbine inlet pressure above 16 MPa, as shown in Figure 4b. Thus, for a given turbine inlet temperature, the maximum cycle efficiency is restricted by the condition of the minimum allowable pinch temperature. In the current study, the minimum pinch temperature is 5 °C; thus, the red dots in Figure 4b represent the near-optimal operating pressures for each turbine inlet temperature, and their values are listed in Table 1. Figure 5 presents a plot of the thermal efficiency of the cycle versus turbine inlet temperatures. Data points taken from references [11,16,17] are also plotted for comparison. It is evident from the plots that the results produced by the current model agree well with those in the literature. Slight differences between our data and published data could be a result of differences in the thermodynamic properties databases used in this simulation and in published models.
7. Results and Discussions
7.1. Cycle Thermal Efficiency
The performance of the proposed cycle, RBC-PC-IHR, was studied by comparing its thermal efficiency with that of RBC-PC. Figure 6 shows the variation in the proposed cycle’s thermal efficiency and minimum pinch temperature in the heat exchanger with respect to the turbine inlet pressure for a range of turbine inlet temperatures. The cycle efficiency increases monotonically with increasing turbine inlet pressure and temperature, as expected. The minimum pinch temperature in the heat exchangers also drops with increasing turbine inlet pressure, thus limiting the maximum possible operating pressure of the cycle. Table 2 lists the near-optimal values of turbine operating pressures at different turbine inlet temperatures with a minimum pinch temperature of 5 °C.
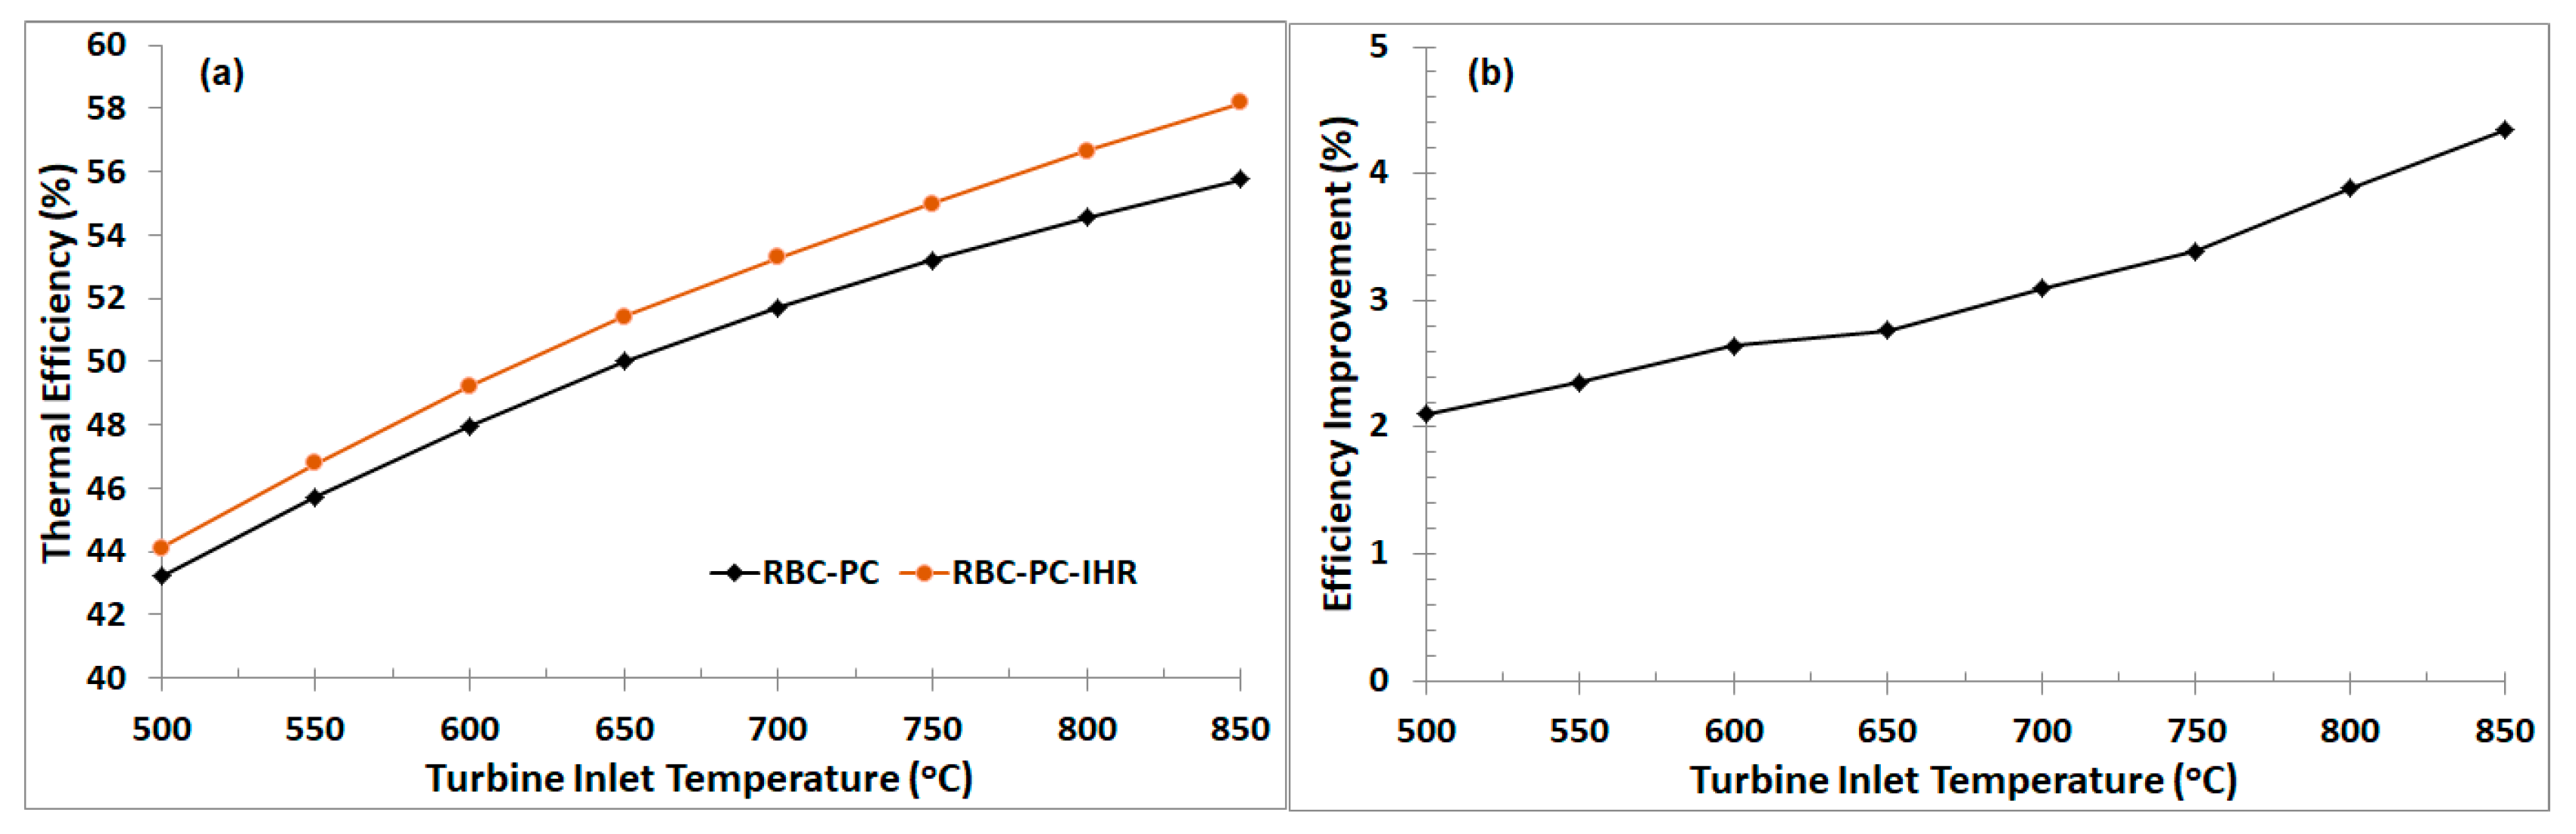
The thermal efficiency of the RBC-PC-IHR configuration is plotted in Figure 7a along with the efficiency of the RBC-PC at different turbine inlet temperatures. A significant increase in thermal efficiency for the RBC-RC-IHR configuration is noted, especially at high turbine inlet temperatures. Figure 7b is plotted to compare the efficiency improvement (in percentage points) offered by the RBC-PC-IHR layout in comparison to the RBC-PC. A minimum efficiency increase of 2% occurs at a turbine inlet temperature of 500 °C, and this increases to nearly 4.5% by 800 °C.
Besides being more efficient, the RBC-PC-IHR operating pressure is much lower than that for the RBC-PC configuration (refer to Table 1 and Table 2). For both cycles, the operating turbine inlet pressure increases with increasing turbine inlet temperature with a minimum of 20 MPa and 17.2 MPa at a turbine inlet temperature of 500 °C for RBC-PC and RBC-PC-IHR, respectively. The maximum pressure is restricted to 25 MPa in this investigation, which is attained by RBC-PC at the turbine inlet temperature of 700 °C; however, for the RBC-PC-IHR configuration, the turbine inlet pressure is raised up to 22.1 MPa by the turbine inlet temperature of 850 °C.
7.2. Heat Exchanger Effectiveness
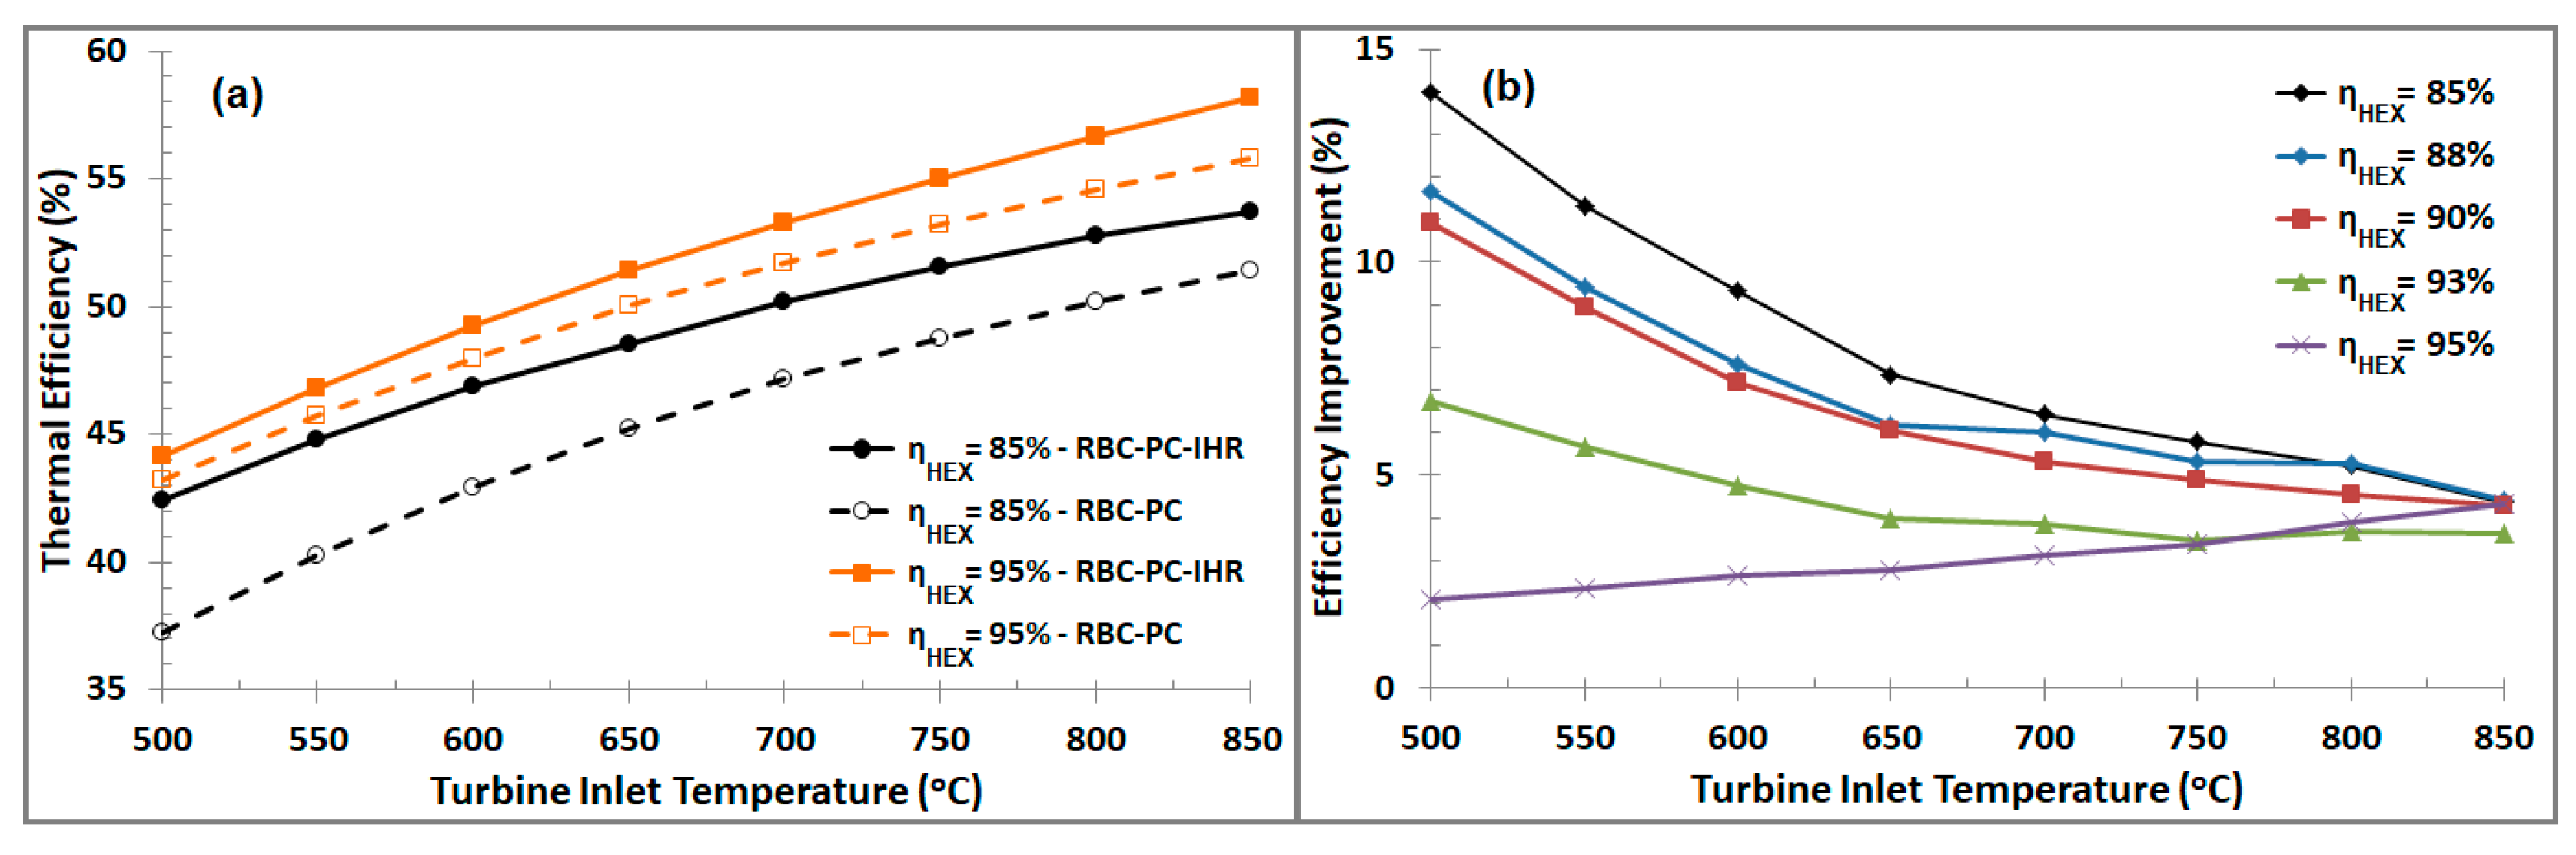
An investigation was carried out to evaluate the performance of both cycles (RBC-PC and RBC-PC-IHR) with respect to heat exchanger effectiveness (). The heat exchanger effectiveness varies between 85% and 95%. For each value of heat exchanger effectiveness, the cycle minimum pressure (p5 for RBC-PC and p6 for RBC-PC-IHR) was adjusted following the procedure mentioned earlier in Section 5. Figure 8a presents the cycle thermal efficiency at different turbine inlet temperatures for heat exchanger effectiveness values of 85% and 95%. Decreasing the heat exchange effectiveness decreases the cycle efficiency due to a decrease in heat recuperation. The thermal efficiency of the proposed layout (RBC-PC-IHR) at low values of heat exchanger effectiveness is significantly better than that of RBC-PC, especially at low turbine inlet temperatures.
Figure 8b presents an estimate of the efficiency improvement offered by the RBC-PC-IHR configuration in comparison to the RBC-PC at different values of heat exchanger effectiveness. The RBC-PC-IHR configuration was found to be nearly 14% more efficient than the RBC-PC at a turbine inlet temperature of 500 °C. Except for a heat exchanger effectiveness of 95%, with increasing turbine inlet temperature, a fall in efficiency improvement is noticed with a minimum of nearly 5% at a turbine inlet temperature of 850 °C.
8. Conclusions
In this work, we proposed a modified version of a recompression Brayton cycle with partial cooling (RBC-PC). We called this configuration a recompression Brayton cycle with partial cooling and improved heat regeneration (RBC-PC-IHR). Energy analysis was performed to investigate the thermal efficiency of the proposed cycle configuration over that of RBC-PC. The key outcomes of the investigation are as follows:
- For a given turbine inlet temperature, the thermal efficiency increased with increasing turbine inlet pressure for both configurations (RBC-PC and RBC-PC-IHR); however, the pinch temperature in the heat exchanger maintained a decreasing trend.
- For a given heat exchanger effectiveness and minimum allowable pinch temperature, the maximum turbine inlet pressure increased with increasing turbine inlet temperature for both layouts.
- The RBC-PC-IHR configuration was significantly efficient in comparison with the RBC-PC. The magnitude of its efficiency would be determined by a number of factors, like turbine inlet temperature, minimum pinch temperature in the heat exchanger, and its effectiveness.
- For a heat exchanger effectiveness of 95% and a minimum pinch of 5 °C, the RBC-PC-IHR was found to be 2% and 4.5% more efficient than the RBC-PC at turbine inlet temperatures of 500 °C and 850 °C, respectively.
- Decreasing the heat exchanger effectiveness and keeping the minimum pinch at a given value at 5 °C resulted in decreased cycle efficiency for both layouts. However, the RBC-PC lost cycle efficiency drastically, especially at low turbine inlet temperatures (between 500 °C to 700 °C). On the other side, the RBC-PC-IHR performed much better between the turbine inlet temperatures of 500 °C and 700 °C. With a heat exchanger effectiveness of 85%, the RBC-PC-IHR was found to be nearly 14% more efficient than the RBC-PC at 500 °C.
Author Contributions
M.E.S. conceived and set up the simulation in Aspen HYSYS V9; M.E.S. and K.H.A. analyzed the simulation results; M.E.S. wrote the article. K.H.A. managed research financials, wherever required. Both authors proofread the final submission.
Funding
This research received no external funding.
Conflicts of Interest
The authors declare no conflict of interest.
Nomenclature
| TIT | turbine inlet temperature, °C |
| TIP | turbine inlet pressure, MPa |
| LTR | low-temperature recuperator |
| MTR | medium-temperature recuperator |
| HTR | high-temperature recuperator |
| SR | split ratio |
| thermal efficiency, % | |
| heat exchanger effectiveness | |
| minimum pinch temperature, °C | |
| cycle’s minimum pressure, MPa | |
| enthalpy of hot stream at the inlet of high-temperature recuperator, kJ/kg | |
| enthalpy of hot stream at the outlet of low-temperature recuperator, kJ/kg |
References
- Yang, M.-H.; Yeh, R.-H. Analyzing the optimization of an organic Rankine cycle system for recovering waste heat from a large marine engine containing a cooling water system. Energy Convers. Manag. 2014, 88, 999–1010. [Google Scholar] [CrossRef]
- Chen, Y.; Lundqvist, P.; Johansson, A.; Platell, P. A comparative study of the carbon dioxide transcritical power cycle compared with an organic Rankine cycle with R123 as working fluid in waste heat recovery. Appl. Therm. Eng. 2006, 26, 2142–2147. [Google Scholar] [CrossRef]
- Conboy, T.; Pasch, J.; Fleming, D. Control of a Supercritical CO2 Recompression Brayton Cycle Demonstration Loop. J. Eng. Gas Turbines Power 2013, 135, 111701. [Google Scholar] [CrossRef]
- Conboy, T.; Wright, S.; Pasch, J.; Fleming, D.; Rochau, G.; Fuller, R. Performance Characteristics of an Operating Supercritical CO2 Brayton Cycle. J. Eng. Gas Turbines Power 2012, 134, 111703. [Google Scholar] [CrossRef]
- Vesely, L.; Dostal, V.; Hajek, P. Design of Experimental Loop with Supercritical Carbon Dioxide. In Proceedings of the 2014 22nd International Conference on Nuclear Engineering, Prague, Czech Republic, 7–11 July 2014; Volume 3. Next Generation Reactors and Advanced Reactors; Nuclear Safety and Security. [Google Scholar] [CrossRef]
- Wang, X.; Dai, Y. Exergoeconomic analysis of utilizing the transcritical CO2 cycle and the ORC for a recompression supercritical CO2 cycle waste heat recovery: A comparative study. Appl. Energy 2016. [Google Scholar] [CrossRef]
- Santini, L.; Accornero, C.; Cioncolini, A. On the adoption of carbon dioxide thermodynamic cycles for nuclear power conversion: A case study applied to Mochovce 3 Nuclear Power Plant. Appl. Energy 2016, 181, 446–463. [Google Scholar] [CrossRef]
- Feher, E.G. The Supercritical Thermodynamic Power Cycle. Energy Convers. 1968, 8, 85–90. [Google Scholar] [CrossRef]
- Angelino, G. Carbon Dioxide Condensation Cycles for Power Production. J. Eng. Gas Turbines Power 1968, 90, 287. [Google Scholar] [CrossRef]
- Dostál, V.; Driscoll, M.J.; Hejzlar, P. A Supercritical Carbon Dioxide Cycle for Next Generation Nuclear Reactors; Tech Rep MIT-ANP-TR-100; Massachusetts Institute of Technology: Cambridge, MA, USA, 2004; pp. 1–317. [Google Scholar]
- Kulhánek, M.; Dostál, V. Thermodynamic Analysis and Comparison of Supercritical Carbon Dioxide Cycles. In Proceedings of the Supercritical CO2 Power Cycle Symposium, Boulder, CO, USA, 24–25 May 2011. [Google Scholar]
- Mahmoudi, S.M.S.; Akbari, A.D.; Rosen, M.A. Thermoeconomic Analysis and Optimization of a New Combined Supercritical Carbon Dioxide Recompression Brayton/Kalina Cycle. Sustainability 2016, 8, 1079. [Google Scholar] [CrossRef]
- Sarkar, J. Second law analysis of supercritical CO2 recompression Brayton cycle. Energy 2009, 34, 1172–1178. [Google Scholar] [CrossRef]
- Sarkar, J.; Bhattacharyya, S. Optimization of recompression S-CO2 power cycle with reheating. Energy Convers. Manag. 2009, 50, 1939–1945. [Google Scholar] [CrossRef]
- Ahn, Y.; Bae, S.J.; Kim, M.; Cho, S.K.; Baik, S.; Lee, J.I.; Cha, J.E. Review of supercritical CO2 power cycle technology and current status of research and development. Nucl. Eng. Technol. 2015, 47, 647–661. [Google Scholar] [CrossRef]
- Turchi, C.S.; Ma, Z.; Neises, T.W.; Wagner, M.J. Thermodynamic Study of Advanced Supercritical Carbon Dioxide Power Cycles for Concentrating Solar Power Systems. J. Sol. Energy Eng. 2013, 135, 041007. [Google Scholar] [CrossRef]
- Padilla, R.V.; Soo Too, Y.C.; Benito, R.; Stein, W. Exergetic analysis of supercritical CO2 Brayton cycles integrated with solar central receivers. Appl. Energy 2015, 148, 348–365. [Google Scholar] [CrossRef]
- Angelino, G.; Invernizzi, C.M. Carbon dioxide power cycles using liquid natural gas as heat sink. Appl. Therm. Eng. 2009, 29, 2935–2941. [Google Scholar] [CrossRef] [Green Version]
- Siddiqui, M.; Taimoor, A.; Almitani, K.; Siddiqui, M.E.; Taimoor, A.A.; Almitani, K.H. Energy and Exergy Analysis of the S-CO2 Brayton Cycle Coupled with Bottoming Cycles. Processes 2018, 6, 153. [Google Scholar] [CrossRef]
- Deng, S.; Jin, H.; Cai, R.; Lin, R. Novel cogeneration power system with liquefied natural gas (LNG) cryogenic exergy utilization. Energy 2004, 29, 497–512. [Google Scholar] [CrossRef]
- Zhang, N.; Lior, N. A novel near-zero CO2 emission thermal cycle with LNG cryogenic exergy utilization. Energy 2006, 31, 1666–1679. [Google Scholar] [CrossRef]
- Besarati, S.M.; Yogi Goswami, D. Analysis of Advanced Supercritical Carbon Dioxide Power Cycles with a Bottoming Cycle for Concentrating Solar Power Applications. J. Sol. Energy Eng. 2013, 136, 011020. [Google Scholar] [CrossRef]
- Moran, M.J.; Shapiro, H.N.; Boettner, D.D.; Bailey, M.B. Fundamentals of Engineering Thermodynamics, 7th ed.; Wiley: Hoboken, NJ, USA, 2010. [Google Scholar]
- Ahn, Y.; Lee, J.; Kim, S.G.; Lee, J.I.; Cha, J.E.; Lee, S.W. Design consideration of supercritical CO2 power cycle integral experiment loop. Energy 2015, 86. [Google Scholar] [CrossRef]
- Linares, J.I.; Cantizano, A.; Arenas, E.; Moratilla, B.Y.; Martín-Palacios, V.; Batet, L. Recuperated versus single-recuperator re-compressed supercritical CO2 Brayton power cycles for DEMO fusion reactor based on dual coolant lithium lead blanket. Energy 2017, 140, 307–317. [Google Scholar] [CrossRef]
Figure 1.
Supercritical CO2 (S-CO2) power cycle layouts: (a) recompression Brayton cycle (RBC) with partial cooling and (b) RBC with partial cooling and improved heat regeneration. LTR: low-temperature recuperator; HTR: high-temperature recuperator. Layouts (a) adapted from [17].
Figure 1.
Supercritical CO2 (S-CO2) power cycle layouts: (a) recompression Brayton cycle (RBC) with partial cooling and (b) RBC with partial cooling and improved heat regeneration. LTR: low-temperature recuperator; HTR: high-temperature recuperator. Layouts (a) adapted from [17].

Figure 2.
A temperature–entropy diagram for different S-CO2 Brayton cycle layouts: (a) RBC-PC, and (b) RBC-PC with improved heat regeneration (RBC-PC-IHR). The highest temperature of the cycle is 500 °C.
Figure 2.
A temperature–entropy diagram for different S-CO2 Brayton cycle layouts: (a) RBC-PC, and (b) RBC-PC with improved heat regeneration (RBC-PC-IHR). The highest temperature of the cycle is 500 °C.

Figure 3.
Cycle thermal efficiency (solid lines) and minimum pinch temperature in the heat exchanger (dashed lines) plotted as a function of the cycle’s minimum pressure () for (a) RBC-PC and (b) RBC-PC-IHR. The turbine inlet pressure (TIP) was set to 25 MPa or 16 MPa for turbine inlet temperatures (TIT) of 850 °C and 500 °C. The red dot shows the near-optimal value for the cycle’s minimum pressure.

Figure 4.
(a) Thermal efficiencies of RBC-PC plotted versus turbine inlet pressure for TIT from 500 °C to 850 °C. (b) Minimum pinch temperature versus turbine inlet pressure; red dots represent the minimum pinch temperature of 5 °C.
Figure 4.
(a) Thermal efficiencies of RBC-PC plotted versus turbine inlet pressure for TIT from 500 °C to 850 °C. (b) Minimum pinch temperature versus turbine inlet pressure; red dots represent the minimum pinch temperature of 5 °C.


Figure 6.
(a) Thermal efficiencies of the RBC-PC-IHR plotted versus turbine inlet pressure for TIT from 500 °C to 850 °C. (b) Minimum pinch temperature versus turbine inlet pressure; red dots represent the minimum pinch temperature of 5 °C.
Figure 6.
(a) Thermal efficiencies of the RBC-PC-IHR plotted versus turbine inlet pressure for TIT from 500 °C to 850 °C. (b) Minimum pinch temperature versus turbine inlet pressure; red dots represent the minimum pinch temperature of 5 °C.

Figure 7.
(a) The thermal efficiencies of RBC-PC-IHR and RBC-PC plotted versus turbine inlet temperatures from 500 °C to 850 °C. (b) The improvement in thermal efficiency from RBC-PC-IHR compared to RBC-PC in percentage points.
Figure 7.
(a) The thermal efficiencies of RBC-PC-IHR and RBC-PC plotted versus turbine inlet temperatures from 500 °C to 850 °C. (b) The improvement in thermal efficiency from RBC-PC-IHR compared to RBC-PC in percentage points.

Figure 8.
(a) Cycle thermal efficiencies versus turbine inlet pressure with heat exchanger effectiveness values of 85% and 95%. (b) Improvement in thermal efficiency from the RBC-PC-IHR compared to the RBC-PC in percentage points at different values of heat exchanger effectiveness between 85% and 95%.


Table 1.
Turbine inlet pressures at different turbine inlet temperatures for maximum thermal efficiency of the recompression Brayton cycle with partial cooling (RBC-PC).
Table 1.
Turbine inlet pressures at different turbine inlet temperatures for maximum thermal efficiency of the recompression Brayton cycle with partial cooling (RBC-PC).
| Turbine inlet temperature (°C) | 500 | 550 | 600 | 650 | 700 | 750 | 800 | 850 |
| Turbine inlet pressure (MPa) | 20.0 | 21.5 | 23.0 | 24.9 | 25.0 | 25.0 | 25.0 | 25.0 |
| Thermal efficiency (%) | 43.2 | 45.7 | 48.0 | 50.0 | 51.7 | 53.2 | 54.5 | 55.8 |
Table 2.
Turbine inlet pressures at different turbine inlet temperatures for maximum thermal efficiency of the RBC-PC with improved heat regeneration (RBC-PC-IHR).
Table 2.
Turbine inlet pressures at different turbine inlet temperatures for maximum thermal efficiency of the RBC-PC with improved heat regeneration (RBC-PC-IHR).
| Turbine inlet temperature (°C) | 500 | 550 | 600 | 650 | 700 | 750 | 800 | 850 |
| Turbine inlet pressure (MPa) | 17.2 | 17.9 | 18.6 | 19.3 | 20 | 20.7 | 21.4 | 22.1 |
| Thermal efficiency (%) | 44.1 | 46.8 | 49.2 | 51.4 | 53.3 | 55.0 | 56.7 | 58.2 |
© 2018 by the authors. Licensee MDPI, Basel, Switzerland. This article is an open access article distributed under the terms and conditions of the Creative Commons Attribution (CC BY) license (http://creativecommons.org/licenses/by/4.0/).
Share and Cite
MDPI and ACS Style
Siddiqui, M.E.; Almitani, K.H. Energy Analysis of the S-CO2 Brayton Cycle with Improved Heat Regeneration. Processes 2019, 7, 3. https://0-doi-org.brum.beds.ac.uk/10.3390/pr7010003
AMA Style
Siddiqui ME, Almitani KH. Energy Analysis of the S-CO2 Brayton Cycle with Improved Heat Regeneration. Processes. 2019; 7(1):3. https://0-doi-org.brum.beds.ac.uk/10.3390/pr7010003
Chicago/Turabian StyleSiddiqui, Muhammad Ehtisham, and Khalid H. Almitani. 2019. "Energy Analysis of the S-CO2 Brayton Cycle with Improved Heat Regeneration" Processes 7, no. 1: 3. https://0-doi-org.brum.beds.ac.uk/10.3390/pr7010003
Note that from the first issue of 2016, this journal uses article numbers instead of page numbers. See further details here.