Cogeneration Process Technical Viability for an Apartment Building: Case Study in Mexico


1
Centro de Innovación en Ingeniería Aplicada (CIIA), Departamento de Computación e Industrias, Universidad Catolica del Maule (UCM), 3460000 Talca, Chile
2
Departamento de Sistemas Energéticos, Universidad Nacional Autonoma de Mexico (UNAM), Ciudad Universitaria, 04510 México, Mexico
*
Author to whom correspondence should be addressed.
Processes 2019, 7(2), 93; https://0-doi-org.brum.beds.ac.uk/10.3390/pr7020093
Submission received: 29 December 2018
/
Revised: 5 February 2019
/
Accepted: 7 February 2019
/
Published: 13 February 2019
(This article belongs to the Special Issue Advances in Theoretical and Computational Energy Optimization Processes)
Abstract
:The objective of this paper is to evaluate and to simulate the cogeneration process applied to an apartment building in the Polanco area (Mexico). Considering the building’s electric, thermal demand and consumption data, the cogeneration process model was simulated using Thermoflow© software (Thermoflow Inc., Jacksonville, FL, USA), in order to cover 1.1 MW of electric demand and to supply the thermal needs of hot water, heating, air conditioning and heating pool. As a result of analyzing various schemes of cogeneration, the most efficient scheme consists of the use of a gas turbine (Siemens model SGT-100-1S), achieving a cycle with efficiency of 84.4% and a heat rate of 14,901 kJ/kWh. The economic results of this evaluation show that it is possible to implement the cogeneration in the building with a natural gas price below US$0.014/kWh. The use of financing schemes makes the economic results more attractive. Furthermore, the percentage of the turbine load effect on the turbine load net power, cogeneration efficiency, chimney flue gas temperature, CO2 emission, net heat ratio, turbine fuel flow and after burner fuel flow was also studied.
1. Introduction
Rapidly increasing world energy use has already raised concerns over supply difficulties, exhaustion of energy resources and heavy environmental impacts (ozone layer depletion, global warming, climate change, etc.). Final energy consumption is usually shown split into three main sectors: industry, transport and ‘other’, including in the latter, agriculture, service sector and residential. This makes it difficult to gather information about building energy consumption [1].
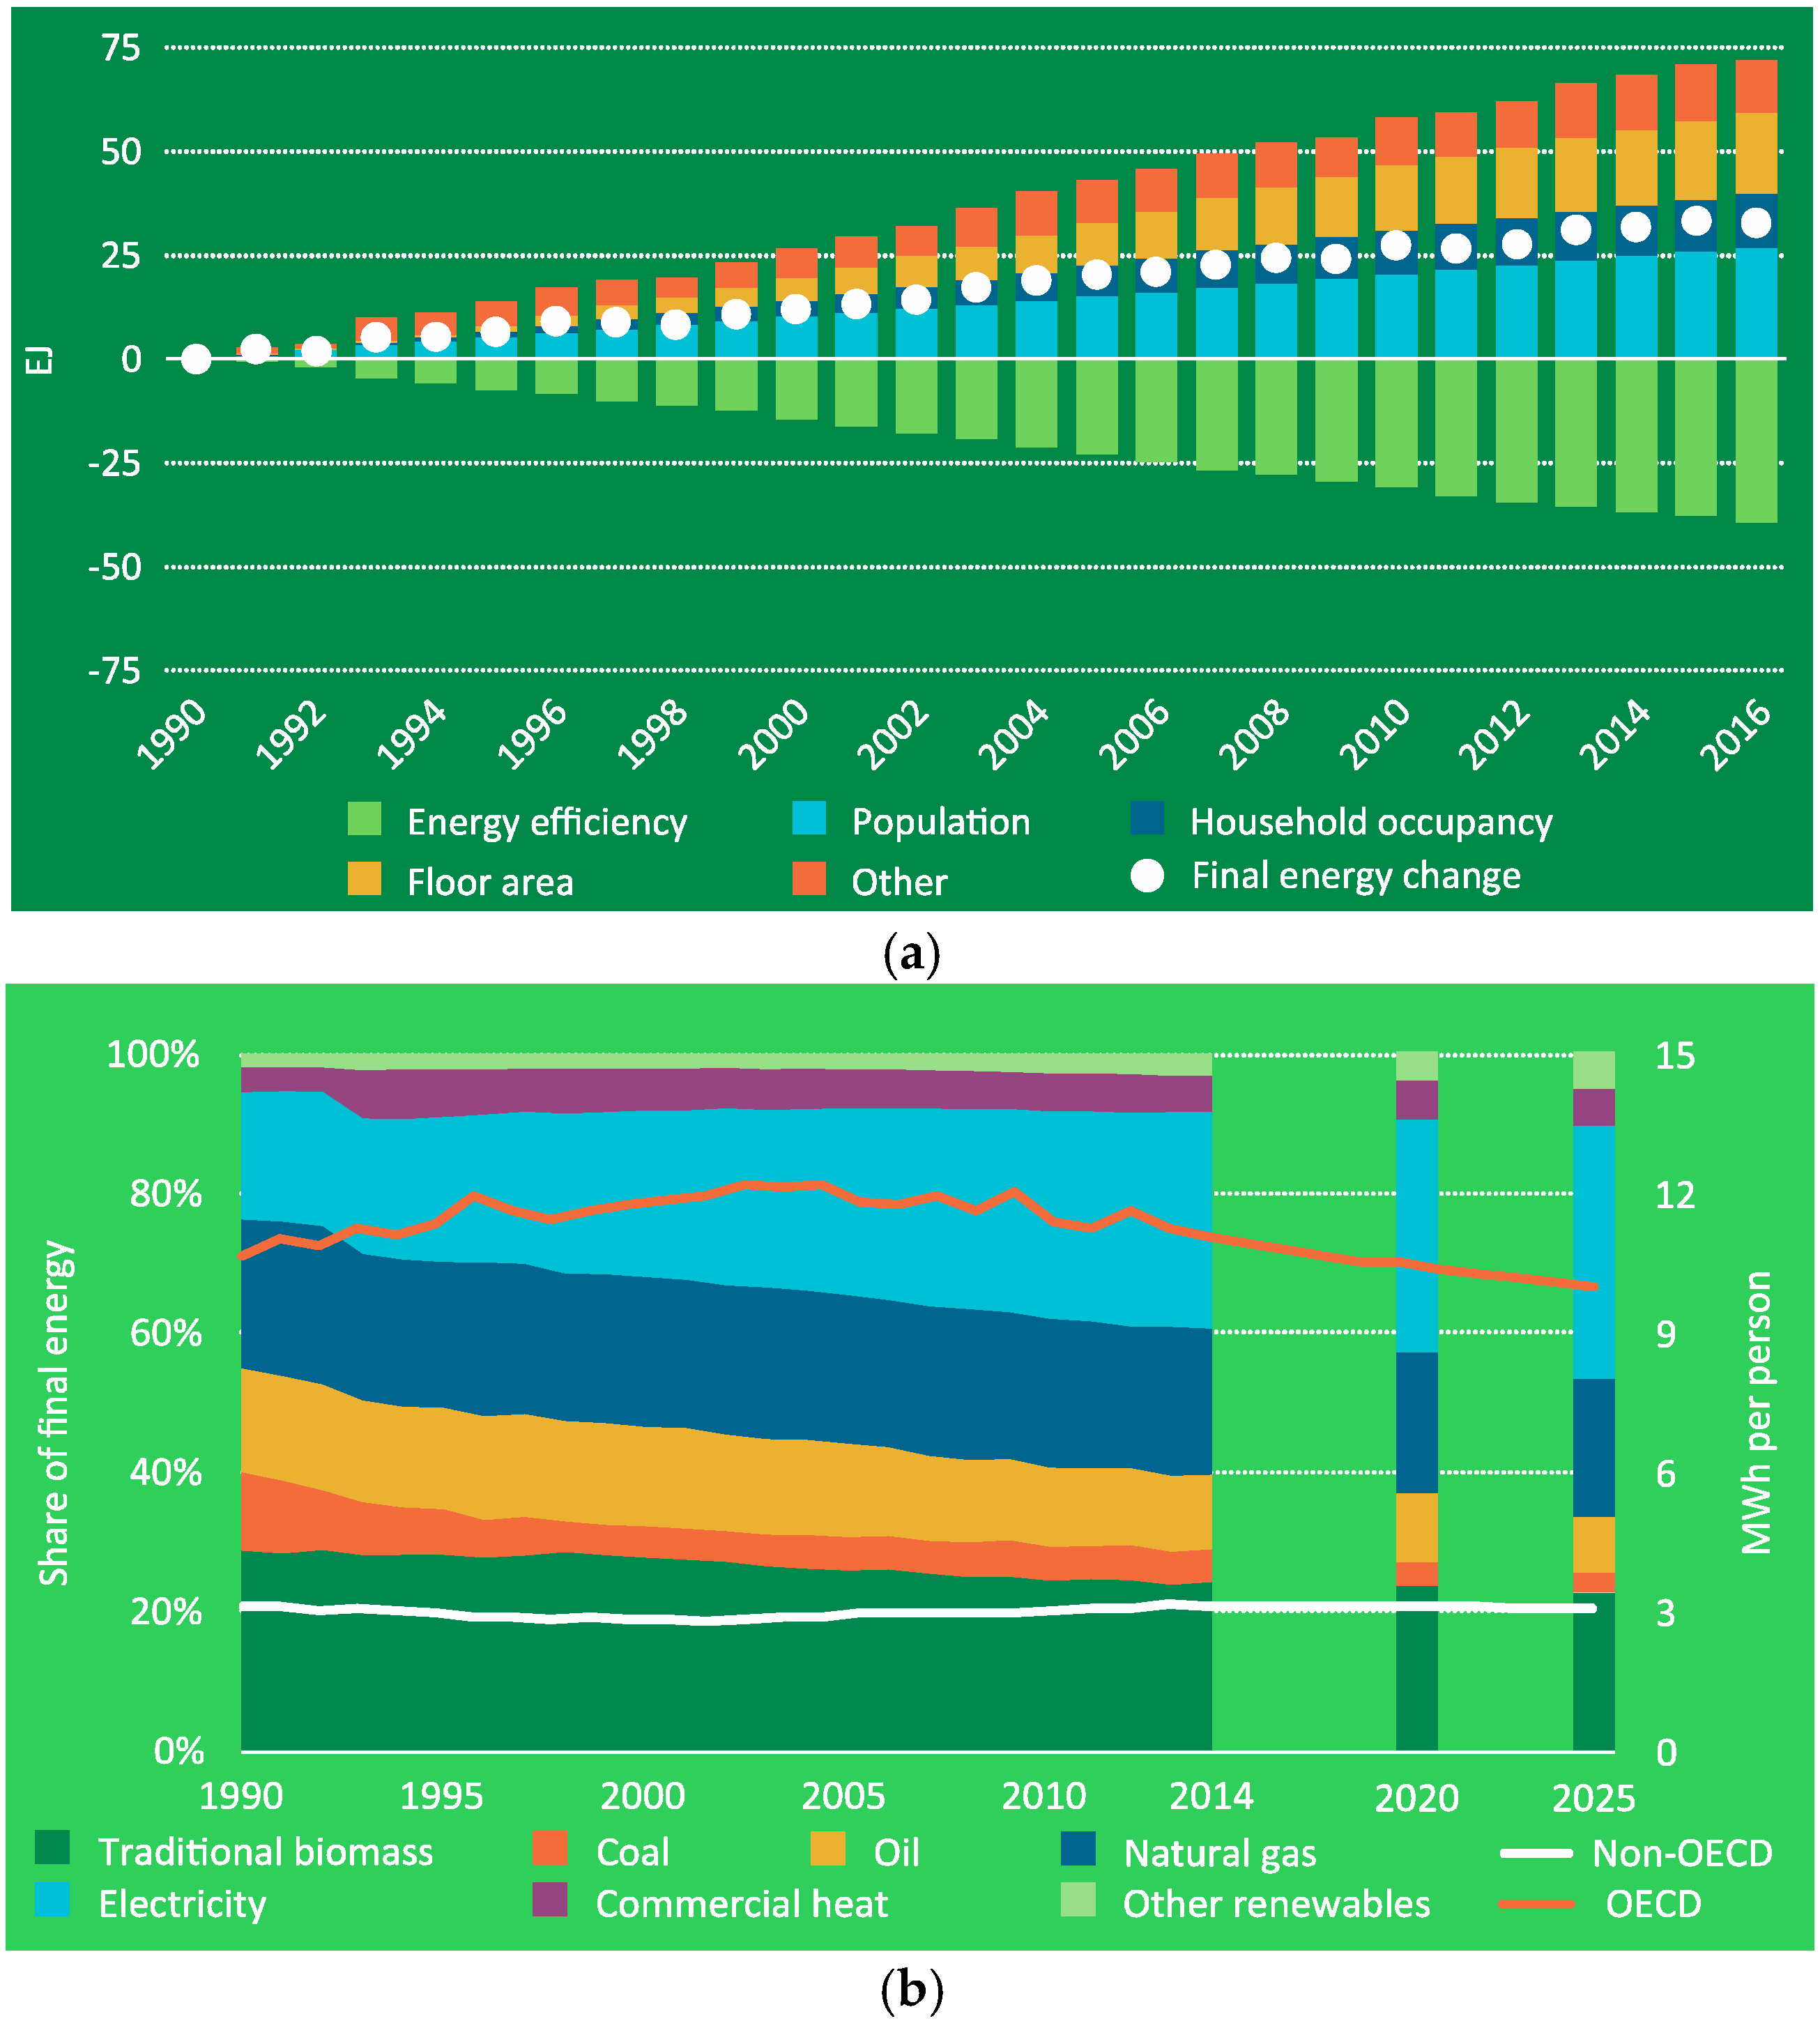
Buildings account for approximately 40% of global energy consumption and play an important role in the energy market. The energy demands of buildings are predicted to continue growing worldwide in the coming decades [2,3,4]. Some authors [4,5,6] report that the energy demands of buildings (including residential and commercial buildings) have grown by 1.8% per year for forty years (see Figure 1a). Coal and oil use in buildings has remained fairly constant since then, while natural gas use grew steadily by about 1% per year. Global use of electricity in buildings grew on average by 2.5% per year since 2010, and in non-OECD countries it increased by nearly 6% per year. Global buildings sector energy intensity (measured by final energy per square meter) fell by 1.3% per year between 2010 and 2014, thanks to the continued adoption and enforcement of building energy codes and efficiency standards. Yet, progress has not been fast enough to offset growth in floor area (3% per year globally) and the increasing demand for energy services in buildings. More telling is energy demand per capita, where global average building energy use per person has remained practically constant since 1990, at just below 5 MWh per person per year (see Figure 1b) [6]. The Secretary of Energy (SENER) [7] has reported that buildings in Mexico are responsible for: 20% of total energy consumption, 27.8% of total electricity consumption, 78% of total gas consumption and 20% of CO2 emissions. Ali [8] explored various architectural and building technologies that are employed to achieve a low-energy built environment. He concluded that the designers of the next generation of buildings, whether residential, commercial, or institutional, should aim for “zero energy” buildings in which there will be no need to draw energy from a region’s power grid. In this approach, the climate and environment are used advantageously, rather than being treated as adversaries, and buildings become sources of energy.
On the other hand, by 2015, global energy generation was distributed in the following way: 78.3% fossil fuels, 2.6% nuclear energy and 19.1% renewable energy (9% biomass, 10.1% geothermal-solar-hydro-wind-biofuels). In addition, 15% of the world’s population did not have access to electricity. Of this group, 87% belonged to rural areas, 55% to sub-Saharan Africa and 34% to South Asia [9]. SENER [7] has reported that the percentage distribution of the energy sources for buildings (Mexico) is: 42.2% fossil fuel, 29.2% electricity, 27.8% wood and 0.8% solar. In addition, until June 2015, the generation of electric energy was distributed in the following way: Photovoltaic <1%, Wind 0.8%, Geothermal 2.3%, Nuclear 4.3%, Hydroelectric 13.5%, Carboelectric 13.5% and Thermoelectric (combined cycle, steam cycle, turbo gas and internal combustion) 65.6%, which is why the Mexican electricity market is based mainly on power cycles that must use cogeneration in order to optimize their process.
There are other fuels that can be used in the cogeneration process or as part of a combined process, for example, Al-Aboosi and El-Halwagi [10] developed a design framework for integrating water and energy systems including multiple energy sources, the cogeneration process and desalination technologies in treating wastewater and fresh water for shale gas production. Solar energy was included to provide thermal power directly to a multi-effect distillation plant exclusively (to be more feasible economically) or indirect supply through a thermal energy storage system. On the other hand, if renewable energies are used, the cogeneration process can be more environmentally friendly; for example, Yan and Qin [11] designed an integrated heating system that incorporates geothermal energy into the framework of an integrated energy system of electricity, heating, and gas. An analysis of the environmental and economic benefits indicates that the system reduces pollutant emissions and decreases the cost of urban heating.
Cogeneration is defined as: “The production of more than one useful form of energy (such as process heat and electrical power) from the same energy source” [12]. This concept must be complemented by the use of waste-generated fuels in the same process as, for example, biogas. The cogeneration process has existed since 1882, when Thomas Edison designed and built the first commercial plant in the USA [5]. The basic elements of a cogeneration plant are: primary energy source, heat utilization systems, refrigeration systems, water treatment system, control system, electrical system and auxiliary systems. The different types of cogeneration can be distinguished by the equipment used in the production of energy, as, for example: cogeneration with steam turbine, cogeneration with gas turbine, cogeneration with an alternative engine, combined cycle cogeneration with gas turbine, combined cycle cogeneration with an alternative engine and tri-generation [13].
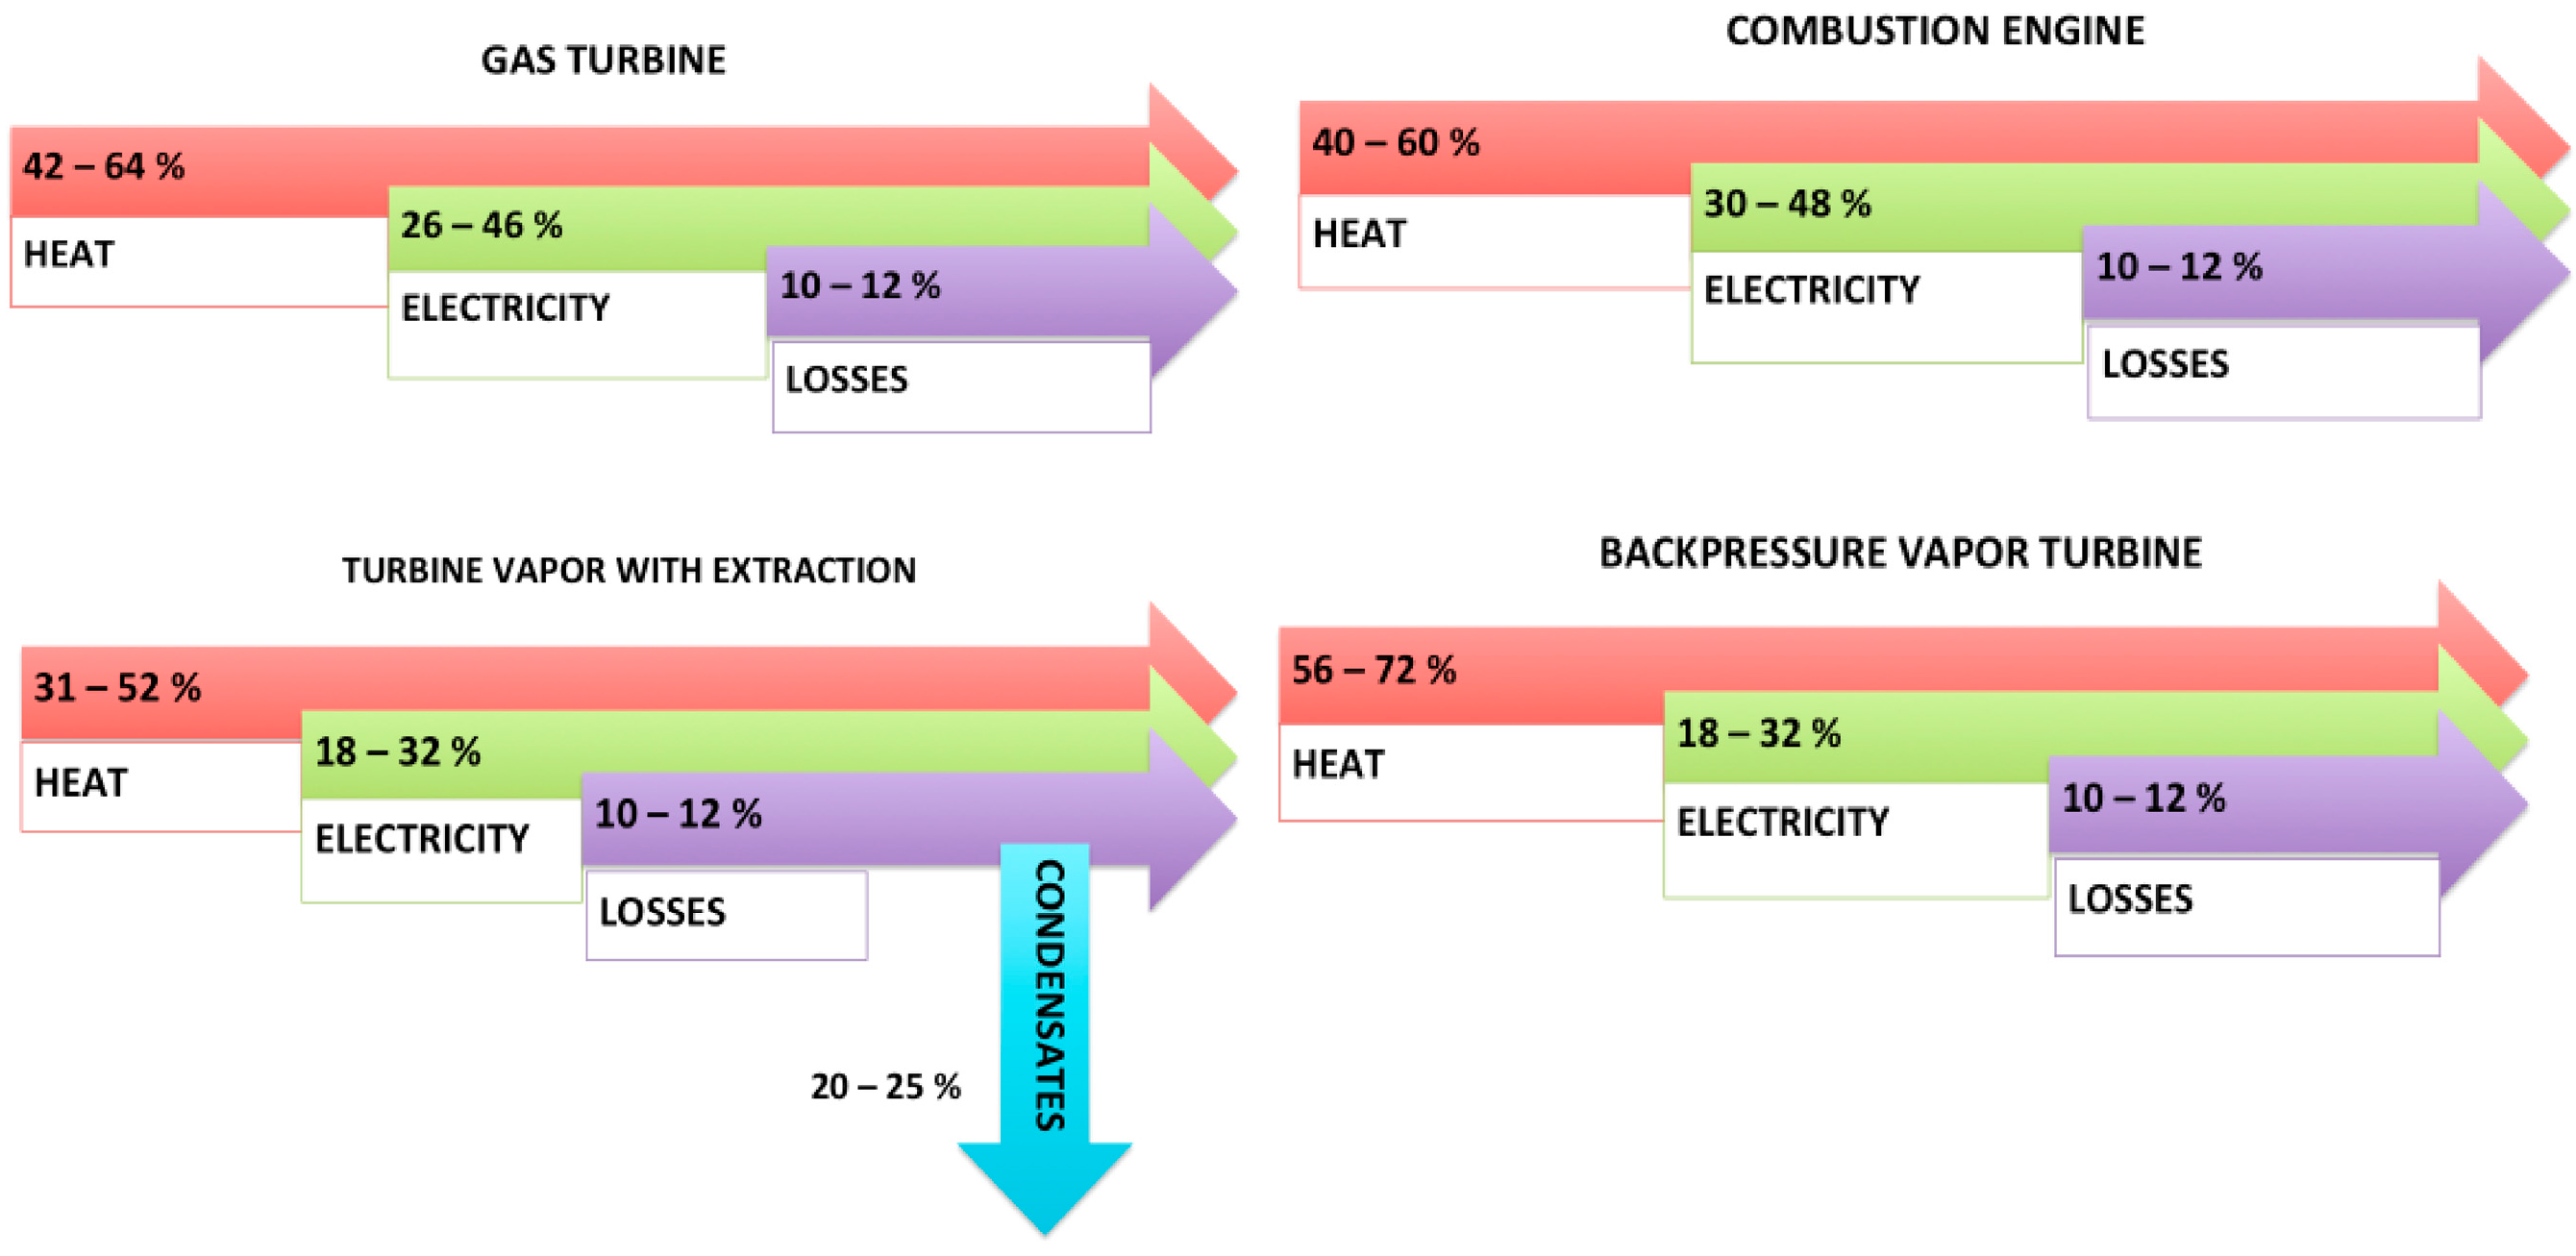
In conventional power plants, a large amount of heat is produced but not used. By using cogeneration, on the designed systems that can use heat, the efficiency of energy production can be increased starting from the current levels, ranging from 35% to 55%, to over 80% [14]. This increase in energy efficiency can be a result of spending less energy and reducing greenhouse gas emissions, when conventional methods of generating heat and electricity are compared separately [15,16]. Figure 2 shows the generation ranges and energy losses for the different cogeneration configurations. It is observed that in all four cases, a greater amount of heat, rather than electricity, is produced. Thus, the decision to choose one of the options is based on the technical-economic analysis of the process.
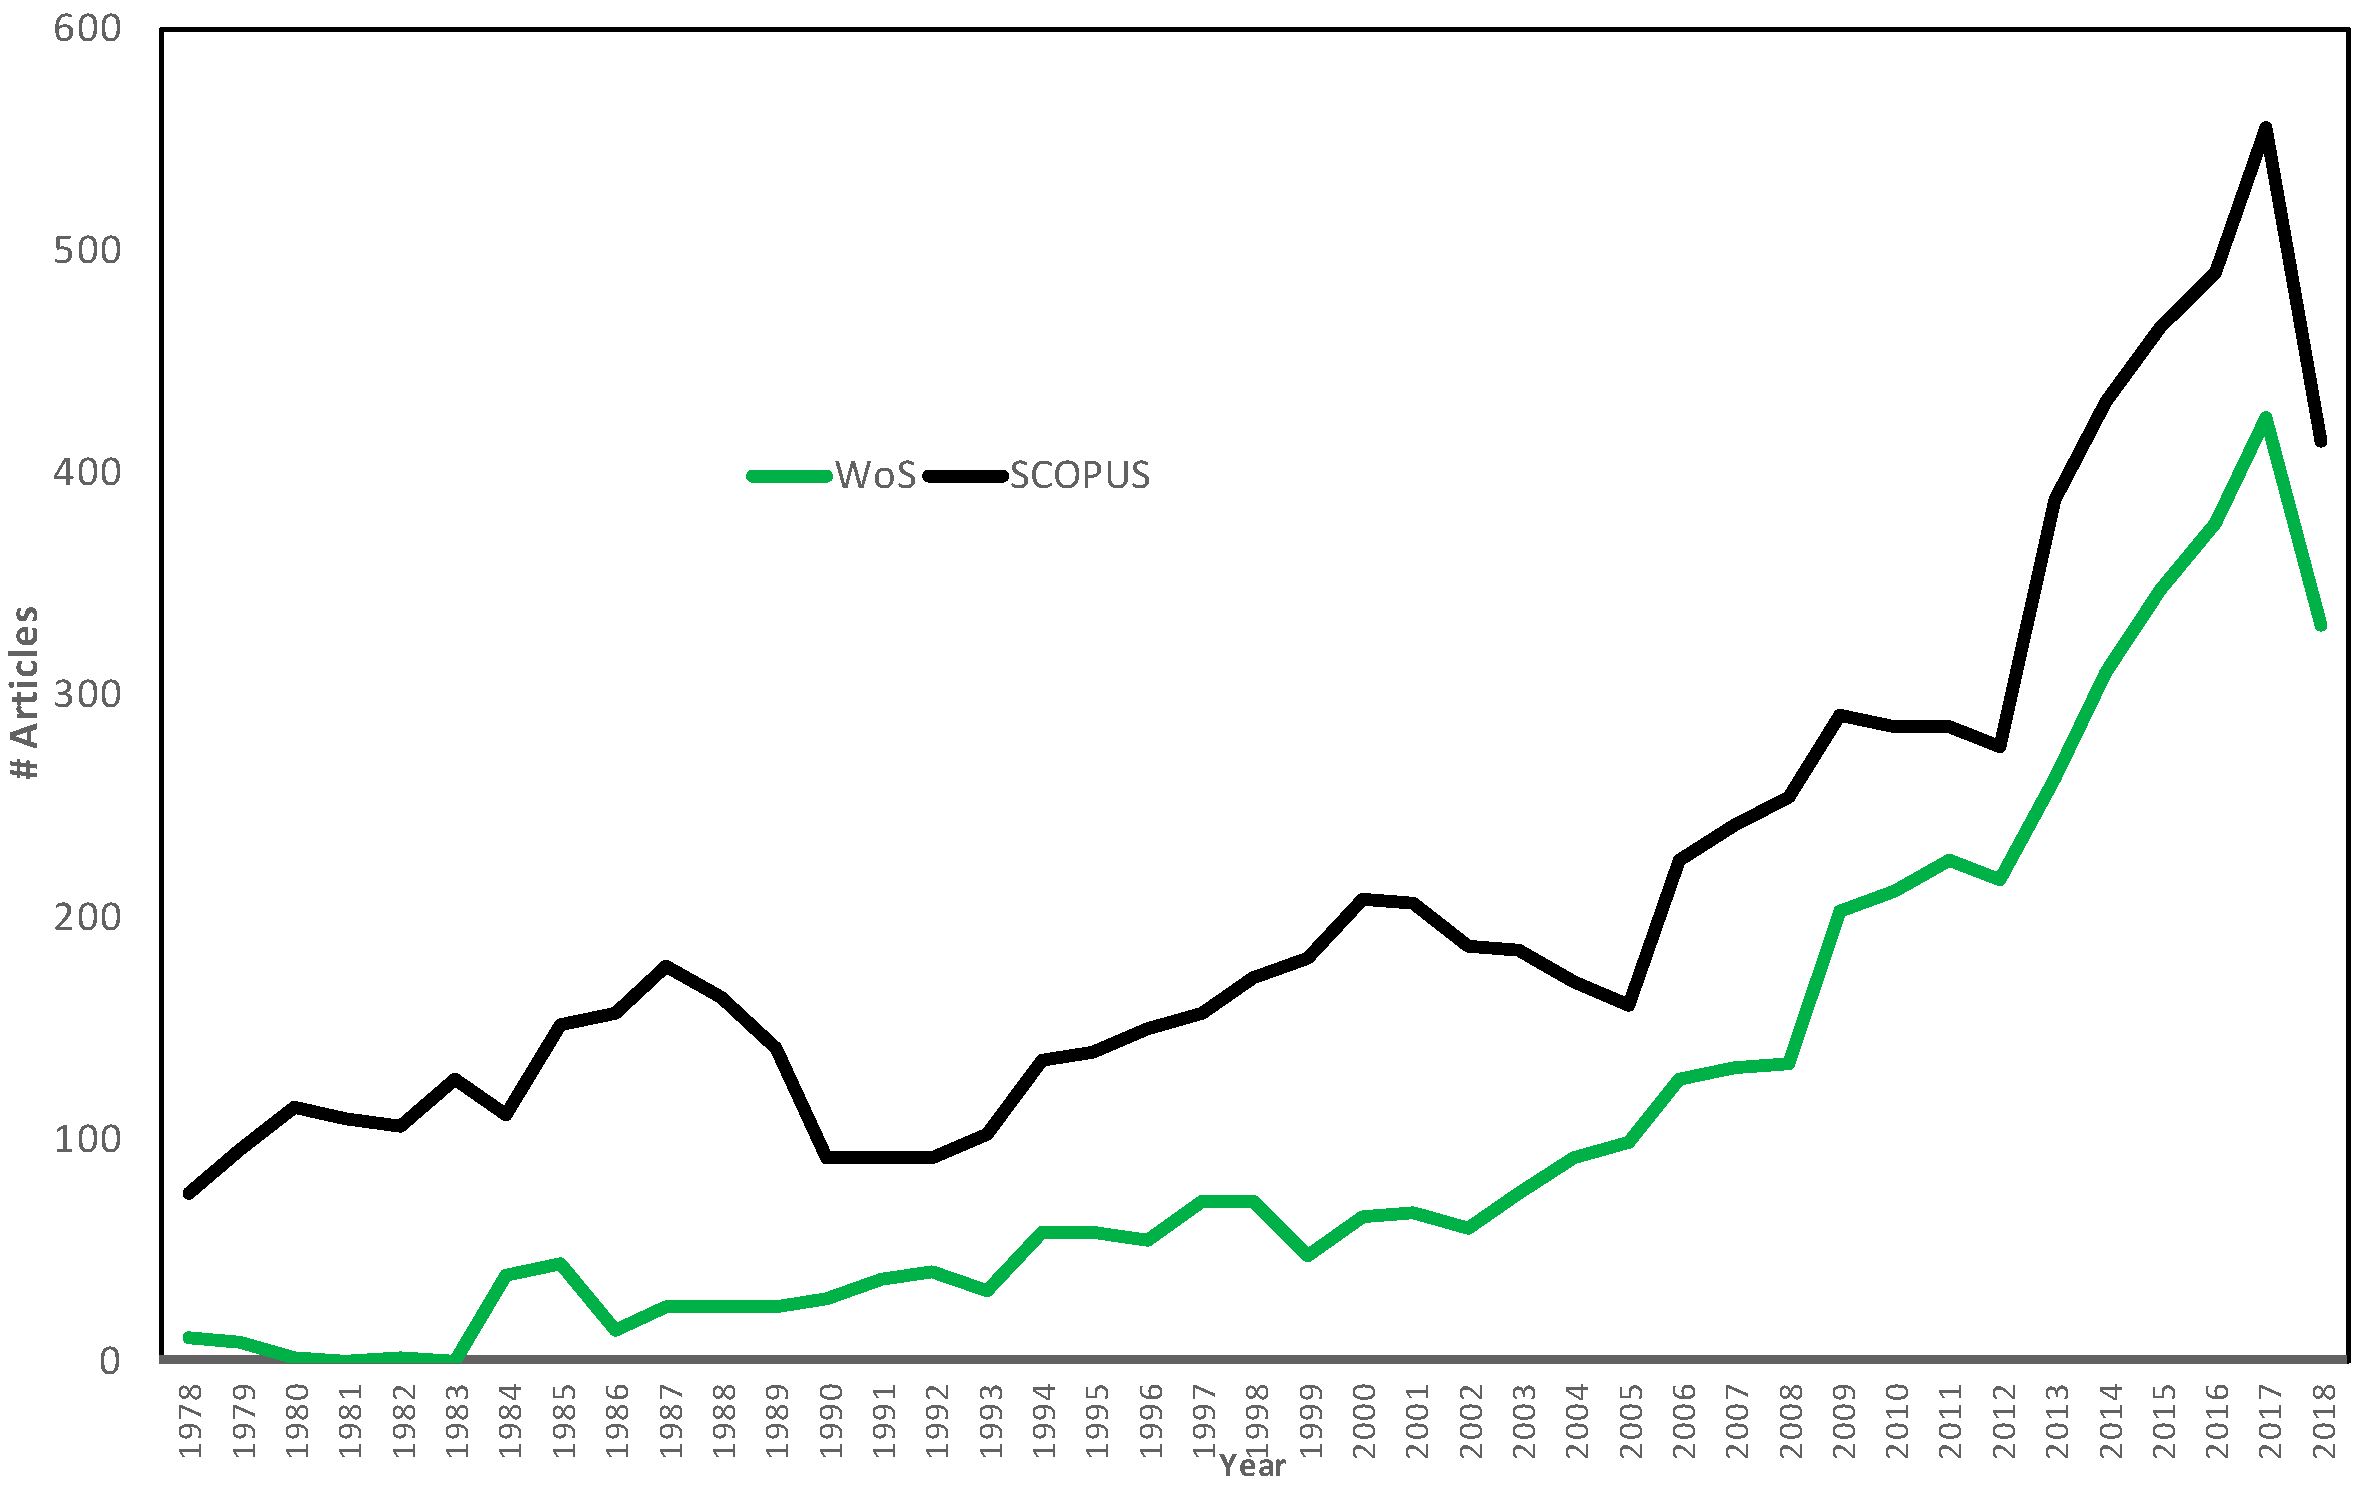
Several authors have investigated cogeneration systems. Figure 3 shows the number of publications from 1978 to 2018. These graphs are for the word “cogeneration” in the title, keywords and abstract. Some authors on the subject of cogeneration are: Jana and De [17], who propose a biomass-based cogeneration plant with CO2 capture. The thermodynamic modeling of the industrial plant was simulated by using ASPEN Plus; Ünal et al [18] have reported the techniques of optimization in the processes of trigeneration and poly-power generation; Shabbir and Mirzaeian [19] describe a feasibility study of the implementation of different cogeneration options to a paper mill to evaluate their energy saving potentials and economic benefits; Dincer and Zamfirescu [20] developed the concept of renewable-energy-based multigeneration options for producing a number of outputs, such as power, heat, hot water, cooling, hydrogen, fresh water, and so forth and discussed their benefits. Such options obviously led to an improved system performance and reduced the environmental impacts; Buoro et al [21] identified the optimal energy production system and its optimal operation strategy required to satisfy the energy demand of a set of users in an industrial area. A distributed energy supply system is made up of a district heating network, a solar thermal plant with long term heat storage, a set of Combined Heat and Power units and conventional components also, such as boilers and compression chillers; and Yu et al [22] propose a general evaluation method to compare the performance of six different approaches for promoting wind power integration. In consideration of saving coal consumption, reducing CO2 emissions, and increasing investment costs, the comprehensive benefits are defined as the evaluation index.
Current technology is making cogeneration cost-effective on increasingly smaller scales, which means that electricity and heat can be produced in neighborhoods, or even individual sites, in which cases the process is called micro-cogeneration [23]. Cogeneration applications in buildings include hospitals, institutional buildings, hotels, office and residential/housing buildings where several families live [24]. Thus, cogeneration systems for multifamily, commercial or institutional applications benefit from the thermal/electrical load diversity in the multiple loads required, which reduces the need for storage [25]. District energy systems reduce greenhouse gas emissions in two different ways: (i) In buildings, less efficient equipment is replaced by an efficient central power plant; and (ii) By producing electricity for the central grid which can replace, for example, coal and other sources of electricity that involve a large amount of greenhouse gas emission per each kWh [26]. Joelsson [27] determined district heating based on cogeneration of heat and electricity and bedrock heat pumps were found to be energy-efficient systems. The net emission of CO2 is dependent on the fuel, and the CO2 emissions from these systems are comparable to those from a wood pellet boiler, if biomass-based supply chains are used.
There are several publications about the cogeneration process in residential systems [25,28,29,30,31,32,33,34] (see Figure 3). Figure 4 shows the bibliographic mapping that connects the authors with the cited references. This was done with the search “Cogeneration AND Building”. The circumferences indicate the volume of publications made by the authors. The proximity between these circumferences and lines account for the research network on the subject. The 9 authors with the highest number of citations are highlighted. E.g., Tchanche et al [32] presents existing applications and analyzes their maturity. Binary geothermal and binary biomass combined heat and power (CHP) are already mature. Provided the interest in recovering waste heat rejected by thermal devices and industrial processes continues to grow, and favorable legislative conditions are adopted, waste heat recovery organic Rankine cycle systems will experience rapid growth in the near future. Esen and Yuksel [33] experimentally investigated greenhouse heating by biogas, solar and ground energy in the climate conditions in Elazig, Turkey. The greenhouse was constructed, and then the required heating load of the greenhouse was determined. For this purpose, biogas, solar and a ground source heat pump greenhouse heating system with a horizontal slinky ground heat exchanger was designed and set up. Chua et al [34] present a review of recent innovative cooling technology and strategies that could potentially lower the kW/R ton of cooling systems—from the existing mean of 0.9 kW/R ton towards 0.6 kW/R ton or lower.
Studies on the cogeneration process in Mexico have been carried out mainly in industrial areas [35,36,37,38,39]. Currently, despite the fact that the cogeneration process is considered an alternative to efficient and non-polluting energy generation, there is little scientific literature on cogeneration studies in buildings in Mexico, i.e., Fuentes-Cortes et al [40] presents a multi-objective optimization method for designing cogeneration systems in residential complexes and accounting for the involved uncertainty. The model accounts for satisfying the hot water and electric energy demands in a residential complex while minimizing the total annual cost and the associated greenhouse gas emissions. A housing complex in central Mexico is presented as a case study. Weber et al [41] compares the energy efficiency of two processes covering the thermal energy demand of a swimming pool: a CHP unit on the one hand, and a heat pump with internal combustion engine on the other. The energy losses for the CHP unit on-site are equivalent to half the losses caused by extraction and distribution of natural gas under current circumstances in Mexico.
Problem Statement
The problem is to determine the optimal configuration of a cogeneration system for a building. This configuration must meet the energy demands (electric and thermal), considering factors such as: operation scheme, size and type co-generator (turbine or combustion engine), capacity of an auxiliary thermal system (boiler) and energy purchase-sale scheme with the local company’s grid, along with minimizing the total annual energy cost and greenhouse gas (GHG) emissions associated with the consumption of fuels in the process. In this research, the thermal load required by the building’s facilities is much higher than the electric load, so to be able to comply with this, the electric energy produced will be divided into only what is absolutely necessary for the building, as well as for the sale to the electricity distribution company or sale to a private supplier under the current framework of the law in Mexico (since January 2015).
This research arises from recognition of the importance of the cogeneration process in Mexico. Therefore, it seeks to collect information from the analysis of the energy cogeneration system design applied to a housing building, using the computer tool Thermoflex 25 by Thermoflow© (Thermoflow Inc., Jacksonville, FL, USA).
The study contributes to the development of cogeneration in residential applications in warm and not so extreme climates. The study shows how to evaluate a cogeneration plant in a poorly-developed application in Mexico, because in the world, mainly in inhabited areas with colder and more extreme climates, cogeneration applications in apartment buildings are evaluated from a technical and economic point of view, and are very attractive for implementation. But in warmer regions such as Mexico City, this is not the case, since the need for hot and cold air are not as extensive as in cities on more northern latitudes. Hence, it is crucial to determine which cogeneration applications can be economically attractive, determining the values of economic variables and their prices-costs, in apartment buildings.
Knowing the technical, economic, and technological elements that help make cogeneration attractive for investment helps local regulators and governments design strategies for regulations, norms, and supports its development, accurately locating where and what type of support is required, given that these studies show where technical, economic, and even environmental variables are most sensitive, to give attractive results to investors or apartment owners to build and operate the plants.
This in turn favors the technological development of the equipment used by diversifying its applications and generating more market for the commercialization of equipment and services, which, in the long run, lowers costs and helps to increase the benefits of the projects, and also contributes to helping the emission reduction goals to be achieved on the regional, nation, and global scales by having more efficient energy sectors, supported by the contribution that cogeneration can make in applications for housing in countries and regions with warmer climates and not so extreme. And in particular for Mexico, it can also help accelerate the results of government programs for the development of cogeneration and exploitation of cogeneration potential, which has been sought after and promoted in Mexico since 1994, and has not yielded the desired results. This type of study and its results can contribute to providing certainty that cogeneration projects can be successfully evaluated and carried out.
2. Materials and Methods
In the first stage, the current legal framework for cogeneration in Mexico is thoroughly reviewed. This is quite important, as some conceptual design considerations of the cogeneration plant will come from this framework. Some of these considerations are the marketing and sale of the electric surplus, the availability and fees that pertain to the type of fuel as well as tax incentives and aid in fee payments, along with everything related to permits and procedures to follow for the implementation of the project, which will be reflected, firstly, as costs and economic savings in the initial stage of the project. Moreover, the available technical information on the property is collected in order to characterize the demand and consumption of the building’s known average electrical and thermal energy; later, the thermal energy requirements are determined by estimating the demand and consumption of the building, based on the type of apartments, the number of people who could live in them, geographical conditions of the site and usage and customary habits of the potential tenants, keeping in mind the recommendations made by American Society of Heating, Refrigerating and Air-Conditioning Engineers (ASHRAE), equipment manufacturers and developers of this type of project. In this study, the Thermoflow© software was used, which allows the estimation of the operating conditions based on the building’s energy requirements. Therefore, in order to carry out the Thermoflow© modeling of the building’s cogeneration process, it is necessary to know the physical characteristics of the apartments and buildings, the number of users, energy consumption habits, environmental conditions, type of fuel available and current energy regulations. Then, using Thermoflex 25 software by Thermoflow©, two processes are proposed that comply with the building’s thermal and electrical requirements. Finally, a feasibility and viability analysis of both proposed processes is carried out.
For the economic analysis, the value of money over time is considered, and it is necessary to define the discount rate. It is common to improperly use the interest rate paid for the debt as a discount rate, instead of a higher value that considers the opportunity cost for the investor; this is called the ‘Minimum Attractive Rate of Return’ (TREMA) or ‘cost of capital’. This rate can be calculated as the rate that would be earned in an investment without risk (for example, Libor or CETES in Mexico), plus a premium that defines the risk level of the project. This methodology is typical for assessing projects feasibility [19,35].
2.1. Cogeneration Processes Simulation
Processes simulation in engineering is the digital representation of a set of unit operations, which allows determining process variables (flow, temperature, pressure, energy and power) through the use of computational tools. It also makes it possible to study existing processes in a faster, more economic and thorough way than in a real plant. The simulation of the cogeneration process was carried out in this research using the Thermoflex 25© software from Thermoflow©, applied to a residential building. This program has been mainly used in cogeneration processes in industry [42,43,44,45,46]. In the Thermoflex simulation of this work, the planned cogeneration plant will simultaneous produce of electrical and thermal energy. Its production capacity will be designed to cover the entire thermal demand. Thus, this will make the electrical generation greater than the actual demand of the apartment building; therefore, the level of electric surplus and its possible economic income, benefiting the project due to its sale, must be determined. The plant will run uninterrupted 24 h a day, 365 days a year at 100% production capacity on-site and with the plant factor calculated for the proposed installation based on the equipment and the best operating practices. Moreover, in order to cover the scheduled and possible non-scheduled stoppages, the current fee structure provides for contracting an electrical backup service in the public network, with its corresponding cost which will be integrated into the operational cost of the cogeneration plant and into the economic evaluation of the project.
The simulations allow us to determine the performance of the cycle with different sizes of gas turbine and combustion engines. Both technologies are the most used in the cogeneration process. The gas turbine and the combustion engine chosen for the final analysis of the cycle differed mainly in the parameters, i.e., gross power, CHP efficiency, air stream, fuel stream, emissions of CO2 and fuel consumption. These parameters have been evaluated using Thermoflex 25© software, as given by the equations described above.
The theoretical foundations of these simulations are based on thermodynamics and heat transfer. Mainly, energy and mass balances are considered in system flow. For the calculation of thermal energy fluxes in the non-phase-changing fluid, the sensible heat equation is considered [47]:
where F is the mass flow (kg/s), C is the specific heat (kJ/kg·°C), ΔT is the temperature change of the fluid (°C) and E is the energy flow that absorbs or dissipates the fluid (kW). The determination of the energy flows is made based on the maximum requirement possible by all of the users, whereas for the calculation of the thermal energy flows in which the fluid changes phase, the latent heat, along with the sensible heat equation [47], are used:
where ΔH is the latent heat of the fluids (kW) and ECF is the energy flow that absorbs or dissipates the fluid considering the phase change (kW). The determination of the energy flows is made based on the maximum requirement possible by all of the users. Furthermore, to determine the energy content of a flow, the following equation is considered valid:
where h is the specific enthalpy (kJ/kg) and H is the energy content (kW) of the flow. On the other hand, the following relationship is used to determine the power of a unit present in the cogeneration process:
where Δh is the enthalpy change of the fluid (kW) and is the power of the equipment (kW). Furthermore, the equation for determining pump power () is derived from the mechanical energy balance:
where ΔP is the pressure change (Pa) and ρ is the density (kg/m3). Equation (6) represents the energy balance of heat exchangers:
where ΔhH is the specific enthalpy change of hot fluid (kJ/kg), ΔhC is the specific enthalpy change of cold fluid (kJ/kg), FH is the mass flow of hot fluid (kg/s), FC is the mass flow of cold fluid (kg/s) and is the heat flow (kJ/s) transferred from the hot fluid to the cold fluid.
E = FC·ΔT,
ECF = F·C·ΔT + ΔH,
H = F·h,
Other important energetic variables in the cogeneration cycles are energy intensity (kW/kg), which relates the amount of energy required to produce a mass unit of product, the Q/E ratio that specifies the ratio of the thermal and electrical energy needed to cover the requirements of the building and the efficiency of the cycle that indicates the relation between the energy demanded and the energy required by the cogeneration system.
The cogeneration is a process that is generates two products (thermal energy and electricity). The typical parameters used to determine the performance of a cogeneration plant are [48,49,50]: electrical efficiency (Equation (7)), thermal efficiency (Equation (8)) and total efficiency (Equation (9)).
where Qe (kWh) is the gross generation of electricity, Qh (kWh) is the net generation of heat Qf (kWh) is the fuel used.
In the Thermoflow software, the plant model is built from the inside out. The users construct the subsystems from their basic elements. Then, the overall scheme emerges from the interconnected subsystems. Finally, the lowest level decisions are made, such as the fine details within the various subsystems. The structural approach automatically considers all interactions between subsystems. It also allows many lower lever inputs to be logically generated by the program, depending upon the user’s higher level selection. At any level, however, the user is free to alter any or all of the program’s automatic selections.
2.2. Case Study
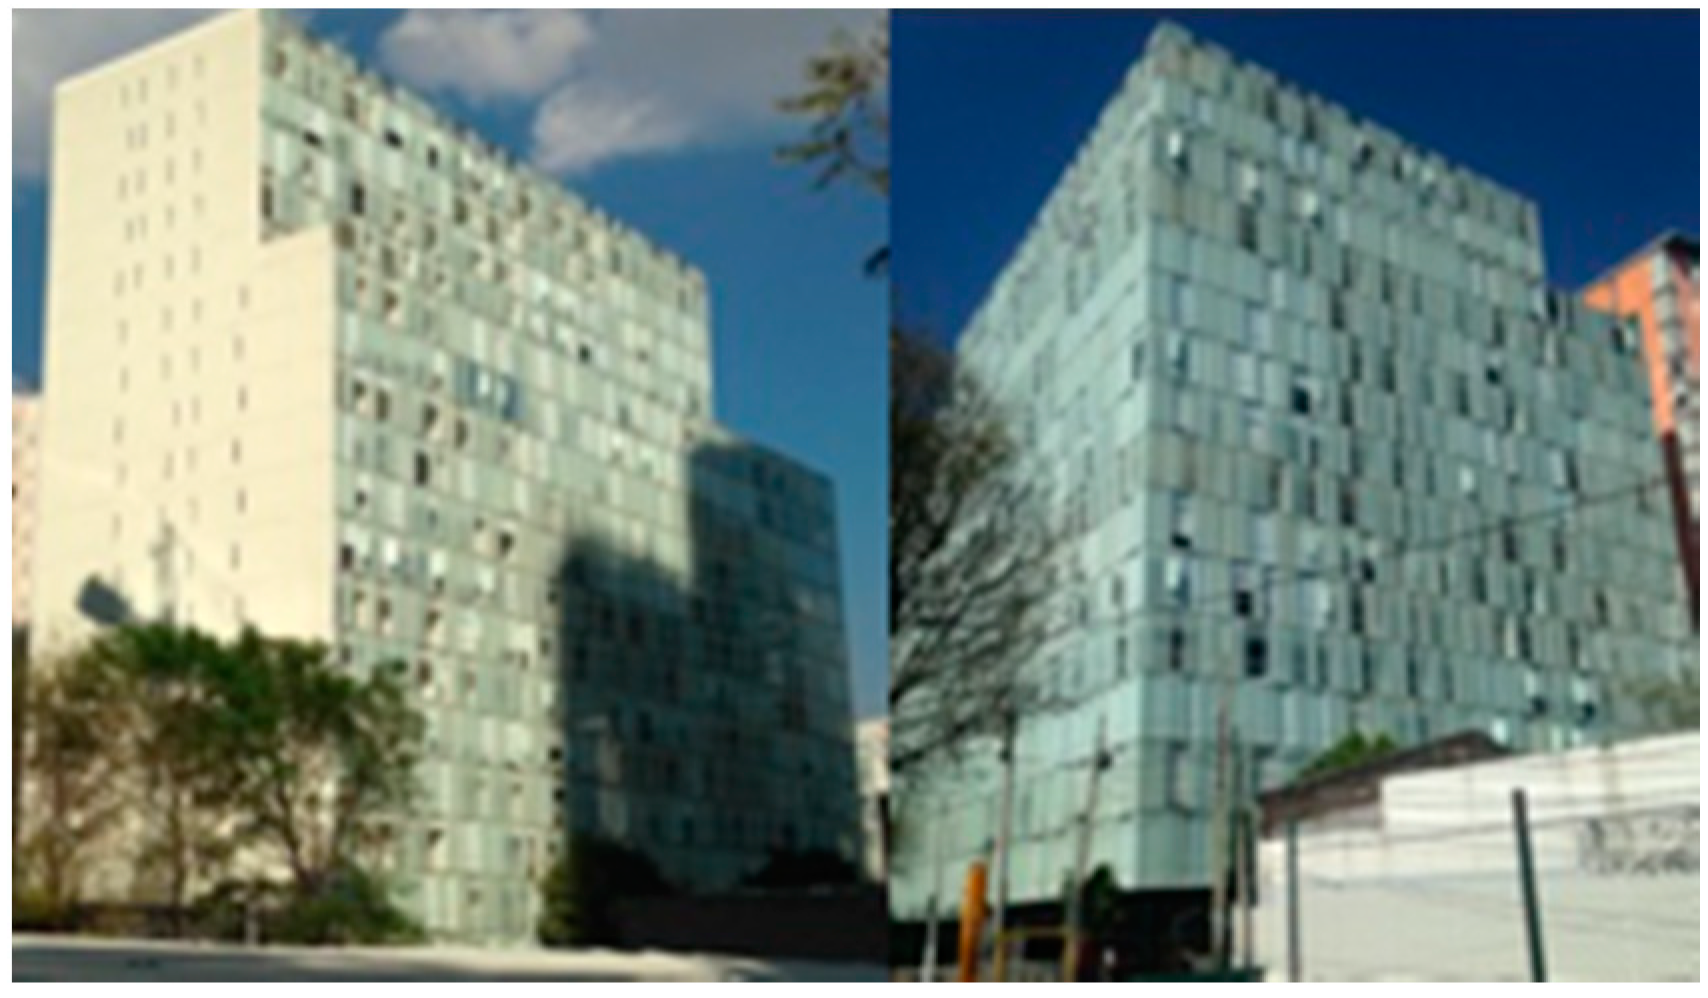
In this research, the design of a cogeneration system for a building was analyzed. The building has electrical and thermal energy requirements (hot water and steam) in its apartments, pool and event hall. The building is located in a high-income area (Polanco) in Mexico City, so the occupants of the property have a high socioeconomic status. They are “L” shaped towers (see Figure 5); towers A and B have 19 and 14 floors, respectively. Their total height is approximately 52 m. There are 5 basement levels with a total of 528 parking lots, 233 cellars and an engine room. On the ground floor there are administrative offices, rooms with electric and gas meters, a gymnasium, entertainment rooms, an indoor pool and green areas.
Medina et al. [51] describe the detail of the building’s infrastructure. The building’s apartments were still under construction at the time of the elaboration of this study; therefore, the electric consumption, the thermal demand and its consumption were estimated according to the average demand and consumption practices in apartments. The building has 233 apartments which are distinguished by the surface, number of people and number of showers (see Table 1).
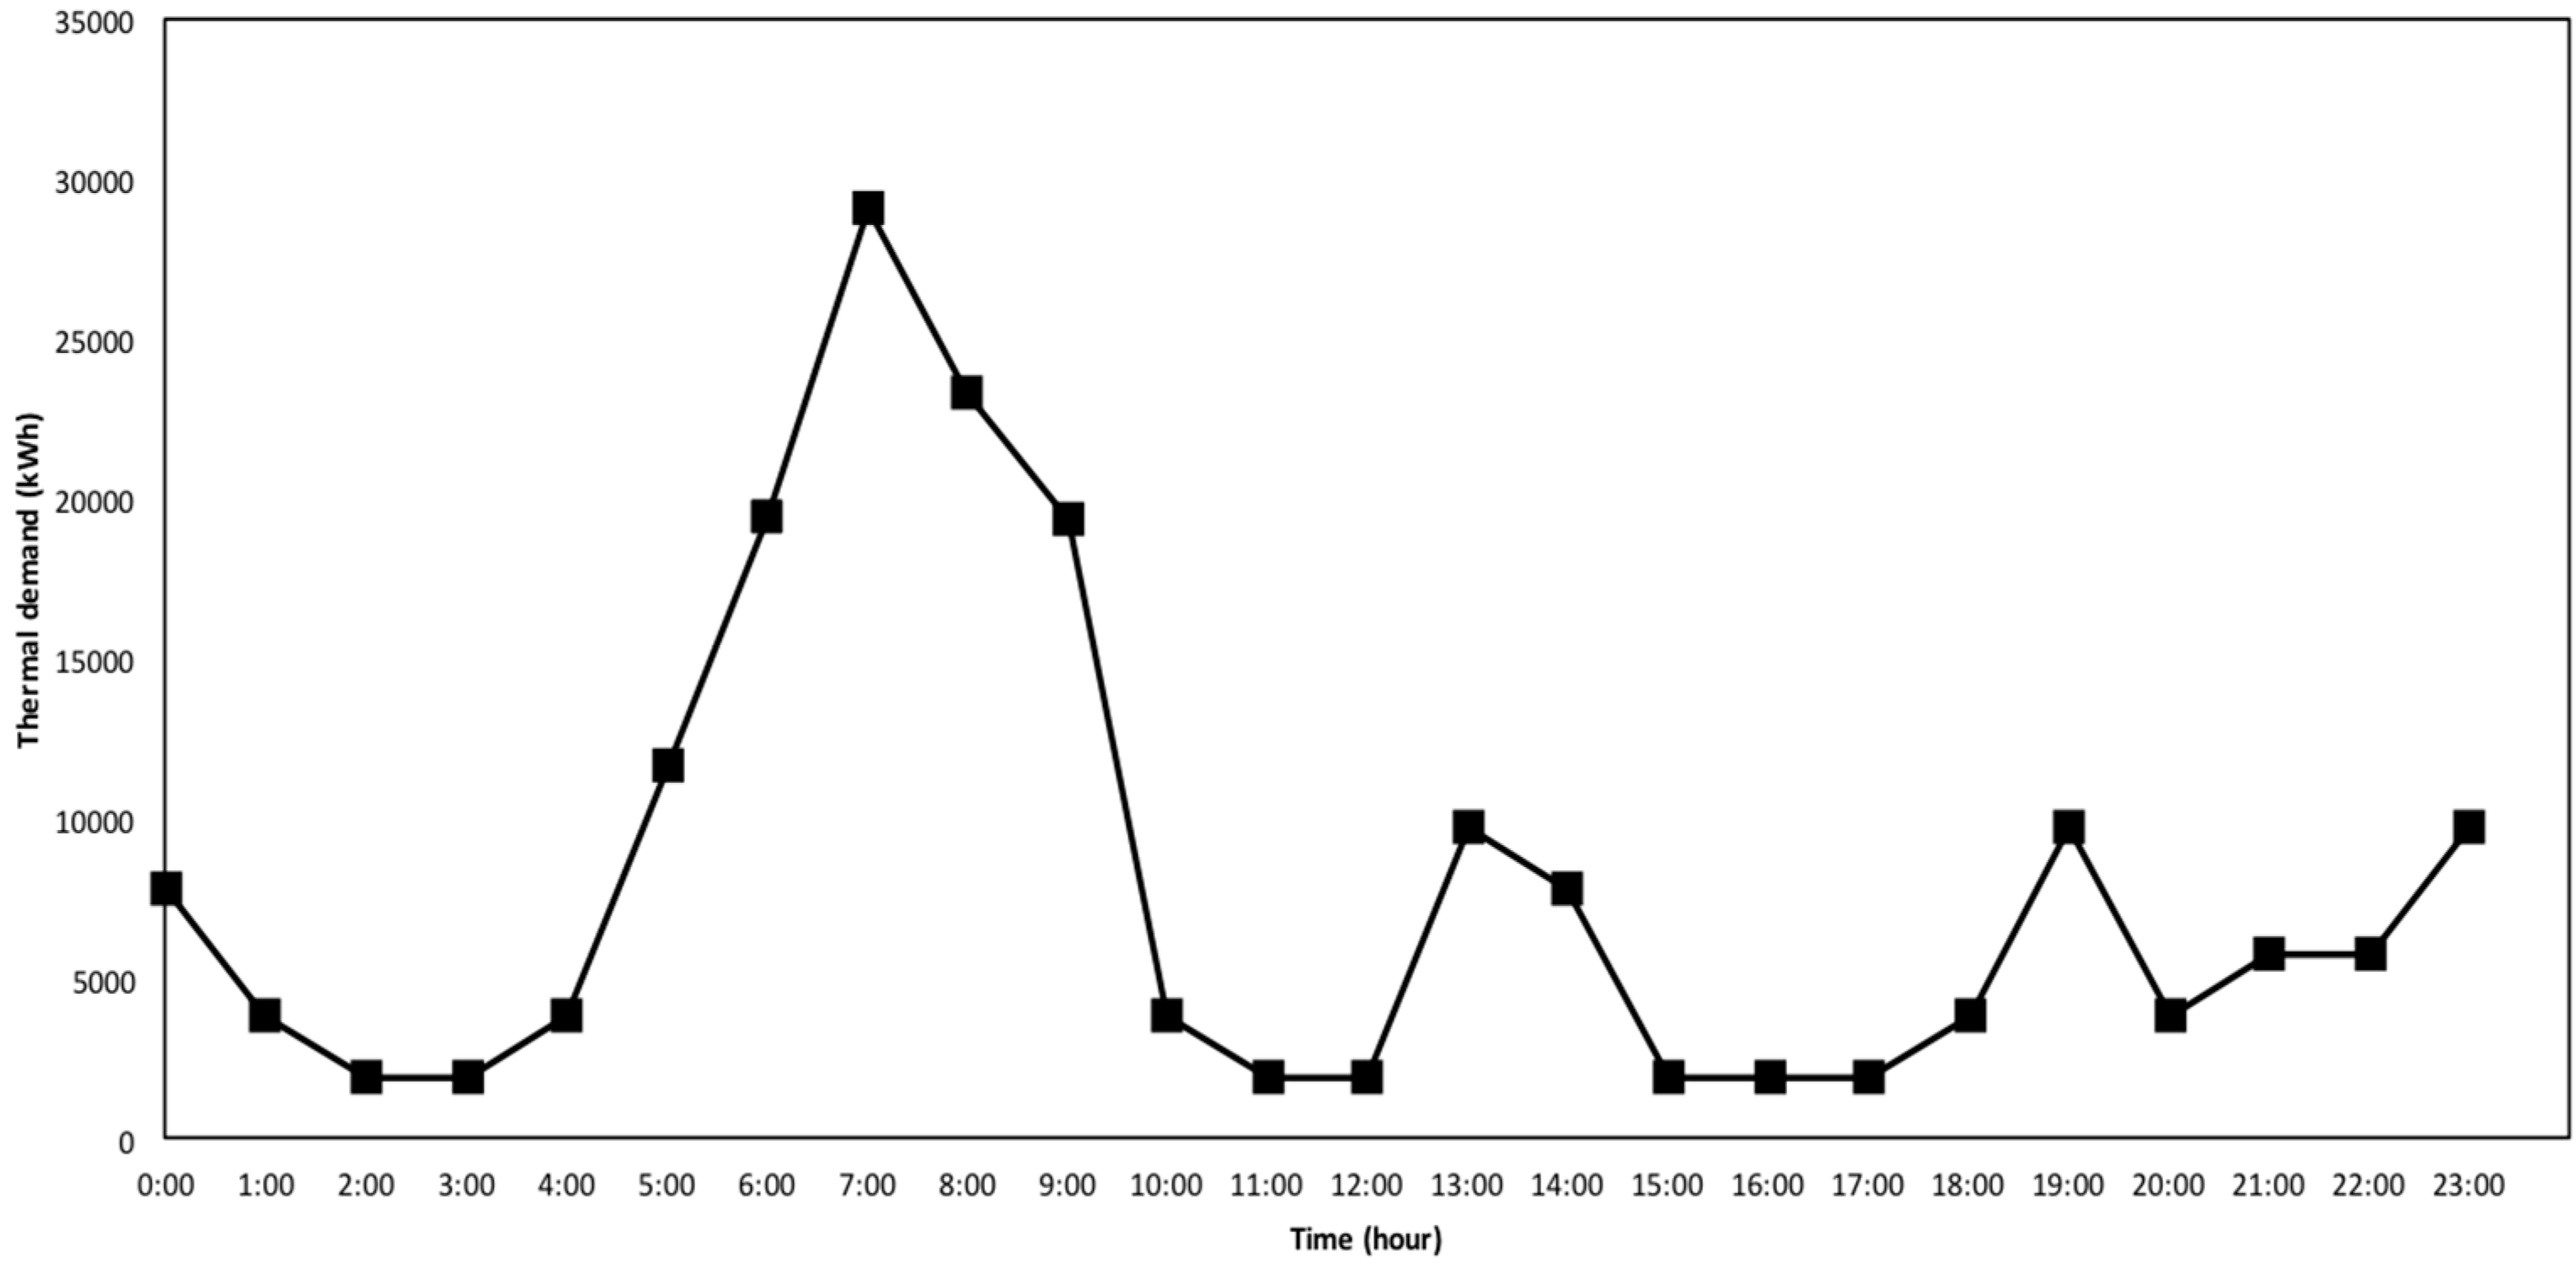
By studying the energy conditions of the building, it was determined that it is necessary to supply it with thermal energy by way of steam and hot water, electric energy and cold and hot air thermal energy; therefore, throughout the day, users will have, at their disposal: Hot water service in the showers and swimming pool, and hot and cold air conditioning, all of which improve their comfort inside the property. In this case, the cogeneration plant will be able to sell surplus electrical energy, with additional benefits such as those provided by green certificates. The thermal demand is estimated according to the frequency of use given to the facilities (see Figure 6). It was considered that users would take showers mainly in the morning and a small fraction of them at night. This is the reason for the maximum values detected. It is important to highlight that a fraction of those who bathe in the morning during the summer will do so at night during the winter. On the other hand, the pool will be active 24 h a day, the kitchen sink will be used in the middle of the day and a rarely at night, and the washing machine will be used in the morning and evening. Finally, the trend in air conditioning usage has been estimated for both summer and winter.
Table 2 shows the thermal energy demand annual. Based on the lifestyles of the building users, a sharp decrease is shown during the following periods: the last week of March and the first week of April, as well as the three first weeks of August. This represents the holiday period, which is in line with the owners’ standard of living, since they leave their apartments during these periods. Guelpa et al [52] examined the effects on the total load that can be obtained by adopting management strategies such as variation in the thermal request profile of the buildings or installation of local storage systems. Results show that even in the case only small changes being applied, reductions in annual primary energy consumption up to 0.4% can be obtained without any additional investment cost.
Figure 7 shows the building’s thermal hot and cold-water requirements, as well as cold air. This simulation was carried out with the Thermoflow© software which solves the mass and energy flows in detail. A summary of the most important energy requirements for the process is shown in Table 3.
The installed load of the building, based on the information reported by Medina et al. [51], is: contacts 35%, pumps 25%, lift force 14%, air force 14%, lighting common services 6%, parking lighting 3% and others 3%. It is observed that electricity is consumed mainly in plugs, pumps and elevators. This coincides with reported by Ali [8]; described in the introduction.
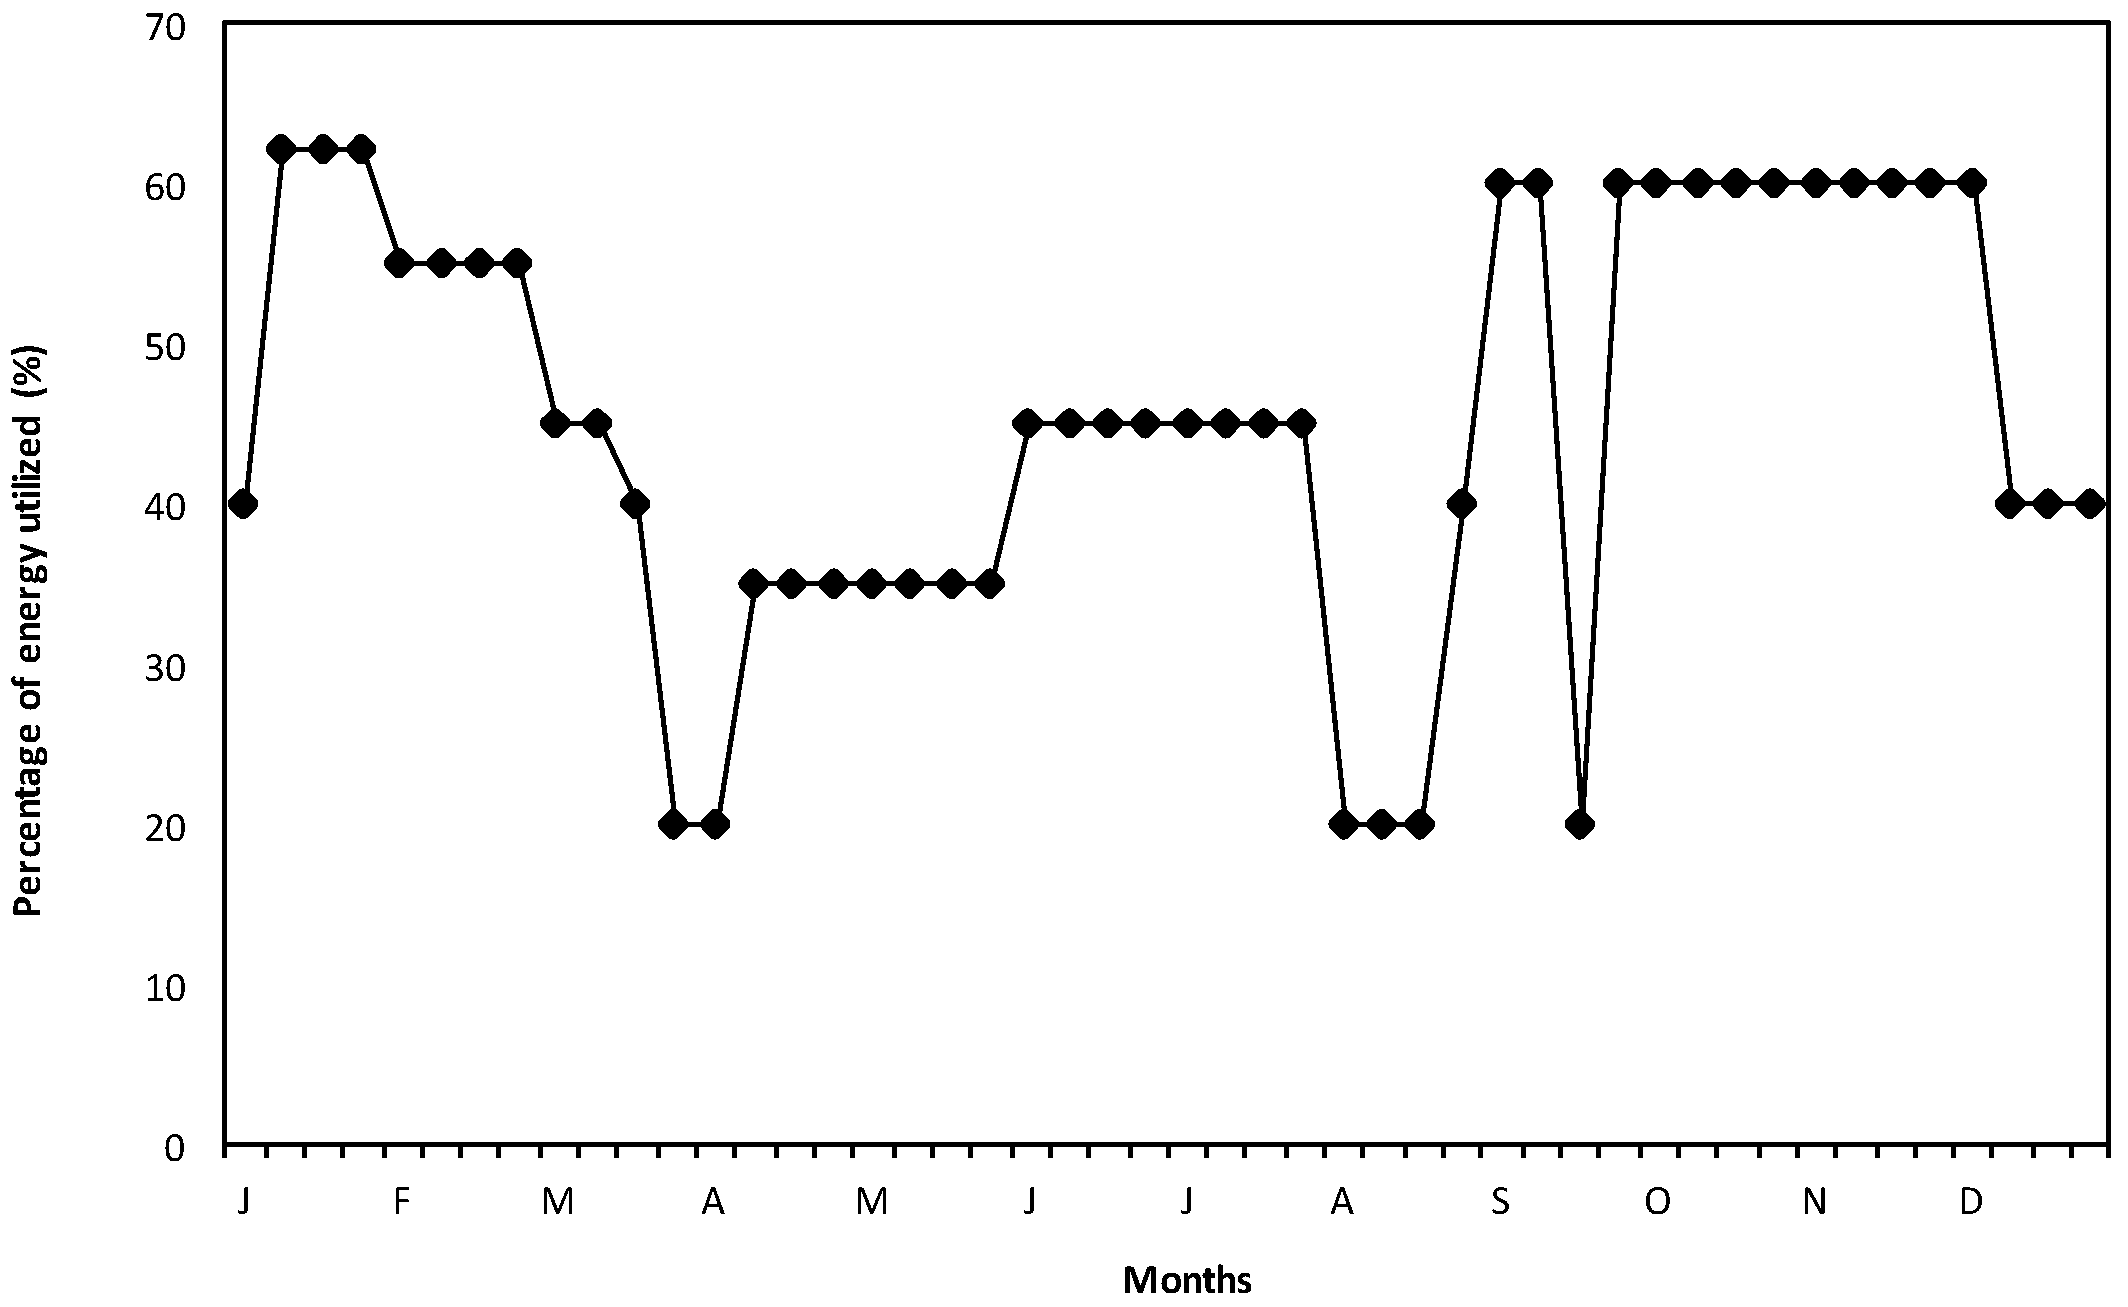
In an average day, there are two periods of greater electricity consumption (7:00–9:00 h and 19:00–21:00 h), which do not come close to the installed load or the maximum possible consumption of electricity, i.e., in the case that the building’s entire electrical installation is working. On the other hand, Figure 8 shows that the electrical demand is between 19 and 62% of the installed load. The estimation of the annual electrical requirements was calculated based on the users’ behavior with regards to their permanency in the building during the year.
3. Results and Discussions
Energy efficiency should be understood as the intelligent use of energy, and not only as a decrease in energy consumption. That is to say, in the case of a building, residents should perform their activities using energy only at the time that it is absolutely necessary, without affecting their comfort and well-being.
In a cogeneration project, it is necessary to know the industrial context in which the process will be installed. Other authors [53,54,55,56] have also considered this prior information, i.e., to know in advance whether it is a manufacturing industry or a commercial building or a public building and establish the type of fuel to be used. Then, it is necessary to have the electrical requirements clearly quantified in order to define the electric demand profile of the process. On the other hand, it is necessary to establish the thermal requirements, i.e., hot water for showers, bathroom and kitchen sinks, or any other industrial use, as cold and/or hot water for air conditioning, water vapor for higher thermal requirements, such as large swimming pools. Once the above is defined, the electricity and natural gas fees for the central region of the country must be considered in the project, which in this case means using the current rates in Mexico City. Finally, it is also important to be informed of the environmental norms and regulations, techniques and the legal framework that will affect the decisions made during the project.
3.1. Choices of Cogeneration Systems
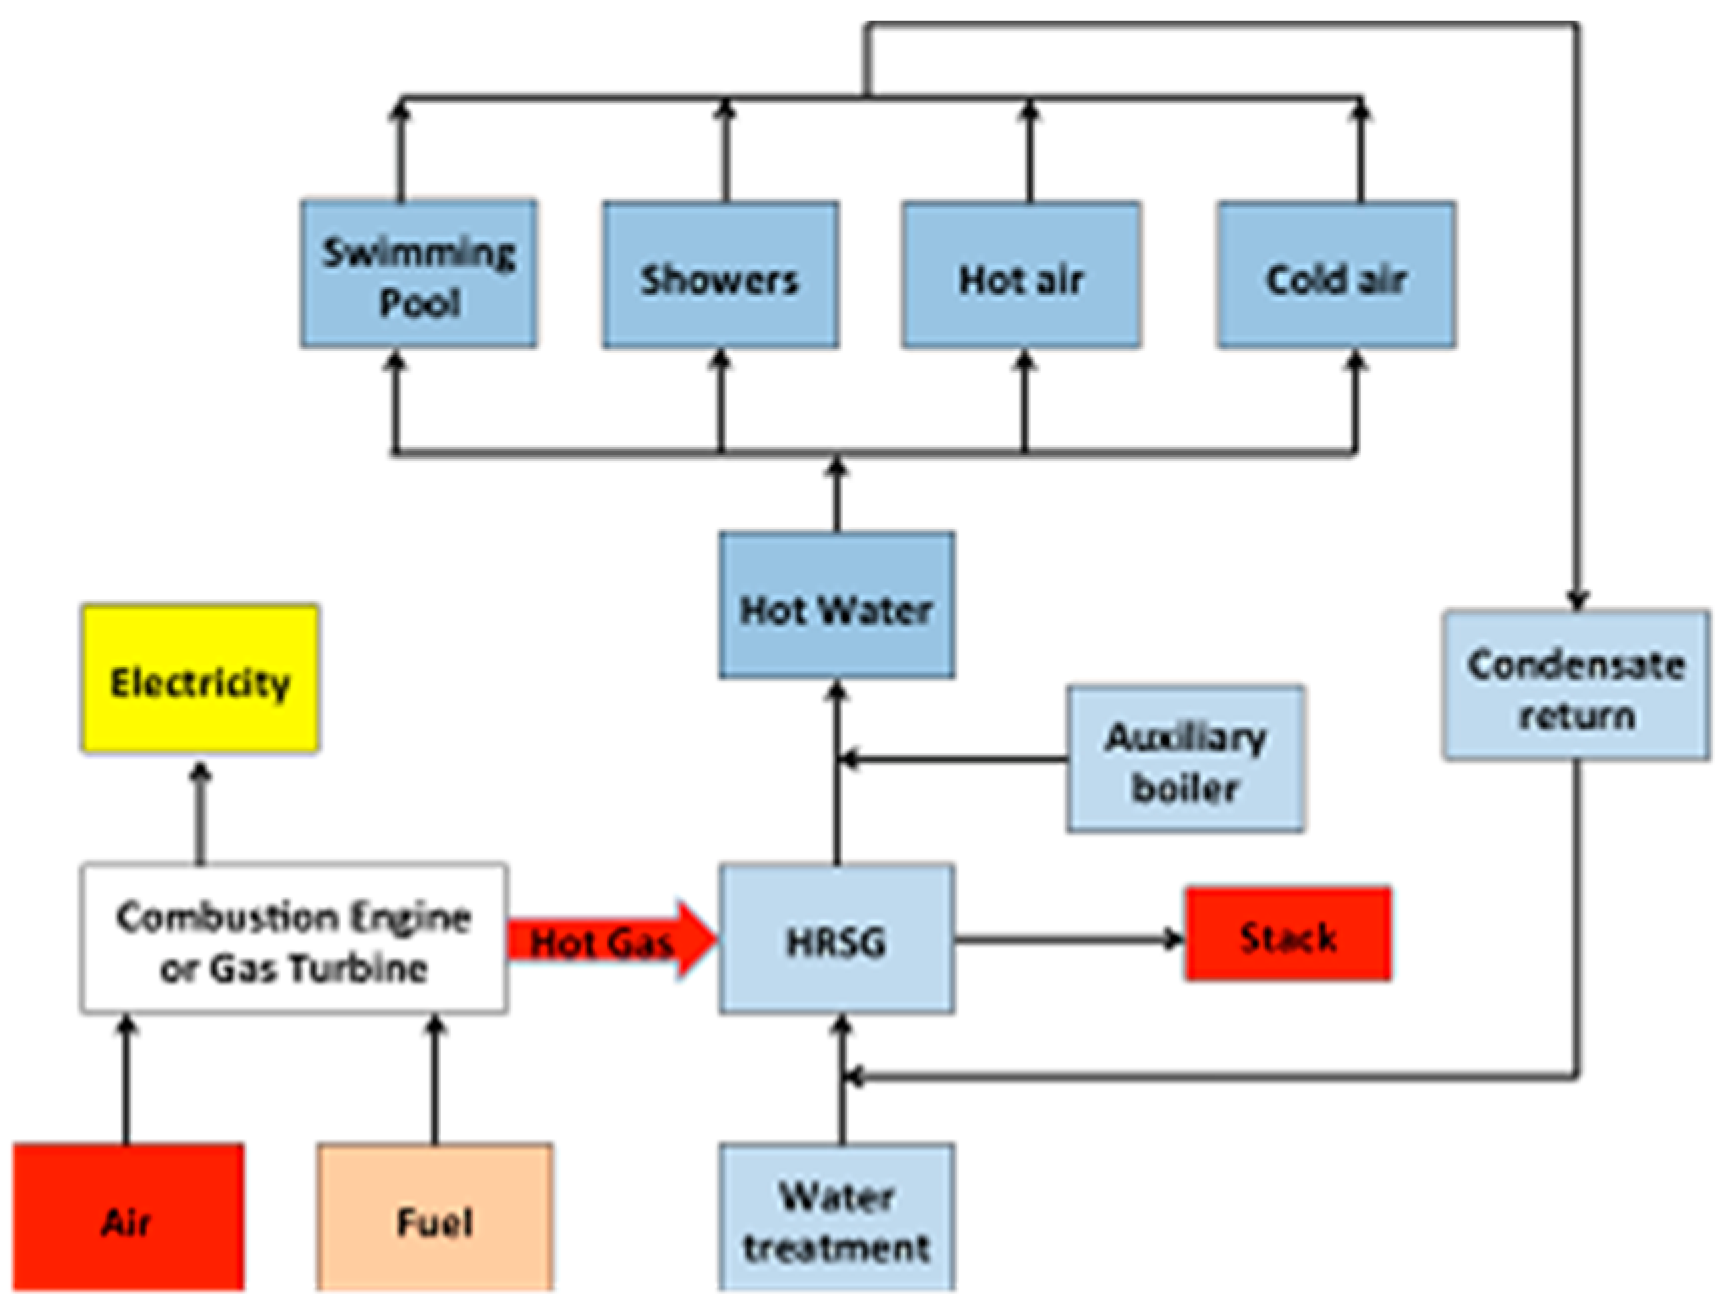
In this research two design process proposals were made: alternative A, which is based on combustion engines (EC process), and alternative B, which uses a gas turbine (GT process). Both comply with the basic conceptual model of a cogeneration plant, which is detailed in Figure 9.
Figure 9 shows that an internal combustion engine or a gas turbine will produce electricity and feed hot gas/air to the heat recovery steam generator (HRSG) in order to generate steam and hot water necessary for the pool, showers, toilets, washing machines, sinks and air conditioning systems. The generation of electricity will be distributed by a board to a system against fire, air conditioning, electrical system, auxiliary and substations, among others. The HRSG system will provide water at 133 and 99 °C. For the generation of cold air, a chiller of at least 300 tons of refrigeration is used. For both hot air and cold air, fan and coils are used as an air conditioning system. Once the water flow has passed through the corresponding stage, condensate recovery is performed.
The system will be installed in the basement to avoid interfering with the facilities at the top of the building. This will make the distribution of the thermal resource via variable speed pumps or hydropneumatics systems, to avoid the tanks in the highest part of the building. Regarding the electrical part, the system will be coupled to the current electrical connection, in order to connect the electric backup service in the public network. By means of a general board, the electrical load will be distributed to the different devices and substations that feed the building.
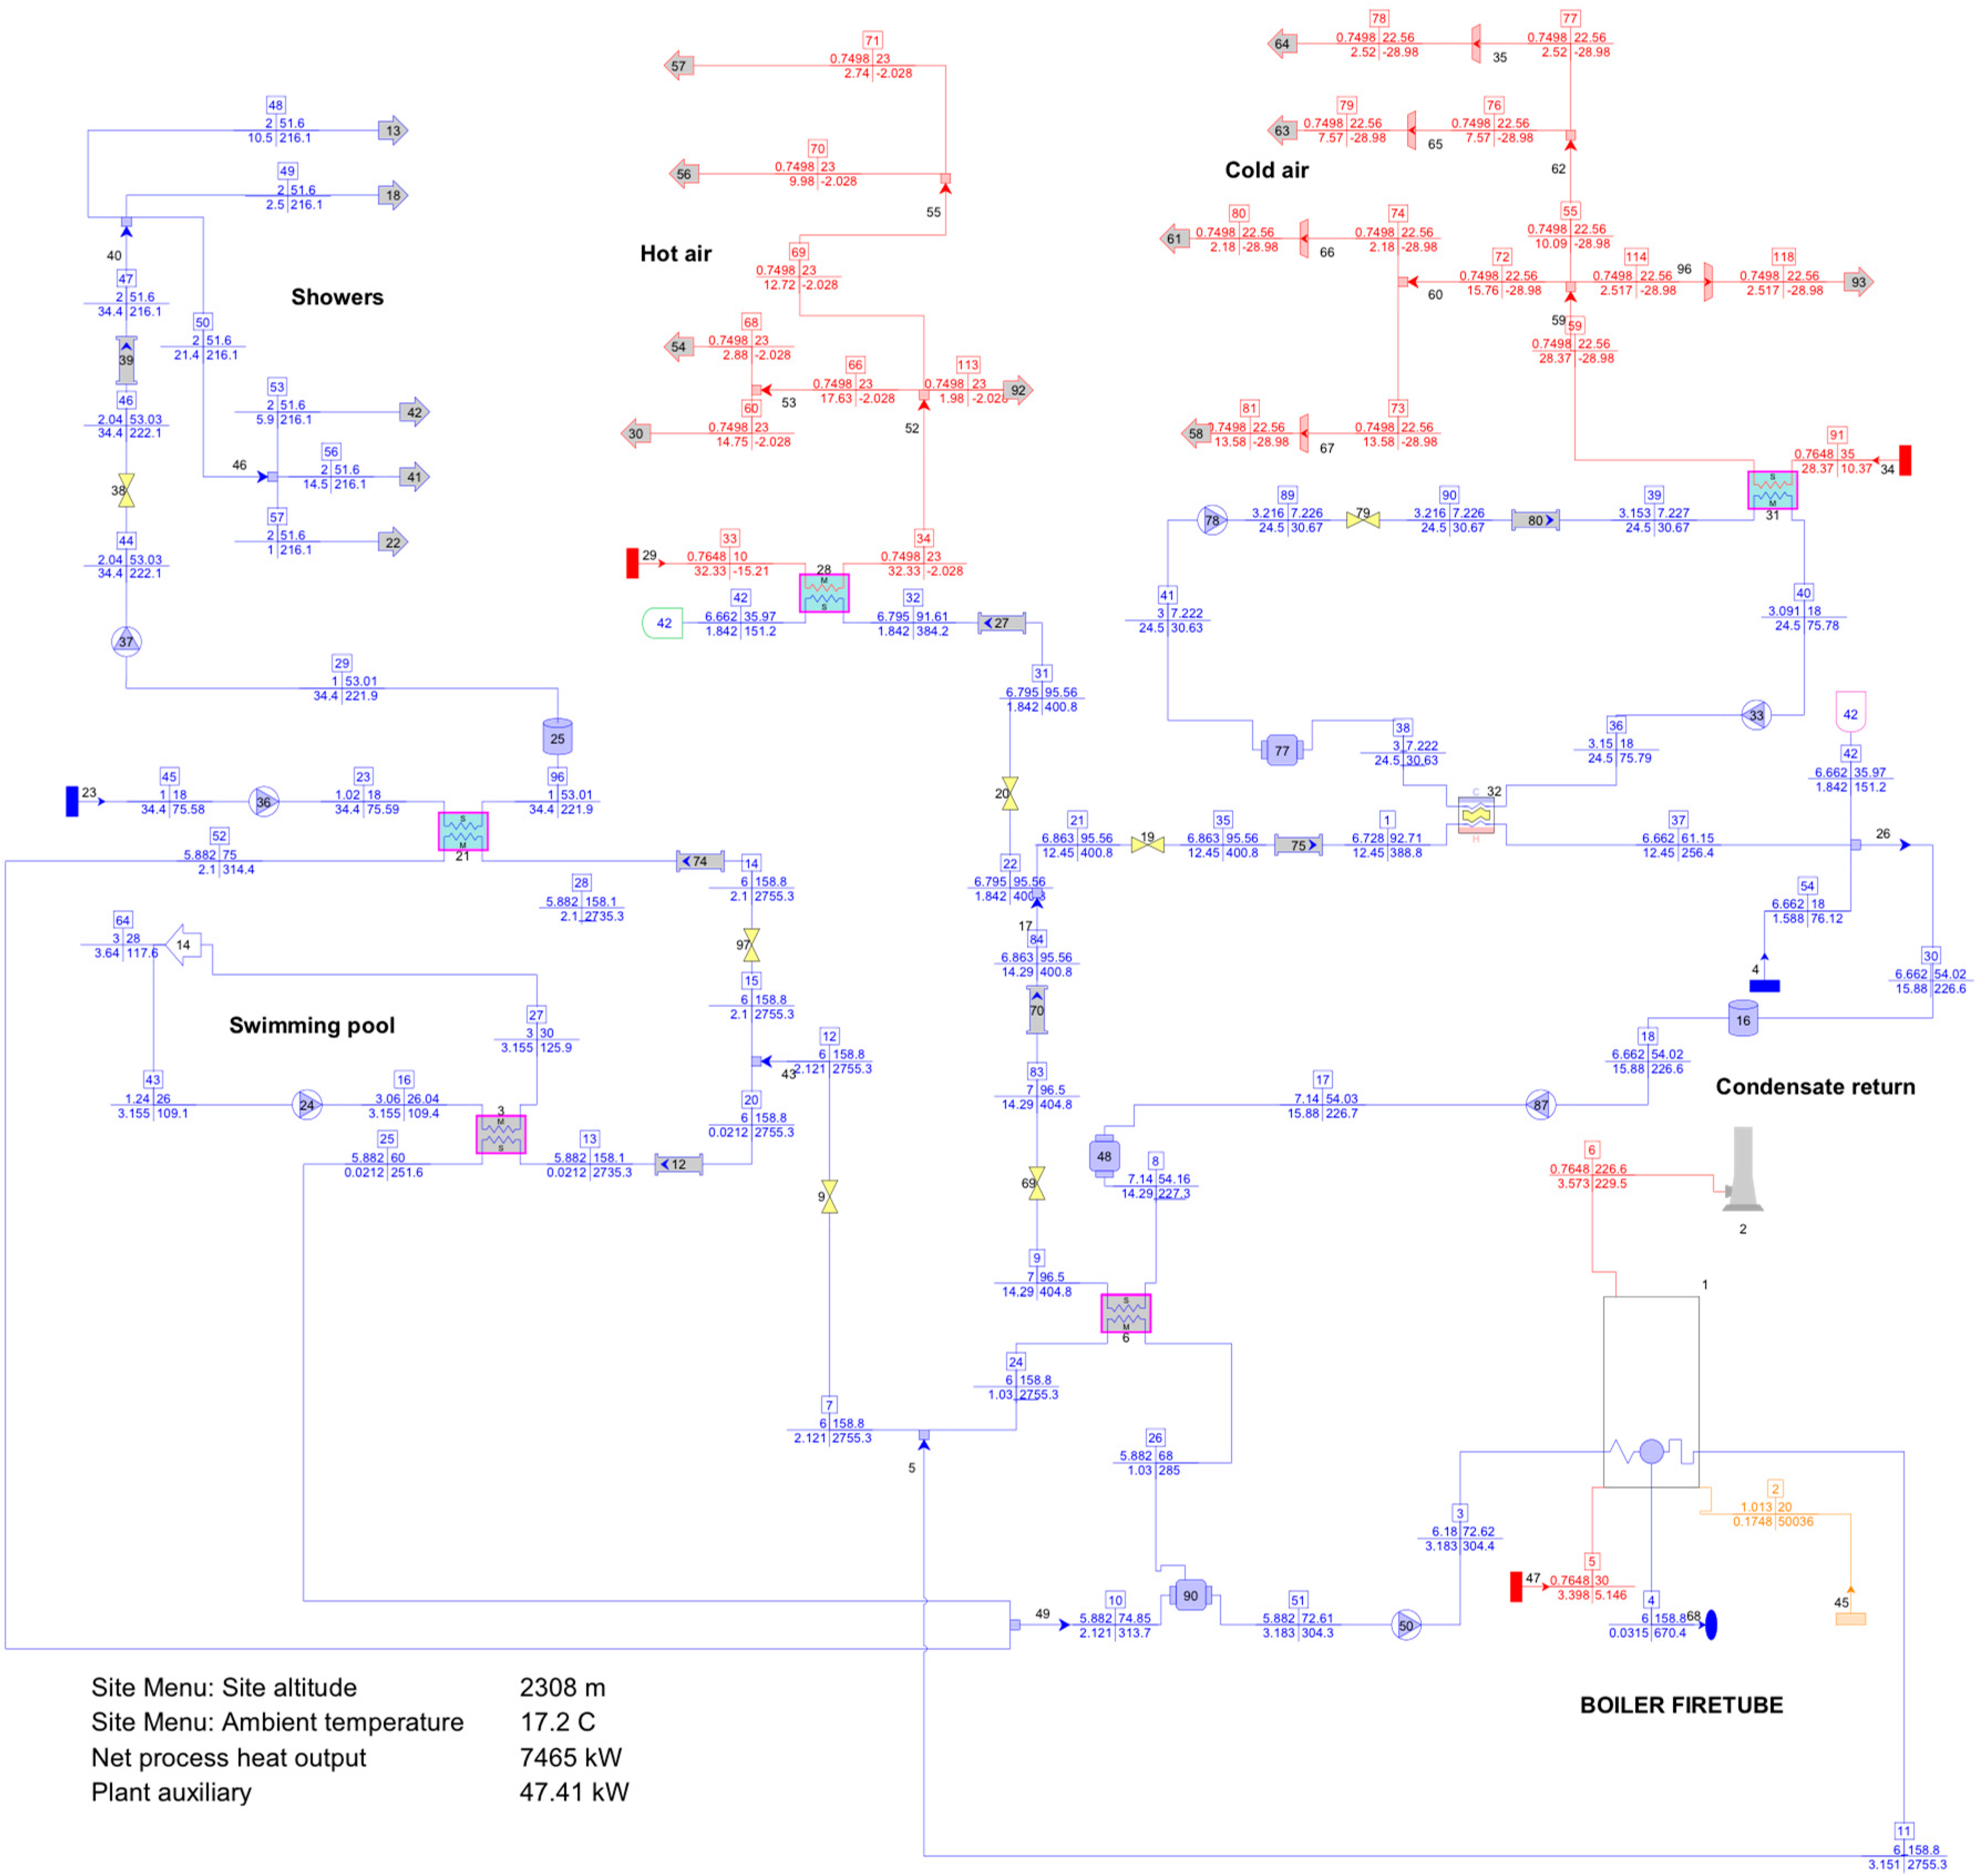
In both processes studied, compliance with 100% of the thermal and electrical requirements are achieved. The scheme (Figure 10) is divided into five sub-processes: I. Combustion engines or gas turbine and recovery boiler, II. Swimming pools, III. Showers IV. Hot air and V. cold air.
First, in the “Combustion Engine” stage of CE process where engines WAR 20V34SG (Wärtsilä North America Inc., Houston, TX, USA) and CAT G16CM34 (Caterpillar company, Deerfield, IL, USA) (CH4 fuel) were used to produce the necessary hot air sent to the HRSG. A cooling sub-process called “Refrigeration of engine system” was required to lower the heat of the engine due to the burning of fuel, without transforming into mechanical energy. Thus, this keeps the engine parts below their design temperature and avoids their deformation and destruction. In addition, part of the cooling heat is used to obtain a fraction of the necessary heat for the showers. The WAR 20V34SG engine has an electric efficiency of 45% and the output air flow temperature is 361 °C. The CAT G16CM34 engine has an electrical efficiency of 42.3%, and the output air flow temperature is 368 °C. Moreover, for proper operation at 100% capacity, 0.694 kg/s of fuel is required, thus generating 26.69 kg/s of air at 363.7 °C, which is necessary for the recovery boiler.
On the other hand, in GT process, the SIEMENS SGT-100-1S (Siemens Aktiengesellschaft, Munich, Germany) (CH4 fuel) turbine was used to produce the necessary hot air which is sent to the recovery boiler (HRSG). Here, a post-combustion sub-process was required to increase the temperature of the exhaust gases, instead of using a higher capacity turbine, making the process more expensive.
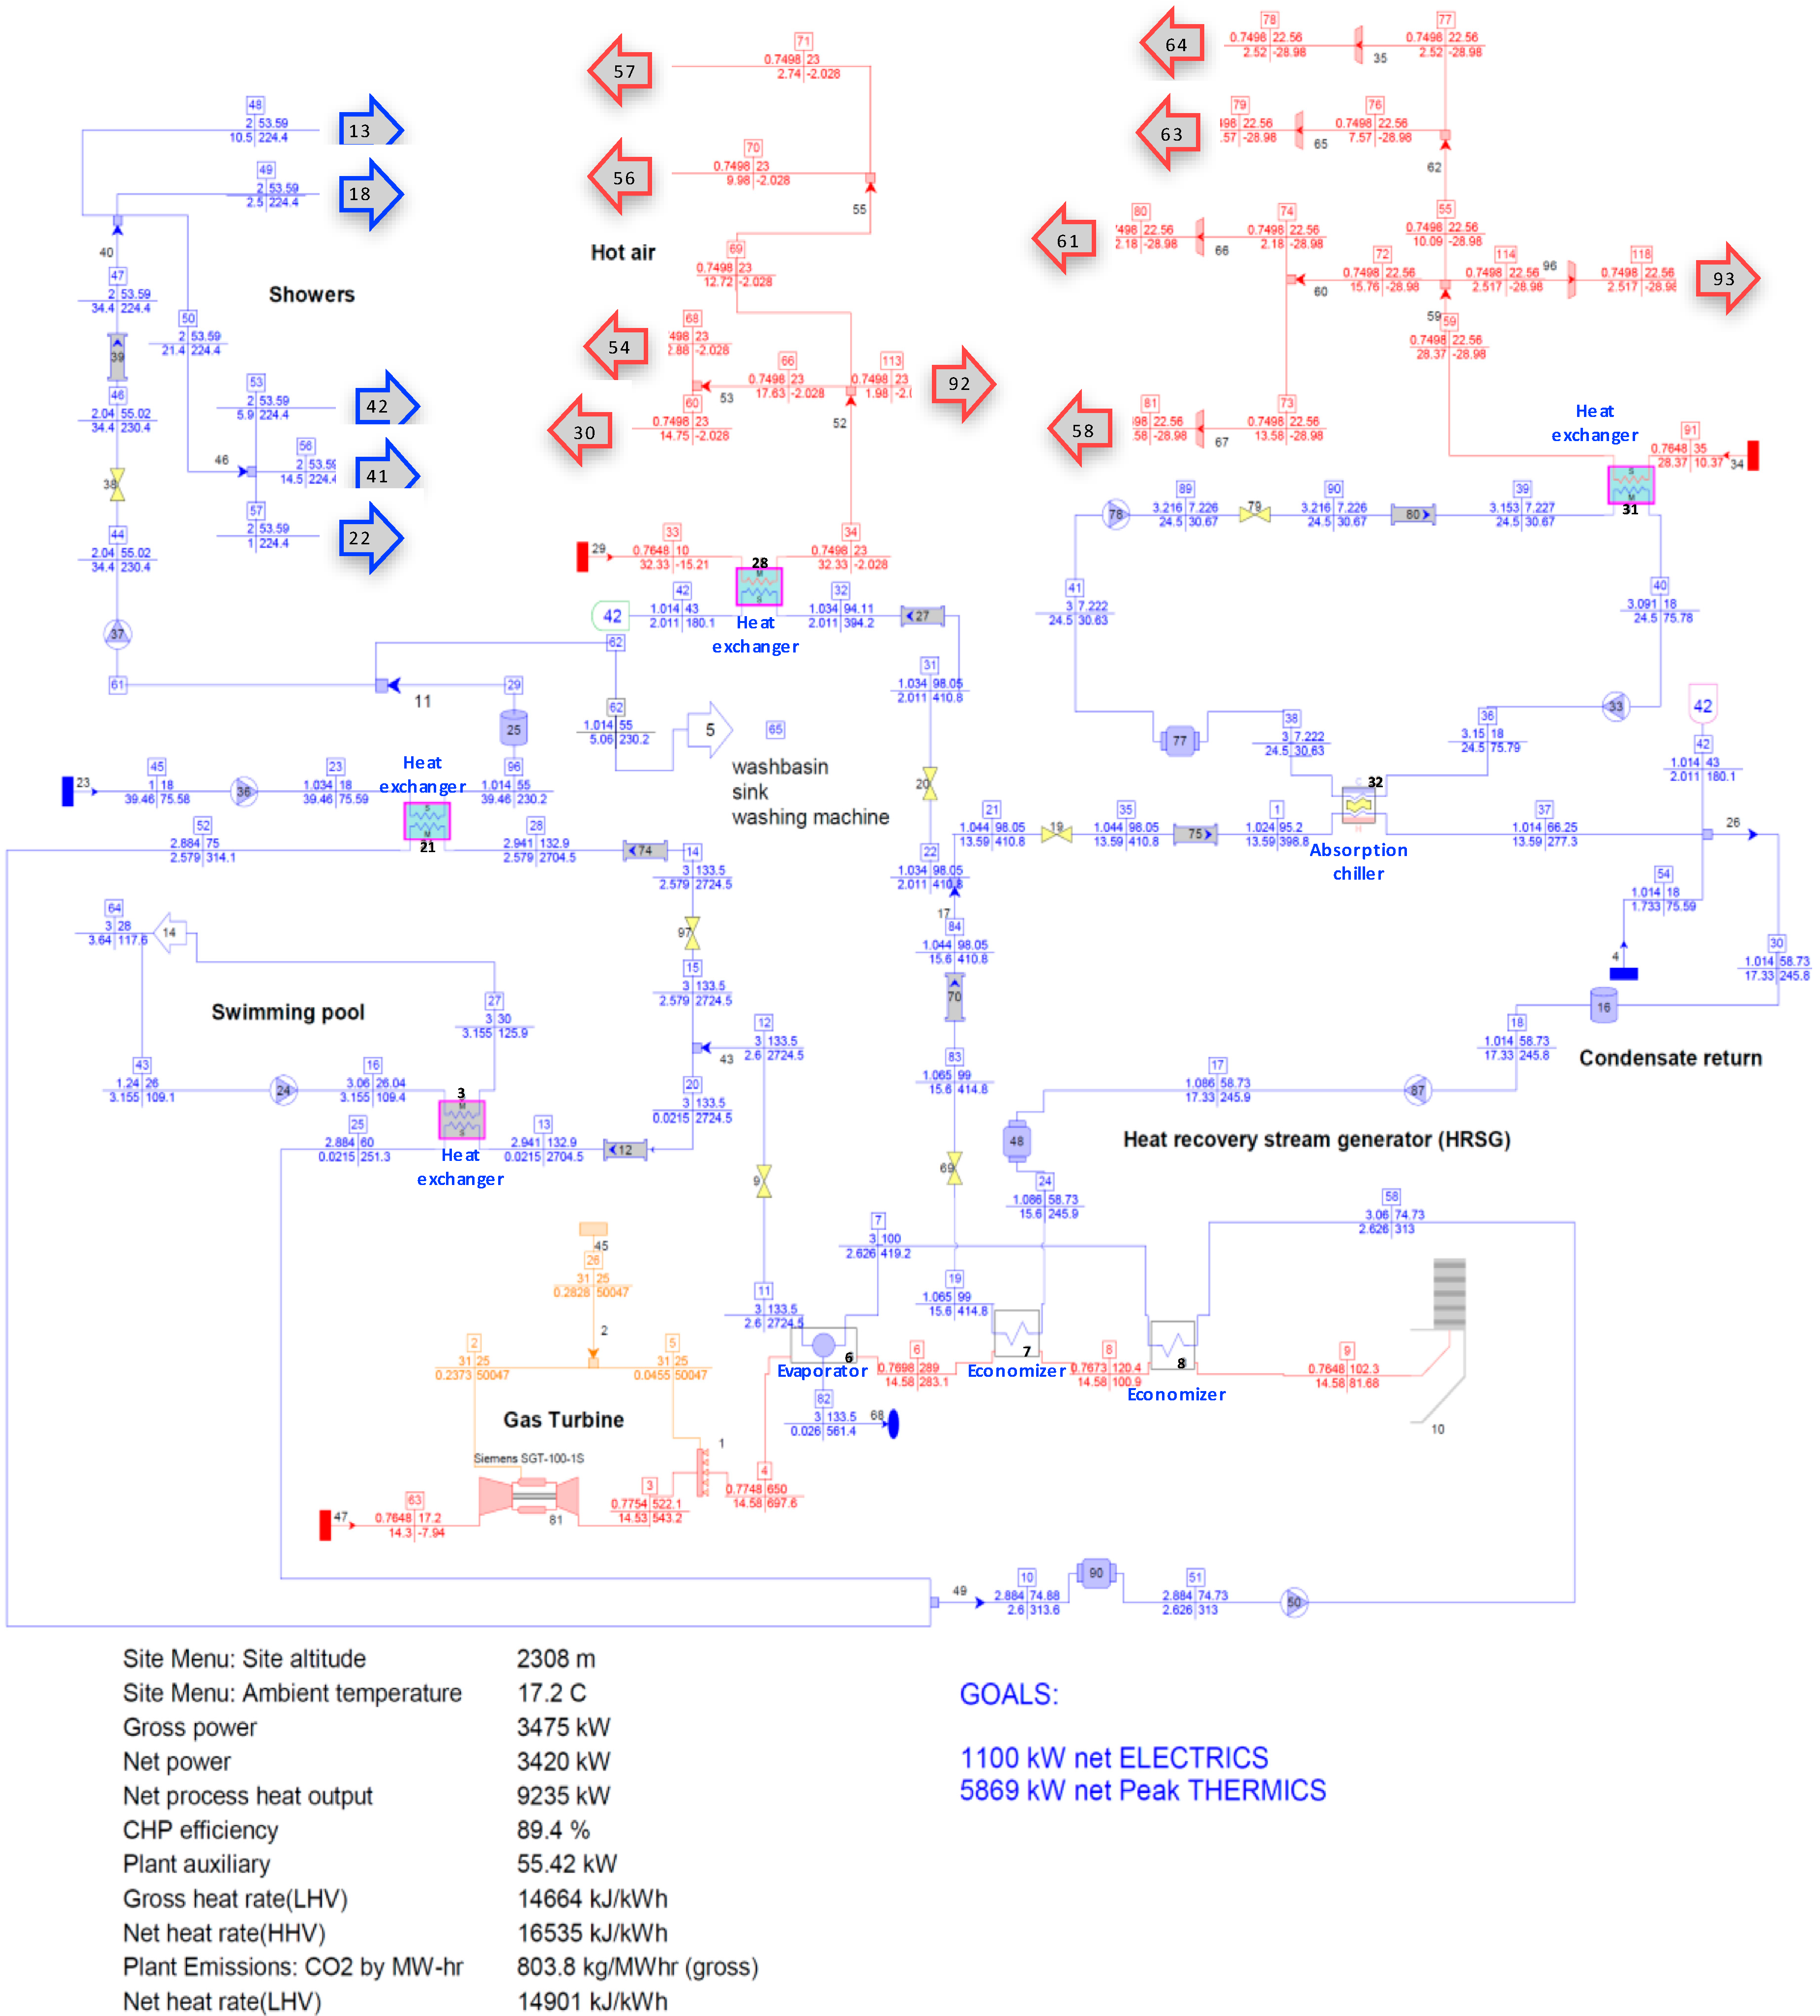
For alternative A and B, in the “HRSG” and “Condensate return” steps, the sub-process consists of an evaporator (6; lower area Figure 10) and two economizers (7 and 8; lower-right area Figure 10), where the evaporator allows the saturated steam to be obtained and feed the thermal energy to the “swimming pool” and the “showers”, while the economizer (7) generates the hot water for the stages of “hot air and “cold air”. The exhaust gases from the economizer (8) must be greater than 100 °C to avoid the condensation of the water present in chimney flue gases. Finally, there is the “condensate return” stage which allows the mixing of the water-cooling flows in the different stages of the process, incorporating this flow to the economizer 7. The “swimming pool” stage is observed, in which a heat exchanger is used to contact, countercurrent wise, the saturated steam coming from the evaporator, with a flow of 3.64 kg/s of recirculated water from the pool (Process block with return 14). In the “showers” stage, hot water is used in the apartment’s showers, washing machines, as well as bathroom and kitchen sinks. A heat exchanger (21; center-left area Figure 10) is used to obtain the hot water which is fed with saturated steam from the evaporator of the recovery boiler to achieve the hot water flow required for the building at 60 °C. Each process shaft (13, 18, 22, 41, 42) represents the hot water requirement for a section of the building, according to the number of people living in an apartment. The “hot air” stage is shown, which meets the needs of hot air by using a heat exchanger, where the hot water flow from the recovery boiler comes into contact, countercurrent wise, with the air that heats up from room temperature conditions on to 23 °C. Flows are separated per building and thereafter, the processes (30, 54, 56, 57 and 92) are distinguished according to living/dining room volume of <80 m3 and between 80 and 144 m3. Moreover, the hot air requirements of the building’s entrance hall are included. In the “cold air” stage, the cold air is generated with the intervention of an absorption chiller (32; center-right area Figure 10), where hot water from the recovery boiler enters. This allows a flow of cooling water to be obtained and which comes in contact with the hot ambient air, cooling it down to 23 °C. The cold air is separated by buildings and also according to the cooling tons required by the apartment, in the living-dining room area. It is important to emphasize that fans appear in each flow representing the electric consumption by the air conditioning system, either for hot or cold air. Moreover, tag 42, which indicates the cooled water flow in exchanger 28 (“Hot air” stage; center area Figure 10), is returned to be mixed with the chiller outlet flow.
The main results of each process are reported in Table 4, where it can be observed that the GT process exceeds, in at least 13 aspects, the CE Process. For example, it has a CHP efficiency of 24.3%, consumes 40.9% less fuel, which translates into the same percentage of lower CO2 emissions, the heat ratio for each kWh of electricity is 44.4% higher, the auxiliary energy consumption is 33% of the EC process and the water consumption is 8% lower. Therefore, the installation of the GT Process is proposed in order to comply with the energy requirements of the building. Onovwiona and Ugursal [25] reported that gas turbines offer a number of advantages when compared to reciprocating internal combustion based cogeneration systems. These include compact size, low weight, small number of moving parts and lower noise. In addition, gas turbine-based cogeneration systems have high-grade waste heat, low maintenance requirements (but require skilled personnel), low vibration and short delivery time. However, in the lower power ranges, reciprocating internal combustion engines have higher efficiency.
3.2. GT Process
Figure 10 shows the simulation model of the cogeneration process using a gas turbine as the energy matrix. With this system, it is possible to comply with 100% of the thermal and electrical requirements. The results of the proposed GT process for the building are analyzed in detail below. First, the “Gas Turbine” section is explained. The gas turbine is a Siemens SGT-100-1S model with 30.6% efficiency, 4907 kWe (at sea level) electric power generation and gas production at 514 °C, which is sent to a post-combustion sub-process to raise its temperature to 650 °C. The air fed to the turbine is at an ambient temperature pressure of 0.765 bar (altitude 2308 m) and at an average temperature of the sector of 17.2 °C. Thus, due to these air conditions, the gross electric power generated is 3475 kW.
3.2.1. Ambient Temperature Effect
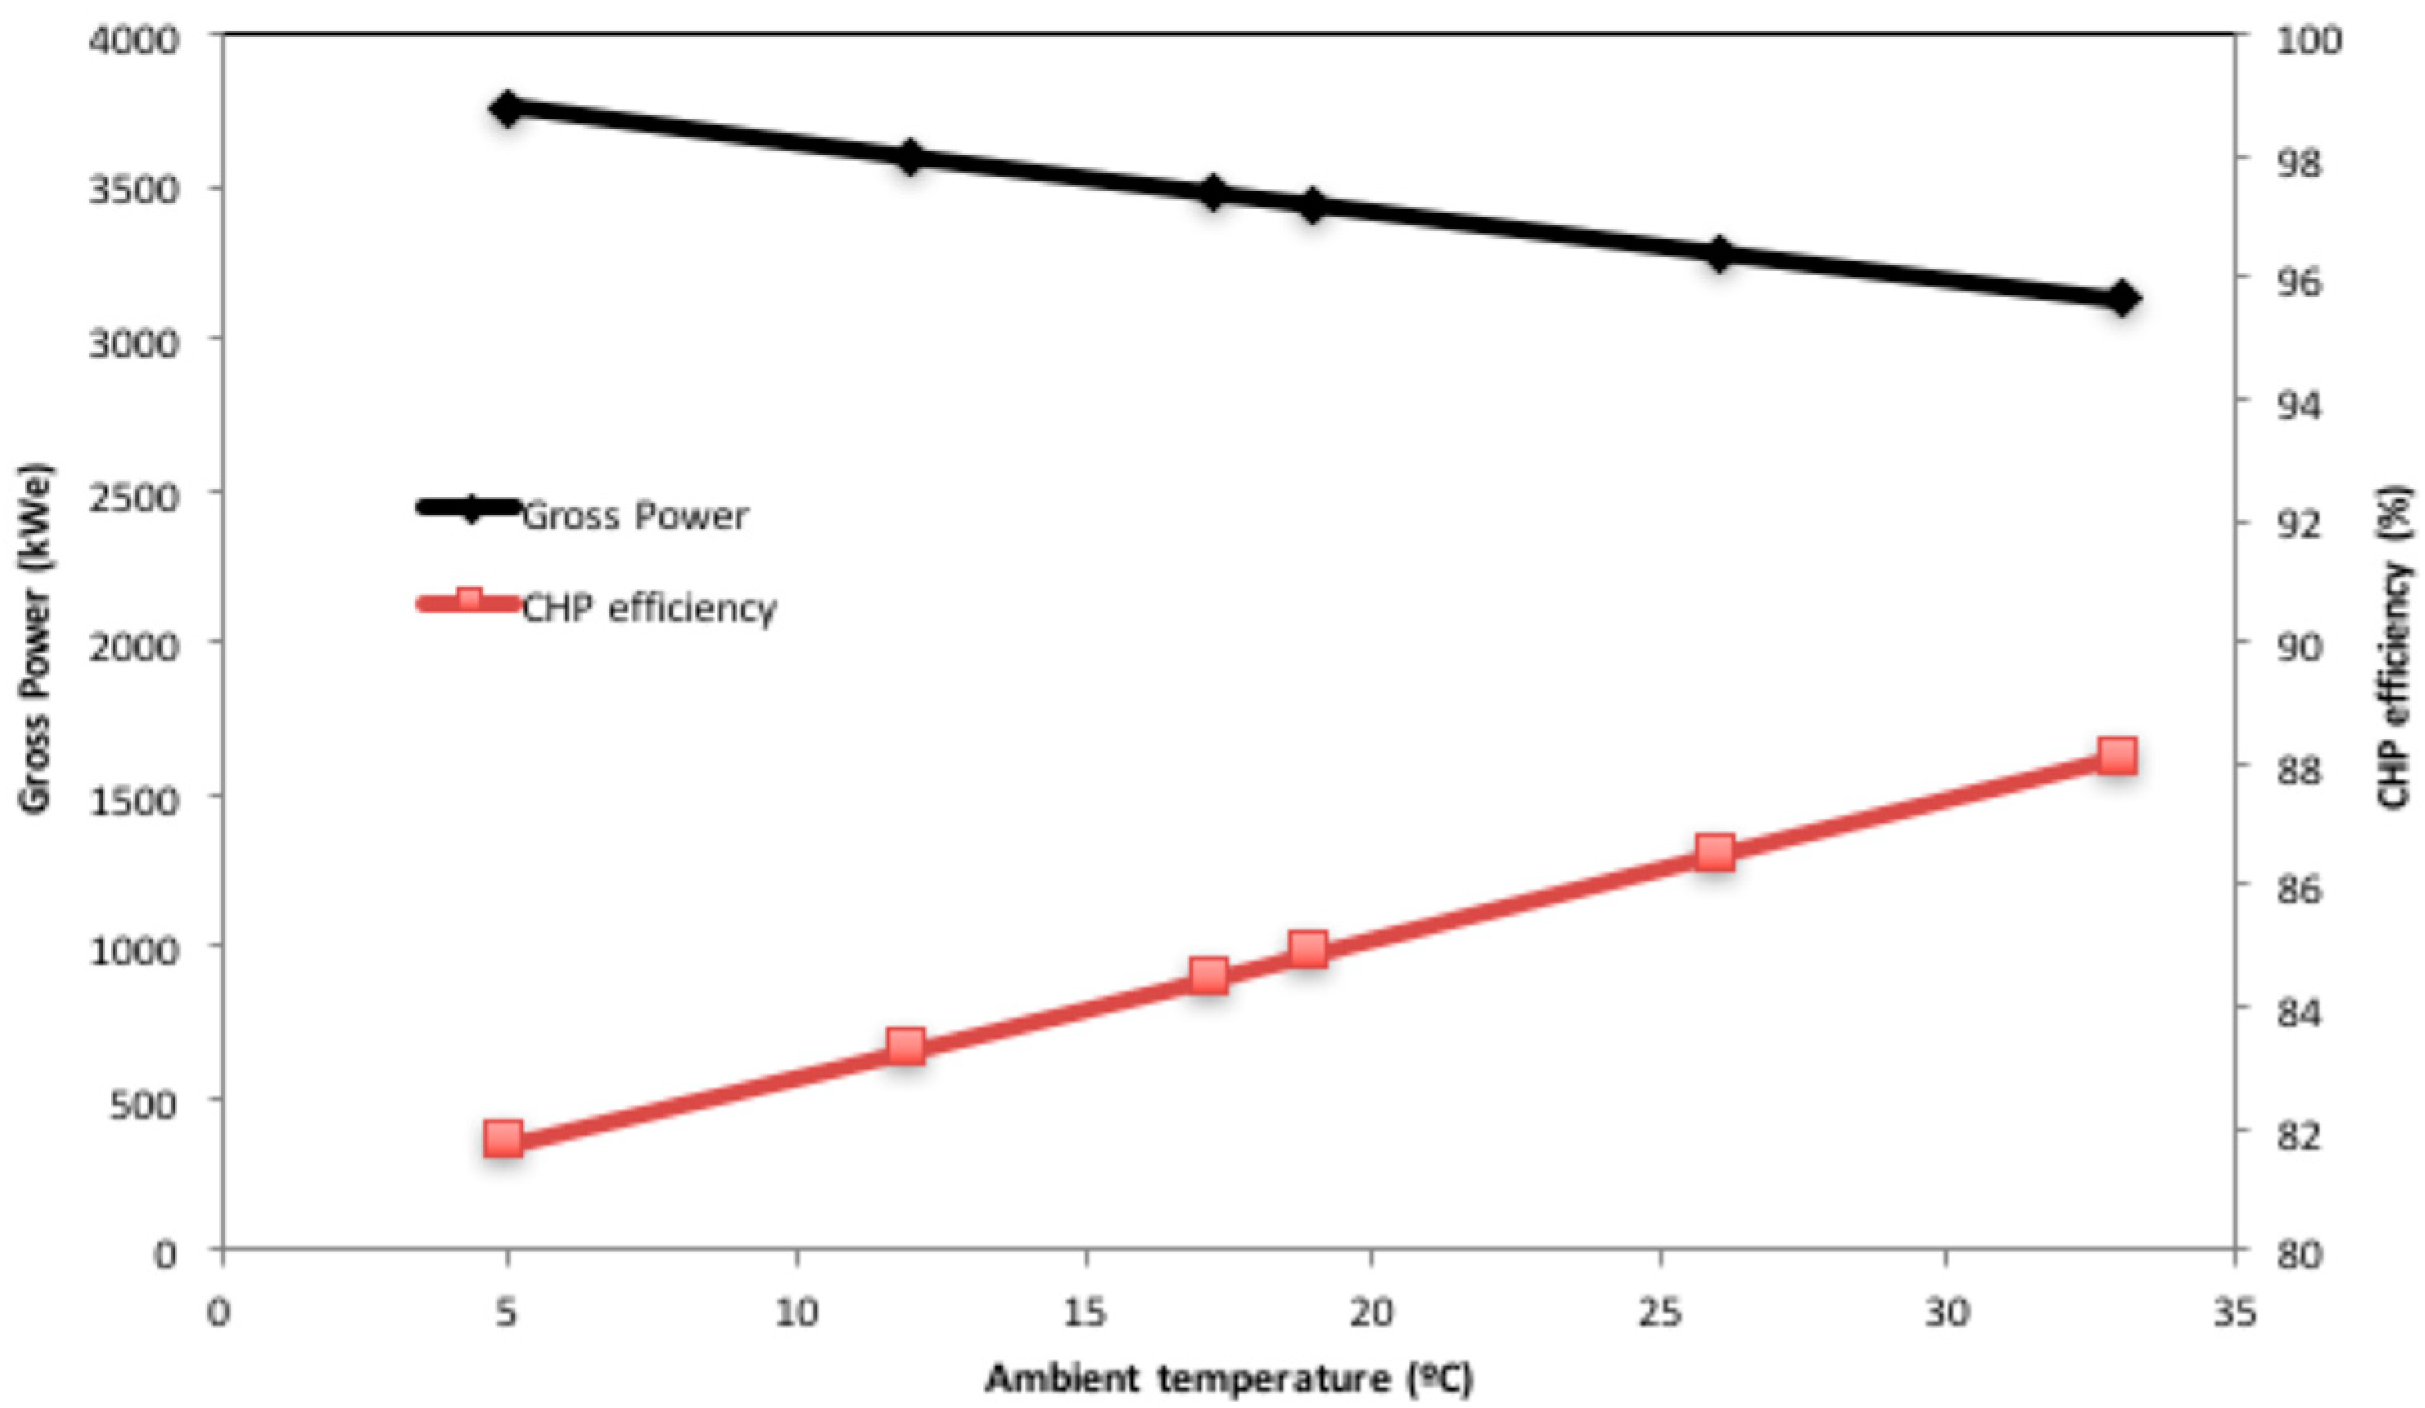
Figure 11 shows the ambient temperature effect on the generation of electrical power and on the efficiency of cogeneration, where the minimum and maximum temperatures of the sector under study were considered. It was observed that in this range, the generation of power varies by 16.8%, while the cogeneration efficiency varies by 7.8%. The latter would indicate that the process is minimal affected by temperature changes in the sector. Basrawi et al [57] researched the effect of the inlet air temperature on the performance of a micro gas turbine (MGT) with cogeneration system (CGS) arrangement. The results showed that when ambient temperature increased, electrical efficiency of the MGT decreased but exhaust heat recovery increased.
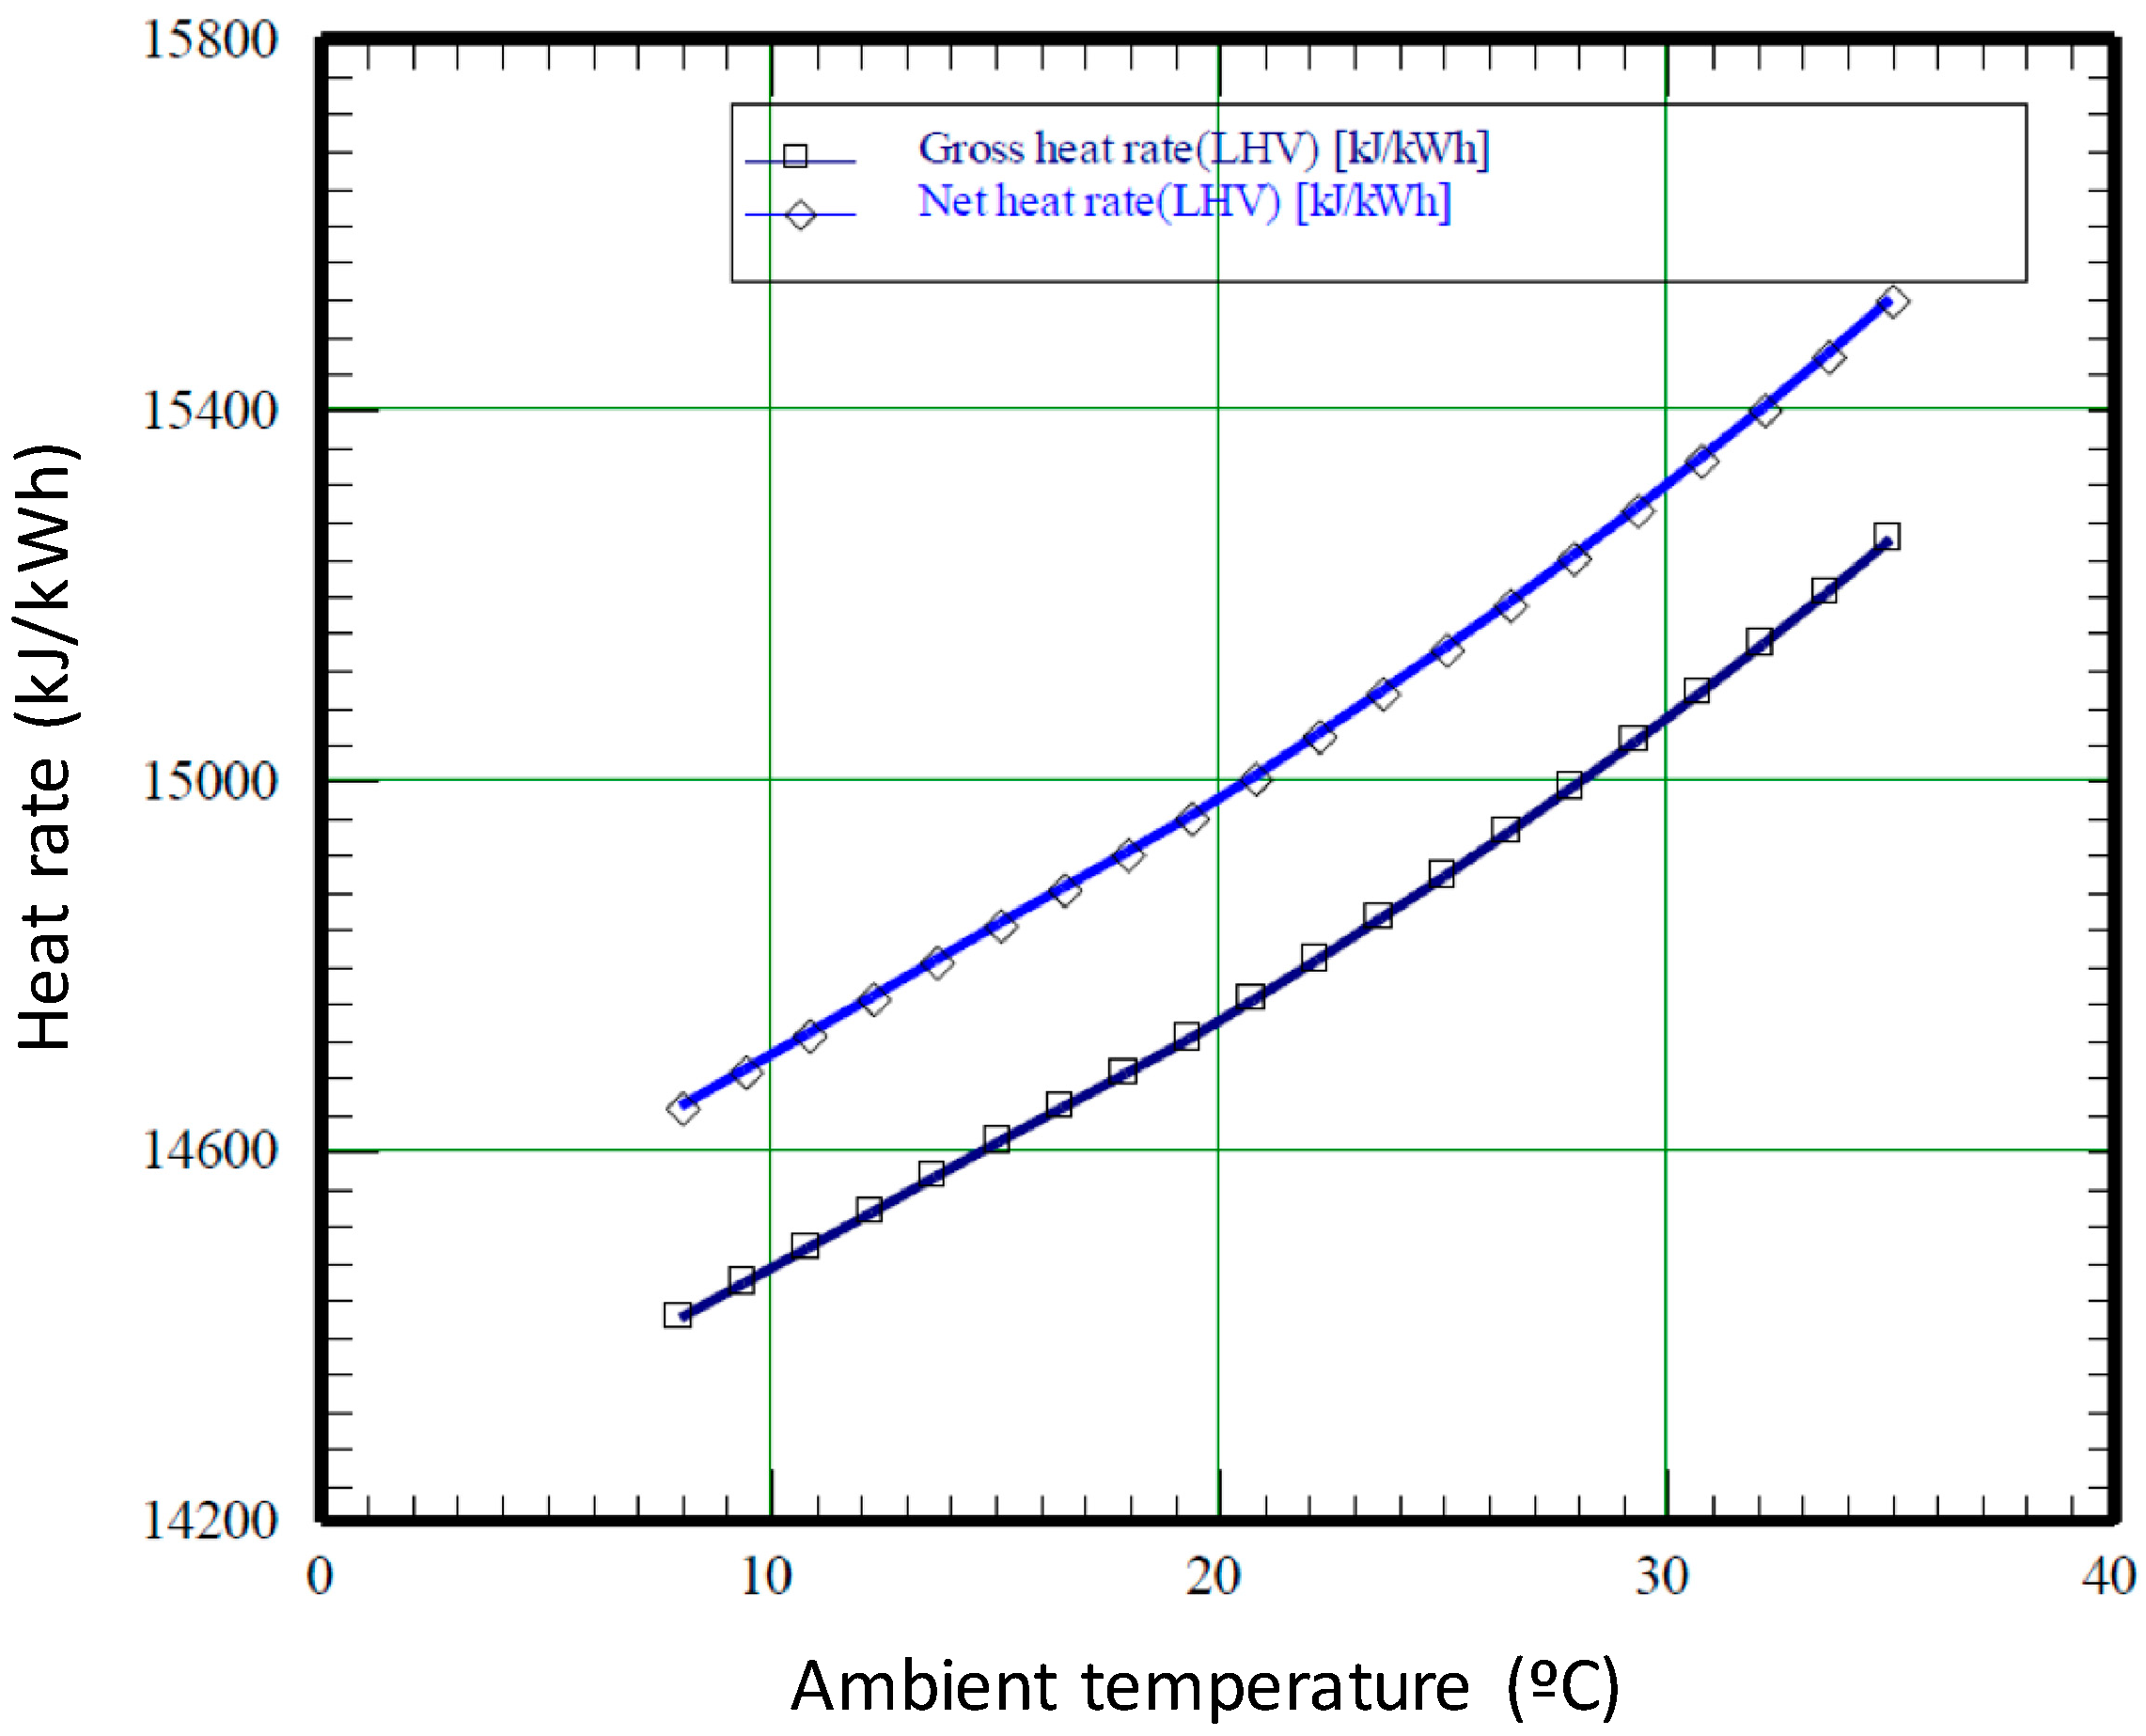
The sensitivity for the variation of the heat rate of the system in the function of the variation of the ambient temperature was analyzed (see Figure 12) as the base value for the analysis of 14901 kJ/kWh electrics. Therefore, the expected result (heat rate) for different environmental conditions of year is observed in Figure 12.
3.2.2. Fuel Effect
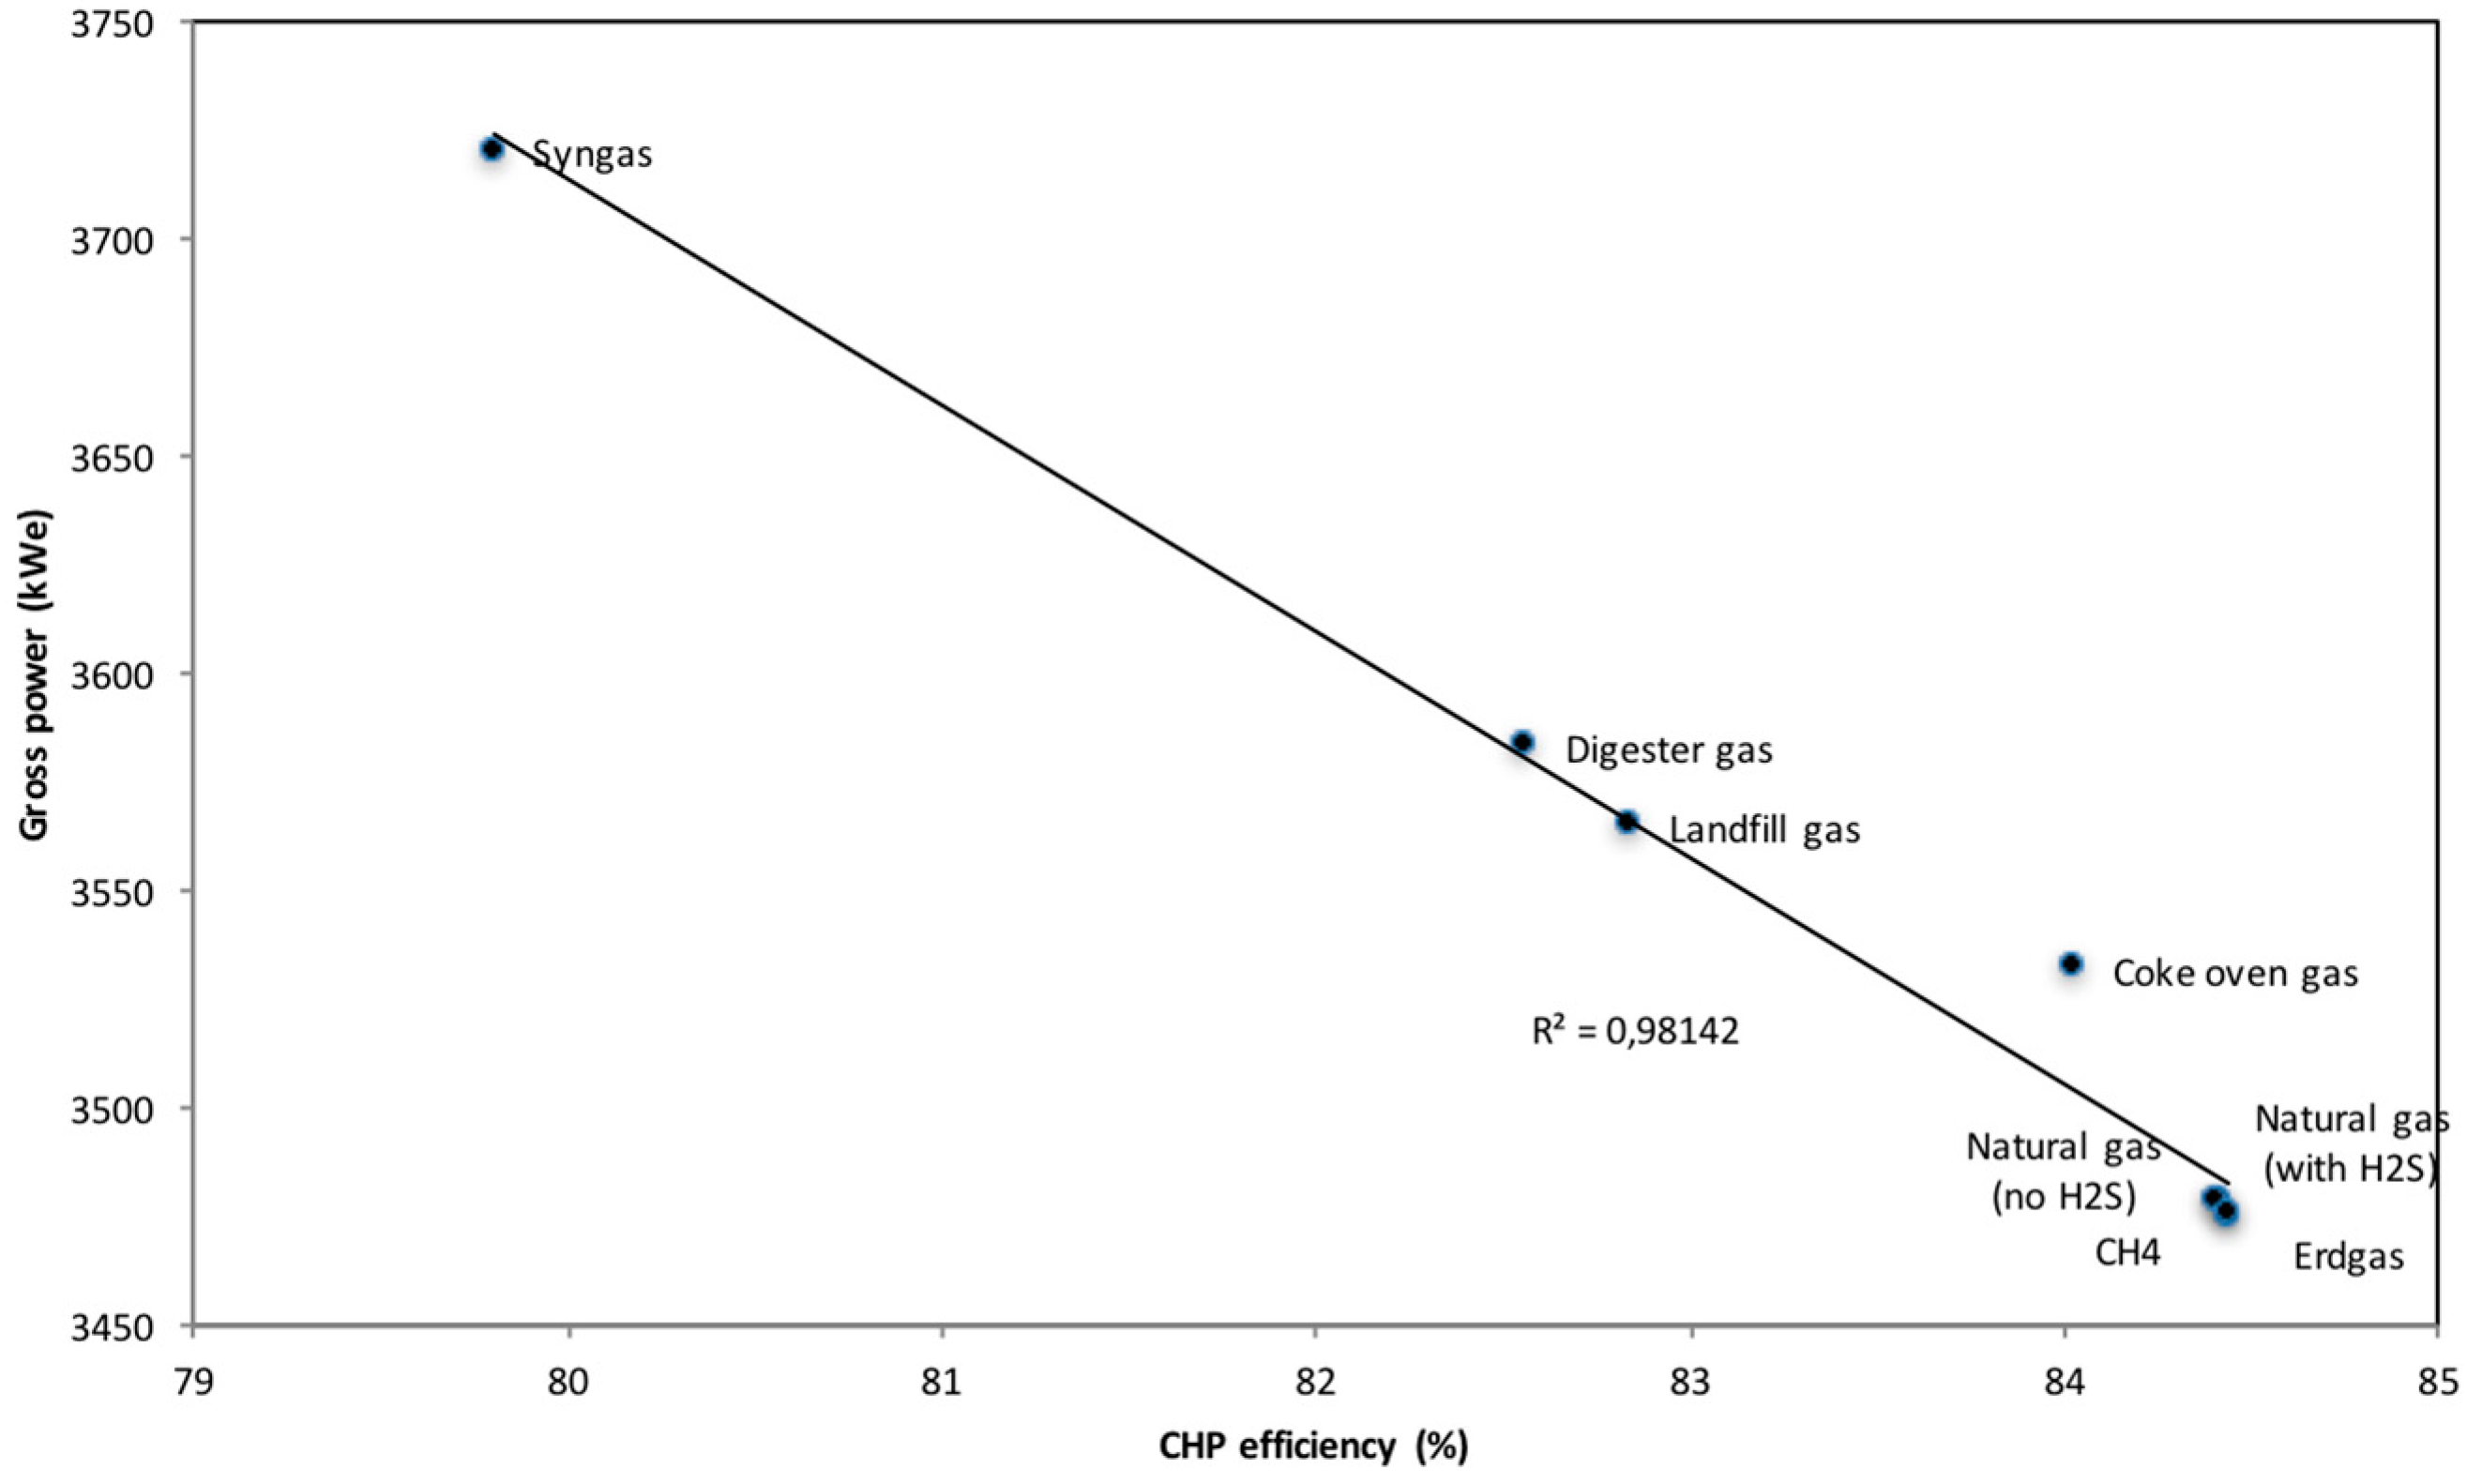
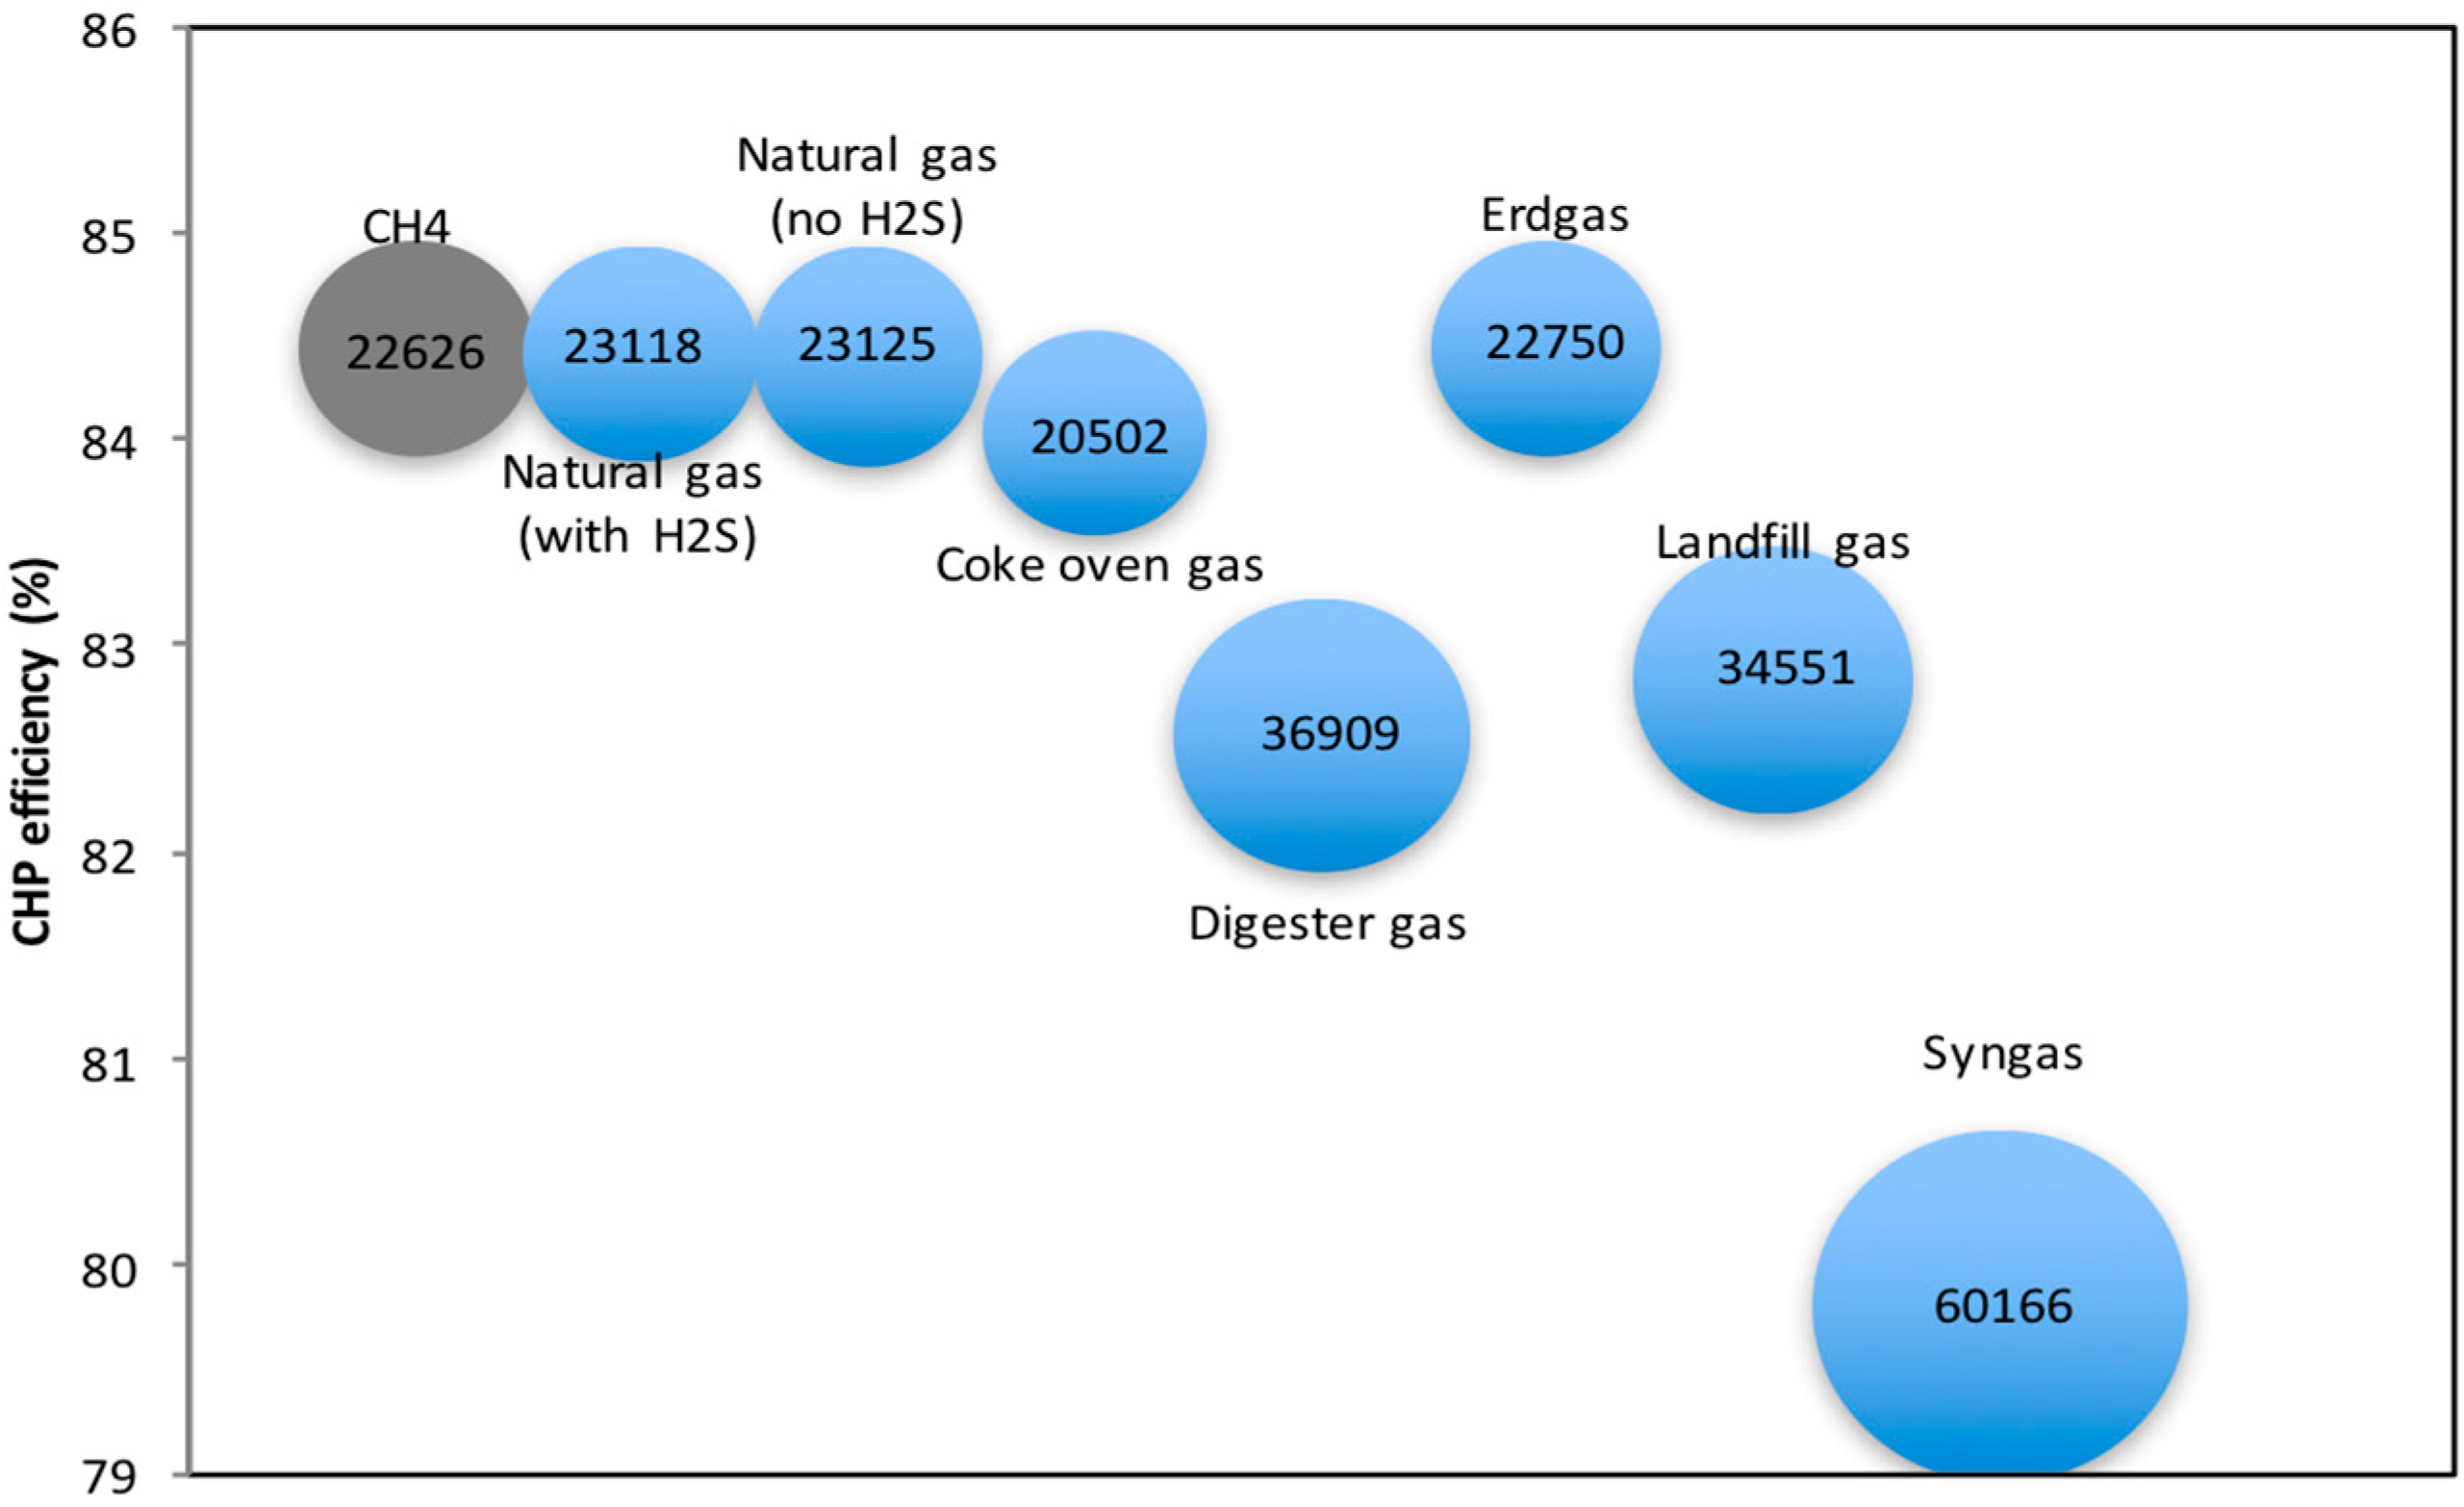
The Siemens SGT-100-1S turbine uses 0.24 kg/s of natural gas at 25 °C and 31 bar, obtaining the results reported in this work, but, moreover, the analysis was performed for different types of fuels. The composition of these gases is reported in Table 5, where the variability of the compounds present in the fuels is observed, so the contrast between the cogeneration efficiency and the gross generation of the electrical power was carried out (see Figure 13). It was then observed that Syngas allows a greater generation of gross electrical power, but with a low cogeneration efficiency compared to that obtained with the other fuels. This behavior of the GT process with Syngas is due to the high concentration of CO and CO2, which gives this fuel a greater heat reaction. In addition, the installation requires a gasifier; thus, the proposal is intended to serve as an example. Figure 13 shows a linear trend with a negative slope (R2: 0.981) between the cogeneration efficiency and the gross power generated. Hence, the higher the cogeneration efficiency, the lower the power generated for the different fuels. With Syngas as fuel, more electricity is generated, so it should be chosen according to an economic criterion. However, 60166 ton/year of CO2 is emitted by using it, which goes against the environmental principles of the cogeneration process.
Figure 14 shows that the CO2 emission is higher for lower cogeneration efficiency with regards to the different types of fuels. It should be highlighted that the CO2 fuel emissions of renewable sources are considered neutral. This coincides with the report by Joelsson [27] which was described in the introduction.
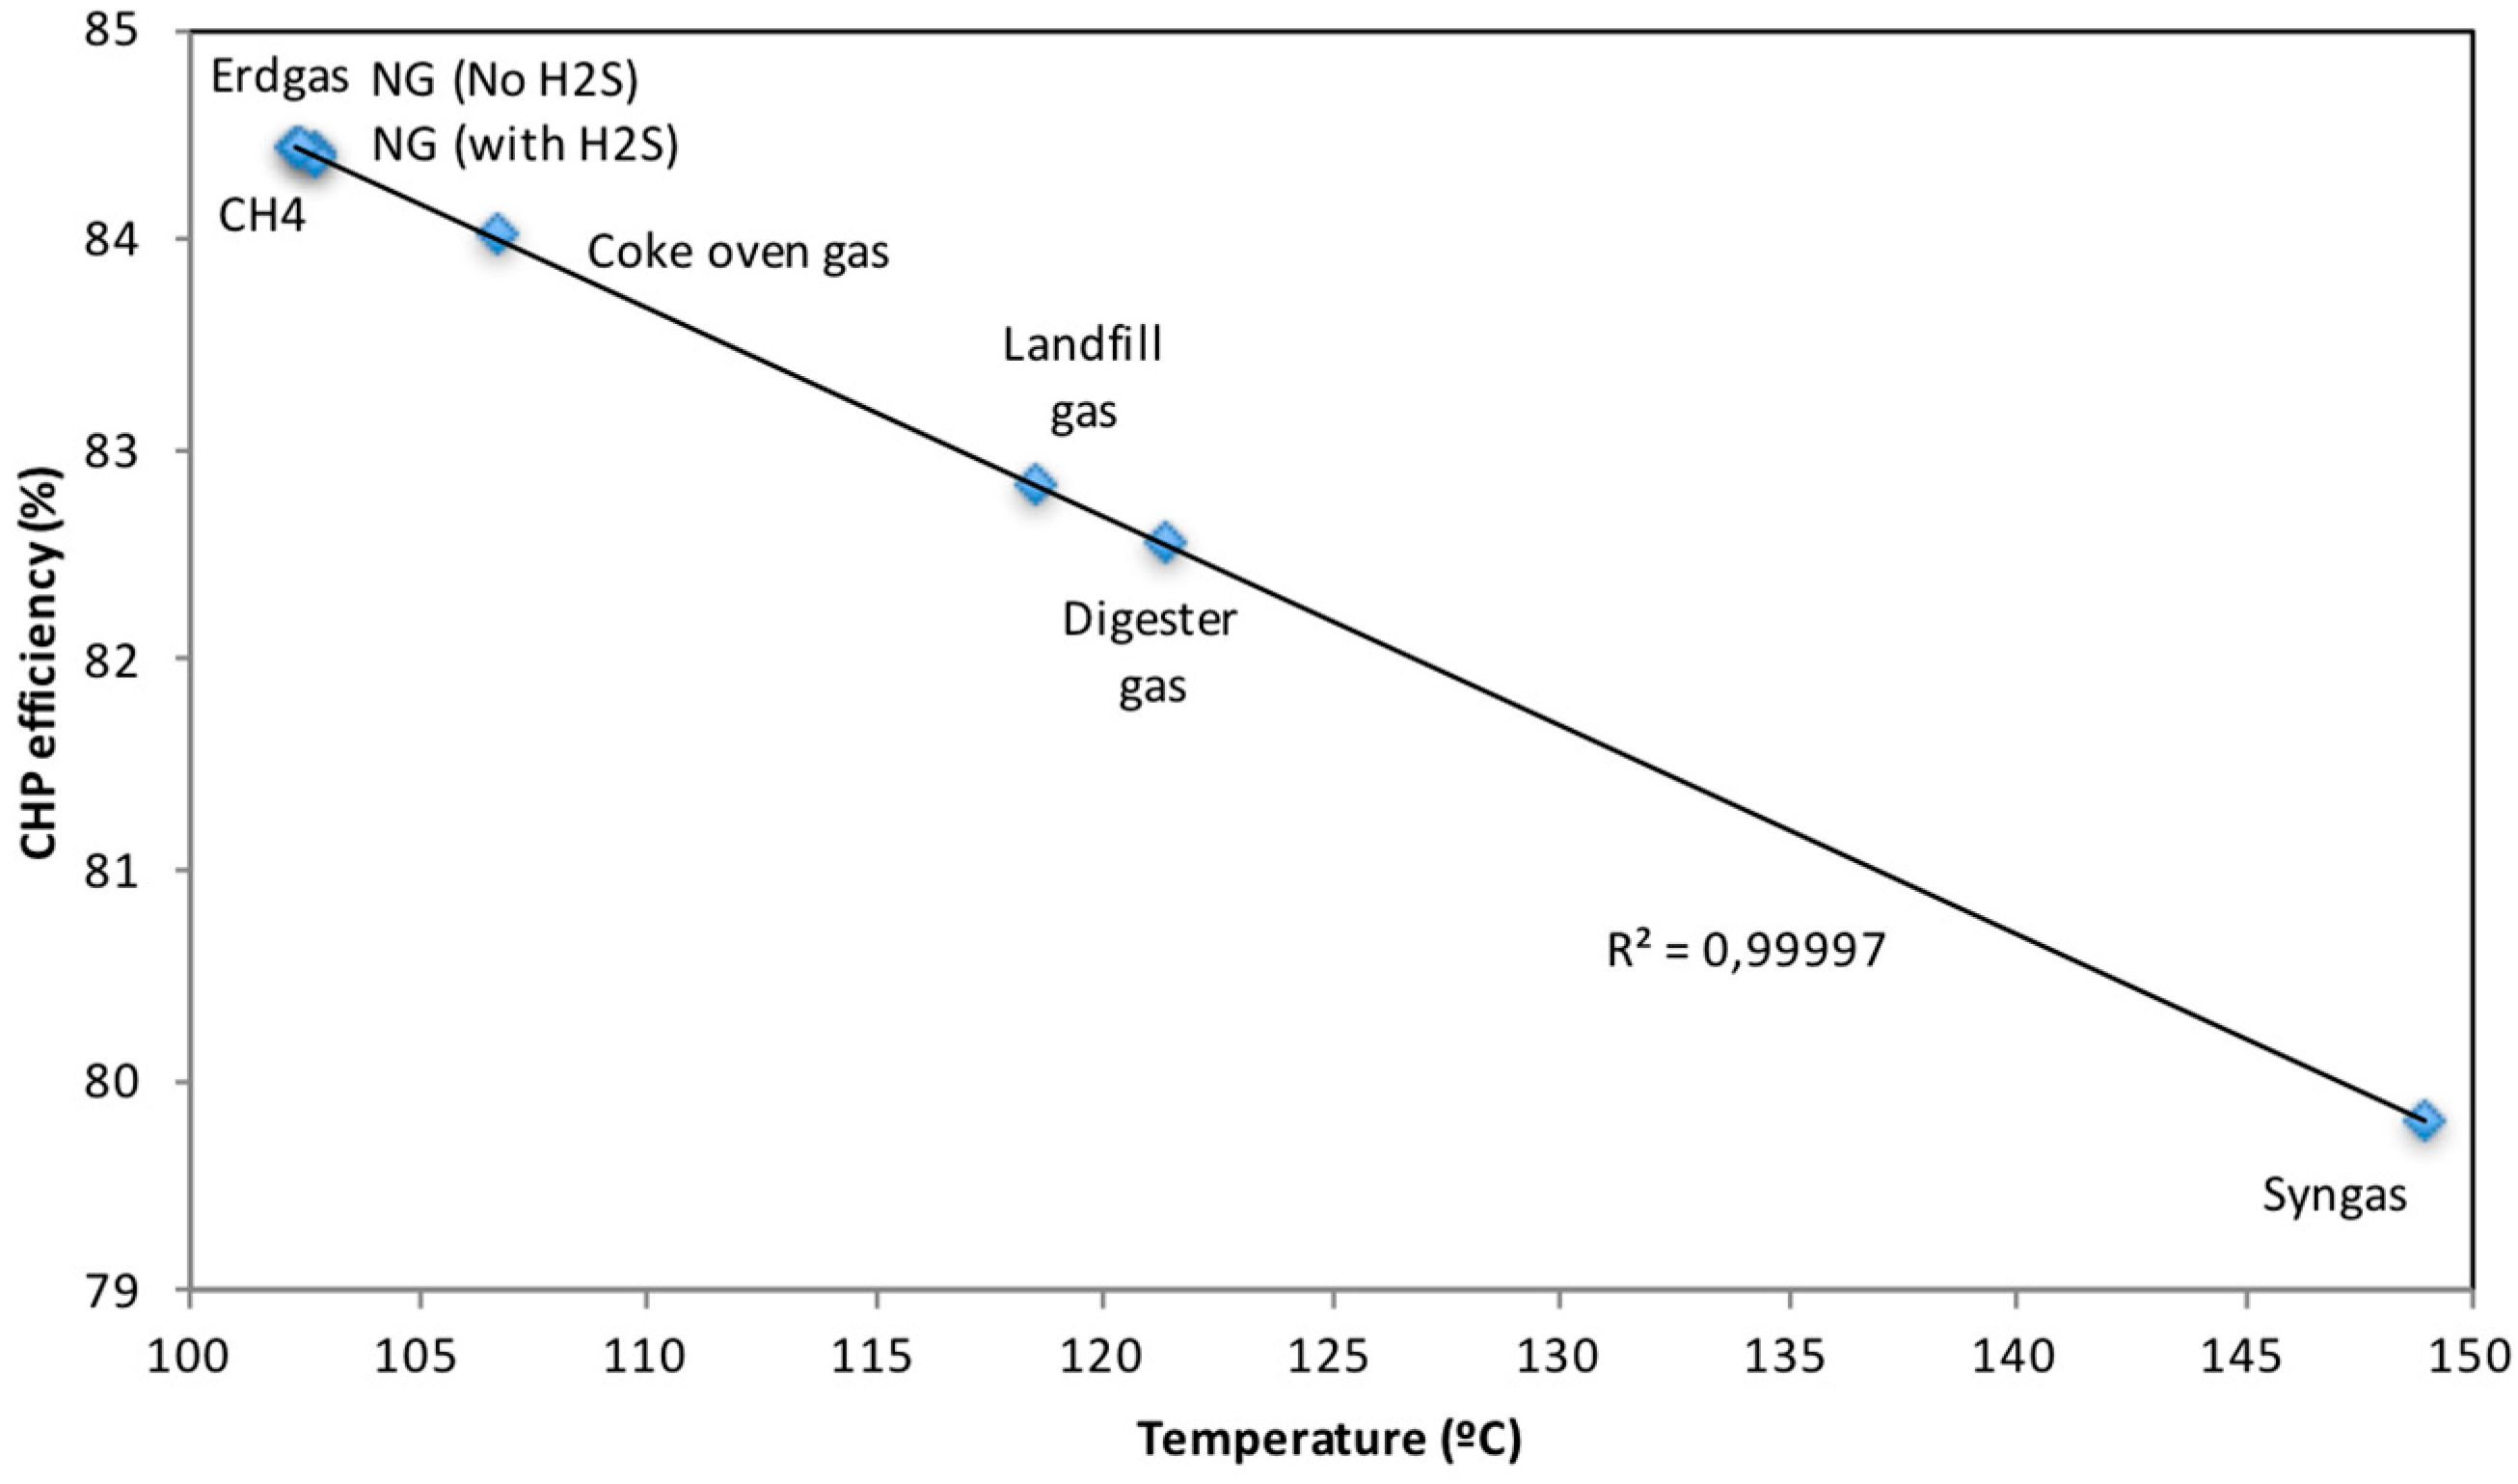
The decrease in the cogeneration efficiency is due to the loss of useful energy that is reflected in the temperature of the gas outlet that leads to the chimney. As shown in Figure 15, there is a linear correlation (R2: 0.99997) between the cogeneration efficiency and the temperature of the HRSG gas outlet. The efficiency of the cogeneration cycle is 84.4%, which is an expected value for this type of system, and therefore, is a value superior to the efficiency of a steam power cycle. In this case, the efficiency is greater in at least 44 percentage points. The energy used in auxiliary devices for the operation of the cycle corresponds to 1.6% of the gross energy generated, which can be considered a very acceptable value. On the other hand, the error percentages of the heat and mass balances show a very good simulation of the calculations obtained. Finally, the electric power generated is 3.48 MW, which greatly surpasses what is required by the building, i.e., 1.12 MW. This implies that the 2.36 MW surpluses can be commercialized according to the country’s legal framework (active as of January 2015). However, the easiest option would be to sell them to the electricity company in Mexico City.
3.2.3. Load Effect
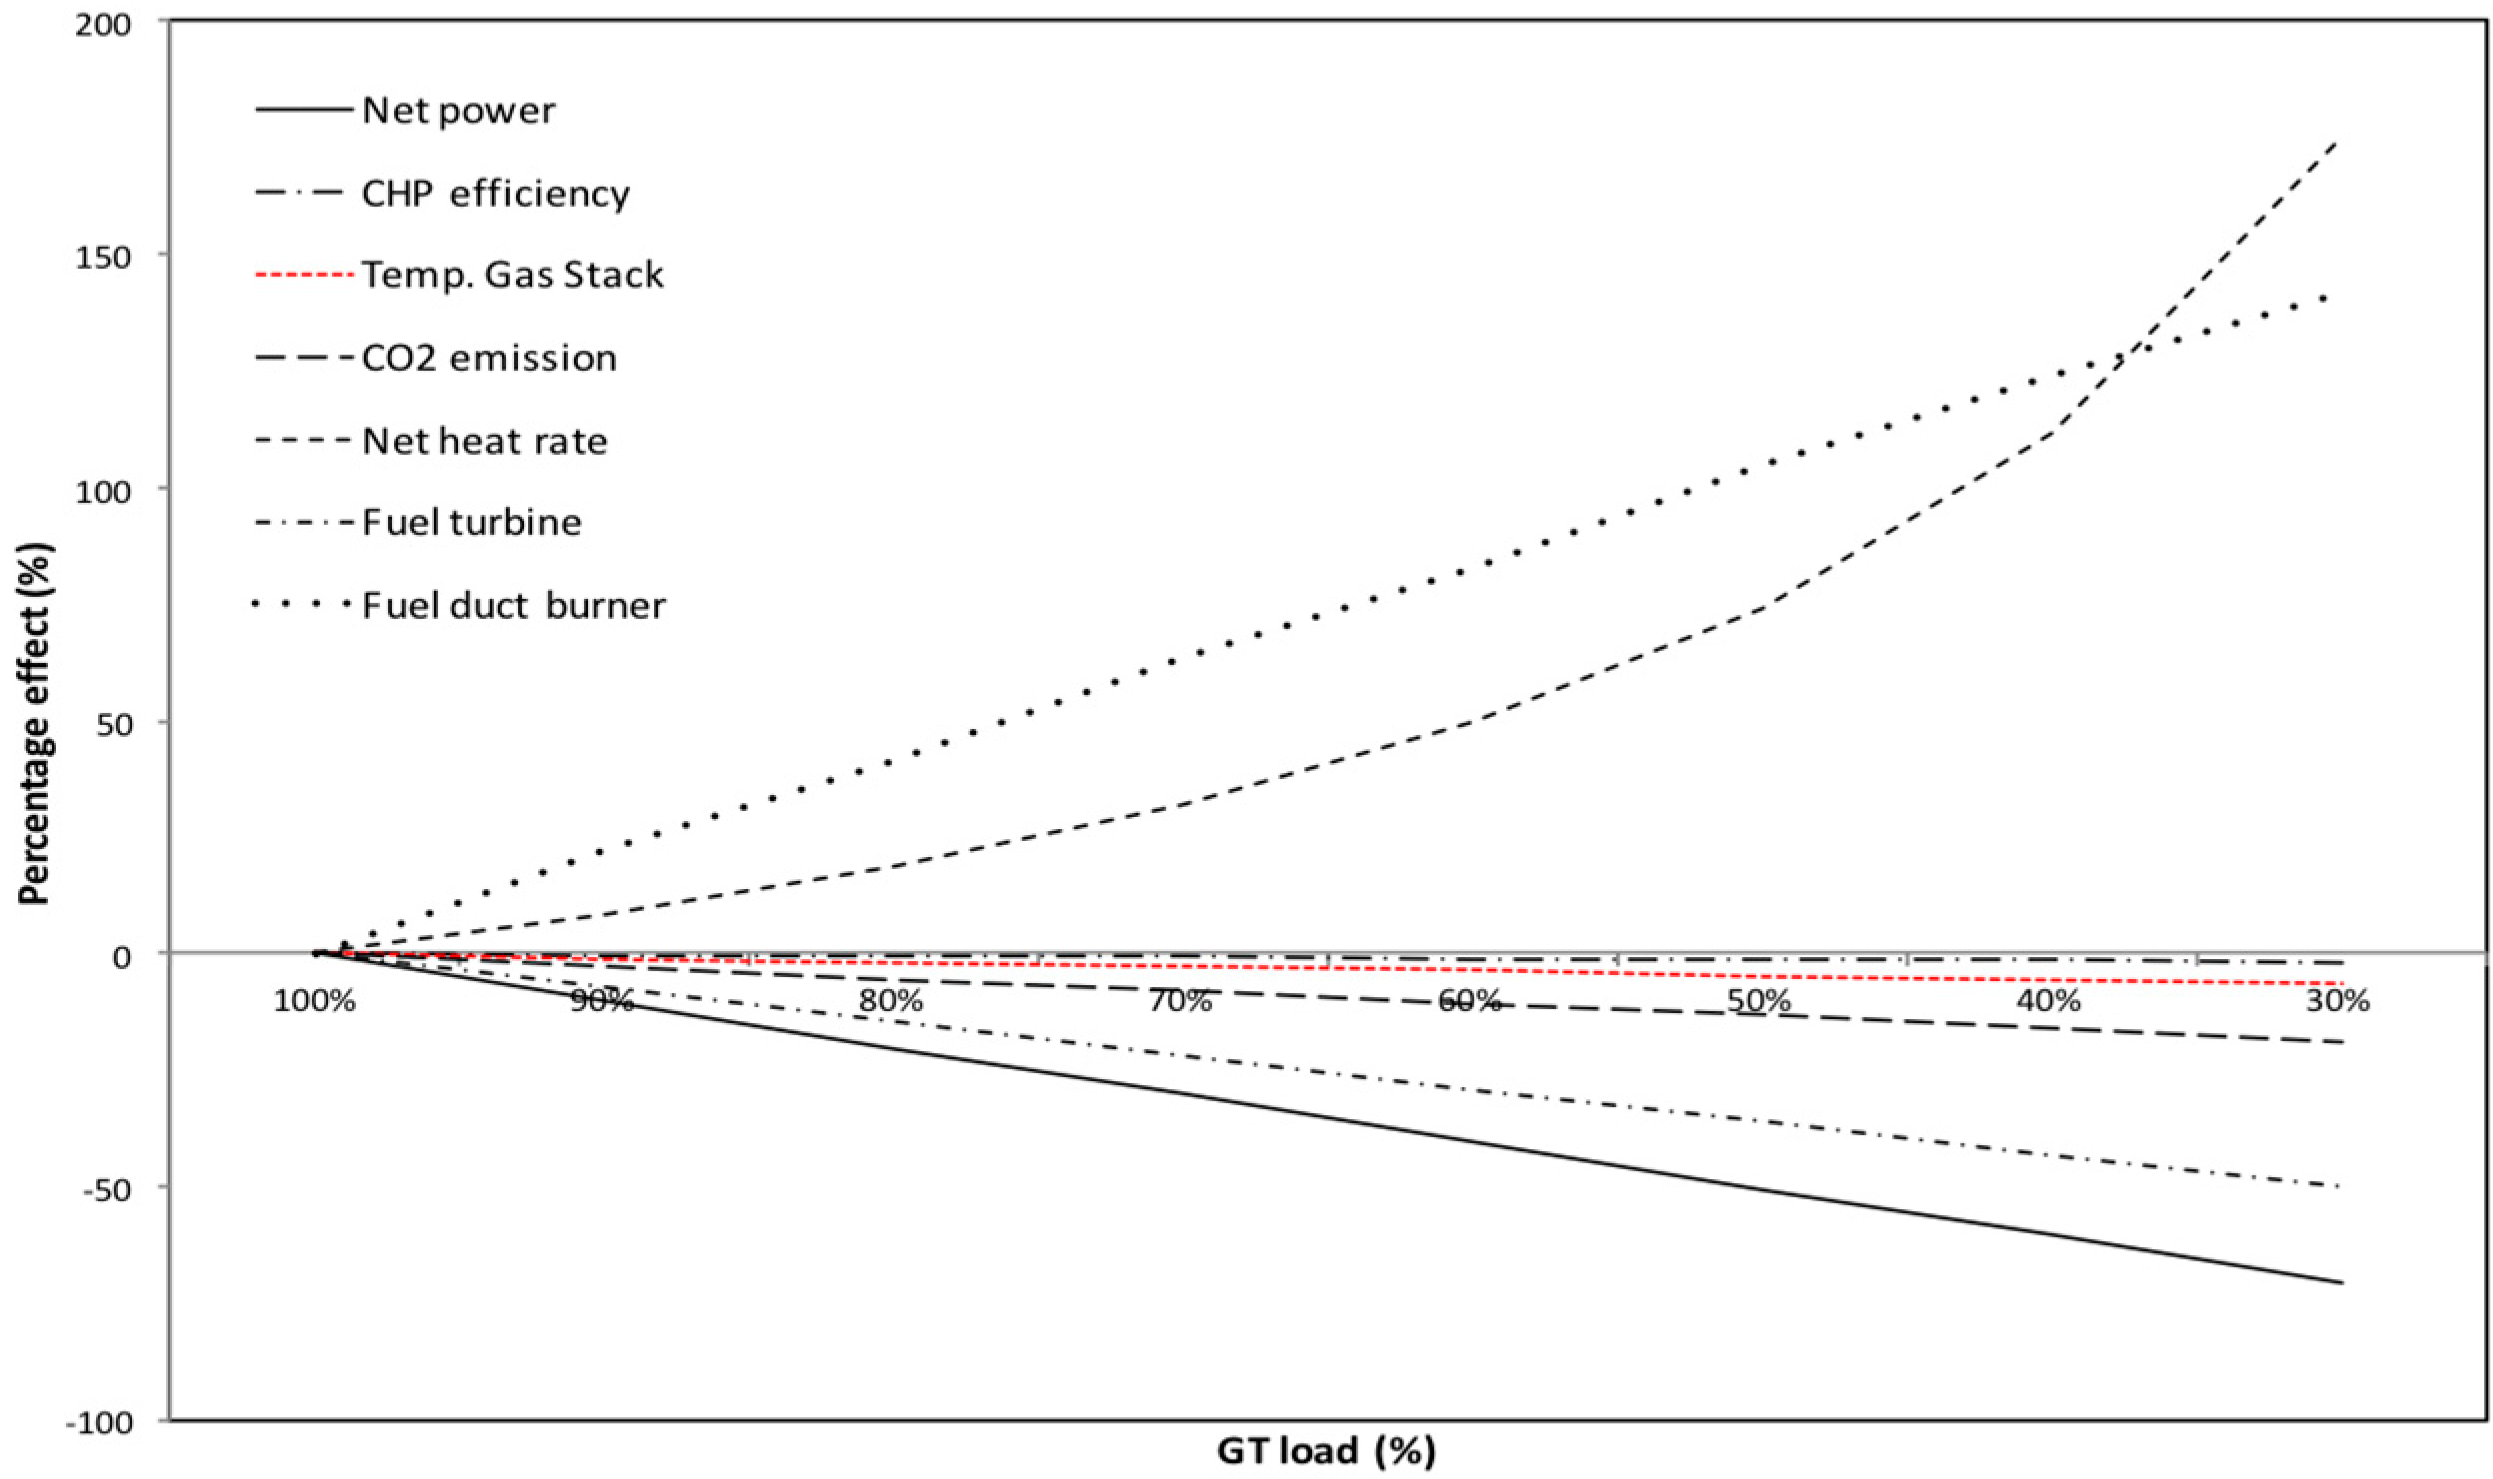
The analysis of the system was performed in case of a variation in the turbine load, decreasing from 100 to 30%, which complies with the building’s thermal requirements, as summarized in Figure 16. Here, it can be observed that by lowering the turbine load, the fuel flow towards it decreases to 50%, while up to 141% more fuel is required in the afterburning, although the total fuel flow decreases by 19%, following the same trend as the CO2 emissions. On the other hand, the temperature of the chimney flue gases decreases by 6.6%, reaching 95.6 °C, which implies that the water vapor present in them does not condense because the atmospheric pressure in the area is 0.7648 bar. Furthermore, the cogeneration efficiency decreases to 1.88%. Finally, the net power decreased to 1.01 MW, and this value is 9.8% less than the total load of the building. However, it must be considered that it is unlikely that 100% of the load will be used at a given time. In other words, with the proposed process, the thermal and electrical limit requirements can be met.
For cogeneration applications, the heat to power ratio of the engine is critical. Onovwiona and Ugursal [25] reported that the percentage of fuel energy input used in producing mechanical work, which results in electrical generation, remains fairly constant until 75% of full load, and thereafter starts decreasing. This means that more fuel is required per kWh of electricity produced at lower partial loadings, thereby leading to decreased efficiency.
3.2.4. Economic Analysis
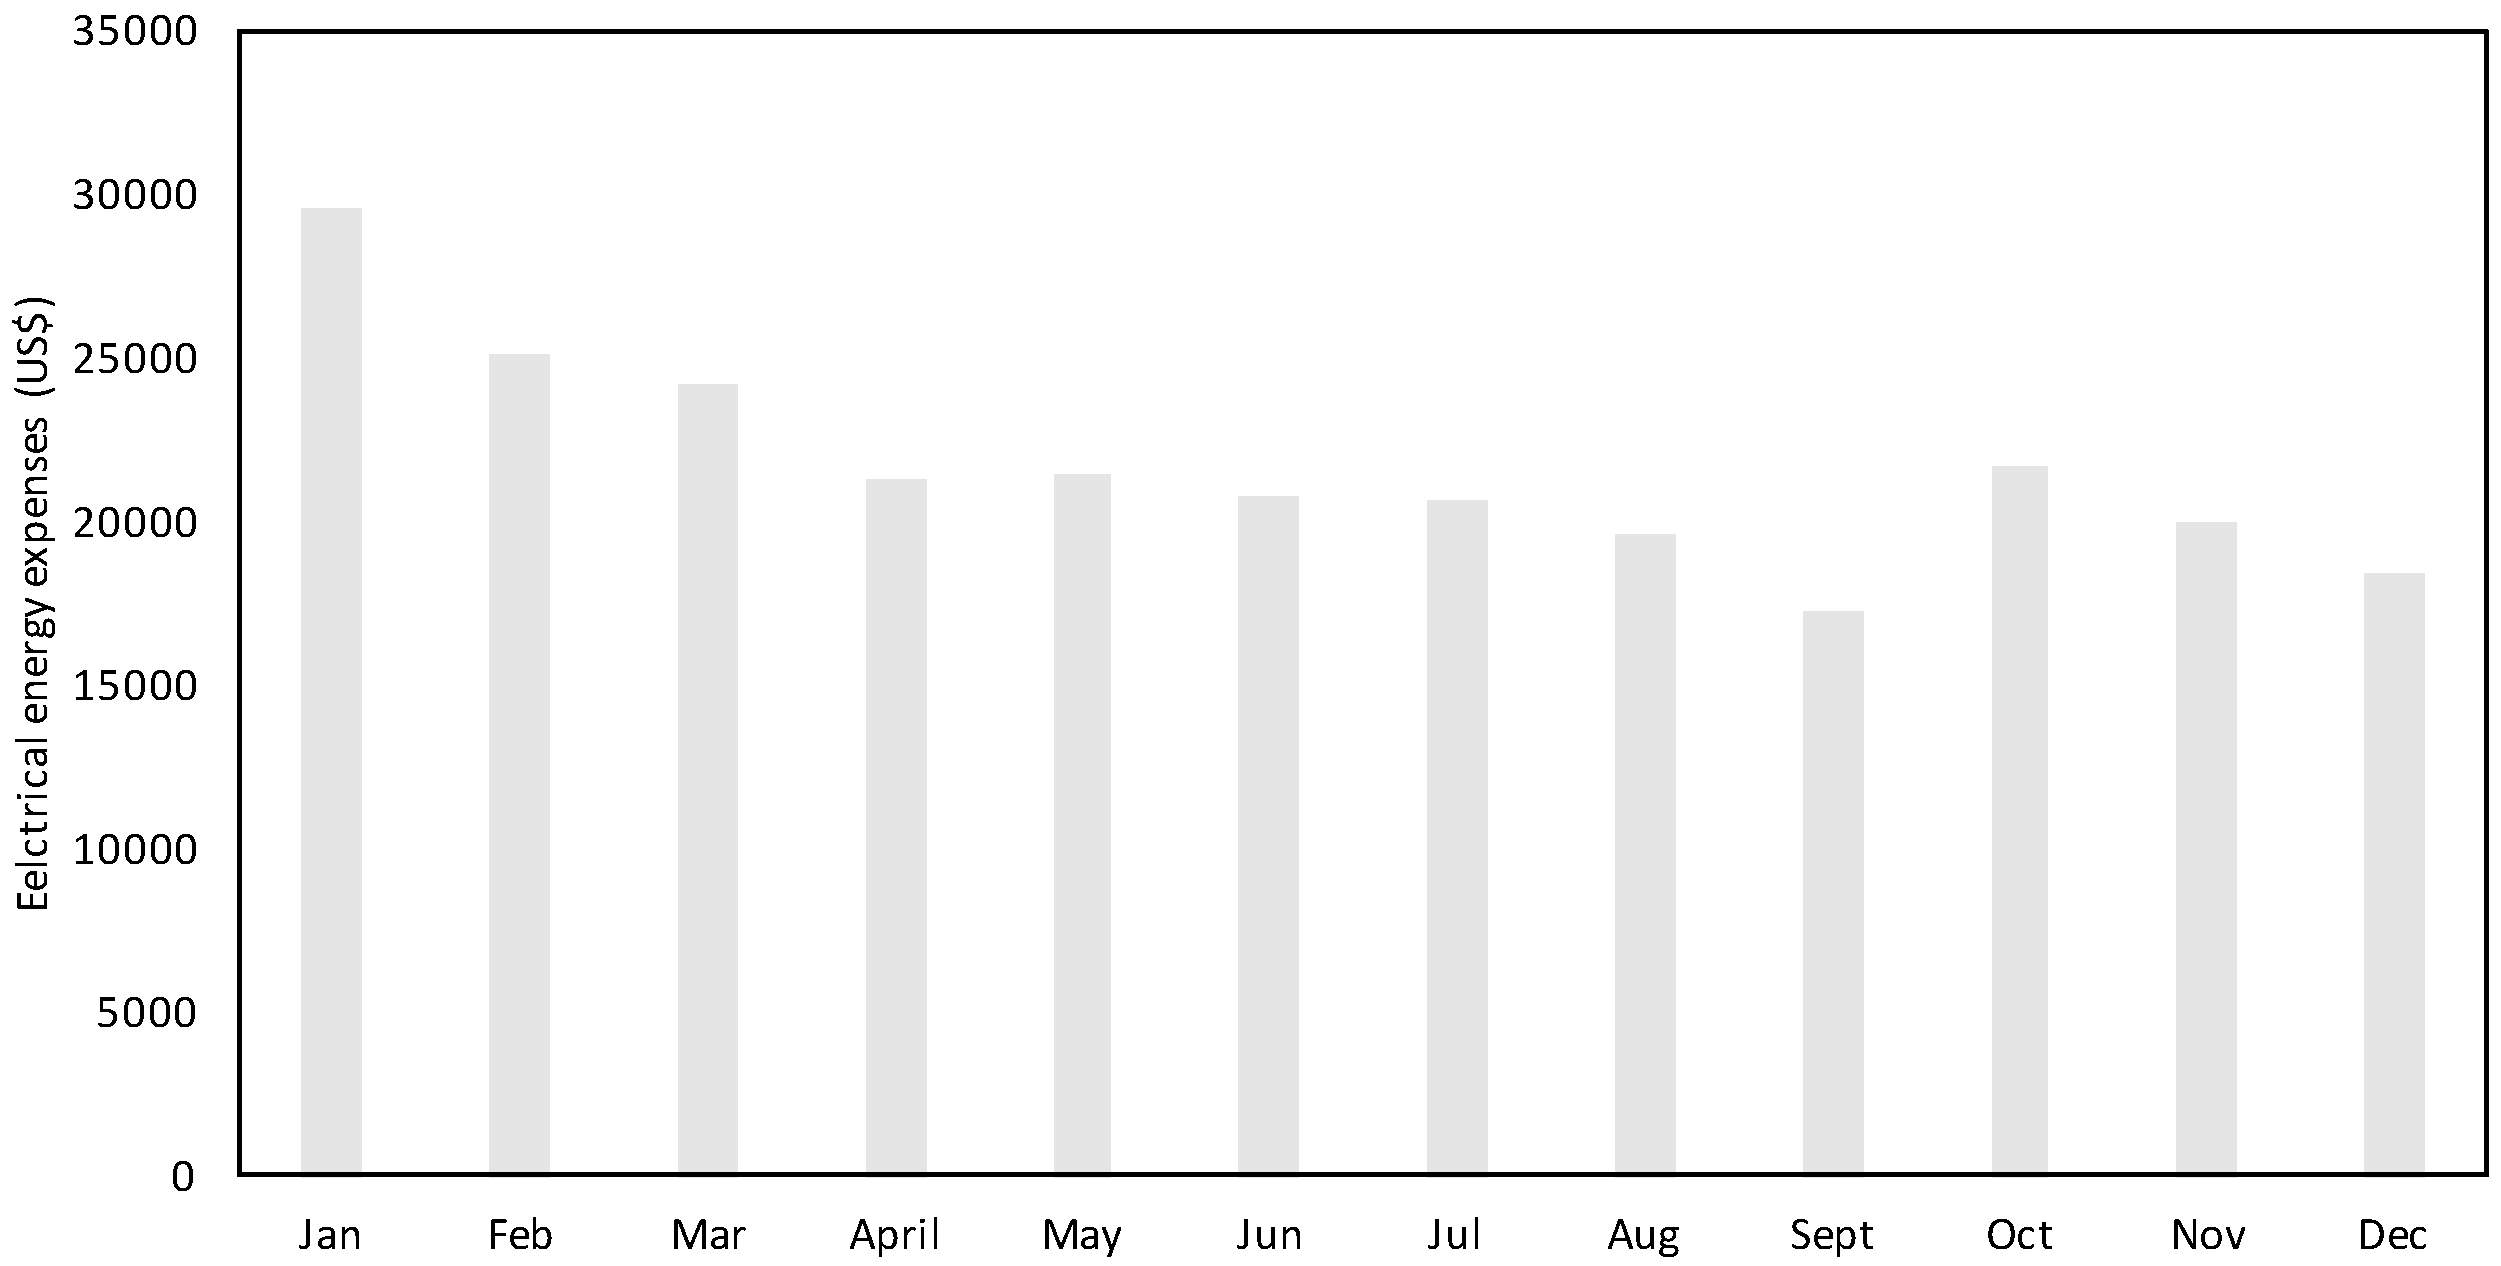
Based on the building’s energy study, the economic expenditure on electric energy, by the building’s users, was determined (see Figure 17). It is important to highlight that the Mexican electric fee to be used for the calculation is the HM Central zone, where the cost of electricity depends on the time of use, seasonality and geographical area. Figure 17 shows that the highest economic expenditure on electricity consumption occurs in January because the winter rate increases with respect to the summer rate. The annual expenditure on electricity consumption then is US$ 29527.
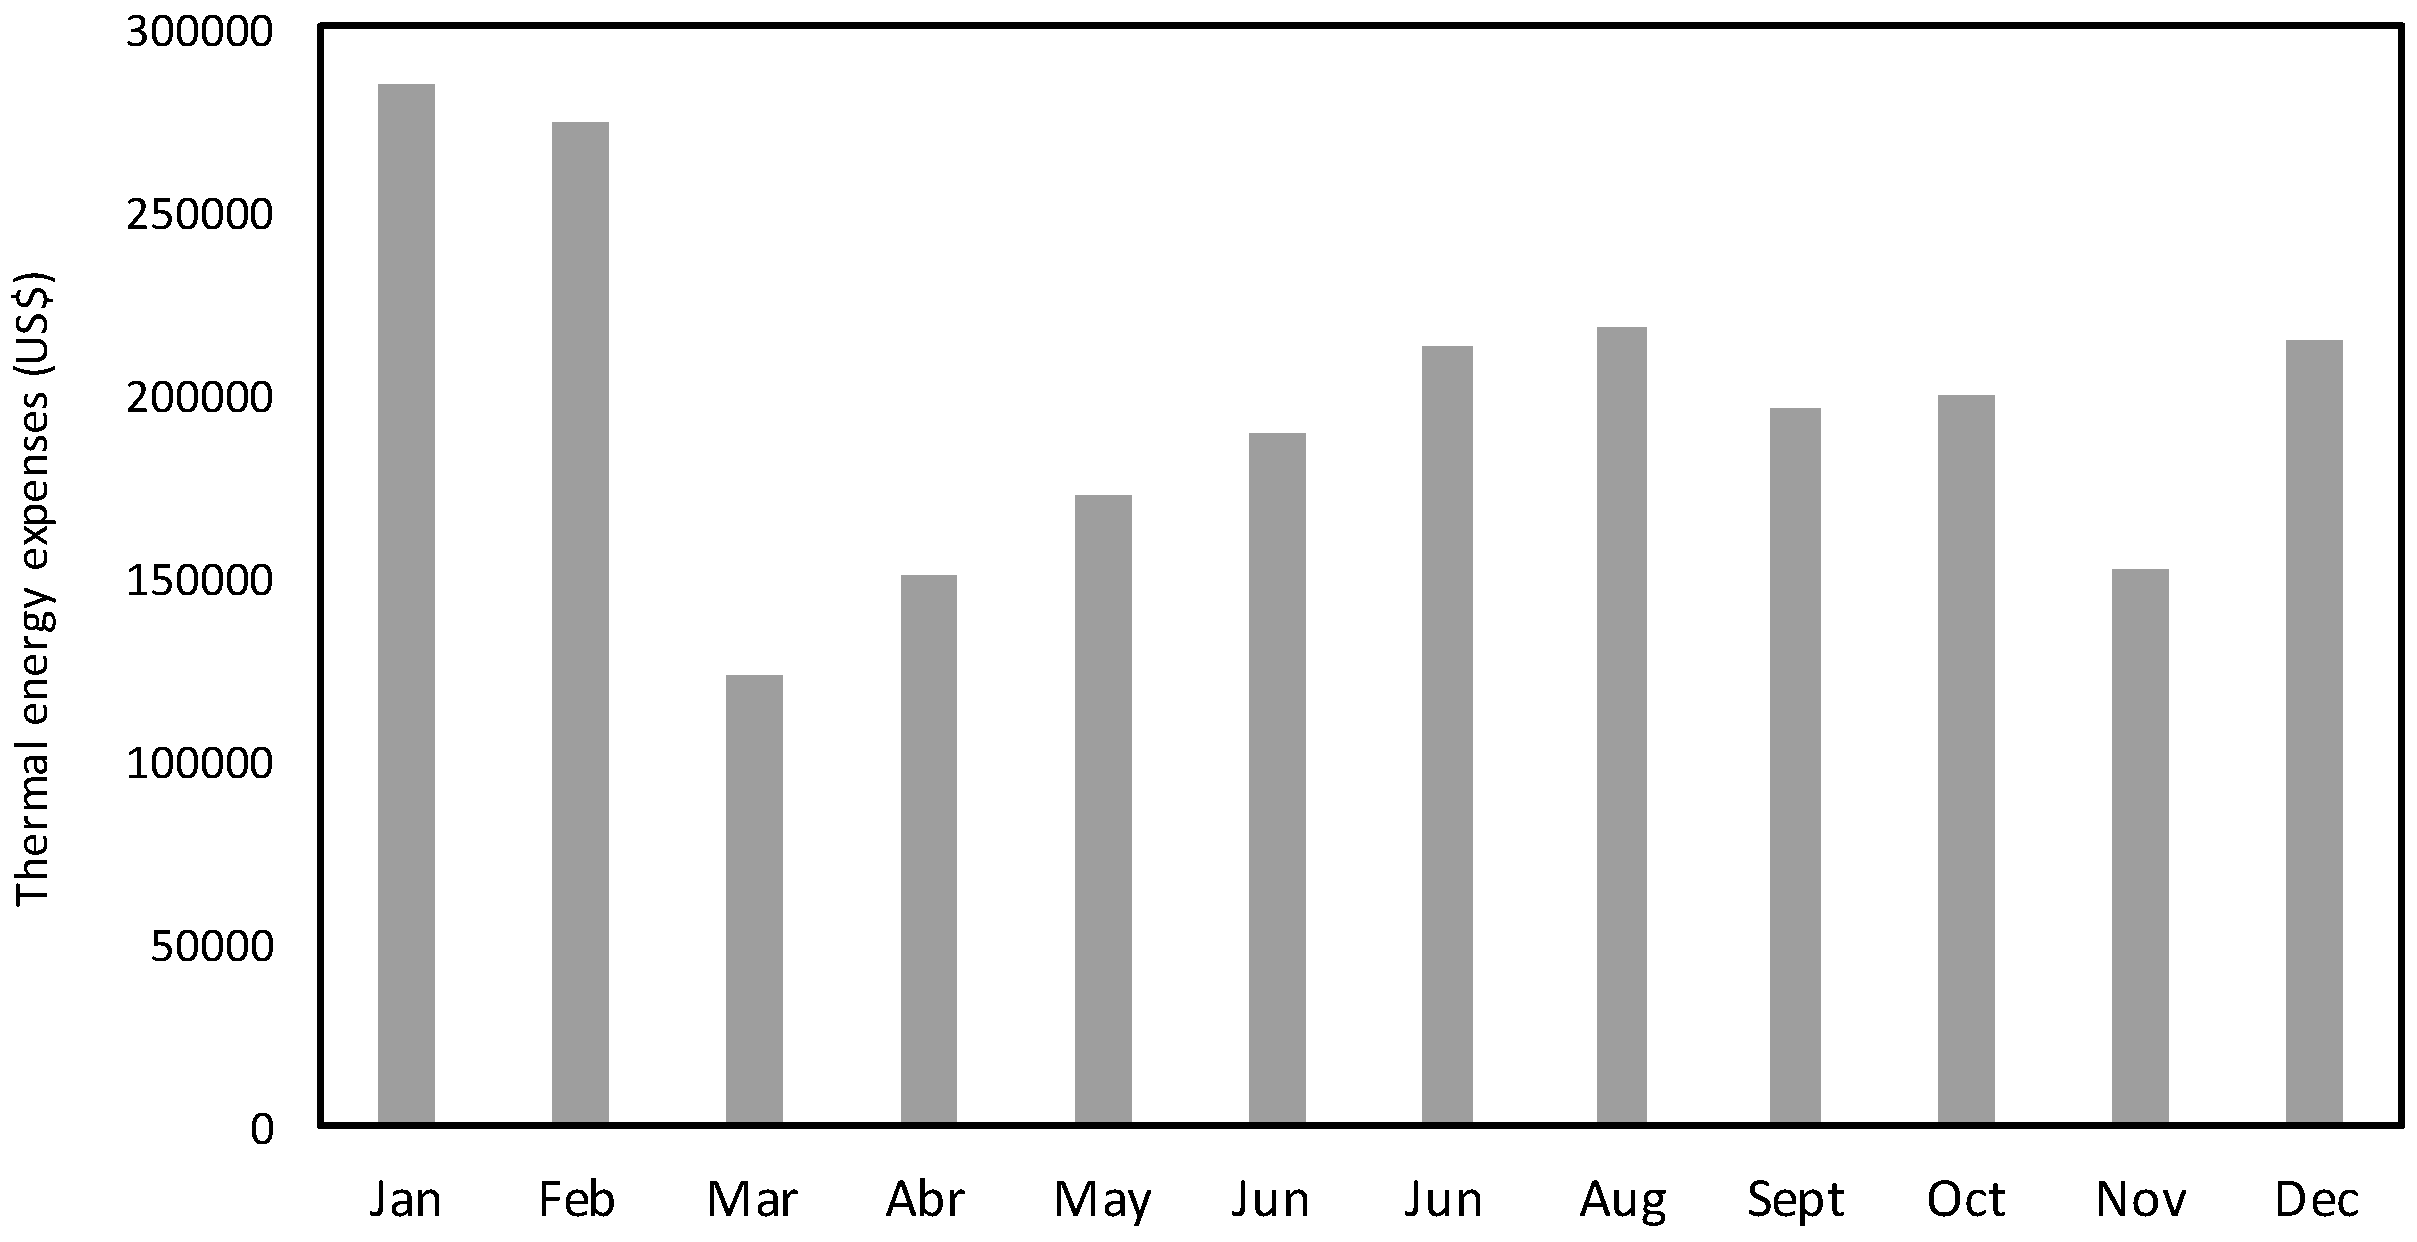
On the other hand, the mean economic expenditure on apartment thermal energy was determined to be US$9471, annually, where the winter months showed greater spending on thermal energy (Figure 18). Moreover, there is the initial investment of the project which mainly considers the purchase of equipment (see Table 6). The largest investment in this cogeneration process is the acquisition of the Gas Turbine, which makes up 87.2% of equipment expenses.
Then, for the economic analysis of the process, the following annual costs are considered (Table 7): Energy of the conventional process and cogeneration, operation and maintenance of the conventional process and cogeneration, and investment in the cogeneration process. The values were compiled from quotations or estimates and information from similar projects. Considering the values in Table 7, the capital or investment recovery will be based on the savings in the consumption of electric and thermal energy, as well as the sale of electric power to the central electricity network, under the prices determined by the market.
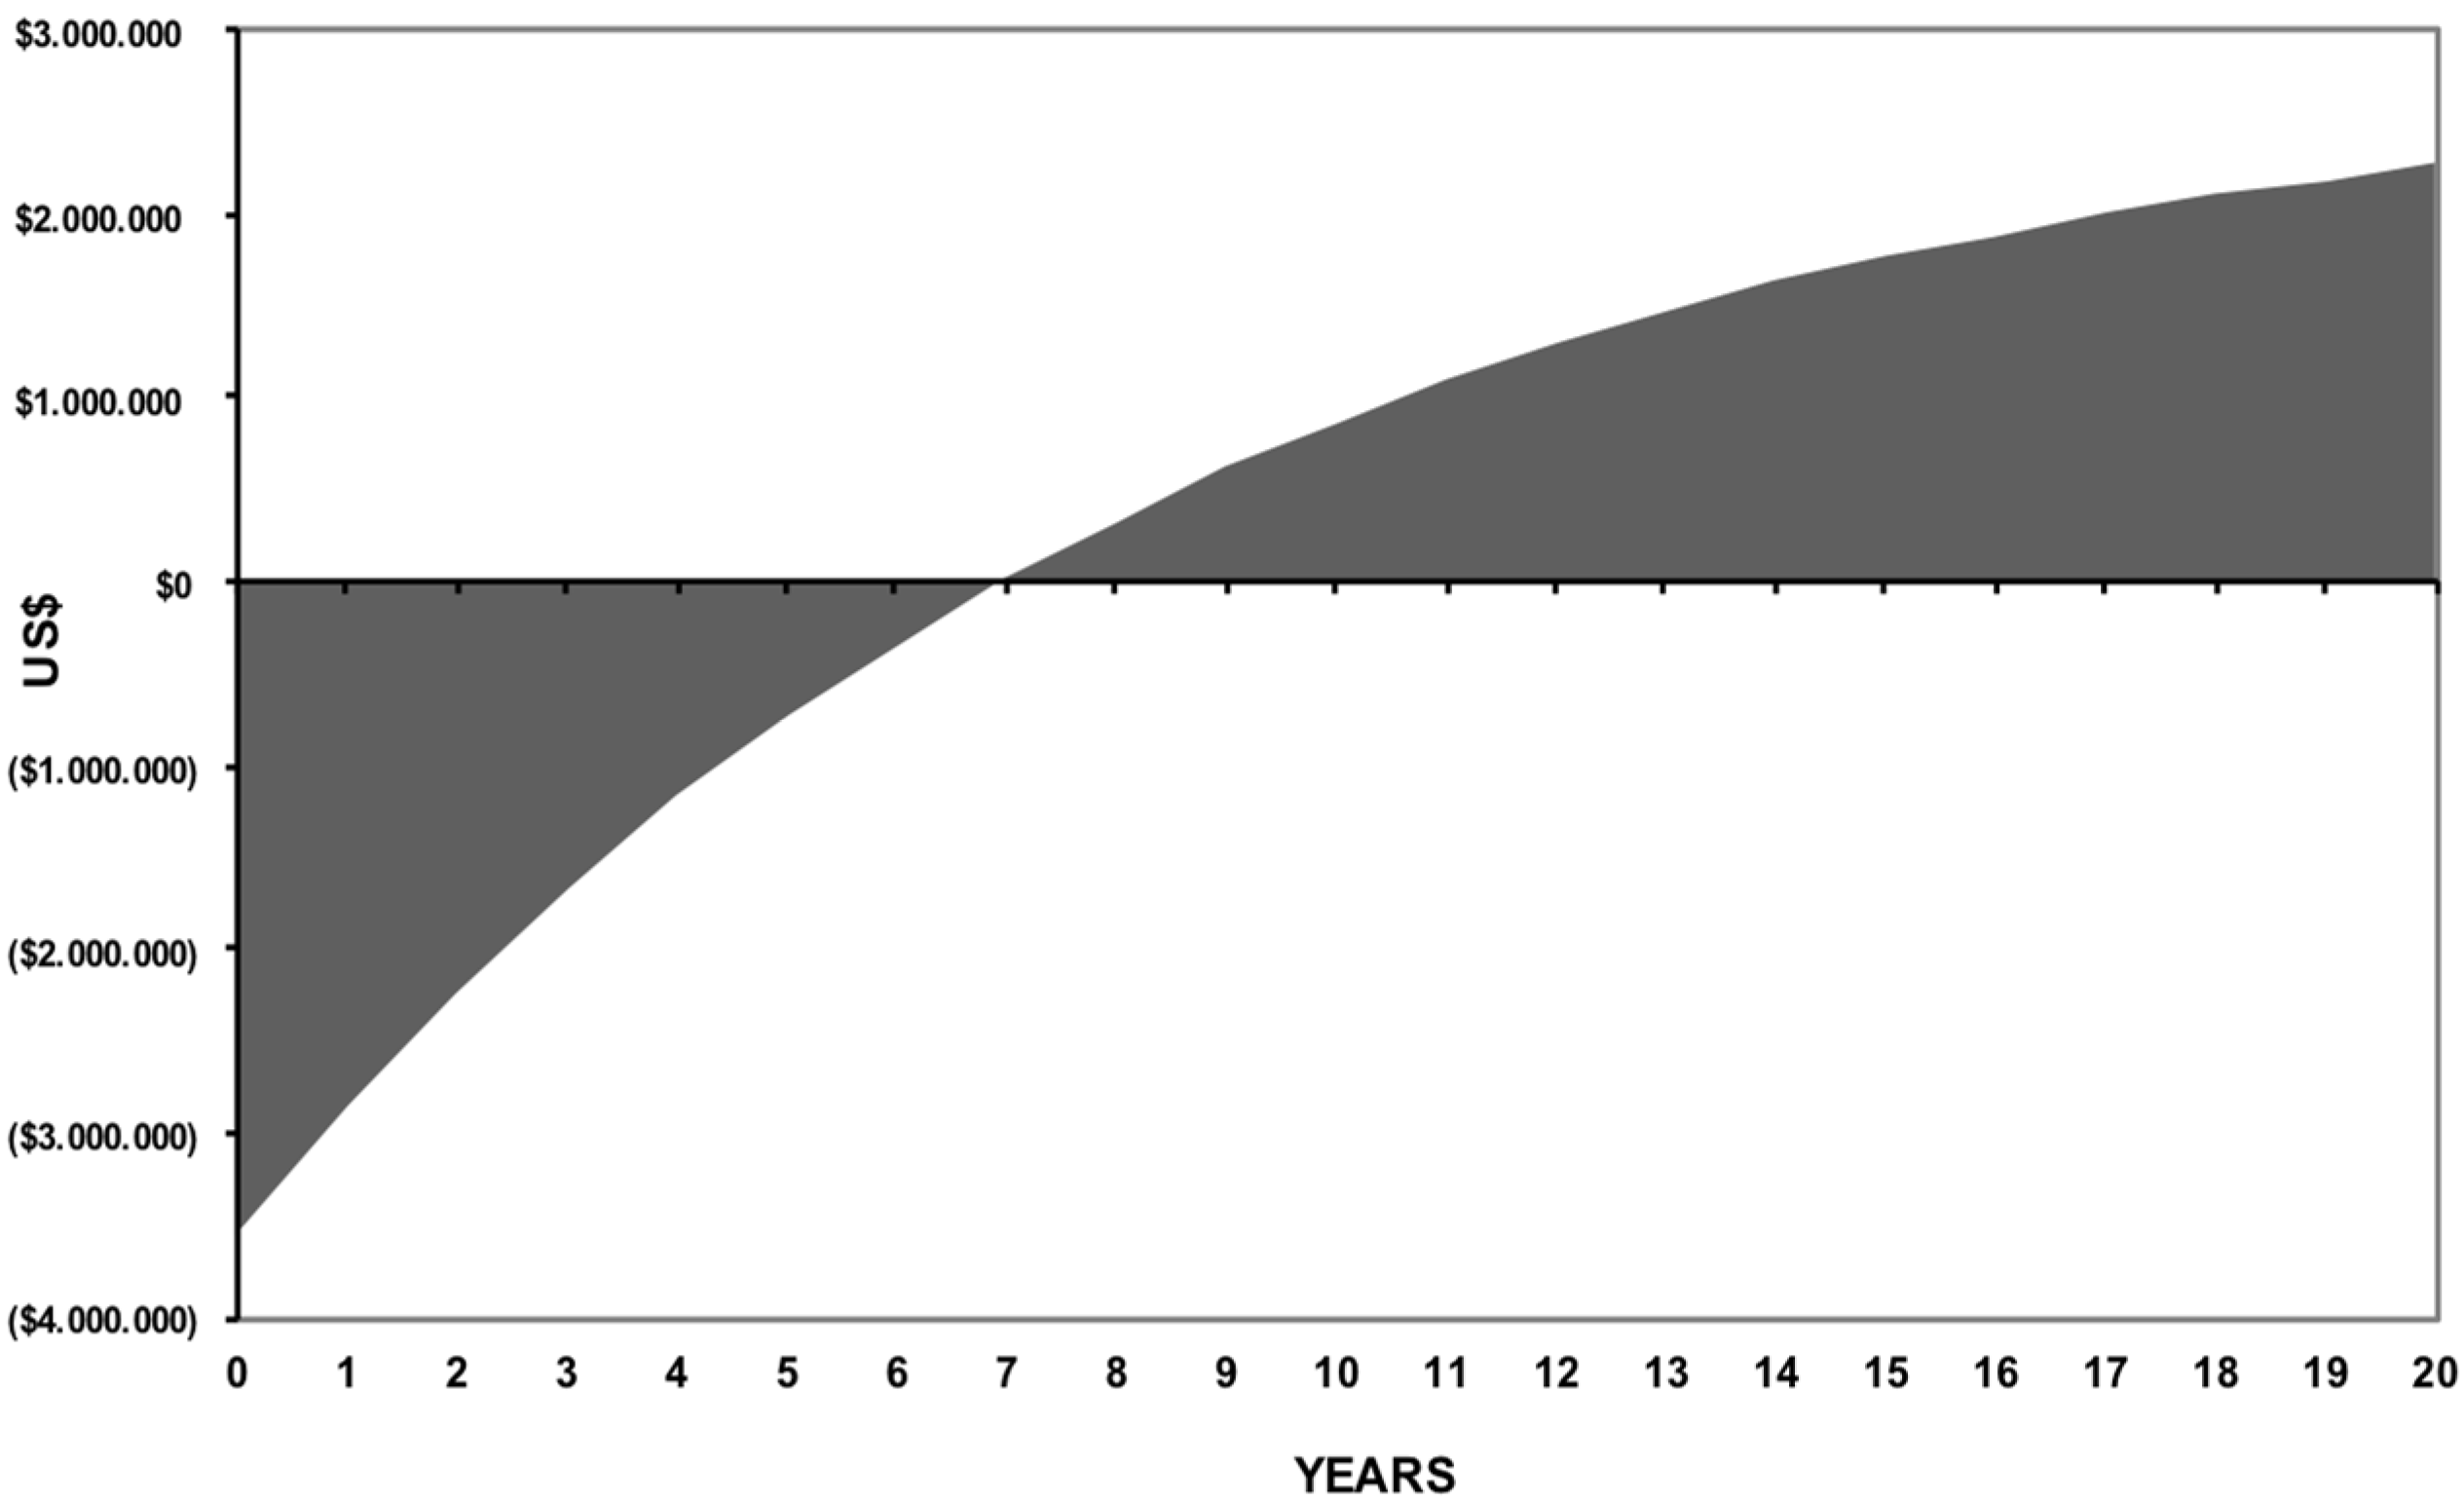
A positive NPV is then produced in the seventh year of operation (see Figure 19) of the cogeneration process, indicating that from that year on the cogeneration process will bring profits to the building being studied. The project is attractive, and an investment recovery period of 7 years is expected, with a natural gas price that does not exceed 0.014 dollars per kWh. However, it no longer is considered attractive if this price is set at around 5 dollars or more. As the gas price refers to that of South Texas (Henry Hub) or Ciudad Pemex to the south of Veracruz, Mexico, the final price is greatly increased by the cost of transportation to Mexico City.
4. Conclusions
The building’s highest energy consumption is in the generation of hot water because it is mainly used in the swimming pool, showers and for the generation of hot and cold air (absorption chiller).
The cogeneration process based on a gas turbine gives better results in the main energy parameters than a process running with combustion engines, i.e. higher cycle efficiency, a lower amount of flows, lower water consumption, lower fuel consumption and therefore a lower amount of CO2 emissions.
It was observed that the ambient temperature (5 to 33 °C) affects with an increasing linear tendency towards the efficiency of the cycle, increasing by 7%, while the generated gross power decreases linearly by 13%. This is because the greater the ambient temperature, the greater the greater enthalpy of the air necessary for the combustion inside the equipment. Such an effect can be visualized in the energy balance system. It is important to highlight that the temperature at the outlet of the chimney should be higher than 100 °C in order to avoid water condensation, along with corrosion of the ducts.
The type of fuel affects the efficiency of the cycle and the power obtained. It is observed that the use of syngas allows a lower cycle efficiency but, in turn, a higher gross power than for the rest of the fuels, while methane shows the opposite trend. These results are due to the calorific power of each compound, with that of Syngas being higher than the rest of the fuels. On the other hand, Syngas is the one that emits the largest amount of CO2, while methane is the one that emits the least. Therefore, the latter is the most environmentally friendly fuel.
By making a variation in the turbine load by decreasing it from 100 to 30%, it was observed that when lowering the load on the turbine, the fuel flow towards the turbine decreases by 50%, while up to 141% more fuel is required in post-combustion, and the total fuel flow decreases by 19%, following the same trend of CO2 emissions.
The results of the technical simulation and the economic and financial evaluation demonstrate that it is possible to take the industrial cogeneration process to the real estate industry; in this specific case, the project is attractive and an investment recovery period of 7 years is expected, with a natural gas price that does not exceed 0.014 dollars per kWh. However, it is not considered attractive any longer if this price is set at around 5 dollars or more. As the gas price refers to that of South Texas (Henry Hub) or Ciudad Pemex to the south of Veracruz, Mexico, the final price is greatly increased by the cost of transportation to Mexico City.
In conclusion, it was shown that the cogeneration process of an apartment building in Polanco area is technically feasible.
Author Contributions
Software, H.V.; Validation, G.L.; Investigation, H.V.; Writing-Original Draft Preparation, H.V.; Supervision, G.L.
Funding
This research was funded by The Pacific Alliance for the Alianza Pacifico Scholarship granted to Hugo Valdés of the Universidad Catolica del Maule, who agreed to finance the collaboration on this study together with Gabriel Leon de los Santos at the UNAM.
Acknowledgments
We wish to thank the Pacific Alliance for its Pacific Alliance Grant awarded to Hugo Valdés from the Catolica del Maule University (Chile), which funded the execution of this study, together with Gabriel León de los Santos from the Nacional Autonoma de Mexico University (Mexico).
Conflicts of Interest
The authors declare no conflict of interest. The funders had no role in the design of the study; in the collection, analyses, or interpretation of data; in the writing of the manuscript, and in the decision to publish the results.
References
- Pérez-Lombard, L.; Ortiz, J.; Pout, C. A review on buildings energy consumption information. Energy Build. 2008, 40, 394–398. [Google Scholar] [CrossRef]
- Xing, Y.; Hewitt, N.; Griffiths, P. Zero carbon buildings refurbishment—A hierarchical pathway. Renew. Sustain. Energy Rev. 2011, 15, 3229–3236. [Google Scholar] [CrossRef]
- Ibn-Mohammed, T.; Greenough, R.; Taylor, S.; Ozawa-Meida, L.; Acquaye, A. Operational vs. embodied emissions in buildings—A review of current trends. Energy Build. 2013, 66, 232–245. [Google Scholar] [CrossRef]
- Nejat, P.; Jomehzadeh, F.; Taheri, M.M.; Gohari, M.; Majid, M.Z.A. A global review of energy consumption, CO2 emissions and policy in the residential sector (with an overview of the top ten CO2 emitting countries). Renew. Sustain. Energy Rev. 2015, 43, 843–862. [Google Scholar] [CrossRef]
- IEA. Transition to Sustainable Buildings: Strategies and Opportunities to 2050; International Energy Agency (IEA): Paris, France, 2013. [Google Scholar]
- International Energy Agency. Tracking Clean Energy Progress 2017; International Energy Agency: Paris, France, 2017. [Google Scholar]
- Secretaría de Energía, México. Balance nacional de energía. 2015. Available online: https://www.gob.mx/sener/documentos/balance-nacional-de-energia (accessed on 28 October 2017).
- Ali, M.M. Energy efficient architecture and building systems to address global warming. Leadersh. Manag. Eng. 2008, 8, 113–123. [Google Scholar] [CrossRef]
- REN21. Renewables 2015 Global Status Report; Renewable Energy Policy Network for 21st Century (REN21 Secretariat): París, France, 2015; ISBN 978-3-9815934-6-4. [Google Scholar]
- Al-Aboosi, F.Y.; El-Halwagi, M.M. An Integrated Approach to Water-Energy Nexus in Shale-Gas Production. Processes 2018, 6, 52. [Google Scholar] [CrossRef]
- Yan, Q.; Qin, C. Environmental and Economic Benefit Analysis of an Integrated Heating System with Geothermal Energy—A Case Study in Xi’an China. Energies 2017, 10, 2090. [Google Scholar] [CrossRef]
- Boles, M.; Cengel, Y. An Engineering Approach, 8th ed.; McGraw-Hill Education: New York, NY, USA, 2014; ISBN 9814595292. [Google Scholar]
- Rezaie, B.; Rosen, M.A. District heating and cooling: Review of technology and potential enhancements. Appl. Energy 2012, 93, 2–10. [Google Scholar] [CrossRef]
- ASPEN Systems Corporation. Combined Heat and Power: A Federal Manager’s Resource Guide: Final Report; Federal Energy Management Program; US Department of Energy: Washington, DC, USA, 2000.
- Havelský, V. Energetic efficiency of cogeneration systems for combined heat, cold and power production. Int. J. Refrig. 1999, 22, 479–485. [Google Scholar] [CrossRef]
- Onovwiona, H.; Ugursal, V. Modeling of internal combustion engine based cogeneration systems for residential applications. Appl. Therm. Eng. 2006, 27, 848–861. [Google Scholar] [CrossRef]
- Jana, K.; De, S. Biomass integrated gasification combined cogeneration with or without CO2 capture—A comparative thermodynamic study. Renew. Energy 2014, 72, 243–252. [Google Scholar] [CrossRef]
- Ünal, A.; Ercan, S.; Kayakutlu, G. Optimisation studies on tri-generation: A review. Int. J. Energy Res. 2015, 39, 1311–1334. [Google Scholar] [CrossRef]
- Shabbir, I.; Mirzaeian, M. Feasibility analysis of different cogeneration systems for a paper mill to improve its energy efficiency. Int. J. Hydrog. Energy 2016, 41, 16535–16548. [Google Scholar] [CrossRef]
- Dincer, I.; Zamfirescu, C. Renewable-energy-based multigeneration systems. Int. J. Energy Res. 2012, 36, 1403–1415. [Google Scholar] [CrossRef]
- Buoro, D.; Pinamonti, P.; Reini, M. Optimization of a distributed cogeneration system with solar district heating. Appl. Energy 2014, 124, 298–308. [Google Scholar] [CrossRef]
- Yu, Y.; Chen, H.; Chen, L. Comparative Study of Electric Energy Storages and Thermal Energy Auxiliaries for Improving Wind Power Integration in the Cogeneration System. Energies 2018, 11, 263. [Google Scholar] [CrossRef]
- Pereira, J.S.; Ribeiro, J.B.; Mendes, R.; Vaz, G.C.; André, J.C. ORC based micro-cogeneration systems for residential application—A state of the art review and current challenges. Renew. Sustain. Energy Rev. 2018, 92, 728–743. [Google Scholar] [CrossRef]
- U.S. DOE Combined Heat and Power Installation Database. Available online: https://doe.icfwebservices.com/chpdb/ (accessed on 17 March 2018).
- Onovwiona, H.; Ugursal, V. Residential cogeneration systems: Review of the current technology. Renew. Sustain. Energy Rev. 2006, 10, 389–431. [Google Scholar] [CrossRef]
- Dennis, K. Environmentally beneficial electrification: Electricity as the end-use option. Electr. J. 2015, 28, 100–112. [Google Scholar] [CrossRef]
- Joelsson, A. Primary Energy Efficiency and CO2 Mitigation in Residential Buildings. Ph.D. Thesis, Mid Sweden University, Östersund, Sweden, 2008. [Google Scholar]
- Fong, K.F.; Lee, C.K. System analysis and appraisal of SOFC-primed micro cogeneration for residential application in subtropical region. Energy Build. 2016, 128, 819–826. [Google Scholar] [CrossRef]
- Mohamed, A.; Hasan, A.; Siren, K. Cost optimal and net zero energy office buildings solutions using small scale biomass-based cogeneration technologies. In Proceedings of the 2nd IBPSA-Italy Conference, Building Simulation Applications BSA 2015, Bozen-Bolzano, Italy, 4–6 February 2015; Available online: http://porto.polito.it/id/eprint/2626933 (accessed on 30 May 2016).
- McDonald, E.; Kegel, M.; Tamasauskas, J. Building Energy Efficiency Assessment of Renewable and Cogeneration Energy Efficiency Technologies for the Canadian High Arctic. In Proceedings of the International High-Performance Buildings Conference, West Lafayette, Indiana, 11–14 July 2016; p. 175. Available online: http://docs.lib.purdue.edu/ihpbc/175 (accessed on 28 November 2016).
- Somcharoenwattana, W.; Menke, C.; Kamolpus, D.; Gvozdenac, D. Study of operational parameters improvement of natural-gas cogeneration plant in public buildings in Thailand. Energy Build. 2011, 43, 925–934. [Google Scholar] [CrossRef]
- Tchanche, B.F.; Lambrinos, G.; Frangoudakis, A.; Papadakis, G. Low-grade heat conversion into power using organic Rankine cycles–A review of various applications. Renew. Sustain. Energy Rev. 2011, 15, 3963–3979. [Google Scholar] [CrossRef]
- Esen, M.; Yuksel, T. Experimental evaluation of using various renewable energy sources for heating a greenhouse. Energy Build. 2013, 65, 340–351. [Google Scholar] [CrossRef]
- Chua, K.J.; Chou, S.K.; Yang, W.M.; Yan, J. Achieving better energy-efficient air conditioning—A review of technologies and strategies. Appl. Energy 2013, 104, 87–104. [Google Scholar] [CrossRef]
- Rincón, L.; Becerra, L.; Moncada, J.; Cardona, C. Techno-economic analysis of the use of fired cogeneration systems based on sugar cane bagasse in south eastern and mid-western regions of Mexico. Waste Biomass Valorization 2014, 5, 189–198. [Google Scholar] [CrossRef]
- Marin-Sanchez, J.E.; Rodriguez-Toral, M.A. An estimation of cogeneration potential by using refinery residuals in Mexico. Energy Policy 2007, 35, 5876–5891. [Google Scholar] [CrossRef]
- Sheinbaum, C.; Jauregui, I.; Rodríguez, V.L. Carbon dioxide emission reduction scenarios in Mexico for year 2005: Industrial cogeneration and efficient lighting. Mitig. Adapt. Strateg. Glob. Chang. 1997, 2, 359–372. [Google Scholar] [CrossRef]
- Huicochea, A.; Romero, R.J.; Rivera, W.; Gutierrez-Urueta, G.; Siqueiros, J.; Pilatowsky, I. A novel cogeneration system: A proton exchange membrane fuel cell coupled to a heat transformer. Appl. Therm. Eng. 2013, 50, 1530–1535. [Google Scholar] [CrossRef]
- García, C.A.; García-Treviño, E.S.; Aguilar-Rivera, N.; Armendáriz, C. Carbon footprint of sugar production in Mexico. J. Clean. Prod. 2016, 112, 2632–2641. [Google Scholar] [CrossRef]
- Fuentes-Cortés, L.F.; Santibañez-Aguilar, J.E.; Ponce-Ortega, J.M. Optimal design of residential cogeneration systems under uncertainty. Comput. Chem. Eng. 2016, 88, 86–102. [Google Scholar] [CrossRef]
- Weber, B.; Cerro, E.; Martínez, I.G.; Rincón, E.; Duran, M.D. Efficient Heat Generation for Resorts. Energy Procedia 2014, 57, 2666–2675. [Google Scholar] [CrossRef]
- Mokheimer, E.M.; Dabwan, Y.N.; Habib, M.A. Optimal integration of solar energy with fossil fuel gas turbine cogeneration plants using three different CSP technologies in Saudi Arabia. Appl. Energy 2017, 185, 1268–1280. [Google Scholar] [CrossRef]
- Barigozzi, G.; Perdichizzi, A.; Ravelli, S. Performance prediction and optimization of a waste-to-energy cogeneration plant with combined wet and dry cooling system. Appl. Energy 2014, 115, 65–74. [Google Scholar] [CrossRef]
- Bimüller, J.D.; Nord, L.O. Process Simulation and Plant Layout of a Combined Cycle Gas Turbine for Oshore Oil and Gas Installations. J. Power Technol. 2015, 95, 40. [Google Scholar]
- Frunzulica, R.; Damian, A.; Baciu, R.; Barbu, C. Analysis of a CHP Plant Operation for Residential Consumers. In Sustainable Energy in the Built Environment-Steps Towards nZEB; Springer International Publishing: New York, NY, USA, 2014; pp. 77–86. [Google Scholar]
- Murugan, S.; Horák, B. A review of micro combined heat and power systems for residential applications. Renew. Sustain. Energy Rev. 2016, 64, 144–162. [Google Scholar] [CrossRef]
- Caramés, T. Diseño conceptual de una instalación de cogeneración con turbina de gas. Bachelor’s Thesis, Escuela Técnica Superior de Náutica, Universidad de Cantabria, Cantabria, Spain, 2012. [Google Scholar]
- Sartor, K.; Quoilin, S.; Dewallef, P. Simulation and optimization of a CHP biomass plant and district heating network. Appl. Energy 2014, 130, 474–483. [Google Scholar] [CrossRef]
- Di Marcoberardino, G.; Roses, L.; Manzolini, G. Technical assessment of a micro-cogeneration system based on polymer electrolyte membrane fuel cell and fluidized bed autothermal reformer. Appl. Energy 2016, 162, 231–244. [Google Scholar] [CrossRef]
- Mohsenzadeh, M.; Shafii, M.B. A novel concentrating photovoltaic/thermal solar system combined with thermoelectric module in an integrated design. Renew. Energy 2017, 113, 822–834. [Google Scholar] [CrossRef]
- Medina, E.; Olmos, J.; Sánchez, A.; Valdez, E. Propuesta y análisis de un sistema fotovoltaico de autoabastecimiento eléctrico en un edificio de departamentos en Polanco. Bachelor’s Thesis, Universidad Nacional Autónoma de México, México, Mexico, 2014. [Google Scholar]
- Guelpa, E.; Barbero, G.; Sciacovelli, A.; Verda, V. Peak-shaving in district heating systems through optimal management of the thermal request of buildings. Energy 2017, 137, 706–714. [Google Scholar] [CrossRef]
- Quispe, C. Análisis energético de un sistema de cogeneración con ciclo combinado y gasificación para la industria azucarera. Bachelor’s Thesis, Universidad de Piura, Piura, Perú, 2010. [Google Scholar]
- Ahmadi, G.; Toghraie, D.; Akbari, O.A. Efficiency improvement of a steam power plant through solar repowering. Int. J. Exergy 2017, 22, 158–182. [Google Scholar] [CrossRef]
- Keynia, F. An optimal design to provide combined cooling, heating, and power of residential buildings. Int. J. Model. Simul. 2018, 1–16. [Google Scholar] [CrossRef]
- Ahmadi, G.; Toghraie, D.; Akbari, O.A. Technical and environmental analysis of repowering the existing CHP system in a petrochemical plant: A case study. Energy 2018, 159, 937–949. [Google Scholar] [CrossRef]
- Basrawi, F.; Yamada, T.; Nakanishi, K.; Naing, S. Effect of ambient temperature on the performance of micro gas turbine with cogeneration system in cold region. Appl. Therm. Eng. 2011, 31, 1058–1067. [Google Scholar] [CrossRef]
Figure 1.
Recent trends in the buildings: (a) Decomposition of final energy demand; (b) Final energy use by fuel and per person [6].
Figure 1.
Recent trends in the buildings: (a) Decomposition of final energy demand; (b) Final energy use by fuel and per person [6].

Figure 2.
Heat and electricity production scheme for different cogeneration configurations.

Figure 3.
Representation of the number of articles published in WoS and Scopus from 1978 to 2018.

Figure 4.
Authors network of research on cogeneration applied to buildings. Determined with the Citespace software.
Figure 4.
Authors network of research on cogeneration applied to buildings. Determined with the Citespace software.

Figure 5.
Photographs of the building under study.

Figure 6.
Thermal demand of users for winter and summer.

Figure 7.
Thermoflow diagram of the thermal energy requirements for the building without cogeneration. Units: .
Figure 7.
Thermoflow diagram of the thermal energy requirements for the building without cogeneration. Units: .

Figure 8.
Percentage of annual electrical requirement for building users.

Figure 9.
General scheme of the cogeneration system for the building under study.

Figure 10.
Scheme of the simulated cogeneration process with the Thermoflow©, considering a gas turbine as an energy source. Carso II CHP/Gas Turbine with HRSG and natural gas to supply 100% of thermic demand.
Figure 10.
Scheme of the simulated cogeneration process with the Thermoflow©, considering a gas turbine as an energy source. Carso II CHP/Gas Turbine with HRSG and natural gas to supply 100% of thermic demand.

Figure 11.
Variation of the gross generation of electrical power and the cogeneration efficiency according to the ambient temperature.
Figure 11.
Variation of the gross generation of electrical power and the cogeneration efficiency according to the ambient temperature.

Figure 12.
Heat rate of the system in the function of the variation of the ambient temperature. Image obtained from Thermoflow.
Figure 12.
Heat rate of the system in the function of the variation of the ambient temperature. Image obtained from Thermoflow.

Figure 13.
Contrast between cogeneration efficiency and gross electric power.

Figure 14.
Emission of ton/year of CO2 of each fuel according to the cogeneration efficiency.

Figure 15.
Linear trend between the cogeneration efficiency and the temperature of the HRSG gas outlet.
Figure 15.
Linear trend between the cogeneration efficiency and the temperature of the HRSG gas outlet.

Figure 16.
Percentage of the turbine load effect on the turbine load net power, cogeneration efficiency, chimney flue gas temperature, CO2 emission, net heat ratio, turbine fuel flow and afterburner fuel flow.
Figure 16.
Percentage of the turbine load effect on the turbine load net power, cogeneration efficiency, chimney flue gas temperature, CO2 emission, net heat ratio, turbine fuel flow and afterburner fuel flow.

Figure 17.
Monthly electricity expenses (US$) for the building.

Figure 18.
Monthly expenses (US$) on the building’s thermal energy.

Figure 19.
Recovery period of investment (MARR 12.1%).


Table 1.
Number of apartments according to surface (m2), number of people and showers [51].
Table 1.
Number of apartments according to surface (m2), number of people and showers [51].
| Items | Amount | Amount | Amount |
|---|---|---|---|
| Surface (m2) | <75 | 105–120 | 130–182 |
| Apartments (n°) | 60 | 88 | 85 |
| People (n°) | 2 | 4 | 5 |
| Apartments (n°) | 60 | 155 | 18 |
| Showers (n°) | 1 | 2 | 3 |
| Apartments (n°) | 60 | 93 | 80 |
Table 2.
Percentage of thermal demand of building.
| Places of Energy Consumption | Winter (%) | Summer (%) |
|---|---|---|
| Shower | 5.33 | 7.67 |
| Bathroom sink | 0.33 | 0.05 |
| Kitchen sink | 0.21 | 0.30 |
| Washing machine | 0.44 | 0.82 |
| Swimming pools | 6.21 | 7.61 |
| Hot air | 86.39 | 2.11 |
| Cold air | 1.40 | 81.45 |
Table 3.
Energy requirements of the system.
| Requirement | Value | Unit |
|---|---|---|
| Hot water flow (swimming pool) | 3.16 | kg/s |
| Energy for the swimming pool | 52.06 | kW |
| Hot water flow (Showers, washing machine, kitchen and bathroom sink | 34.40 | kg/s |
| Energy for showers, washing machine, kitchen and bathroom sink | 5033 | kW |
| Hot water flow | 32.33 | kg/s |
| Hot air energy | 426 | kW |
| Cold air flow | 28.40 | kg/s |
| Cold air energy | 1116 | kW |
Table 4.
Main results of the GT and EC Process.
| Property | Unit | GT | CE |
|---|---|---|---|
| Gross power | kW | 3475 | 15258 |
| Net power | kW | 3420 | 15090 |
| Total auxiliares | kW | 55.41 | 167.6 |
| Net process heat output | kW | 8533 | 8517 |
| CHP efficiency | % | 84.44 | 67.92 |
| Net heat rate (LHV) | kJ/kWh | 14901 | 8291 |
| Net electric efficiency (LHV) | % | 24.16 | 43.42 |
| Air stream | N° | 29 | 31 |
| Water stream | N° | 53 | 68 |
| Fuel stream | N° | 3 | 2 |
| Cycle heat imbalance | % | 0.0002 | 0.0011 |
| Cycle mass imbalance | % | 0 | 0 |
| Water consumption | kg/s | 3.66 | 3.97 |
| Water discharge | kg/s | 1.73 | 1.65 |
| Emissions of CO2 | tonne/year | 22626 | 55554 |
| Fuel consumption | kg/s | 0.283 | 0.694 |
Table 5.
Composition of gases tested in the GT process.
| Combustible | Metane | Natural Gas (with H2S) | Natural Gas (no H2S) | Coke Oven Gas | Digester gas | Erdgas | Landfill Gas | Syngas | |
|---|---|---|---|---|---|---|---|---|---|
| Molecule | |||||||||
| CH4 | 100 | 87.00 | 87.00 | 33.9 | 62 | 97.65 | 63.5 | 5 | |
| H2 | 0 | 0.36 | 0.36 | 47.9 | 0 | 0.00 | 2.5 | 30 | |
| O2 | 0 | 0.07 | 0.07 | 0.6 | 0 | 0.00 | 0.0 | 0 | |
| N2 | 0 | 3.61 | 3.65 | 3.7 | 2 | 0.86 | 0.0 | 5 | |
| CO | 0 | 0.09 | 0.09 | 6.1 | 0 | 0.00 | 0.0 | 35 | |
| CO2 | 0 | 0.34 | 0.34 | 2.6 | 36 | 0.08 | 33.0 | 25 | |
| C2H6 | 0 | 8.46 | 8.46 | 0.0 | 0 | 0.97 | 0.0 | 0 | |
| C2H4 | 0 | 0.03 | 0.03 | 5.2 | 0 | 0.00 | 0.0 | 0 | |
| C3H8 | 0 | 0.00 | 0.00 | 0.0 | 0 | 0.03 | 0.0 | 0 | |
| C4H10 | 0 | 0.00 | 0.00 | 0.0 | 0 | 0.11 | 0.0 | 0 | |
| C5H12 | 0 | 0.00 | 0.00 | 0.0 | 0 | 0.02 | 0.0 | 0 | |
| C6H14 | 0 | 0.00 | 0.00 | 0.0 | 0 | 0.01 | 0.0 | 0 | |
| H2S | 0 | 0.04 | 0.00 | 0.0 | 0 | 0.00 | 0.0 | 0 | |
Table 6.
Summary of the costs associated to the initial investment of the cogeneration process.
| Equipment | Cost (US$) |
|---|---|
| Turbine Gas Model: Siemens SGT-100-1S | 3,100,000 |
| 7 Centrifugal pumps | 17,000 |
| Absorption chiller | 292,000 |
| 7 Heat exchangers | 105,000 |
| Auxiliary equipment | 9000 |
| Equipment import charges | 20,000 |
| Hand labor | 7500 |
| Equipment maintenance | 10,000 |
| Process administrator | 7200 |
| Miscellaneous | 5000 |
| Total | 3,555,500 |
Table 7.
Costs considered in the economic analysis.
| Ítem | Cost (US$) |
|---|---|
| O&M Fixed | 40,800 |
| Conventional Process | |
| Energy/year | 2,784,948 |
| O&M/year | 68,282 |
| Cogeneration Process | |
| * Energy/year | 2,000,781 |
| O&M/year | 66,973 |
| Investment | 3,555,500 |
* The term Energy consider fuel expenses and electric energy sale.
© 2019 by the authors. Licensee MDPI, Basel, Switzerland. This article is an open access article distributed under the terms and conditions of the Creative Commons Attribution (CC BY) license (http://creativecommons.org/licenses/by/4.0/).
Share and Cite
MDPI and ACS Style
Valdés, H.; Leon, G. Cogeneration Process Technical Viability for an Apartment Building: Case Study in Mexico. Processes 2019, 7, 93. https://0-doi-org.brum.beds.ac.uk/10.3390/pr7020093
AMA Style
Valdés H, Leon G. Cogeneration Process Technical Viability for an Apartment Building: Case Study in Mexico. Processes. 2019; 7(2):93. https://0-doi-org.brum.beds.ac.uk/10.3390/pr7020093
Chicago/Turabian StyleValdés, Hugo, and Gabriel Leon. 2019. "Cogeneration Process Technical Viability for an Apartment Building: Case Study in Mexico" Processes 7, no. 2: 93. https://0-doi-org.brum.beds.ac.uk/10.3390/pr7020093
Note that from the first issue of 2016, this journal uses article numbers instead of page numbers. See further details here.