1. Introduction
Objects connected with municipal service management, as well as sewerage systems, pumping stations, sewage sludge processing plants, segregation, recycling, and waste treatment play essential roles in environmental protection. However, they also constitute a potential hazard or nuisance. Nevertheless, if correct operation is ensured and preventive measures are taken if necessary (e.g., when a change in the quality of influent is observed or when hardly-biodegradable or harmful substances (crop protection chemicals, crude-oil derivatives, paints, chemicals from industrial production, disinfectants) appear), the odor nuisance and consequences of malfunctions can be mitigated.
Wastewater treatment plants are technological objects that reduce the pollution load found in wastewater prior to its discharge to a recipient. The processes carried out during wastewater treatment plant operation are connected with the emission of unpleasant odorants into the atmosphere. While discussing the odor nuisance of the considered objects, one should bear in mind that it is connected with the specificity of the medium (i.e., wastewater), as well as the necessity of maintaining certain conditions (e.g., anaerobic or anoxic) that are required to conduct the treatment process correctly [
1,
2,
3,
4,
5].
Municipal wastewater mainly comprises the spent water discharged from houses, public institutions, industrial wastewater, as well as precipitation, seepage, and thaw water, which percolate to sewerage as a result of pipe leaks. The main groups of pollution found in the considered medium include easily degradable organic substances, other organic compounds, biogenic elements (i.e., nitrogen and phosphorus), microorganisms, heavy metals (i.e., mercury, lead, cadmium, chromium, copper, nickel), refractive and toxic substances, and other inorganic compounds.
However, not all pollutants found in water are determined during the wastewater examination, because there are too many of them and the classification of each of them would be impossible. In practice, groups of the most indicative compounds helpful for the assessment of a negative impact on the environment are determined. Organic compounds found in the considered medium are determined using the amount of spent oxygen (O
2) as BOD (biochemical oxygen demand) and COD (chemical oxygen demand); as well as the amount of generated carbon dioxide (CO
2), as TOC (total organic carbon) [
6]. In exploitation practice, total suspension, total nitrogen, or total phosphorus are also determined in the wastewater.
The literature describes the dependencies between a high content of pollution indicators and the odor nuisance of wastewater [
5,
7,
8,
9]. In 2005, Onkal-Engin et al. [
10] studied air samples collected from wastewater treatment plants using a multisensor gas array and classified them by means of artificial neural networks (ANNs). This team stated that the obtained results indicated the possibility of using the method for a general classification of samples, and that the e-nose could be used as a tool for BOD monitoring. Research conducted at the Lublin University of Technology in 2014 and 2016 during the operation of a laboratory sequencing batch reactor (SBR) with activated sludge indicated that the signal from an MOS (metal-oxide-semiconductor) sensor changed when the concentration of aromatic substances increased, while the implemented neural network determined the odor nuisance [
5,
11]. Experiments also indicated that an e-nose could distinguish the stages and states of laboratory-scale bioreactor operation [
12] and the possibility of creating a neural network with the parameters enabling to estimate, for example, the values of COD, TSS (total suspended solids), and the concentration of nitrogen compounds in the considered medium [
11].
The aforementioned papers confirm the validity of using gas multisensor arrays for monitoring the processes occurring in the course of wastewater treatment both under laboratory conditions as well as in the objects at the technical scale. The majority of papers are focused on the odor nuisance of particular devices, and some of them also related this to wastewater quality. Some papers also focused on detecting the presence of crude-oil derivatives, pesticides, and other chemicals in the wastewater flowing into the wastewater treatment plant (WWTP), which can be harmful for activated sludge and cause malfunction of biological treatment processes. Some of them present the possibility of classifying and evaluating the quality of wastewater treated or prepared in laboratory conditions. However, the analysis and assessment of mechanically treated wastewater subjected to highly efficient treatment in bioreactors with activated sludge at full-scale WWTPs where odor nuisance is virtually absent is underrepresented in the literature.
Identifying and—especially—determining the concentration of aromatic compounds is a difficult task. Nevertheless, studies of air quality are carried out by means of several methods. The odor intensity is frequently analyzed using dynamic olfactometry. This method also has certain disadvantages, because it is based on a subjective assessment of testers, and importantly, can only be employed for the samples considered harmless for humans. In turn, the concentrations of odorants are determined on the basis of chromatographic analyses. Unfortunately, this sensitive method of identifying the composition cannot provide information on the odor nuisance. At present, gas sensor arrays are becoming increasingly popular [
3,
7,
8,
9,
13,
14,
15,
16,
17,
18,
19,
20,
21]. Although they are not used for the identification of particular wastewater components and their concentrations (as opposed to chromatographs), they are employed as tools for preliminary sample assessment; additionally, they aid and supplement the traditional methods of determining the pollution indicators of a considered medium.
A system of sensors (i.e., a gas sensor array) coupled with a computing unit (e.g., a computer or microcontroller with an appropriate statistical algorithm) used for the analysis and interpretation of signals constitutes an e-nose (i.e., an imitation of the mammalian olfactory sense) [
11,
22,
23,
24]. Owing to the application of numerous sensors with varied sensitivity and selectivity, it is possible to create a unique combination of signals that is characteristic for a given gas sample—a so-called gas fingerprint [
25]. MOS (metal-oxide-semiconductor) sensors are widely used in the considered arrays; they utilize semiconductor metal oxides, usually tin dioxide (SnO
2) with additives such as platinum, gold, and silver (used in order to improve the selectivity of the gas-sensitive layer) [
26]. Chemisorption occurs on the surface of the sinter. Gas and semiconductor electrons form a bond, and a change in electrical conductivity occurs, which enables to measurements to be taken [
27].
Depending on the type of sensors utilized, they can distinguish between particular components or groups of components found in the considered mixture to a certain degree, which allows for attribution of the readouts with various parameters. Specific information on the investigated gas mixture is obtained using appropriately selected methods of analyzing the obtained complex measurement data. The data obtained from e-nose readouts is multidimensional, resulting in relatively complex interpretation algorithms. A number of statistical techniques can be employed for this purpose, such as principal component analysis (PCA), cluster analysis (CA), linear discriminant analysis (LDA), functional discriminant analysis (FDA), partial least squares discriminant analysis (PLS-DA), generalized linear models with regularized path (GLMNETs), or artificial neural networks (ANNs) [
21,
26,
28,
29,
30,
31,
32,
33,
34]. Our literature review indicated that PCA, cluster analysis, and methods belonging to the group of supervised learning techniques are the most popular [
21,
35,
36,
37].
The PCA statistical method consists of grouping primary data by means of new low-dimensional space generated by linear combinations of primal variables. By reducing the dimensionality of the original space, they can be subsequently presented on graphs [
38]. As a result of transformations, part of the original information is lost, in exchange for a simpler data structure [
39].
There are many types of cluster analysis. The main division involves hierarchical and non-hierarchical cluster analysis. Cluster analysis or clustering involves grouping a set of objects in such a way that the objects in the same group (called a cluster) are more similar (in a certain way) to each other than to those in other groups (clusters). Cluster analysis itself is not a single specific algorithm, but rather the general task to be solved. It can be achieved by various algorithms that differ significantly in their understanding of what constitutes a cluster and how to efficiently find them [
40]. The main idea of non-hierarchical cluster analysis is to find homogeneous clusters of data based on a distance matrix in multidimensional space [
40,
41]. Both methods (PCA and CA) are well-known techniques for the unsupervised classification and visualization of observations in multidimensional space [
42]. Supervised learning techniques can confirm that the previously mentioned hidden structure (homogeneous clusters of data) is applicable for classification purposes. One of predictive supervised machine learning method is the
classification tree technique [
43]. Any system under test can be described by a set of classifications, holding both input and output parameters. The input parameters can also include environment states, pre-conditions, and other rather uncommon parameters [
44]. Each classification can have any number of disjoint classes, describing the occurrence of the parameter. The selection of classes is usually conducted following the principle of equivalence partitioning for abstract test cases and boundary-value analysis for concrete test cases [
45]. Together, all classifications form the classification tree. For semantic purposes, classifications can be grouped into compositions.
Bearing the aforementioned information in mind, the aim of this work is to present the possibility of classifying and thus evaluating the quality of wastewater treated at a full-scale municipal plant by finding a hidden structure in multidimensional space generated on the basis of gas sensors’ readout. Unsupervised methods of machine learning were used to find this structure. Principal component analysis was employed for dimensionality reduction, and cluster analysis for grouping observation purposes. Supervised learning techniques confirmed that the previously mentioned hidden structure (homogeneous clusters of data) is applicable for the purpose of classifying wastewater at different stages of the purification process.
2. Materials and Methods
The considered wastewater originated from the “Hajdów” Municipal Wastewater Treatment Plant in Lublin (South-Eastern Poland), with a daily volume of wastewater
Qd averaging 60,000 m
3 d
−1. This mechanical-biological plant works in a continuous flow mode, and the chambers of the bioreactor utilize a modified Bardenpho [
46]. The samples were taken directly from the technological devices in the mechanical and biological parts, at five points: primary settling tank, mixing chamber, bioreactor inlet, bioreactor outlet, and secondary settling tanks (treated wastewater). Each time, the wastewater samples were collected to bottles, filled, and taken directly to the laboratory for analysis. The elapsed time from sample collection to analysis was approximately 30–45 min. The bottles were stored in a travel refrigerator during transport time.
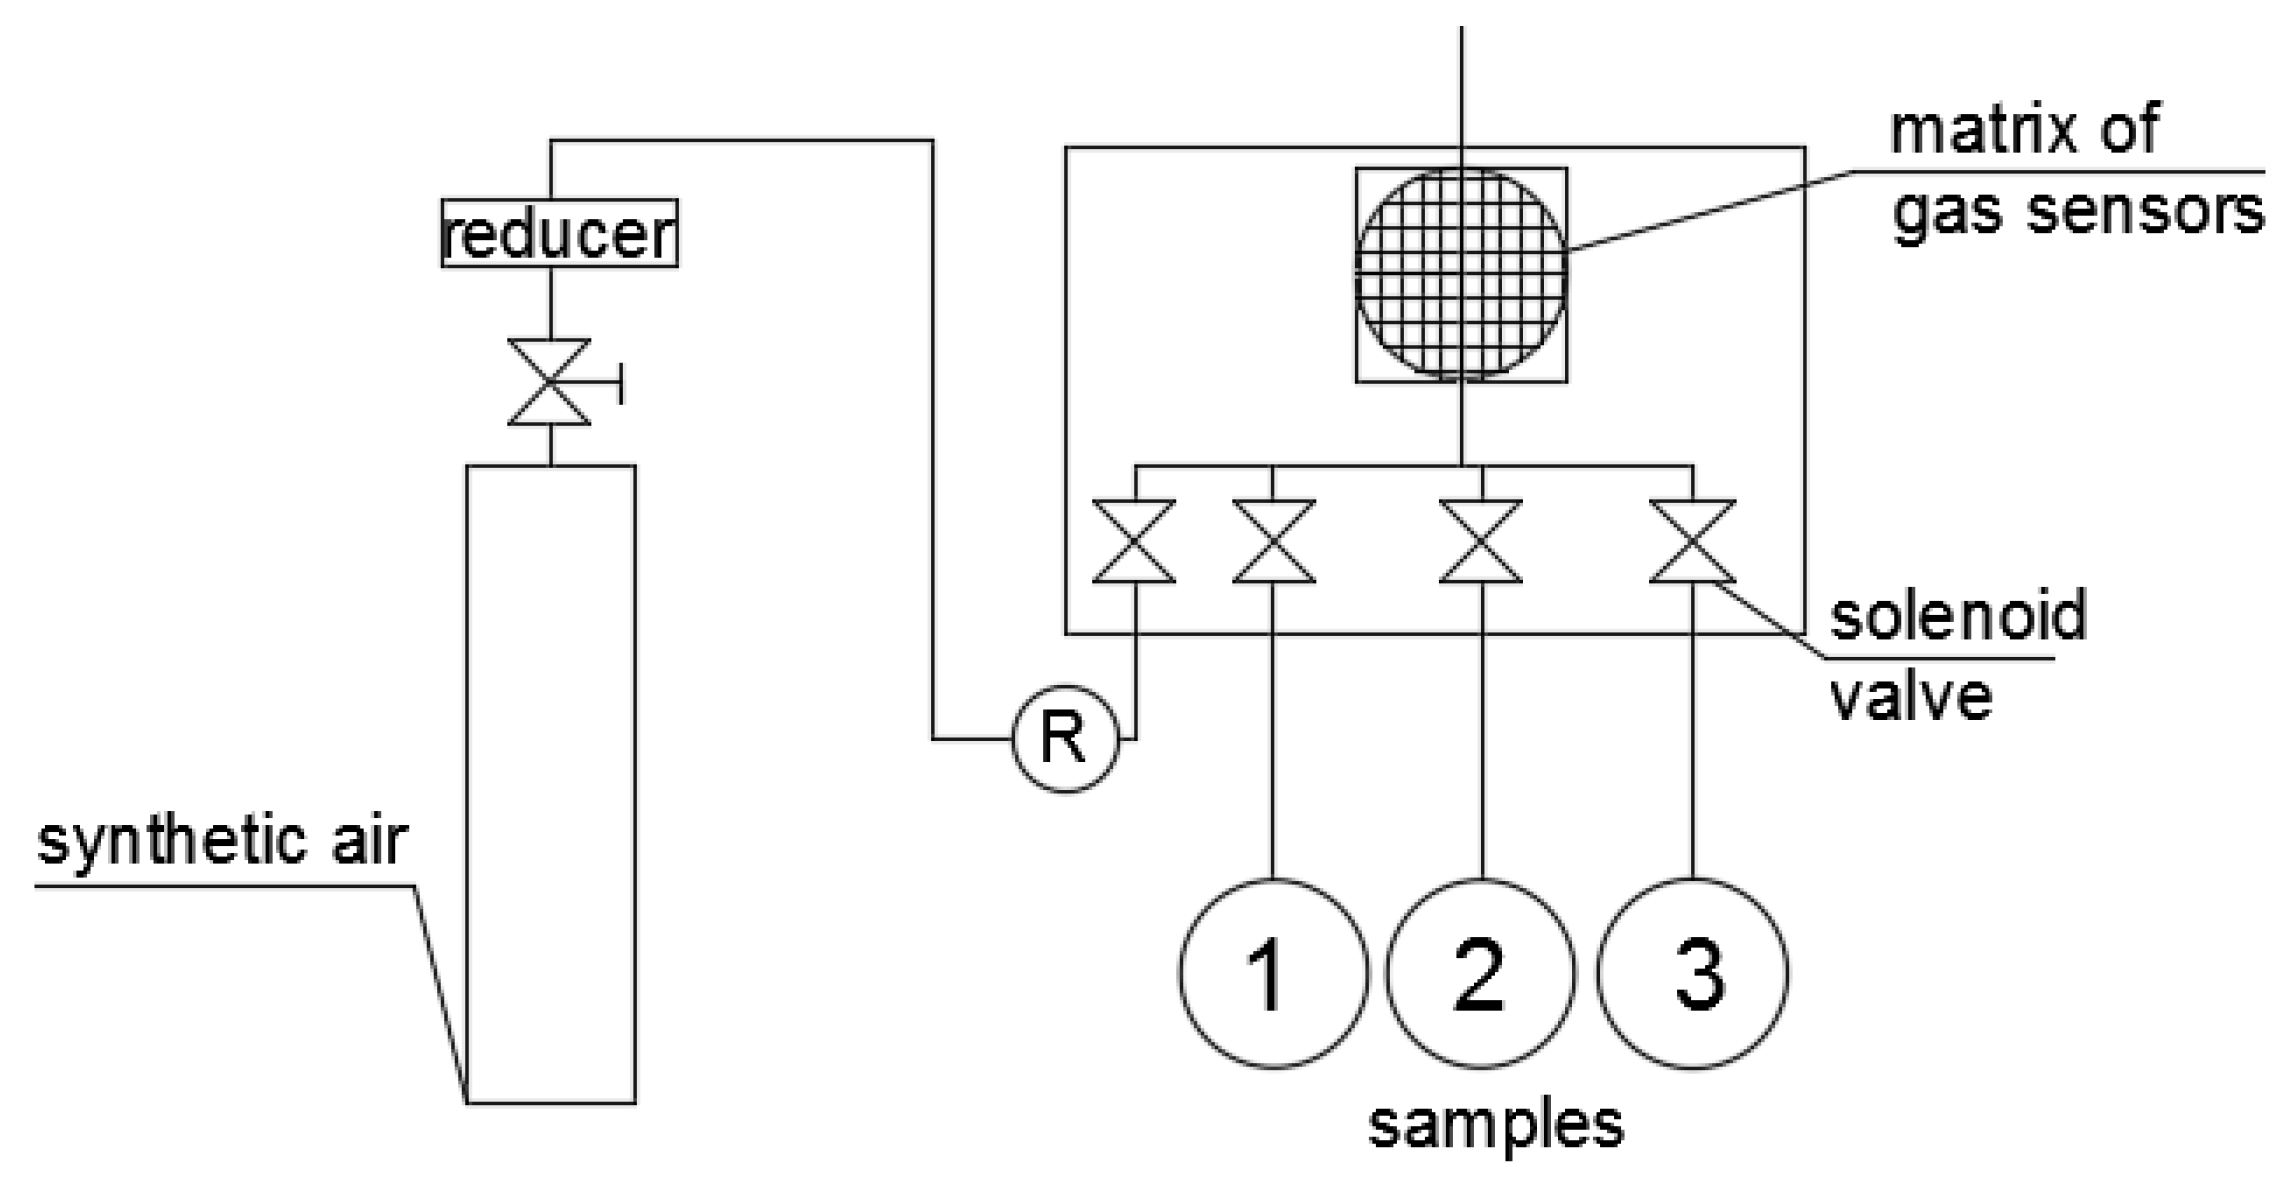
The measurements were performed with a self-constructed gas sensor array comprising 17 MOS sensors by Figaro company (Figaro USA Inc., Arlington Heights, IL, USA): TGS2600-B00 (general air contaminants), TGS2602-B00 (general air contaminants, high sensitivity to VOC), TGS2610-D00 (butane, LP gas; carbon filter), TGS2611-E00 (methane, natural gas; carbon filter), TGS2620-C00 (alcohol, solvent vapors), TGS4161 (carbon dioxide), TGS2444 (ammonia), TGS2442-B02 (carbon monoxide), TGS800 (various gas sensor—carbon monoxide, methane, isobutane, ethanol), TGS825-A00 (hydrogen sulfide), TGS813-A00 (combustible gases), TGS821 (hydrogen gas), TGS823-A00 (ethanol), TGS812 (combustible/flammable/methane gas), TGS830 (chlorofluorocarbons), TGS832-A00 (halocarbon), and TGS2106 (diesel exhaust gas). The utilized sensors were characterized by small size and power consumption [
47,
48,
49]. The measurements were carried out in a 3–5 arrangement for each port, involving 3 min of flushing the sensors with synthetic air and 5 min of mixture analysis. The measurement set is schematically presented in
Figure 1.
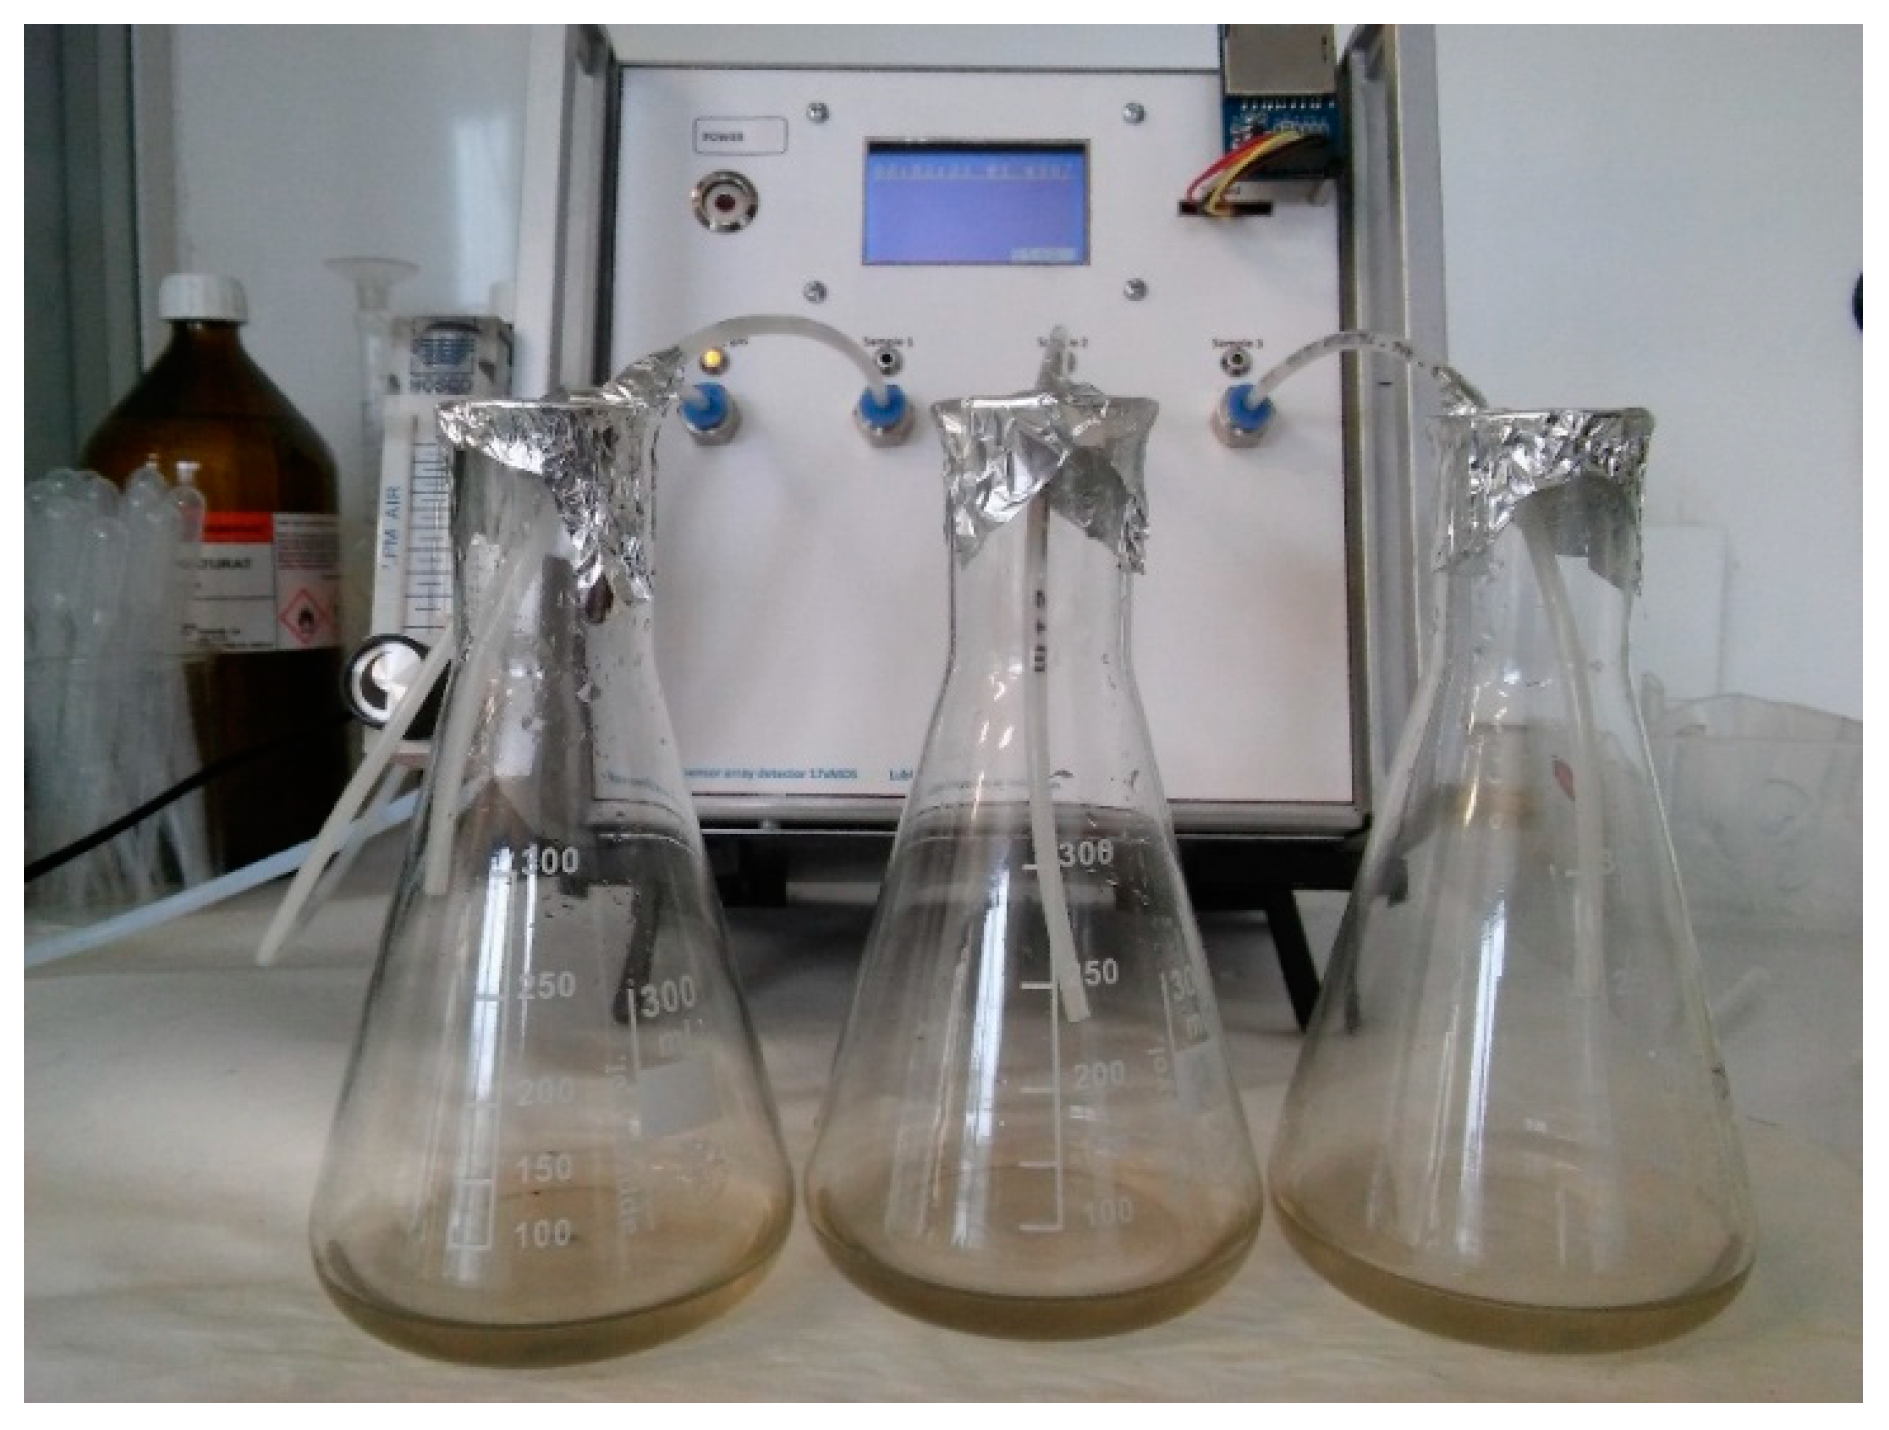
The experiment was conducted under laboratory conditions. Following intensive stirring until a homogenous composition was obtained, the initial samples of the considered medium (100 mL) were poured in equal amount to three identical conical glass flasks and subsequently subjected to analysis using a multisensor gas array (
Figure 2). The procedure was performed in triplicate. The flasks were rinsed with distilled water several times between the consecutive measurements.
Additionally, for reference to the array readouts, and in order to determine the pollution level of consecutive samples, one of the basic and most frequently determined parameters (i.e., total organic carbon (TOC)) was determined with the catalytic oxidation method, using a TOC 5050A Total Organic Carbon Analyzer (Shimadzu, Kyoto, Japan). Total suspended solids (TSS) was also determined by means of a HACH DR 3900 spectrophotometer (Hach Lange GmbH, Düsseldorf, Germany), using photometric method 8006 (program 630), according to protocol recommended by producing company.
The employed device recorded the sensor readouts with 5 s intervals; thus, the obtained datasets were appropriately prepared in order to average the presented results and reduce the amount of analyzed points and improve the legibility of graphs. The total size of the initial dataset used for statistical analysis was 185.
Further statistical analyses were carried out in the R-statistical programming environment [
50] and packages that expand its functionality, including: factoextra [
51], ggplot2 [
52], knitr [
53], plotly [
54], mlr [
55], and rpart [
56].
As a statistical method for analysis of readouts from the matrix of gas sensors, the following methods were applied: principal components analysis [
57] to explain data dispersion, and non-hierarchical cluster analysis—more specifically the
k-means method described by MacQueen [
40]—to find homogeneous clusters of data based on a distance matrix in multidimensional space. As one of the supervised learning techniques, classification tree [
43] was used to confirm that the hidden structure of data from the gas sensors matrix was applicable for wastewater classification purposes.
3. Results and Discussion
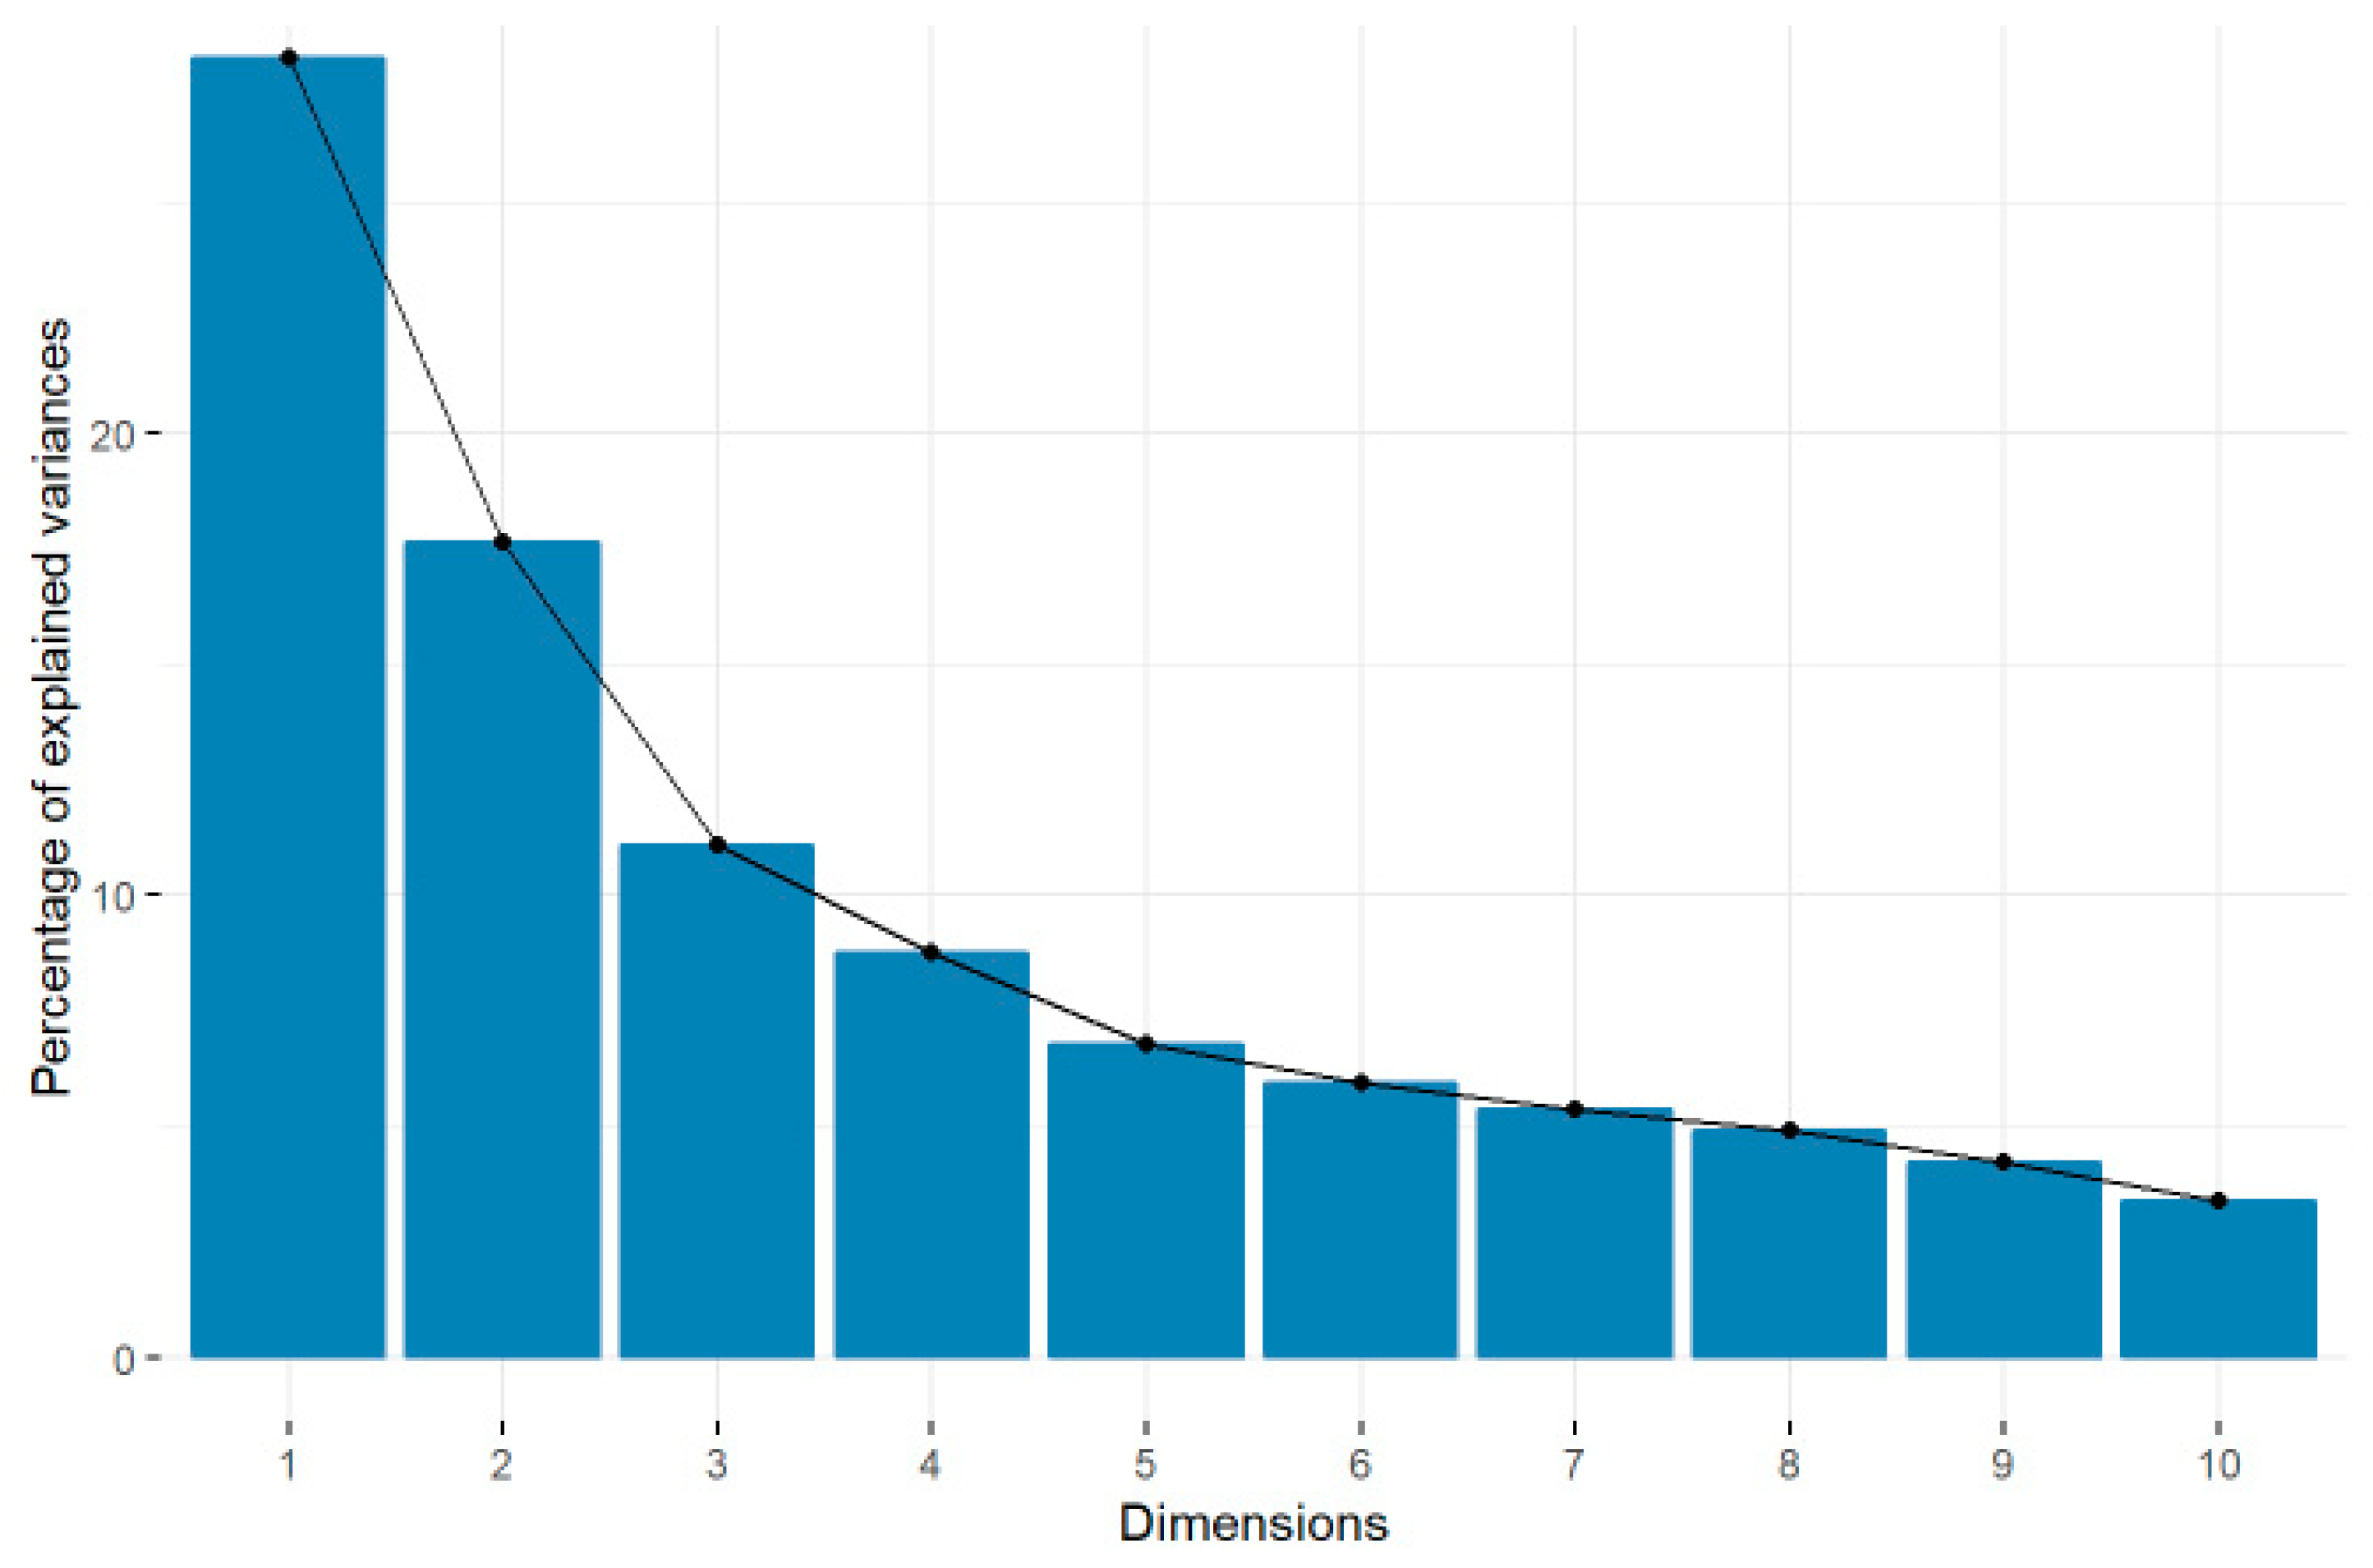
The results in
Table 1 and
Figure 3 show that the first five or six principal components were appropriate for the explanation of data dispersion [
57]. Another argument for choosing the first six principal components is the Kaiser criterion, which states that only the principal components which have eigenvalues greater than 1 should be chosen [
58]. The six principal components explain 78% of the variance; however, in terms of visualizing observations in low-dimensional 2D and 3D space, only 46% and 57% of variance are explained, respectively.
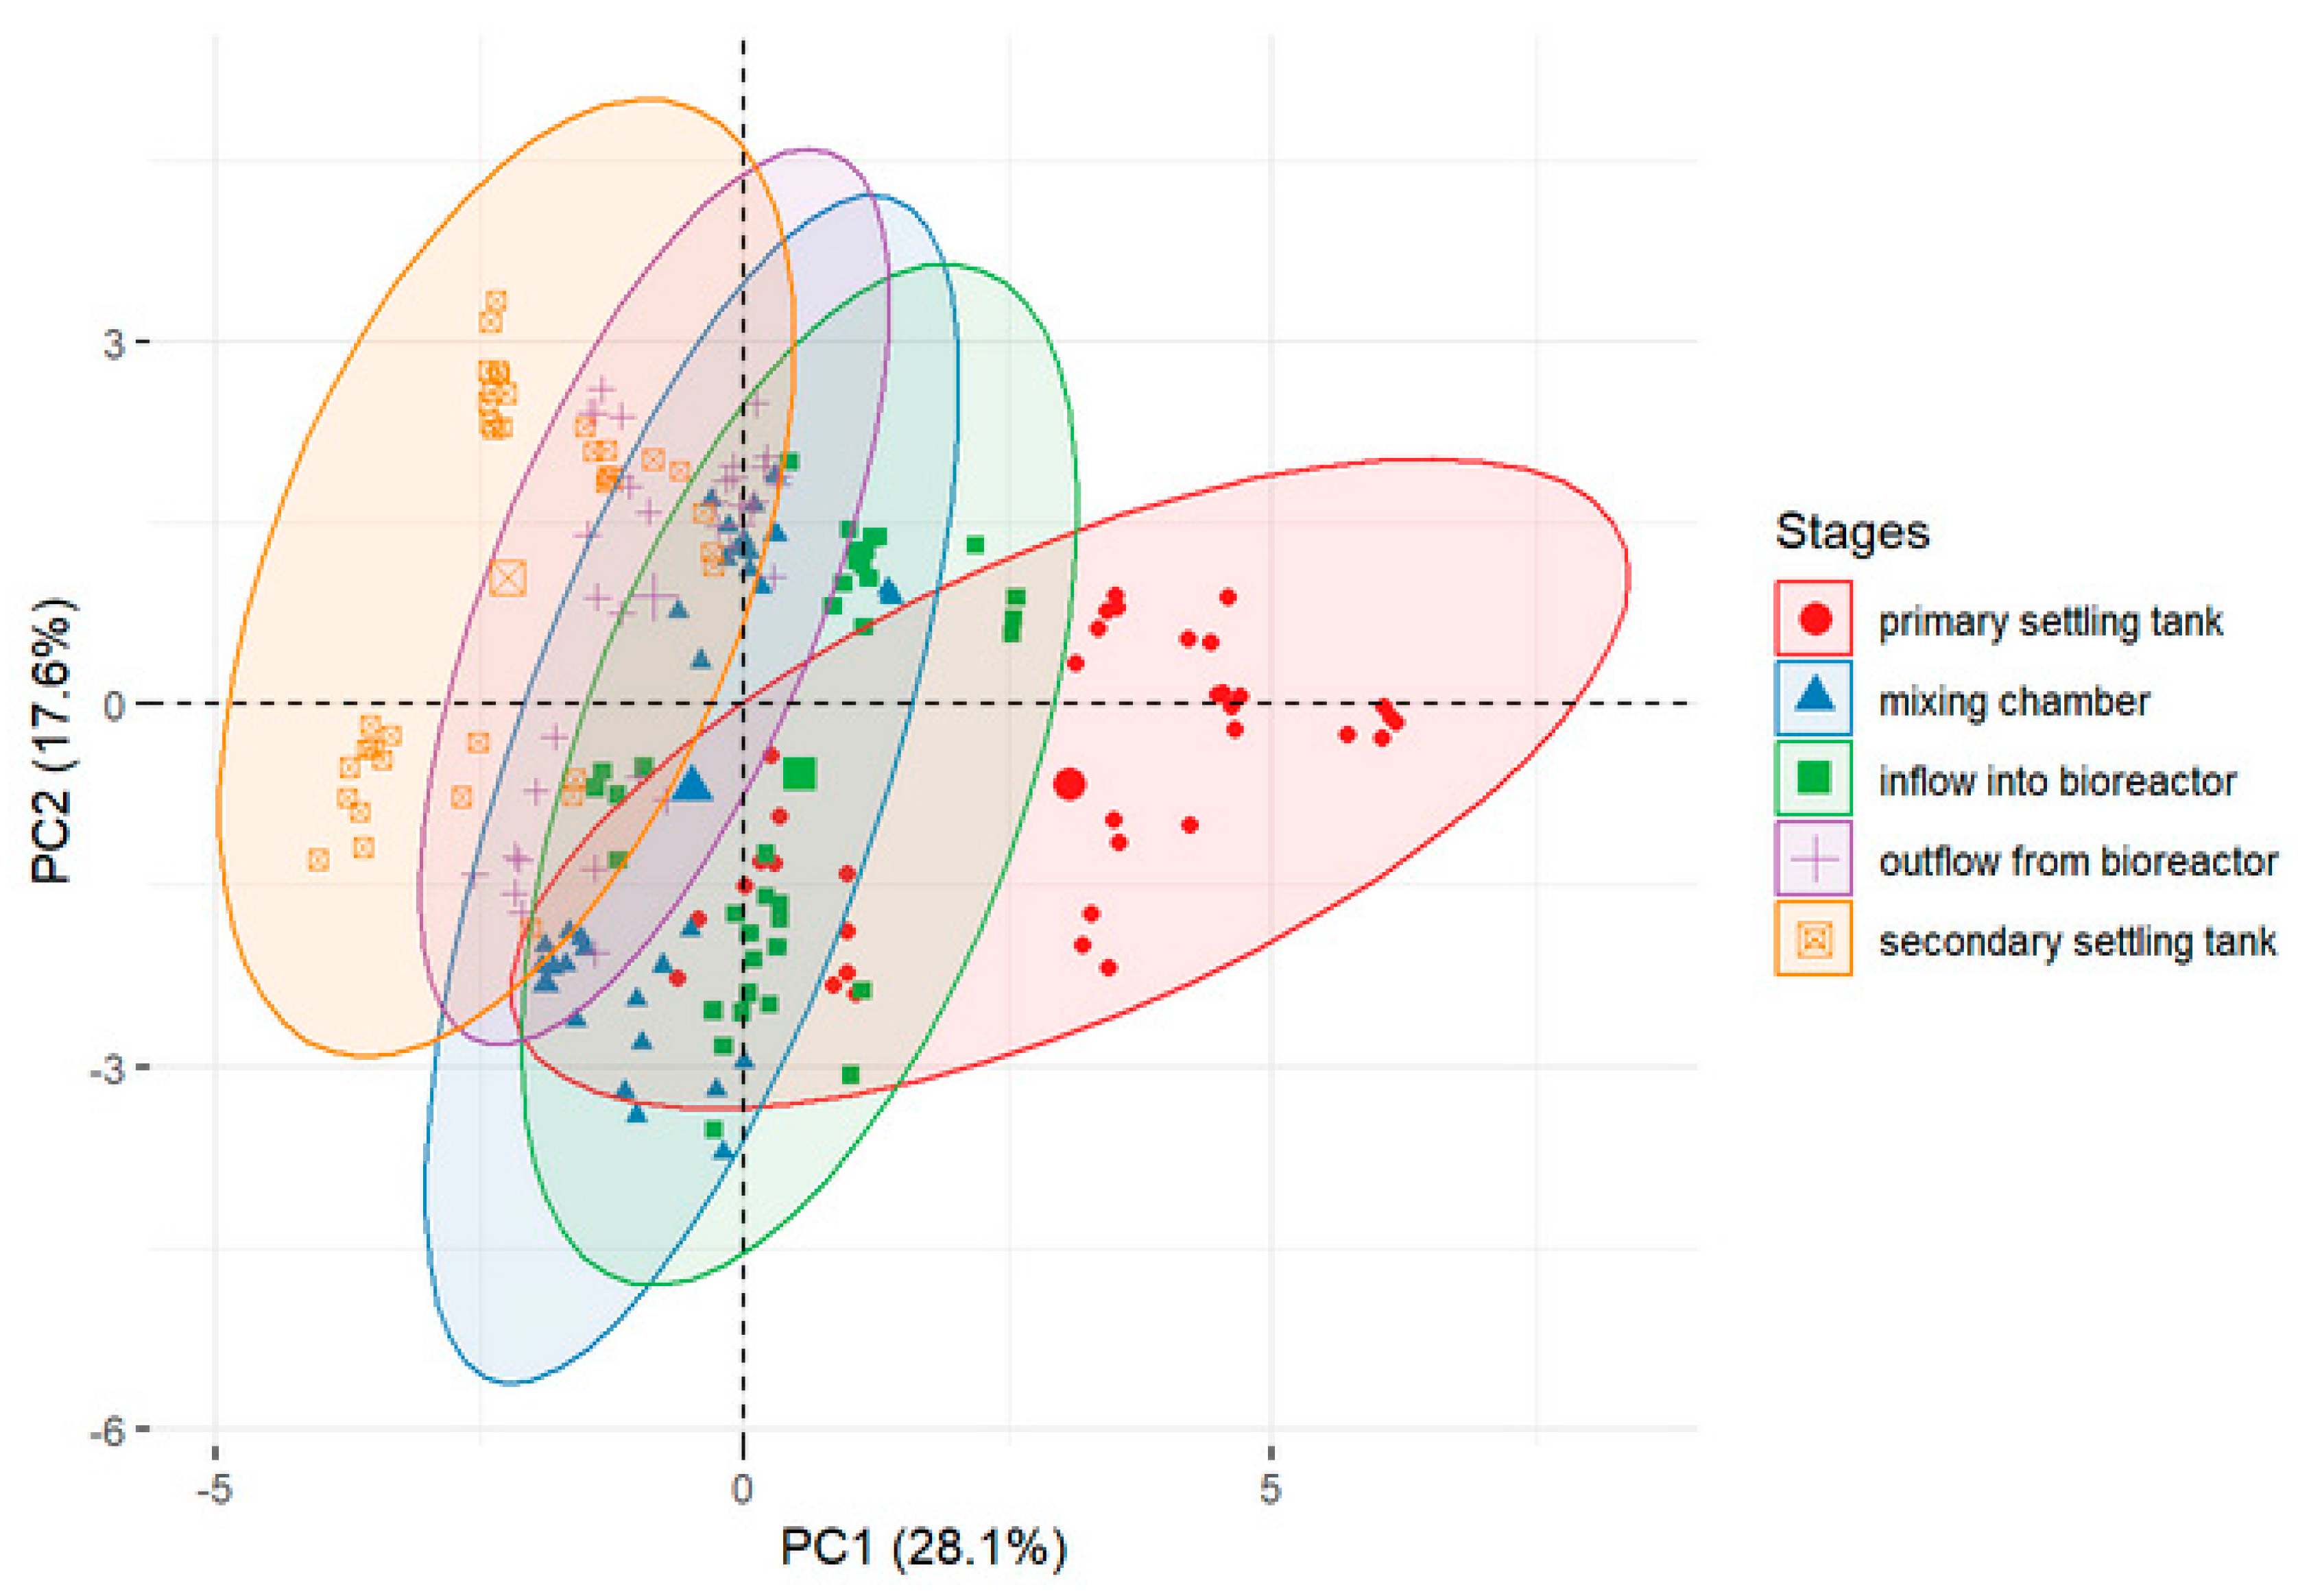
Figure 4 presents the final result of the statistical analysis of obtained data, carried out with the PCA method. It aimed at reducing the data dimensionality from the initial 17 variables to only 2 new variables, in order to facilitate the readout and present the dependencies hidden in the data excess. Part of the information is lost during the PCA statistical analysis, but it is possible to reverse the transformation.
Figure 4 shows groups of observations of particular stages of the wastewater treatment process. Groups of data from opposite stages were distinct, which means that based on the information from electronic nose sensors, one can group them into relatively homogenous clusters.
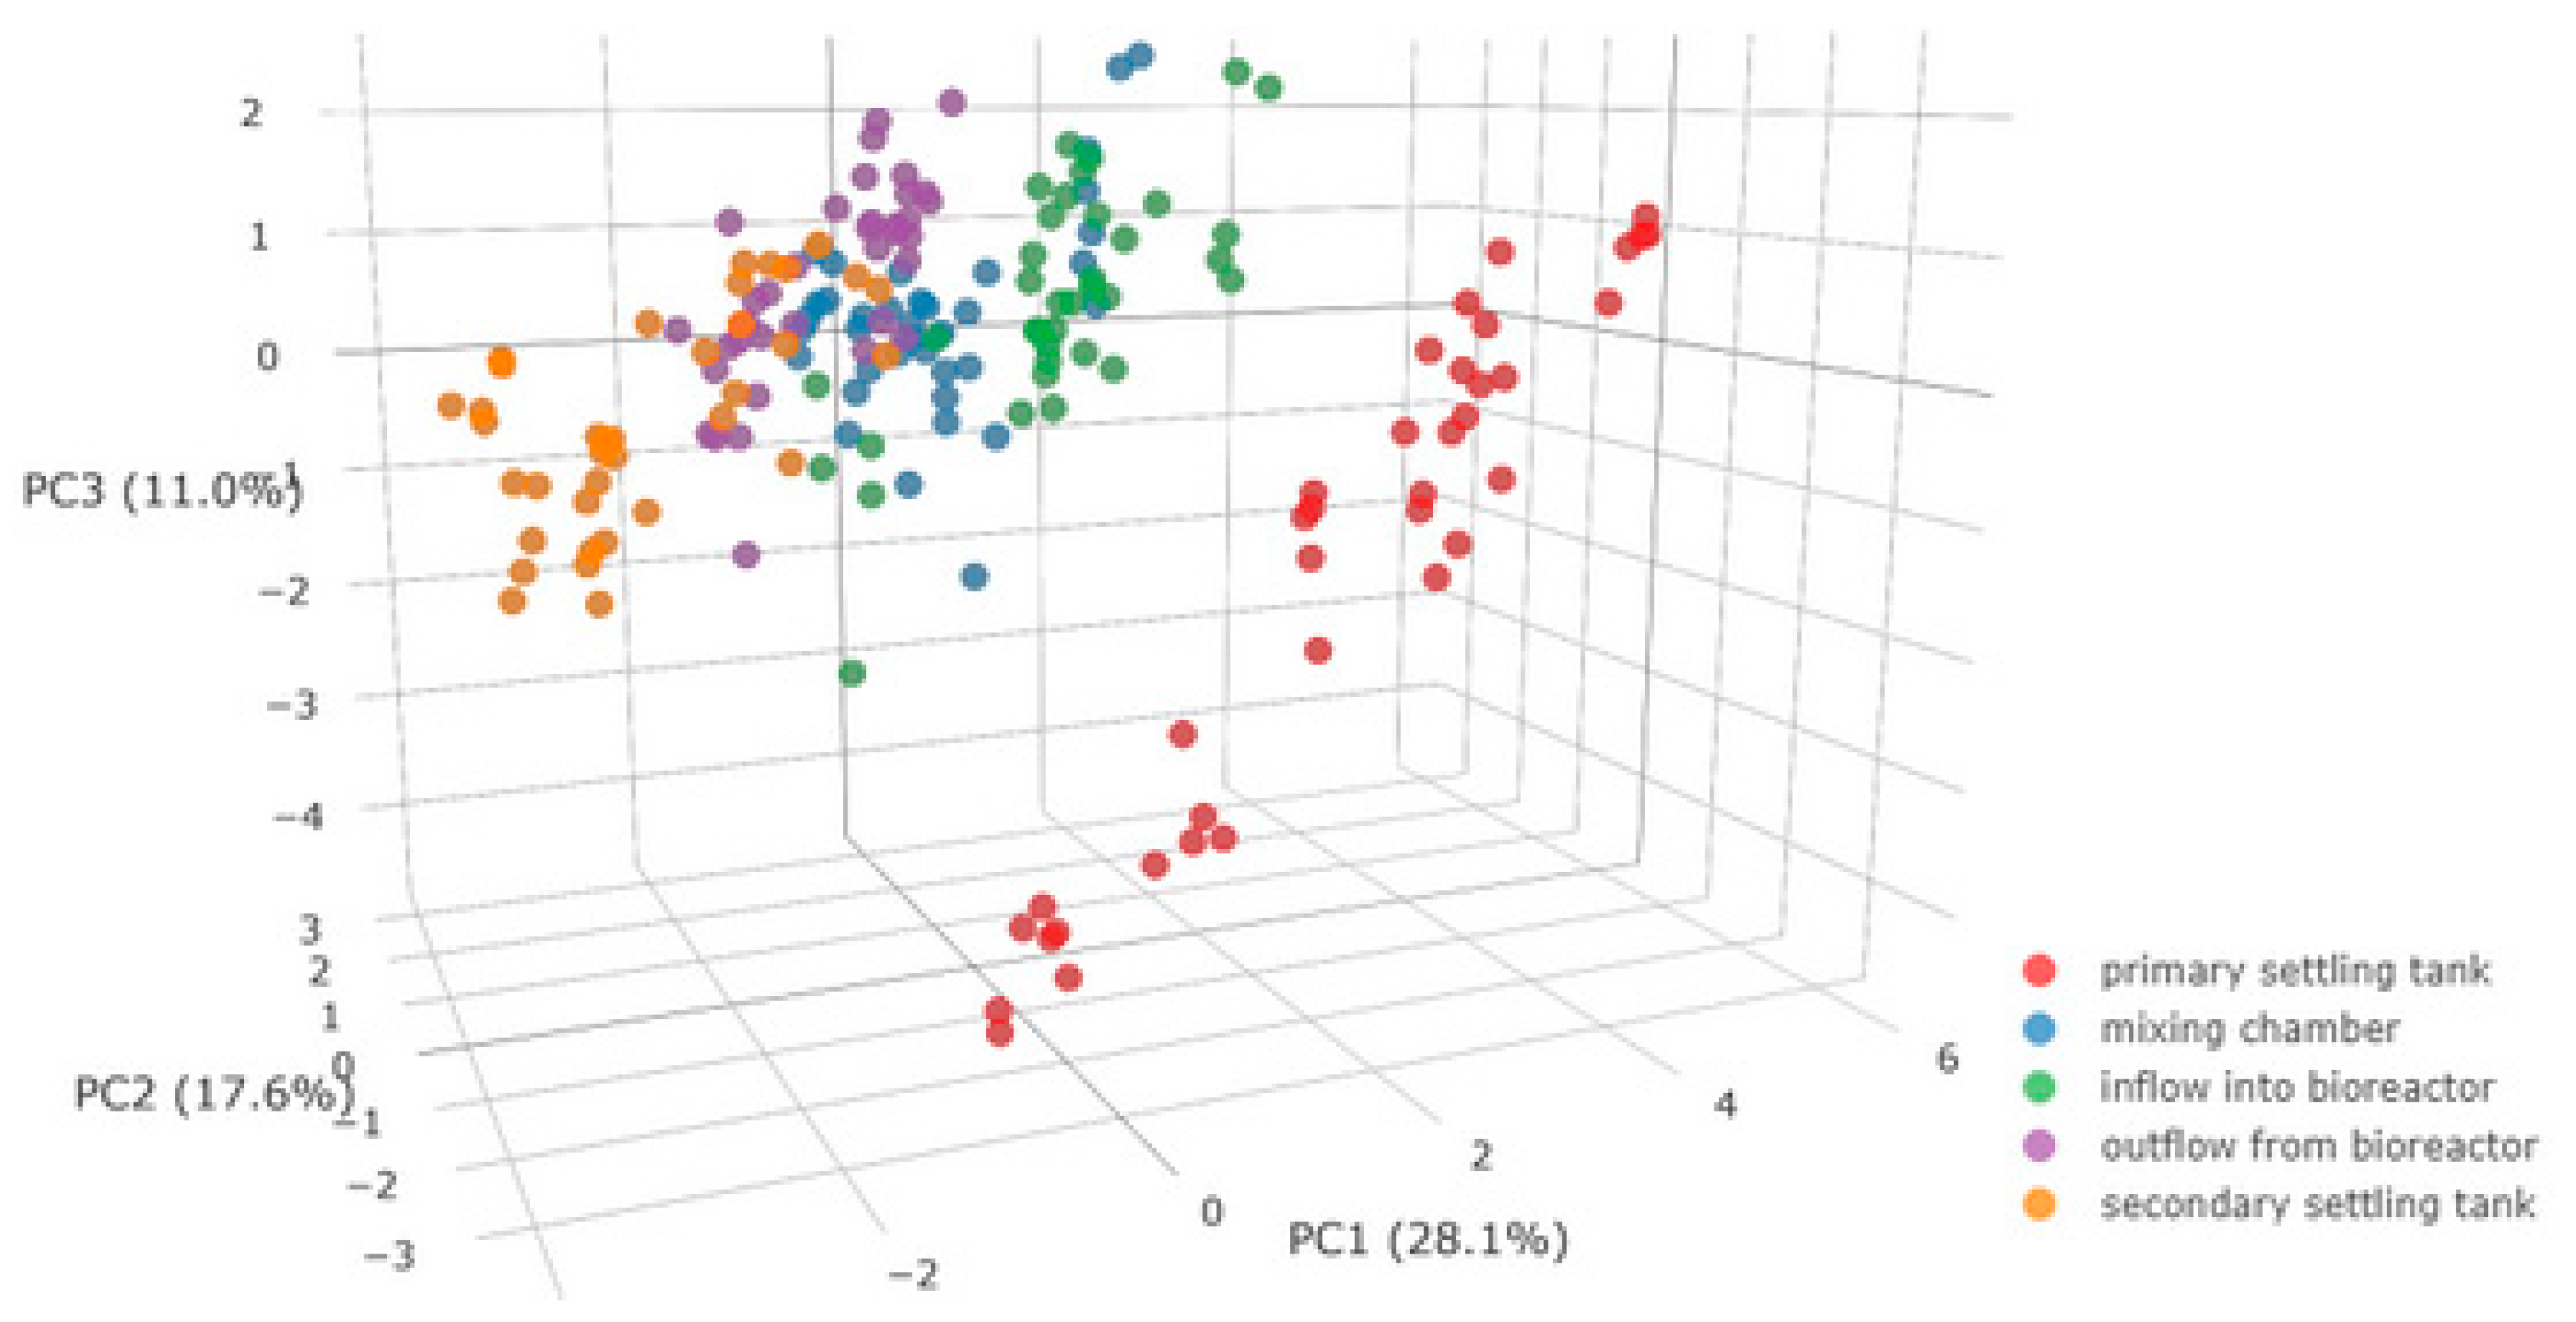
The image of changes taking place in the wastewater treatment process was clearer in three-dimensional PCA space.
Figure 5 shows a 3D representation of the data. The observations from the primary settling tank form a separate group of points, and the data from the secondary settling tank are on the opposite side.
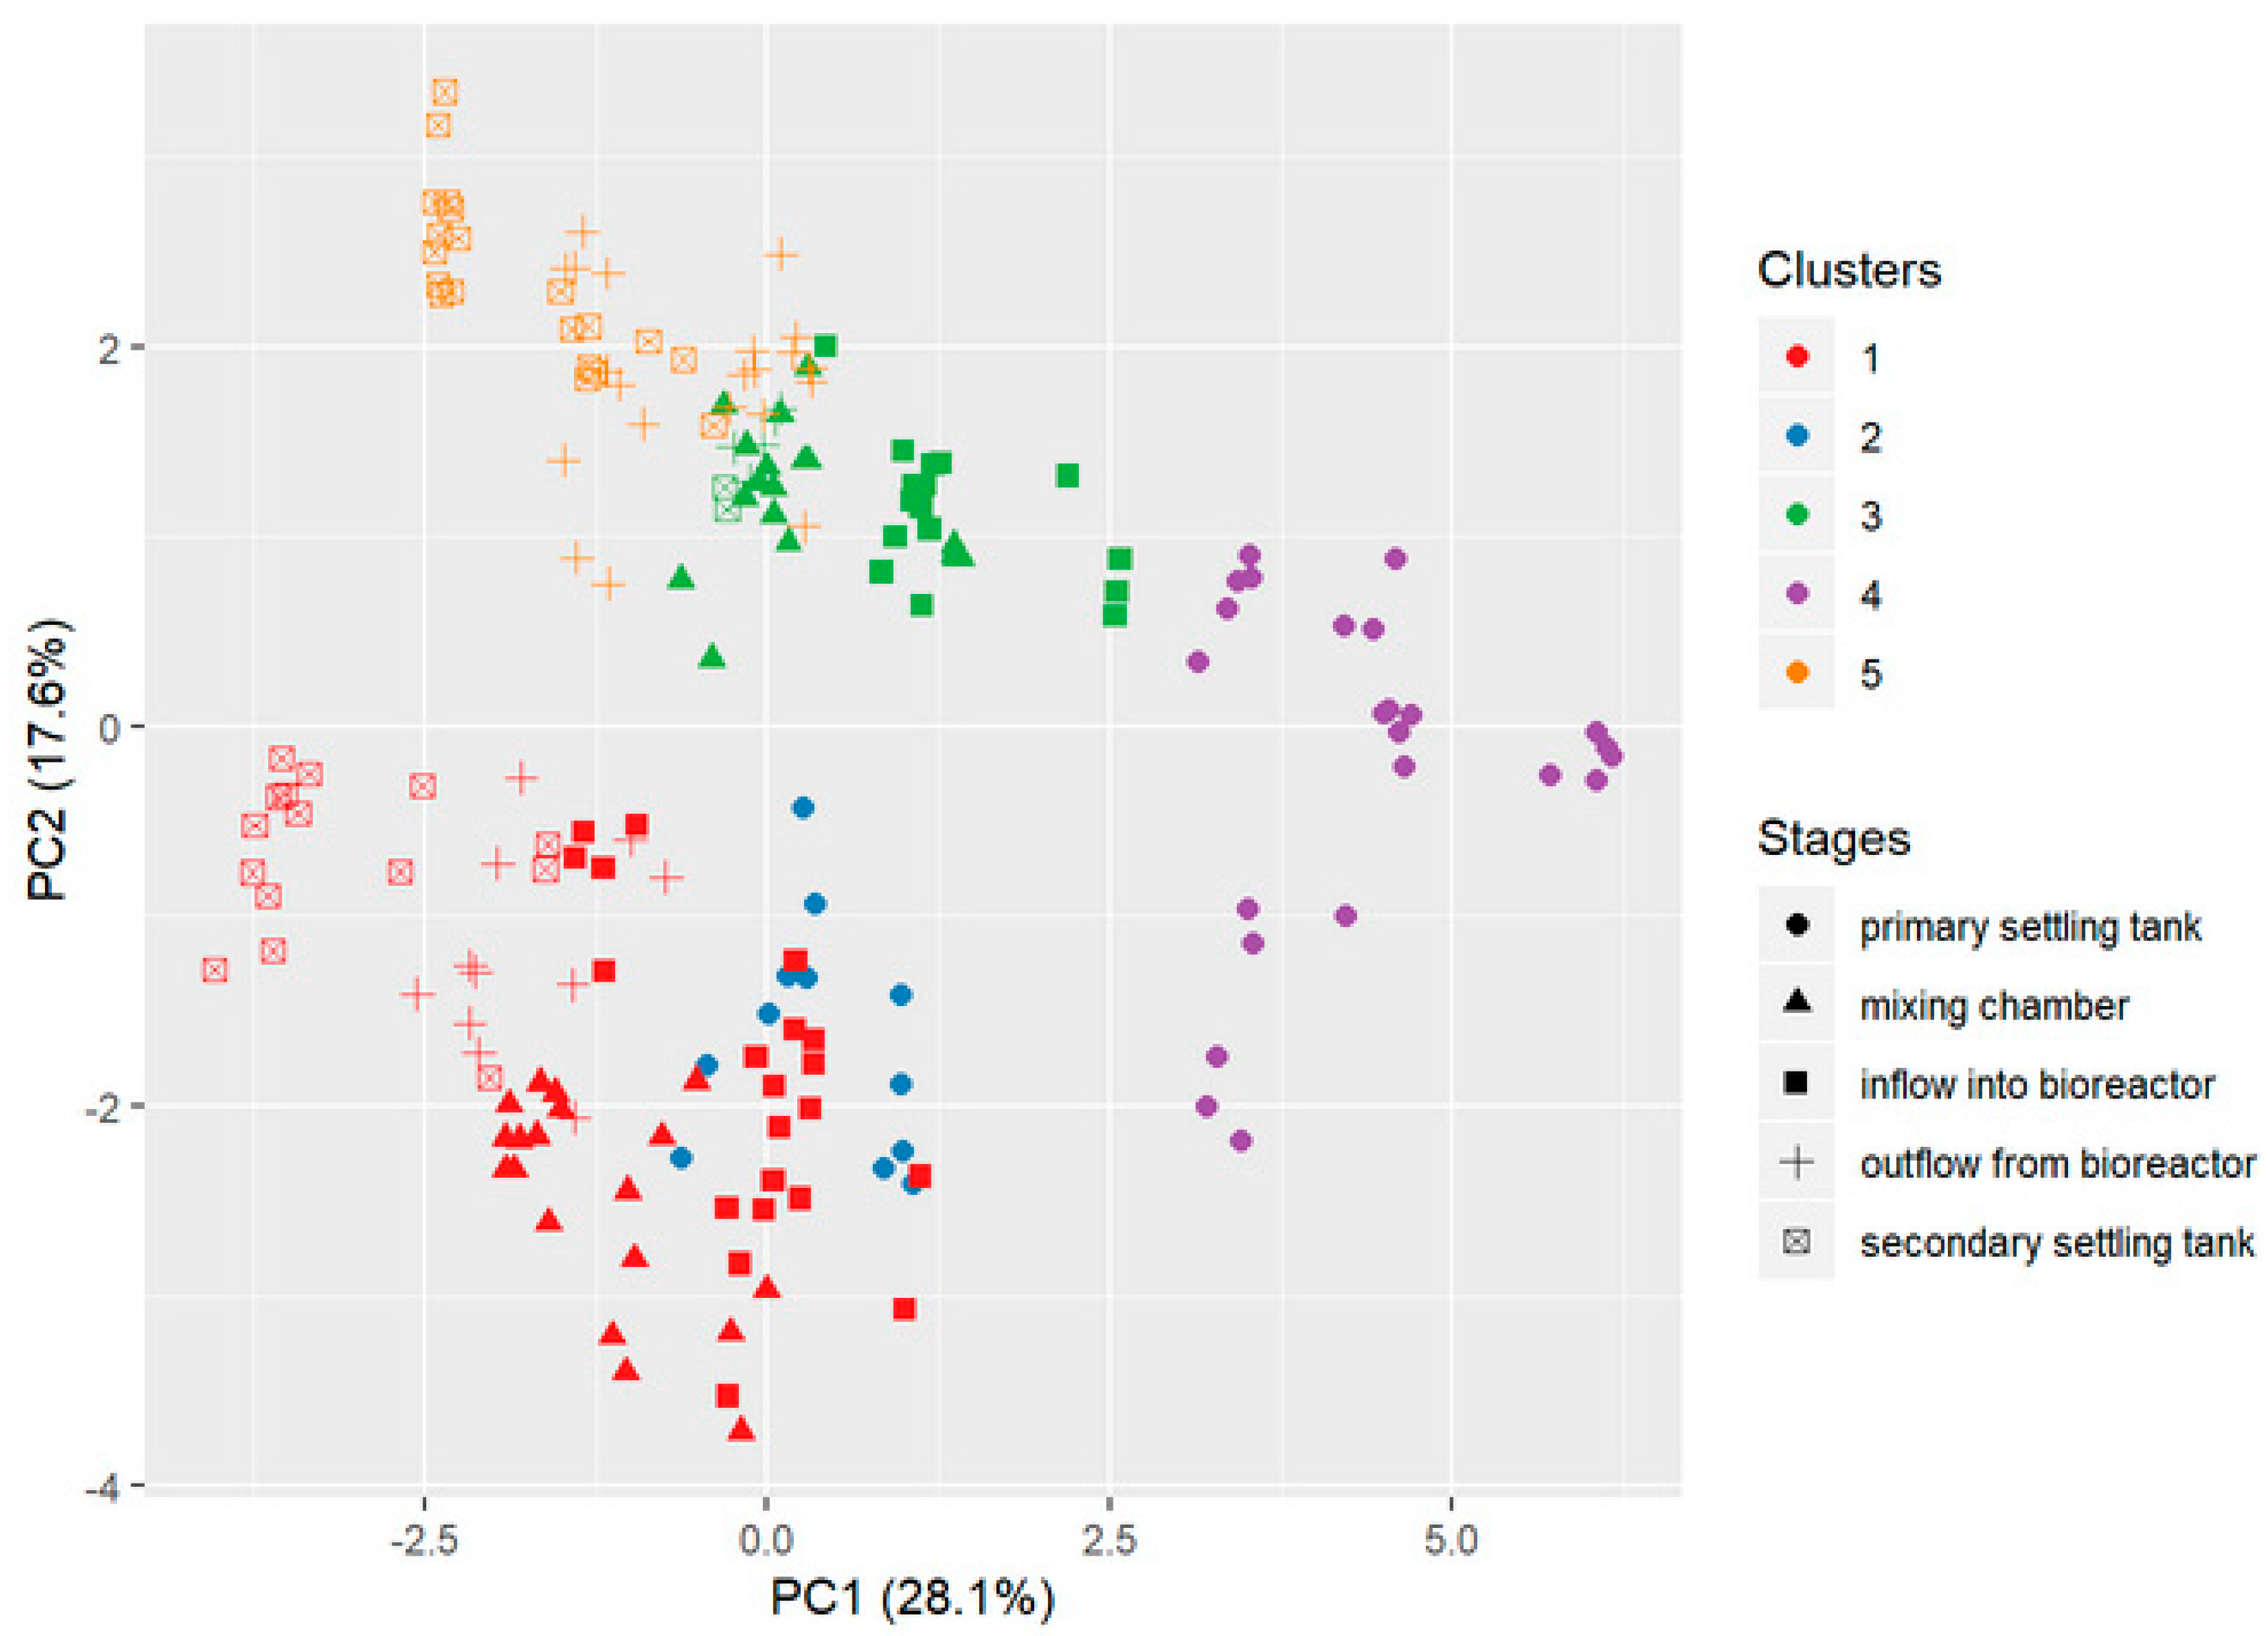
Non-hierarchical cluster analysis (i.e., the k-means method) was employed. The main idea behind applying this technique was to find homogeneous clusters of data based on a distance matrix in multidimensional space. Since there are five different stages in the wastewater treatment process, we chose k = 5. There was no need to standardize variables, because they were characterized by almost the same variance. Both figures above led us to the conclusion that non-hierarchical cluster analysis operating in 17-dimensional space could group observations according to treatment stages.
Figure 6 illustrates the result of clustering in two-dimensional PC space. There were some misclassifications, but the observations from the primary and secondary settling tanks were in different clusters. First, they were in clusters 1 and 2, whereas later they were in 3 and 4. Therefore, cluster analysis confirmed that there is the potential to discriminate the stages of wastewater treatment process by means of statistically modeling data from an electronic nose.
All unsupervised learning methods showed some structure correlated with the stages of the wastewater treatment process. Supervised learning techniques could confirm that this hidden structure is applicable for classification purposes. As shown below, even a rather simple predictive method [
43] was characterized by a very good accuracy.
In order to build and assess the performance of the Classification and Regression Tree model (CART model) [
59], the data were split randomly into training and testing samples in a 2:1 proportion. Tuning of the complexity parameter of the model was executed via 5-fold cross-validation. A common method for describing the performance of a classification model is the confusion matrix. This is a simple cross-tabulation of the observed and predicted classes for the data. Diagonal cells denote the cases where the classes were correctly predicted, while the off-diagonals illustrate the number of errors for each possible case. The simplest metric is the overall accuracy rate, which reflects the agreement between the observed and predicted classes.
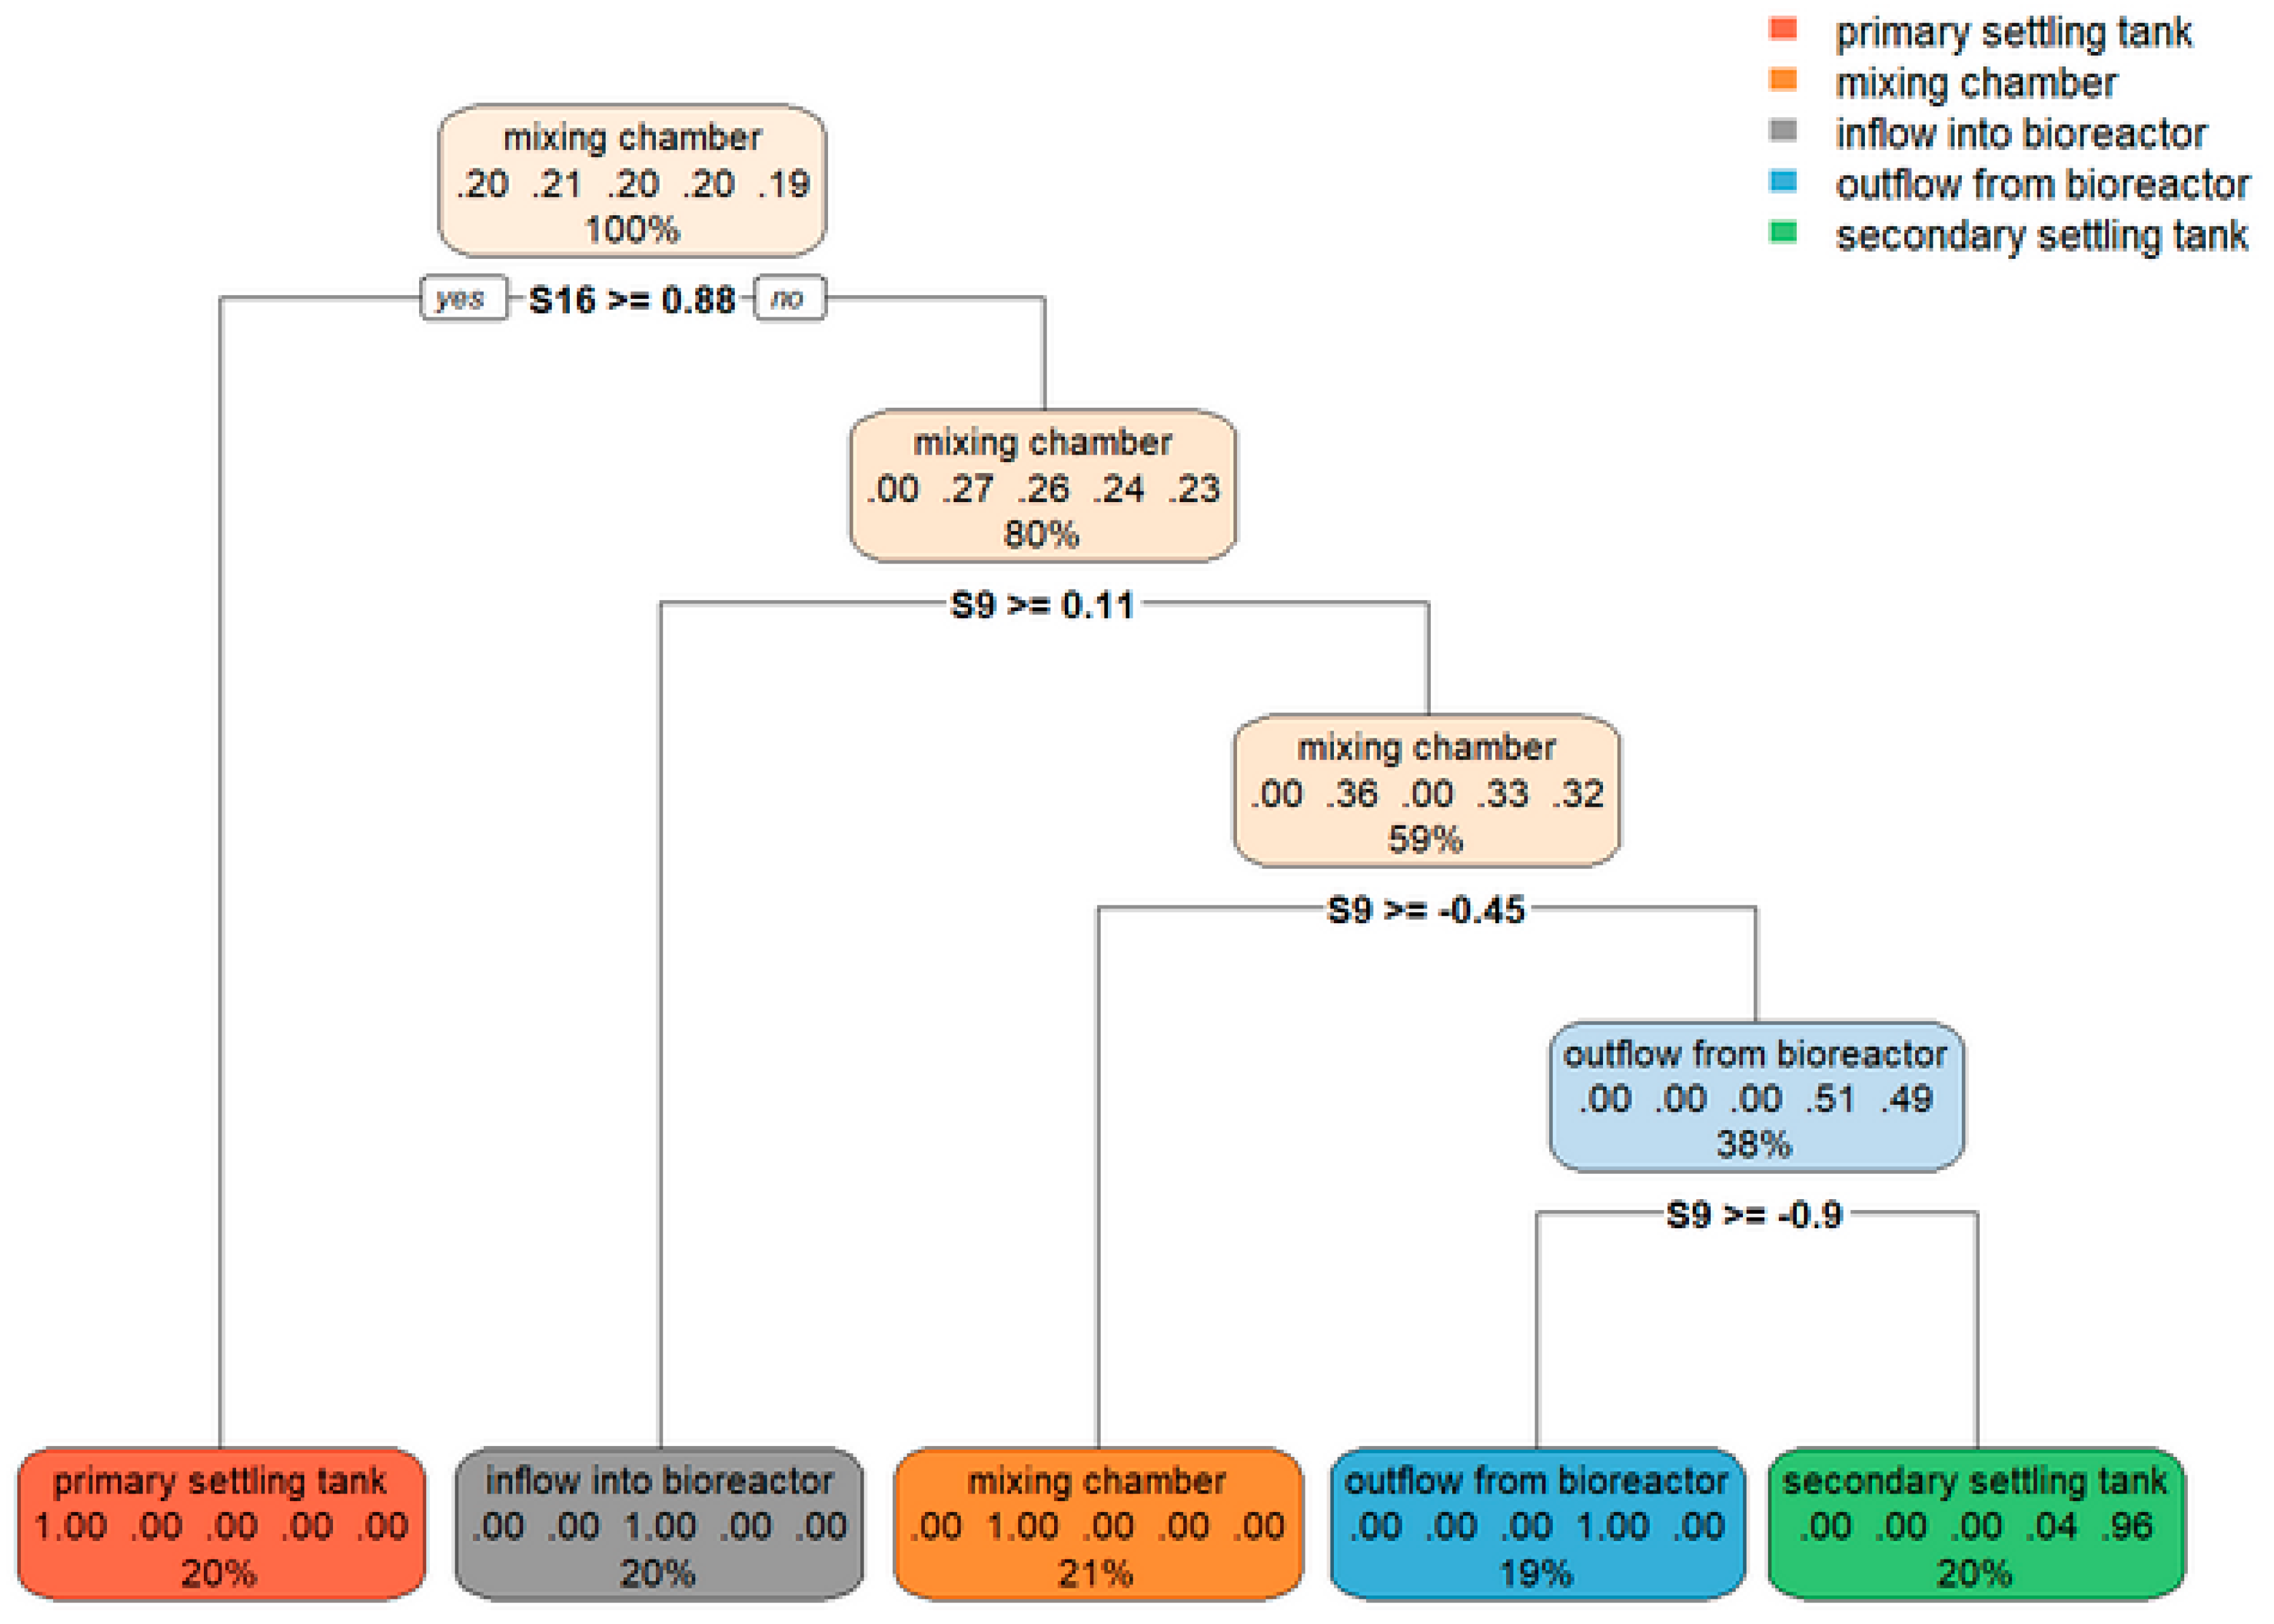
Very good accuracy for training and testing data was obtained by decision tree (i.e., 98% and 97%, respectively). Only two observations of outflow from the bioreactor were mistakenly classified to the secondary settling tank in the test sample (see
Table 2), which is understandable because these two stages are adjacent to each other in the wastewater treatment process.
The model classified the observations with very good precision as visible in the
Figure 7. The purity of leaves (terminal nodes) in the decision tree was very high. Thus, it was possible to obtain a rather simple predictive model with sufficient accuracy.
All the described results of e-nose readouts can be presented on the background of wastewater quality at the different stages of the treatment process. The treated wastewater was characterized by a varying level of pollution in particular stages of the process. As mentioned before, treatment stage is also connected with the intensity of odor emission [
1,
3,
4,
5].
Figure 4 shows that points (sensor readout data) were grouped into sets corresponding to consecutive devices of the technological line of the wastewater treatment plant and arranged with a certain regularity—from the highest pollution level (on the right-hand side of the graph) to the lowest level (left-hand side). The ellipses overlapped in a certain range, which probably stems from certain similarities of the investigated mixtures, especially apparent in the case of the sample from a mixing chamber and the one collected at the reactor inlet. In turn, the wastewater samples from the primary and secondary settling tanks (treated wastewater) could be distinguished unequivocally. Similar classification of unpurified and purified wastewater is also visible in
Figure 5,
Figure 6 and
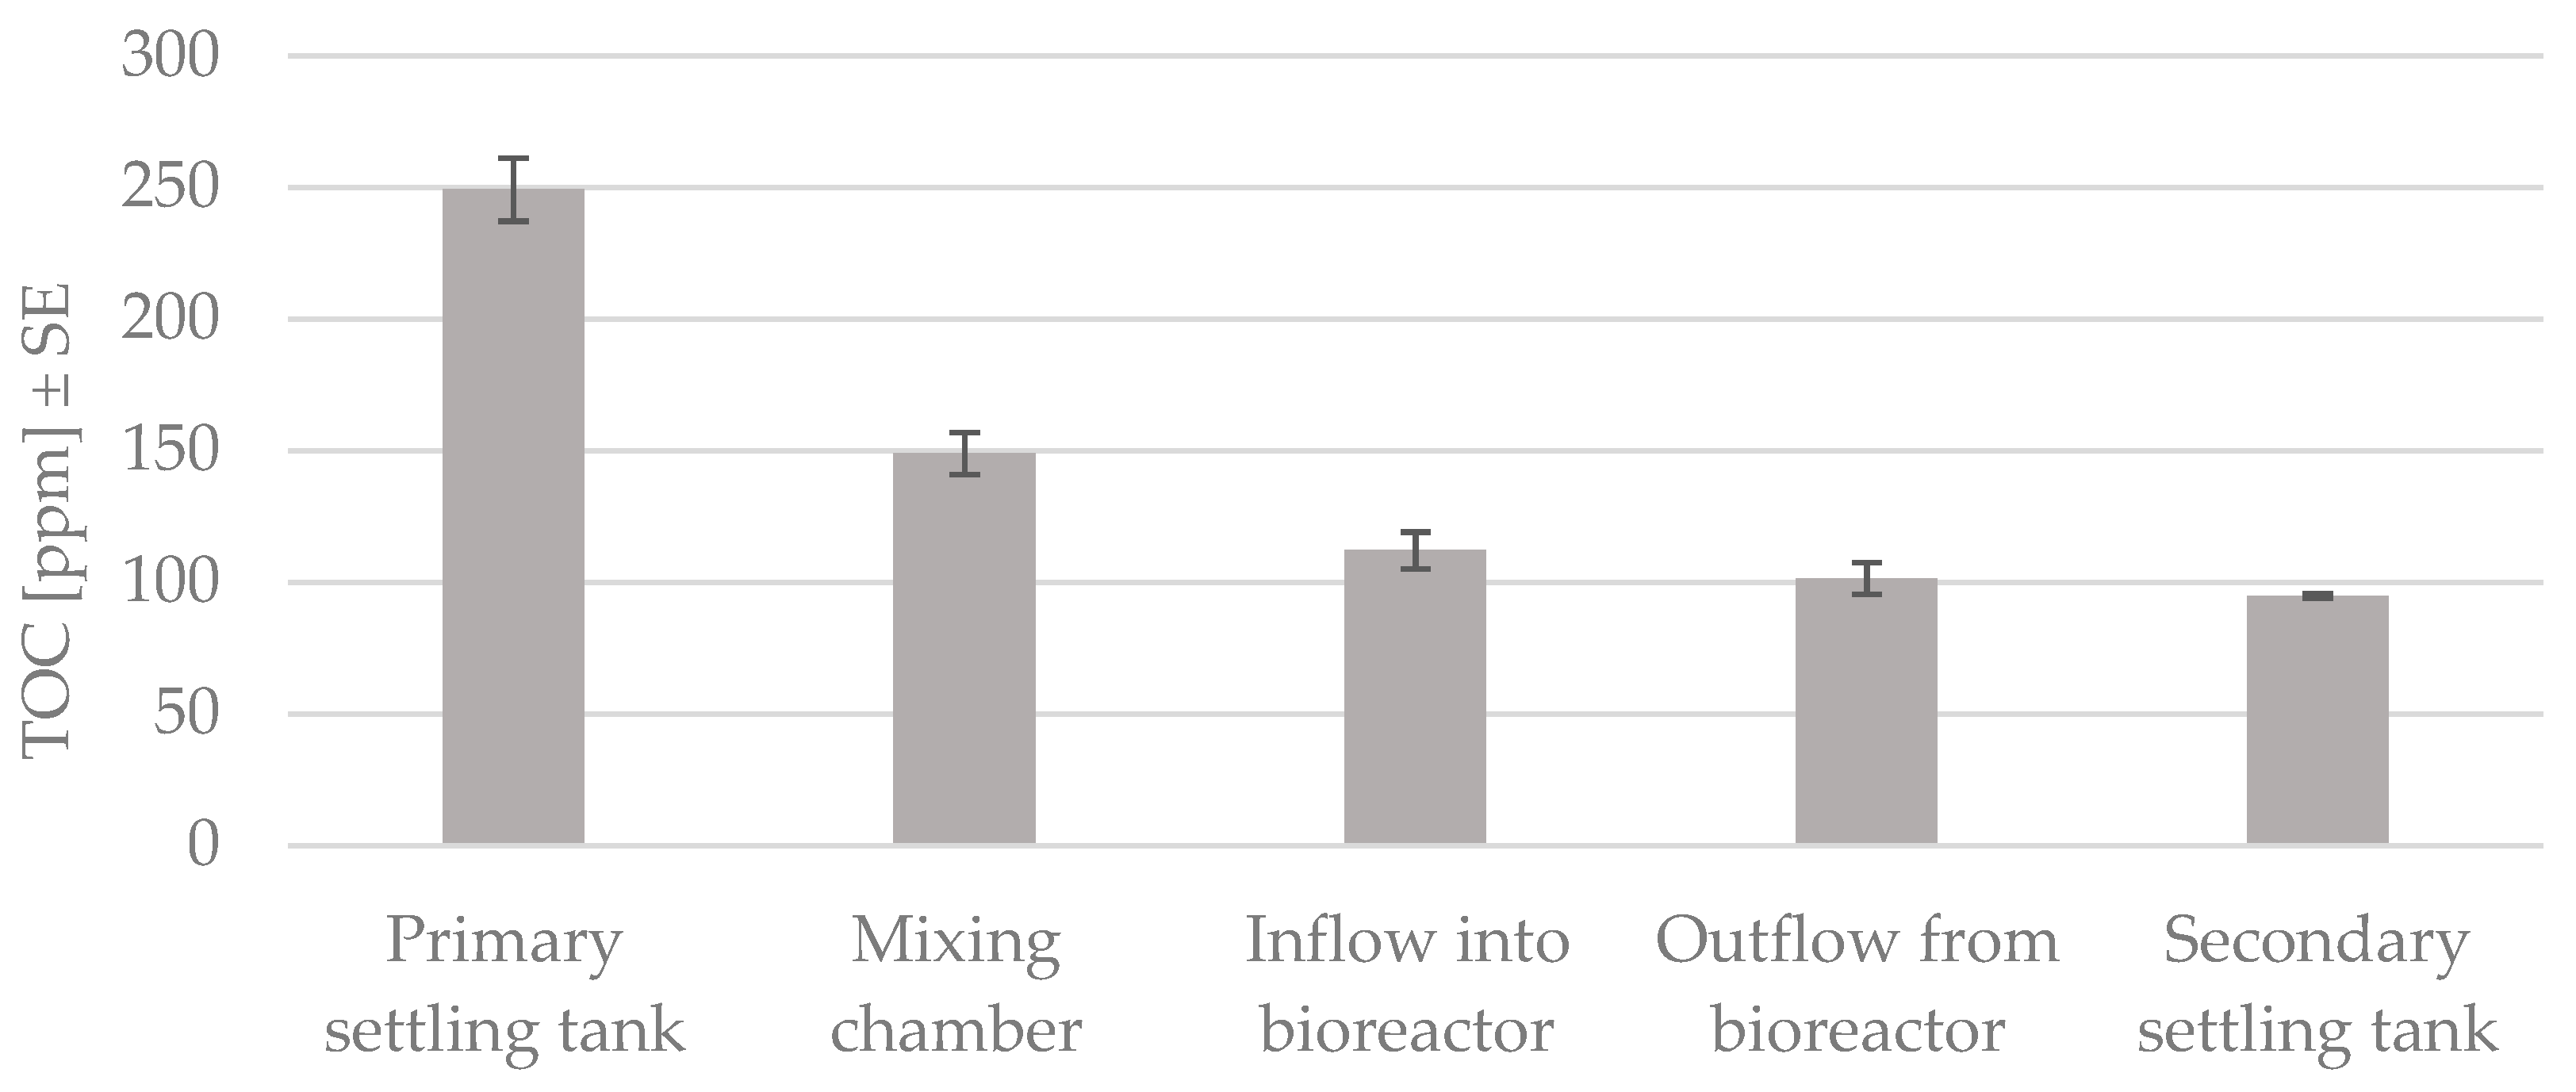
Figure 7. This relation can be confirmed by the bar graph in
Figure 8, presenting the results of total organic carbon (TOC) determination in samples.
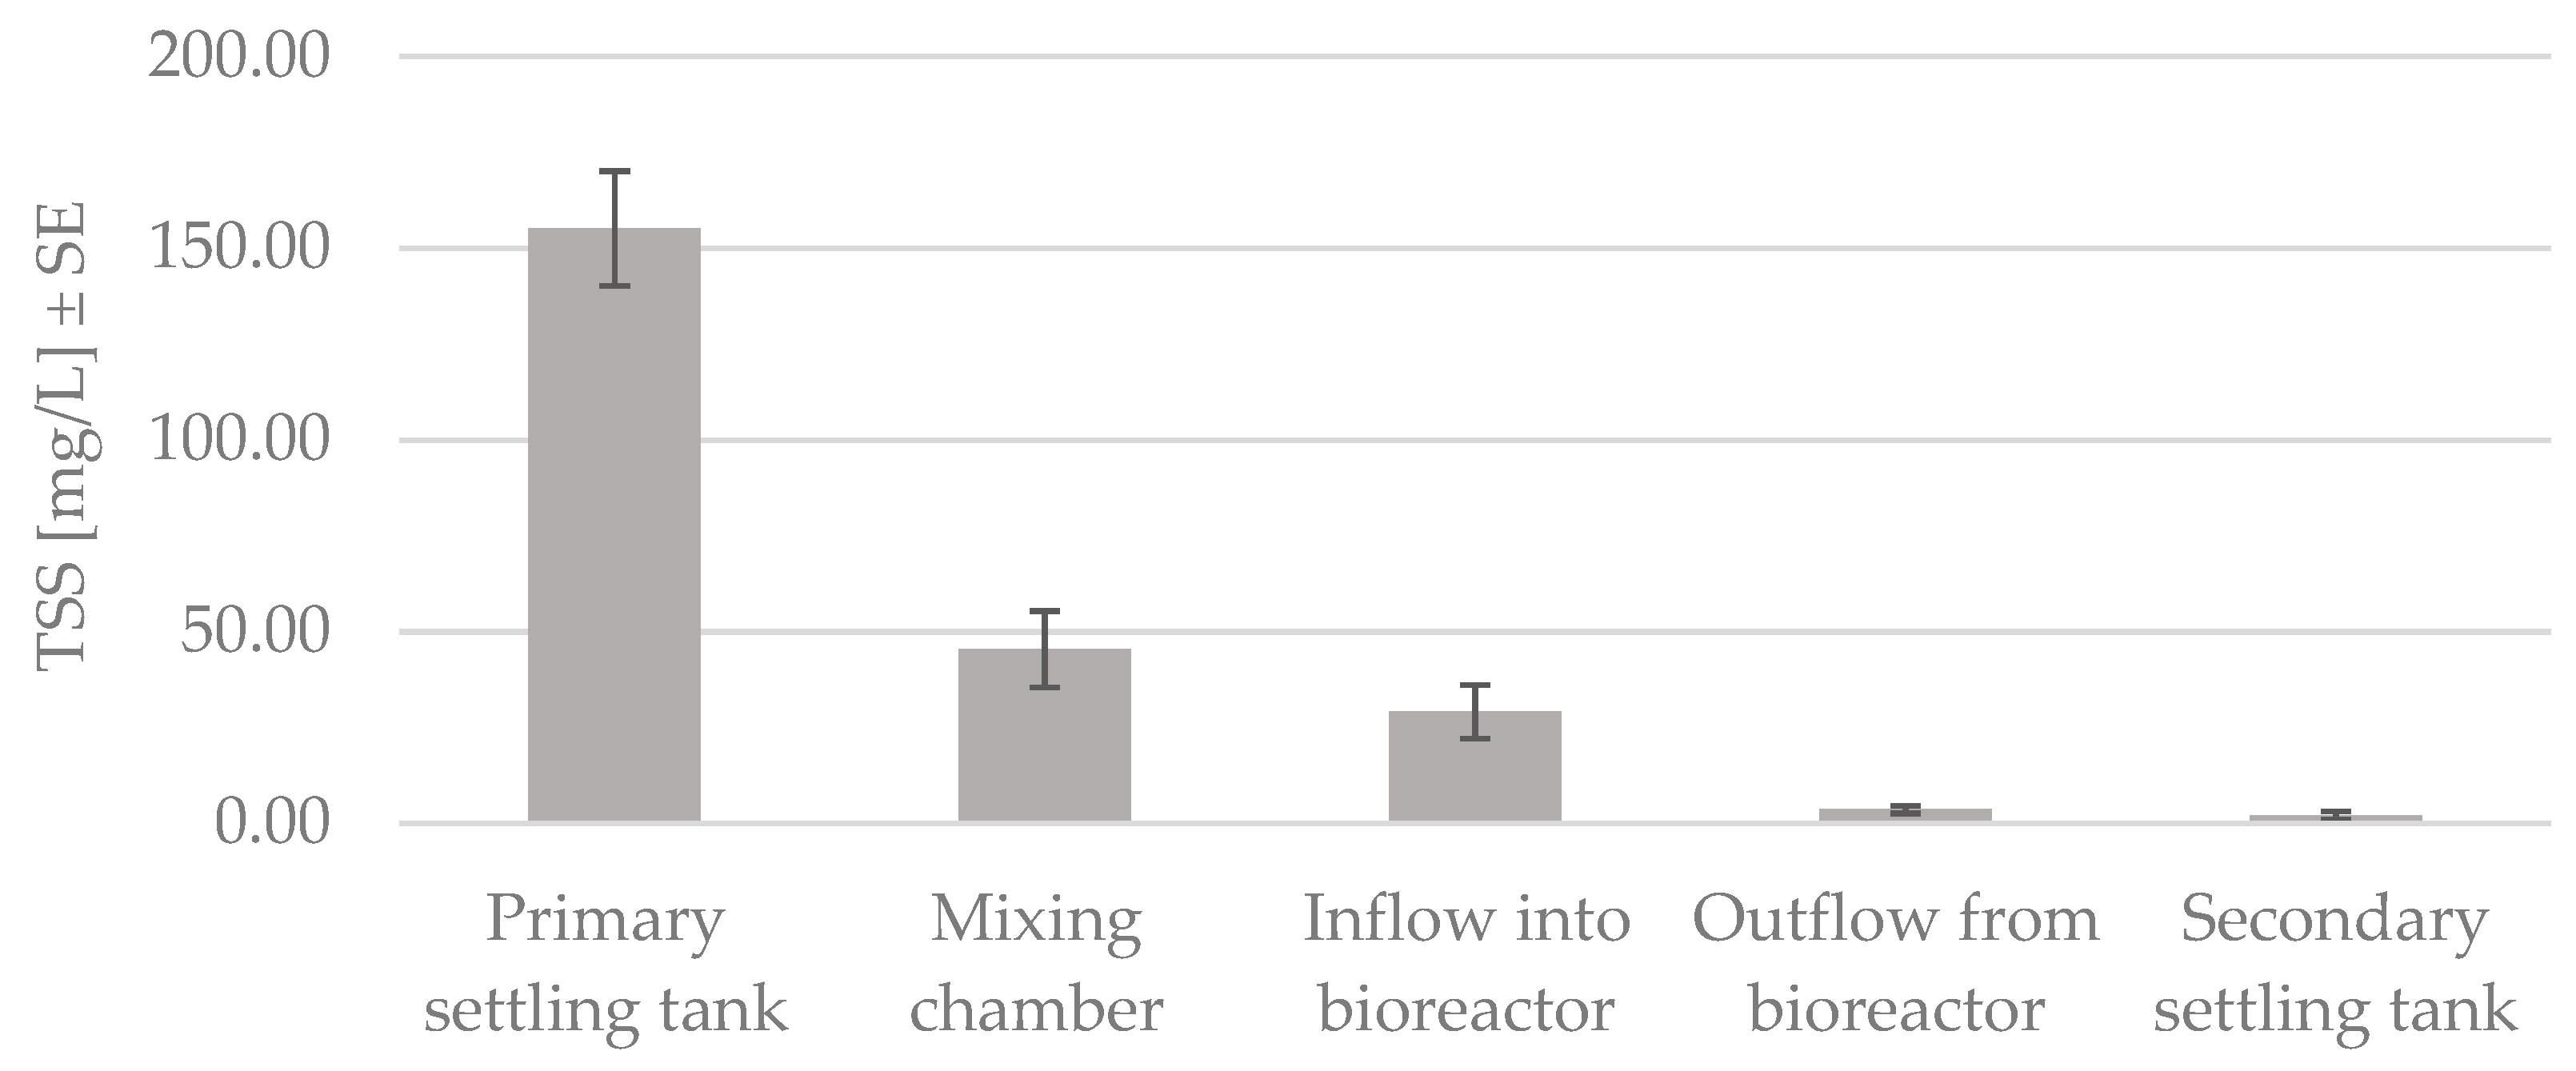
The only exception to the aforementioned observation stating that the results for samples arranged in line with the level of pollution was the arrangement of the samples described as the bioreactor outlet, beyond the ellipsis describing the secondary settling tank. Some of the points describing a measurement drift of the penultimate sample were located on the edge of the left side of the graph. The treated wastewater should be characterized by a much lower odor nuisance. The explanation for this phenomenon can be found in
Figure 9, presenting a graph showing a change in the level of suspended solids. The total TSS values for the samples correspond to the tendency observed in
Figure 4.
The observations from primary settling tank and secondary settling tank depicted in
Figure 5 were separable, and certain directions of changes which took place in the wastewater treatment process observed in PCA map could be defined. Based on the PCA and the distribution of ellipses on the graph, certain tendencies and correlations between the pollution indicators could be observed, which has already been mentioned in the literature [
7,
8,
11,
14,
15,
16,
60]. Moreover, based on previous research conducted in a laboratory bioreactor [
12], a shift in the characteristics of the considered samples towards the positive values on the
x-axis was observed, along with an increasing wastewater pollution level [
61]. A similar situation occurred in the case of the results discussed in this chapter.
In the course of the analysis of measurement data from the samples of water by means of an e-nose, it was observed that each of the employed statistical methods (
Figure 4,
Figure 5,
Figure 6 and
Figure 7) enabled us to unequivocally distinguish the wastewater treated only in the mechanical part from the biologically treated wastewater. A similar analysis conducted using PCA was presented by Bourgeois et al. [
15]; every disturbance in the wastewater quality (caused by, e.g., heavy rain or chemical pollution) was clearly identifiable in the PCA plot.
Other studies also indicated the possibility of employing PCA, for example, for assessing the operation of wastewater treatment plants with activated sludge at technical scale [
62]. The possibility of using this method for differentiation between raw sewage and final effluent on the basis of the signal from conducing polymer sensor array was proved [
6].
In addition, the literature indicates that it is possible to determine the odor nuisance of treatment devices on the basis of e-nose readouts [
9,
12,
13,
18,
19,
20]. Blanco-Rodríguez et al. [
63] discussed the application of an e-nose in for detecting the odor intensity in a wastewater treatment plant and the analysis of odor in six selected object locations (i.e., BioInlet, BioOutlet, Flotation, Flare, Settling, and Sludge in their work). Generally, the possibility of using the aforementioned devices as an early warning against the odors emitted in the course of the wastewater treatment process and the possibility of utilizing them in situ for odor monitoring were emphasized. However, it was also observed that it is possible to distinguish between particular samples and conduct a basic assessment of a gas mixture, which may help in the preliminary estimation and comparison of compounds emitted from particular locations in a wastewater treatment plant. This may be helpful in detecting changes such as the occurrence of hazardous substances in wastewater, as well as emergencies such as failures in the treatment plant operation.
The possibility of employing a gas sensor array for monitoring the results of wastewater treatment in SBRs operating under laboratory conditions has also been described [
11]. The option to utilize an e-nose for the identification of wastewater treatment stages and the occurrence of process failure on the basis of interpreting the changes in sensor resistance, reacting to the change in the air quality of bioreactor headspace using PCA, was confirmed. This analysis enabled the particular states and phases of a laboratory SBR operation to be distinguished and the results of readouts performed in the headspace of untreated unpurified and purified wastewater could be clearly differentiated [
12].
Research has shown that the e-nose can be a suitable device for the classification of wastewater as well as odors to their respective location in a WWTP. The samples were collected at different locations: influent, settling tank, activated sludge, and final effluent. A clear classification was obtained with a correlation of 0.99631; 93.06% of the outputs were classified successfully with an error below 10% [
10], however, no significant odor problems were recorded within the mentioned plant [
64].
Wastewater classification has also been shown in other studies. Dewwetinck et al. [
8] showed that processing the gas fingerprints with PCA allowed for the interpretation and differentiation of wastewater samples in terms of origin and quality, relative to their reference (i.e., deionized water). In other WWTPs, the samples collected from the inlet works, settling tank, and final effluent showed that a nonspecific sensor array could distinguish between the different types of sewage samples and from different treatment works [
7,
65]. The research conducted by Nake et al. [
17] showed that conducting-polymer (CP) sensors appeared to be unsuitable for this application while MOS sensors were a better fit. The MOS sensors were able to discriminate between the different odors from the outdoor sludge/bark mixer, the outdoor deodorization tower, outdoor sludge dewatering, and the clarifier.
The fact that each of the applied statistical methods (
Figure 4,
Figure 5,
Figure 6 and
Figure 7) enabled us to unequivocally distinguish the mechanically treated wastewater from the biologically treated wastewater can have a practical application in the future for the management of processes conducted at full-scale WWTPs. The presented methods could be applied in a preliminary assessment and classification of the wastewater treatment result as well as in the rapid on-line detection of a malfunction or treatment process failure in flow bioreactors with activated sludge. In the mentioned case, results can be interpreted as the more the clusters grouping the measurement results of the samples collected in the primary and secondary settling tanks differ from each other, the more efficient the treatment process. The opposite is true as well—the more similar the clusters reflecting features of wastewater before and after biological purification, the less efficient the treatment process. In turn, a sudden decrease in the difference between the clusters corresponding to the readout of arrays analyzing the two devices (primary and secondary settling tanks) may indicate a failure in the treatment process. Rapid detection of disturbances in the treatment process and a decrease in the quality of treated wastewater would give time for WWTP operators to identify the causes of failure, take preventive actions, and avoid further deterioration which could result in exceeding the permissible level of the quality of treated wastewater discharged to the receiver.
The possibility of using a gas sensor array for the assessment and classification of the wastewater taken up in various treatment plant devices was indicated in the cited works. However, this paper also attempts to familiarize the reader with the mathematical methods for the analysis of multidimensional signals, starting with initial visualization in two- and three-dimensional space, through interpretation of the similarities characterizing the analyzed datasets, confirmation of the observed relations using cluster analysis, to their verification with supervised learning techniques.
4. Summary and Conclusions
The results of the conducted research confirm that the gas sensor arrays could analyze various gases, depending on the configuration of sensors. Quick, relatively inexpensive, and repeatable (provided that the sensors are flushed appropriately prior to use) operation constitute the advantages of the discussed devices. This method is suitable for so-called screening tests (i.e., indicating any deviations from the norm). The on-line measurements enable a constant monitoring of the wastewater table headspace, and thus acquisition of information on the conducted processes. Additionally, the operation of multisensor arrays and the results of conducted studies may constitute a basis for the creation of early warning systems and models of wastewater treatment processes.
The presented research results and cited references indicate that multisensor arrays—especially MOS-type sensors—may find application in objects characterized by high odor nuisance (i.e., wastewater treatment plants). This technology facilitates the classification of samples as well as their preliminary assessment.
Conducting a relatively simple PCA facilitates the interpretation of a set of measurement data, and provides relevant information on the tendencies as well as similarities and differences among the samples.
Cluster analysis which operates in 17-dimensional space could group observations according to their membership to stages of treatment, and confirmed the fact that there is potential to discriminate stages of wastewater treatment by means of statistically modeling data from an electronic nose.
The readings from electronic nose sensors could be applied to build split rules of a decision tree model classifying observations with very good precision. The purity of leaves (terminal nodes) in the decision tree was very high and allowed us to obtain a predictive model with sufficient accuracy describing the classification of samples into stages of wastewater purification at a full-scale treatment plant.

 ,
, 


