An Accurate Clinical Implication Assessment for Diabetes Mellitus Prevalence Based on a Study from Nigeria

 , , and
Abstract
:1. Introduction
Background
2. Material and Methods
2.1. Ethical Consents
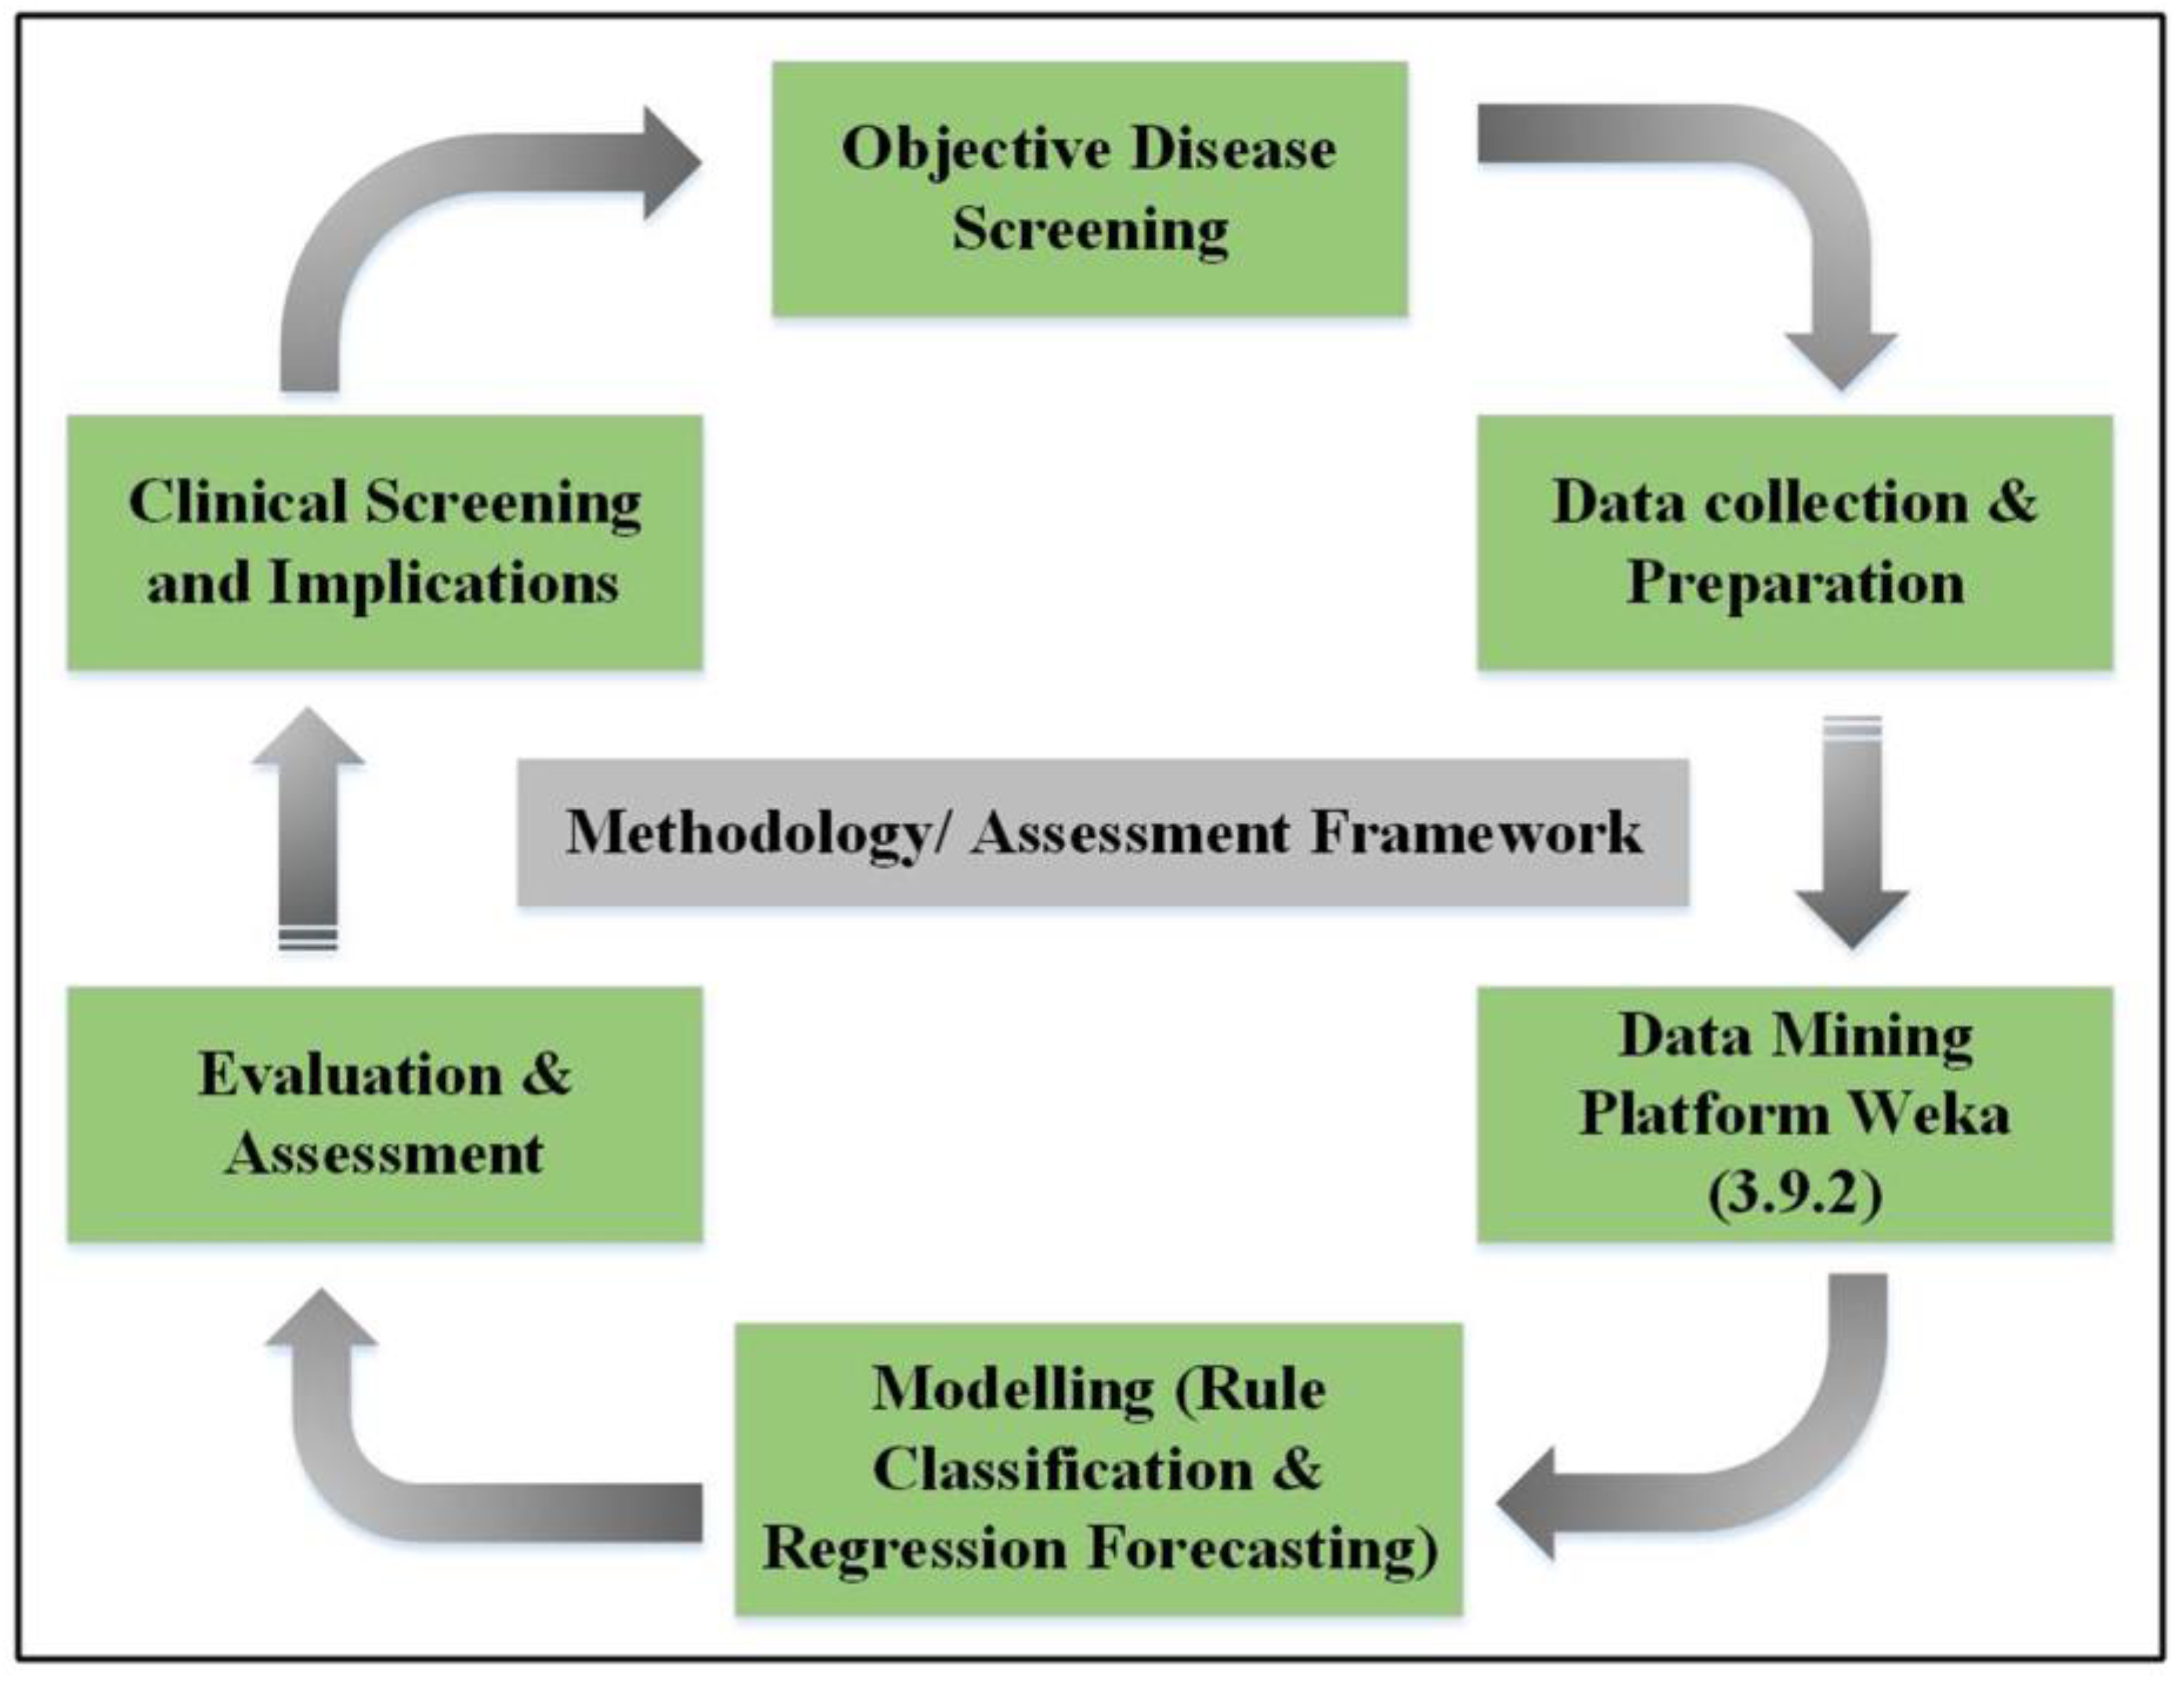
2.2. Model Framework
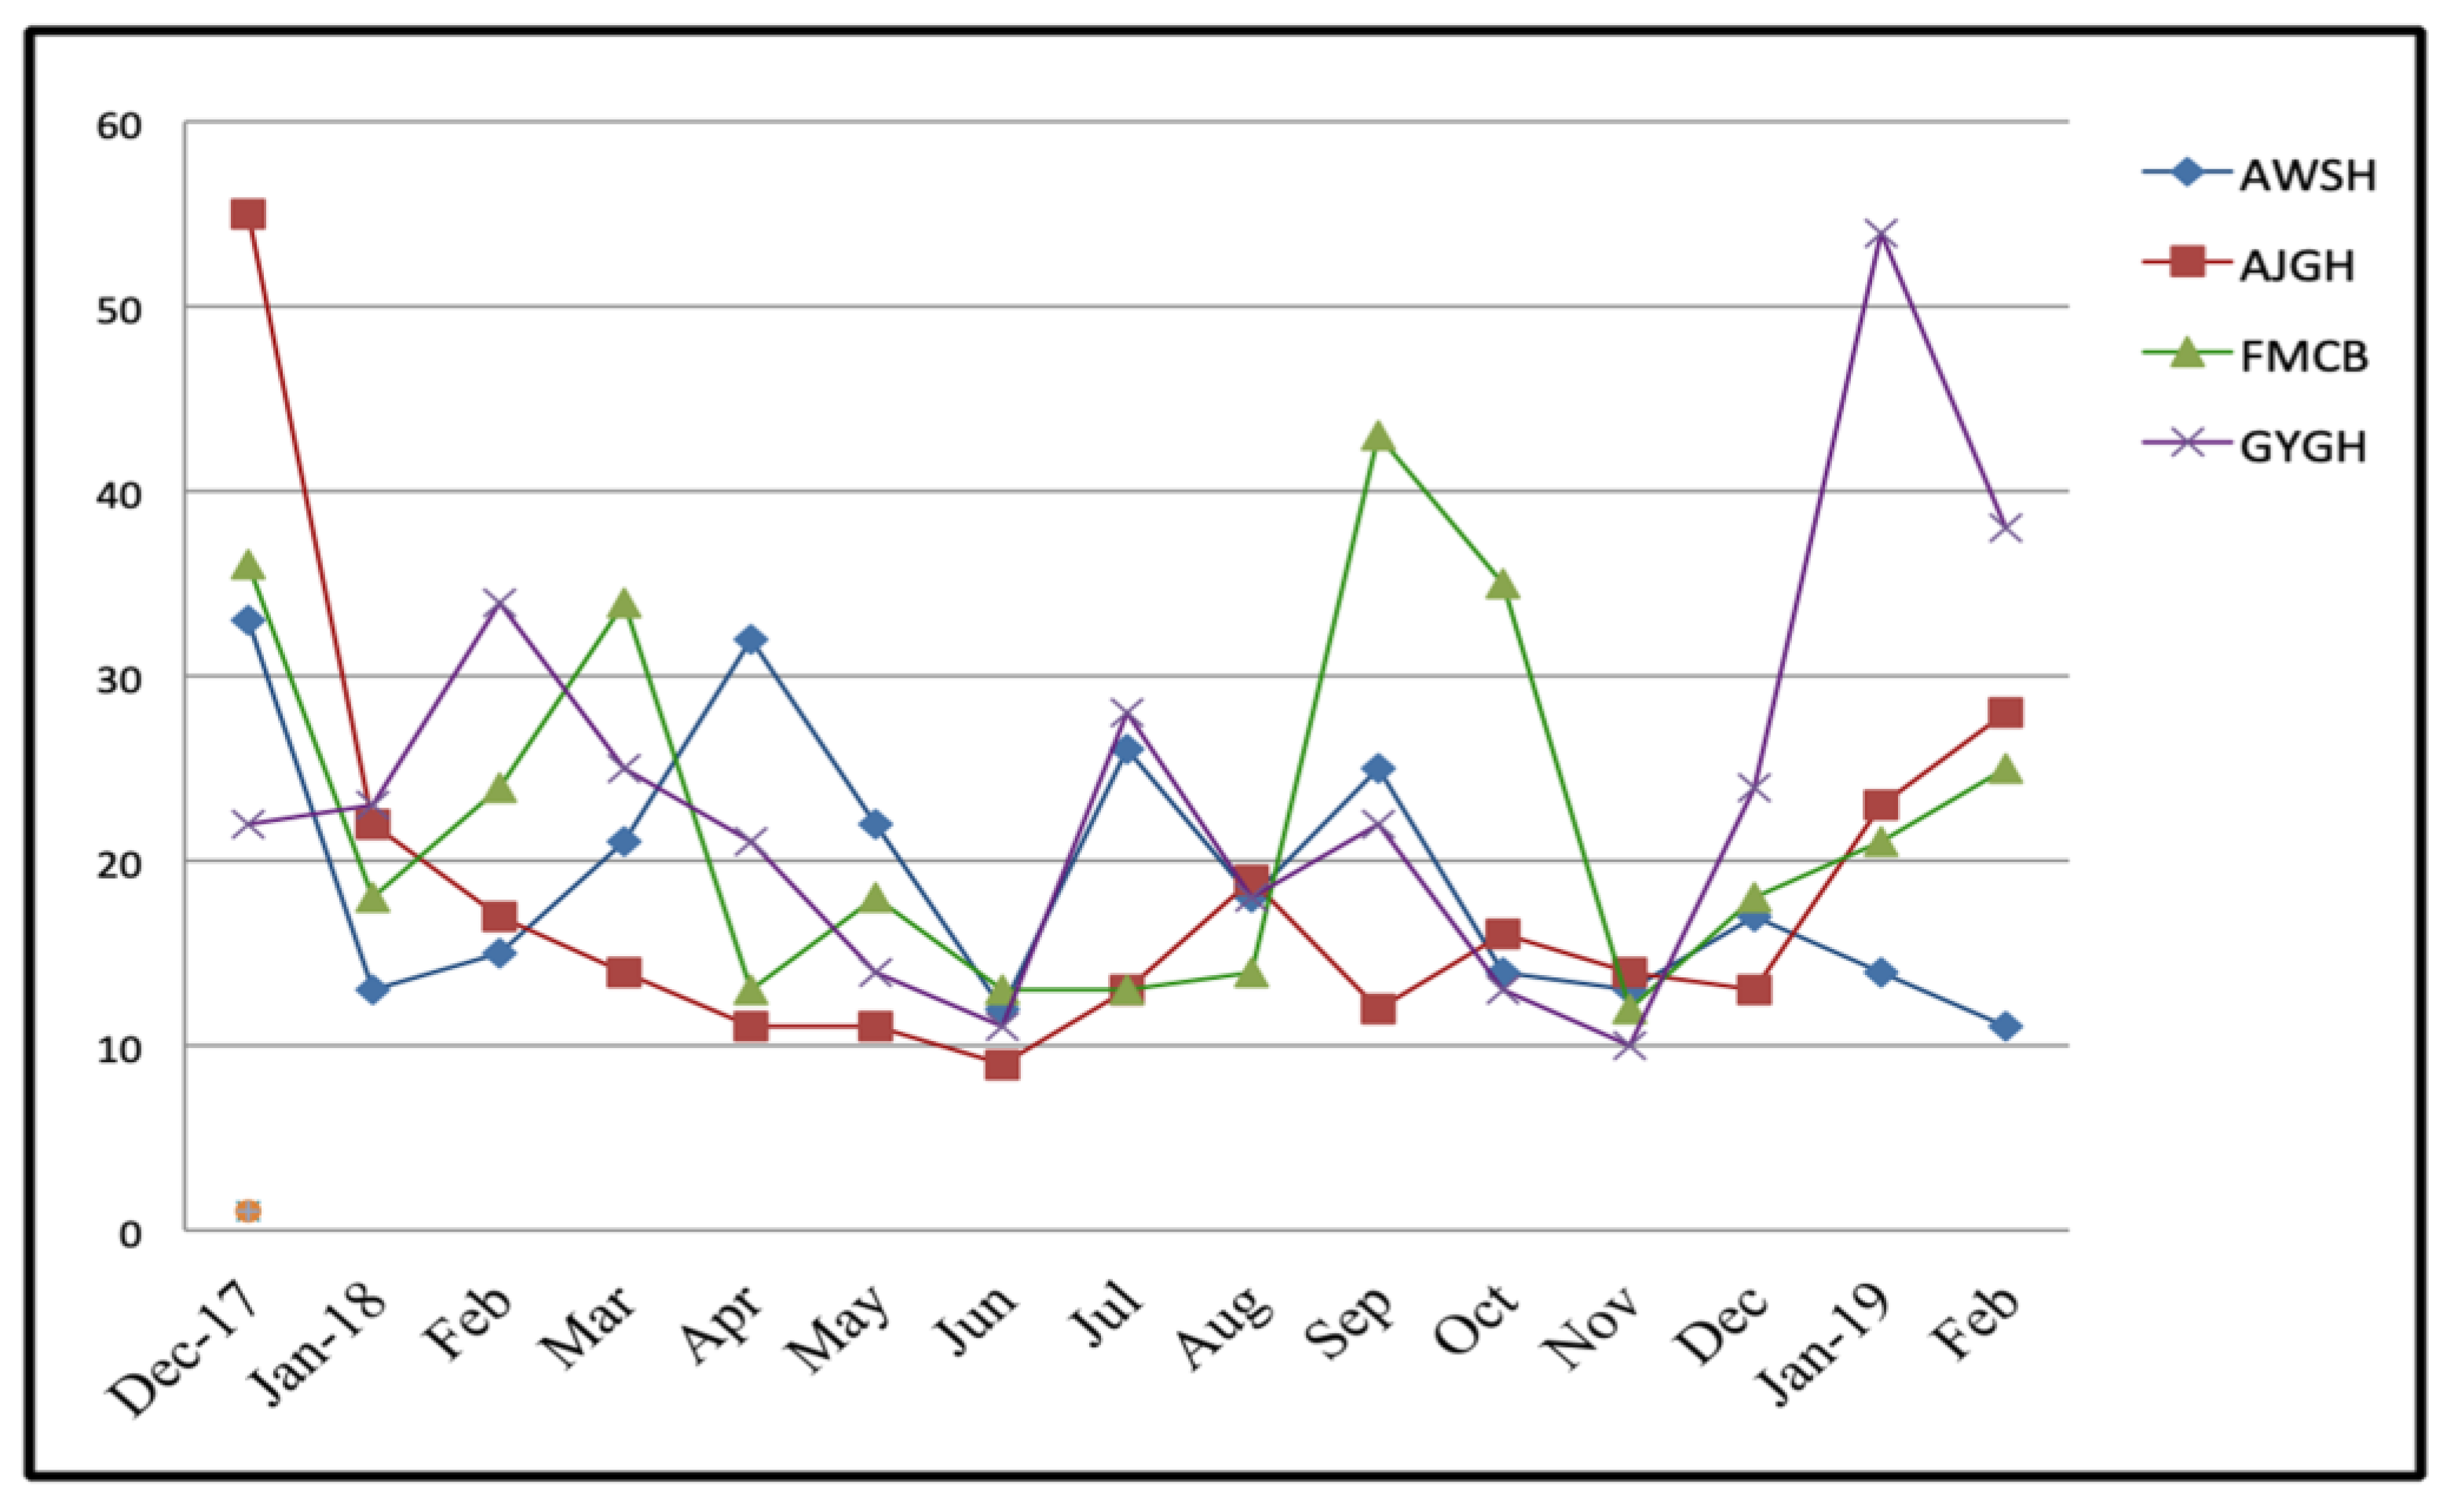
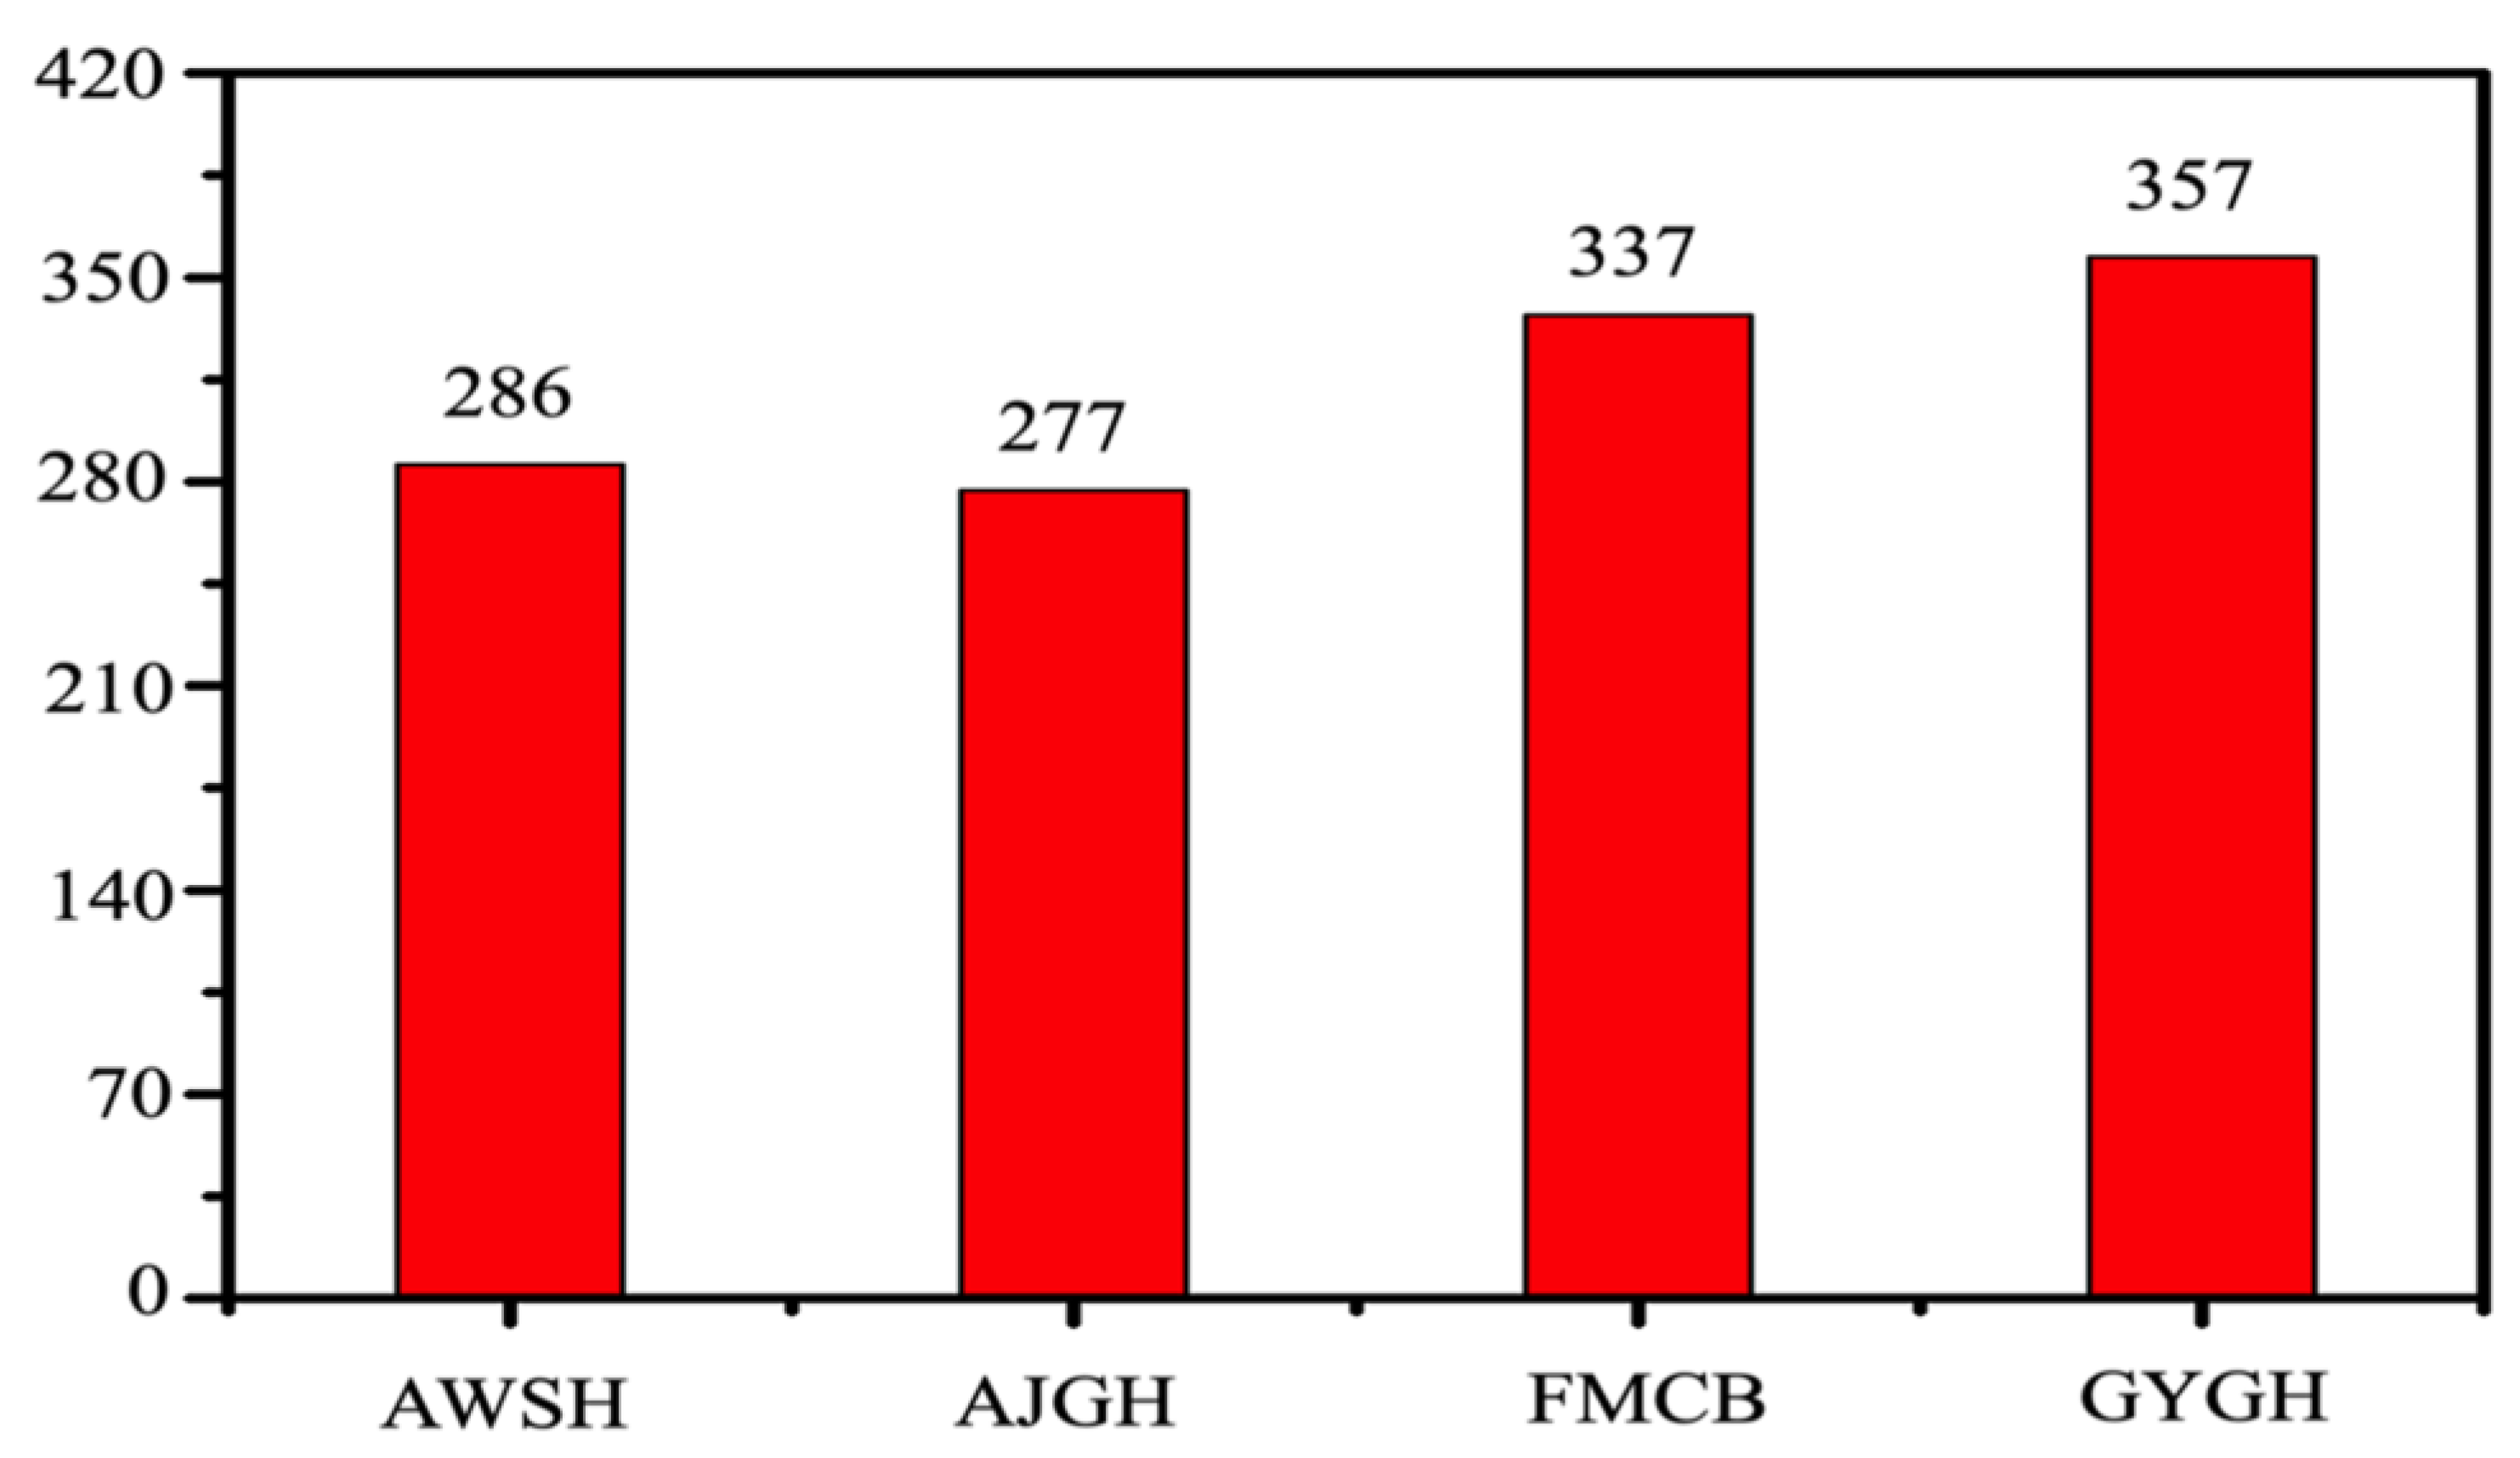
2.3. Data Collection and Explanation
2.4. Attributes Selection
2.5. Attribute Parameters
2.6. Data Mining Platform
- (i)
- Place the K points into the considerable space as represented by the objects that are being clustered, which indicate the initial group of centroids.
- (ii)
- Properly assign each object to the group that undoubtedly possesses the most adjacent centroid.
- (iii)
- After assigning all objects, recalculate the prominent position of the K centroid.
- (iv)
- Repeat the second and third step until the centroids are not able to shift significantly more. This efficiently produces the possible separation of group objects, which can accurately calculate the matrix to be minimized by Equation (4).
2.7. Rules Classification
2.8. Kappa Statistics
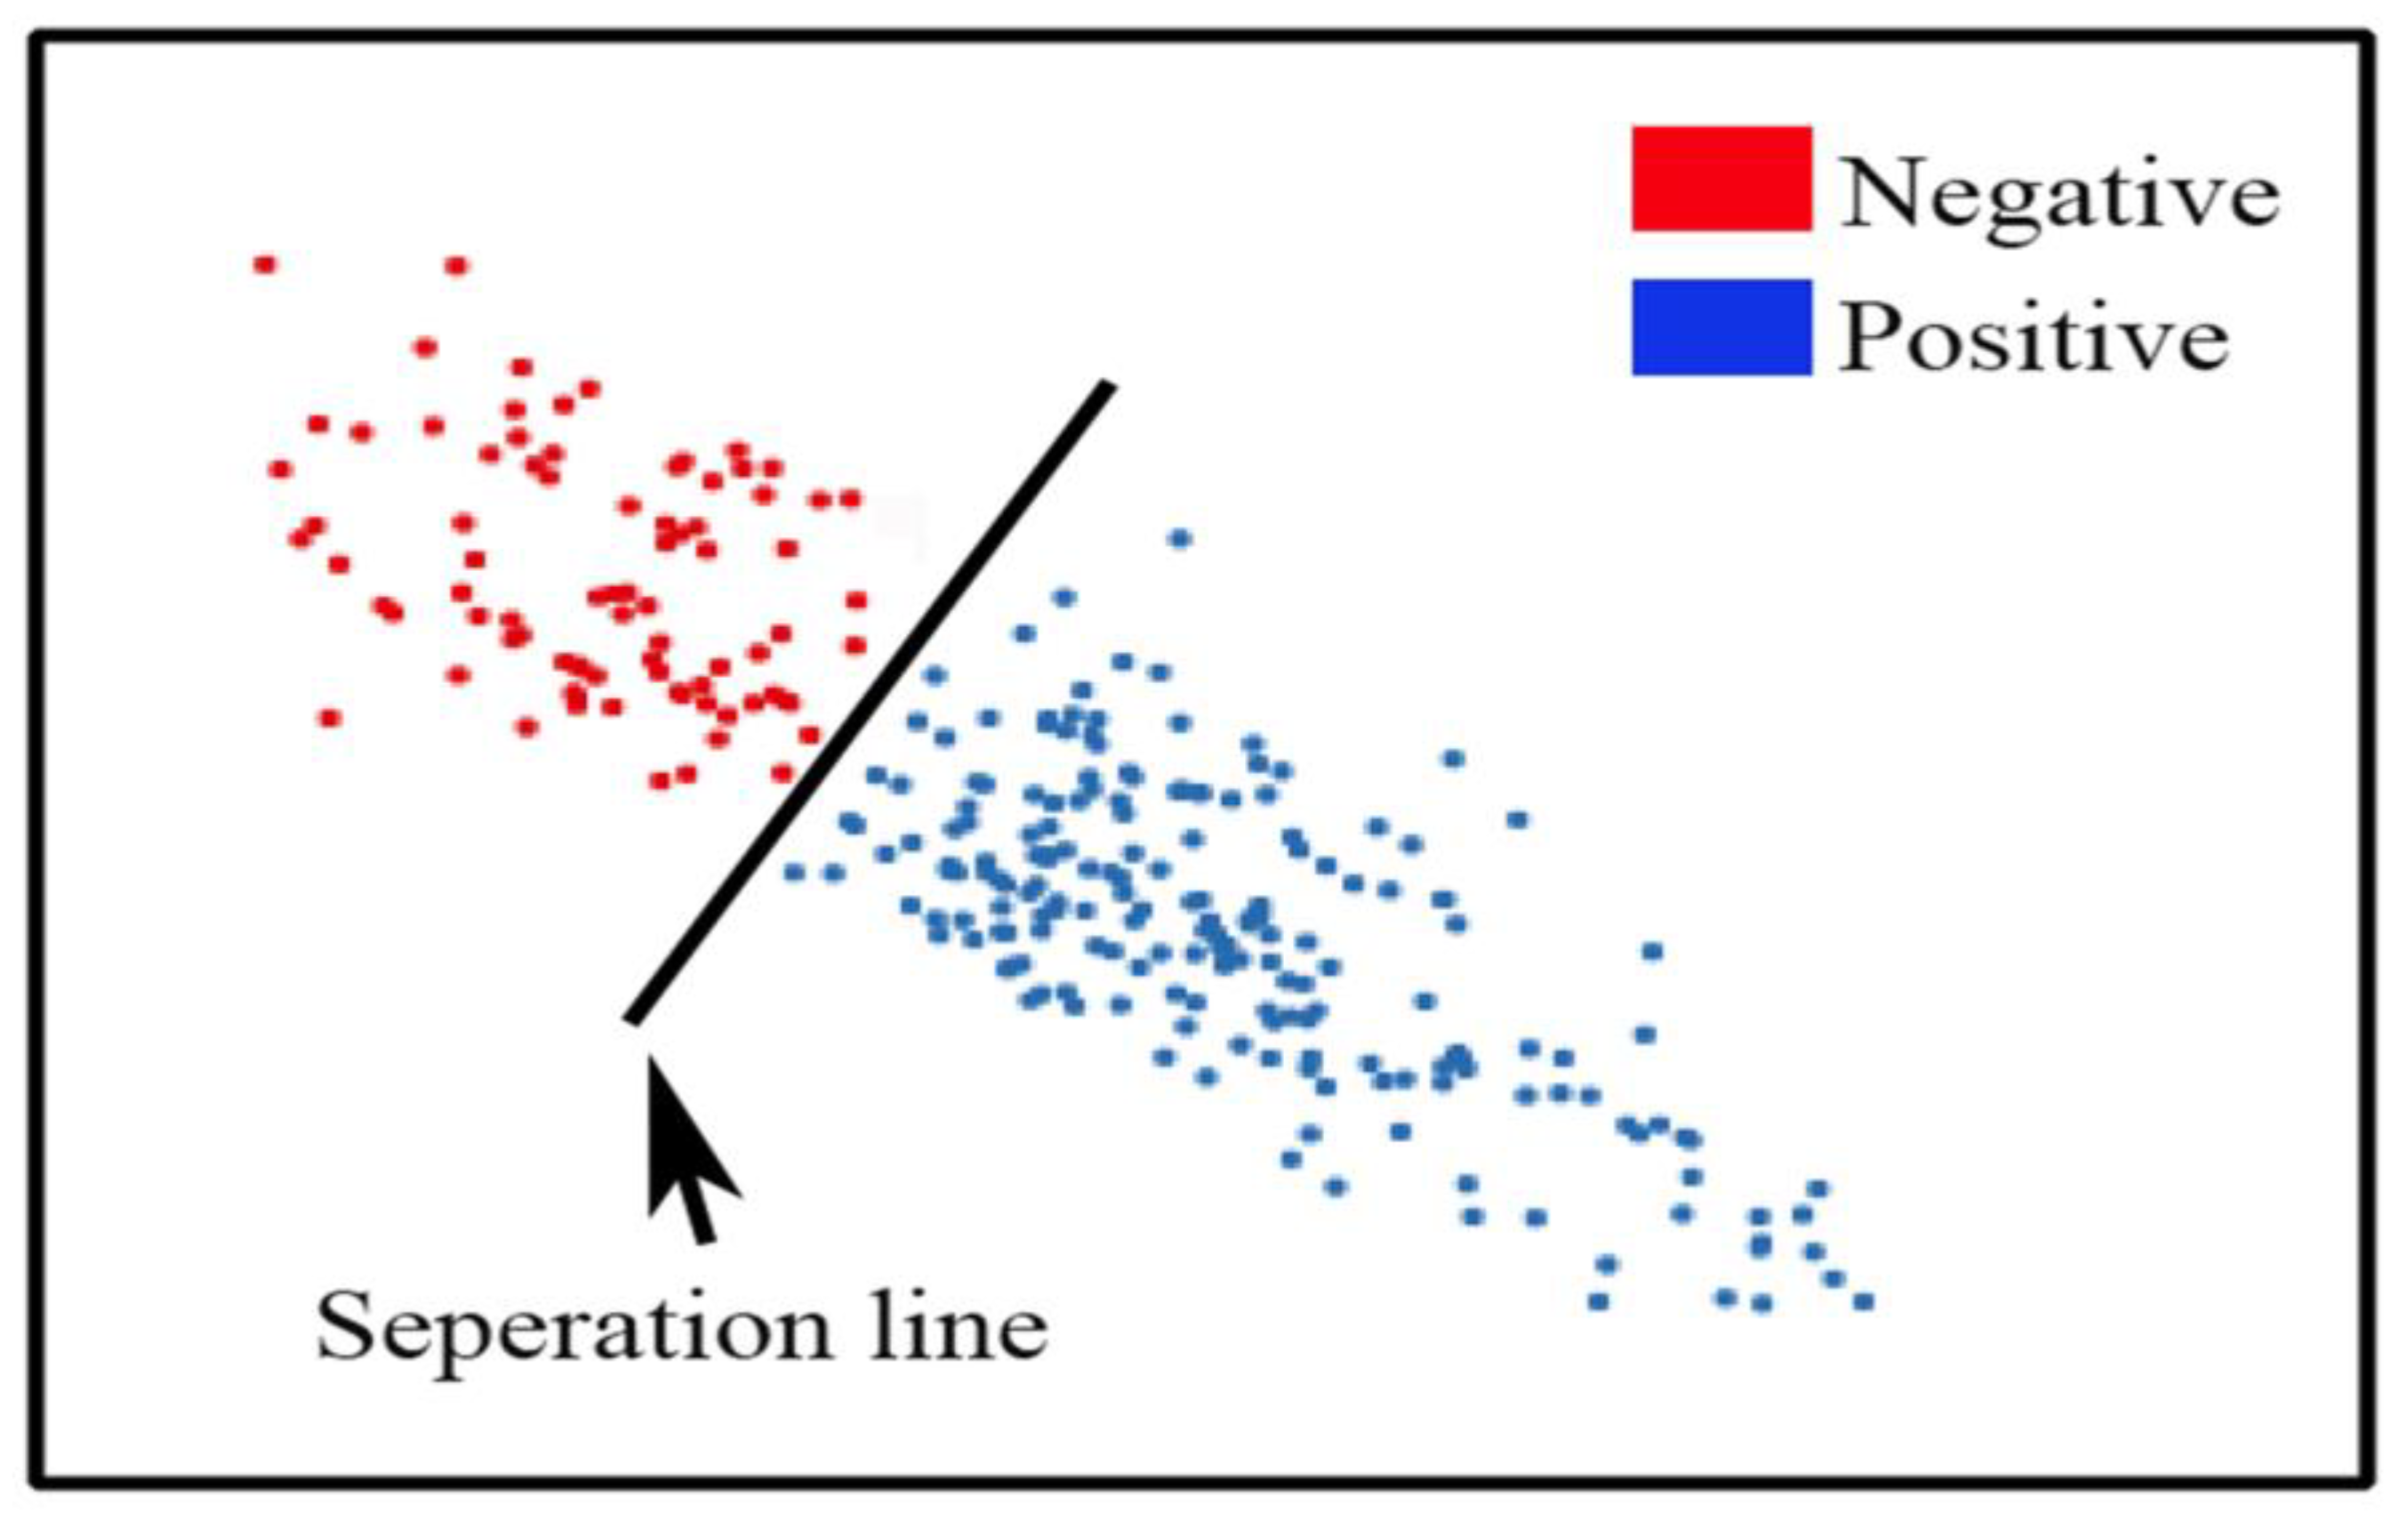
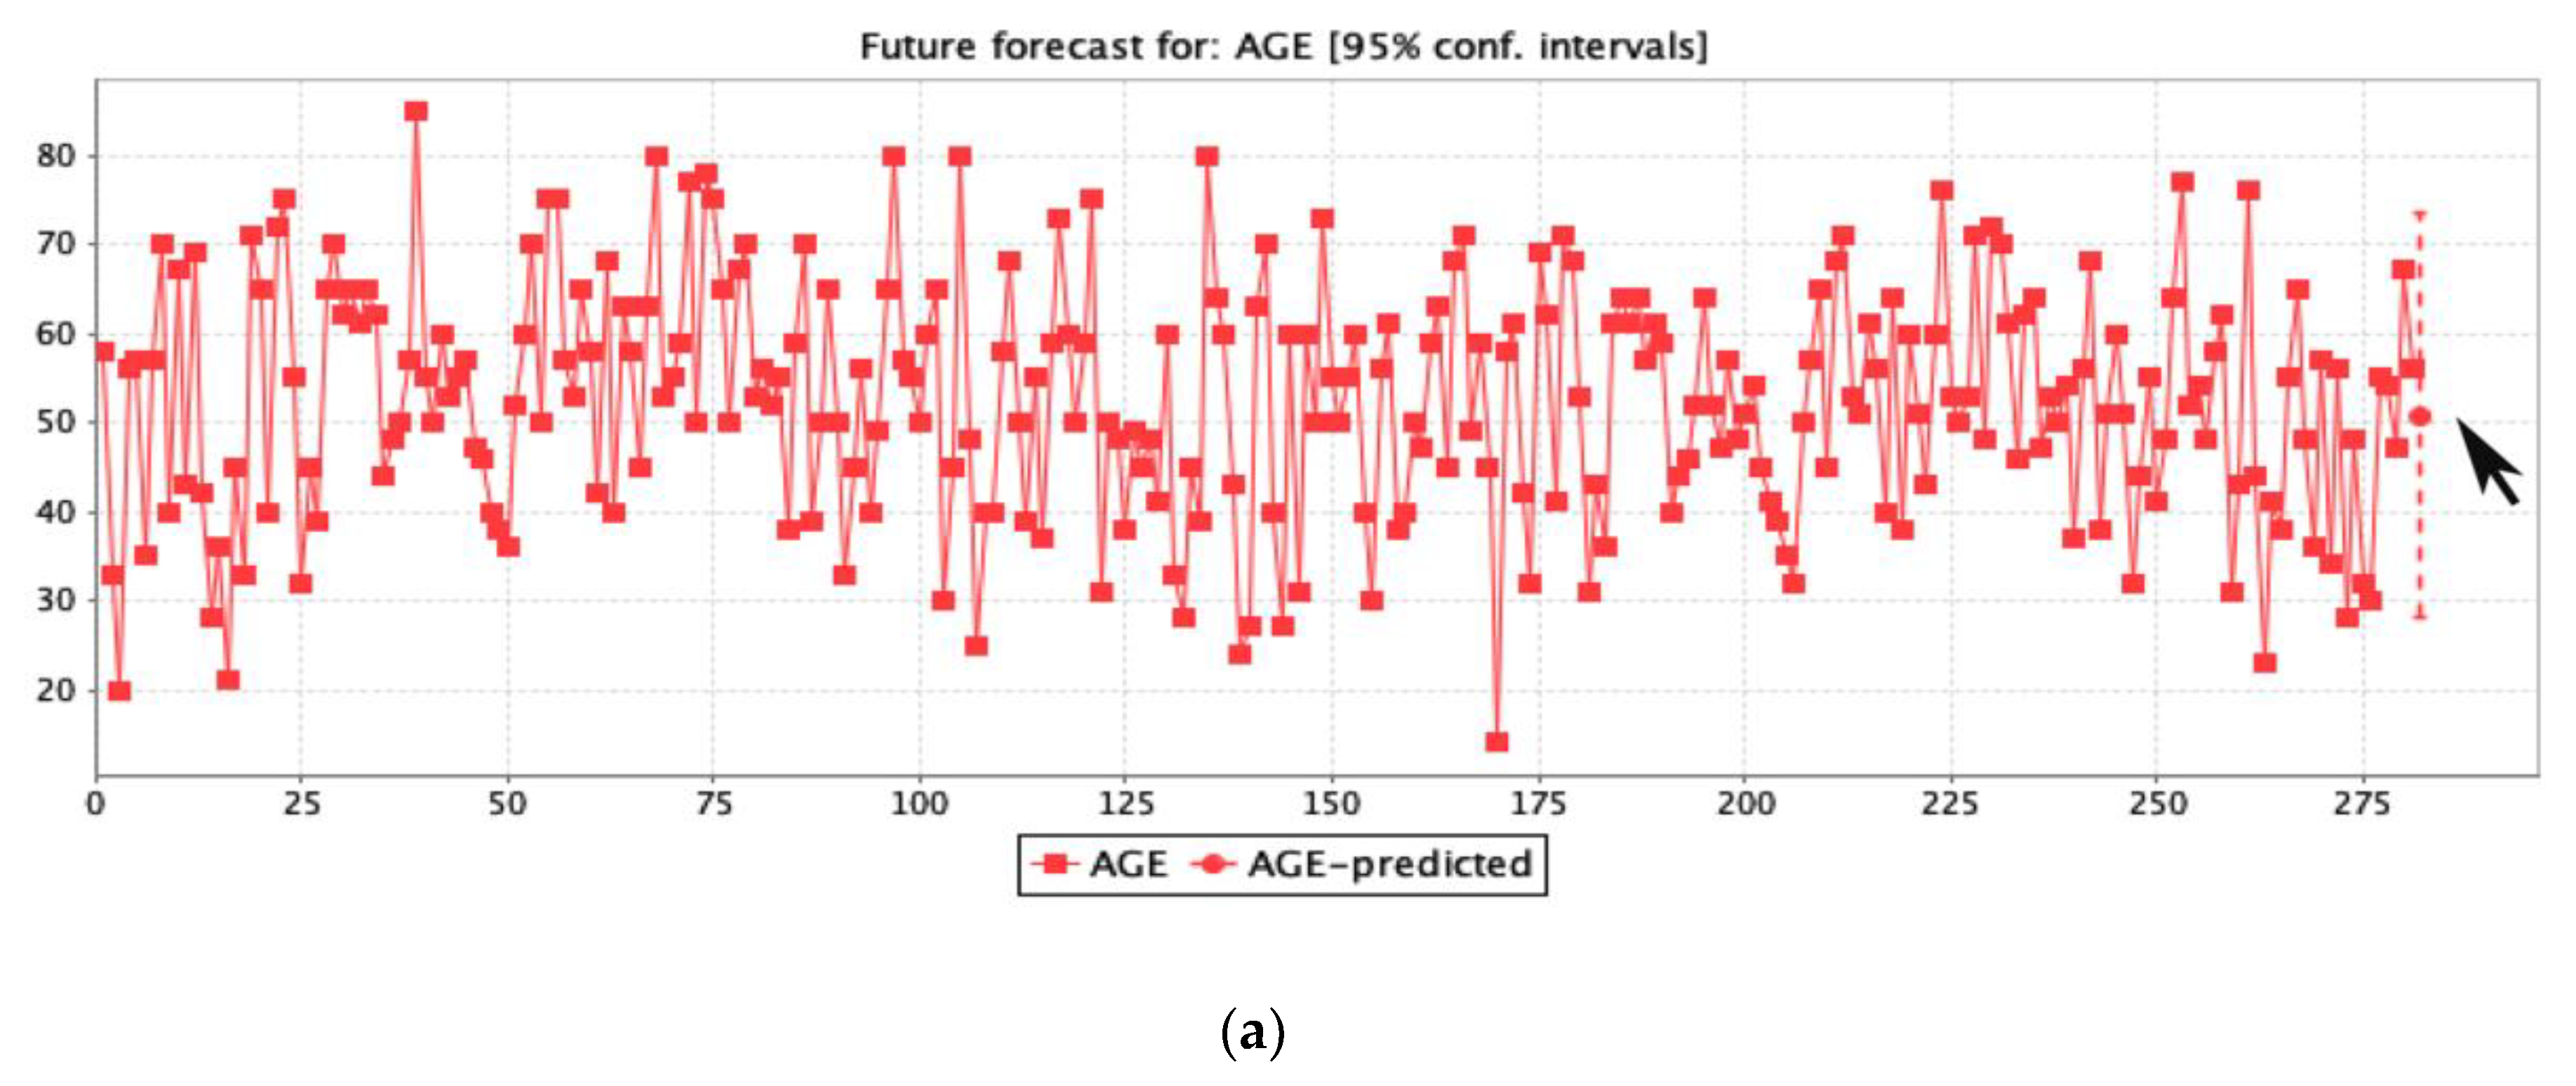
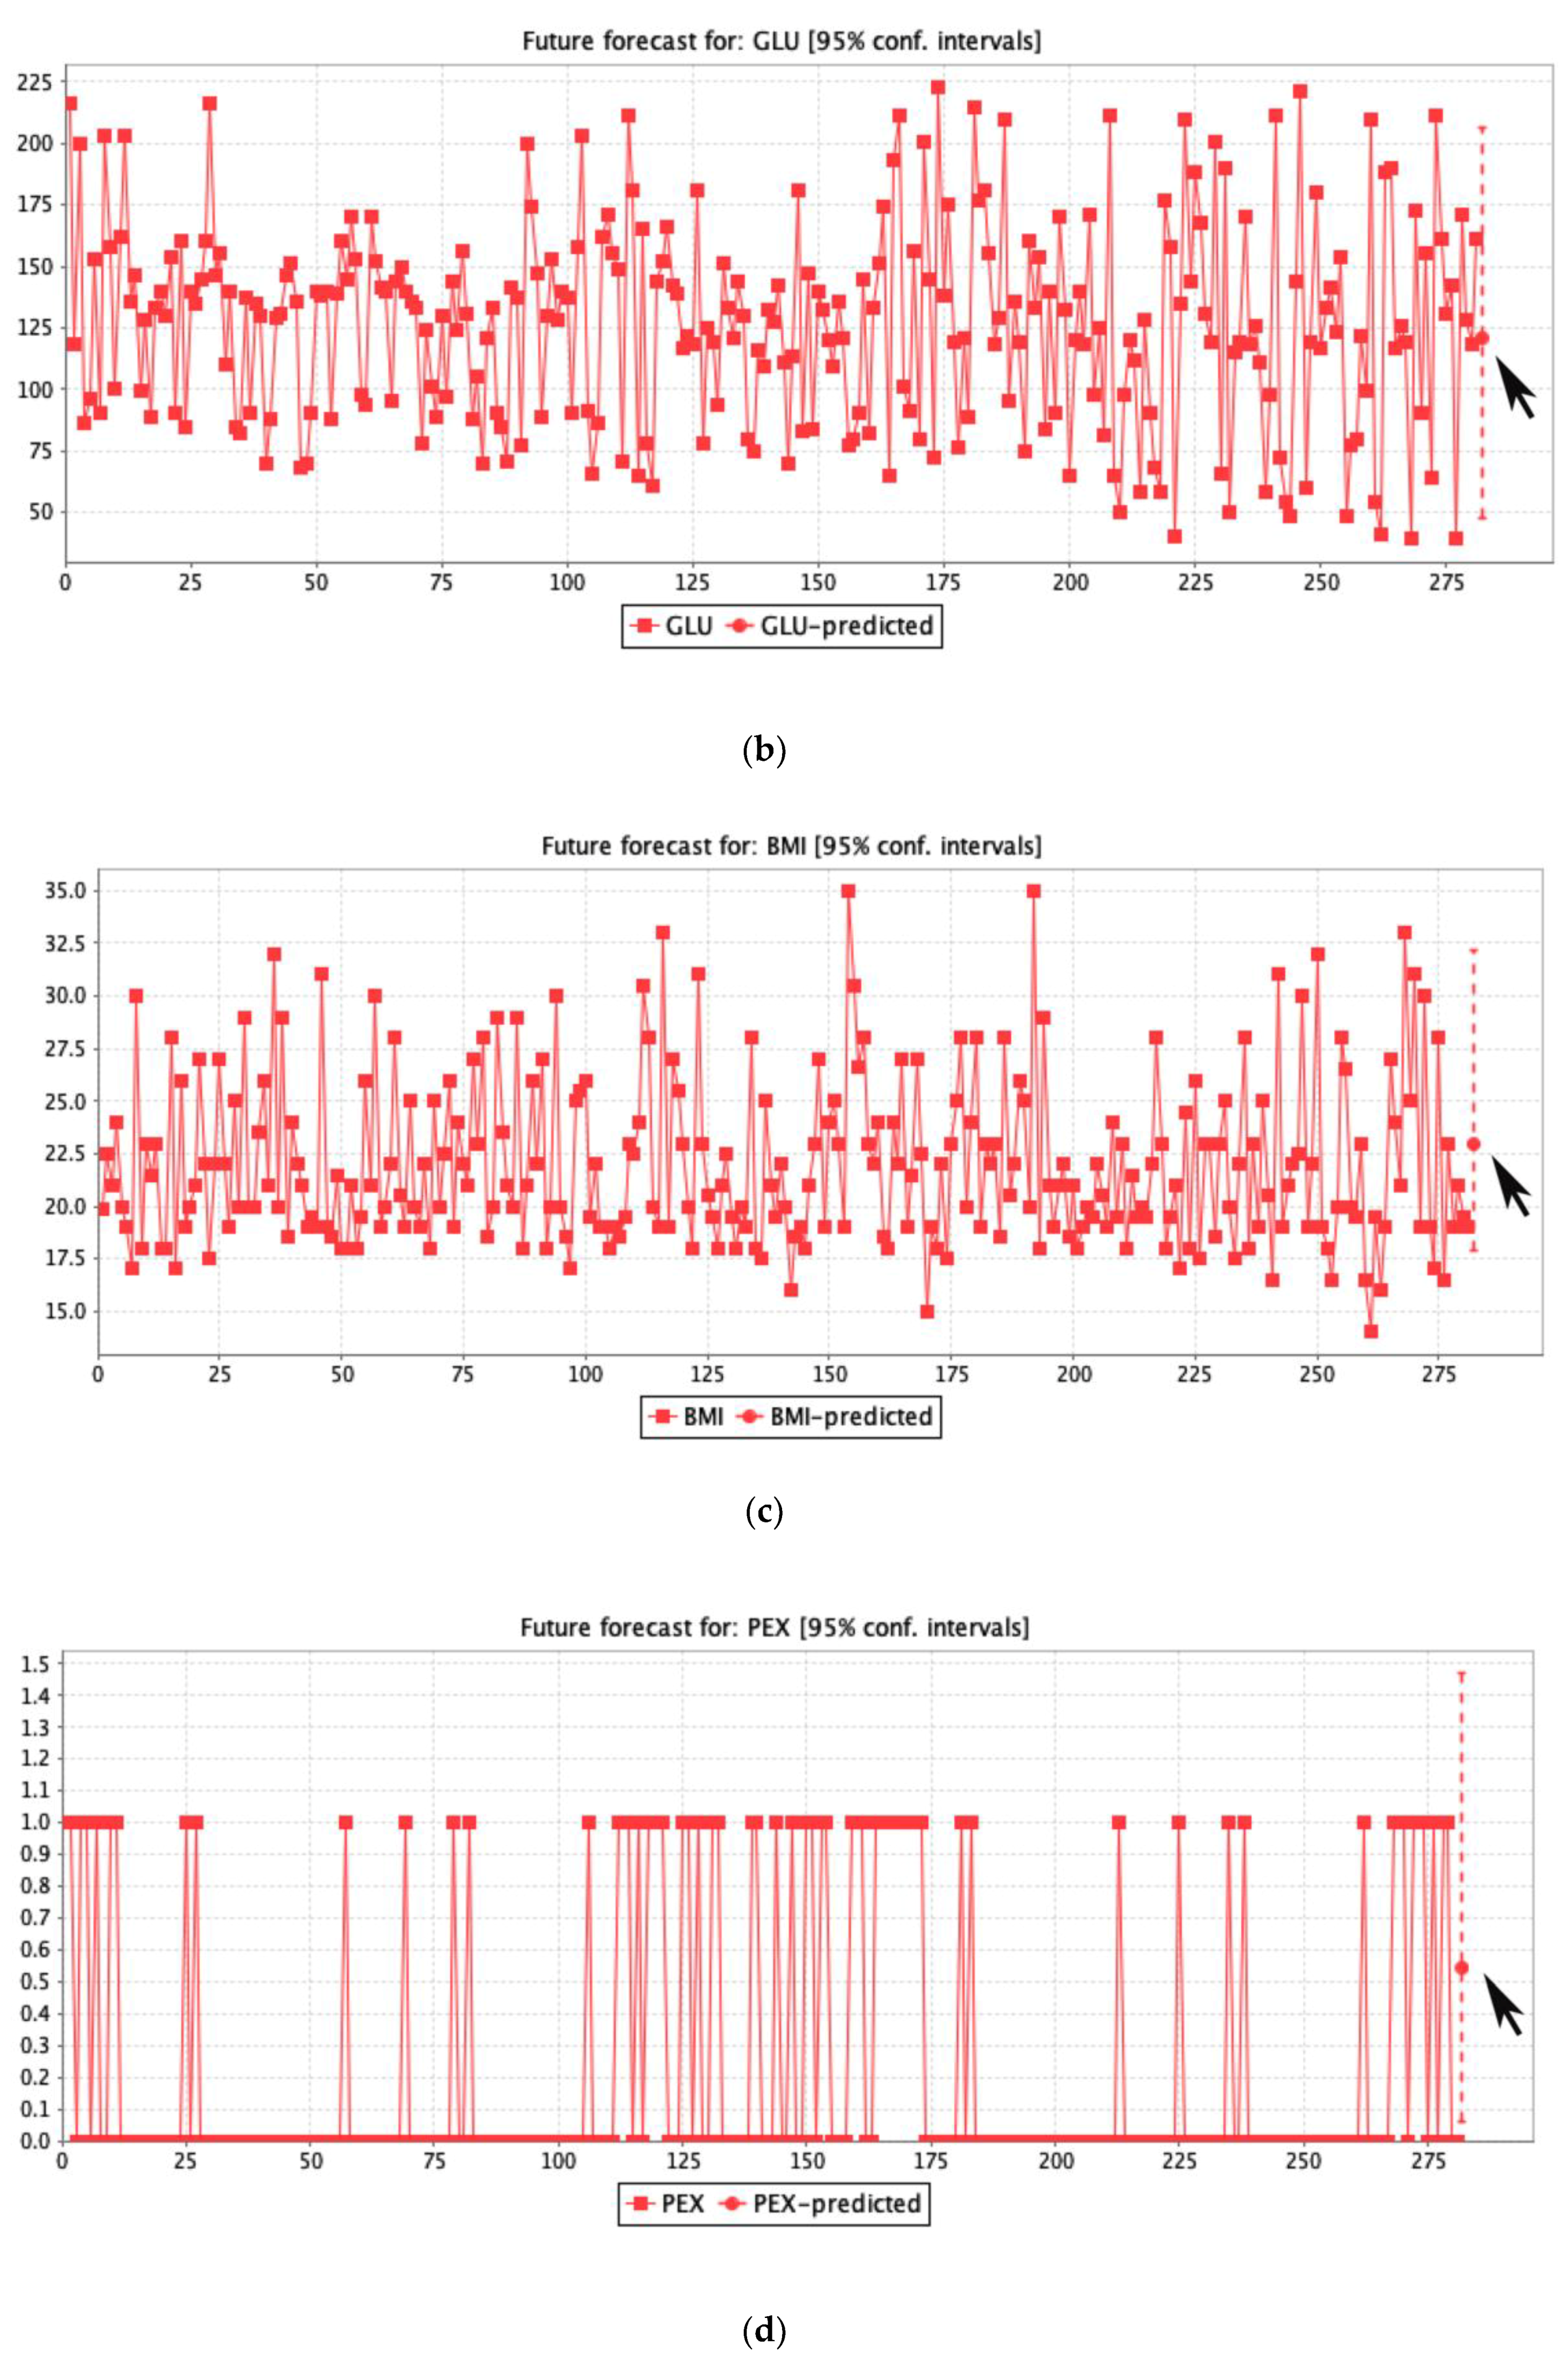
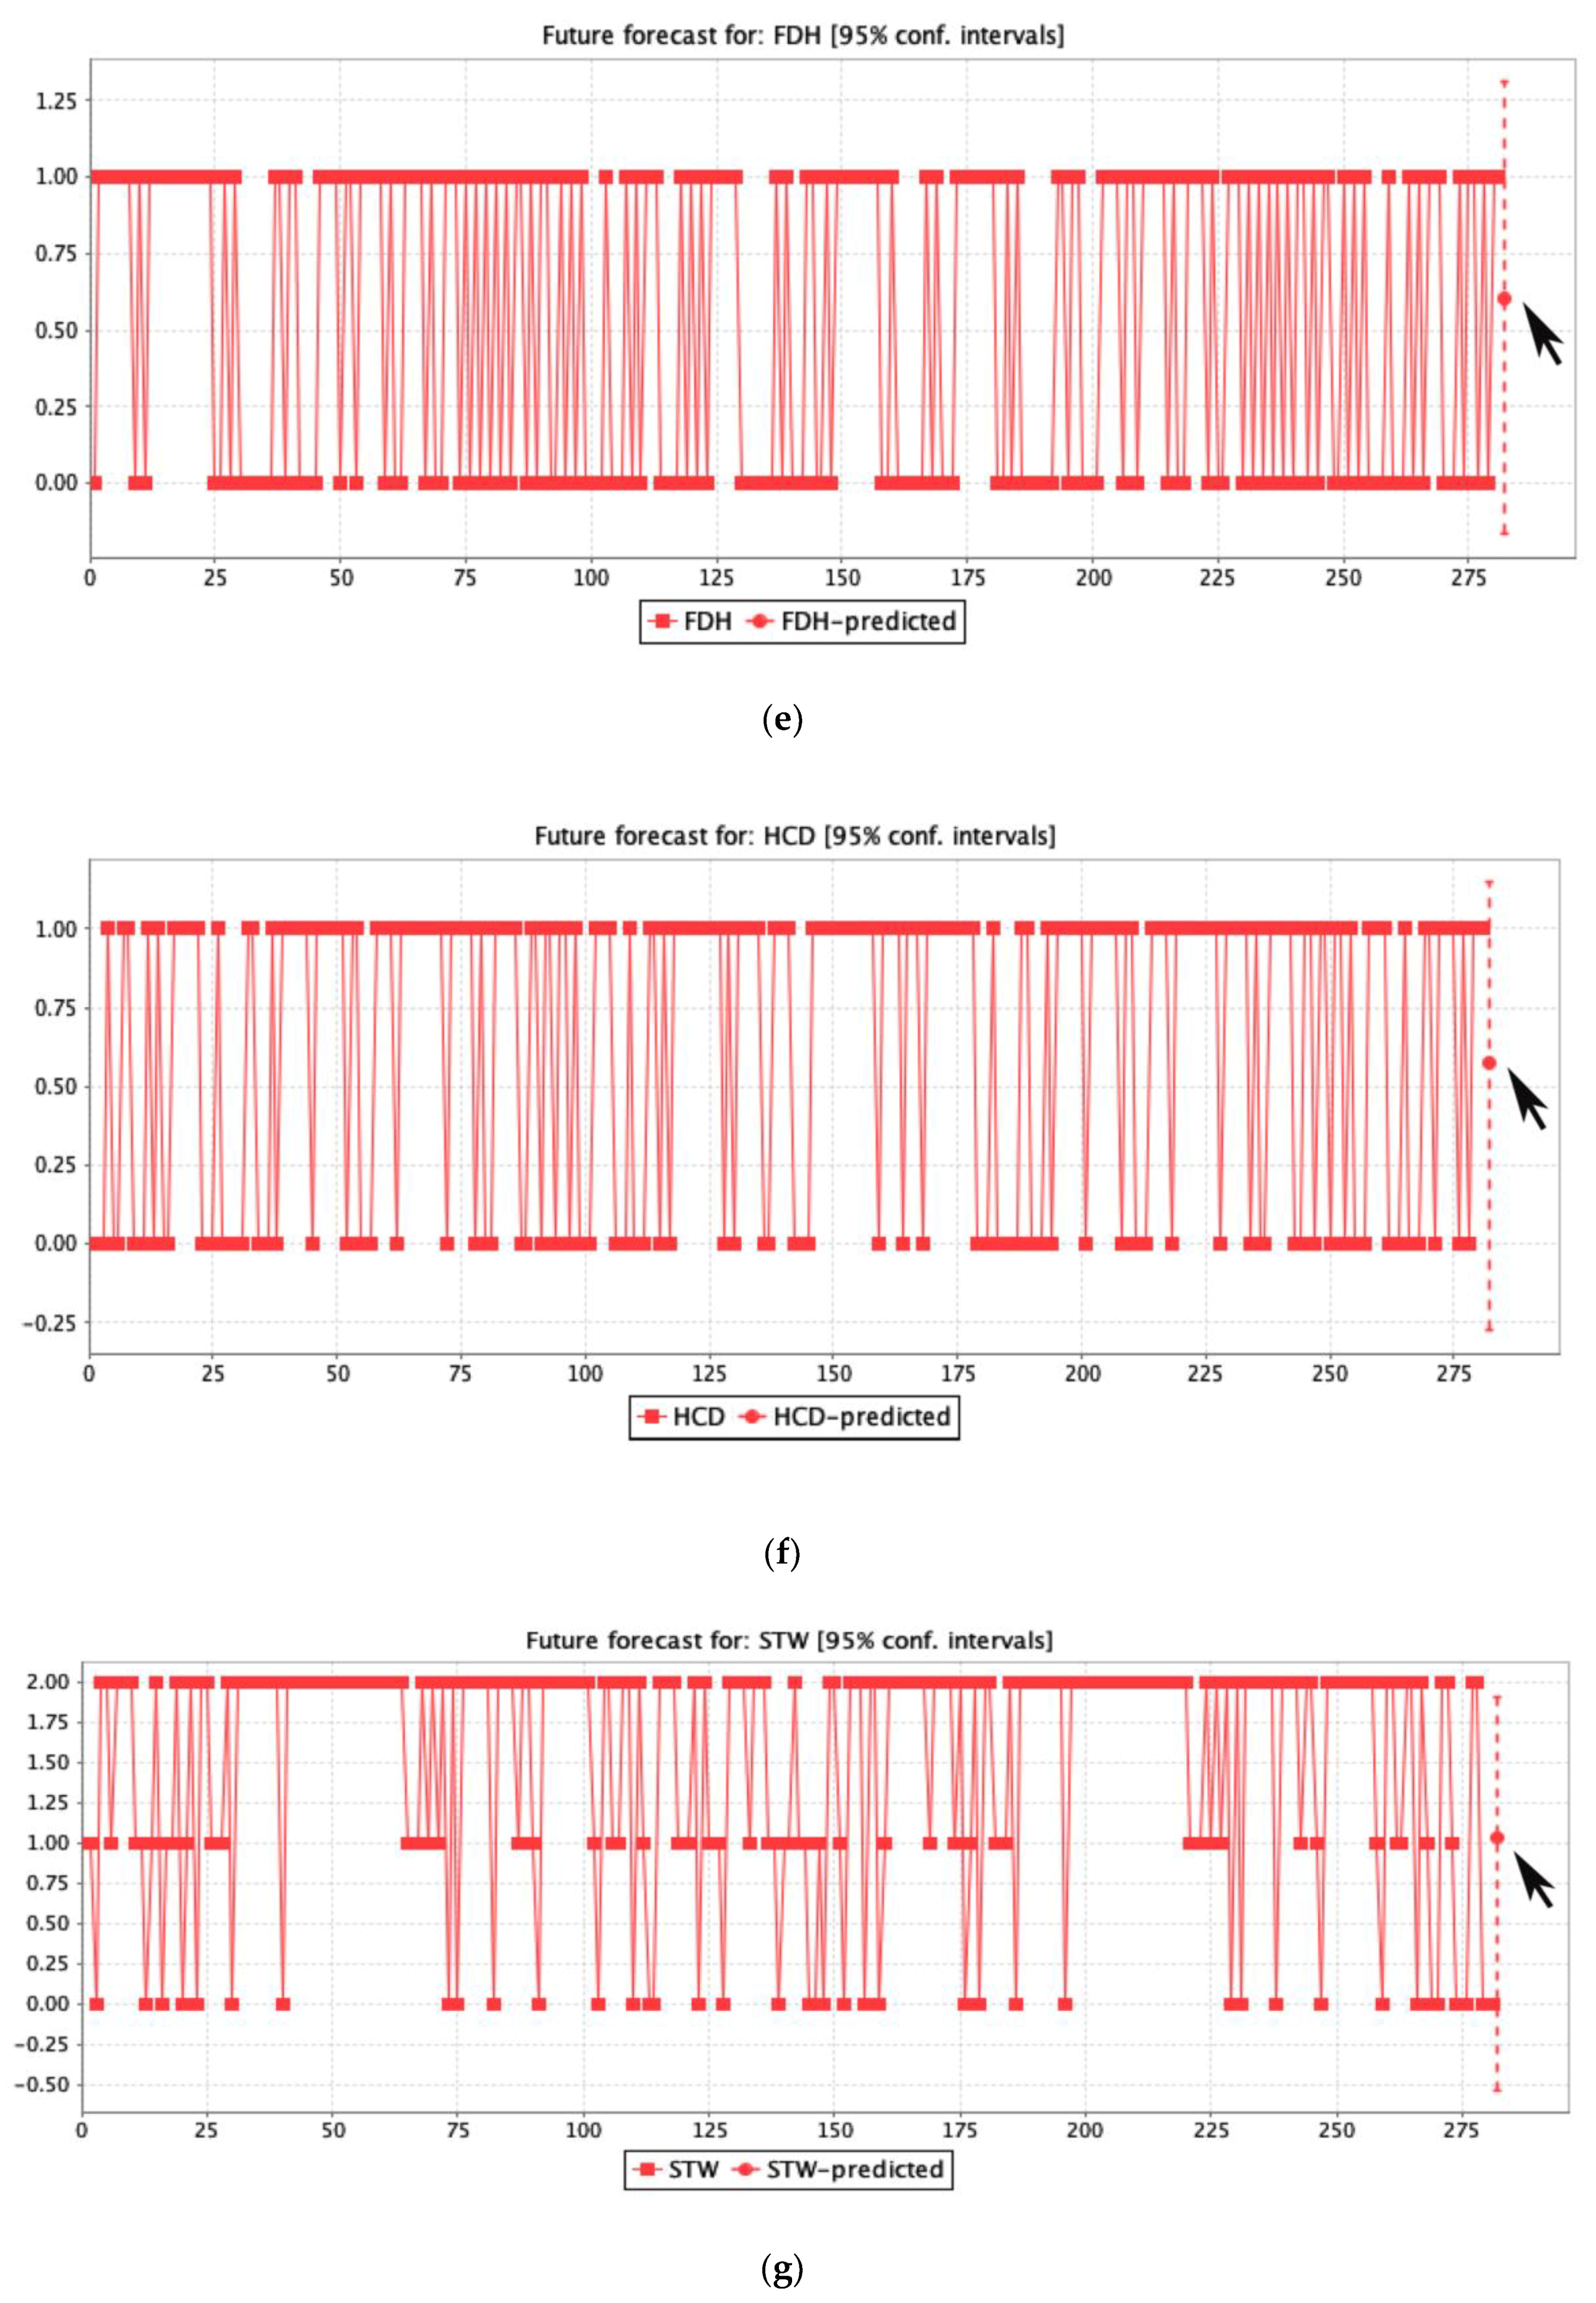
2.9. Logistic Regression Forecasting
3. Results
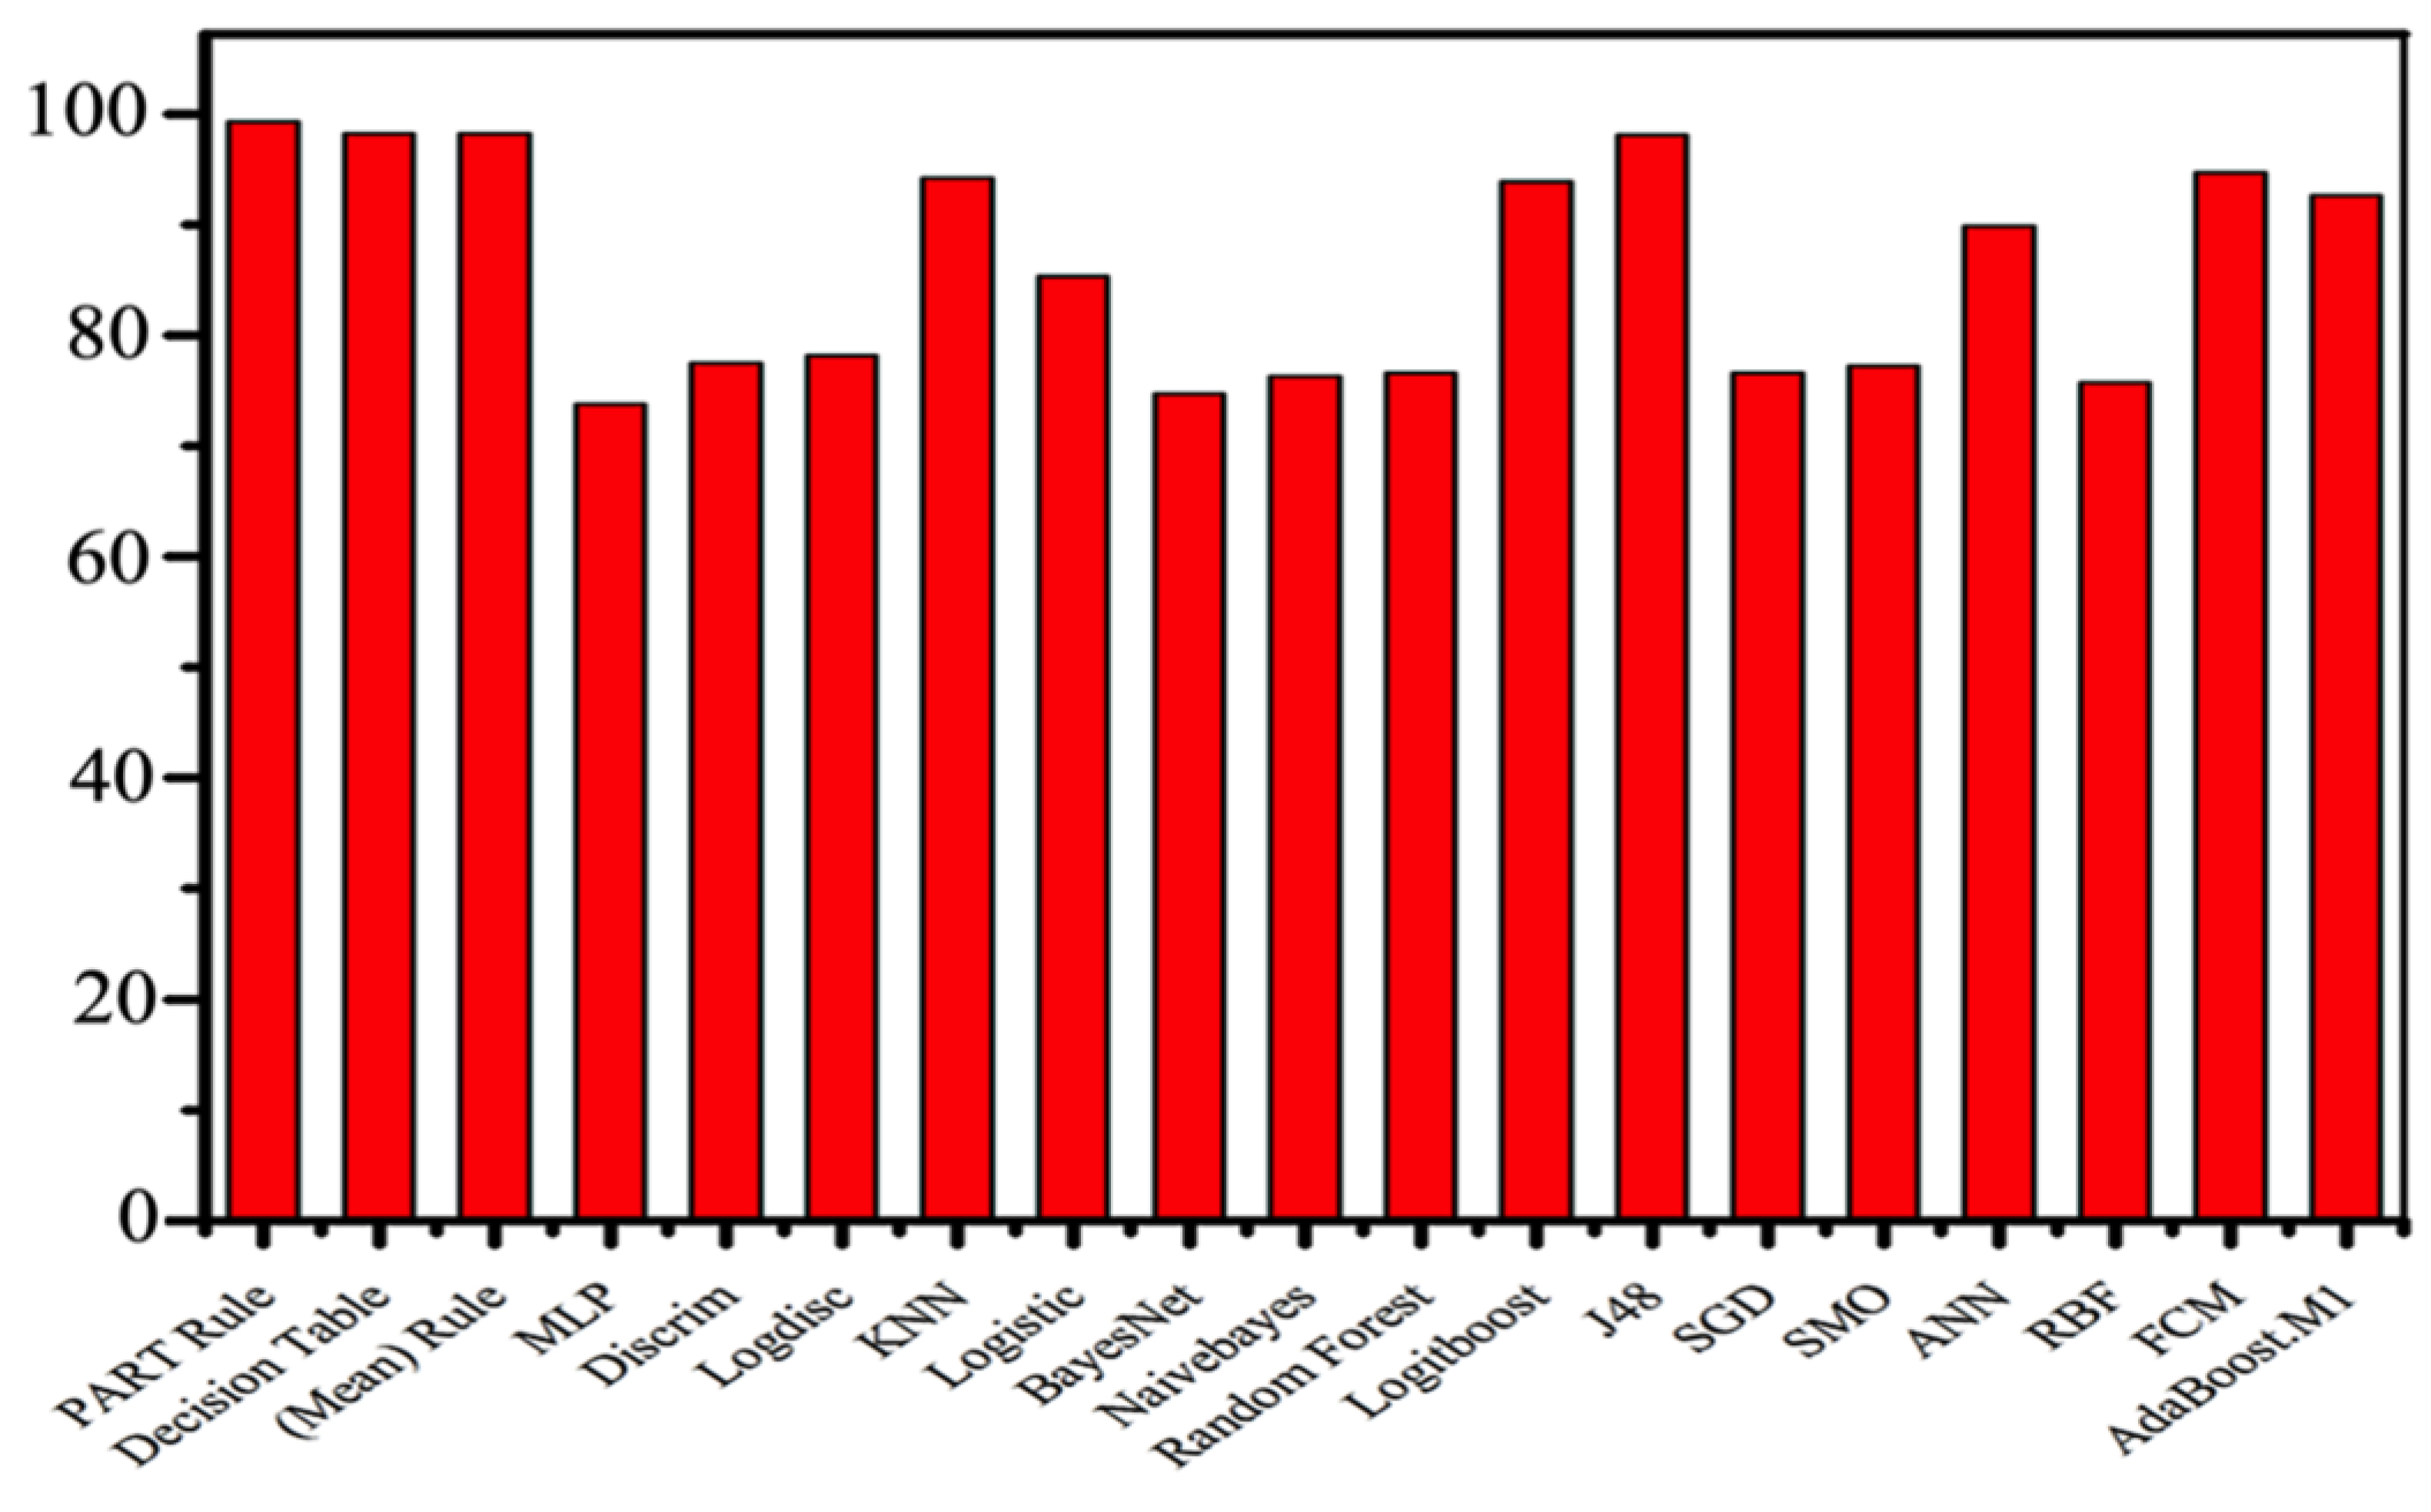
3.1. Measurements
3.2. Rule Forecast Assessment
4. Discussion
Limitation
5. Conclusions
Author Contributions
Funding
Acknowledgments
Conflicts of Interest
Nomenclature
| PART | Projective adaptive response theory |
| F-measure | Frequency matrix |
| CI | Confidence interval |
| MCC | Matthews’s correlation coefficient |
| DR | Decision rules |
| DM | Diabetes mellitus |
| T2DM | Type 2 diabetes mellitus |
| GLU | Glucose level |
| BMI | Body mass index |
| HYP | Hypertension |
| HCD | History of cardiovascular disease |
| FDH | Family diabetes history |
| PEX | Physical exercise |
| STW | Work stress |
| DIT | Diet |
| LR | Logistic regression |
References
- Khoury, N.; Attal, F.; Amirat, Y.; Oukhellou, L.; Mohammed, S.; Khoury, N. Data-Driven Based Approach to Aid Parkinson’s Disease Diagnosis. Sensors 2019, 19, 242. [Google Scholar] [CrossRef]
- Melmed, S.; Polonsky, K.S.; Larsen, P.R.; Kronenberg, H. Williams Textbook of Endocrinology, 13th ed.; Elsevier: Amsterdam, The Netherlands, 2016. [Google Scholar]
- Whiting, D.R.; Guariguata, L.; Weil, C.; Shaw, J. IDF Diabetes Atlas: Global estimates of the prevalence of diabetes for 2011 and 2030. Diabetes Res. Clin. Pract. 2011, 94, 311–321. [Google Scholar] [CrossRef]
- Cho, N.H.; Shaw, J.E.; Karuranga, S.; Huang, Y.; da Rocha Fernandes, J.D.; Ohlrogge, A.W.; Malanda, B. IDF Diabetes Atlas: Global estimates of diabetes prevalence for 2017 and projections for 2045. Diabetes Res. Clin. Pract. 2018, 138, 271–281. [Google Scholar] [CrossRef] [PubMed]
- Shamshirgaran, S.M.; Jorm, L.; Lujic, S.; Bambrick, H. Health related outcomes among people with type 2 diabetes by country of birth: Result from the 45 and Up Study. Prim. Care Diabetes 2019, 13, 71–81. [Google Scholar] [CrossRef] [PubMed]
- Gan, D.; King, H.; Lefèbvre, P.; Mbanya, J.-C.; Silink, M.; Siminerio, L. Diabetes Atlas, 2nd ed.; Gent: Brussels, Belgium, 2015. [Google Scholar]
- American Diabetes Association. 1. Improving Care and Promoting Health in Populations: Standards of Medical Care in Diabetes-2019. Diabetes Care 2019, 42, S7–S12. [Google Scholar] [CrossRef]
- Tsobgny-Tsague, N.-F.; Lontchi-Yimagou, E.; Nana, A.R.N.; Tankeu, A.T.; Katte, J.C.; Dehayem, M.Y.; Bengondo, C.M.; Sobngwi, E. Effects of nonsurgical periodontal treatment on glycated haemoglobin on type 2 diabetes patients (PARODIA 1 study): A randomized controlled trial in a sub-Saharan Africa population. BMC Oral Health 2018, 18, 28. [Google Scholar] [CrossRef]
- Lélis, V.-M.; Guzmán, E.; Belmonte, M.-V. A Statistical Classifier to Support Diagnose Meningitis in Less Developed Areas of Brazil. J. Med. Syst. 2017, 41, 145. [Google Scholar] [CrossRef] [PubMed]
- Awad, S.F.; O’Flaherty, M.; Critchley, J.; Abu-Raddad, L.J. Forecasting the burden of type 2 diabetes mellitus in Qatar to 2050: A novel modeling approach. Diabetes Res. Clin. Pract. 2018, 137, 100–108. [Google Scholar] [CrossRef]
- Choi, S.B.; Kim, W.J.; Yoo, T.K.; Park, J.S.; Chung, J.W.; Lee, Y.; Kang, E.S.; Kim, D.W. Screening for prediabetes using machine learning models. Comput. Math. Methods Med. 2014, 2014, 618976. [Google Scholar] [CrossRef] [PubMed]
- Talaei-Khoei, A.; Wilson, J.M.; Kazemi, S.-F. Period of Measurement in Time-Series Predictions of Disease Counts from 2007 to 2017 in Northern Nevada: Analytics Experiment. JMIR Public Heal Surveill. 2019, 5, e11357. [Google Scholar] [CrossRef]
- Olivera, A.R.; Roesler, V.; Iochpe, C.; Schmidt, M.I.; Vigo, Á.; Barreto, S.M.; Duncan, B.B. Comparison of machine-learning algorithms to build a predictive model for detecting undiagnosed diabetes—ELSA-Brasil: Accuracy study. Sao Paulo Med. J. 2017, 135, 234–246. [Google Scholar] [CrossRef] [PubMed]
- Sohail, M.N.; Jiadong, R.; Uba, M.M.; Irshad, M. A Comprehensive Looks at Data Mining Techniques Contributing to Medical Data Growth: A Survey of Researcher Reviews; Springer: Singapore, 2019; pp. 21–26. [Google Scholar]
- Kaur, P.; Sharma, N.; Singh, A.; Gill, B. CI-DPF: A Cloud IoT based Framework for Diabetes Prediction. In Proceedings of the 2018 IEEE Annual Information Technology, Electronics and Mobile Communication Conference, Columbia, Canada, 3 November 2018; pp. 654–660. [Google Scholar]
- Mahmud, S.M.H.; Hossin, M.A.; Ahmed, M.R.; Noori, S.R.H.; Sarkar, M.N.I. Machine Learning Based Unified Framework for Diabetes Prediction. In Proceedings of the 2018 International Conference on Big Data Engineering and Technology (BDET 2018), Chengdu, China, 27 August 2018; pp. 46–50. [Google Scholar]
- Srikanth, P.P.; Nilofer, V.; Siddiqui, I.; Dasari, P.; Ambica, B.; Venkata, V.B.V.E. Characteristic evaluation of diabetes data using clustering techniques. Int. J. Comput. Sci. Netw. Secur. 2008, 8, 244–251. [Google Scholar]
- Okpor, M.D. Prognostic Diagnosis of Gestational Diabetes Utilizing Fuzzy Classifier. Int. J. Comput Sci. Netw. Secur. 2015, 15, 44. [Google Scholar]
- Humayun, A.; Niaz, M.; Umar, M.; Mujahid, M. Impact on the Usage of Wireless Sensor Networks in Healthcare Sector. Int. J. Comput. Sci. Netw. Secur. 2017, 17, 102–105. [Google Scholar]
- Atmini, D.; Dwi, L.; Eminugroho, R. Sensitivity Analysis of Goal Programming Model for Dietary Menu of Diabetes Mellitus Patients. Int. J. Model. Optim. 2017, 7, 7–14. [Google Scholar] [CrossRef]
- Raimundo, M.S.; Okamoto, J., Jr. Application of Hurst Exponent (H) and the R/S Analysis in the Classification of FOREX Securities. Int. J. Model. Optim. 2018, 8, 116–124. [Google Scholar] [CrossRef]
- Alotaibi, M. Investigating the Role of Social Robot in improving diabetic Children Management and awareness. Int. J. Comput. Sci. Netw. Secur. 2017, 17, 121. [Google Scholar]
- Khawaja, A.P.; Cooke Bailey, J.N.; Wareham, N.J.; Scott, R.A.; Simcoe, M.; Igo, R.P.; Song, Y.E.; Wojciechowski, R.; Cheng, C.-Y.; Khaw, P.T.; et al. Genome-wide analyses identify 68 new loci associated with intraocular pressure and improve risk prediction for primary open-angle glaucoma. Nat. Genet. 2018, 50, 778–782. [Google Scholar] [CrossRef]
- Dian, S.; Rahmadi, R.; van Laarhoven, A.; Ganiem, A.R.; van Crevel, R. Predicting Mortality of Tuberculous Meningitis. Clin. Infect. Dis. 2018, 67, 1954–1955. [Google Scholar] [CrossRef] [PubMed]
- Samy, G.; Gamal, N. A Framework for Social Network-Based Dynamic Modeling and Prediction of Communicable Disease. Int. J. Model. Optim. 2019, 9, 30–33. [Google Scholar] [CrossRef]
- Lamwong, J.; Pongsumpun, P. Age Structural Model of Zika Virus. Int. J. Model. Optim. 2018, 8, 17–23. [Google Scholar] [CrossRef]
- Verdial, F.; Madtes, D.; Hwang, B.; Mulligan, M.; Odem-Davis, K.; Waworuntu, R.; Wood, D.; Farjah, F. A Prediction Model for Nodal Disease among Patients with Non-Small Cell Lung Cancer. Ann. Thorac. Surg. 2019. [Google Scholar] [CrossRef] [PubMed]
- Kasiakogias, A.; Tsioufis, C.; Dimitriadis, K.; Konstantinidis, D.; Koutra, E.; Kyriazopoulos, K.; Kyriazopoulos, I.; Liatakis, I.; Mantzouranis, M.; Philippou, C.; et al. P1540Comparison of the European Society of Hypertension stratification and European Society of Cardiology HeartScore for prediction of coronary artery disease and stroke in essential hypertension. Eur. Heart J. 2018, 39, 1540. [Google Scholar] [CrossRef]
- Mustaqeem, A.; Anwar, S.M.; Majid, M.; Khan, A.R. Wrapper method for feature selection to classify cardiac arrhythmia. In Proceedings of the 39th Annual International Conference of the IEEE Engineering in Medicine and Biology Society, Jeju Island, Korea, 11–15 July 2017; pp. 3656–3659. [Google Scholar]
- Romanowski, K.; Balshaw, R.F.; Benedetti, A.; Campbell, J.R.; Menzies, D.; Ahmad Khan, F.; Johnston, J.C. Predicting tuberculosis relapse in patients treated with the standard 6-month regimen: An individual patient data meta-analysis. Thorax 2019, 74, 291–297. [Google Scholar] [CrossRef] [PubMed]
- Alfian, G.; Syafrudin, M.; Ijaz, M.; Syaekhoni, M.; Fitriyani, N.; Rhee, J. A Personalized Healthcare Monitoring System for Diabetic Patients by Utilizing BLE-Based Sensors and Real-Time Data Processing. Sensors 2018, 18, 2183. [Google Scholar] [CrossRef] [PubMed]
- Ijaz, M.; Alfian, G.; Syafrudin, M.; Rhee, J. Hybrid Prediction Model for Type 2 Diabetes and Hypertension Using DBSCAN-Based Outlier Detection, Synthetic Minority Over Sampling Technique (SMOTE), and Random Forest. Appl. Sci. 2018, 8, 1325. [Google Scholar] [CrossRef]
- Kieviet, A. Werkzeuge der digitalen Transformation. In Lean Digital Transformation; Springer: Berlin/Heidelberg, Germany, 2019; pp. 57–159. [Google Scholar]
- Witten. Weka—Data Mining with Open Source Machine Learning Software in Java. Weka. 2016. Available online: https://www.cs.waikato.ac.nz/ml/weka/ (accessed on 23 May 2018).
- Fallah, M.; Niakan Kalhori, S.R. Systematic Review of Data Mining Applications in Patient-Centered Mobile-Based Information Systems. Healthc. Inform. Res. 2017, 23, 262. [Google Scholar] [CrossRef] [PubMed]
- Padillo, F.; Luna, J.M.; Ventura, S. A Grammar-Guided Genetic Programing Algorithm for Associative Classification in Big Data. Cognit. Comput. 2019, 1–16. [Google Scholar] [CrossRef]
- González, J.; Ortega, J.; Damas, M.; Martín-Smith, P.; Gan, J.Q. A new multi-objective wrapper method for feature selection—Accuracy and stability analysis for BCI. Neurocomputing 2019, 333, 407–418. [Google Scholar] [CrossRef]
- Muhammad, M.U.; Asiribo, O.E.; Noman, S.M. Application of Logistic Regression Modeling Using Fractional Polynomials of Grouped Continuous Covariates. Niger. Stat. Soc. 2017, 1, 144–147. [Google Scholar]
- Dubey, R.; Makwana, R.R.S. Computer-Assisted Valuation of Descriptive Answers Using Weka with RandomForest Classification. In Proceeding of the Second International Conference on Microelectronics, Computing & Communication Systems (MCCS 2017), 76th ed.; LNEE, Ed.; Springer: Singapore, 2019; pp. 359–366. [Google Scholar]
- Rani, R.U.; Kakarla, J. Efficient Classification Technique on Healthcare Data. In Progress in Advanced Computing and Intelligent Engineering, 713rd ed.; AISC, Ed.; Springer: Singapore, 2019; pp. 293–300. [Google Scholar]


| Diabetes Type | Patients | Age | Weight | “0” Missing Values | Attributes | Class | |
| (N = 281) | T_N | T_P | |||||
| NID | 256 | >10 <87 | 256.0 | 11 | 87 | 194 | |
| GTD | 14 | 14.0 | |||||
| IND | 11 | 11.0 | |||||
| Classification | PART Rule % | Decision Table Rule % | |||||
| Total number of diabetes mellitus patients from age >10 and <87 (N = 281) | |||||||
| |||||||
| Accuracy | 99.28 | 98.22 | |||||
| Kappa statistics | 0.98 | 0.96 | |||||
| Mean absolute error | 0.01 | 0.03 | |||||
| True positive rate | 0.99 | 0.98 | |||||
| False positive rate | 0.01 | 0.01 | |||||
| Precision | 0.99 | 0.98 | |||||
| Recall | 0.99 | 0.98 | |||||
| F-Measure | 0.99 | 0.98 | |||||
| MCC | 0.98 | 0.96 | |||||
| ROC area | 0.99 | 0.99 | |||||
| PRC area | 0.99 | 0.99 | |||||
| Time taken to build the model | 0.10 s | 0.77 s | |||||
| Average accuracy | 99.28 | 98.22 | |||||
| Mean average accuracy | 98.75% | ||||||
| Values | Counts | Ratio | Cluster by Class | Cluster by Diabetes Type | |||
| (N’ = 281) | T_N | T_P | NID | GTD | IND | ||
| 0 | 138 | 49% | 47 | 91 | 128 | 7 | 3 |
| 1 | 143 | 51% | 40 | 103 | 128 | 7 | 8 1 |
| Twenty-Three If-Then Rules Extracted from the Assessment Are: | |
|---|---|
| Rule 1: | IF the patient’s glucose level is (>101); THEN the patient is classified as tested positive with diabetes. |
| Rule 2: | IF the patient’s glucose level is (>72); THEN the patient is classified as tested positive for diabetes, but the patient has to screen through the second stage test. |
| Rule 3: | IF the patient’s blood pressure is (≤100); THEN the patient is classified as tested negative for diabetes but this case also depends on the glucose level of the patient, which takes patients for screening of the second stage. |
| Rule 4: | IF the patient’s blood pressure is (<100); THEN the patient is classified as tested negative for diabetes but the patient has to go through the second stage of screening. |
| Rule 5: | IF the patient’s (age ≤ 49) and (BMI ≤ 25) and the patient also has no diabetes in their family history; THEN the patient is classified as tested negative for diabetes. |
| Rule 6: | IF the patient’s (age ≤ 34) and (BMI > 25) and the patient also has no diabetes in their family history and patient’s diet is unbalanced; THEN the patient is classified as tested negative for diabetes. |
| Rule 7: | IF the patient’s age is from (35 ≤ 49) and (BMI > 25) and the patient also has no diabetes in their family history and the patient’s diet is unbalanced and the patient is without physical exercise; THEN the patient is classified as tested positive for diabetes. |
| Rule 8: | IF the patient’s age is from (35 ≤ 49) and (BMI > 25), and the patient also has no diabetes in their family history, the patient’s diet is unbalanced, and the patient is with physical exercise but has no history of cardiovascular disease; THEN the patient is classified as tested negative for diabetes. |
| Rule 9: | IF the patient’s age is from (35 ≤ 49) and (BMI > 25), and the patient also has no diabetes in their family history, the patient’s diet is unbalanced, and the patient is with physical exercise but has no history of cardiovascular disease; THEN the patient is classified as tested positive for diabetes. |
| Rule10: | IF the patient’s age is (≤49) and (BMI > 25), and the patient also has no diabetes in their family history and the patient’s diet is balanced; THEN the patient is classified as tested negative for diabetes. |
| Rule11: | IF the patient’s age is (≤49) and (BMI ≤ 25), and the patient also has diabetes in their family history; THEN the patient is classified as tested negative for diabetes. |
| Rule12: | IF the patient’s age is (≤49) and (BMI > 25), and the patient also has diabetes in their family history; THEN the patient is classified as tested positive for diabetes. |
| Rule13: | IF the patient’s age is (>49) and (BMI ≤ 25), and the patient also has a high work stress but no diabetes in their family history; THEN the patient is classified as tested negative for diabetes. |
| Rule14: | IF the patient’s age is (>49) and (BMI > 25), and the patient also has a high work stress but no diabetes in their family history; THEN the patient is classified as tested positive for diabetes. |
| Rule15: | IF the patient’s age is (>49) and the patient has a high work stress, and also has diabetes in their family history; THEN the patient is classified as tested positive for diabetes. |
| Rule16: | IF the patient’s age is (>49) and (BMI >25), and the patient’s work stress is low and also has no diabetes in their family history but their diet is unbalanced; THEN the patient is classified as tested positive for diabetes. |
| Rule17: | IF the patient’s age is (>49) and (BMI > 25), and the patient has no diabetes in their family history and has a balanced diet; THEN the patient is classified as tested negative for diabetes. |
| Rule18: | IF the patient’s age is (>49) and (BMI > 25), and the patient’s work stress is low but they have diabetes in their family history; THEN the patient is classified as tested positive for diabetes. |
| Rule19: | IF the patient’s age is (>49) and (BMI ≤ 25), and the patient has a low or medium work stress with hypertension and also their food is not balanced; THEN the patient is classified as tested positive for diabetes. |
| Rule20: | IF the patient is male with age (>49) and (BMI ≤ 25), and the patient has a low or medium work stress without hypertension and also their food is not balanced but they have diabetes in their family history with cardiovascular disease; THEN the patient is classified as tested positive for diabetes. |
| Rule21: | IF the patient is male with age (>49) and (BMI ≤ 25), and the patient has a low or medium work stress without hypertension and their diet is not balanced, and they have cardiovascular disease history in their family; THEN the patient is classified as tested negative for diabetes. |
| Rule22: | IF the patient is female with age (>49) and (BMI ≤ 25), and the patient has a low or medium work stress without hypertension and their diet is not balanced; THEN the patient is classified as tested negative for diabetes. |
| Rule23: | IF the patient’s age is (>49) and (BMI ≤ 25), and the patient has a low or medium work stress with balanced diet; THEN the patient is classified as tested negative for diabetes. |
| Method | Accuracy% | Mean% |
|---|---|---|
| PART rule | 99.28 | 98.75% |
| Decision table rule | 98.22 | |
| MLP | 73.82 | |
| Discrim | 77.54 | |
| Logdisc | 78.22 | |
| KNN | 94.29 | |
| Logistic | 85.35 | |
| BayesNet | 74.76 | |
| NaïveBayes | 76.35 | |
| Random Forest | 76.66 | |
| LogitBoost | 93.93 | |
| J48 | 98.17 | |
| SGD | 76.62 | |
| SMO | 77.26 | |
| ANN | 89.84 | |
| RBF | 75.71 | |
| FCM | 94.78 1 | |
© 2019 by the authors. Licensee MDPI, Basel, Switzerland. This article is an open access article distributed under the terms and conditions of the Creative Commons Attribution (CC BY) license (http://creativecommons.org/licenses/by/4.0/).
Share and Cite
Sohail, M.N.; Jiadong, R.; Muhammad, M.U.; Chauhdary, S.T.; Arshad, J.; Verghese, A.J. An Accurate Clinical Implication Assessment for Diabetes Mellitus Prevalence Based on a Study from Nigeria. Processes 2019, 7, 289. https://0-doi-org.brum.beds.ac.uk/10.3390/pr7050289
Sohail MN, Jiadong R, Muhammad MU, Chauhdary ST, Arshad J, Verghese AJ. An Accurate Clinical Implication Assessment for Diabetes Mellitus Prevalence Based on a Study from Nigeria. Processes. 2019; 7(5):289. https://0-doi-org.brum.beds.ac.uk/10.3390/pr7050289
Chicago/Turabian StyleSohail, Muhammad Noman, Ren Jiadong, Musa Uba Muhammad, Sohaib Tahir Chauhdary, Jehangir Arshad, and Antony John Verghese. 2019. "An Accurate Clinical Implication Assessment for Diabetes Mellitus Prevalence Based on a Study from Nigeria" Processes 7, no. 5: 289. https://0-doi-org.brum.beds.ac.uk/10.3390/pr7050289