Article

Performance and Kinetic Model of a Single-Stage Anaerobic Digestion System Operated at Different Successive Operating Stages for the Treatment of Food Waste

by
Sagor Kumar Pramanik
1,
Fatihah Binti Suja
1,*,
Mojtaba Porhemmat
1 and
Biplob Kumar Pramanik
2
1
Department of Civil and Structural Engineering, Faculty of Engineering and Built Environment, Universiti Kebangsaan Malaysia, UKM Bangi, Selangor 43600, Malaysia
2
School of Engineering, RMIT University, Melbourne, VIC 3000, Australia
*
Author to whom correspondence should be addressed.
Submission received: 19 August 2019 / Revised: 30 August 2019 / Accepted: 31 August 2019 / Published: 6 September 2019
(This article belongs to the Special Issue Carbonaceous Materials for CO2 Capture and Pollutants Removal)

Abstract

:
A large quantity of food waste (FW) is generated annually across the world and results in environmental pollution and degradation. This study investigated the performance of a 160 L anaerobic biofilm single-stage reactor in treating FW. The reactor was operated at different hydraulic retention times (HRTs) of 124, 62, and 35 days under mesophilic conditions. The maximum biogas and methane yield achieved was 0.934 L/g VSadded and 0.607 L CH4/g VSadded, respectively, at an HRT of 124 days. When HRT decreased to 62 days, the volatile fatty acid (VFA) and ammonia accumulation increased rapidly whereas pH, methane yield, and biogas yield decreased continuously. The decline in biogas production was likely due to shock loading, which resulted in scum accumulation in the reactor. A negative correlation between biogas yield and volatile solid (VS) removal efficiency was also observed, owing to the floating scum carrying and urging the sludge toward the upper portion of the reactor. The highest VS (79%) and chemical oxygen demand (COD) removal efficiency (80%) were achieved at an HRT of 35 days. Three kinetic models—the first-order kinetic model, the modified Gompertz model, and the logistic function model—were used to fit the cumulative biogas production experimental data. The kinetic study showed that the modified Gompertz model had the best fit with the experimental data out of the three models. This study demonstrates that the stability and performance of the anaerobic digestion (AD) process, namely biogas production rate, methane yield, intermediate metabolism, and removal efficiency, were significantly affected by HRTs.

1. Introduction

City councils are faced with managing increased amounts of food waste (FW) nowadays, which could potentially derail sustainable economic development. Pramanik et al. [1] reported that annual FW generation reached 278, 74.7, 51, 157, and 44 kg per person in America, United Kingdom, India, Japan, and China, respectively. Another report developed by Edward [2] noted that according to the Solid Waste Corporation Management of Malaysia (SWCorp), Malaysia disposed of 16,687 tons of FW daily. SWCorp also noted that 55% of municipal solid waste disposed at landfills mainly consisted of FW. Several treatment processes including incineration, composting, and landfill have been widely used to manage FW [3,4]. However, these processes are not economically feasible, as they incur high energy losses and increased environmental pollution [3,4,5]. This challenge of managing FW whilst protecting the environment has spurred the need to develop new and innovative techniques that would allow FW to be used for other purposes—based on the concept of a circular economy.
FW has a high organic content and excellent biodegradability. Therefore, it can be treated using anaerobic digestion (AD), an environmentally friendly technology that is also able to recover energy from the FW treatment in the form of biogas. The stability and efficiency of AD depend on many factors such as feeding mode, moisture content of the FW, reactor configuration, and operating conditions [3,6]. Reactor configuration has an important impact on FW treatment [7]. The configuration includes single-phase, two-phase, or multiple-phase. Of these, the single-stage AD process has been proven to have many advantages including recirculation adaptability, a simple design, less technical failure, and low cost [6]. It is important to note that most of the AD systems operate in single-phase systems, for example, 95% of European full-scale plants typically function based on a single-phase AD process to produce biogas from organic waste, such as food waste [3,4,5,6,7], manure [8], and biological sludge [9], where hydrolysis, acidogenesis, acetogenesis, and methanogenesis occur simultaneously in one reactor. Ganesh et al. [10] compared the process performance and reactor stability of one-stage and two-stage AD of fruit and vegetable waste. They found that the single-stage process produced a higher methane yield, volatile solid (VS) destruction, and energy yield, compared to the two-stage process. Most of the studies have used lab-scale AD set-up for biogas production from FW [4,7,10,11,12,13,14,15,16,17,18,19,20,21,22]. However, the performance of a semi-pilot scale anaerobic biofilm single-stage reactor in producing biogas from typical FW, especially from the cafeteria, needs to be investigated.
The performance of a single-stage AD system is affected by operational conditions including hydraulic retention time (HRT), organic loading rate (OLR), inflow rate, and duration. The OLR is an important parameter for the AD process since it indicates the amount of VS to be fed into the reactor every day. The biogas production may decrease if the feeding rate in the reactor is beyond the optimal level, and then, system failures can occur due to overloading [6]. HRT is another critical parameter in the AD process, as it indicates the time required to complete the degradation of the FW. Furthermore, HRT affects biogas production, AD operation stability, kinetic model parameters, and biomass concentration [23]. HRT depends on the OLR, process temperature, and substrate composition and is connected to the bacterial growth rate [24]. A longer HRT and a lower OLR are the best options for achieving constant and maximal methane yields. Meanwhile, a significant accumulation of volatile fatty acid (VFA) could occur at a shorter HRT and a higher OLR, leading to AD system failure [24]. Kim et al. [11] investigated the AD of FW at an HRT of 10 days and 12 days under mesophilic and thermophilic conditions. They found that the methane gas yield in the mesophilic and thermophilic conditions increased with an HRT of 12 days more than an HRT of 10 days. Shi et al. [25] reported that average biogas production increased from 55.2 mL/g VS to 105.2 mL/g VS while HRT increased from 20 days to 60 days. The author pointed out that the HRT of 20 days displayed lower stability compared with the HRT of 40 days and 60 days. Bouallagui et al. [12] investigated the production of biogas from fruit and vegetable waste at HRTs of 12 days, 15 days, and 20 days under mesophilic conditions, and found that the HRT of 20 days displayed stable performance with the highest biogas yield and highest VS reduction efficiency. However, more studies should be done to investigate the effectiveness of a semi-pilot anaerobic biofilm single-stage reactor in producing biogas from FW at different successive operating stages.
Bacteria washout is the most familiar issue faced by most conventional AD processes [26]. However, this issue can be solved by using a biofilm in the reactor since biomass attached to biofilm carriers can move freely in the water volume inside the reactor and are contained inside the reactor via screens at the reactor outlets. As mentioned previously, FW contains high concentrations of complex components such as carbohydrate, lipid, and protein; thus, an anaerobic biofilm reactor can be used to treat FW while achieving a more stable growth process and operation because this type of reactor enhances the interaction between substrate and bacteria [26]. From the literature review conducted in this study, no study has yet investigated the use of a biofilm-based AD process for biogas production.
The mathematical kinetic model used for the AD process plays a vital role in optimizing, predicting, simulating, and monitoring process performance under various conditions [27]. The models help in the prediction of kinetic parameters as well as in clarifying the digestion process. Deepanraj et al. [
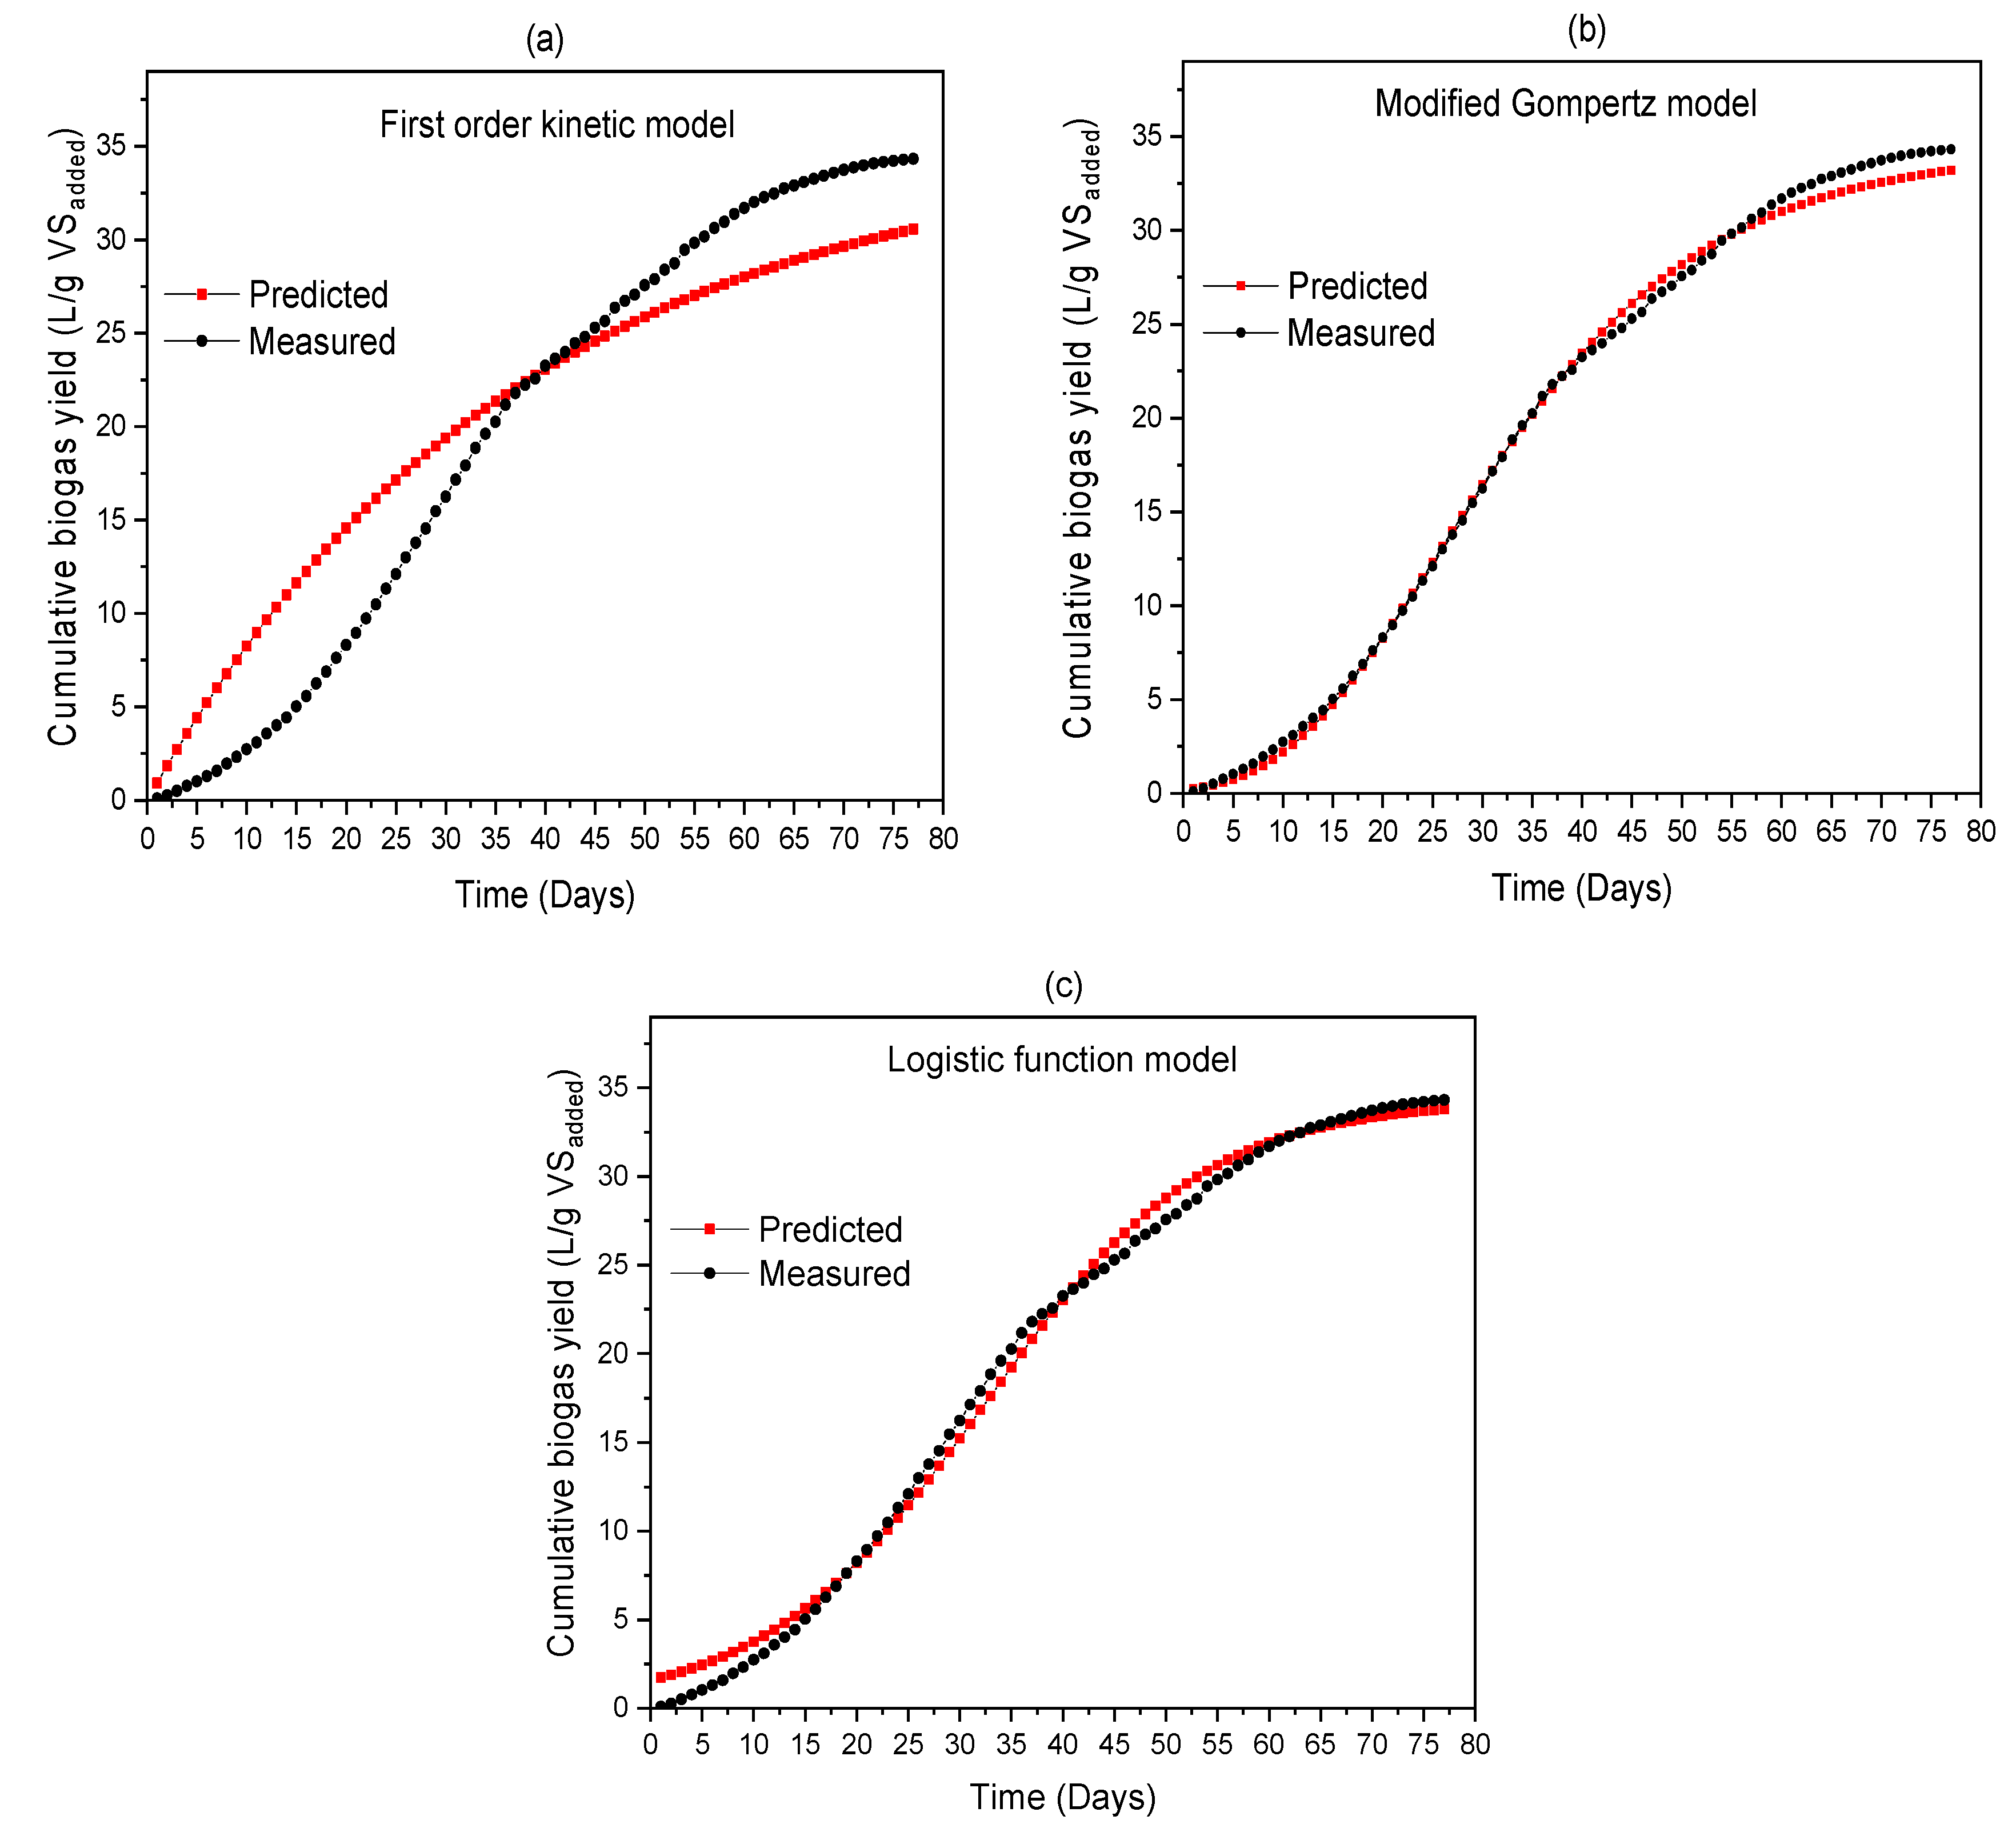
13] compared two kinetics models—the modified Gompertz model and the logistic model—to determine the kinetic parameters of the reaction of FW as a feedstock under different total solid (TS) concentrations. They found that the modified Gompertz model yielded better performance and better described the process kinetics compared to the logistic model. However, the use of kinetic models for biogas production from FW at different HRTs has not been widely investigated.
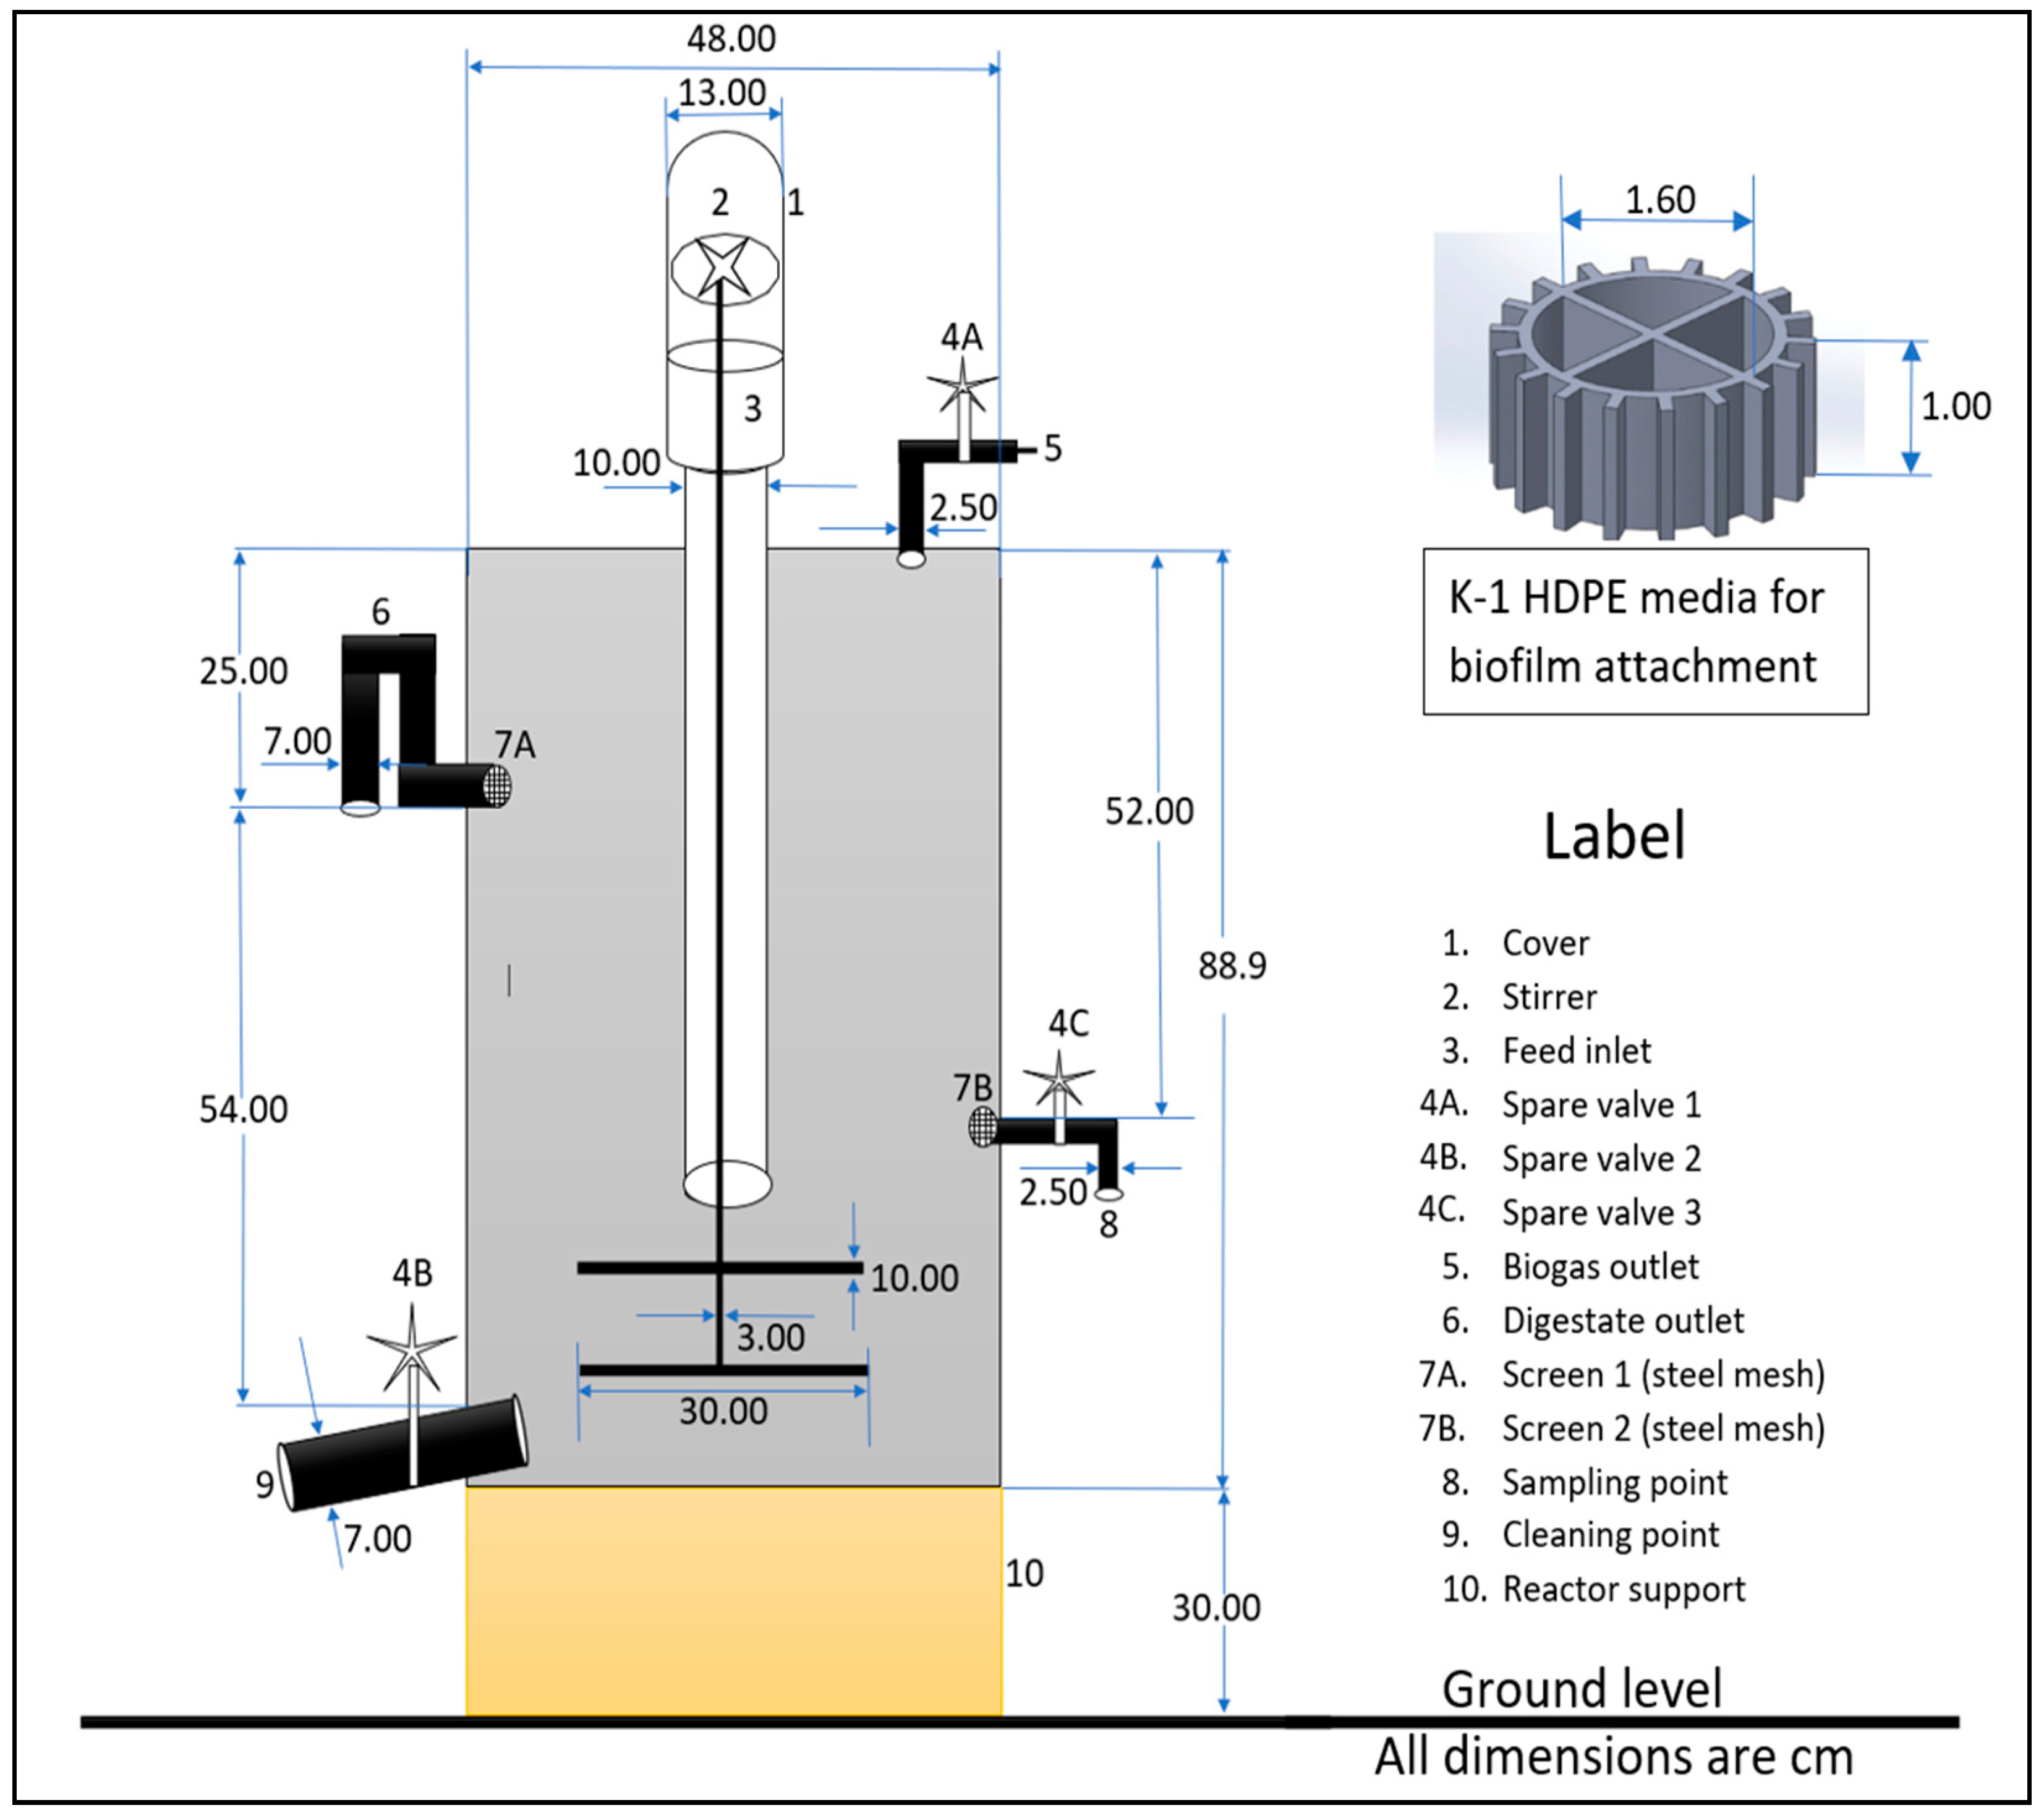
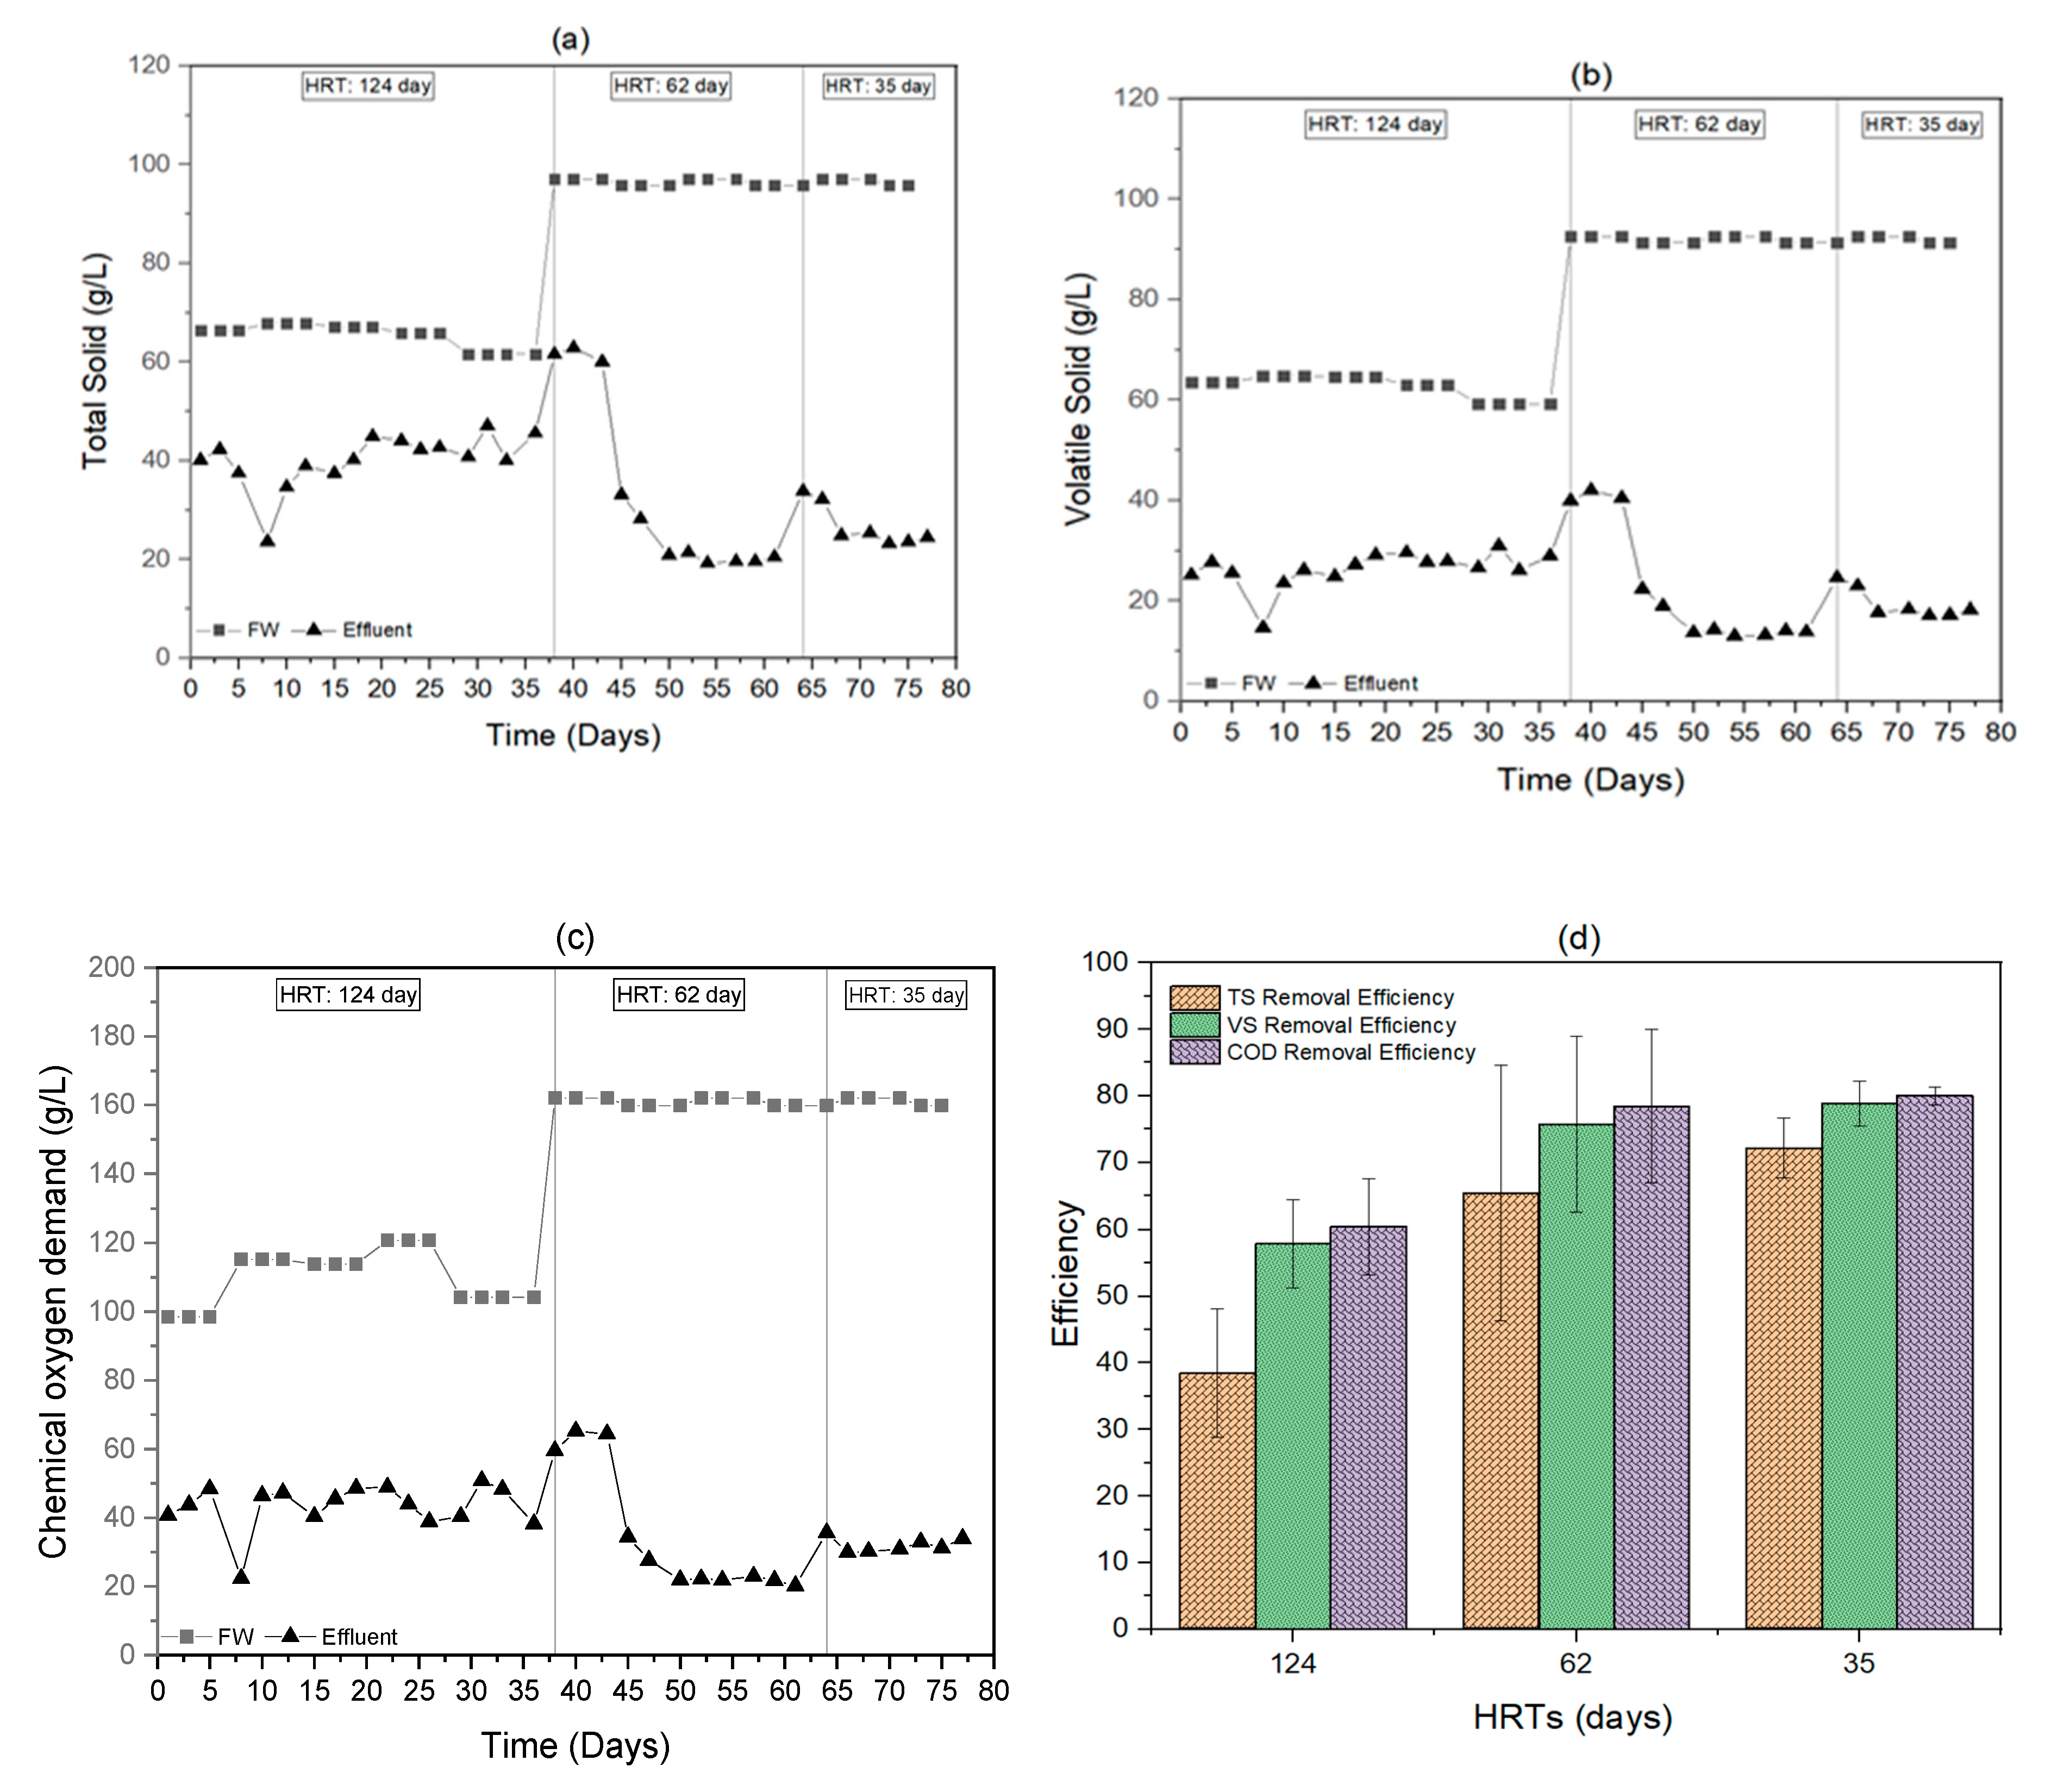
Based on the identified gaps in previous studies, the objective of this study is to investigate the biogas production efficiency of a semi-pilot (160 L) anaerobic biofilm single-stage reactor using FW at different successive operational stages under mesophilic conditions. This study also evaluated the degradation performance of FW (i.e., total solids, VS, and chemical oxygen demand (COD)). Three mathematical kinetic models (i.e., first-order kinetic model, modified Gompertz model, and logistic model) were used to determine the biogas production potential, the maximum biogas production rate, and the lag time for AD by fitting the measured biogas yields. See the end of the document for further details on references.

2. Materials and Methods

2.1. Substrate and Inoculum

FW was used as a substrate and collected from a cafeteria near the Faculty of Engineering, Universiti Kebangsaan Malaysia, Malaysia. The FW consisted of vegetables, rice, noodles, fruits, pasta, bread, egg, meat, and fish. Different impurities such as plastics, metals, eggshells, bags, tissues, and other non-biodegradable materials were manually removed from the FW. The compositions of the FW used in this experiment are displayed in Table 1. The FW was mixed with a kitchen blender to produce waste with a particle size between 4 mm and 10 mm. The characteristics of the FW used in this experiment are shown in Table 1. Fresh cow manure (CM) was used as an inoculum in this study. Approximately 35 kg of fresh CM was collected from a local farm near Bangi, Malaysia. Fresh CM was manually mixed with tap water until the volume of the slurry reached 124 L. The pH, TS, VS, and COD of the inoculum were 7.72, 37.70 g/L, 24.63 g/L, and 31.55 g/L, respectively. Both the FW and the CM slurry were stored at 4 °C in an airtight plastic container to prevent any degradation until its next use.

2.2. Experimental Design

The configuration of the 160 L single-stage AD system is shown in Figure 1. A single-stage high-density polyethylene anaerobic reactor with a working volume of 124 L was used in this study. The reactor was equipped with a stainless-steel stirrer with two arms to provide sufficient mixing of substrates; performed manually twice a day for 2 min. The length and thickness of the arms of the stirrer are 30 cm and 10 cm, respectively. The speed of the arms of the stirrer was 40 rpm. Before removal of digestate, the speed was increased to 70 rpm in order to ensure homogeneity in the reactor. For biofilm attachment, the reactor was filled with 9000 units of K-1 high-density polyethylene (HDPE) media with 1.6 cm diameter and 1 cm thickness, which was bought from amazon.com. The outlets of the reactor were installed with stainless-steel sieves with an opening diameter of 0.6 cm, to ensure that the plastic media remained inside the digester. The operational temperature was set between 31 °C and 34 °C. No external heat exchangers were used to maintain the reactor temperature since Malaysia is characterized by hot and humid weather throughout the year.

2.3. Operation and Monitoring of the Reactor

In the beginning, the reactor was inoculated with 124 L of the CM slurry. After that, the reactor start-up was commenced by acclimatizing the environment in the reactor using synthetic wastewater according to the composition shown in Table 2. The start-up operation of the reactor was completed for two weeks with synthetic wastewater of 260 mL/day and an OLR of 0.01 kg COD/m3/d. This low-strength synthetic wastewater was used to provide low organic stress to the reactor. After a successful start-up, the reactor was operated under different successive operational stages in reference to a sequence of increasing OLRs of 0.51, 1.4, and 2.45 kg VS/m3/d while consecutively decreasing the HRT from 124 days, 62 days, and 35 days over 77 days. Throughout the operation, FW was fed into the reactor three days a week. The operational conditions for OLR and HRT are shown in Table 3. Sampling was performed using a sampling pipe to measure several parameters including the pH, temperature, VFA, and ammonia nitrogen (NH3-N) for monitoring purposes. The effluent from the reactor was used to check the digester’s performance throughout its operation. The collected effluents were first stirred to achieve homogeneity and then placed into an HDPE bottle and sampled. The samples were stored following EPA guidelines [28] until removed for testing. The biogas component ((e.g., methane (CH4) and carbon dioxide (CO2)) and volume were measured on site using a portable biogas analyzer and supelTM-inert multi-layer foil gas sampling bags, respectively.

2.4. Analytical Methods

Sludge samples were taken from the reactor three times a week to determine the total and soluble parameters. The pH and temperature were measured using test probes. The TS, VS, total Kjeldahl nitrogen (TKN), and NH3-N were measured using the standard method for the examination of water and wastewater [29]. For the assessment of VFA and soluble COD (sCOD), the samples were first filtered using a 0.45 µm cellulose nitrate filter paper before subsequent testing using the esterification method (HACH, Method 8196, DR 6000 spectrophotometer) and acid persulfate digestion method (HACH, Method 8190, Test & Tube Vials). The reactor digestion method (HACH, COD High Range, DR 6000 spectrophotometer) was used to determine the concentration of total COD (tCOD) and sCOD. All laboratory analyses were performed at a room temperature of 22 ± 2 °C and in duplicates. Biogas was collected in gas collection bags (supelTM-inert multi-layer foil bag), whereas the methane and carbon dioxide content in the biogas was measured using a gas analyzer (Biogas 5000, Geotech, UK).

2.5. Kinetics Study and Statistical Analysis

Three kinetic models i.e., the first-order kinetic model (Equation (1)), the modified Gompertz model (Equation (2)), and the logistic function models (Equation (3)) were selected to fit the cumulative biogas production obtained from the experimental data. The most suitable kinetic model should be selected not only to predict the efficiency of particular reactors, but also to correctly analyze the metabolic pathways and mechanisms involved during the AD of FW [15]. However, all three kinetic models have specific benefits individually. For example, the first-order kinetic model delivers additional information about the hydrolysis rate constant, whereas the modified Gompertz model provides information on the lag phase and the maximum specific methane production rate. The first-order kinetic model was based on the hypothesis that hydrolysis controls the entire process and the availability of the substrate as the limiting factor [30,31,32]. The modified Gompertz model is normally used in the simulation of methane accumulation, and the model has been proven as an excellent empirical non-linear regression model [30,31]. The model describes the cell density during microbial growth periods in terms of exponential growth rates and lag phase duration. In contrast, the logistic function model is suitable for an initial exponential increase and a final stabilization at the highest production level, which assumes that the rate of biogas production is proportional to the quantity of biogas already produced [33]. Therefore, all three kinetic models were used in this study to determine the cumulative biogas production potential, hydrolysis kinetics, lag phase duration, and maximum methane production.
First order kinetic model :   M = P b × [ 1 e x p ( k t ) ]
Modified Gompertz model : M = P b × e x p { e x p [ R m · e P b ( λ t ) + 1 ] }
Logistic function model :   M = P b 1 + e x p { 4 · R m · ( λ t ) P b + 2 }
where
  • M is the biogas yield (L/g VSadded) with respect to time t (days),
  • Pb is the maximum biogas potential of the substrate (L/g VSadded),
  • k is the hydrolysis rate constant (1/day),
  • t is the time (day),
  • Rm is the maximum biogas production rate (L/g VSadded.d),
  • λ is the lag phase time (days),
  • e is Euler’s function equal to 2.7183.
A nonlinear least-square regression analysis was performed using SPSS software (IBM SPSS statistics 25) to determine K, Rm, λ , and predicted biogas yield. The coefficient of determination (R2) and root mean square error (RMSE) were calculated for each model to compare the accuracy of the studied models. R2 is also known as the goodness-of-fit-index, which was determined using SPSS 25 software. RMSE, given by Equation (4), is interpreted as the standard deviation between the predicted and measured values with a lower RMSE indicating a better fit [14].
R M S E = i = 1 n ( P V i M V i ) 2 n
where P V i is the predicted value of biogas volume, M V i is the measured value of the biogas volume, and n is the number of measurements.
The second-order Akaike information criterion (AIC) test (Equations (5) and (6)) and the Bayesian information criterion (BIC) test (Equation (7)) were used to compare the models and to determine the model that is more likely to be correct [15]. The equations for AIC and BIC are given by Equations (5)–(7):
A I C = N ln ( R S S N ) + 2 K + 2 K ( K + 1 ) ( N K 1 ) ,   w h e n   N K < 40
A I C = N ln ( R S S N ) + 2 K ,   w h e n   N K 40
B I C = N ln ( R S S N ) + K ln ( N )
where N is the number of data points, K is the number of parameters fit by the regression model, and RSS is the residual sum of the square.

3. Results and Discussion

3.1. Biogas Production at Various HRTs and OLRs

The biogas yield and the volumetric biogas production rate (VBPR) at different HRTs are displayed in Figure 2a. It is found that the production of biogas started immediately on the first day of digestion after which it began to increase continuously until day 37. The biogas yield started to decrease slowly after day 37, and the production of biogas almost stopped after day 75. At an HRT of 124 days and an OLR of 0.51 kg VS/m3, the maximum biogas yield and the average biogas yield were 0.934 L/g VSadded and 0.589 L/g VSadded, respectively. When HRT decreased from 124 days to 62 days and OLR increased from 0.51 kg VS/m3/d to 1.4 kg VS/m3/d, the maximum biogas yield and the average biogas yield decreased from 0.934 to 0.715 L/g VSadded and from 0.589 to 0.41 L/g VSadded, respectively (Table 4). Figure 2a shows that the HRT reduction caused a sharp decrease in biogas yield. It is important to note that the accumulation of scum was observed in the reactor at an OLR of 1.4 kg VS/m3/d corresponding to an HRT of 62 days, after day 45. Towards the end of the experiments, the scum layer reached almost 14.5 cm thickness in the upper part of the reactor. A similar result was obtained by Hu et al. [16] who found that increasing OLR could cause the accumulation of scum in the reactor. This is likely due to the shock loading of the feed concentration in the reactor.
The volumetric biogas production rate (VBPR) generally indicates the productivity performance of an anaerobic reactor. It was found that the VBPR of the reactor in this study increased until day 54. When HRT was 124 days, the maximum VBPR and the average VBPR were 0.476 Lbiogas/LFW/d and 0.3 Lbiogas/LFW/d, respectively (Table 4). The maximum VBPR and the average VBPR improved to 1.056 Lbiogas/LFW/d and 0.606 Lbiogas/LFW/d, respectively, when HRT decreased from 124 days to 62 days. A further decrease in HRT (i.e., 35 days) led to the reduction in the maximum VBPR and the average VBPR. This result shows that an HRT longer than 62 days is optimal for the single-stage mesophilic AD of FW.
Figure 2b displays the percentage of biogas composition at various HRTs. The CH4 content in the biogas produced from the FW increased rapidly until day 37, after which it gradually decreased throughout the remaining period. The highest CH4 values of 70.0%, 60.83%, and 52.5% were recorded at HRTs of 124 days, 62 days, and 35 days, respectively (Table 4). On the other hand, a higher value of CO2 was observed at an HRT of 35 days than the HRT of 62 days followed by an HRT of 124 days (Figure 2b). It is noted that the concentration of hydrogen sulfide was approximately 550 ppm, 1300 ppm, and 1700 ppm at HRTs of 124 days, 62 days, and 35 days, respectively, indicating that the purity of the produced biogas depends on the HRT.
Methane yield is an important performance index of the reactor’s efficiency during the AD of FW. The CH4 yield declined with increasing OLRs and decreasing HRTs (Figure 2c). A similar result was reported by Liu et al. [17], who observed that when the OLR increased from 1 g to 1.5 g of VS/L/day, the CH4 yield decreased from 386 mLCH4/g VSadded to 370 mLCH4/g VSadded when FW was used as the substrate under mesophilic condition. Nagao et al. [7] also found that CH4 yield decreased from 0.25 m3CH4/kg VSadded to 0.05 m3CH4/kg VSadded when OLR increased from 1.4 kg-VS /m3/d to 2.75 kg-VS /m3/d during the single-stage AD of vegetable waste. This was possibly due to the additional active microorganisms that could wash out with a shorter HRT during the removal of effluent and could also increase TS concentration resulting in decreasing mass transfer efficiency [18].

3.2. Performance of the Single-Stage AD System

3.2.1. Monitoring of pH, Temperature, VFA, and NH3-N at Different Operating Stages

The single-stage AD reactor was operated semi-continuously for 77 days under mesophilic condition. The OLR and the quantity of FW were increased stepwise as HRT was decreased from a 124-day HRT to a 35-day HRT during the operation period. In spite of the weather fluctuations, the AD reactor still operated in mesophilic conditions at temperatures ranging from 30 °C to 34 °C with different HRTs (Figure 3a). The fluctuations in VFA and NH3-N concentrations resulted in pH changes. Hence, the pH values not only indicate the balance of the AD process, but also display the accumulation of VFA and NH3-N. Figure 3a shows that pH value increased steadily at an HRT of 124 days due to the effect of a low concentration of VFA and an increased concentration of alkaline compounds, particularly NH3-N. Furthermore, the organic nitrogen in the FW could degrade into NH3-N; this accumulation of ammonia in the reactor increased the alkalinity and pH value [34]. When HRT decreased from 124 days to 62 days and OLR increased from 0.51 kg VS/m3/d to 1.4 kg VS/m3/d, pH decreased steadily from 7.0 to 6.5 (Figure 3a). A similar pattern in pH drop was observed at an OLR of 2.45 kg VS/m3/d corresponding to an HRT of 35 days (Figure 3a). A sharp decrease in pH value at HRTs of 62 days and 35 days was due to the high concentration of VFA. Therefore, easily degradable organics in FW were quickly degraded into VFA, resulting in acidification, which finally led to the failure of the reactor.
Reactor acidification is the most significant and common problem inhibiting methanogenic activity [17,18]. This is due to the rapid increase in the intermediate product, particularly VFA concentration, which reduces the biogas production and leads to the collapse of the entire process [17,19]. Hence, it is important to check the VFA concentrations periodically to avoid process failure. The system was stable at an OLR of 0.51 kg VS/m3/d corresponding to an HRT of 124 days due to the low concentration of VFA (410 mg HAOc/L). When HRT decreased from 124 days to 35 days and OLR increased from 0.51 kg VS/m3/d to 2.45 kg VS/m3/d, a noticeable accumulation of VFA was observed in the reactor (Figure 3b), which approximately exceeded the VFA accumulation of the 124-day HRT by more than 12-fold. The biogas yield decreased sharply when the concentration of VFA in the reactor reached 5620 mg HAOc/L. Xu et al. [19] and Shi et al. [34] reported that methanogenic activity was inhibited completely when the concentrations of VFA fell in the range of 5800 to 6900 mg/L, consistent with the present study.
The concentration of NH3-N plays an important role in both process efficiency and stability. The FW contains a high concentration of protein and ammonia that are produced from the protein content of FW during hydrolysis [20,35,36]. The concentration of the total NH3-N is affected by pH and temperature. For example, microorganism inhibition can occur due to the high concentrations of NH3-N, which could lead to the failure of the complete AD process [20,35,36]. As shown in Figure 3c, the concentration of NH3-N increased continuously at an HRT of 124 days and caused no considerable difference in the pH values. After decreasing HRT to 62 days, the concentration of NH3-N decreased a little (2819 mg/L) at the early stage, and then gradually increased to a peak value of 3800 mg/L. The pH also decreased gradually with an increase in the NH3-N concentrations at an HRT of 62 days (Figure 3a,c). When HRT further decreased to 35 days, the concentration of NH3-N in the reactor rapidly accumulated, and further increased to 5700 mg/L (Figure 3c). Biogas yield was reduced when the NH3-N concentration was increased to more than 3500 mg/L. A similar result was reported by Peng et al. [36], who investigated the effect of NH3-N on AD performance during FW treatment. They found that the concentration of NH3-N gradually increased in the reactor, and the production of biogas decreased gradually when the NH3-N concentration was increased to almost 3500 mg/L.

3.2.2. Removal Efficiency of TS, VS, and COD

Removal efficiency is considered significant in evaluating the performance of an AD process. The organic substances of FW were degraded and transformed into biogas during the AD process, which resulted in the fluctuations of TS, VS, and COD concentration. The effluent concentrations of TS, VS, and COD during the AD process fell in the range of 19-62 g/L, 13-42 g/L, and 22-67g/L, respectively (Figure 4a–c). An average TS destruction efficiency of 38% was observed at an HRT of 124 days, which then sharply increased to 65% and 72% when the HRTs decreased to 62 days and 35 days, respectively (Figure 4d). The lowest average VS removal rate of 58% was observed at an HRT of 124 days and an OLR of 0.51 kg VS/m3/d, respectively. The highest average VS removal of 79% was achieved when HRT was shortened to 35 days and the OLR was increased to 2.45 kg VS/m3/d, respectively (Table 4). This could be considered a result of the urging of the floating scum that brought the sludge to the upper portion of the reactor as reported by Hu et al. [16]. At an OLR of 0.51 kg VS/m3/d and an HRT of 124 days, the average COD removal was 60%. When the OLR increased to 1.4 kg VS/m3/d and 2.45 kg VS/m3/d and the HRT decreased to 62 days and 35 days, the average removal efficiency of COD increased sharply to 78% and 80%, respectively (Figure 4d). A similar observation was reported by Kumar et al. [21], who noted that COD reduction efficiency was increased with a decrease in HRTs and an increase in OLRs, consistent with the present study. This result shows that biogas yield had a negative correlation with TS, VS, and COD reduction efficiency with decreasing HRTs.

3.3. Kinetic Analysis and Model Selection

Three kinetic models—the first-order kinetic model, the modified Gompertz model, and the logistic function model—were proposed to evaluate the performance of the AD of FW. The estimated parameters such as hydrolysis rate constant (first order), lag phase duration, maximum biogas production rate, and biogas yield potential, as obtained from the three fitted kinetic models, are displayed in Table 5. The polynomial regression models explain the relationship between the cumulative biogas yields as a function of AD time through FW (Figure 5). Three primary sections were designated in this study; Section 1 categorizes the relationship for lag phase (10 days and 11 days for the modified Gompertz model and the logistic function model, respectively) to identify biogas production. Section 2 represents the exponential phase during which the cumulative biogas yield increased sharply from 10 days or 11 days (depending on the model) to 64 days because of the quick development of the anaerobic microbial communities. Section 3 presents the steady phase and death phase (after 64 days) wherein the cumulative biogas yield increased gradually until the cumulative biogas yield curve reached a plateau, which could be due to the reduction of the anaerobic microbial populations [18], as a consequence of which, the biogas production nearly stopped.
Biogas production potential was determined by fitting the experimental data based on cumulative biogas production and the kinetic parameters of the three models employed to analyze the FW degradation rate. The predicted cumulative biogas yield derived from the first-order kinetic model, the modified Gompertz model, and the logistic function model are shown in Figure 5a–c, respectively. All three kinetic models indicate a reasonable fit with the experimental data, as supported by the high values of R2 and the low residual sum of square (RSS) values. The R2 and RSS values of the modified Gompertz model were significantly higher (0.997) and lower (29.764) compared to the first-order kinetic model and the logistic function model, respectively. This indicates that the modified Gompertz model presented a more robust estimation, and it was able to describe more than 99% of the modifications in the results. A similar finding was reported by Zahan et al. [31], who noted that the modified Gompertz model was the best fit model followed by the first-order kinetic model and the logistic function model. Deepanraj et al. [13] also found that the modified Gompertz model could better fit data compared to the logistic function model. The hydrolysis rate constant (k) of the FW determined from the first-order model was 0.027 (1/day). A study reported by Li et al. [14] found that the k-value of the AD of FW could range from 0.13–0.56 1/d. Mao et al. [37] pointed out that biogas production and the rate of degradation depends on the k-value. In general, faster degradation and biogas production rates could be achieved with a higher k-value. The present study found that a lower k-value was connected to decreased biodegradability and needed longer degradation times to obtain maximum biogas production.
The maximum biogas production rate (Rm) of 0.833 L/g VSadded.d and 0.803 L/g VSadded.d was observed for the modified Gompertz model and the logistic function model, respectively. Li et al. [14] observed that the Rm value of the FW was higher compared to the co-digestion of pig manure with dewatered sewage sludge, chicken manure, and corn stover. This could be because FW is more easily degradable than other substrates, including sludge, straw, and livestock manure. The delayed response and the subsequent adaptation of microorganisms to the fluctuating environment are expressed by the lag phase (λ) [14,37]. The modified Gompertz model and the logistic function model achieved approximately the same λ value of 10.2 days and 11 days, respectively. The value of λ in this study was relatively high compared to the previously reported λ of 1.2–1.8 days and 1.5–2.1 days by Deepanraj et al. [22] for the modified Gompertz model and logistic function model, respectively. Therefore, a high λ value could reduce the adaptation ability of microorganisms to the reaction system and produce biogas within a longer timeframe. The effective biogas production period (Tef) was calculated by subtracting the λ value from the period taken to achieve 90% of total biogas production (T90). Studies have reported that a longer λ with longer Tef might lean towards more extended periods of AD and a reversible process inhibition whereas a longer λ with shorter Tef could indicate a shorter AD period and an irreversible process inhibition. A shorter λ with shorter Tef revealed a high biogas production rate and a shorter AD period [14,30,37]. The Tef was found to be 53 days and 52 days for the Modified Gompertz model and the logistic function model, respectively, as shown in Table 5.
RMSE, RSS, AIC, and BIC are established statistical indicators that help determine a better fit for the kinetic model with the experimental data, as displayed in Table 6. The modified Gompertz model had the lowest RMSE value (0.622) as opposed to the first-order kinetic model (3.972) and the logistic function model (0.853). The modified Gompertz model exhibited the lowest RSS, AIC, and BIC followed by, in ascending order, the logistic function model and the first-order kinetic model. Nguyen et al. [15] reported that the higher value of R2 and the lower values of RMSE, RSS, AIC, and BIC indicated a more suitable kinetic model. Therefore, the modified Gompertz model best fitted the biogas production data as compared to the first-order kinetic model and the logistic function model. Zahan et al. [31] suggested that the small deviations achieved between the measured and predicted value (almost equal to or less than 10%) indicate that the proposed kinetic models have correctly predicted the performance of the anaerobic reactors. The deviation between the measured and predicted cumulative biogas yield in this study was found to be 1.523% for the logistic function model, 3.27% for the modified Gompertz model, and 12.51% for the first-order model. This indicates that the logistic function model and the modified Gompertz model can be used to estimate the potential biogas production using FW.

4. Conclusions

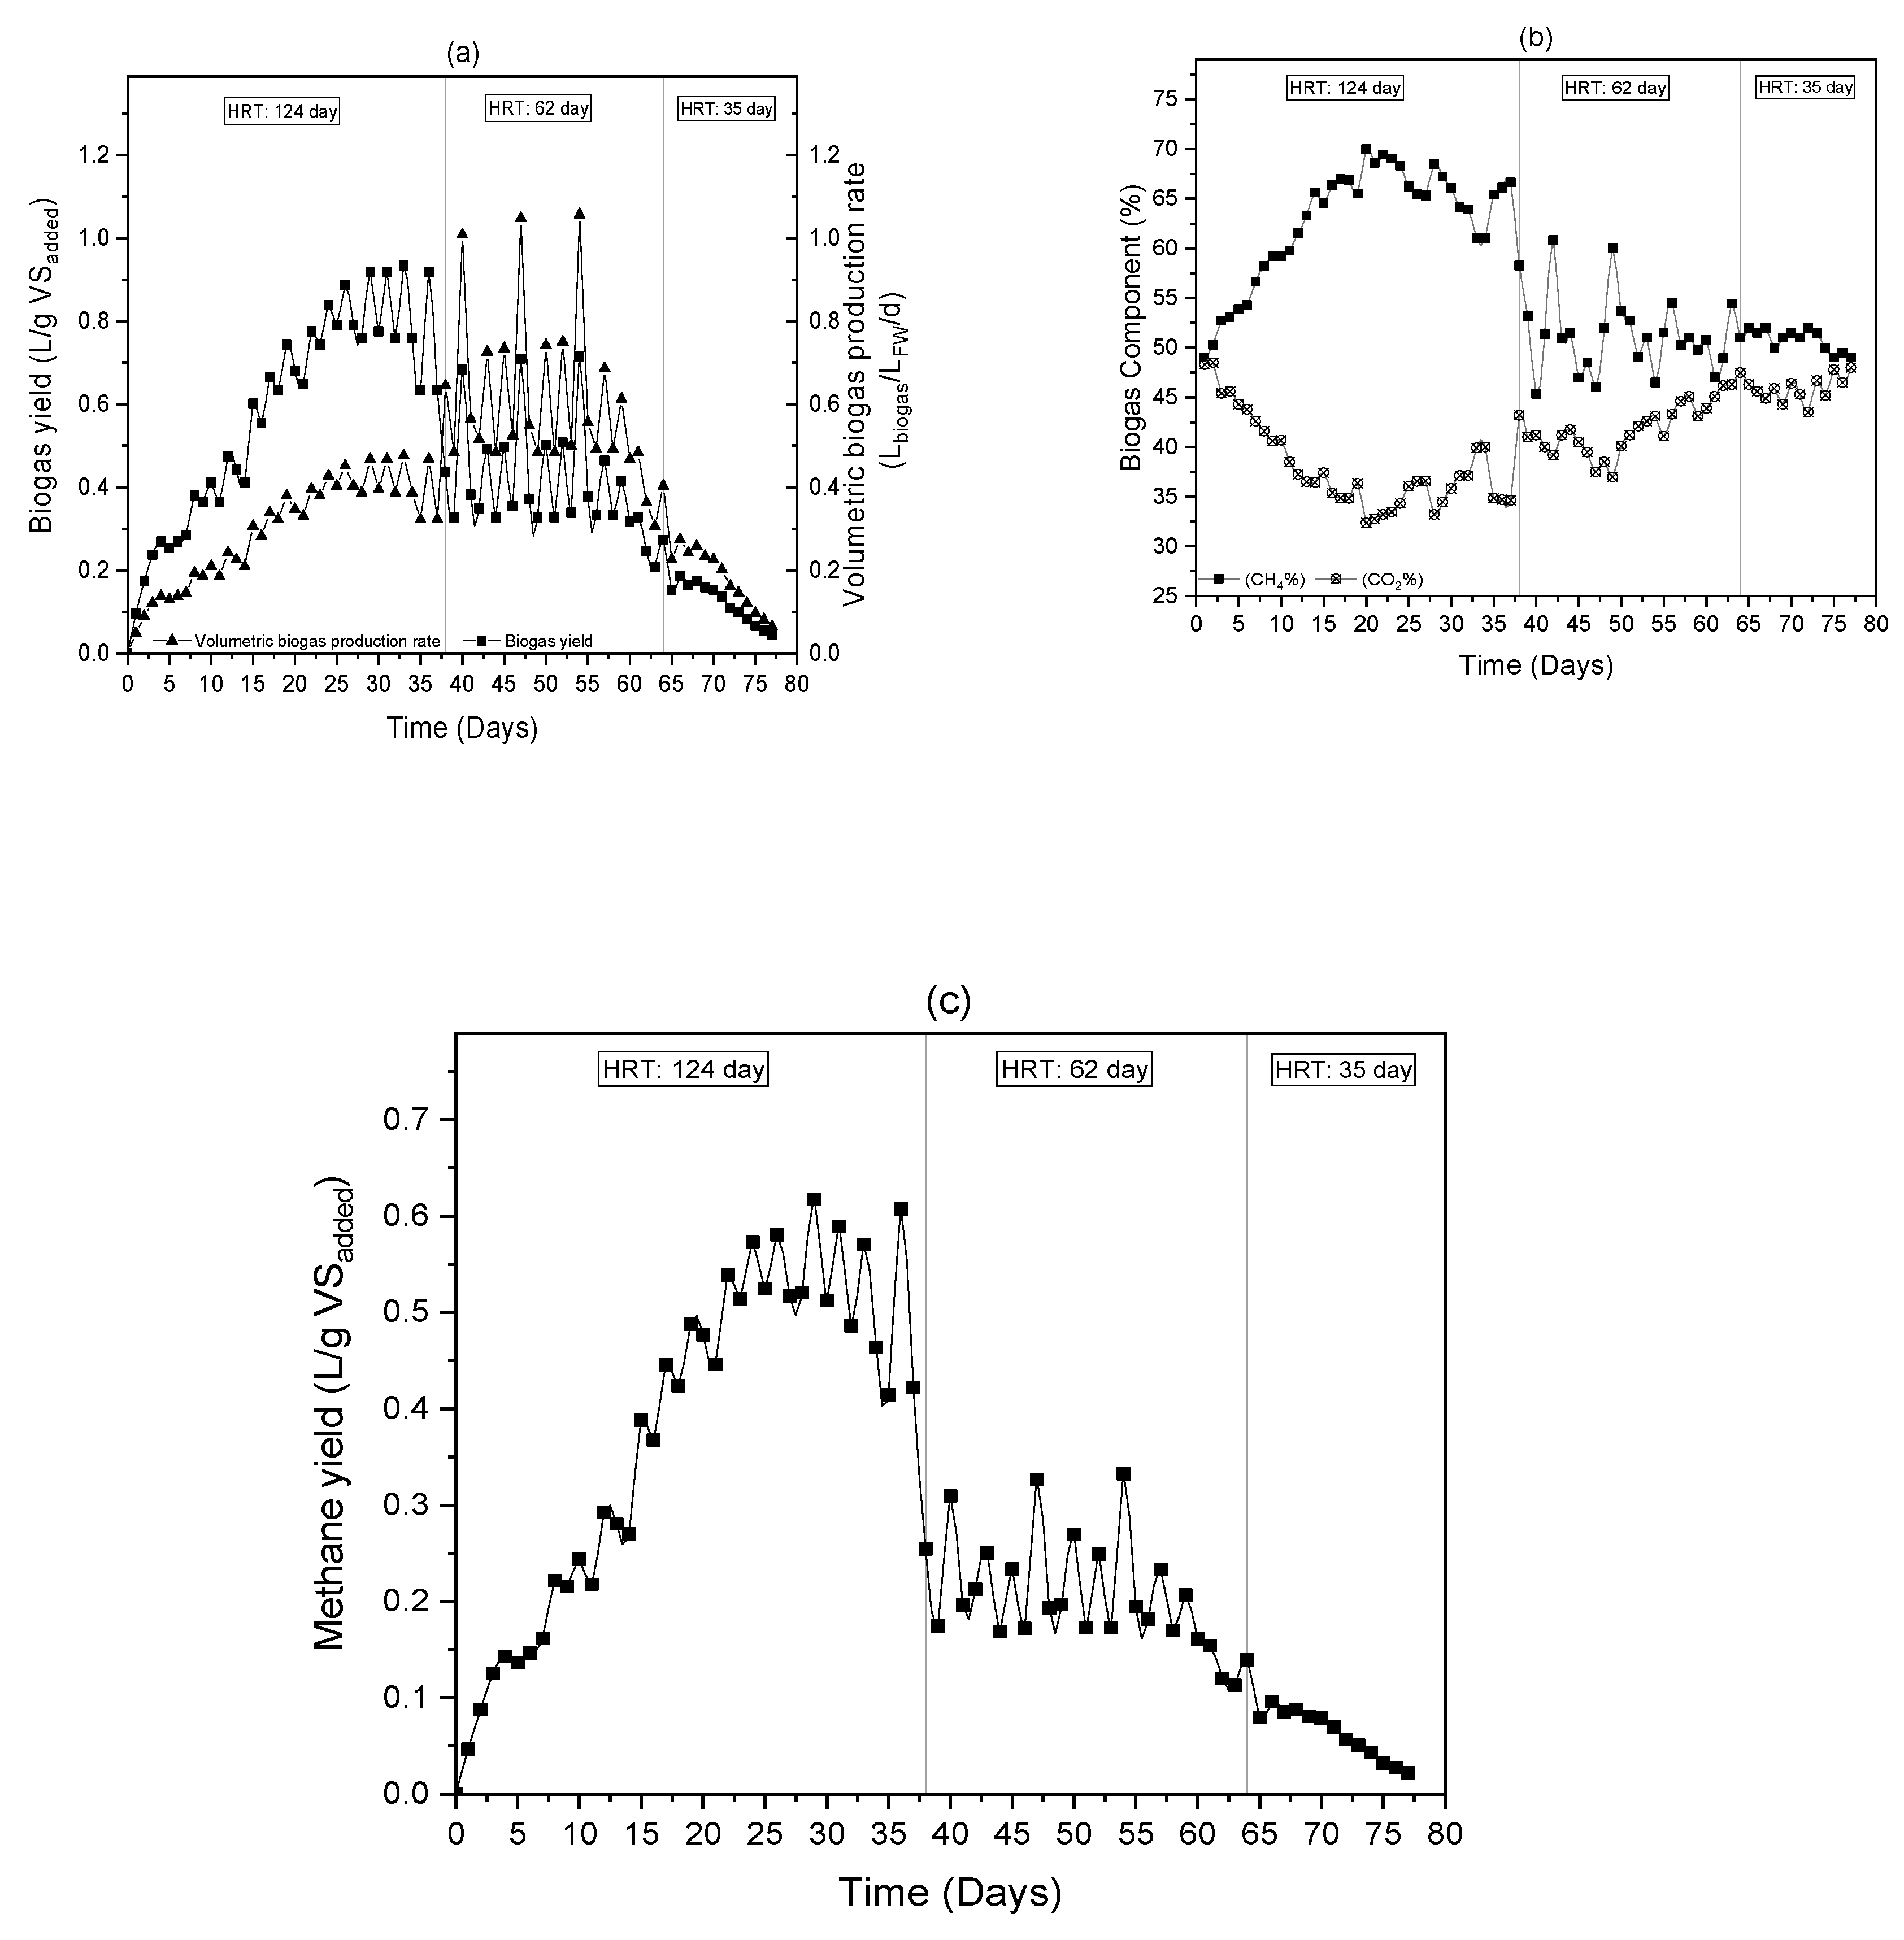
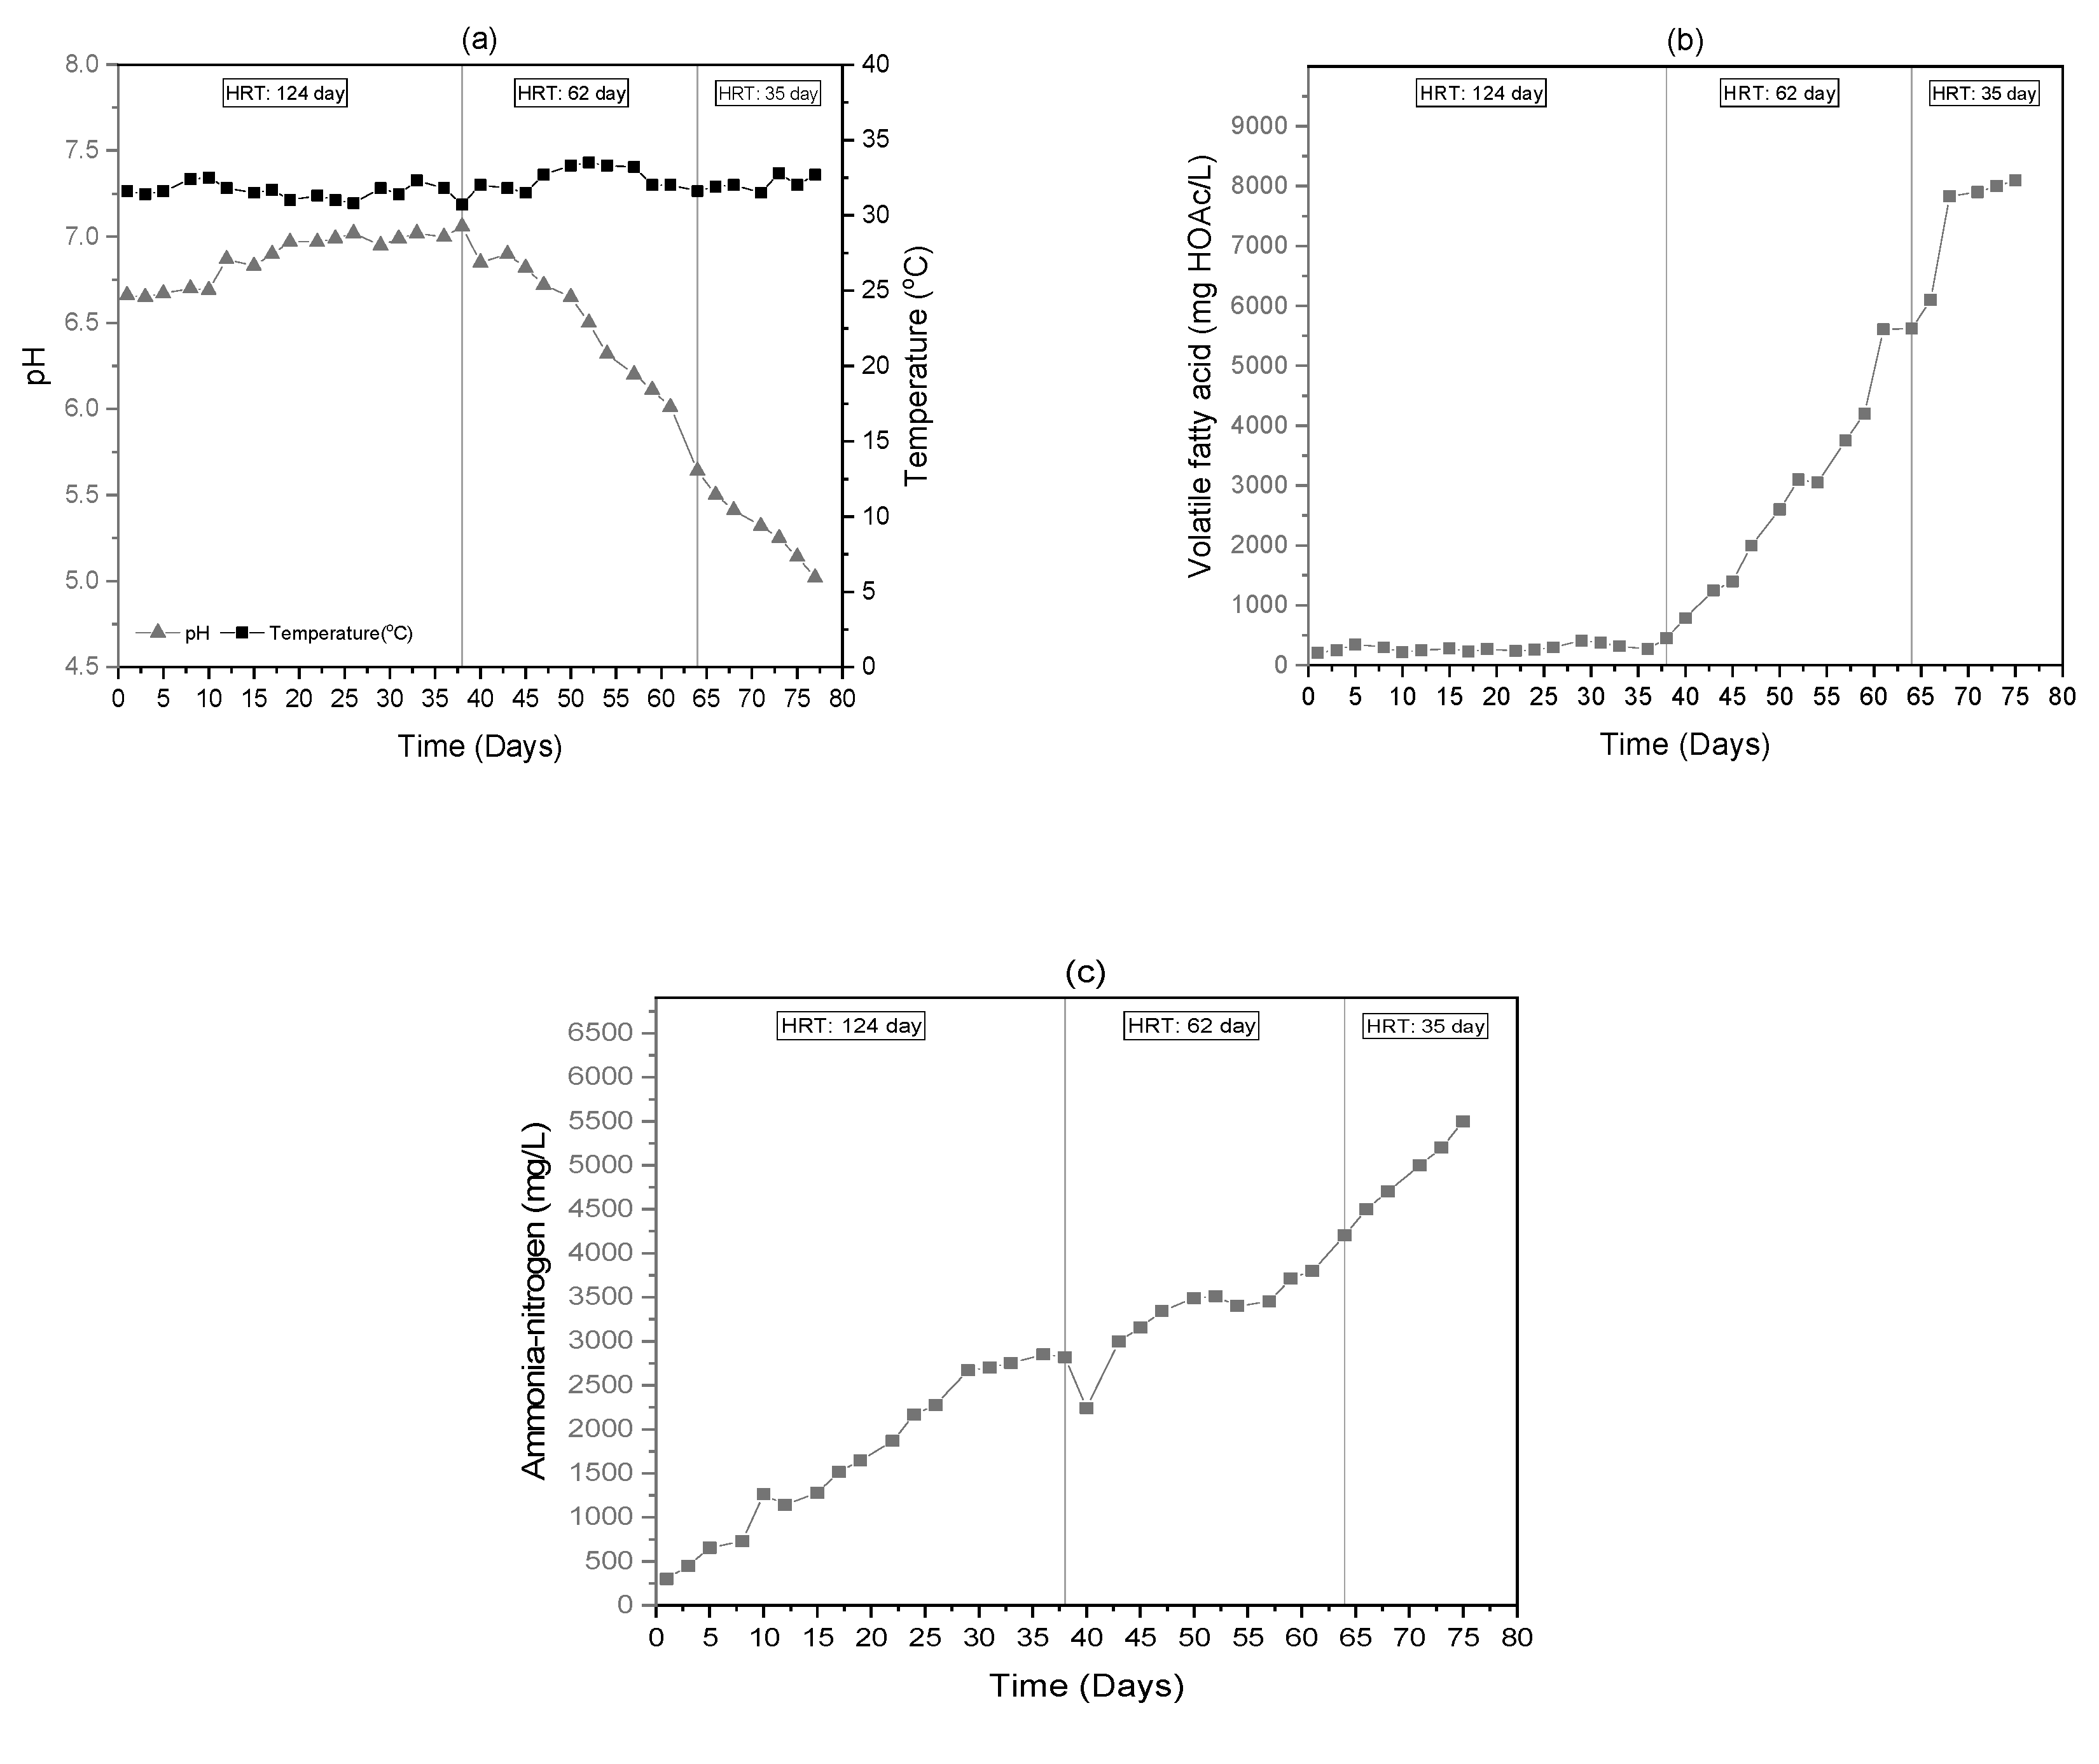
The AD of FW at HRTs of 124 days, 62 days, and 35 days were investigated under mesophilic conditions. The highest biogas and methane yield were obtained in Stage-1 with an OLR of 0.51 kg VS/m3/day and an HRT of 124 days. It was observed that the biogas and methane yield decreased when HRT decreased from 124 days to 62 days. When HRT was decreased to 35 days in Stage-3, the AD process became unstable and the biogas production decreased sharply due to VFA and ammonia accumulation. The shock loading, temperature fluctuation, irregular mixing, and stepwise feeding type (i.e., three days in a week) may be the reason for the VFA and ammonia accumulation inside the reactor. However, AD process failure, VFA and ammonia accumulation, low buffer capacity, foaming problem, and high financial cost are different economic and technical challenges for single-stage AD of FW waste. Therefore, multi-stage and temperature control reactor, co-digestion, continuous feeding and mixing, FW pre-treatment, and addition of micro-nutrients and antifoaming agents are preferentially recommended to improve the performance of the single-stage AD reactor. Among three kinetic models, the modified Gompertz model was the most suitable model (R2 = 0.997) for fitting the measured biogas yield and it could be used to describe the kinetics of the AD process more reasonably. The calculated parameters displayed that AD of FW at high loading have low hydrolysis rate and long lag phase. The modified Gompertz model could be used for practical applications to optimize process parameters to improve the design and operation of an AD process.

Author Contributions

S.K.P., F.B.S., M.P., and B.K.P. conceived and designed the experiments; S.K.P. and M.P. constructed the reactor; S.K.P. performed the experiment, S.K.P., F.B.S., and B.K.P. analysed the data; all authors contributed to preparing this manuscript.

Funding

This research was funded by LRGS MRUN/F2/01/2019.

Conflicts of Interest

The authors declare no conflict of interest.

References

  1. Pramanik, S.K.; Suja, F.B.; Zain, S.; Pramanik, B.K. The Anaerobic Digestion Process of Biogas Production from Food Waste: Prospects and Constraints. Bioresour. Technol. Rep. 2019, 8, 100310. [Google Scholar] [CrossRef]
  2. Edward, O.T. Tackling Food Wastage with Innovation 2018. Available online: https://www.nst.com.my/opinion/letters/2018/11/432303/tackling-food-wastage-innovation (accessed on 19 August 2019).
  3. Zhang, C.; Su, H.; Baeyens, J.; Tan, T. Reviewing the Anaerobic Digestion of Food Waste for Biogas Production. Renew. Sustain. Energy Rev. 2014, 38, 383–392. [Google Scholar] [CrossRef]
  4. Meng, Y.; Li, S.; Yuan, H.; Zou, D.; Liu, Y.; Zhu, B.; Chufo, A.; Jaffar, M.; Li, X. Evaluating Biomethane Production from Anaerobic Mono- and Co-Digestion of Food Waste and Floatable Oil (FO) Skimmed from Food Waste. Bioresour. Technol. 2015, 185, 7–13. [Google Scholar] [CrossRef]
  5. Pramanik, S.K.; Suja, F.B.; Pramanik, B.K. Opportunity of Biogas Production from Solid Organic Wastes through Anaerobic Digestion. E3S Web Conf. 2018, 05025, 1–10. [Google Scholar] [CrossRef]
  6. Kothari, R.; Pandey, A.K.; Kumar, S.; Tyagi, V.V.; Tyagi, S.K. Different Aspects of Dry Anaerobic Digestion for Bio-Energy: An Overview. Renew. Sustain. Energy Rev. 2014, 39, 174–195. [Google Scholar] [CrossRef]
  7. Nagao, N.; Tajima, N.; Kawai, M.; Niwa, C.; Kurosawa, N.; Matsuyama, T.; Yusoff, F.M.; Toda, T. Maximum Organic Loading Rate for the Single-Stage Wet Anaerobic Digestion of Food Waste. Bioresour. Technol. 2012, 118, 210–218. [Google Scholar] [CrossRef]
  8. Khalid, A.; Arshad, M.; Anjum, M.; Mahmood, T.; Dawson, L. The Anaerobic Digestion of Solid Organic Waste. Waste Manag. 2011, 31, 1737–1744. [Google Scholar] [CrossRef]
  9. Collivignarelli, M.C.; Abb, A.; Miino, M.C.; Torretta, V. What Advanced Treatments Can Be Used to Minimize the Production of Sewage Sludge in WWTPs? Appl. Sci. 2019, 9, 2650. [Google Scholar] [CrossRef]
  10. Ganesh, R.; Torrijos, M.; Sousbie, P.; Lugardon, A.; Steyer, J.P.; Delgenes, J.P. Single-Phase and Two-Phase Anaerobic Digestion of Fruit and Vegetable Waste: Comparison of Start-up, Reactor Stability and Process Performance. Waste Manag. 2014, 34, 875–885. [Google Scholar] [CrossRef]
  11. Kim, J.K.; Oh, B.R.; Chun, Y.N.; Kim, S.W. Effects of Temperature and Hydraulic Retention Time on Anaerobic Digestion of Food Waste. J. Biosci. Bioeng. 2006, 102, 328–332. [Google Scholar] [CrossRef]
  12. Bouallagui, H.; Ben Cheikh, R.; Marouani, L.; Hamdi, M. Mesophilic Biogas Production from Fruit and Vegetable Waste in a Tubular Digester. Bioresour. Technol. 2003, 86, 85–89. [Google Scholar] [CrossRef]
  13. Deepanraj, B.; Sivasubramanian, V.; Jayaraj, S. Effect of Substrate Pretreatment on Biogas Production through Anaerobic Digestion of Food Waste. Int. J. Hydrog. Energy 2017, 42, 26522–26528. [Google Scholar] [CrossRef]
  14. Li, L.; He, Q.; Zhao, X.; Wu, D.; Wang, X.; Peng, X. Anaerobic Digestion of Food Waste: Correlation of Kinetic Parameters with Operational Conditions and Process Performance. Biochem. Eng. J. 2018, 130, 1–9. [Google Scholar] [CrossRef]
  15. Nguyen, D.D.; Jeon, B.H.; Jeung, J.H.; Rene, E.R.; Banu, J.R.; Ravindran, B.; Vu, C.M.; Ngo, H.H.; Guo, W.; Chang, S.W. Thermophilic Anaerobic Digestion of Model Organic Wastes: Evaluation of Biomethane Production and Multiple Kinetic Models Analysis. Bioresour. Technol. 2019, 280, 269–276. [Google Scholar] [CrossRef]
  16. Hu, Y.; Kobayashi, T.; Qi, W.; Oshibe, H.; Xu, K.Q. Effect of Temperature and Organic Loading Rate on Siphon-Driven Self-Agitated Anaerobic Digestion Performance for Food Waste Treatment. Waste Manag. 2018, 74, 150–157. [Google Scholar] [CrossRef]
  17. Liu, C.; Wang, W.; Anwar, N.; Ma, Z.; Liu, G.; Zhang, R. Effect of Organic Loading Rate on Anaerobic Digestion of Food Waste under Mesophilic and Thermophilic Conditions. Energy Fuels 2017, 31, 2976–2984. [Google Scholar] [CrossRef]
  18. Gou, C.; Yang, Z.; Huang, J.; Wang, H.; Xu, H.; Wang, L. Effects of Temperature and Organic Loading Rate on the Performance and Microbial Community of Anaerobic Co-Digestion of Waste Activated Sludge and Food Waste. Chemosphere 2014, 105, 146–151. [Google Scholar] [CrossRef]
  19. Xu, Z.; Zhao, M.; Miao, H.; Huang, Z.; Gao, S.; Ruan, W. In Situ Volatile Fatty Acids Influence Biogas Generation from Kitchen Wastes by Anaerobic Digestion. Bioresour. Technol. 2014, 163, 186–192. [Google Scholar] [CrossRef]
  20. Chen, H.; Wang, W.; Xue, L.; Chen, C.; Liu, G.; Zhang, R. Effects of Ammonia on Anaerobic Digestion of Food Waste: Process Performance and Microbial Community. Energy Fuels 2016, 30, 5749–5757. [Google Scholar] [CrossRef]
  21. Kumar, G.; Sivagurunathan, P.; Park, J.H.; Kim, S.H. Anaerobic Digestion of Food Waste to Methane at Various Organic Loading Rates (OLRs) and Hydraulic Retention Times (HRTs): Thermophilic vs. Mesophilic Regimes. Environ. Eng. Res. 2016, 21, 69–73. [Google Scholar] [CrossRef]
  22. Deepanraj, B.; Sivasubramanian, V.; Jayaraj, S. Experimental and Kinetic Study on Anaerobic Digestion of Food Waste: The Effect of Total Solids and PH. J. Renew. Sustain. Energy 2015, 7, 063104. [Google Scholar] [CrossRef]
  23. Zhang, W.; Lang, Q.; Pan, Z.; Jiang, Y.; Liebetrau, J.; Nelles, M.; Dong, H.; Dong, R. Performance Evaluation of a Novel Anaerobic Digestion Operation Process for Treating High-Solids Content Chicken Manure: Effect of Reduction of the Hydraulic Retention Time at a Constant Organic Loading Rate. Waste Manag. 2017, 64, 340–347. [Google Scholar] [CrossRef]
  24. Mao, C.; Feng, Y.; Wang, X.; Ren, G. Review on Research Achievements of Biogas from Anaerobic Digestion. Renew. Sustain. Energy Rev. 2015, 45, 540–555. [Google Scholar] [CrossRef]
  25. Shi, X.; Dong, J.; Yu, J.; Yin, H.; Hu, S.; Huang, S.; Yuan, X. Effect of Hydraulic Retention Time on Anaerobic Digestion of Wheat Straw in the Semicontinuous Continuous Stirred-Tank Reactors. Biomed Res. Int. 2017, 2017, 2457805. [Google Scholar] [CrossRef]
  26. Arij, Y.; Fatihah, S.; Rakmi, A.R. Performance of Pilot Scale Anaerobic Biofilm Digester (ABD) for the Treatment of Leachate from a Municipal Waste Transfer Station. Bioresour. Technol. 2018, 260, 213–220. [Google Scholar] [CrossRef]
  27. Bong, C.P.C.; Lim, L.Y.; Lee, C.T.; Ho, W.S.; Klemeš, J.J. The Kinetics for Mathematical Modelling on the Anaerobic Digestion of Organic Waste-A Review. Chem. Eng. Trans. 2017, 61, 1669–1674. [Google Scholar]
  28. Appels, L.; Baeyens, J.; Degrève, J.; Dewil, R. Principles and Potential of the Anaerobic Digestion of Waste-Activated Sludge. Prog. Energy Combust. Sci. 2008, 34, 755–781. [Google Scholar] [CrossRef]
  29. Rodriguez, C.; Alaswad, A.; El-Hassan, Z.; Olabi, A.G. Improvement of Methane Production from P. Canaliculata through Mechanical Pretreatment. Renew. Energy 2017, 119, 73–78. [Google Scholar] [CrossRef]
  30. Kafle, G.K.; Chen, L. Comparison on Batch Anaerobic Digestion of Five Different Livestock Manures and Prediction of Biochemical Methane Potential (BMP) Using Different Statistical Models. Waste Manag. 2016, 48, 492–502. [Google Scholar] [CrossRef]
  31. Zahan, Z.; Othman, M.Z.; Muster, T.H. Anaerobic Digestion/Co-Digestion Kinetic Potentials of Different Agro-Industrial Wastes: A Comparative Batch Study for C/N Optimisation. Waste Manag. 2018, 71, 663–674. [Google Scholar] [CrossRef]
  32. Li, K.; Liu, R.; Sun, C. Comparison of Anaerobic Digestion Characteristics and Kinetics of Four Livestock Manures with Different Substrate Concentrations. Bioresour. Technol. 2015, 198, 133–140. [Google Scholar] [CrossRef]
  33. Donoso-Bravo, A.; Pérez-Elvira, S.I.; Fdz-Polanco, F. Application of Simplified Models for Anaerobic Biodegradability Tests. Evaluation of Pre-Treatment Processes. Chem. Eng. J. 2010, 160, 607–614. [Google Scholar] [CrossRef]
  34. Shi, X.; Guo, X.; Zuo, J.; Wang, Y.; Zhang, M. A Comparative Study of Thermophilic and Mesophilic Anaerobic Co-Digestion of Food Waste and Wheat Straw: Process Stability and Microbial Community Structure Shifts. Waste Manag. 2018, 75, 261–269. [Google Scholar] [CrossRef]
  35. Akindele, A.A.; Sartaj, M. The Toxicity Effects of Ammonia on Anaerobic Digestion of Organic Fraction of Municipal Solid Waste. Waste Manag. 2018, 71, 757–766. [Google Scholar] [CrossRef]
  36. Peng, X.; Zhang, S.Y.; Li, L.; Zhao, X.; Ma, Y.; Shi, D. Long-Term High-Solids Anaerobic Digestion of Food Waste: Effects of Ammonia on Process Performance and Microbial Community. Bioresour. Technol. 2018, 262, 148–158. [Google Scholar] [CrossRef]
  37. Mao, C.; Wang, X.; Xi, J.; Feng, Y.; Ren, G. Linkage of Kinetic Parameters with Process Parameters and Operational Conditions during Anaerobic Digestion. Energy 2017, 135, 352–360. [Google Scholar] [CrossRef]
Figure 1. Schematic diagram of the single-stage anaerobic biofilm digester system.
Processes 07 00600 g001
Figure 2. (a) Biogas yield and volumetric biogas production rate, (b) biogas component, and (c) methane yield during anaerobic digestion of food waste.
Processes 07 00600 g002
Figure 3. pH, volatile fatty acids, and ammonia-nitrogen concentration in different operating stages during anaerobic digestion of food waste. (a) pH value; (b) volatile fatty acid (VFA) concentration; (c) ammonia-nitrogen concentration.
Processes 07 00600 g003
Figure 4. Variations of total solid (TS), volatile solid (VS), and chemical oxygen demand (COD) in different operating stages during anaerobic digestion of food waste. (a) TS concentration; (b) VS concentration; (c) COD concentration; (d) average removal efficiency of TS, VS, and COD at different hydraulic retention time (HRT).
Processes 07 00600 g004
Figure 5. Cumulative biogas yield from the (a) first-order kinetic model, (b) modified Gompertz model, and (c) logistic function model.
Processes 07 00600 g005
Table 1. Composition and characteristics of the food waste used in this study.
Type of Food WastePercentage Composition (% wet weight)
Rice, pasta and noodles48
Vegetables21
Meat, fish and egg17
Fruits and berries8
Bakery and grain products6
Characteristics of the Food Waste
ParameterStage-1Stage-2 & 3
Total solid; TS (g/L)66 ± 2.4196.42 ± 0.62
Volatile solid; VS (g/L)63 ± 2.2792 ± 0.62
VS/TS ratio0.960.95
pH4.91 ± 0.164.57 ± 0.28
Chemical oxygen demand; COD (g/L)110 ± 8.16160.9 ± 1.13
Soluble chemical oxygen demand; sCOD (g/L)35 ± 3.8051.6 ± 1.64
Ammonia-nitrogen; NH3-N (mg/L)104 ± 6.52112.63 ± 7.52
Total Kjeldahl nitrogen; TKN (mg/L)356 ± 10.7377.63 ± 12.58
Total volatile fatty acid; tVFA (mg HOAc/L)3585 ± 99.64573.33 ± 144.91
Note: The values indicate average ± standard deviation of duplicate samples.
Table 2. Composition of the synthetic wastewater.
Name of ChemicalsUnitQuantity
Glucosemg5300
Beef Extractmg840
CaCl2 2H2Omg61.2
MgSO4 7H2Omg64.3
NH4Clmg333.3
Distilled water-Full to 1L
Table 3. Operational conditions of semi-continuous single-stage anaerobic digestion system.
StagesDuration (days)Q (L/day)OLR (kg VS/m3/d)HRT (days)
10–3710.51124
238–6321.462
364–773.52.4535
Note: Influent flow rate (Q); hydraulic retention time (HRT); organic loading rate (OLR).
Table 4. Performances of the single-stage reactor.
Stages123
HRT (days)1246235
OLR (kg VS/m3/d)0.511.42.45
Duration (days)372614
Biogas yield (L/g VSadded)0.9340.7160.273
Volumetric Biogas production (L/L/d)0.4761.0570.403
Methane yield (L/g VSadded)0.6170.3330.139
Methane Content (%)7060.8352.5
TS removal efficiency (%)38.5 ± 9.665.5 ± 19.172.2 ± 4.5
VS removal efficiency (%)57.9 ± 6.575.8 ± 13.178.9 ± 3.3
COD removal efficiency (%)60.4 ± 7.178.5 ± 11.580.0 ± 1.3
Note: Influent flow rate (Q); hydraulic retention time (HRT); organic loading rate (OLR); total solid (TS); volatile solid (VS); chemical oxygen demand (COD). The values indicate average ± standard deviation of duplicate samples.
Table 5. Estimated kinetic parameters for the three models.
Kinetic ModelParameterUnits
First order kinetic modelHydrolysis rate constant (k)1/day0.027
R-square0.886
RMSE3.972
Biogas yieldPredictedL/g VSadded30.03
MeasuredL/g VSadded34.323
Difference%12.51
Modified Gompertz modelLag phase time (λ)days10.209
T90days63
Tefdays53
Maximum biogas production rate (Rm)L/g VSadded.d0.833
R-square0.997
RMSE0.622
Biogas yieldPredictedL/g VSadded33.20
MeasuredL/g VSadded34.323
Difference%3.27
Logistic function modelLag phase time (λ)days11.016
T90days63
Tefdays52
Maximum biogas production rate (Rm)L/g VSadded.d0.803
R-square0.995
RMSE0.853
Biogas yieldPredictedL/g VSadded33.80
MeasuredL/g VSadded34.323
Difference%1.523
Note: The coefficient of determination (R2); root mean square error (RMSE); T90 is duration for approximately 90% of biogas production.
Table 6. Criteria for analysis of the best fit of the three kinetic models.
Kinetic ModelRSSNParameterAIC TestBIC Test
AIC∆(AIC)Akaike WeightBIC∆(BIC)
First order Kinetic Model1214.86772216.57283.432.84 × 10−62221.10281.26
Modified Gompertz Model29.76773−66.8600.99−60.160
Logistic Function Model55.9177348.5642.585.67 × 10−10−11.6048.56
Note: Residual sum of the square (RSS); number of data points (N); Akaike information criterion (AIC); Bayesian information criterion (BIC); difference (∆).

