Effect of Delays on the Response of Microalgae When Exposed to Dynamic Environmental Conditions


1
Escuela de Ingeniería Bioquímica, Pontificia Universidad Católica de Valparaíso (PUCV), Avenida Brasil 2085, Valparaíso 2362803, Chile
2
Chemical Engineering Department, Universidad de La Frontera, Av. Francisco Salazar 01145, Temuco 4811230, Chile
3
Cetaqua, Centro Tecnológico del Agua, Los Pozos 7340, Santiago 7570475, Chile
*
Author to whom correspondence should be addressed.
Processes 2020, 8(1), 87; https://0-doi-org.brum.beds.ac.uk/10.3390/pr8010087
Submission received: 2 December 2019
/
Revised: 26 December 2019
/
Accepted: 7 January 2020
/
Published: 9 January 2020
(This article belongs to the Special Issue Modelling and Optimal Design of Complex Biological Systems)
Abstract
:During mathematical representation of microbial cultures, it is normally assumed that changes in the environment produce instantaneous effects on growth. However, reports are available indicating that sometimes this may not be the case. This work studied the existence of delays on the response of a population of microalgae when subjected to changes in energy and carbon sources, and when exposed to a growth inhibitor. Results show that no appreciable delays exist when microalgae undergo changes in the incident light intensity. For changes in carbon source concentration (inorganic carbon), a small delay in the range of minutes was detected. Finally, when exposing microalgae to inhibitory concentrations of ammonia, a significant delay of several hours was observed.
1. Introduction
The study of kinetic models is essential to understanding and describing many relevant phenomena in bioprocess engineering. They are used to describe the growth of biomass as the result of its interaction with the environment [1], and may provide detailed information of a culture’s behaviour, contributing to the design, operation, monitoring, and control of processes at large scales [2,3].
During modelling of microbial cultures, it is normally assumed that changes in the environment produce instantaneous effects on growth. This is observed in traditional growth kinetics models, such as Monod, Haldane, or Contois models [4]. These traditional models do not consider that there can be a delay between changes in environmental conditions and the growth response of the microbial population [5,6]. When microorganisms are exposed to unbalanced conditions, such as sudden changes of the concentration of substrates or inhibitors, they go through a cellular stress phase, forcing microorganisms to redistribute metabolic fluxes. This can result in a delayed growth rate (DGR) [5,7]. Depending on the studied microorganism, the delay can range from several minutes in the case of bacteria to several days in the case of fungi.
The general idea of a delay in a microorganism’s response is somehow not extensively studied. Delays occur naturally as a result of two phenomena: delays due to the cell cycle and delays related to the transport of nutrients inside cells [8]. Few studies have reported the existence of these delays. For example, almost 50 years ago, Caperon [9] proposed that these delays exist during the growth of a population in response to the changes in the environment. He conducted a study based on continuous cultures of Isochrysis galbana. Ellermeyer et al. [10] studied the delayed growth response in Escherichia coli, determining a 20 min delay. Kelly et al. [11] reported a delay of 300 min as a consequence of products that inhibit Candida guilliermondii. Munna et al. [12] studied the influence of high temperatures on the growth of Saccharomyces cerevisiae, observing a delay of up to 360 min. Segura et al. [4] identified the existence of delays as high as 60 h when exposing Chlorella sorokiniana to different concentrations of ammonia as a growth inhibitor. The existence of these delays can influence the prediction accuracy of traditional kinetic models. This will especially be the case when systems are operated under dynamic environmental conditions, as is the case for batch and feed-batch cultivation strategies.
Microalgae have attracted increasing attention during the last decade as an efficient, versatile, and renewable way to harvest solar energy. Indeed, uses include production of biofuels, pigments, food ingredients, and even wastewater treatment. Cultivation of microalgae inevitably involve the application of dynamic conditions—even if a continuous culture is implemented—as a result of natural illumination changes during the day. Moreover, microalgae cultivation normally takes several days or weeks, during which changes in environmental conditions are expected. Therefore, microalgae represent a relevant case study when determining the effects of delays on the behavior of microbial populations.
This study was oriented to analyze the effects of different environmental conditions on the growth response of a microalgae population. It specifically studied disturbances in the carbon and energy sources and the exposure to a growth inhibitor (ammonia). Chlorella vulgaris was used to conduct the study, considering that this is a well-known microalga that is has a wide variety of purposes and applications.
2. Material and Methods
2.1. Microorganism and Culture Medium
This study was conducted using Chlorella vulgaris UTX 2714 microalgae. It was cultivated using a modified BG-11 medium [13], using sodium bicarbonate as the main carbon source. The medium composition was 100 mg L−1 Na2EDTA, 600 mg L−1 ferric ammonium citrate, 600 mg L−1 citric acid, 3.6 g L−1 CaCL2·2H2O, 7.5 g L−1 MgSO4·7H2O, 4.0 g L−1 K2HPO4, 2.86 g L−1 H3BO3, 1.80 g L−1 MnCL2·4H2O, 222 mg L−1 ZnSO4·7H2O, 79 mg L−1 CuSO4·5H2O, 50 mg L−1 CoCl2·6H2O, 40 mg L−1 NaMoO4·2H2O, 1.5 g L−1 NaNO3.
2.2. Photobioreactor
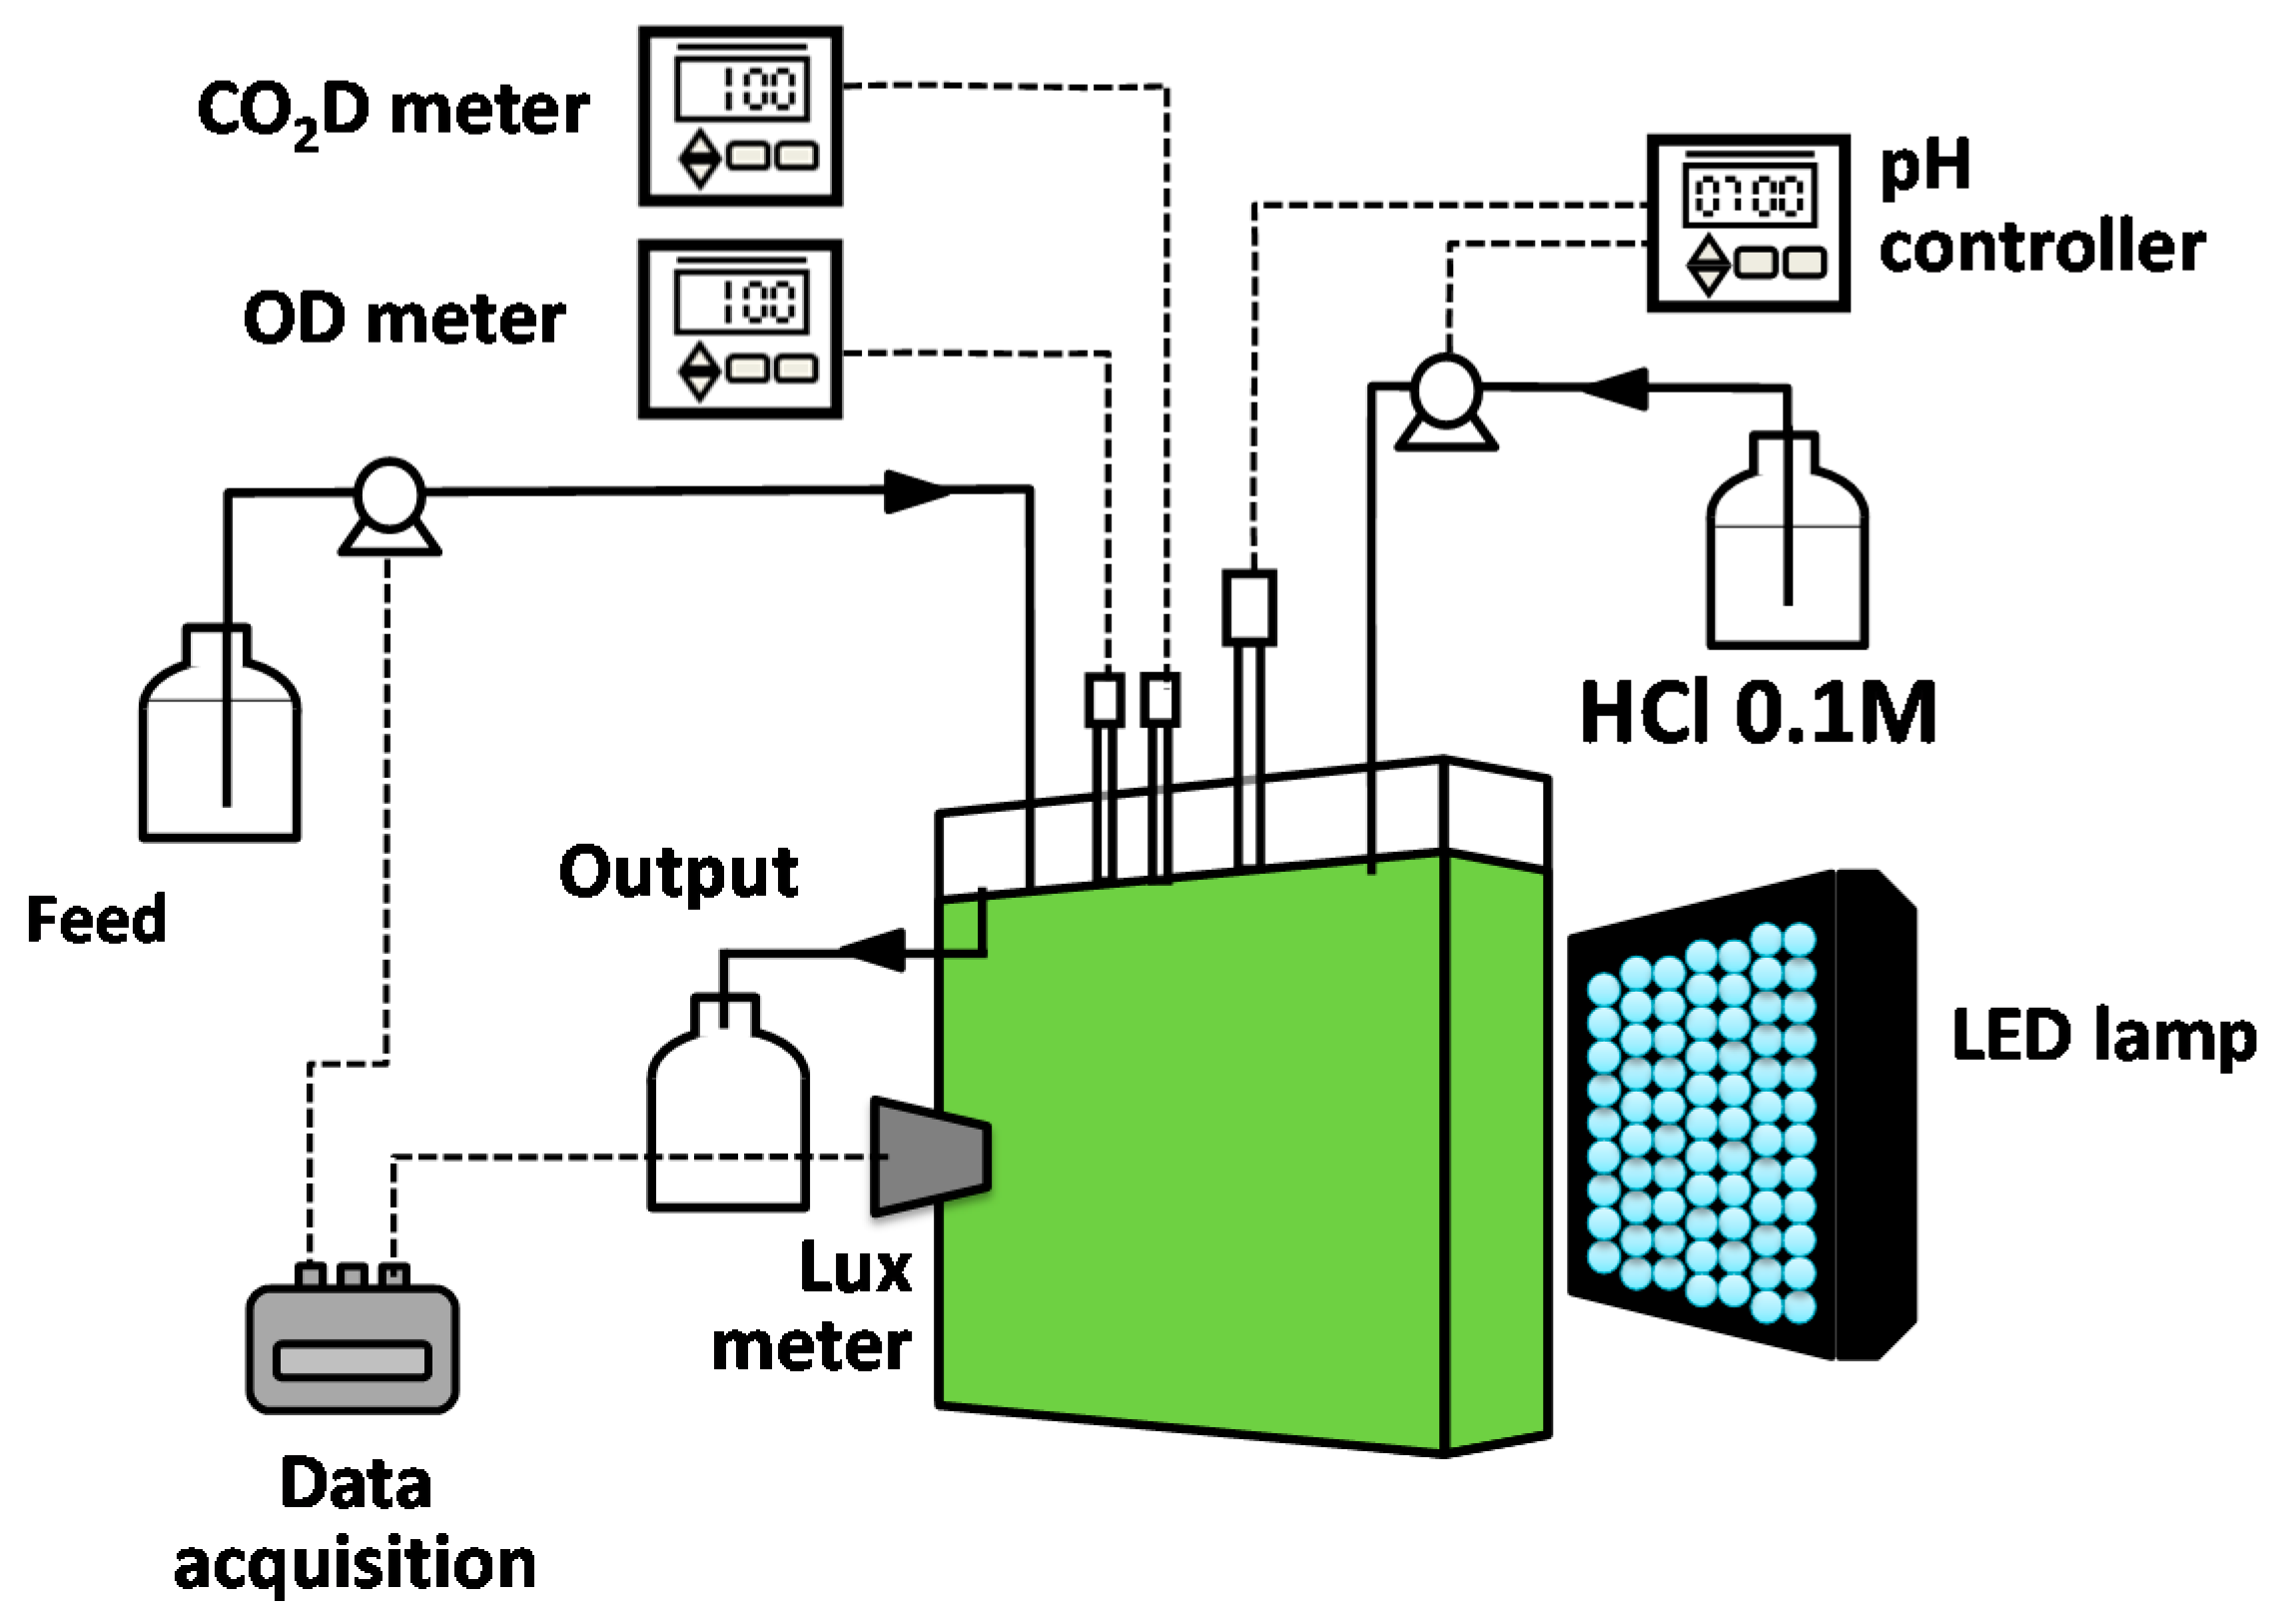
A lab-scale flat panel photobioreactor was used to conduct this study (see Figure 1). The system was an adaptation of the one reported previously by Segura et al. [4]. Light was supplied by a 50 W LED lamp. The system was operated as a turbidostat in order to keep biomass concentration constant, through the online measurement of the light intensity determined by a lux meter (Rixen, LXT-401A, Taiwan). Transmitted light intensity was automatically kept constant using a pump that fed the medium, thereby diluting the culture. During photobioreactor operation, dissolved oxygen (DO) and pH were measured online using electrodes (DO WQ401, GlobalWater, College Station, TX, USA). Signals of sensors were processed by a data acquisition system, which also controlled the feeding pump (USB 6008, National Instruments, Austin, TX, USA). The system was controlled by an application developed using LabView software (Version 8.6, National Instruments, Austin, TX, USA, 2007). The pH was controlled online using a pH controller (Hanna Instruments, Woonsocket, Rhode Island, USA) that determined the operation of a peristaltic pump dosing a HCl 0.1 M solution (Cole Parmer, Vernon Hills, IL, USA).
The photobioreactor was inoculated before each experiment with biomass cultured in 1 L bottles. Data was collected from the assays only when operation of the photobioreactor showed stable biomass concentration and steady oxygen production rates.
2.3. Oximetry Measurements
Oximetry measurements were used to determine the oxygen production rate (OPR) resulting from photosynthesis. OPR can be used as an indicator of microalgae growth rate, since produced oxygen is directly related to biomass production [14]. OPR was determined in the same photobioreactor after oxygen concentration was decreased to about 2 mg L−1 by bubbling nitrogen.
Dissolved oxygen dynamics can be represented by the following mass balance:
where oxygen transfer rate (OTR) represents the rate of oxygen exchange between the liquid phase and the atmosphere. The volumetric oxygen mass transfer coefficient (KLa) and the response time of the DO sensor were determined experimentally. The response time of DO sensor was considered following the criteria described by Garcia-Ochoa and Gomez [15]. Analysis showed that the sensor response time (15 s) was fast enough to produce no significant influence on OPR determinations. The measured OPR can be then determined using the rate of oxygen increase if OTR during that period is negligible. This assumption is reasonable, since during measurements, mixing was minimized and no bubbling was provided.
2.4. Delay Determination Experiments
The existence of a delay in growth response was determined by modifying 3 environmental conditions: light intensity (source of energy), total inorganic carbon concentration (TIC, carbon source), and ammonia concentration (inhibitor).
In the case of the energy source, step changes of incident light were applied, starting from an initial value of 245 µmoL m−2s−1. Three step changes were applied (see Table 1). After these step changes, the initial condition was restored.
For the carbon source, delay was determined following the response to pulses of TIC produced by dosing sodium bicarbonate. Two assays were performed, with pulses of 500 and 1200 mg L−1 TIC.
Finally, in the case of ammonia as an inhibitor, a step change in total ammonium nitrogen (TAN) was applied by manually dosing ammonium sulphate in order to keep the concentration at the desired level (Table 1).
In all cases, the response of the microalgae to changes in tested conditions was monitored by measuring the OPR. The photobioreactor was operated at an air bubbling rate in the range of 1–1.5 volume of air per volume of liquid per minute (vvm) to ensure proper mixing and to avoid biomass settling. Air bubbling was stopped during OPR determination.
2.5. Analytic Methods
Photosynthetically active radiation (PAR) radiation was determined using a handheld sensor (model LI-1400, LI-COR, Lincoln, NE, USA). Biomass concentration was measured by absorbance at 540 nm. The relation between absorbance and dry cellular weight (DCW) was established by a calibration curve. Concentration of total inorganic carbon was determined based on the measurements provided by a dissolved CO2 sensor (DCO2 GDX, Vernier, Beaverton, OR, USA). The concentration of total ammonium nitrogen was measured using Hach kits (Hach, Loveland, CO, USA).
2.6. Modelling of Microalgae Culture
When applying step changes in operational conditions, determination of delays can be done by the direct observation of the evolution of the tested response (OPR in this research). However, this is not as simple when pulses are applied, since the initial and final states are the same. Delays related to the carbon source were studied in this research by applying pulses, since it was not possible to produce a step change under the conditions of this study. It must be noted that TIC concentration is the dynamic result of different factors, such as desorption, consumption, and feed conditions.
In order to provide a tool to analyze the data coming from TIC pulses, simulations were performed. The model described by Decostere et al. [14] was used for this purpose. This model describes the growth of microalgae, considering inorganic carbon as the limiting nutrient. The model was modified in order to include a discrete delay (τ). The modified model is presented in Table 2. Model calibration was performed with data from a new assay, involving a pulse of 2000 mgTIC L−1. During this assay, concentrations of dissolved oxygen, pH, and CO2 were measured online using specific probes. The following parameters were fitted: the specific growth rate, the saturation constants, and the algal growth yields. The fitting process was done using a cost function for the minimization of the sum of squares of error between the measured and predicted data (normalized by the maximum value of the experimental data). The volumetric oxygen mass transfer coefficient and the endogenous respiration rate were measured experimentally in separate assays. The rest of the parameters were obtained from the literature (Table 3). Turbidostat used in this research performs discrete dilutions of the culture in order to keep the optical density constant. Such dilutions were considered in the model before fitting was performed.
3. Results and Discussion
3.1. Assays to Determine Delay: Source of Energy
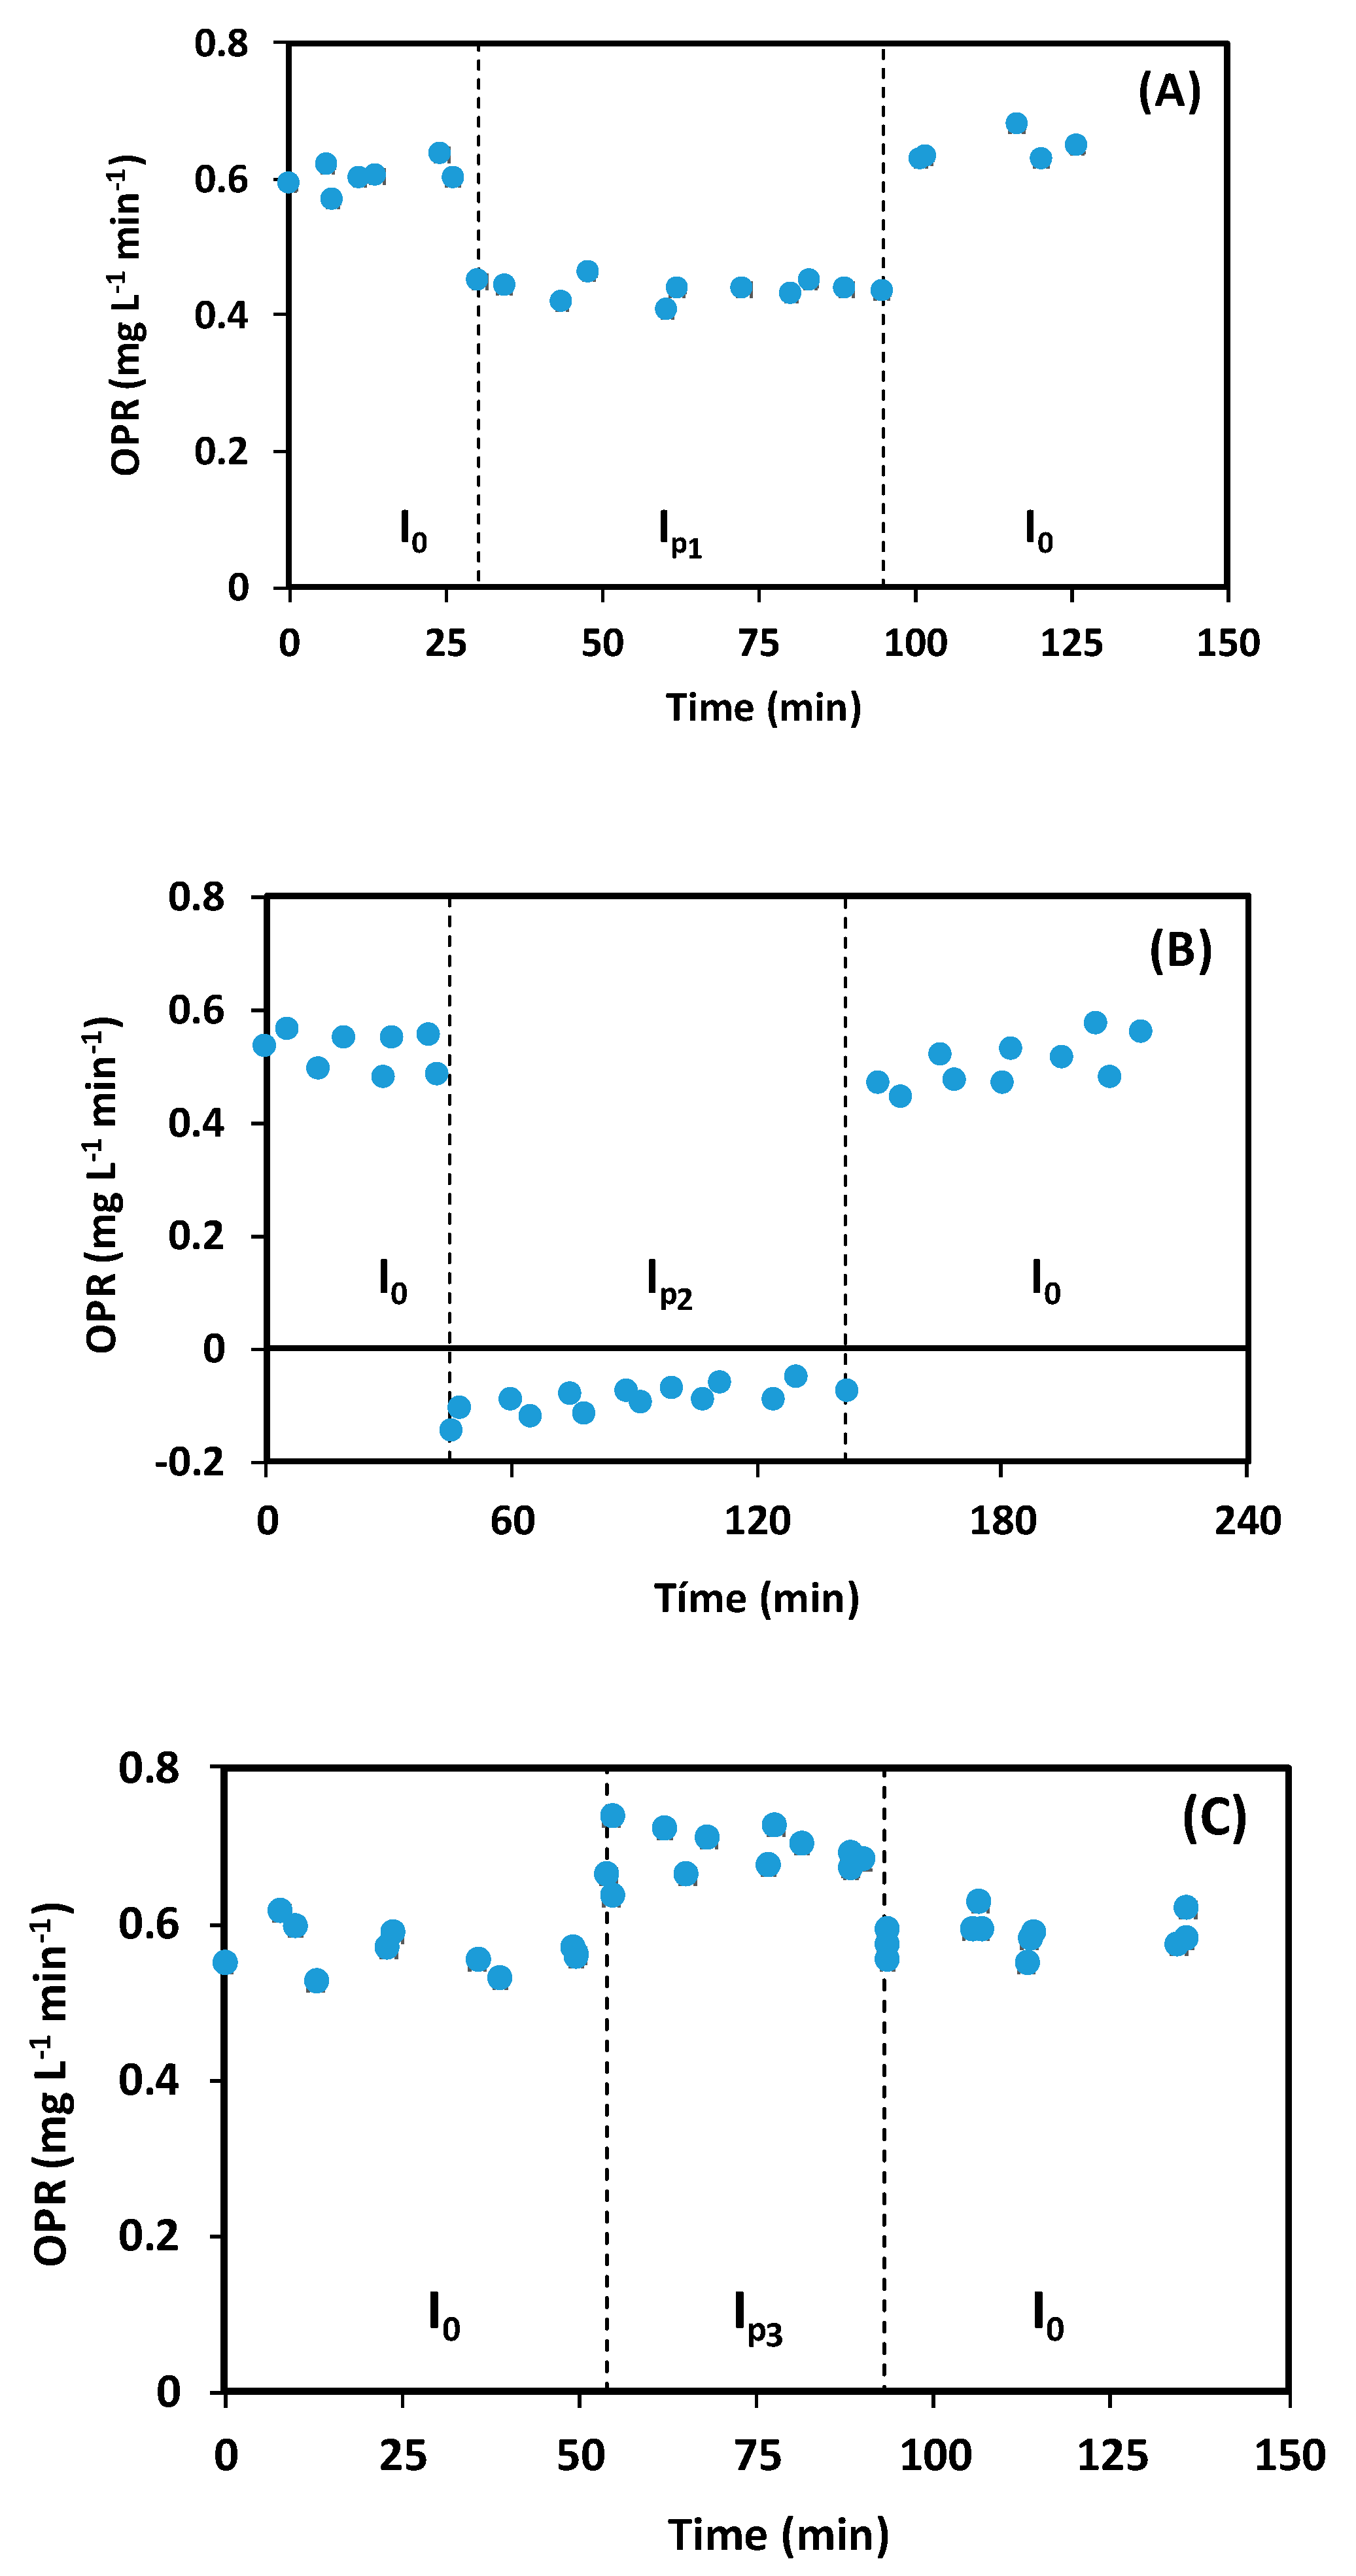
The evolution of OPR when microalgae undergo immediate changes in the incident light intensity is shown in Figure 2. Dotted lines in the charts indicate the moment when changes in incident light were applied. Biomass concentration during these assays remained in the range of 540–570 mgDCW L−1.
Figure 2A shows the behaviour when a 50% decrease in light was applied. During the first phase (I0 = 245 µmoL m−2 s−1), the OPR was 0.61 ± 0.04 mg O2 L−1 min−1. When the light intensity was decreased to 122 µmoL m−2 s−1, an instantaneous decrease in OPR was observed (28%). When the light intensity was returned to its original condition (after 100 min), the OPR increased back to 0.65 ± 0.02 mg O2 L−1 min−1. Analysis of data (Student’s t test with 95% confidence) showed that OPR before and after disturbance were not statistically different.
Figure 2B presents the system’s behaviour when light intensity was reduced to 0. During the first phase (I0 = 245 µmoL m−2 s−1), the OPR was 0.52 ± 0.01 mg O2 L−1 min−1. Immediately after the light was turned off, the OPR decreased by 117%. If no illumination is provided, the culture consumes oxygen [20]. This creates a negative OPR (oxygen is consumed and not produced), which was observed during the period when absence of light was applied. When the light was turned back on, OPR increased back to 0.50 ± 0.01 mg O2 L−1 min−1.
Figure 2C presents microorganism activity when the light intensity was increased by 50% (Ip3 = 367 µmoL m−2 s−1). Before the disturbance, the OPR was 0.56 ± 0.01 mg O2 L−1 min−1. After increasing the light intensity, a 20% increase in OPR was observed. When returning to the initial conditions, the OPR decreased to 0.58 ± 0.01 mg O2 L−1 min−1. Again, analysis of data (Student’s t with 95% confidence) showed that OPR values before and after the disturbance were not statistically different.
Analysis of the conditions tested shows that for changes in light intensity, no relevant delay response would exist. Light is a form of radiation that has traveling speeds of approximately 3 × 10⁸ m s−1. Light transfer inside a cell to the photosynthetic system is a physical phenomenon that microalgae do not regulate [21]. During described assays, response was determined by oxygen production and transfer to the liquid media. Absence of a significant delay means that cells react very quickly to stimulus derived from changes in light intensity, and that the metabolic response produces almost immediate changes in dissolved oxygen concentration. This means that OPR determination is a good way to follow changes in metabolic behaviour of microalgae, due to their low response times.
3.2. Assays to Determine Delay: Source of Carbon
Figure 3 presents the evolution of OPR as a result of bicarbonate pulses. Two assays are presented: a pulse generating 500 mgTIC L−1 and a pulse generating 1200 mgTIC L−1. In both cases, pulses were performed at time 0. Each condition was replicated twice. Biomass concentration and pH were 675 mgDCW L−1 and 7.5 ± 0.4, respectively, for the first condition (pulse of 500 mgTIC L−1); and 600 mgDCW L−1 and 7.5 ± 0.5, respectively, for the second condition (pulse of 1200 mgTIC L−1). Maximum activity (measured as OPR) was observed 30–50 min after pulses were performed. From the observation of the OPR evolution, the existence of a considerable delay is not evident.
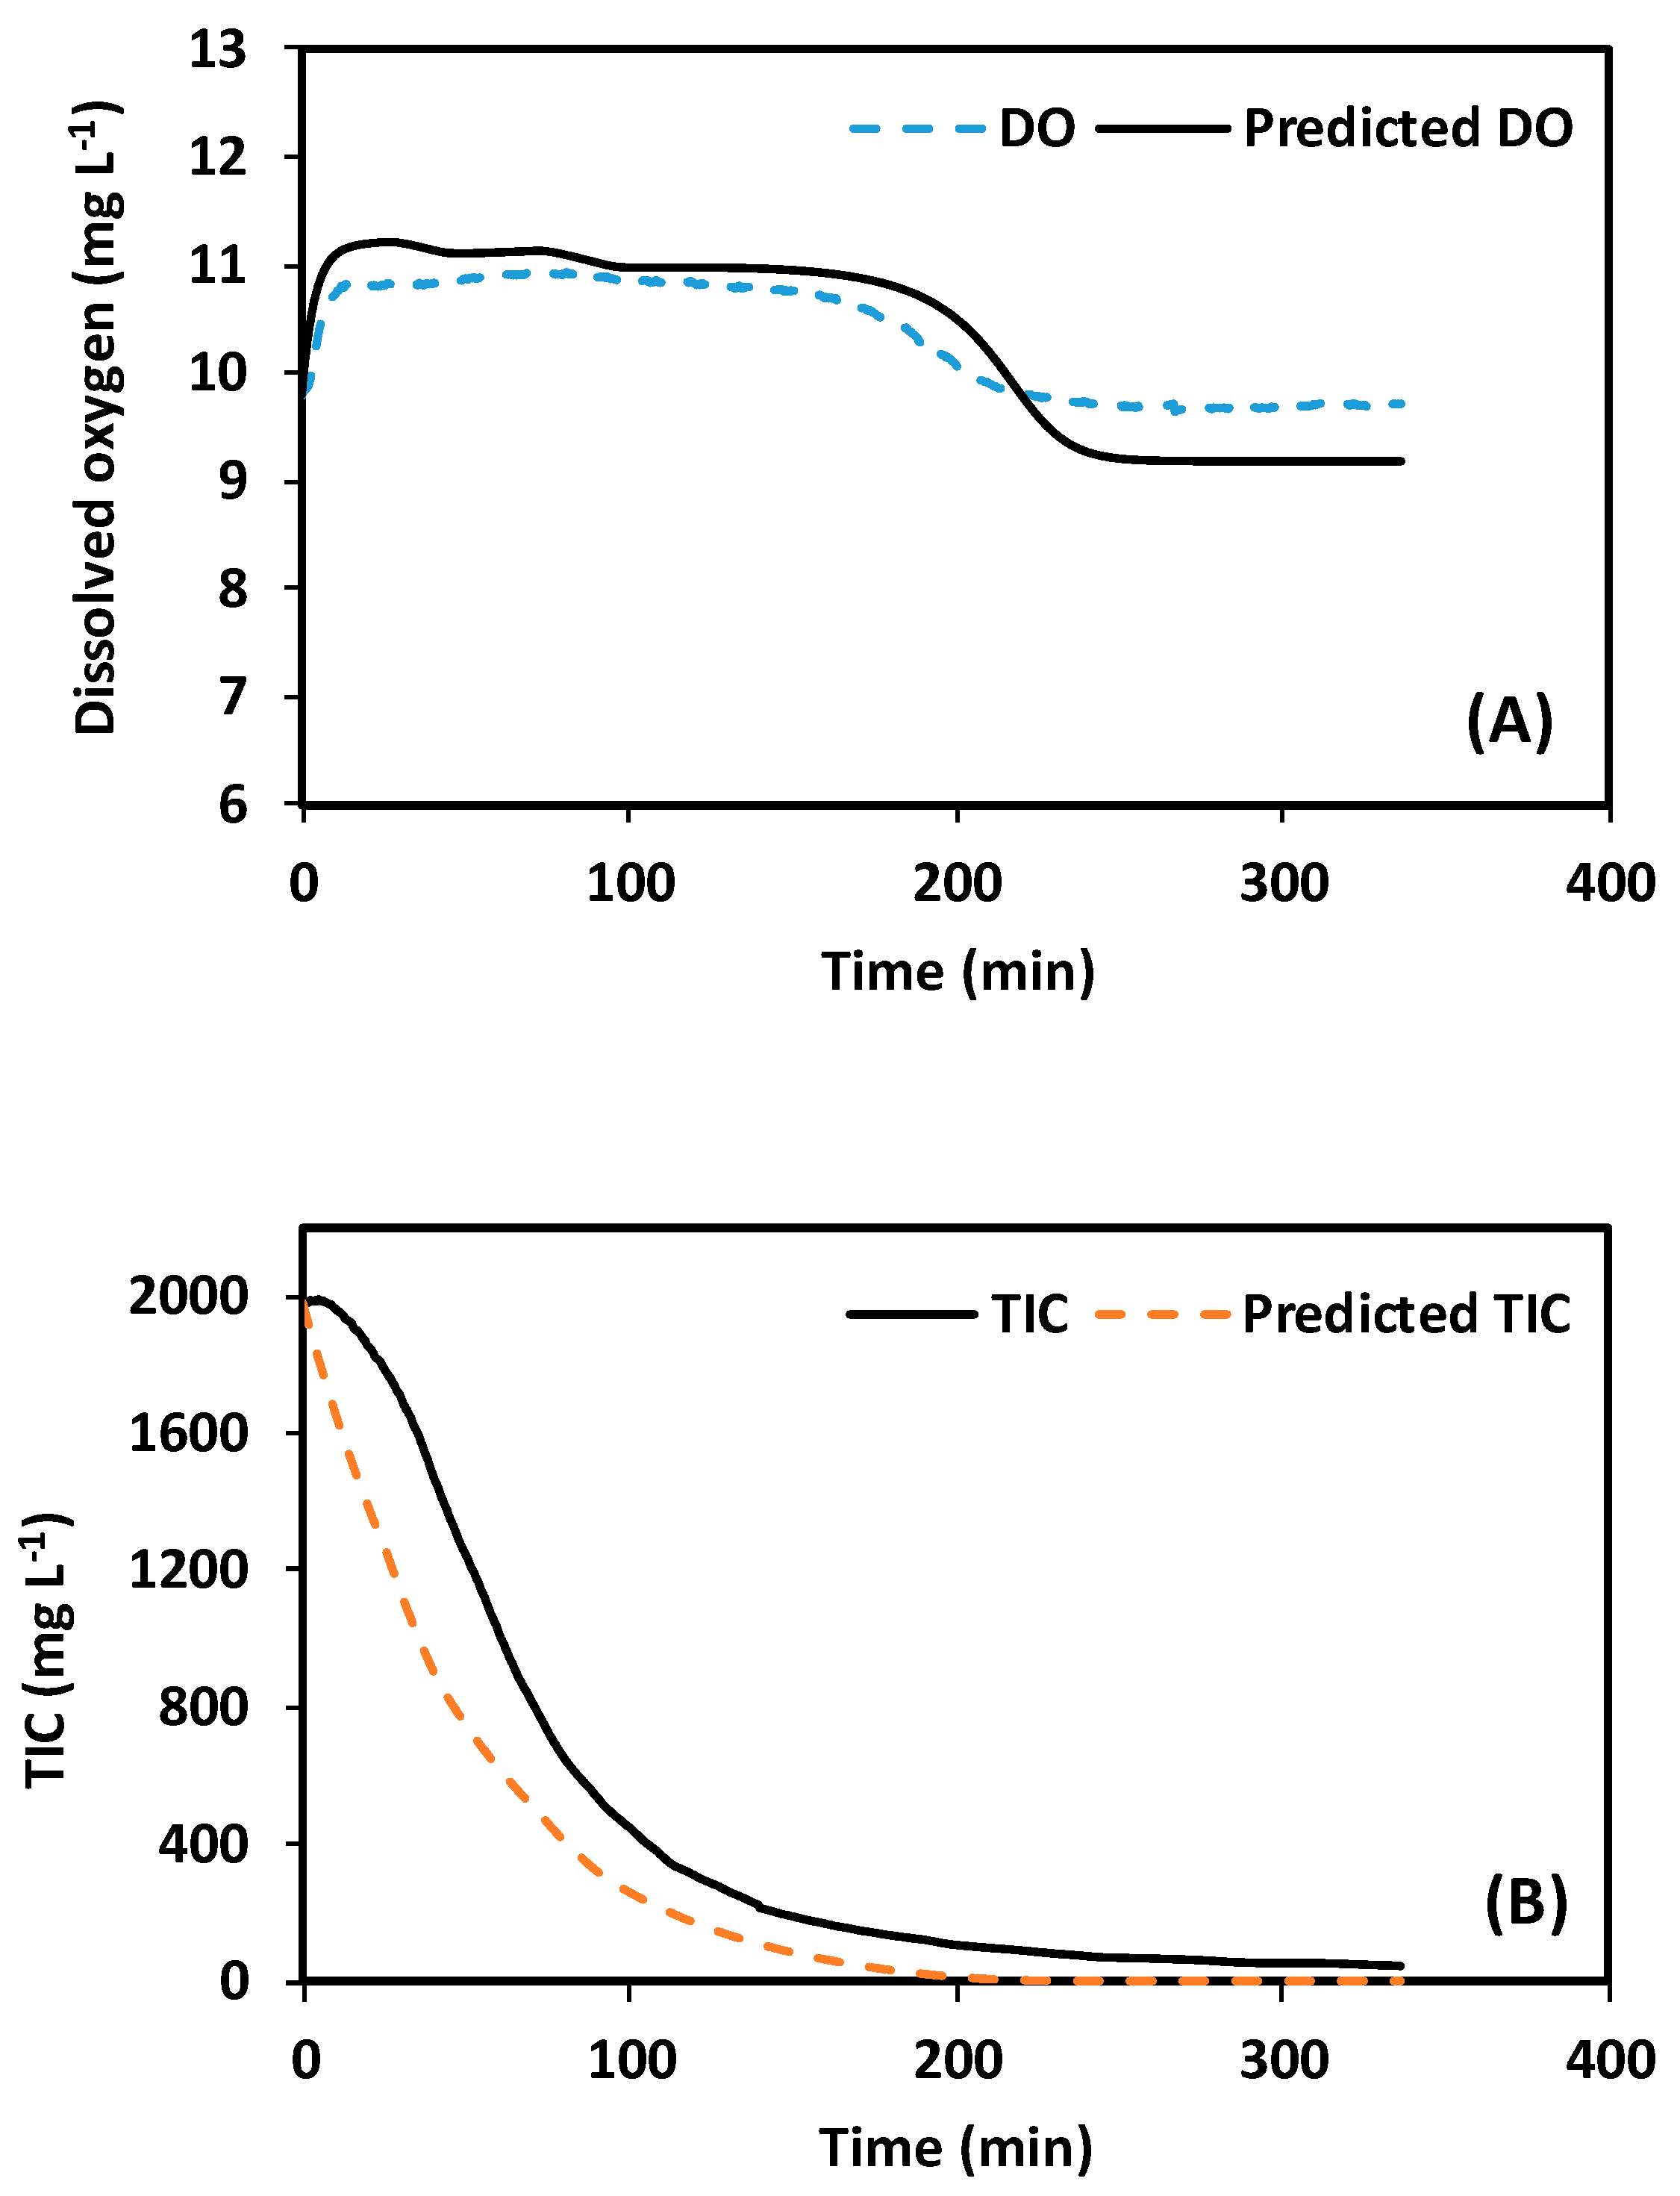
In order to further study the behavior of the system after TIC pulses, the model presented by Decostere et al. [14] was used as a tool. As already stated, the model was modified to consider a discrete delay (see Table 2) and was calibrated with an independent assay, involving a bicarbonate pulse of 2000 mgTIC L−1. Table 4 and Figure 4 present the results of the fitting process. The model can describe the DO and TIC profiles acceptably well. The Pearson correlation values for DO and TIC profiles were 0.93 and 0.97, respectively. Moreover, the cost function resulting from the fitting of the modified model was 33% less than with the fitting of the traditional model (without delay). The magnitude of the discrete delay was close to 5 min (see Table 4).
The fitted model, including the calculated discrete delay, was used to predict the behavior of the assays involving pulses of 500 and 1200 mgTIC L−1. Figure 3 presents these results. The Pearson correlation coefficients for OPR and TIC profiles were 0.981 and 0.984, respectively, for the 1200 mgTIC L−1 pulse. In the case of the 500 mgTIC L−1 pulse, the Pearson correlation coefficients were 0.90 and 0.95, respectively. In general terms, the model predicts the observed behavior well, even though parameters were obtained with a different data set. This good fit confirms that if delay exists, it would be of only a few minutes. This is in agreement with studies reporting that Chlorella strains exhibit substantial metabolic flexibility in response to environmental disturbance [22,23], possibly because cytoplasm and extracellular spaces are highly active in light conditions, where CO2 and HCO3− are shuttled from the cytoplasm to the chloroplast [24]. In this sense, Tu et al. [25] reported the presence of membrane transporter for HCO3− in Chlorella sp. LPF, closely related to Chlorella vulgaris.
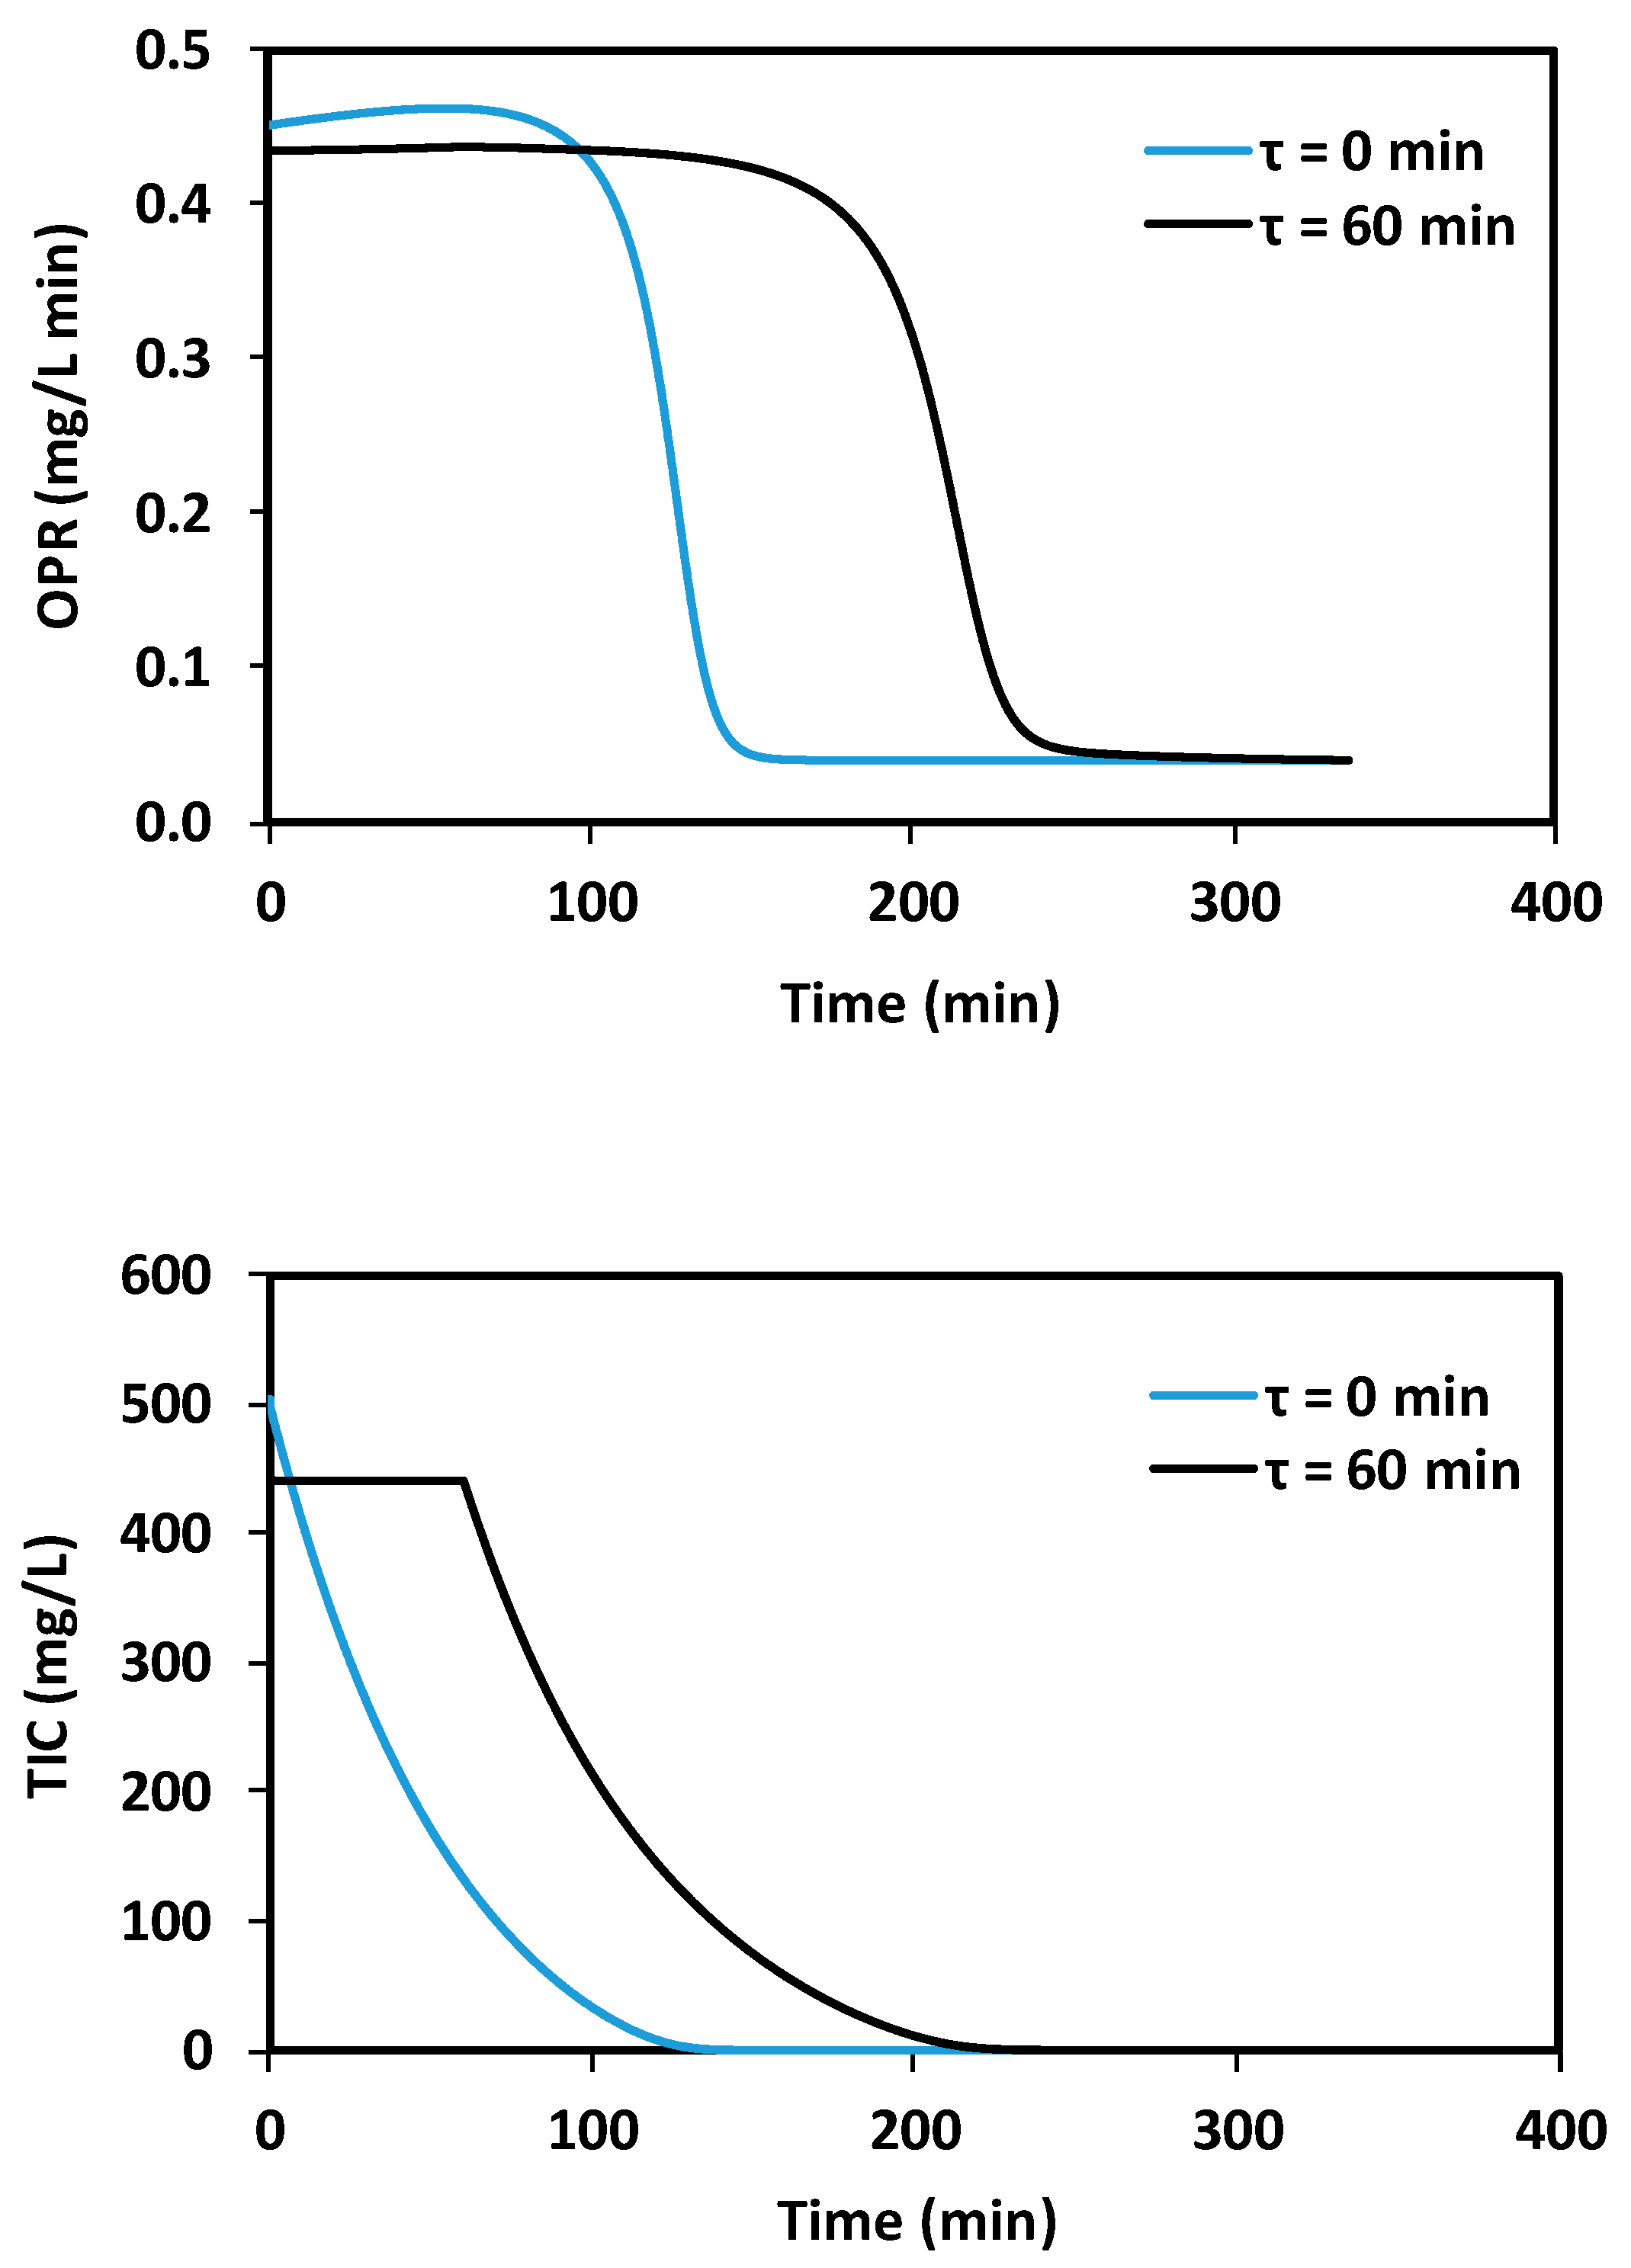
To visualize the effect of a larger delay on microalgae growth, the calibrated model was used to simulate two scenarios: no delay and 1 h discrete delay. Figure 5 presents the results of these simulations, considering a biomass concentration of 500 mgDCW L−1 and an inorganic carbon pulse (500 mgTIC L−1). Predicted OPR and TIC concentrations are presented. It can be seen that the existence of a discrete delay of 1 h creates great differences in behavior. It is inferred that when delays are present and significant, they can have a significant impact on the prediction accuracy of traditional kinetic models operating under dynamic conditions.
3.3. Assays to Determine Delay: Presence of Ammonia as an Inhibitor
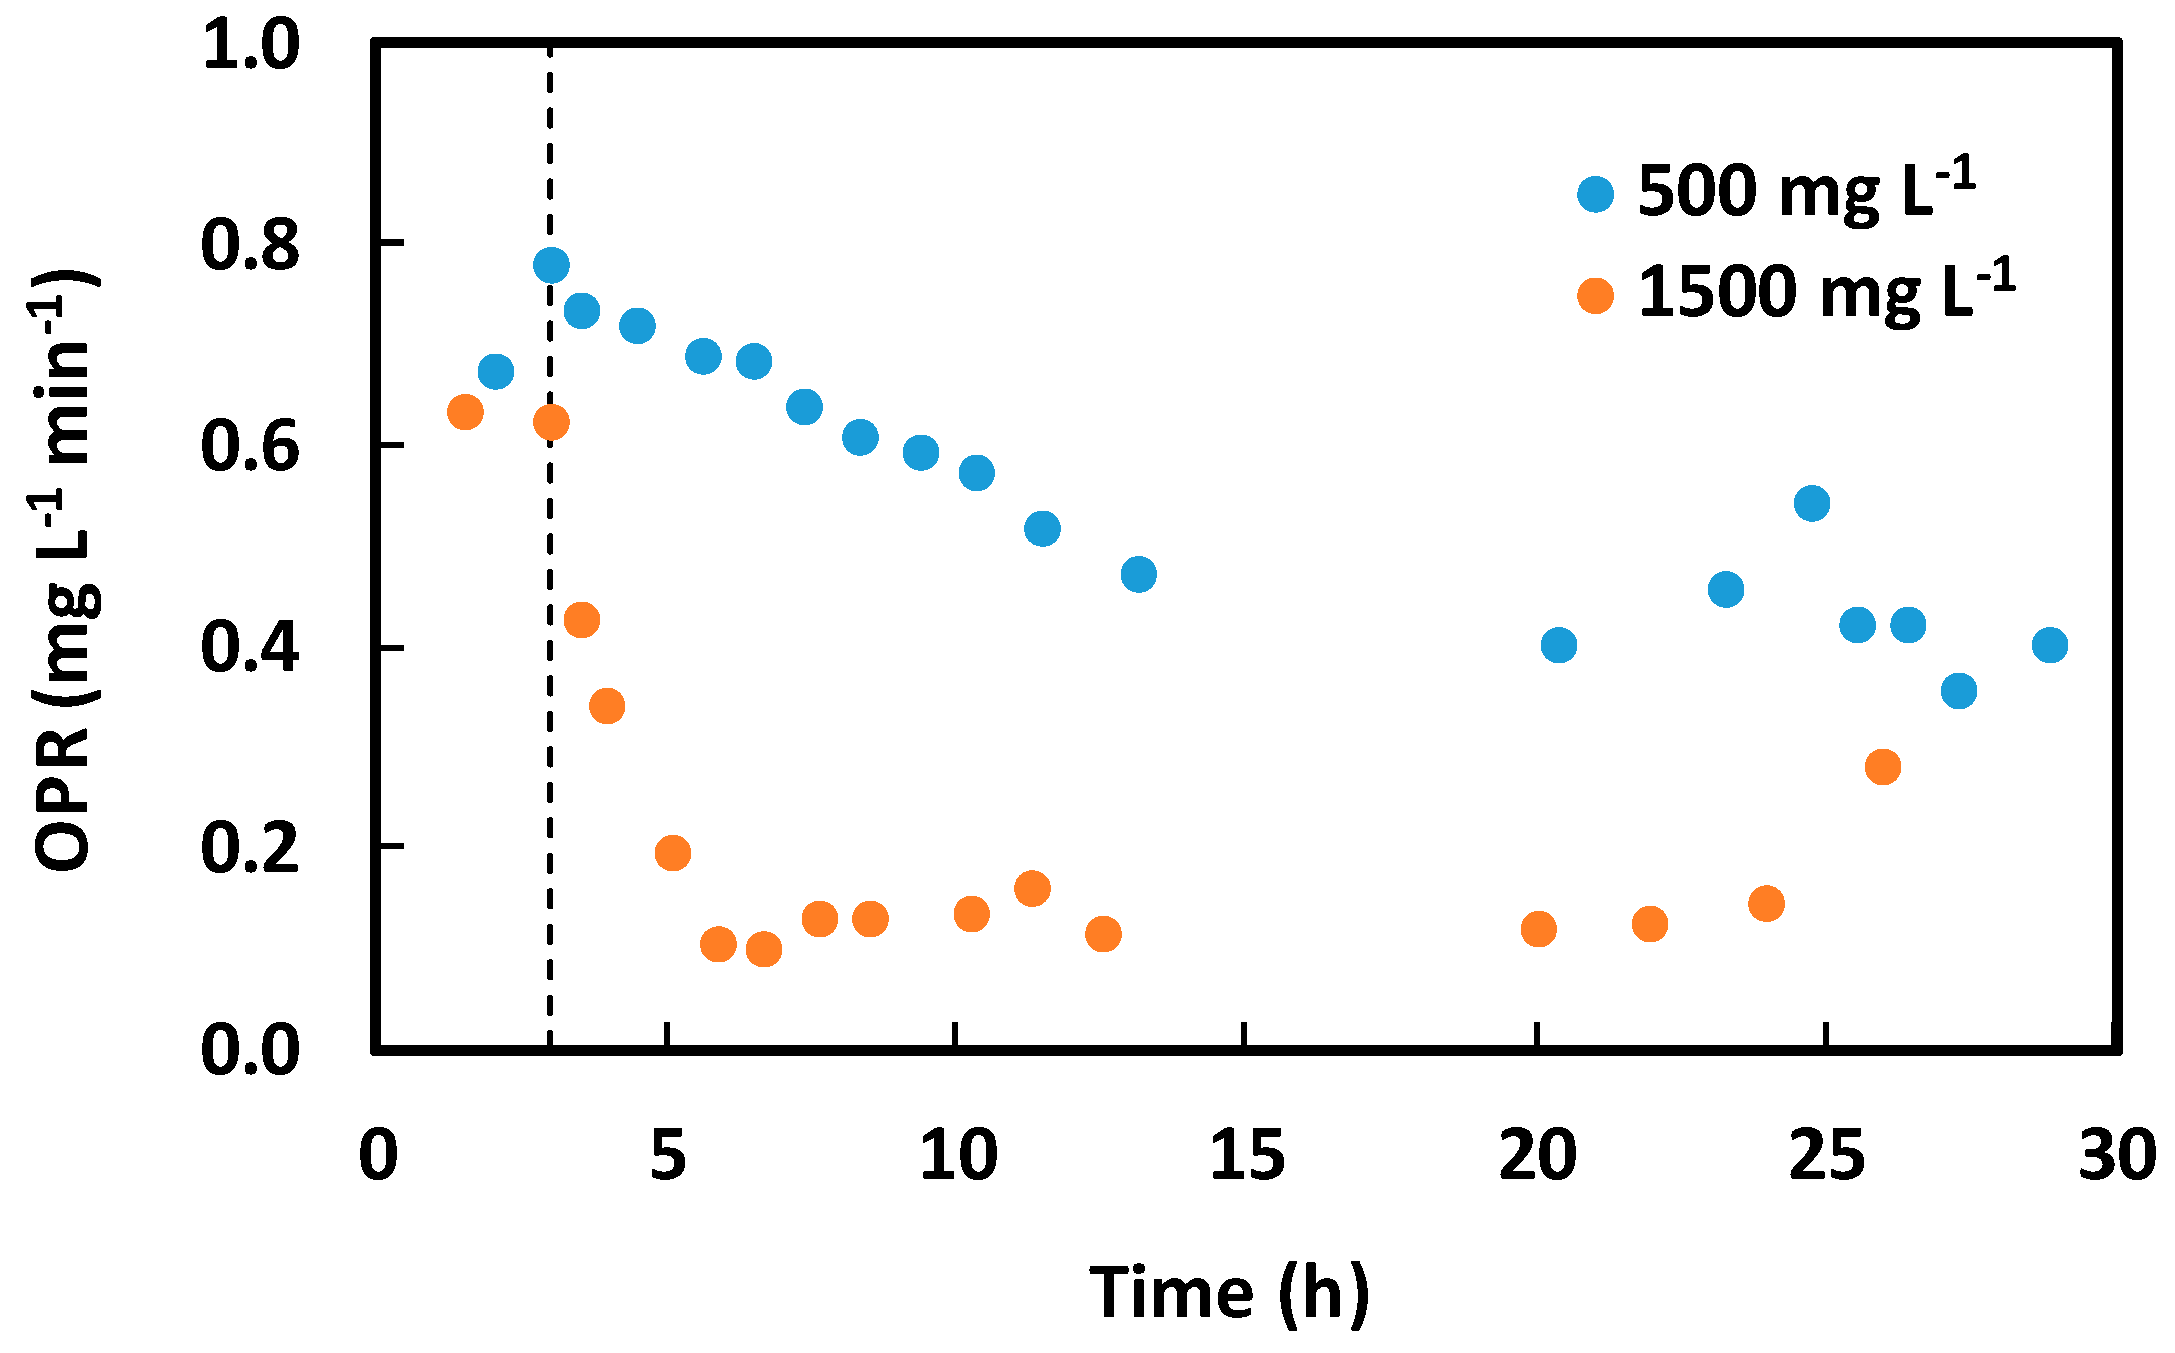
Figure 6 shows the evolution of OPR during the operation of the turbidostat, when the step increases in ammonia were performed. The dotted line indicates the moment when the step change was performed. The tested ammonia concentrations were 500 ± 100 and 1500 ± 100 mgTAN L−1. The biomass concentration was 600 ± 100 mgDCW L−1 and pH was 8.5 ± 0.2. As expected, in both cases, the presence of TAN induced a decrease in OPR, in accordance to results described by Segura et al. [4]. Figure 6 shows that inhibition was not instantaneous. Delays of about 10 and 3 h were observed for TAN concentrations of 500 and 1500 mgTAN L−1, respectively. Such values are lower than those reported by Segura et al. [4], who reported delays of 60 and 10 h for the same TAN concentrations when working with Chlorella sorokiniana. A complementary assay was performed, using a larger ammonia concentration of 2500 mgTAN L−1. In this case, changes were too fast to be represented by changes in OPR, so one could infer that the delay is only in the range of minutes under this high concentration of ammonia.
Results indicate that the magnitude of the delay seems to be related to the inhibitor concentration. The undissociated and uncharged ammonia molecule is lipid-soluble, so it can easily enter the cell through the membrane [26]. The magnitude of this passive transport of ammonia is concentration-dependent. The observed delays are, at least partially, the consequence of mass transfer limitation of ammonia from the environment to the intracellular space.
4. Conclusions
- Exposure of a microalgae culture of Chlorella vulgaris to changes in light intensity induced no delay of the microorganism response. This means that the effects of induced changes were observed immediately, or fast enough to prevent an apparent delay.
- OPR is a useful measurement to study microalgae cultivation dynamics, since it rapidly responds to changes in microalgae metabolism.
- When applying changes on TIC, a delay of few minutes was observed. The relevance of this delay may depend on the specific situation.
- A relevant delay was observed when applying changes to TAN concentration (inhibitor). The magnitude of the delay will depend on the magnitude of the applied changes and can take several hours.
Author Contributions
Conceptualization, D.J., C.V., and A.D.-B.; methodology, D.J., H.Z., C.V., and A.D.-B.; investigation, D.J., H.Z., and A.D.-B.; writing—original draft preparation, H.Z. and D.J.; writing—review and editing, H.Z., D.J., C.V., and A.D.-B.; project administration, D.J.; funding acquisition, D.J. and A.D.-B. All authors have read and agreed to the published version of the manuscript.
Funding
Authors want to thank the financial support provided by the Center for Water Resources for Agriculture and Mining (CONICYT/FONDAP/15130015).
Conflicts of Interest
The authors declare no conflict of interest.
References
- Heijen, J.; Romein, B. Derivation of Kinetic Equations for Growth on Single Substrates Based on General Properties of a Simple Metabolic Network. Biotechnol. Prog. 1995, 11, 712–716. [Google Scholar] [CrossRef]
- Richelle, A.; Bogaerts, P. Systematic methodology for bioprocess model identification based on generalized kinetic functions. Biochem. Eng. J. 2015, 100, 41–49. [Google Scholar] [CrossRef]
- Velayudhan, A. Overview of integrated models for bioprocess engineering. Curr. Opin. Chem. Eng. 2014, 6, 83–89. [Google Scholar] [CrossRef]
- Segura, C.; Vergara, C.; Seeger, M.; Donoso-Bravo, A.; Jeison, D. When constants are no longer constant: The case of inhibition in bioprocesses. Biochem. Eng. J. 2017, 123, 24–28. [Google Scholar] [CrossRef]
- Xiu, Z.; Song, B.; Sun, L.; Zeng, A. Theoretical analysis of effects of metabolic overflow and time delay on the performance and dynamic behavior of a two-stage fermentation process. Biochem. Eng. J. 2002, 11, 101–109. [Google Scholar] [CrossRef]
- Weber, J.; Kayser, A.; Rinas, U. Metabolic flux analysis of Escherichia coli in glucose-limited continuous culture. II. Dynamic response to famine and feast, activation of the methylglyoxal pathway and oscillatory behavior. Microbiology 2005, 151, 707–716. [Google Scholar] [CrossRef] [Green Version]
- Russell, J.B.; Cook, G.M. Energetics of bacterial growth: Balance of anabolic and catabolic reactions. Microbiol. Rev. 1995, 59, 48–62. [Google Scholar] [CrossRef] [Green Version]
- Yao, Y.; Li, Z.; Liu, Z. Hopf bifurcation analysis of a turbidostat model with discrete delay. Appl. Math. Comput. 2015, 262, 267–281. [Google Scholar] [CrossRef]
- Caperon, J. Time Lag in Population Growth Response of Isochrysis Galbana to a Variable Nitrate Environment. Ecology 1969, 50, 188–192. [Google Scholar] [CrossRef]
- Ellermeyer, S.; Hendrix, J.; Ghoochan, N. A theoretical and empirical investigation of delayed growth response in the continuous culture of bacteria. J. Theor. Biol. 2003, 222, 485–494. [Google Scholar] [CrossRef]
- Kelly, C.; Jones, O.; Barnhart, C.; Lajoie, C. Effect of furfural, vanillin and syringaldehyde on Candida guilliermondii growth and xylitol biosynthesis. Appl. Biochem. Biotechnol. 2008, 148, 97–108. [Google Scholar] [CrossRef] [PubMed]
- Munna, M.S.; Humayun, S.; Noor, R. Influence of heat shock and osmotic stresses on the growth and viability of Saccharomyces cerevisiae SUBSC01. BMC Res. Notes 2015, 8, 369. [Google Scholar] [CrossRef] [PubMed]
- Lam, M.K.; Lee, K.T. Microalgae biofuels: A critical review of issues, problems and the way forward. Biotechnol. Adv. 2012, 30, 673–690. [Google Scholar] [CrossRef] [PubMed]
- Decostere, B.; Janssens, N.; Alvarado, A.; Maere, T.; Goethals, P.; Van Hulle, S.W.; Nopens, I. A combined respirometer-titrimeter for the determination of microalgae kinetics: Experimental data collection and modelling. Chem. Eng. J. 2013, 222, 85–93. [Google Scholar] [CrossRef]
- Garcia-Ochoa, F.; Gomez, E. Bioreactor scale-up and oxygen transfer rate in microbial processes: An overview. Biotechnol. Adv. 2009, 27, 153–176. [Google Scholar] [CrossRef] [PubMed]
- Luangpipat, T.; Chisti, Y. Biomass and oil production by Chlorella vulgaris and four other microalgae—Effects of salinity and other factors. J. Biotechnol. 2017, 257, 47–57. [Google Scholar] [CrossRef]
- Gehring, T.; Silva, J.D.; Kehl, O.; Castilhos, A.B.; Costa, R.H.; Uhlenhut, F.; Alex, J.; Horn, H.; Wichern, M. Modelling waste stabilisation ponds with an extended version of ASM3. Water Sci. Technol. 2010, 61, 713–720. [Google Scholar] [CrossRef]
- Chen, Y.; Zhang, L.; Xu, C.; Vaidyanathan, S. Dissolved inorganic carbon speciation in aquatic environments and its application to monitor algal carbon uptake. Sci. Total Environ. 2016, 541, 1282–1295. [Google Scholar] [CrossRef]
- Wolf, G.; Picioreanu, C.; van Loosdrecht, M.C.M. Kinetic Modeling of Phototrophic Biofilms: The PHOBIA Model. Biotechnol. Bioeng. 2006, 5, 1064–1079. [Google Scholar] [CrossRef]
- Masojídek, J.; Koblizek, M.; Torzillo, G. Photosynthesis in Microalgae, in Handbook of Microalgal Culture: Biotechnology and Applied Phycology; Richmond, A., Ed.; Blackwel Science: Oxford, UK, 2004; pp. 20–37. [Google Scholar]
- Falkowski, P.; Raven, J. Aquatic Photosyntesis; Blackwell Science Ltd.: Boston, MA, USA, 1997. [Google Scholar]
- Liu, C.; Chang, C.; Liao, Q.; Zhu, X.; Chang, J. Photoheterotrophic growth of Chlorella vulgaris ESP6 on organic acids from dark hydrogen fermentation effluents. Bioresour. Technol. 2013, 145, 331–336. [Google Scholar] [CrossRef]
- Mitra, D.; van Leeuwen, J.H.; Lamsal, B. Heterotrophic/mixotrophic cultivation of oleaginous Chlorella vulgaris on industrial co-products. Algal Res. 2012, 1, 40–48. [Google Scholar] [CrossRef]
- Zuñiga, C.; Li, C.; Huelsman, T.; Levering, J.; Zielinski, D.C. Genome-scale metabolic model for the green alga Chlorella vulgaris UTEX accurately predicts phenotypes under autotrophic, Short title: Metabolic model of Chlorella vulgaris accurately predicts increased growth rates. Plant Physiol. 2016, 172, 589–602. [Google Scholar] [CrossRef] [PubMed] [Green Version]
- Tu, Z.; Liu, L.; Lin, W.; Xie, Z.; Luo, J. Potential of using sodium bicarbonate as external carbon source to cultivate microalga in non-sterile condition. Bioresour. Technol. 2018, 266, 109–115. [Google Scholar] [CrossRef] [PubMed]
- Collos, Y.; Harrison, P.J. Acclimation and toxicity of high ammonium concentrations to unicellular algae. Mar. Pollut. Bull. 2014, 80, 8–23. [Google Scholar] [CrossRef]
Figure 1.
A schematic illustration of a flat panel photobioreactor operated as a turbidostat.

Figure 2.
Evolution of microbial activity measured as the oxygen production rate (OPR) when the light intensity was changed. Note: I0 = 245 µmoL m−2 s−1, Ip1 = 122 µmoL m−2 s−1, Ip2 = 0 µmoL m−2 s−1, Ip3 = 367 µmoL m−2 s−1.
Figure 2.
Evolution of microbial activity measured as the oxygen production rate (OPR) when the light intensity was changed. Note: I0 = 245 µmoL m−2 s−1, Ip1 = 122 µmoL m−2 s−1, Ip2 = 0 µmoL m−2 s−1, Ip3 = 367 µmoL m−2 s−1.

Figure 3.
Evolution of OPR during total inorganic carbon (TIC) pulses of 500 and 1200 mgTIC L−1. Error bars represent the standard deviation between duplicates. Predicted OPR represents data provided by the fitted tested model.
Figure 3.
Evolution of OPR during total inorganic carbon (TIC) pulses of 500 and 1200 mgTIC L−1. Error bars represent the standard deviation between duplicates. Predicted OPR represents data provided by the fitted tested model.

Figure 4.
Comparison of experimental and predicted data during the assay performed for model fitting. Conditions: TIC pulses of 2000 mg L−1, 600 mgDCW L−1, and pH 7.5. (A) dissolved oxygen (DO) profile. (B) TIC profile.
Figure 4.
Comparison of experimental and predicted data during the assay performed for model fitting. Conditions: TIC pulses of 2000 mg L−1, 600 mgDCW L−1, and pH 7.5. (A) dissolved oxygen (DO) profile. (B) TIC profile.

Figure 5.
Simulations of OPR and TIC evolution as a response of a pulse of 500 mgTIC L−1 (at time 0), with no delay and 60 min delay (τ).
Figure 5.
Simulations of OPR and TIC evolution as a response of a pulse of 500 mgTIC L−1 (at time 0), with no delay and 60 min delay (τ).

Figure 6.
Evolution of microbial activity measured as the oxygen production rate (OPR) when applying constant total ammonia nitrogen concentrations of 500 and 1500 mg L−1. Biomass concentration: 600 mgDCW L−1, pH: 8.5.
Figure 6.
Evolution of microbial activity measured as the oxygen production rate (OPR) when applying constant total ammonia nitrogen concentrations of 500 and 1500 mg L−1. Biomass concentration: 600 mgDCW L−1, pH: 8.5.


Table 1.
Description of assays realized for disturbances of environmental conditions.
| Incident Light (Photosynthetically Active Radiation, PAR) Steps Changes (µmoL m−2 s−1) | Carbon Sources Pulses (mgTIC L−1) | Exposure to TAN (Total Ammonium Nitrogen) Steps (mgTAN L−1) |
|---|---|---|
| 245 → 122 (−50%) | 500 | 0 → 500 |
| 245 → 0 | 1200 | 0 → 1500 |
| 245 → 367 (+50%) | 0 → 2500 |
Table 2.
The Gujer matrix for the modified algal growth model.
| Process | dx/dt | Process Rate | ||||
|---|---|---|---|---|---|---|
| 1. Growth on | ||||||
| 2. Growth on | ||||||
| 3. Microalgae decay | −1 | |||||
| 4.Transfer rate | 1 | |||||
| 5.Transfer rate | 1 | |||||
| 6. hydratation | 61 | −44 | ||||
| 7. dissociation | −61 | 60 | ||||
| 8. Endogenous respiration | −1 |
Table 3.
Parameters used in the model described in Table 2.
Table 3.
Parameters used in the model described in Table 2.
| Parameter | Description | Assigned Value | Reference |
|---|---|---|---|
| µmax | Maximum growth rate | 0.1–11 (d−1) * | [16] |
| bmax | Maximum decay rate | 0.01 (d−1) | [14] |
| re | Endogenous respiration | 0.0581 (d−1) ** | This study |
| Global mass transfer coefficient for O2 | 345 (d−1) | This study | |
| Biomass/HCO3− yield | 0.5–0.6 (gDCW g−1HCO3−) * | [14] | |
| Biomass/CO2 yield | 0.7–0.8 (gDCW g−1CO2) * | [14] | |
| Oxygen/biomass yield | 1.2–1.3 (gO2 g−1DCW) * | [14] | |
| Half saturation constant for growth on HCO3− | 0.061–6.1 (g HCO3− m−3) * | [14] | |
| Half saturation constant for growth on CO2 | 0.044–4.44 (g CO2 m−3)* | [14] | |
| k1 | Reaction rate for hydration of CO2 | 10,000 (d−1) | [17] |
| k2 | Reaction rate for dissociation of HCO3− | 10,000 (d−1) | [17] |
| pK1 | Dissociation constant | 6.36 | [18] |
| pK2 | Dissociation constant | 10.33 | [18] |
| Diffusion coefficient of O2 in water | 1.65 × 10⁻⁴ (m3 d−1) | [19] | |
| Diffusion coefficient of CO2 in water | 1.73 × 10⁻⁴ (m3 d−1) | [19] |
Note: * Parameter determined by fitting; ** parameter determined by measuring the oxygen consumption rate in the absence of light.
Table 4.
Values of parameters fitted using data from the 2000 mgTIC L−1 pulse (Figure 4).
Table 4.
Values of parameters fitted using data from the 2000 mgTIC L−1 pulse (Figure 4).
| Parameter | Units | Value |
|---|---|---|
| µmáx | (d−1) | 0.682 |
| gDCW g−1 HCO3− | 0.559 | |
| gDCW g−1CO2 | 0.785 | |
| gO2 g−1DCW | 1.24 | |
| mg L−1 | 4.96 | |
| mg L−1 | 0.370 | |
| Delay | min | 5.17 |
| R2 DO | 0.93 | |
| R2 TIC | 0.97 | |
| Cost function | 40.1 |
© 2020 by the authors. Licensee MDPI, Basel, Switzerland. This article is an open access article distributed under the terms and conditions of the Creative Commons Attribution (CC BY) license (http://creativecommons.org/licenses/by/4.0/).
Share and Cite
MDPI and ACS Style
Zúñiga, H.; Vergara, C.; Donoso-Bravo, A.; Jeison, D. Effect of Delays on the Response of Microalgae When Exposed to Dynamic Environmental Conditions. Processes 2020, 8, 87. https://0-doi-org.brum.beds.ac.uk/10.3390/pr8010087
AMA Style
Zúñiga H, Vergara C, Donoso-Bravo A, Jeison D. Effect of Delays on the Response of Microalgae When Exposed to Dynamic Environmental Conditions. Processes. 2020; 8(1):87. https://0-doi-org.brum.beds.ac.uk/10.3390/pr8010087
Chicago/Turabian StyleZúñiga, Héctor, Christian Vergara, Andrés Donoso-Bravo, and David Jeison. 2020. "Effect of Delays on the Response of Microalgae When Exposed to Dynamic Environmental Conditions" Processes 8, no. 1: 87. https://0-doi-org.brum.beds.ac.uk/10.3390/pr8010087
Note that from the first issue of 2016, this journal uses article numbers instead of page numbers. See further details here.