Detection of Drivers’ Anxiety Invoked by Driving Situations Using Multimodal Biosignals


1
Department of Human Factors Engineering, Ulsan National Institute of Science and Technology, Ulsan 44919, Korea
2
Intelligent Robotics Research Division, Electronics and Telecommunications Research Institute, Daejeon 34129, Korea
*
Author to whom correspondence should be addressed.
Processes 2020, 8(2), 155; https://0-doi-org.brum.beds.ac.uk/10.3390/pr8020155
Submission received: 10 November 2019
/
Revised: 11 January 2020
/
Accepted: 21 January 2020
/
Published: 25 January 2020
(This article belongs to the Special Issue Big Data in Biology, Life Sciences and Healthcare)
Abstract
:It has become increasingly important to monitor drivers’ negative emotions during driving to prevent accidents. Despite drivers’ anxiety being critical for safe driving, there is a lack of systematic approaches to detect anxiety in driving situations. This study employed multimodal biosignals, including electroencephalography (EEG), photoplethysmography (PPG), electrodermal activity (EDA) and pupil size to estimate anxiety under various driving situations. Thirty-one drivers, with at least one year of driving experience, watched a set of thirty black box videos including anxiety-invoking events, and another set of thirty videos without them, while their biosignals were measured. Then, they self-reported anxiety-invoked time points in each video, from which features of each biosignal were extracted. The logistic regression (LR) method classified single biosignals to detect anxiety. Furthermore, in the order of PPG, EDA, pupil, and EEG (easiest to hardest accessibility), LR classified accumulated multimodal signals. Classification using EEG alone showed the highest accuracy of 77.01%, while other biosignals led to a classification with accuracy no higher than the chance level. This study exhibited the feasibility of utilizing biosignals to detect anxiety invoked by driving situations, demonstrating benefits of EEG over other biosignals.
1. Introduction
The emotional state during driving is related to driving safety and comfort [1,2]. Negative emotions, especially, can have a serious impact on driving performance, resulting in an increase in the risk of accidents. For example, anger is directly linked to vehicle accidents, and anxiety interferes with concentration on driving [3]. Some studies showed that negative emotions can be regulated by feedback from in-vehicle agents [4,5], which suggests that it is essential to identify the emotional state of a driver to give appropriate feedback.
It has already been revealed, that changes in physiological features such as electroencephalography (EEG), photoplethysmography (PPG), electrodermal activity (EDA), and eye-related features are more suitable than a subjective questionnaire in stress detection [6,7]. Similarly, many studies have attempted to recognize a driver’s emotional state using biosignals, without self-expression of emotions by the driver [8,9,10,11,12,13]. Some studies measured the physiological outcomes of autonomic nervous systems such as heart rates and skin conductance and used them to infer the level of stress in driving situations [8,9,10], while others also inspected traffic situations (e.g., crash) since drivers’ internal emotional state can be changed significantly by external events [11,12,14,15]. For instance, a study revealed that an attention reaction level represented by skin conductance response increased with an accident risk level (i.e., external driving environment), regardless of individual trait anxiety levels (i.e., internal state) [14]. Likewise, drivers are affected by environmental dynamics, which gives rise to the demand on detection of a driver’s emotion invoked from external driving situations.
Although driving anxiety is one of the emotions most influential to driving safety [16], few studies have measured the physiological [14] and neural responses [15] of anxiety compared to other negative emotions [8,9,10,11,12]. In addition, the previous studies determined the onset of anxiety as being spread over an entire video clip [12], or as identical across subjects [14,15]. However, due to variability of driving experiences and personal traits, individual drivers may start to feel anxiety at different time points.
Therefore, in the present study, we aimed to detect driving anxiety using biosignals measured at individualized anxiety onset. In addition, we investigated how combining multiple biosignals could improve such detection. For this purpose, we extracted features from four different biosignals: Electroencephalography (EEG), photoplethysmography (PPG), electrodermal activity (EDA) and pupil size (PS). As a detection algorithm, we built and trained a classifier based on the data of individual subjects and used it to classify biosignals into either a normal or anxiety state.
We confirmed that classification of EEG outperformed that of other signals in terms of average accuracy and weights in the classification model. Classifiers tended to utilize frontal theta, alpha and gamma powers of EEG to detect anxiety-invoked situations. Furthermore, adding other biosignals such as EDA or pupil size to EEG further enhanced the detection performance in some participants. Our findings contribute to the ability to extract feasible biosignals and reveal cognitive processes related to driving anxiety.
2. Materials and Methods
2.1. Participants and Stimuli
Thirty-one university students with normal vision were recruited who had maintained their driver licenses for at least one year since they obtained them (15 females, 16 males, mean age 23.26 ± 1.93 years, mean license possession period 19.62 ± 11.84 months). The participants in the present study were different from our previous study that used the same stimuli [15]. This study was carried out in accordance with the recommendations of the Institutional Review Board of the Ulsan National Institute of Science and Technology (UNISTIRB-18-45-C) with written informed consent from all participants. After experiments, eight participants were excluded from data analysis because in more than 80% of trials, one or more biosignal data points was found to be in poor quality.
Three anxiety-invoking external events during driving were used in this study: A sudden jaywalker, a sudden entry of a vehicle including bicycle, and a speeding vehicle passing by. These events were chosen using the risk criteria in the Hazard Perception Test provided by England Driver and the Vehicle Standard Agency [17]. We collected thirty 30 s driver perspective video clips from YouTube, which contained one of the three anxiety-invoking events above. Each video clip included one anxiety-invoking event (video of anxiety: VA). We also collected another set of thirty 30 s driver perspective video clips from YouTube that did not include any anxiety-invoking events but presented driving at normal speed (video of normal condition: VN). The anxiety-invoking events started on average at 12.73 s (S.D. 5.77 s) and lasted for 2.87 s (S.D. 1.20 s) (Table A1). The start time was determined when an anxiety-related object appeared in the video and the lasting time elapsed from the start time to the time point when the object disappeared.
2.2. Experimental Task
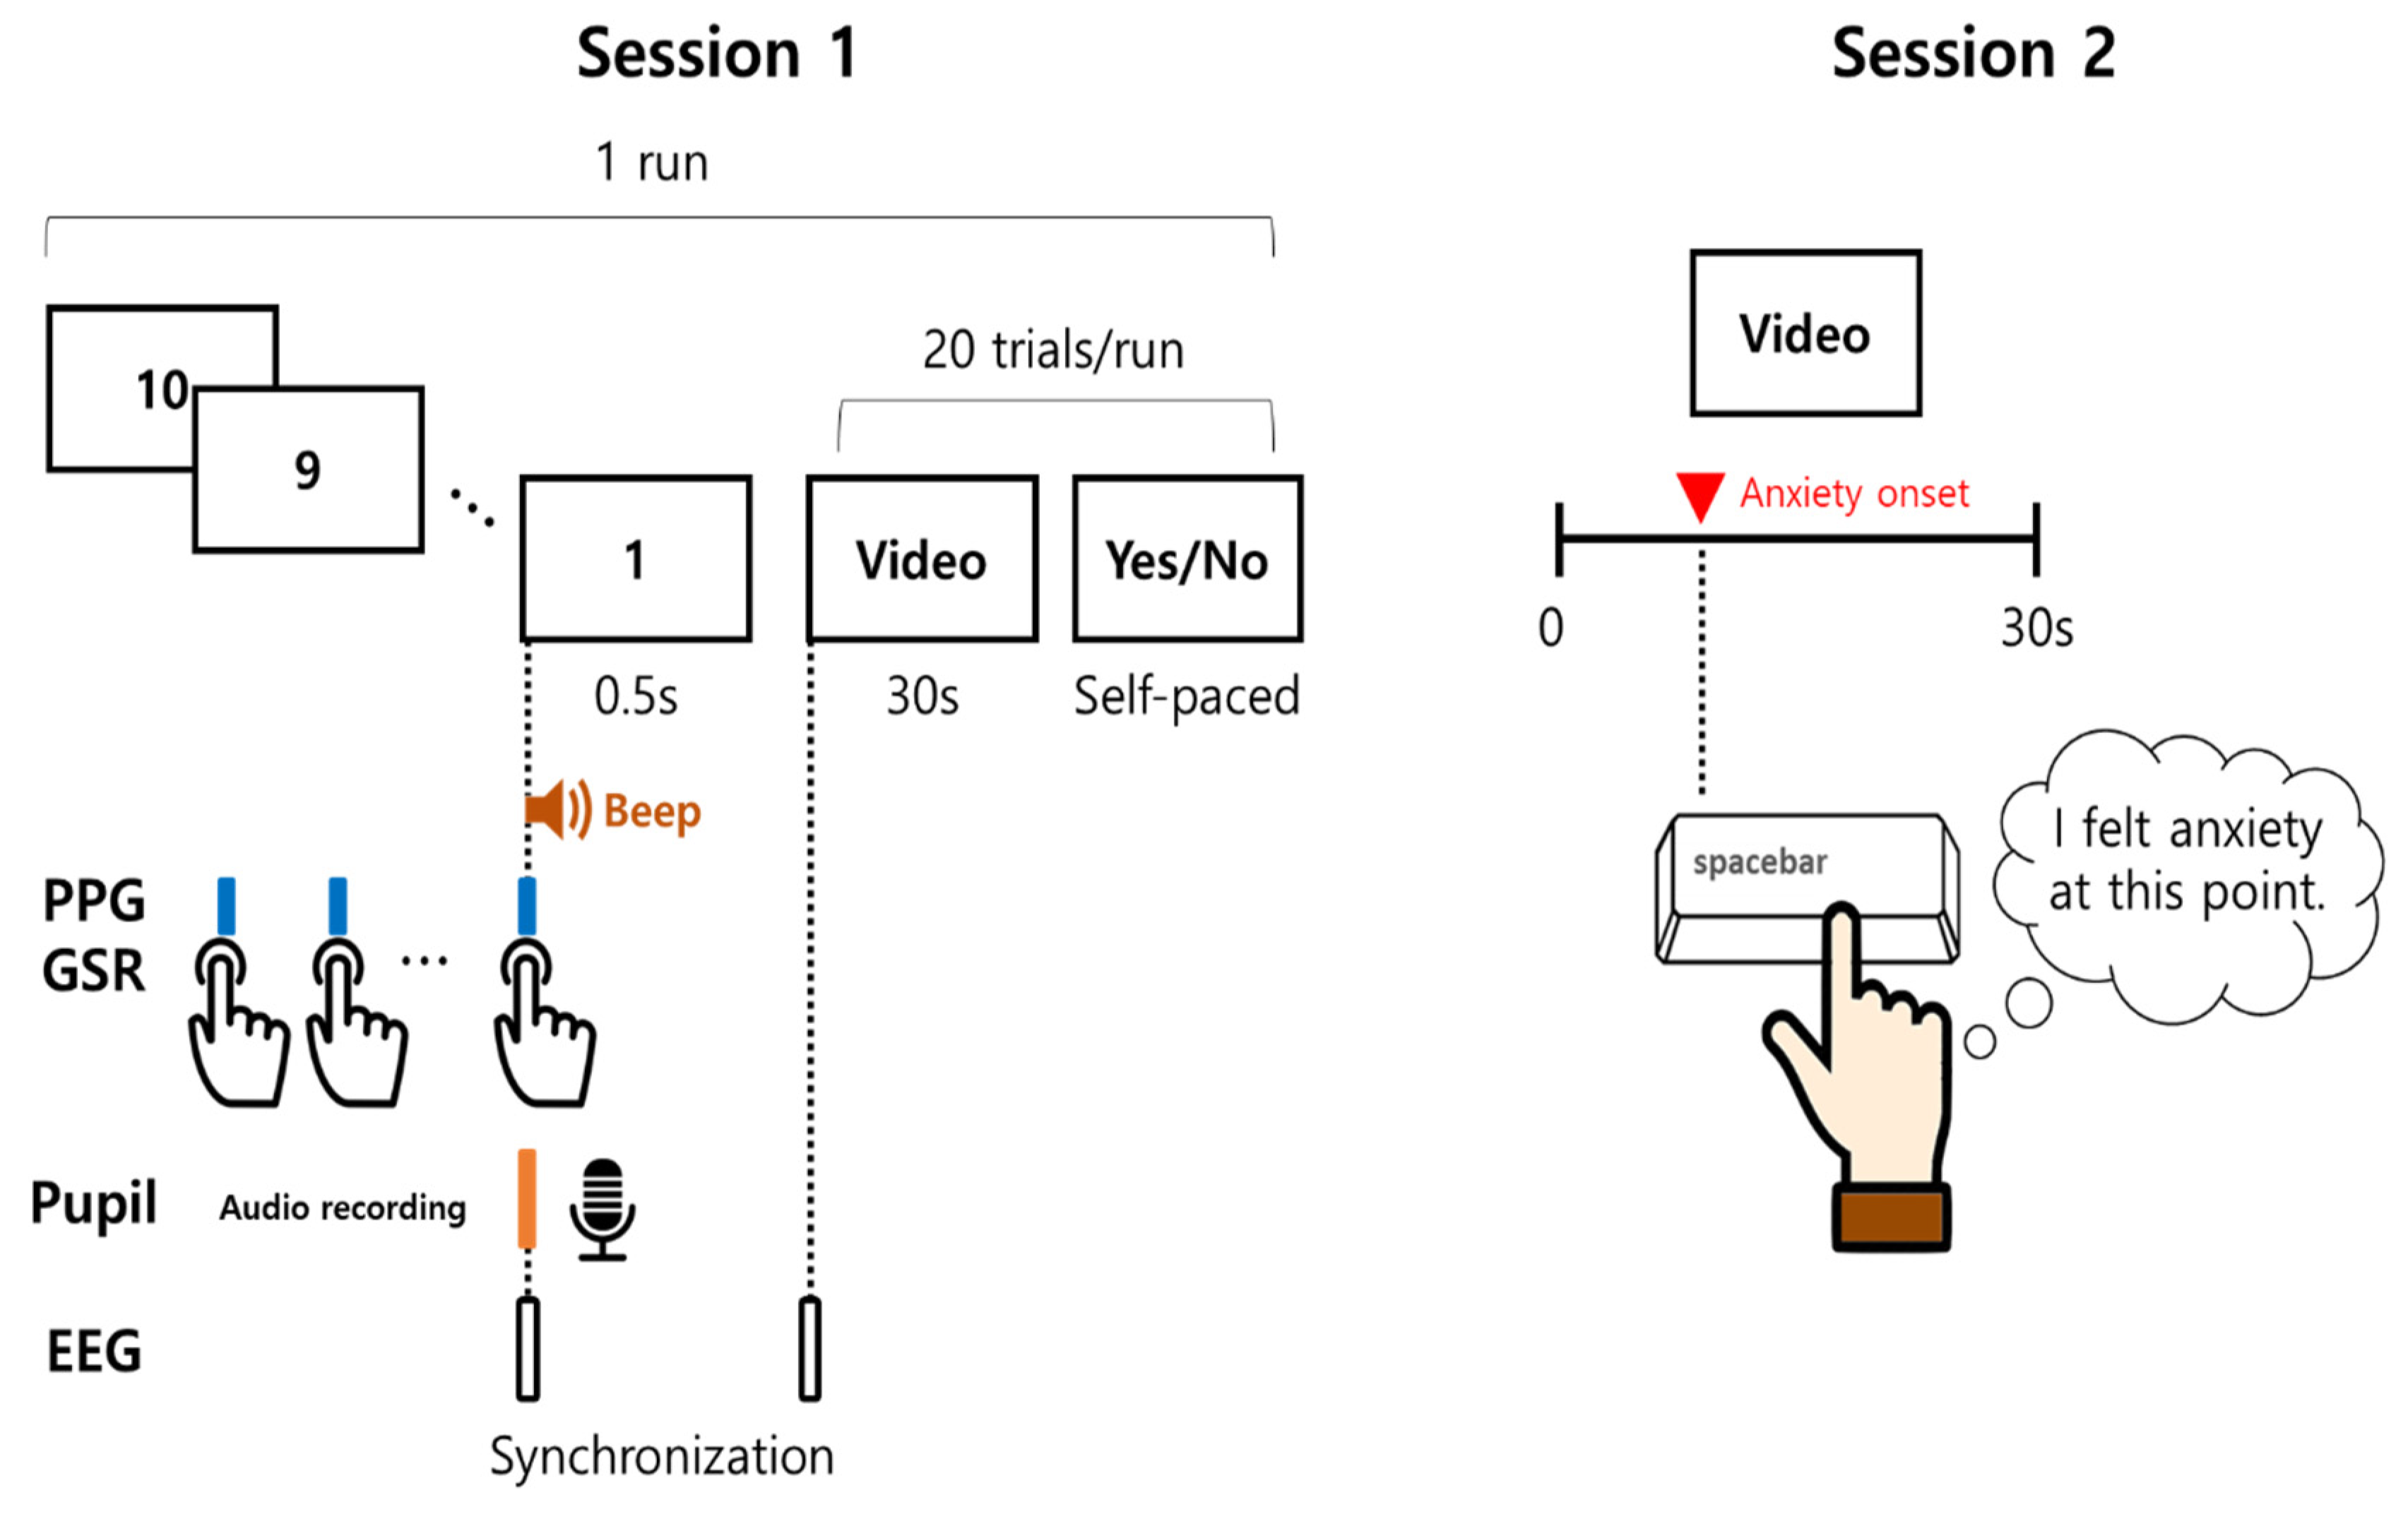
The experiment consisted of two sessions (Figure 1). In the first session, participants were asked to watch sixty videos. At the end of each video, they were asked to answer the question of whether or not they felt anxiety during the video by pressing a keypad (1: Yes/2: No). Presentation of videos was repeated over three successive runs with a short break between runs—there were twenty trials of video presentation followed by responses in each run. The number of VA and VN in each run were balanced and each video was presented in a random order. In the second session, participants were told to press the space bar at the points when they had felt anxiety while they watched the same sixty videos again. They were allowed to press multiple times, yet only the first one was used in the subsequent analysis.
2.3. Multimodal Biosignal Recordings
Four biosignals were collected simultaneously in the first session: EEG, PPG, EDA, and PS. EEG signals were measured (band-pass filtering 1–50 Hz, sampling rate: 500 Hz) with a 31-channel wet-electrode recording system (actiCHamp, Brain products GmbH, Gliching, Germany) at the following electrode locations, determined in accordance with the International 10/20 system: FP1, FPz, FP2, F7, F3, Fz, F4, F8, FC9, FC5, FC1, FC2, FC6, FC10, T7, C3, Cz, C4, T8, CP5, CP1, CP2, CP6, P7, P3, Pz, P4, P8, O1, Oz, and O2. Two additional electrodes were attached to the left mastoid (TP9) as a ground, and the right one (TP10) as a reference. PPG and EDA were collected from a wristband-type wearable device (E4, Empatica Inc, Milano, Italy) with a 64 Hz and 4 Hz sampling rate, respectively. PS was acquired by a wearable eye tracker (Tobii Pro Glasses 2, TOBII, Danderyd, Sweden). The signals from three devices were synchronized by marking the beginning of the first video as follows: Before watching the first driving video, participants should press the event-marker button on the wristband to the 0.5 s rhythm of the countdown from 10 to 1, as instructed on the monitor screen. By doing so, participants could press the button accurately at the moment when the last number 1 was shown, while they could miss some other time points that were not used for synchronization. When the last number, ‘1’, was shown on the monitor screen, a beep sound was presented together, which was recorded by a camera embedded in the eye-tracker. The first video started 0.5 s after the display of ‘1’ (Figure 1). EEG signals were recorded along with triggers, marking the beginning of every trial.
2.4. Behavior Analysis
The behavioral data were acquired from the experiment, including the self-reports of anxiety for all videos and the time points of each VA. The ratio of self-reports of anxiety was calculated as the number of videos with ‘Yes’ response over the number of VA or VN (i.e., 30). To verify that VA clearly invoked anxiety, we compared this ratio between VA and VN using paired t-test. We also estimated the number of time points for each video by fitting Poisson distribution. The time points of self-invoked anxiety from VA were used to determine the onset of individuals’ anxiety (anxiety onset). There was no clear onset time for VN due to absence of event. Thus, the control onset was defined as the average start time of VA (i.e., 12.73 ± 5.77 s, control onset) for VN. These two onsets were used to extract the features of anxiety from biosignals (Section 2.5).
2.5. Signal Processing and Feature Extraction
2.5.1. EEG
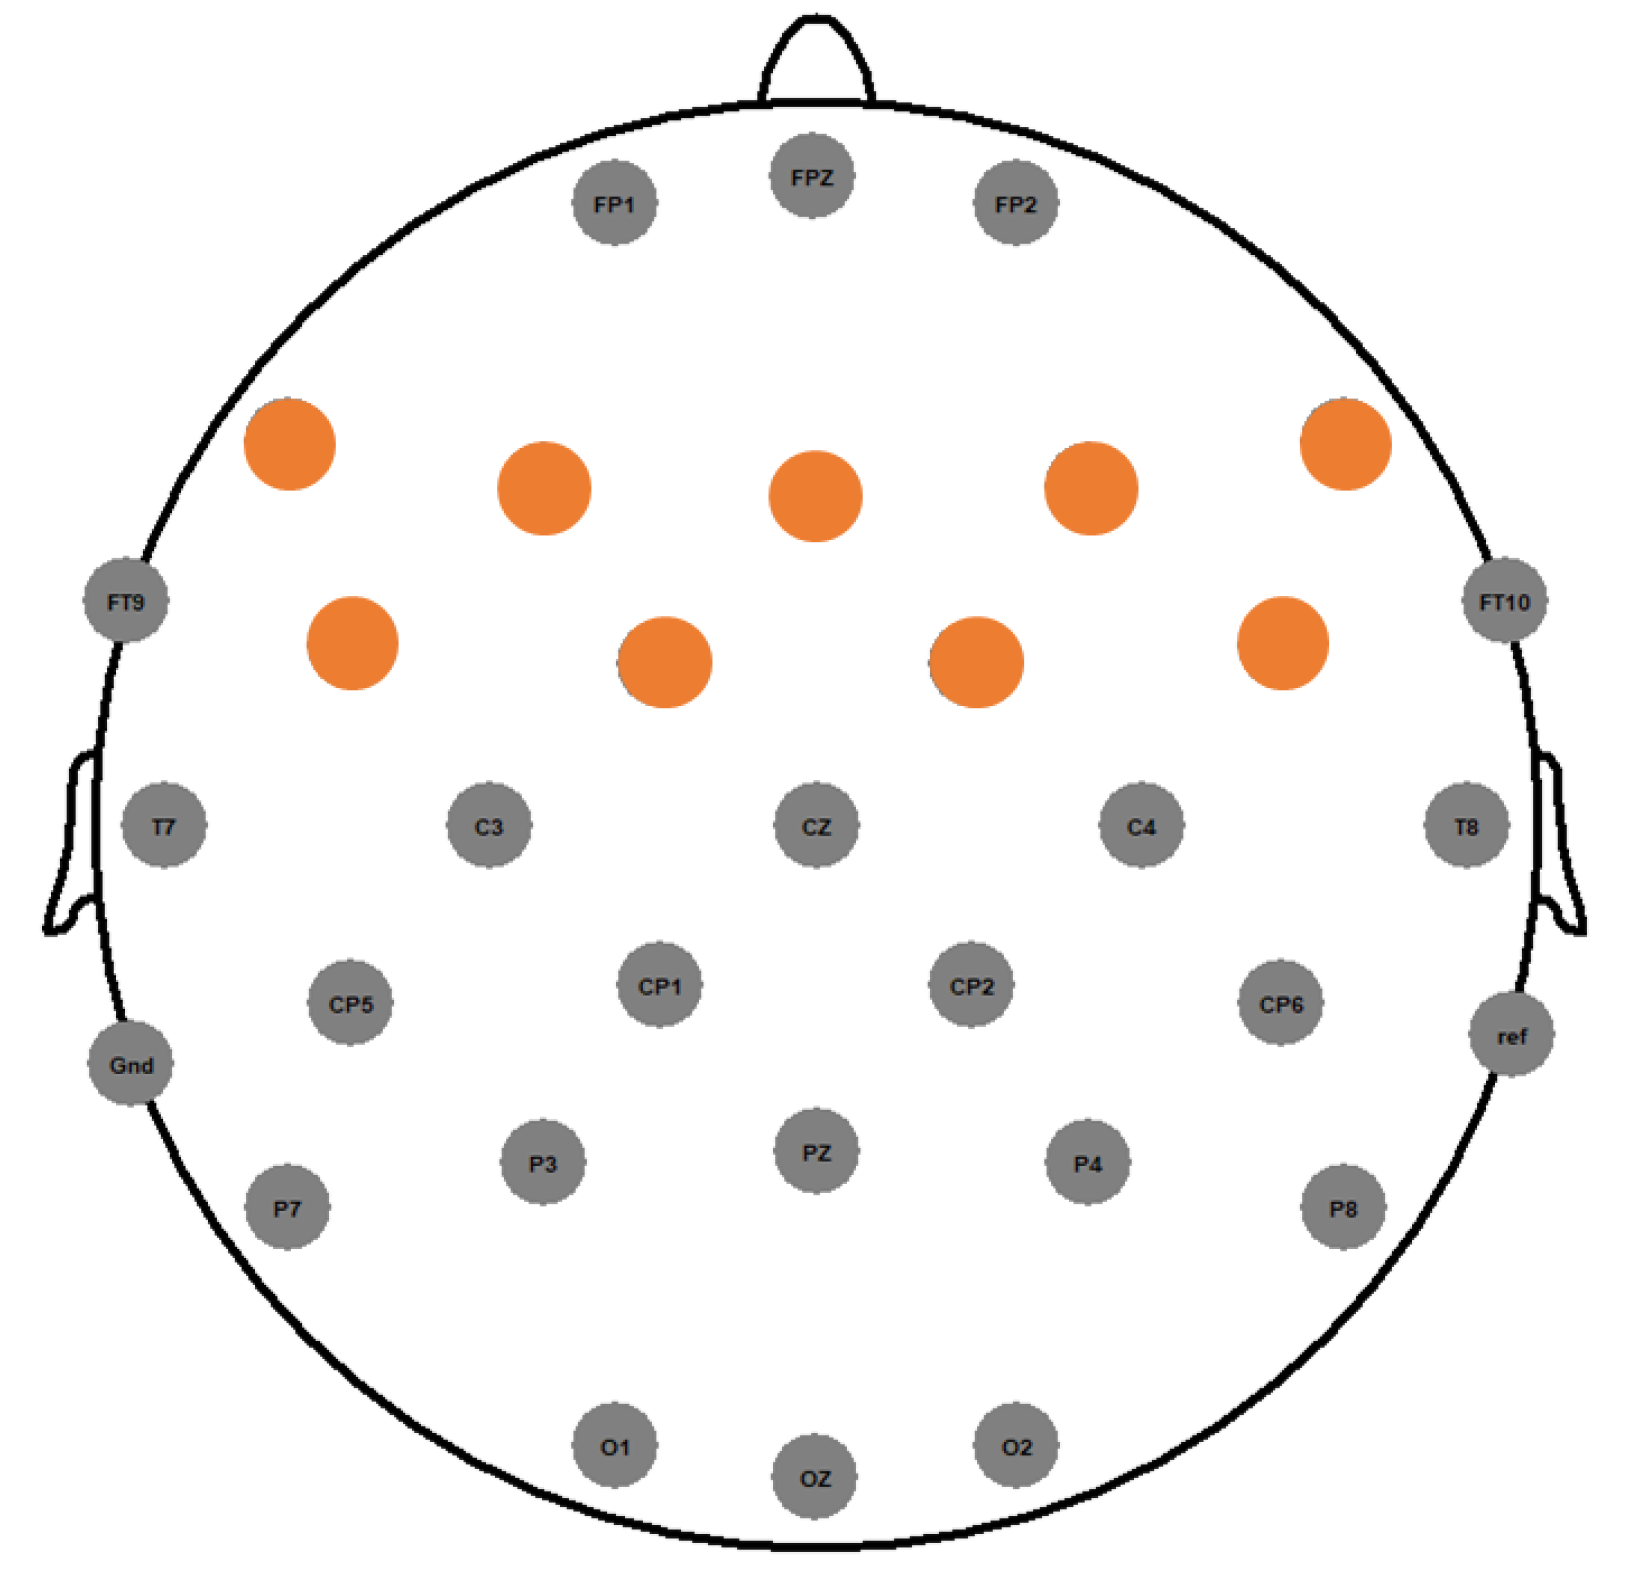
To remove eye movement artifacts from EEG signals, artifact subspace reconstruction (ASR) was applied to the recorded EEG data [18]. Then, EEG data were transformed to the spectral domain using short-time Fourier Transform (STFT) with a 1-s window and 50% overlapping. The power spectral density (PSD) in four frequency bands was estimated using Welch’s method: Theta (4–8 Hz), alpha (8–12 Hz), beta (13–30 Hz) and gamma (30–40 Hz). Only frontal channels (F7, F3, Fz, F4, F8, FC5, FC1, FC2, FC6) were used for the analysis of this study as the frontal cortex is involved in emotional processing of anxiety [15,19] (Figure 2). The data were extracted from t2 s after the two onset types (i.e., anxiety onset and control onset) and baseline corrected with t1 s before the onsets, where t1 = (1 2 3) s and t2 = (3 4 5) s. Additionally, stress related EEG features [20], such as frontal alpha asymmetry (FAA), brain load index (BLI) and beta/alpha ratio (B/A), were extracted from the same 9 periods. Thus, a total of 423 features (FAA, BLI, B/A for 9 channels, and 4 frequencies for 9 channels for each period) were extracted from EEG data. To prevent over-fitting due to the sizable number of features compared to input data (i.e., the number of trials), we reduced the number of features to 20 using least absolute shrinkage and selection operator (LASSO) regression analysis provided by the function ‘lasso’ from MATLAB (2019a, MathWorks, Natick, MA, USA, 2019). We also extracted the same features of EEG data with a 2 s window and 0.5 s non-overlapping to check if it had more reliable estimates.
2.5.2. PPG
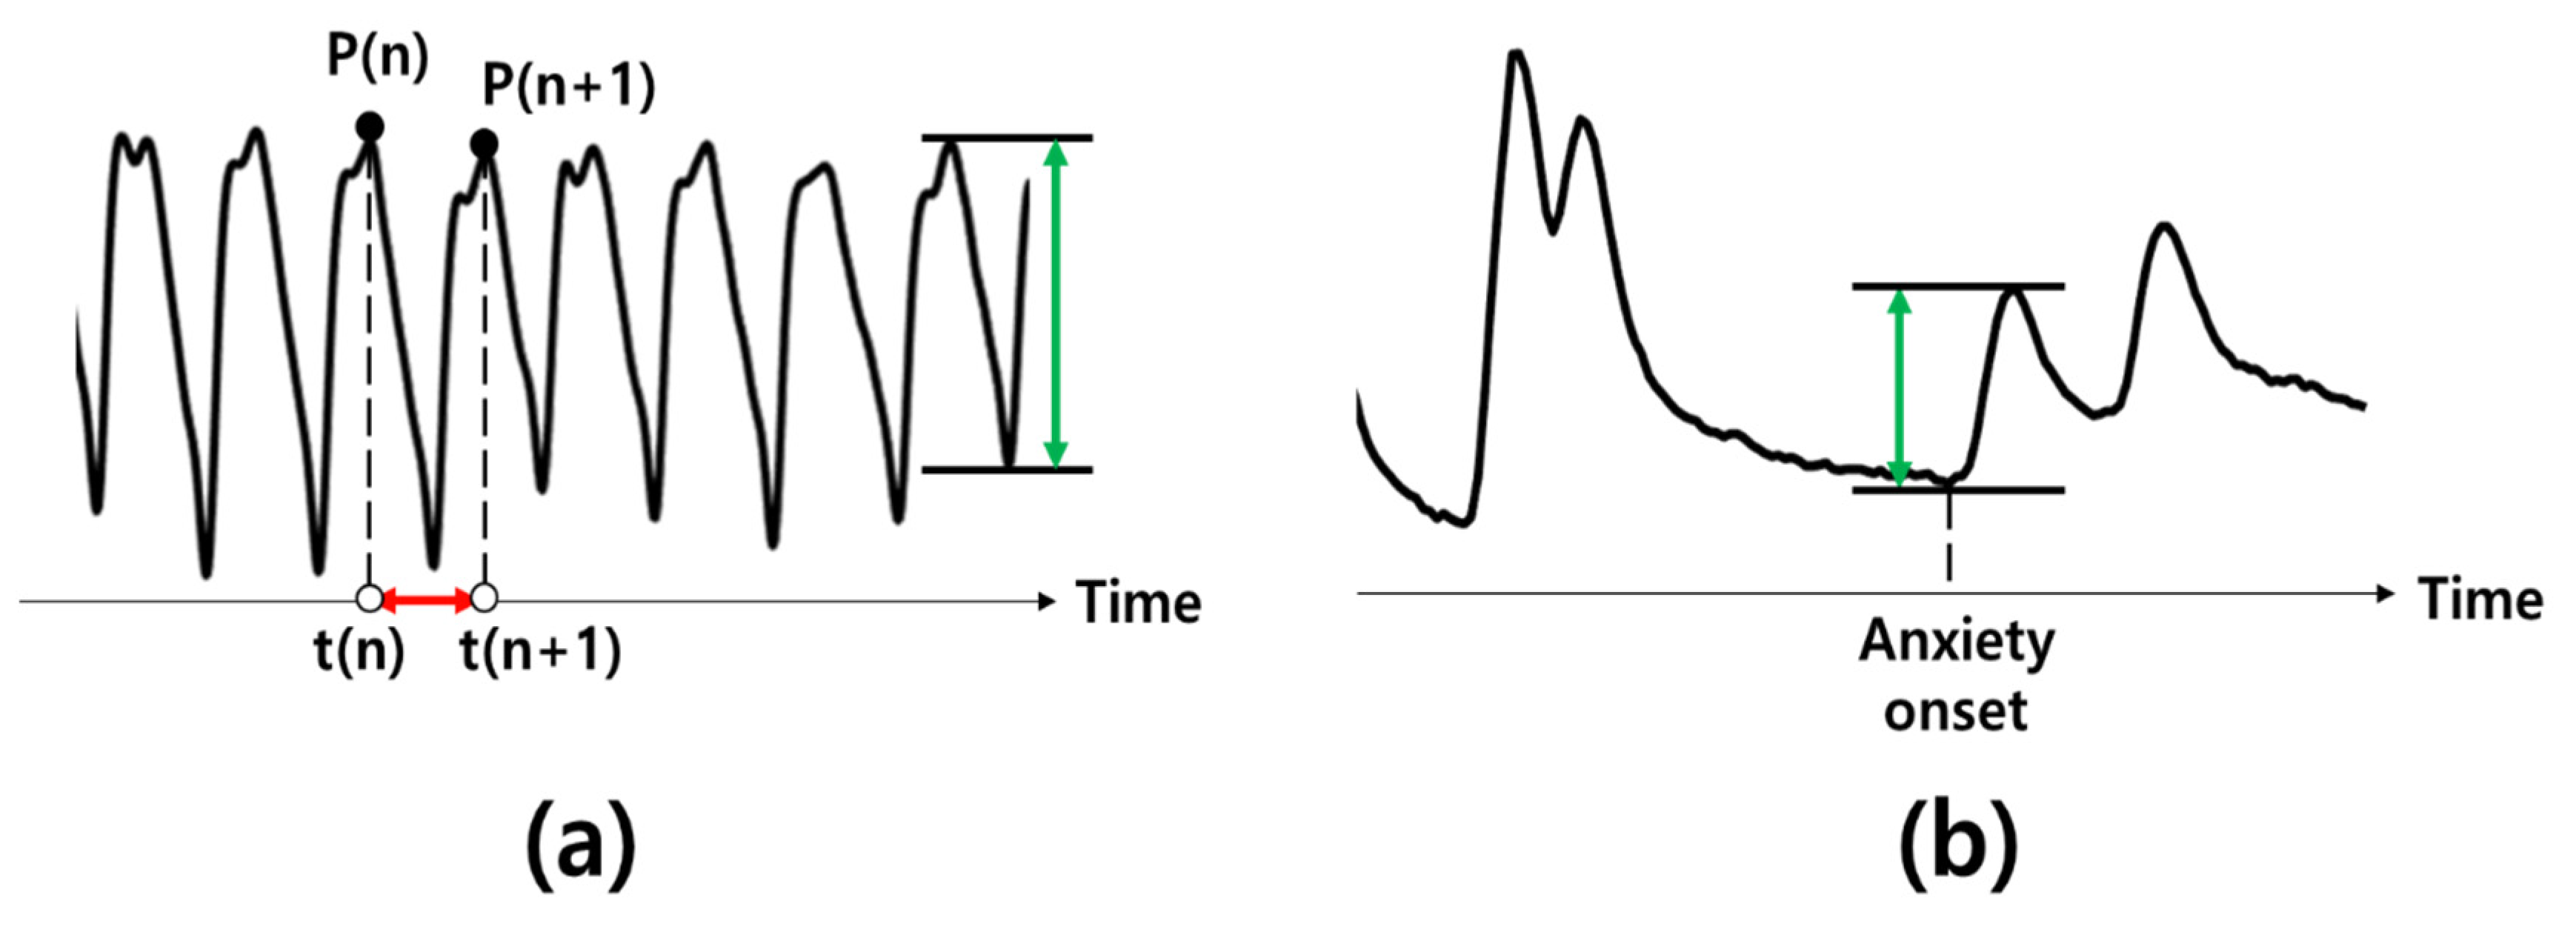
PPG was standardized by subtracting average amplitude and dividing standard deviation of amplitude from 10 s before ([−10 0]), and 10 s after ([0 10]) the time points of interest. A total of 12 features were extracted from preprocessed PPG signals as follows. Firstly, four arithmetic features were calculated from 10 s after the onset (No. 1 ~4 in Table 1). Then, the rest of the features were extracted from a peak-to-peak interval (PPI) according to a previous feature extraction method [21] (No. 5 ~12 in Table 1). As shown in Figure 3a, a PPI is defined as a time interval, t(n + 1) − t(n), between the n-th peak, P(n), to a subsequent peak, P(n + 1) where ‘t’ indicates time. The length and irregularity of PPI are defined as Equations (1) and (2), respectively. We also calculated the number of PPIs within a time window, denoted as ‘nPPI’, as well as the number of fast PPIs that was defined as PPIs faster than average PPI, as ‘fast PPIpost count’. In addition, the ratio of low frequency (LF: 0.04~0.15 Hz) to high frequency (HF: 0.15~0.4 Hz) was obtained within a time period of interest.
PPI length = t(n) − t(n − 2)
PPI irregularity = [(t(n) − t(n − 1)) − (t(n − 1) − t(n − 2))]/[t(n) − t(n − 2)]
2.5.3. EDA
EDA increases from certain latency, normally 1 s, after the onset of arousal events [22]. Thus, EDA signal was corrected with baseline that was determined as a period from the onset to 1 s. Then, we epoched the EDA signals from 1 s to 6 s after both the anxiety onset and control onset. The five arithmetic features were selected within the 5 s time-window: Mean, std., maximum, and minimum EDA signal, as well as EDA amplitude defined as a difference between maximum and minimum.
2.5.4. Pupil Size
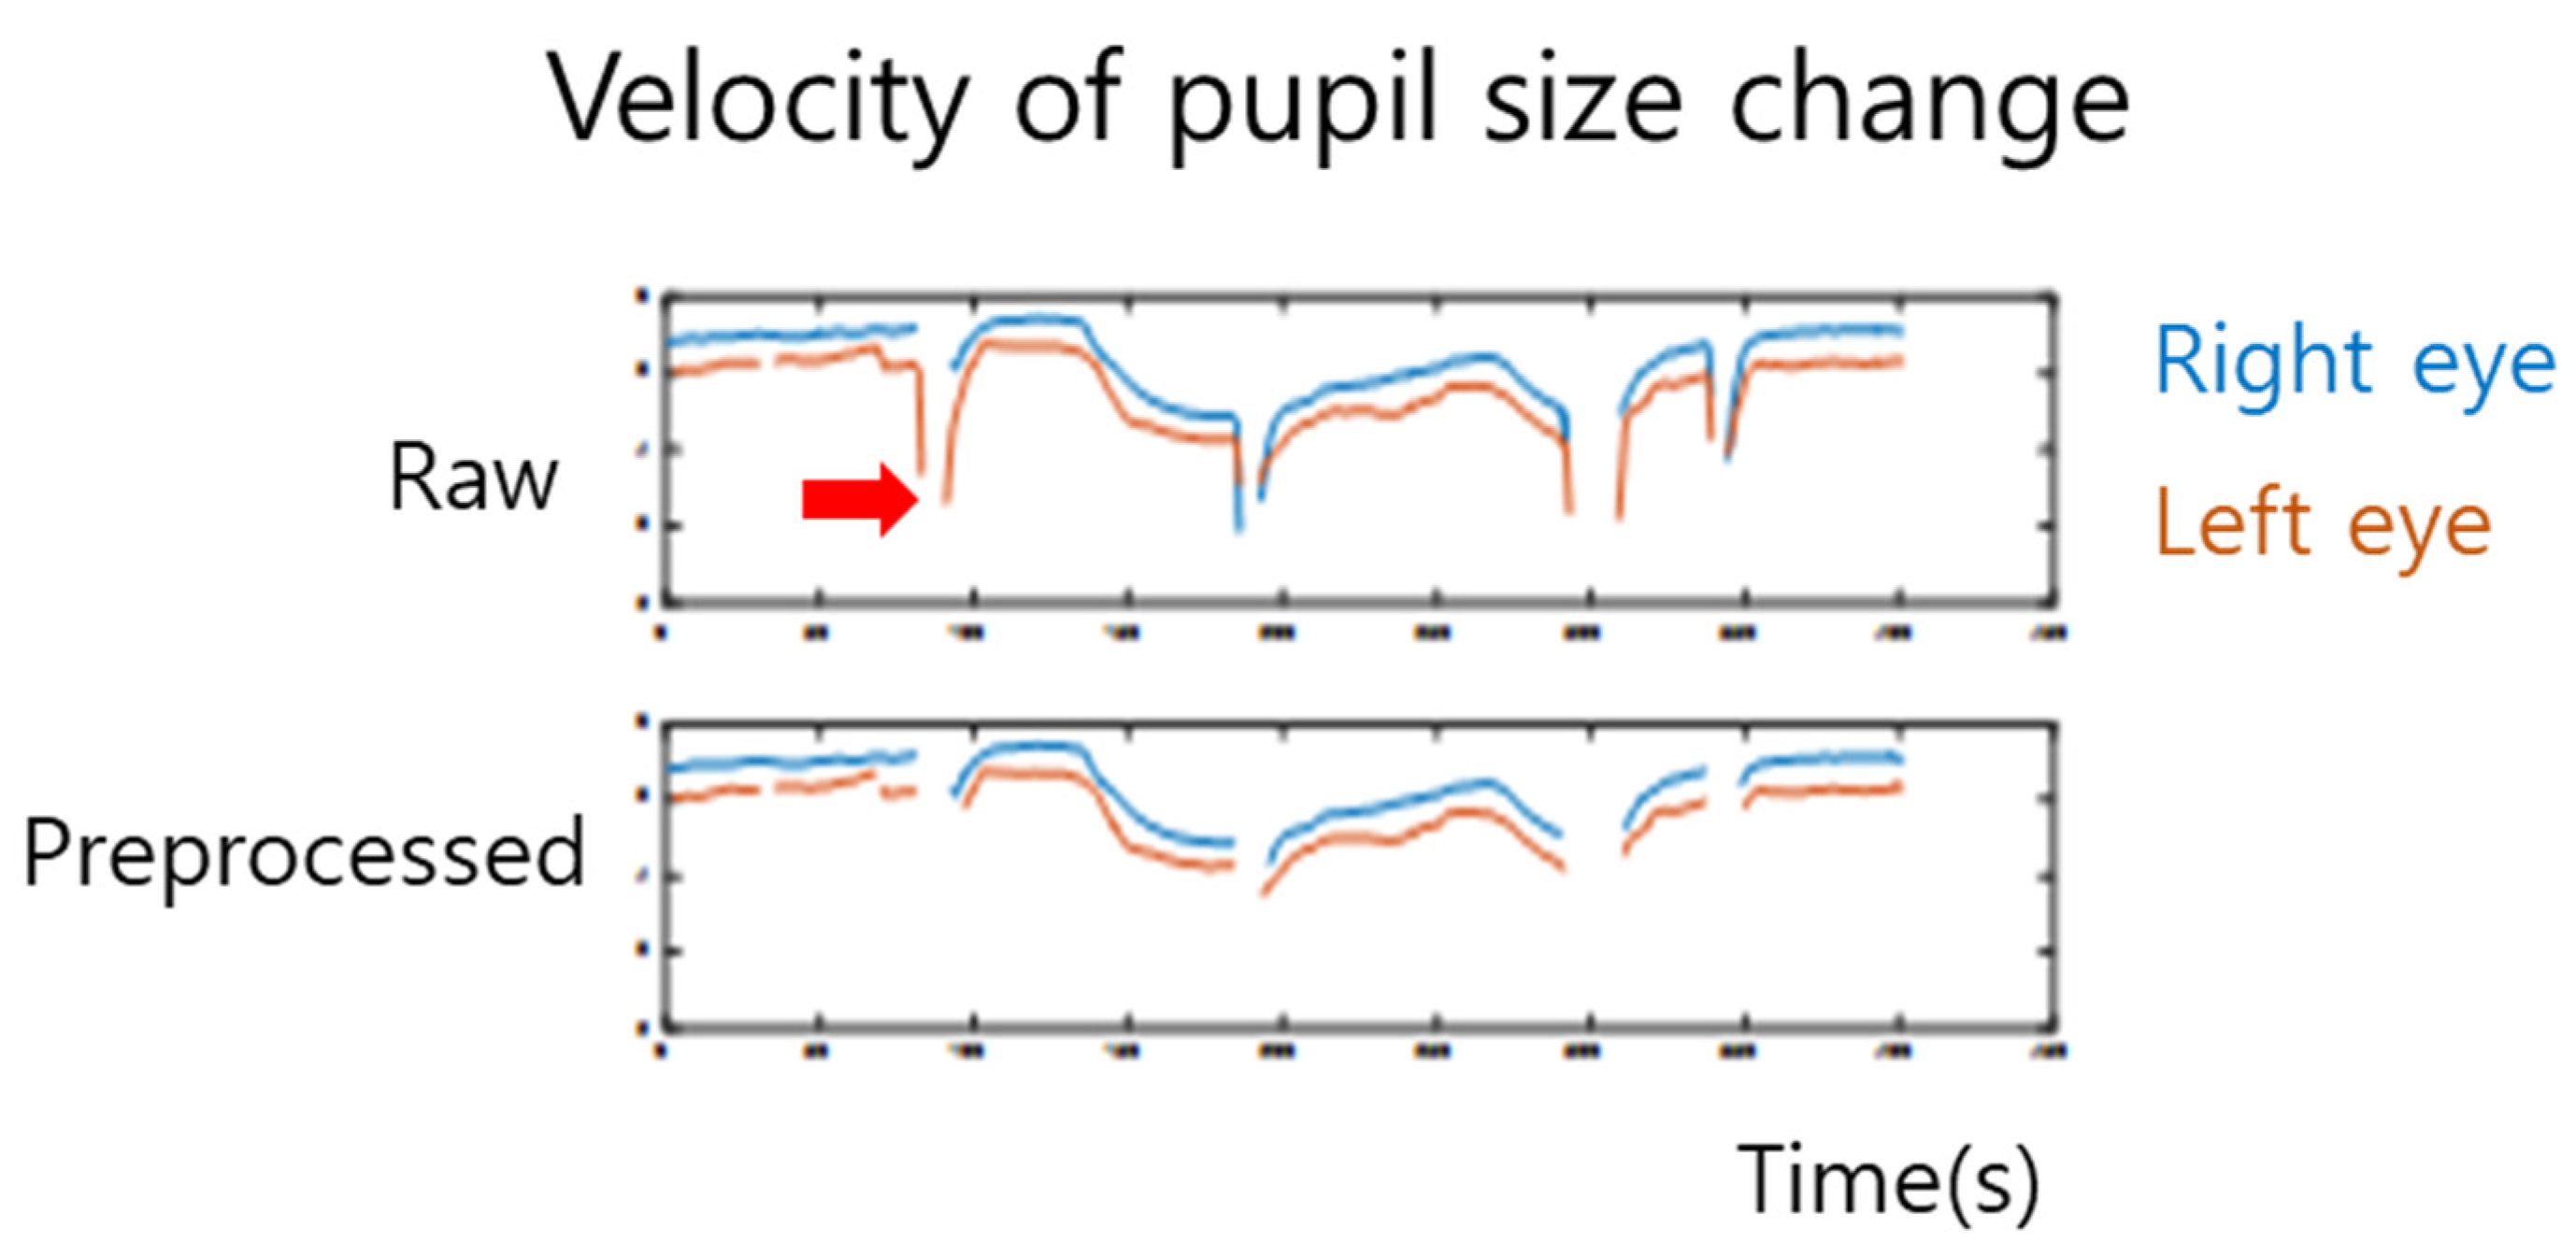
To reduce blinking noise in PS, we removed the pupil data whose velocity was 1.5% higher than average velocity (Figure 4). This threshold was set heuristically. According to previous studies [23,24], the largest change in PS is within 2 to 5 s after an emotional change compared to the size from 1 s before the emotional change. Thus, PS data were corrected by baseline of signal 1 s before the onset. The five arithmetic features selected in this study were: Mean, std., max, min and pupil range calculated as maximum minus minimum within a time window (i.e., 3 s).
2.6. Decoding Analysis
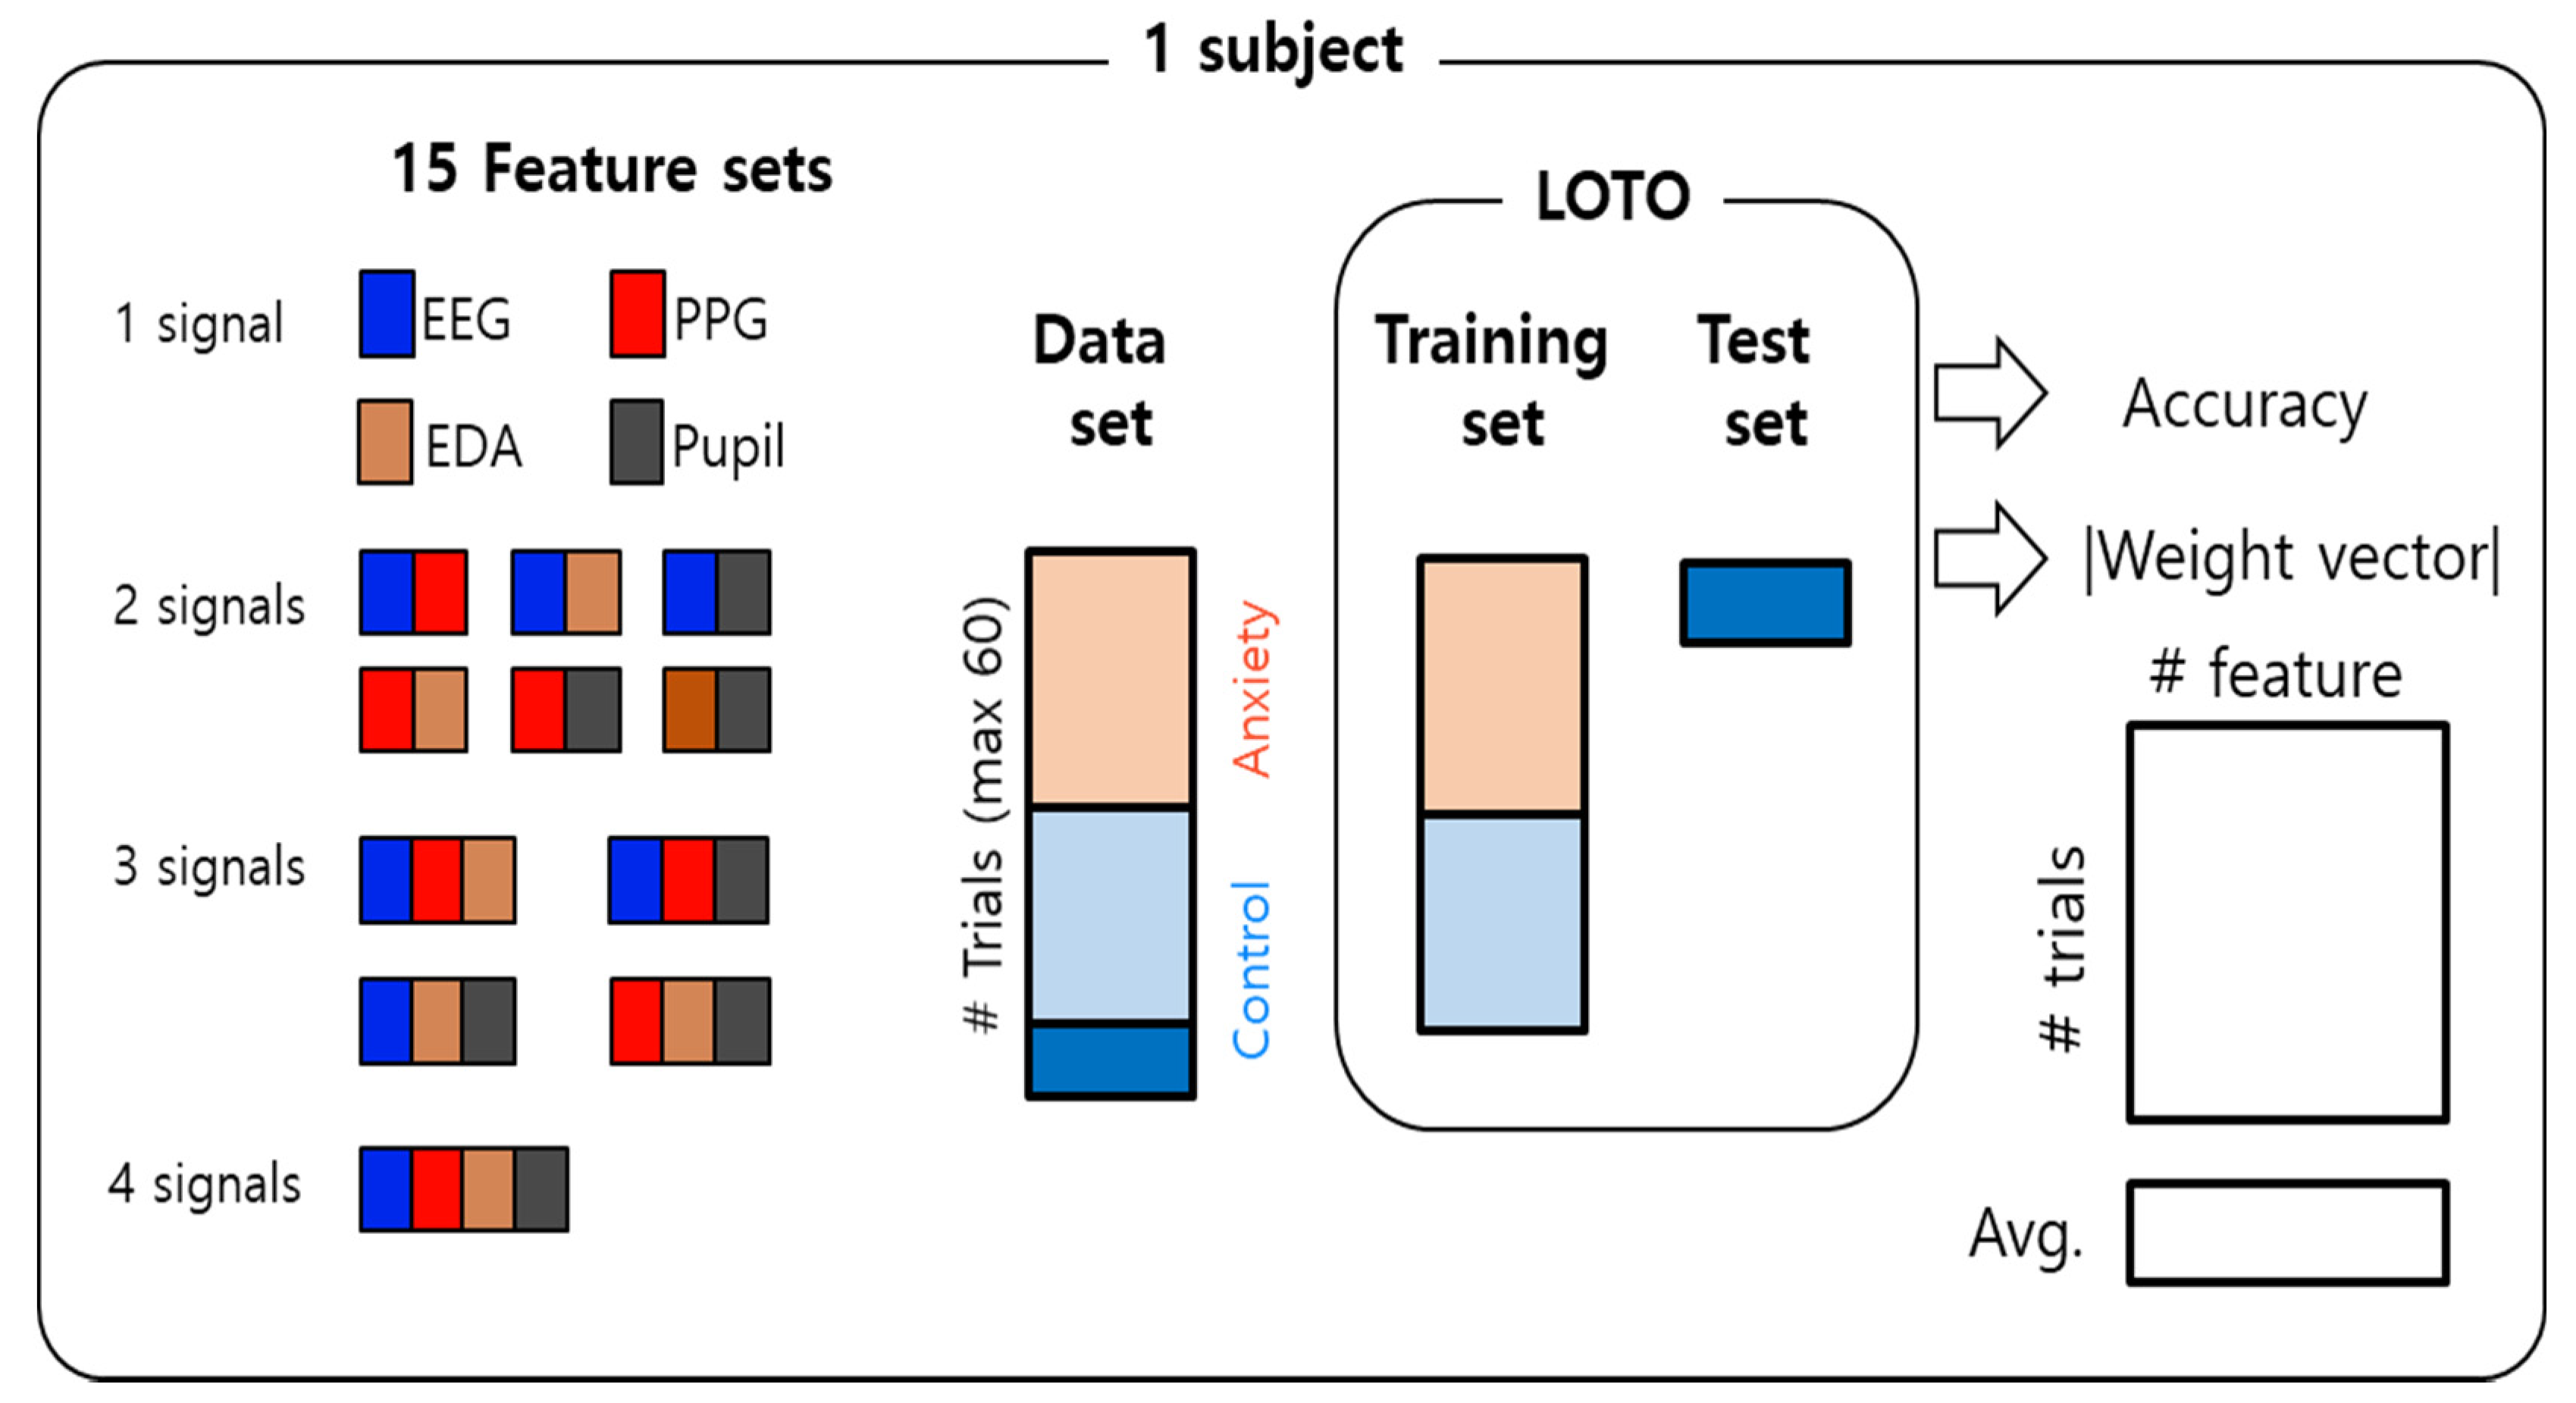
We built 15 feature sets with all possible combinations of 4 signals in order to find which signal or combination of signals provided the best features for detecting anxiety. We extracted 20 features from EEG, 12 features from PPG, 5 from EDA and 5 from pupil size, respectively. To evaluate decoding accuracy, leave-one-trial-out (LOTO) validation was used for each participant (Figure 5). To predict whether given trial data contained video with an anxiety event or not, we trained a classifier using the rest of the trials. Before training the classifier, we normalized the features using the standard scaling for each feature. The logistic regression (LR) was used as a classifier. Additionally, we used 10-fold cross validation (CV) for evaluating decoding accuracy as a more conservative validation method and the artificial neural networks (ANN) was used as another classifier to check if it could improve accuracy. Thus, there were eight decoding methods for analysis (2 validation methods × 2 classifiers × 2 sets with EEG features extracted using a 2 s window).
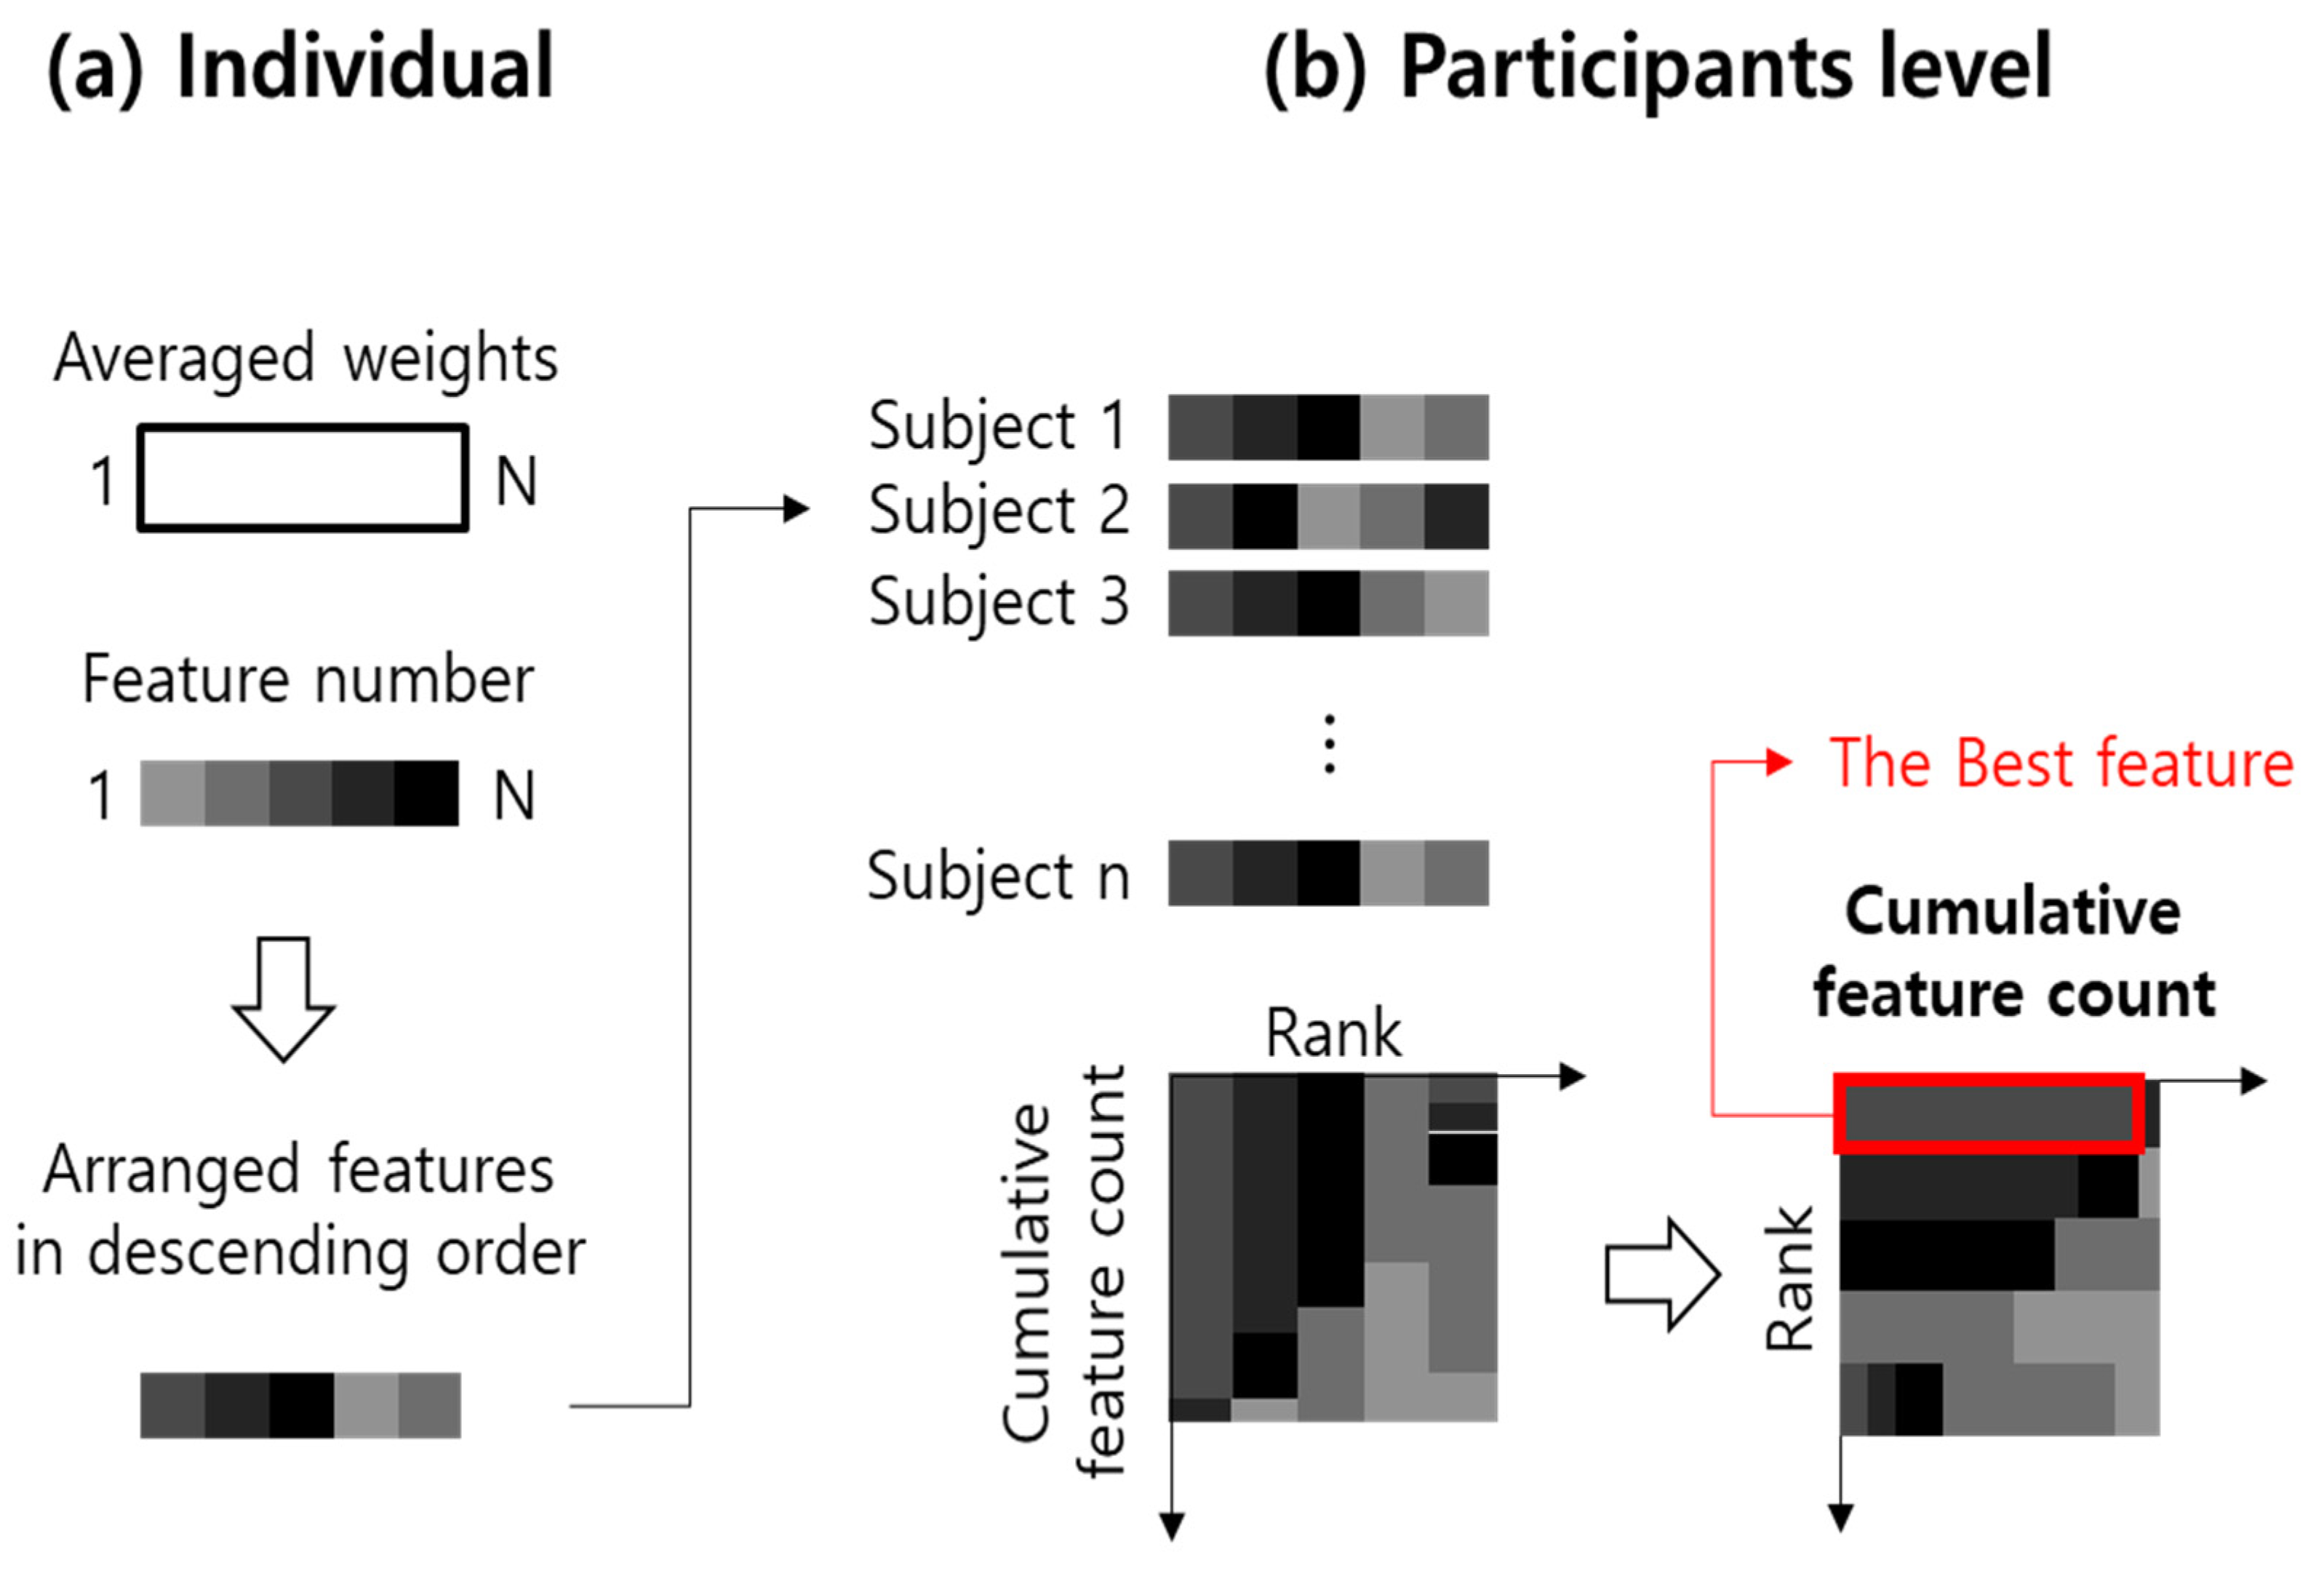
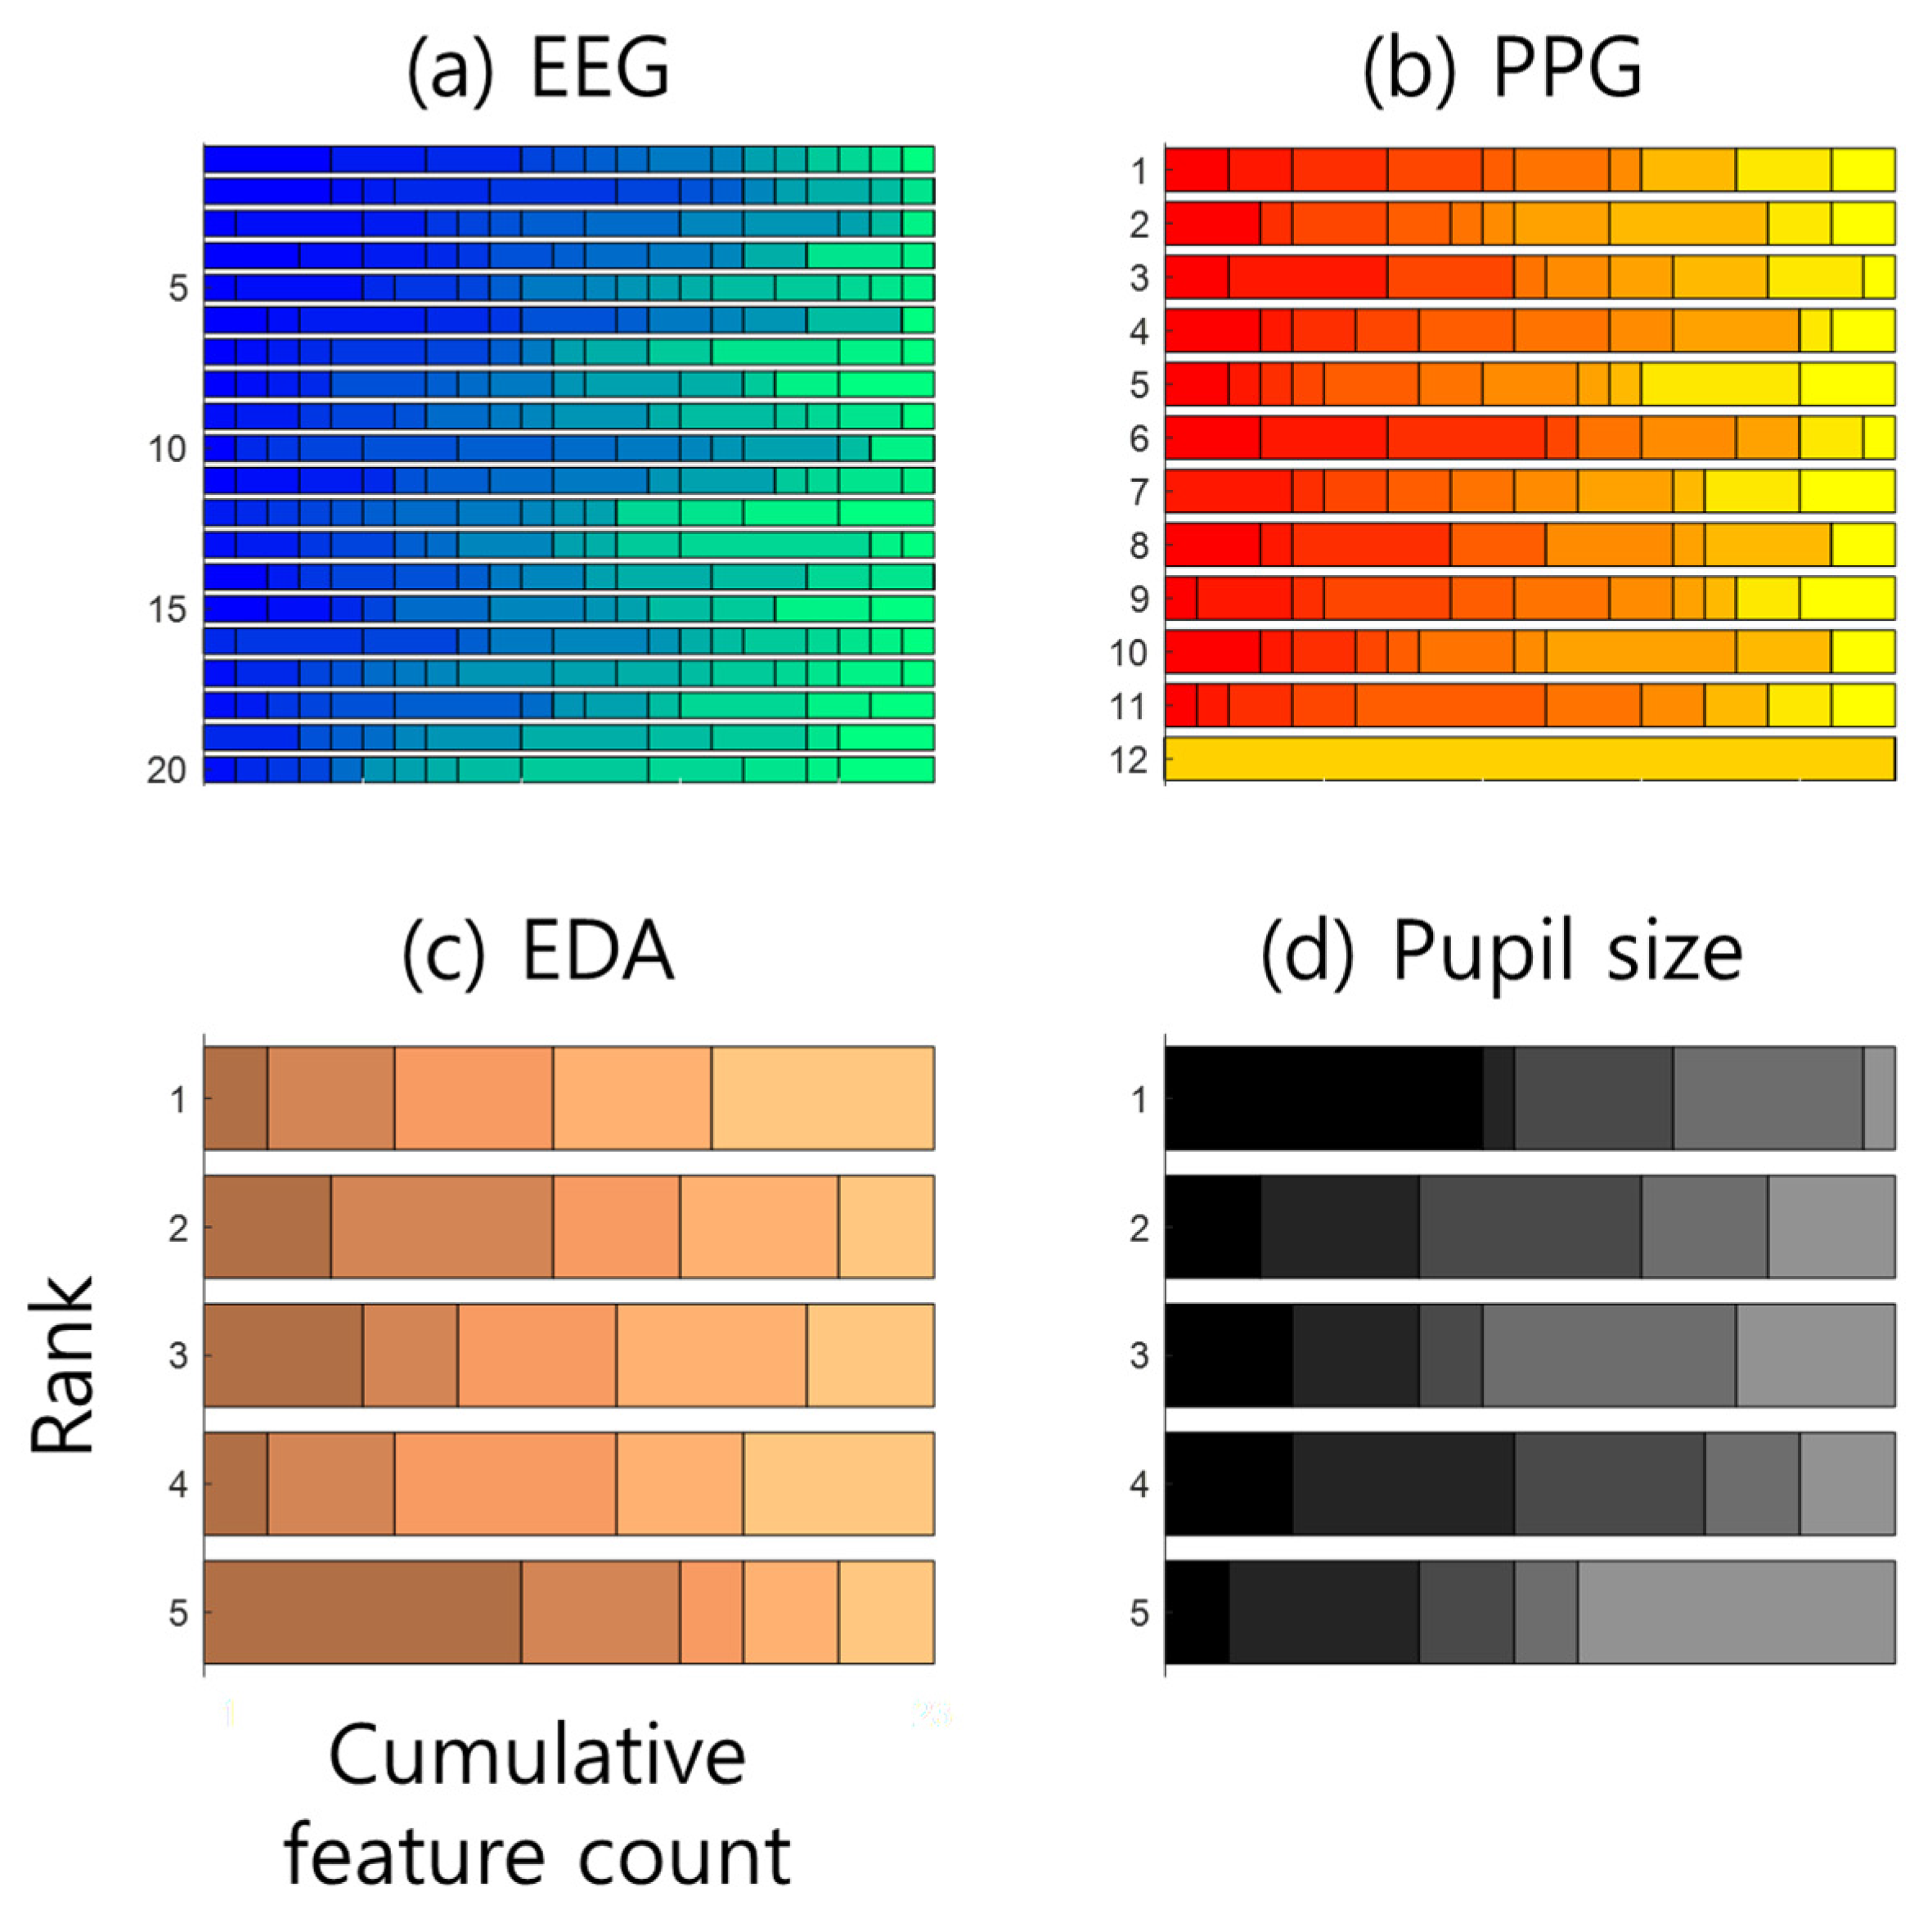
In addition, we developed a cumulative feature count (CFC) in order to evaluate which bio signal was more involved in building the classifier across participants. To do so, we calculated the average of the absolute values of the LR weights assigned to each of the 42 features in each participant (Figure 6). Then, we sorted the features based on their average absolute weight values in a descending order (Figure 6a). Finally, we collected this vector of sorted features from every participant and counted the number of times a feature appeared on each rank (Figure 6b). A feature with the largest proportion in the high ranking could be interpreted as the best feature and/or the best signal. The CFCs from other possible classifiers were also calculated in the same way, except for the number of features in the feature set. Since the CFC was used to rank weights rather than to select features, the number of features of all classifiers was not changed, regardless of CFC application.
3. Results
3.1. Behavior Results
The ratio of self-reports of anxiety for VA and VN were 0.7505 and 0.1704, respectively, indicating VA invoked anxiety significantly more than VN did (t(30) = 20.78, p < 0.0001). In addition, the average number of keyboard presses for anxiety timing for each VA was 0.99 ± 0.22. The expected number of anxiety expressions for each stimulus fitted by Poisson distribution is summarized in Table 2. For example, one would expect to observe 1.103 keyboard press for the stimulus no. 1, estimated by 31 participants button pressing data. These results confirmed that VA could sufficiently arouse anxiety in our experiment.
3.2. Decoding Results
Twenty-three participants’ data was used for a decoding analysis. The number of anxiety and control trials used in the analysis were 24.91 ± 7.36 and 24.09 ± 6.65 out of maximum 30 trials for each. The paired t-test showed no difference in the number of trials between anxiety and control (t(22) = 1.67, p = 0.11), thus informing the chance level of decoding as 50%.
The LR classifier with LOTO validation using a feature set with 1 s EEG data showed the highest accuracies among seven other methods (Table A2 and Table A3). Paired t-test of decoding methods revealed that the other three classification methods using a feature set with 1 s EEG data showed lower average and maximum accuracy (ps < 0.05). We also found that the decoding accuracy of feature sets including EEG features with a 2 s window using LR classifier with both LOTO and 10-fold CV method were not above chance level (ps > 0.5) (Table A4). Also, ANN classifier trained with 10-fold CV method did not perform above chance level either (ps > 0.9). When using ANN classifier with LOTO method, however, feature set 2 (PPG only) showed results slightly above the chance level (average 0.53, t(22) = 1.90, p = 0.035) across subjects, while other feature sets did not (ps > 0.05). In sum, our analysis results indicated that the LR classifier with LOTO validation method produced the most accurate estimation.
Decoding results showed that among 15 possible combinations of multimodal biosignals, decoding EEG alone showed the highest accuracy (Table 3, the third column). In addition, we obtained accuracy above the chance level in most participants (i.e., 22 or 23) whenever the feature sets included EEG features (Table 3, the fifth column). When decoding all the features from every biosignal, the cumulative feature count analysis revealed that the EEG features dominated the top ranks followed by PPG (Figure 7). The cumulative feature count results from other combinations of biosignals also indicated that the EEG features were mostly used for decoding (Figure A1 and Figure A2). Although using the EEG features exhibited the highest performance on average, a subset of participants showed higher decoding accuracy when using other feature sets compared to using the feature set 1—which contained EEG features only (Table 3, the rightmost column). Nine participants exhibited higher accuracy when using the feature set 7, consisting of PS plus EEG, compared to using EEG only. However, only two of them presented above-chance-level accuracy using the feature set 4 that contained PS only, indicating that PS could augment EEG to enhance classification accuracy but not yield high accuracy alone. This is the case when using other feature sets such as the feature set 6 (EEG + EDA) and 13 (EEG + EDA + PS), where adding other signals to EEG helped increase accuracy, but using those signals alone did not produce high accuracy.
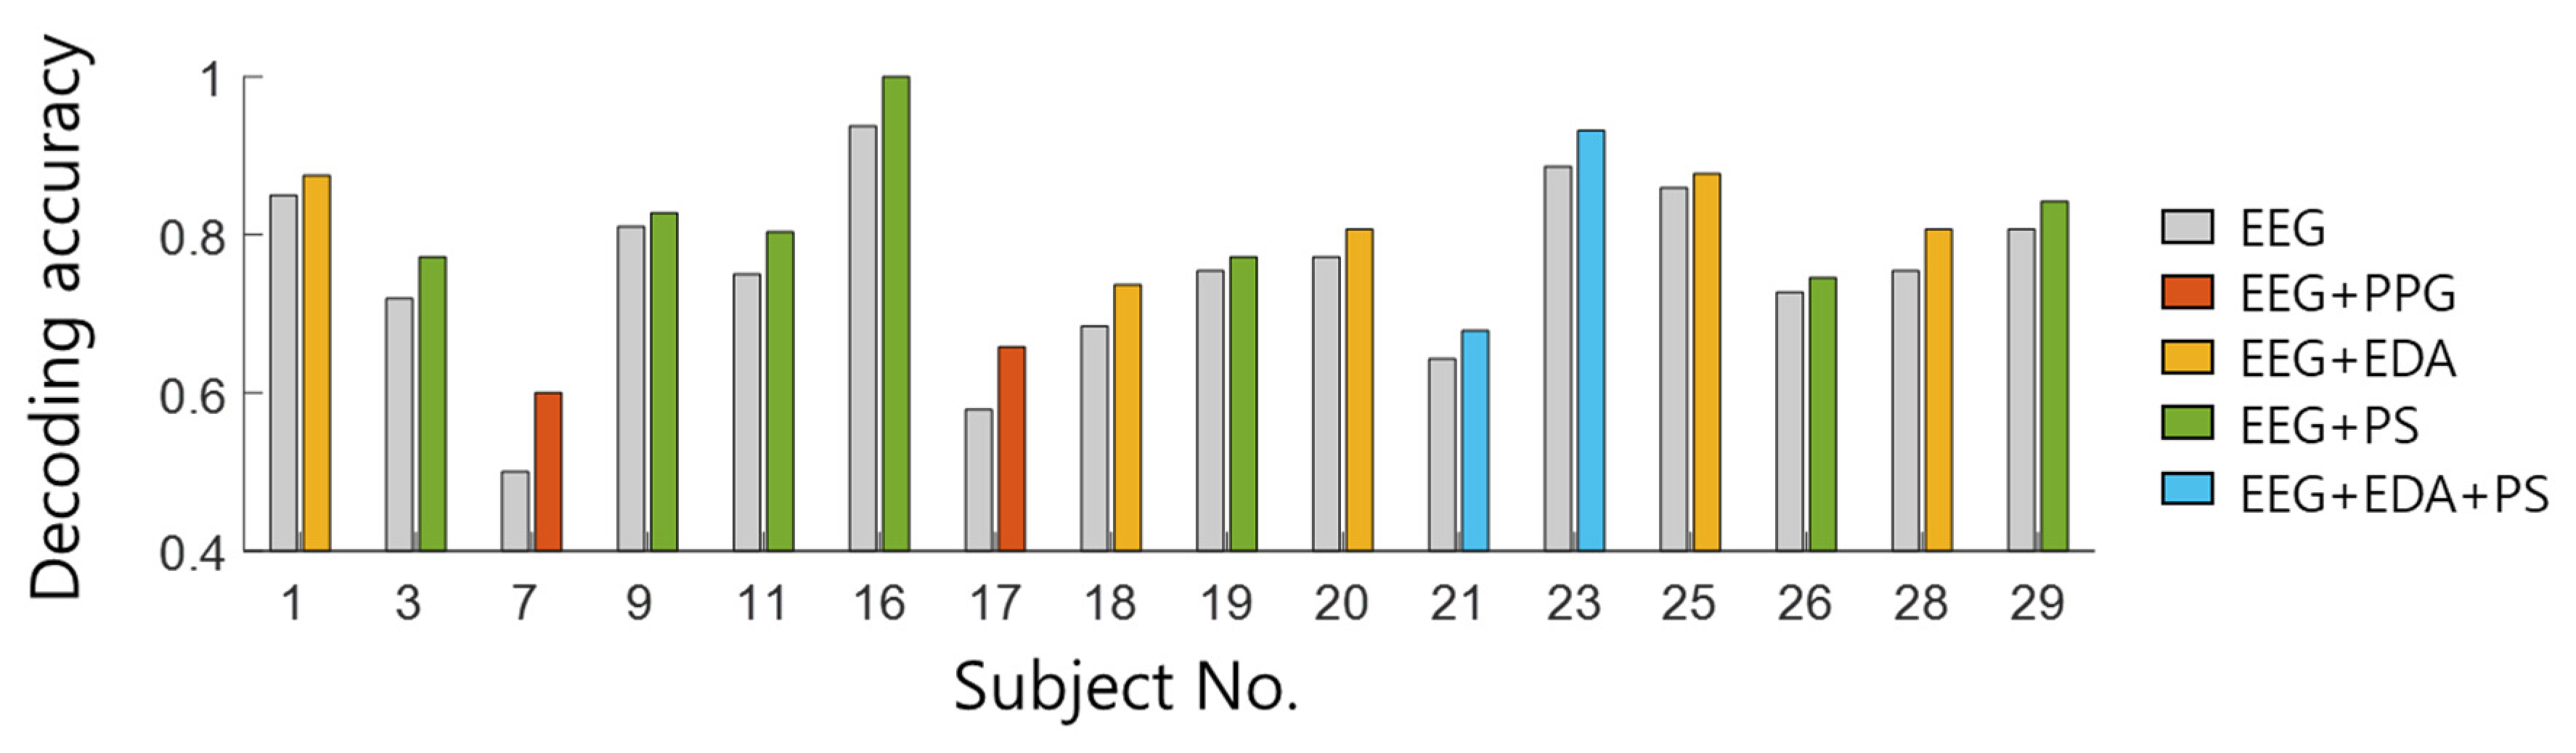
Once we observed improvement of decoding by adding other signals to EEG, we counted how many participants benefited from mixing of other biosignals to EEG in terms of decoding accuracy. In other words, we evaluated in how participants using any of the feature sets including EEG plus other signals (i.e., sets 5, 6, 7, 11, 12, 13 and 15) performed using the feature set 1 (i.e., EEG only). We found that 16 out of 23 participants exhibited higher accuracy when using multimodal features than when using EEG only. Figure 8 describes the best feature set for each participant and how much it improved decoding accuracy compared to the uni-modal feature set of EEG. The 7 participants (i.e., 2, 4, 5, 6, 10, 24, 27) who had the highest accuracy for uni-modal EEG feature or the same accuracy between uni-modal EEG feature and the multimodal one were excluded for visualization. Especially, the feature set 7 (EEG + PS) and set 6 (EEG + EDA) were most influential in increasing the possibility of accuracy improvement by multimodal signals.
3.3. Selected Features from EEG
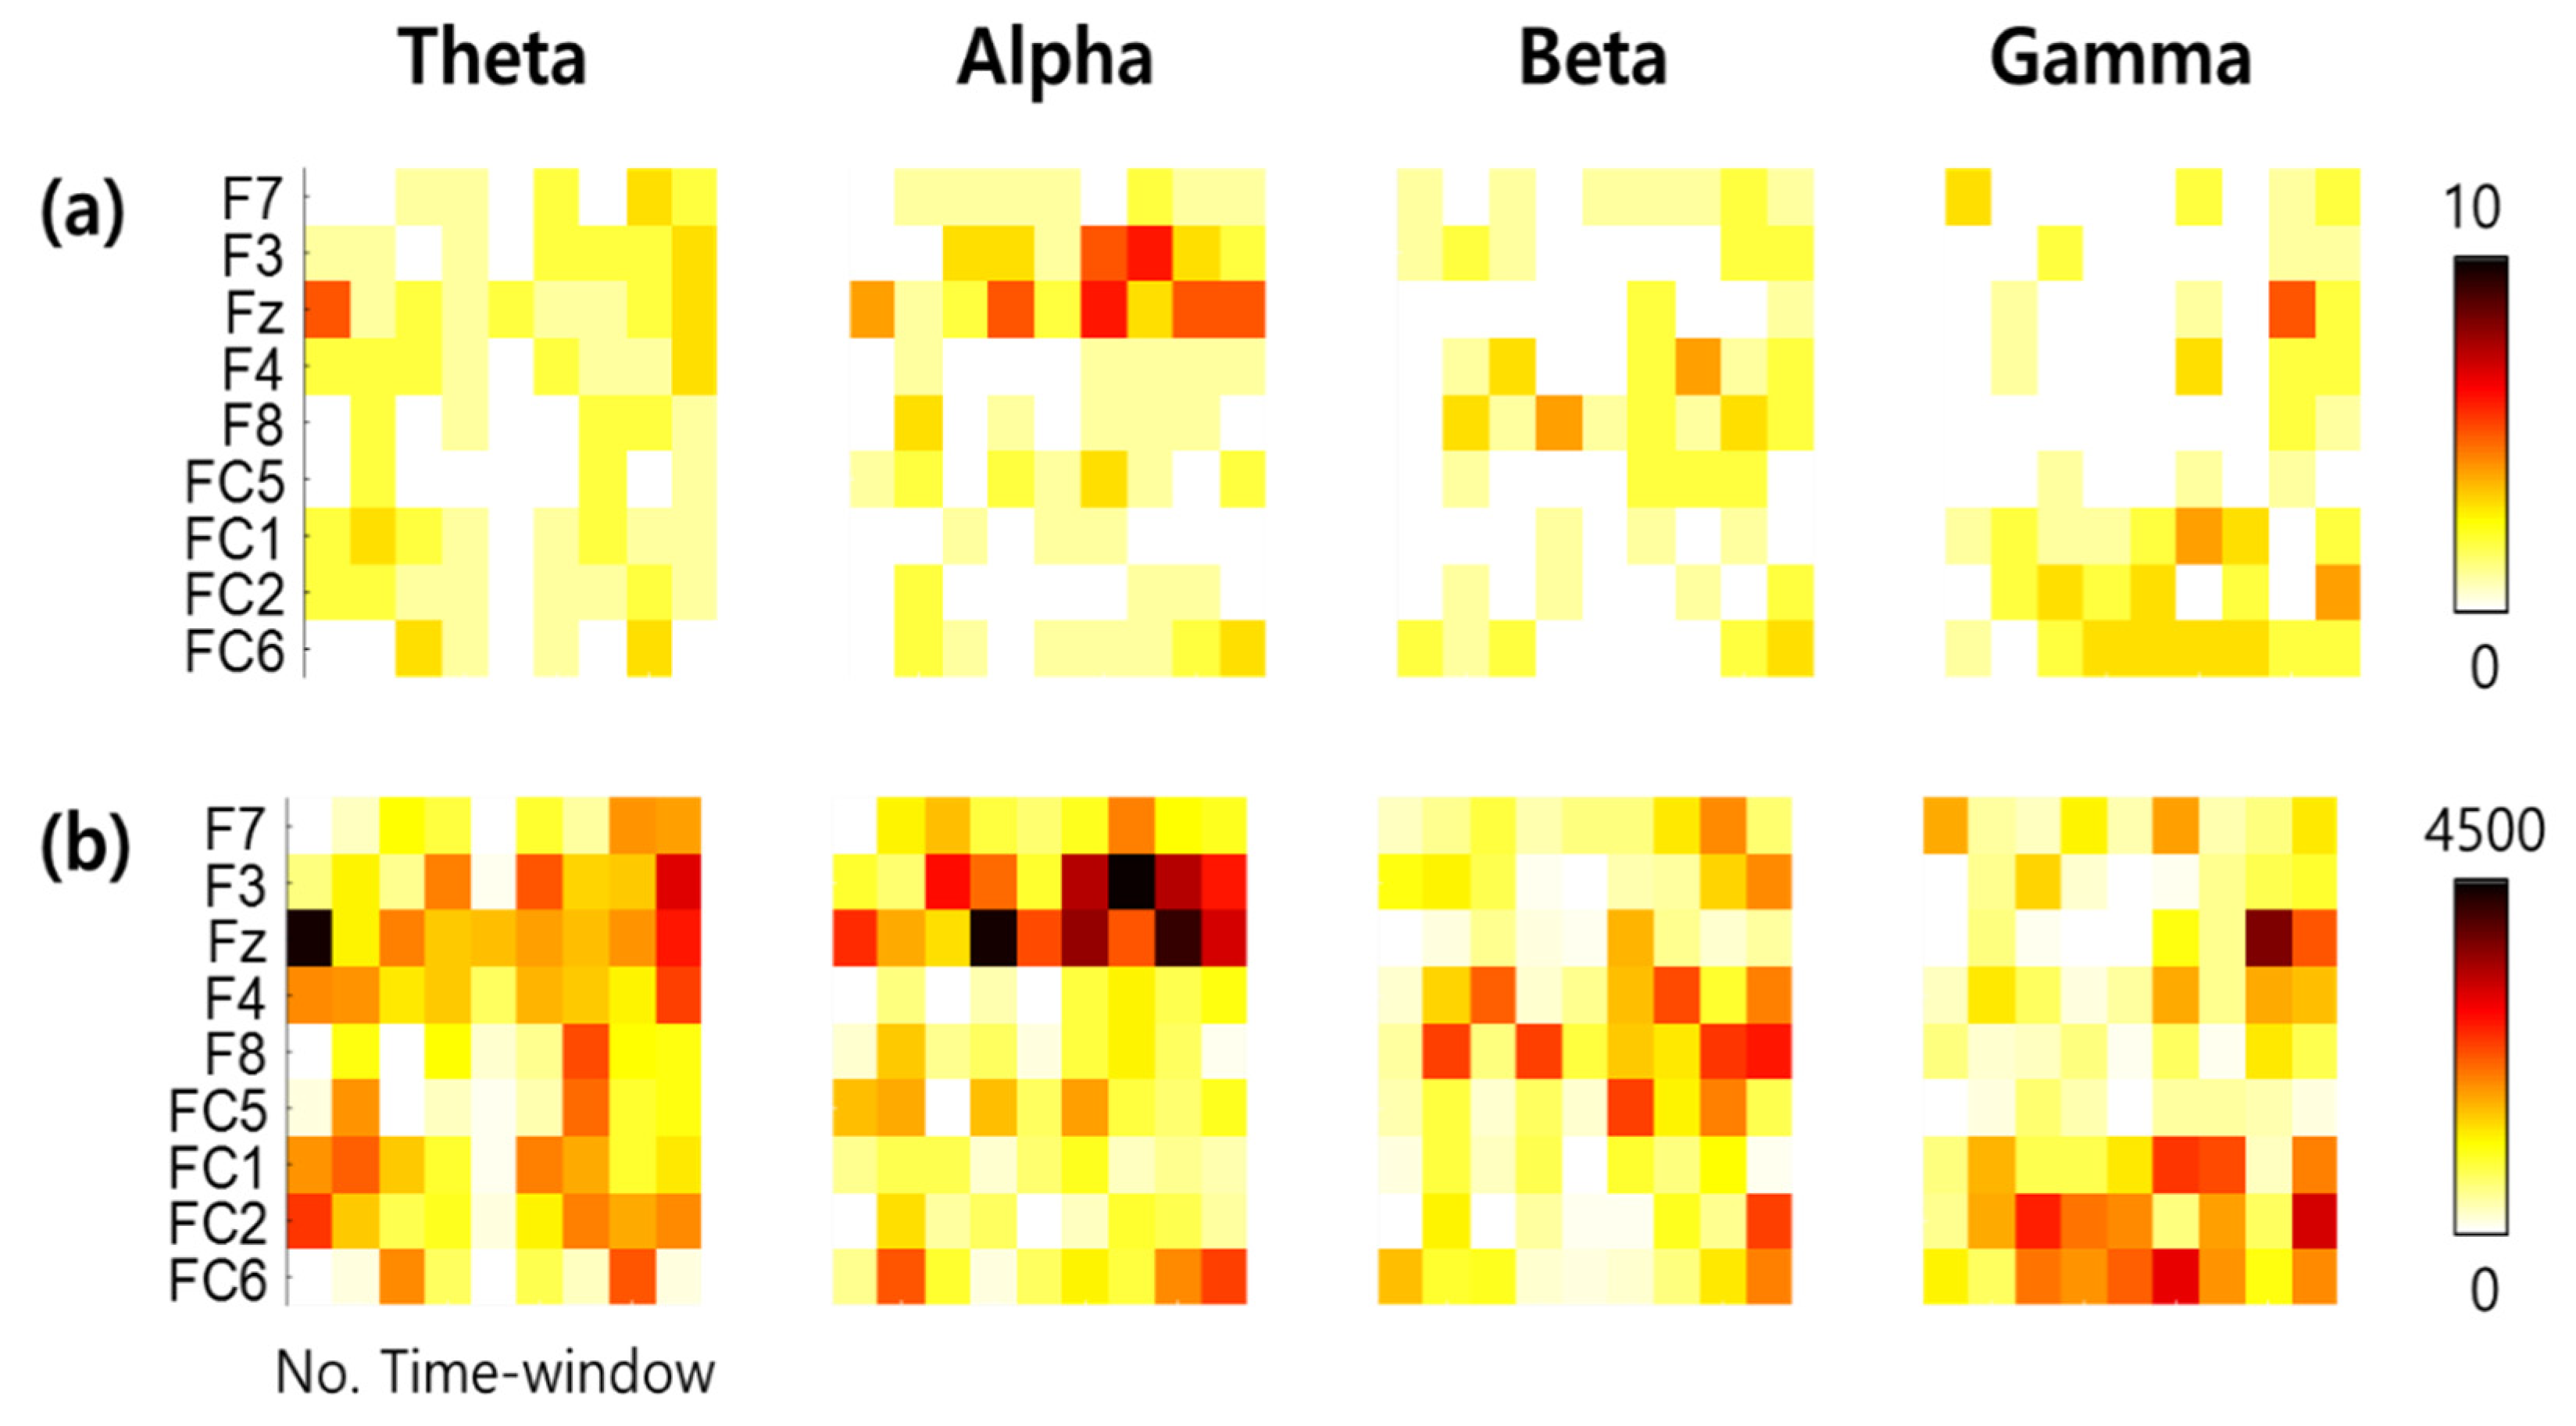
We selected twenty-dimensional feature vectors from 324-dimensional feature vectors of EEG features using LASSO. The most commonly selected features across participants were alpha power at F3 and Fz channels, followed by theta and gamma at Fz channel (Figure 9a). In addition, the most commonly selected features among all training sets for building models of all participants (i.e., 17,775 sets) were also alpha power at F3 (4,488 sets) and Fz (4,405 sets) and theta power at Fz (4,387 sets) (Figure 9b). Notably, gamma feature selection occurred more frequently over front-central channels (e.g., FC1, FC2, FC6) than frontal channels, whereas theta and alpha features over frontal channels were preferred.
4. Discussion
This study aimed to investigate whether multimodal biosignals from wearable sensors could be used to detect anxiety invoked by driving situations, and which signal or combination of signals would show the highest detection accuracy. We simultaneously measured four biosignals—EEG, PPG, EDA, and pupil size—and built a classifier to discriminate anxiety-invoked driving situations and normal ones from these biosignals. The results revealed that classification of EEG outperformed that of other signals in terms of average accuracy and cumulative feature counts. Specifically, classifiers tended to harness frontal theta, alpha and gamma powers of EEG to detect anxiety-invoked situations. Adding other biosignals such as EDA or pupil size to EEG further enhanced the detection performance in some participants.
The selected EEG features for anxiety detection might indicate neural processes involved in dealing with anxiety events. Frontal-midline theta oscillations may directly represent the emotional process of anxiety. It is widely known that anterior cingulate cortex (ACC) is involved in processing negative affects and generates theta oscillations at the frontal midline [25,26]. Another possible explanation is, that theta oscillations at frontal midline were engaged in attention demanding tasks [25,26,27,28]. For example, encountering sudden increases of traffic on road lanes or crossroads increased frontal midline theta power in a driving simulator where the external situation required attention for action derived from the new information [27]. The anxiety events used in our study delivered the new information requiring follow-up action (e.g., hit the brake) in driving environments, thus inducing theta oscillations at frontal midline. In addition, frontal gamma oscillations often appear along with frontal theta oscillations when attention is required for the task [29]. However, it is difficult to find a proper explanation for the alpha oscillations at frontal channels.
Despite dominance of EEG features in contribution to brain-computer interface (BCI) performance, some participants (i.e., 16 out of 23) exhibited better performance when other biosignals (i.e., EDA, pupil size or both) were added to EEG in BCIs. This leaves room for the feasibility of simpler biosignals, other than EEG, to be used in anxiety detection systems in the future. Yet, it should also be highlighted that the combination of multiple biosignals varies across individuals, suggesting that a system to detect anxiety may need personal customization, particularly in a vehicle. We attempted to extract a common feature set from all the participants and examine decoding performance using it. But, decoding performance was only close to a chance level. This might be because the features varied across individuals, as expected. In addition, further work is required to explore why all individuals did not display more improved accuracy for multimodal signals compared with EEG only. Nonetheless, our study highlights that EEG seems to be essential in the development of such a system.
Overall, the average accuracy achieved in this study is lower than other studies that detected driver’s states: 77% vs. {82%, 82.03%, 89.70%, 100%, 77.95%} [8,9,10,11,12]. However, other studies demonstrated the estimation of driver’s states other than anxiety, such as stress or specific emotions (happy and angry), where they discriminated these emotional states from a normal state. In contrast, our studies estimated changes in anxiety derived by sudden events in driving situation.
The present study contributes to the extraction of feasible biosignals for anxiety detection while driving. Furthermore, the analysis of neural data demonstrated that attention for action and processing negative affects were involved in driving with anxiety events. Our findings can be applied to systems for monitoring driver’s emotional states in smart cars. This research suggests the following directions for future research. Broadening the scope of the target group to novices who may feel anxiety more frequently or the elderly whose change of states are slower than normal drivers. In addition, future work should focus on enhancing the decoding accuracy of anxiety detection by applying feature selection methods, suggested in other emotion detection studies such as hybrid techniques (e.g., clustering, principal component analysis (PCA), etc.) [30,31].
Author Contributions
Conceptualization, S.L.; data curation, S.L. and T.L.; formal analysis, S.L., T.L. and T.Y.; funding acquisition, C.Y. and S.-P.K.; investigation, S.L.; methodology, S.L., T.L. and T.Y.; project administration, S.L. and C.Y.; resources, S.-P.K.; software, S.L., T.L. and T.Y.; supervision, S.-P.K.; validation, S.L. and T.L.; visualization, S.L.; writing—original draft, S.L.; writing—review & editing, S.-P.K. All authors have read and agreed to the published version of the manuscript.
Funding
This research was funded by the Electronics and Telecommunications Research Institute (ETRI), grant number 18ZS1300 (the development of smart context-awareness foundation technique for major industry acceleration) and by the Korean Government (MSIT), grant number 2017-0-00432 (development of non-invasive integrated BCI SW platform to control home appliances and external devices by user’s thought via AR/VR interface).
Conflicts of Interest
The authors declare no conflict of interest.
Appendix A

Table A1.
Descriptions of video with anxiety event.
| Video No. | Event Start | Event End | Description |
|---|---|---|---|
| 1 | 19 | 21 | Lane change of the front car from left side |
| 2 | 6 | 8 | Lane change of the front car from left side |
| 3 | 16 | 19 | Jaywalking from left side |
| 4 | 8 | 10 | Jaywalking from left side |
| 5 | 13 | 15 | Jaywalking from left side |
| 6 | 7 | 10 | Jaywalking from left side |
| 7 | 8 | 10 | Jaywalking from right side at night |
| 8 | 11 | 14 | Lane change of the front car from right side at night |
| 9 | 18 | 21 | Jaywalking from left side at night |
| 10 | 10 | 11 | Bicyclist from right side |
| 11 | 23 | 25 | Jaywalking from left side |
| 12 | 12 | 15 | Bicyclist from left side |
| 13 | 13 | 15 | Jaywalking from left side |
| 14 | 22 | 24 | Bicyclist from left side at a high speed |
| 15 | 18 | 20 | Jaywalking from left side at night |
| 16 | 19 | 21 | Pedestrian from left side |
| 17 | 16 | 18 | Wheelchair jaywalking from right side at the corner |
| 18 | 8 | 10 | Fast jaywalking from right side |
| 19 | 22 | 27 | Bus at the front changing lane from right side |
| 20 | 17 | 19 | Large vehicle passing by left side at night |
| 21 | 18 | 21 | Large vehicle at the front trying to change lane from left side |
| 22 | 18 | 21 | Large vehicle at the front trying to change lane from left side |
| 23 | 7 | 13 | Large vehicle at the front trying to change lane from right side |
| 24 | 1 | 6 | A sudden stop of a car at the front |
| 25 | 8 | 13 | The entrance of a bottleneck |
| 26 | 13 | 18 | Lane change of the front car from left side |
| 27 | 6 | 9 | Facing a car driving in reverse lane |
| 28 | 8 | 12 | Lane change of the front car from right side |
| 29 | 13 | 15 | Facing a car driving in reverse lane |
| 30 | 4 | 7 | Lane change of the front car from right side |
Appendix B
Table A2.
Individual decoding accuracy for each feature set using LR classifier with LOTO method (1 s window for EEG features).
Table A2.
Individual decoding accuracy for each feature set using LR classifier with LOTO method (1 s window for EEG features).
| Feature Set No. | 1 | 2 | 3 | 4 | 5 | 6 | 7 | 8 | 9 | 10 | 11 | 12 | 13 | 14 | 15 |
|---|---|---|---|---|---|---|---|---|---|---|---|---|---|---|---|
| Subject 1 | 0.8500 | 0.6750 | 0.1000 | 0.1750 | 0.7750 | 0.8750 | 0.7250 | 0.5750 | 0.6500 | 0.1250 | 0.7500 | 0.7250 | 0.7000 | 0.6000 | 0.7250 |
| Subject 2 | 0.7636 | 0.5818 | 0.4545 | 0.5636 | 0.6545 | 0.7636 | 0.6727 | 0.5273 | 0.5455 | 0.5091 | 0.6727 | 0.6545 | 0.6727 | 0.5273 | 0.6000 |
| Subject 3 | 0.7193 | 0.3684 | 0.2807 | 0.4211 | 0.7544 | 0.7368 | 0.7719 | 0.3333 | 0.4561 | 0.3860 | 0.7193 | 0.7193 | 0.7368 | 0.4035 | 0.6842 |
| Subject 4 | 0.8246 | 0.4912 | 0.5263 | 0.4561 | 0.7193 | 0.8246 | 0.8246 | 0.4737 | 0.5263 | 0.3684 | 0.7018 | 0.7719 | 0.7895 | 0.4912 | 0.7719 |
| Subject 5 | 0.7797 | 0.3220 | 0.4576 | 0.1186 | 0.7288 | 0.7797 | 0.7458 | 0.2881 | 0.3729 | 0.1017 | 0.6949 | 0.6949 | 0.7288 | 0.3559 | 0.6780 |
| Subject 6 | 0.8372 | 0.5814 | 0.5349 | 0.4884 | 0.7442 | 0.8372 | 0.7674 | 0.6047 | 0.4419 | 0.3953 | 0.7674 | 0.6744 | 0.7907 | 0.4419 | 0.7674 |
| Subject 7 | 0.5000 | 0.5500 | 0.0000 | 0.3000 | 0.6000 | 0.5500 | 0.4500 | 0.5000 | 0.4000 | 0.4000 | 0.6000 | 0.5000 | 0.4500 | 0.3500 | 0.4500 |
| Subject 9 | 0.8103 | 0.4655 | 0.5172 | 0.3793 | 0.7241 | 0.7414 | 0.8276 | 0.5000 | 0.4655 | 0.4828 | 0.6897 | 0.6724 | 0.7759 | 0.5172 | 0.6724 |
| Subject 10 | 0.7544 | 0.3333 | 0.2807 | 0.2632 | 0.7018 | 0.6842 | 0.7193 | 0.3158 | 0.3333 | 0.3684 | 0.6667 | 0.6842 | 0.6842 | 0.3509 | 0.6842 |
| Subject 11 | 0.7500 | 0.4464 | 0.1429 | 0.4643 | 0.6786 | 0.7500 | 0.8036 | 0.5179 | 0.4464 | 0.4821 | 0.6429 | 0.6964 | 0.7679 | 0.5000 | 0.6786 |
| Subject 16 | 0.9375 | 0.5625 | 0.5625 | 0.5000 | 0.9375 | 0.9375 | 1.0000 | 0.5625 | 0.6250 | 0.7500 | 0.8125 | 1.0000 | 1.0000 | 0.6875 | 0.9375 |
| Subject 17 | 0.5789 | 0.4474 | 0.5789 | 0.4737 | 0.6579 | 0.5789 | 0.5526 | 0.4474 | 0.4211 | 0.5263 | 0.6579 | 0.5526 | 0.5789 | 0.3947 | 0.5526 |
| Subject 18 | 0.6842 | 0.4737 | 0.3684 | 0.4386 | 0.6842 | 0.7368 | 0.6140 | 0.5439 | 0.5263 | 0.4211 | 0.7018 | 0.6667 | 0.6842 | 0.5789 | 0.6842 |
| Subject 19 | 0.7544 | 0.4561 | 0.5263 | 0.4912 | 0.7018 | 0.7018 | 0.7719 | 0.4035 | 0.4386 | 0.5088 | 0.6667 | 0.6842 | 0.7544 | 0.4386 | 0.6667 |
| Subject 20 | 0.7719 | 0.5088 | 0.5439 | 0.4035 | 0.7719 | 0.8070 | 0.8070 | 0.4912 | 0.4561 | 0.4561 | 0.8070 | 0.7368 | 0.8070 | 0.4561 | 0.7368 |
| Subject 21 | 0.6429 | 0.4821 | 0.5714 | 0.5714 | 0.6429 | 0.5893 | 0.5714 | 0.5536 | 0.5536 | 0.6429 | 0.6071 | 0.6786 | 0.6607 | 0.5893 | 0.6786 |
| Subject 23 | 0.8864 | 0.6136 | 0.5000 | 0.4318 | 0.8636 | 0.8864 | 0.9091 | 0.5000 | 0.6364 | 0.3636 | 0.8864 | 0.9318 | 0.8636 | 0.5909 | 0.9318 |
| Subject 24 | 0.7193 | 0.4386 | 0.5088 | 0.3509 | 0.5789 | 0.7018 | 0.6842 | 0.4561 | 0.3684 | 0.4561 | 0.6316 | 0.5789 | 0.6316 | 0.4035 | 0.5088 |
| Subject 25 | 0.8596 | 0.5088 | 0.5088 | 0.5088 | 0.8070 | 0.8772 | 0.8421 | 0.5614 | 0.5614 | 0.4737 | 0.8772 | 0.7719 | 0.8596 | 0.5965 | 0.8421 |
| Subject 26 | 0.7273 | 0.5818 | 0.4182 | 0.5273 | 0.6545 | 0.7273 | 0.7455 | 0.5273 | 0.5273 | 0.4909 | 0.6545 | 0.6364 | 0.7091 | 0.5091 | 0.6545 |
| Subject 27 | 1.0000 | 0.5882 | 0.4706 | 0.5294 | 0.9412 | 1.0000 | 1.0000 | 0.6471 | 0.5294 | 0.4118 | 0.8824 | 0.8824 | 0.9412 | 0.5294 | 0.8824 |
| Subject 28 | 0.7544 | 0.5088 | 0.5789 | 0.4211 | 0.7193 | 0.8070 | 0.7544 | 0.4912 | 0.5088 | 0.4035 | 0.7193 | 0.7544 | 0.7895 | 0.4737 | 0.7368 |
| Subject 29 | 0.8070 | 0.4561 | 0.3509 | 0.5263 | 0.7719 | 0.7719 | 0.8421 | 0.5088 | 0.5263 | 0.4737 | 0.7544 | 0.8421 | 0.8421 | 0.5614 | 0.7895 |
Table A3.
Average and maximum decoding accuracies for each feature set using two classifiers with two validation methods (1 s window for EEG features).
Table A3.
Average and maximum decoding accuracies for each feature set using two classifiers with two validation methods (1 s window for EEG features).
| Feature Set No. | 1 | 2 | 3 | 4 | 5 | 6 | 7 | 8 | 9 | 10 | 11 | 12 | 13 | 14 | 15 | |
|---|---|---|---|---|---|---|---|---|---|---|---|---|---|---|---|---|
| Avg. | LR_LOTO | 0.8335 | 0.6938 | 0.5620 | 0.5347 | 0.6887 | 0.8209 | 0.8321 | 0.6927 | 0.6117 | 0.5898 | 0.7015 | 0.7811 | 0.8100 | 0.6865 | 0.7162 |
| LR_CV | 0.6613 | 0.3925 | 0.1817 | 0.2835 | 0.6110 | 0.6545 | 0.6459 | 0.4038 | 0.4181 | 0.2941 | 0.6033 | 0.6049 | 0.6345 | 0.4269 | 0.5991 | |
| ANN_LOTO | 0.7455 | 0.5404 | 0.4623 | 0.4928 | 0.6597 | 0.7141 | 0.7078 | 0.5099 | 0.5073 | 0.5020 | 0.6562 | 0.6617 | 0.6852 | 0.4932 | 0.6320 | |
| ANN_CV | 0.5908 | 0.4875 | 0.3580 | 0.4448 | 0.5232 | 0.5938 | 0.5525 | 0.4584 | 0.4344 | 0.4250 | 0.4962 | 0.4978 | 0.5554 | 0.4476 | 0.4786 | |
| Max | LR_LOTO | 1.0000 | 1.0000 | 0.7000 | 0.7000 | 0.9500 | 1.0000 | 1.0000 | 1.0000 | 0.7500 | 0.7500 | 0.8864 | 1.0000 | 1.0000 | 1.0000 | 0.9500 |
| LR_CV | 1.0000 | 0.5500 | 0.6000 | 0.5500 | 0.9500 | 0.9500 | 1.0000 | 0.7500 | 0.6100 | 0.7500 | 0.8500 | 1.0000 | 1.0000 | 0.8000 | 0.9500 | |
| ANN_LOTO | 1.0000 | 0.6842 | 0.7000 | 0.6471 | 0.9412 | 0.9375 | 0.9412 | 0.6842 | 0.7000 | 0.7500 | 0.8824 | 0.8824 | 0.8750 | 0.5965 | 0.8824 | |
| ANN_CV | 0.9000 | 0.6500 | 0.6500 | 0.6000 | 0.8500 | 1.0000 | 0.8500 | 0.7000 | 0.6500 | 0.7000 | 0.8500 | 0.9500 | 0.8500 | 0.7000 | 0.8000 | |
Table A4.
Average and maximum decoding accuracies for each feature set using two classifiers with two validation methods (2 s window for EEG features).
Table A4.
Average and maximum decoding accuracies for each feature set using two classifiers with two validation methods (2 s window for EEG features).
| Feature Set No. | 1 | 2 | 3 | 4 | 5 | 6 | 7 | 8 | 9 | 10 | 11 | 12 | 13 | 14 | 15 | |
|---|---|---|---|---|---|---|---|---|---|---|---|---|---|---|---|---|
| Avg. | LR_LOTO | 0.4861 | 0.4808 | 0.3917 | 0.4316 | 0.4974 | 0.4941 | 0.4934 | 0.4828 | 0.4889 | 0.4370 | 0.4980 | 0.4961 | 0.4924 | 0.4936 | 0.5010 |
| LR_CV | 0.4316 | 0.3907 | 0.1619 | 0.2772 | 0.4470 | 0.4423 | 0.4488 | 0.4102 | 0.4051 | 0.3041 | 0.4560 | 0.4627 | 0.4577 | 0.4097 | 0.4646 | |
| ANN_LOTO | 0.5104 | 0.5350 | 0.4530 | 0.4685 | 0.4929 | 0.5267 | 0.5104 | 0.5197 | 0.4791 | 0.5014 | 0.5016 | 0.5026 | 0.5130 | 0.4904 | 0.5031 | |
| ANN_CV | 0.4512 | 0.4780 | 0.3456 | 0.4236 | 0.4441 | 0.4223 | 0.4395 | 0.4309 | 0.4535 | 0.4407 | 0.4459 | 0.4372 | 0.4233 | 0.4101 | 0.4370 | |
| Max | LR_LOTO | 0.6842 | 0.8095 | 0.5652 | 0.6842 | 0.7619 | 0.7632 | 0.7368 | 0.6316 | 0.7143 | 0.6786 | 0.7143 | 0.7619 | 0.7105 | 0.7000 | 0.7000 |
| LR_CV | 0.6083 | 0.7667 | 0.5000 | 0.5500 | 0.7000 | 0.6333 | 0.7083 | 0.7167 | 0.6333 | 0.5000 | 0.7000 | 0.7500 | 0.7167 | 0.6000 | 0.6500 | |
| ANN_LOTO | 0.7000 | 0.7193 | 0.7368 | 0.6140 | 0.7143 | 0.6316 | 0.6842 | 0.7895 | 0.6842 | 0.6842 | 0.6316 | 0.7619 | 0.6607 | 0.6140 | 0.6500 | |
| ANN_CV | 0.7200 | 0.6667 | 0.6000 | 0.6000 | 0.7500 | 0.6550 | 0.6167 | 0.6000 | 0.7000 | 0.6500 | 0.6500 | 0.6150 | 0.5900 | 0.6500 | 0.6000 | |
Appendix C
Figure A1.
The cumulative feature count results from each of four biosignals.

Figure A2.
The cumulative feature count results from all possible combinations of three biosignals out of four.
Figure A2.
The cumulative feature count results from all possible combinations of three biosignals out of four.

References
- Eyben, F.; Wöllmer, M.; Poitschke, T.; Schuller, B.; Blaschke, C.; Faerber, B.; Nguyen-Thien, N. Emotion on the Road—Necessity, Acceptance, and Feasibility of Affective Computing in the Car. Adv. Hum.-Comput. Interaction 2010, 2010. [Google Scholar] [CrossRef] [Green Version]
- Chan, M.; Singhal, A. Emotion matters: Implications for distracted driving. Saf. Sci. 2015, 72, 302–309. [Google Scholar] [CrossRef]
- de Groot-Mesken, J. Measuring Emotions in Traffic. In Proceedings of the ESF Congress Towards Safer Road Traffic in Southern Europe, Ankara, Turkey, 31 May–2 June 2001. [Google Scholar]
- Jeon, M.; Walker, B.N.; Gable, T.M. The effects of social interactions with in-vehicle agents on a driver’s anger level, driving performance, situation awareness, and perceived workload. Appl. Ergon. 2015, 50, 185–199. [Google Scholar] [CrossRef]
- Nass, C.; Jonsson, I.-M.; Harris, H.; Reaves, B.; Endo, J.; Brave, S.; Takayama, L. Improving automotive safety by pairing driver emotion and car voice emotion. In CHI ‘05 Extended Abstracts on Human Factors in Computing Systems; ACM: Portland, OR, USA, 2005; pp. 1973–1976. [Google Scholar]
- Alberdi, A.; Aztiria, A.; Basarab, A. Towards an automatic early stress recognition system for office environments based on multimodal measurements: A review. J. Biomed. Inform. 2016, 59, 49–75. [Google Scholar] [CrossRef]
- Giannakakis, G.; Grigoriadis, D.; Giannakaki, K.; Simantiraki, O.; Roniotis, A.; Tsiknakis, M. Review on psychological stress detection using biosignals. IEEE Trans. Affect. Comput. 2019, 1. [Google Scholar] [CrossRef]
- Rigas, G.; Goletsis, Y.; Fotiadis, D.I. Real-Time Driver’s Stress Event Detection. IEEE Trans. Intell. Transp. Syst. 2012, 13, 221–234. [Google Scholar] [CrossRef]
- Singh, R.R.; Conjeti, S.; Banerjee, R. Assessment of Driver Stress from Physiological Signals collected under Real-Time Semi-Urban Driving Scenarios. Int. J. Comput. Intell. Syst. 2014, 7, 909–923. [Google Scholar] [CrossRef] [Green Version]
- Chen, L.-l.; Zhao, Y.; Ye, P.-f.; Zhang, J.; Zou, J.-z. Detecting driving stress in physiological signals based on multimodal feature analysis and kernel classifiers. Expert Syst. Appl. 2017, 85, 279–291. [Google Scholar] [CrossRef]
- Ooi, J.; Ahmad, S.; Ishak, A.; Nisa, K.; Minhad, N.A.; Ali, S.; Yu Zheng, C. Grove: An auxiliary device for sympathetic assessment via EDA measurement of neutral, stress, and anger emotions during simulated driving conditions. Int. J. Med Eng. Inform. 2018, 10, 16. [Google Scholar] [CrossRef]
- Fan, X.; Bi, L.; Chen, Z. Using EEG to Detect Drivers’ Emotion with Bayesian Networks. In Proceedings of the 2010 International Conference on Machine Learning and Cybernetics, Qingdao, China, 11–14 July 2010; pp. 1177–1181. [Google Scholar]
- Healey, J.A.; Picard, R.W. Detecting stress during real-world driving tasks using physiological sensors. IEEE Trans. Intell. Transp. Syst. 2005, 6, 156–166. [Google Scholar] [CrossRef] [Green Version]
- Barnard, M.P.; Chapman, P. Are anxiety and fear separable emotions in driving? A laboratory study of behavioural and physiological responses to different driving environments. Accid. Anal. Prev. 2016, 86, 99–107. [Google Scholar] [CrossRef] [PubMed]
- Lee, S.; Lee, T.; Yang, T.; Seomoon, E.; Yoon, C.; Kim, S.-P. Neural correlates of anxiety induced by environmental events during driving. In Proceedings of the TENCON 2018-2018 IEEE Region 10 Conference, Jeju Island, Korea, 28–31 October 2018. [Google Scholar]
- Taylor, J.; Deane, F.; Podd, J. The Relationship Between Driving Anxiety and Driving Skill: A Review of Human Factors and Anxiety-Performance Theories to Clarify Future Research Needs. N. Z. J. Psychol. 2008, 37, 28–37. [Google Scholar]
- HazardPerceptionTest.net Hazard Perception Tips. Available online: https://hazardperceptiontest.net/hazard-perception-tips/ (accessed on 9 November 2019).
- Chang, C.; Hsu, S.; Pion-Tonachini, L.; Jung, T. Evaluation of Artifact Subspace Reconstruction for Automatic EEG Artifact Removal. In Proceedings of the 2018 40th Annual International Conference of the IEEE Engineering in Medicine and Biology Society (EMBC), Honolulu, HI, USA, 18–21 July 2018; pp. 1242–1245. [Google Scholar]
- Aftanas, L.I.; Pavlov, S.V.; Reva, N.V.; Varlamov, A.A. Trait anxiety impact on the EEG theta band power changes during appraisal of threatening and pleasant visual stimuli. Int. J. Psychophysiol. 2003, 50, 205–212. [Google Scholar] [CrossRef]
- Giannakakis, G.; Grigoriadis, D.; Tsiknakis, M. Detection of stress/anxiety state from EEG features during video watching. In Proceedings of the 2015 37th Annual International Conference of the IEEE Engineering in Medicine and Biology Society (EMBC), Milan, Italy, 25–29 August 2015; pp. 6034–6037. [Google Scholar]
- Yeo, H.-S.; Lee, J.-W.; Yoon, G.-W.; Hwang, H.-T. Method and Apparatus for Evaluating Human Stress Using Photoplethysmography. U.S. Patent 7613486, 3 November 2009. [Google Scholar]
- Boucsein, W. Electrodermal Acitivity, 2nd ed.; Springer: Berlin/Heidelberg, Germany, 2011. [Google Scholar]
- Partala, T.; Surakka, V. Pupil size variation as an indication of affective processing. Int. J. Hum.-Comput. Stud. 2003, 59, 185–198. [Google Scholar] [CrossRef]
- Klingner, J.; Kumar, R.; Hanrahan, P. Measuring the task-evoked pupillary response with a remote eye tracker. In Proceedings of the 2008 Symposium on Eye Tracking Research & Applications, Savannah, GA, USA, 26–28 March 2008; ACM: Savannah, GA, USA, 2008; pp. 69–72. [Google Scholar]
- Cavanagh, J.F.; Shackman, A.J. Frontal midline theta reflects anxiety and cognitive control: Meta-analytic evidence. J. Physiol.-Paris 2015, 109, 3–15. [Google Scholar] [CrossRef] [PubMed] [Green Version]
- Bush, G.; Luu, P.; Posner, M.I. Cognitive and emotional influences in anterior cingulate cortex. Trends Cogn. Sci. 2000, 4, 215–222. [Google Scholar] [CrossRef]
- Laukka, S.J.; Järvilehto, T.; Alexandrov, Y.I.; Lindqvist, J. Frontal midline theta related to learning in a simulated driving task. Biol. Psychol. 1995, 40, 313–320. [Google Scholar] [CrossRef]
- Mizuki, Y.; Suetsugi, M.; Ushijima, I.; Yamada, M. Differential effects of dopaminergic drugs on anxiety and arousal in healthy volunteers with high and low anxiety. Prog. Neuro-Psychopharmacol. Biol. Psychiatry 1997, 21, 573–590. [Google Scholar] [CrossRef]
- Ishii, R.; Canuet, L.; Ishihara, T.; Aoki, Y.; Ikeda, S.; Hata, M.; Katsimichas, T.; Gunji, A.; Takahashi, H.; Nakahachi, T.; et al. Frontal midline theta rhythm and gamma power changes during focused attention on mental calculation: An MEG beamformer analysis. Front. Hum. Neurosci. 2014, 8, 406. [Google Scholar] [CrossRef] [PubMed] [Green Version]
- Nogueira, P.A.; Rodrigues, R.; Oliveira, E.; Nacke, L.E. A Hybrid Approach at Emotional State Detection: Merging Theoretical Models of Emotion with Data-Driven Statistical Classifiers. In Proceedings of the 2013 IEEE/WIC/ACM International Joint Conferences on Web Intelligence (WI) and Intelligent Agent Technologies (IAT), Atlanta, GA, USA, 17–20 November 2013; pp. 253–260. [Google Scholar]
- Sharma, N.; Gedeon, T. Objective measures, sensors and computational techniques for stress recognition and classification: A survey. Comput. Methods Programs Biomed. 2012, 108, 1287–1301. [Google Scholar] [CrossRef] [PubMed]
Figure 1.
Experimental task and multimodal biosignal recording. In Session 1, participants watched video clips with or without anxiety events and answered whether they felt anxiety. In Session 2, participants indicated a point where in the video they felt anxiety.
Figure 1.
Experimental task and multimodal biosignal recording. In Session 1, participants watched video clips with or without anxiety events and answered whether they felt anxiety. In Session 2, participants indicated a point where in the video they felt anxiety.

Figure 2.
EEG montage for the present study. Colored channels were analyzed in the study.

Figure 3.
Examples of photoplethysmography (PPG) and electrodermal activity (EDA) signals from subject 1. (a) The description of peak-to-peak interval (PPI) (red) and PPG amplitude (green). (b) The description of EDA amplitude.
Figure 3.
Examples of photoplethysmography (PPG) and electrodermal activity (EDA) signals from subject 1. (a) The description of peak-to-peak interval (PPI) (red) and PPG amplitude (green). (b) The description of EDA amplitude.

Figure 4.
The example of preprocessed pupil size data. The sudden shrink of velocity (red arrow) indicated eye blinking which can be removed by preprocessing.
Figure 4.
The example of preprocessed pupil size data. The sudden shrink of velocity (red arrow) indicated eye blinking which can be removed by preprocessing.

Figure 5.
The description of leave-one-trial-out (LOTO) within 1 subject.

Figure 6.
Visualization of the method for extracting the best feature. (a) Individual level, (b) Participants level.
Figure 6.
Visualization of the method for extracting the best feature. (a) Individual level, (b) Participants level.

Figure 7.
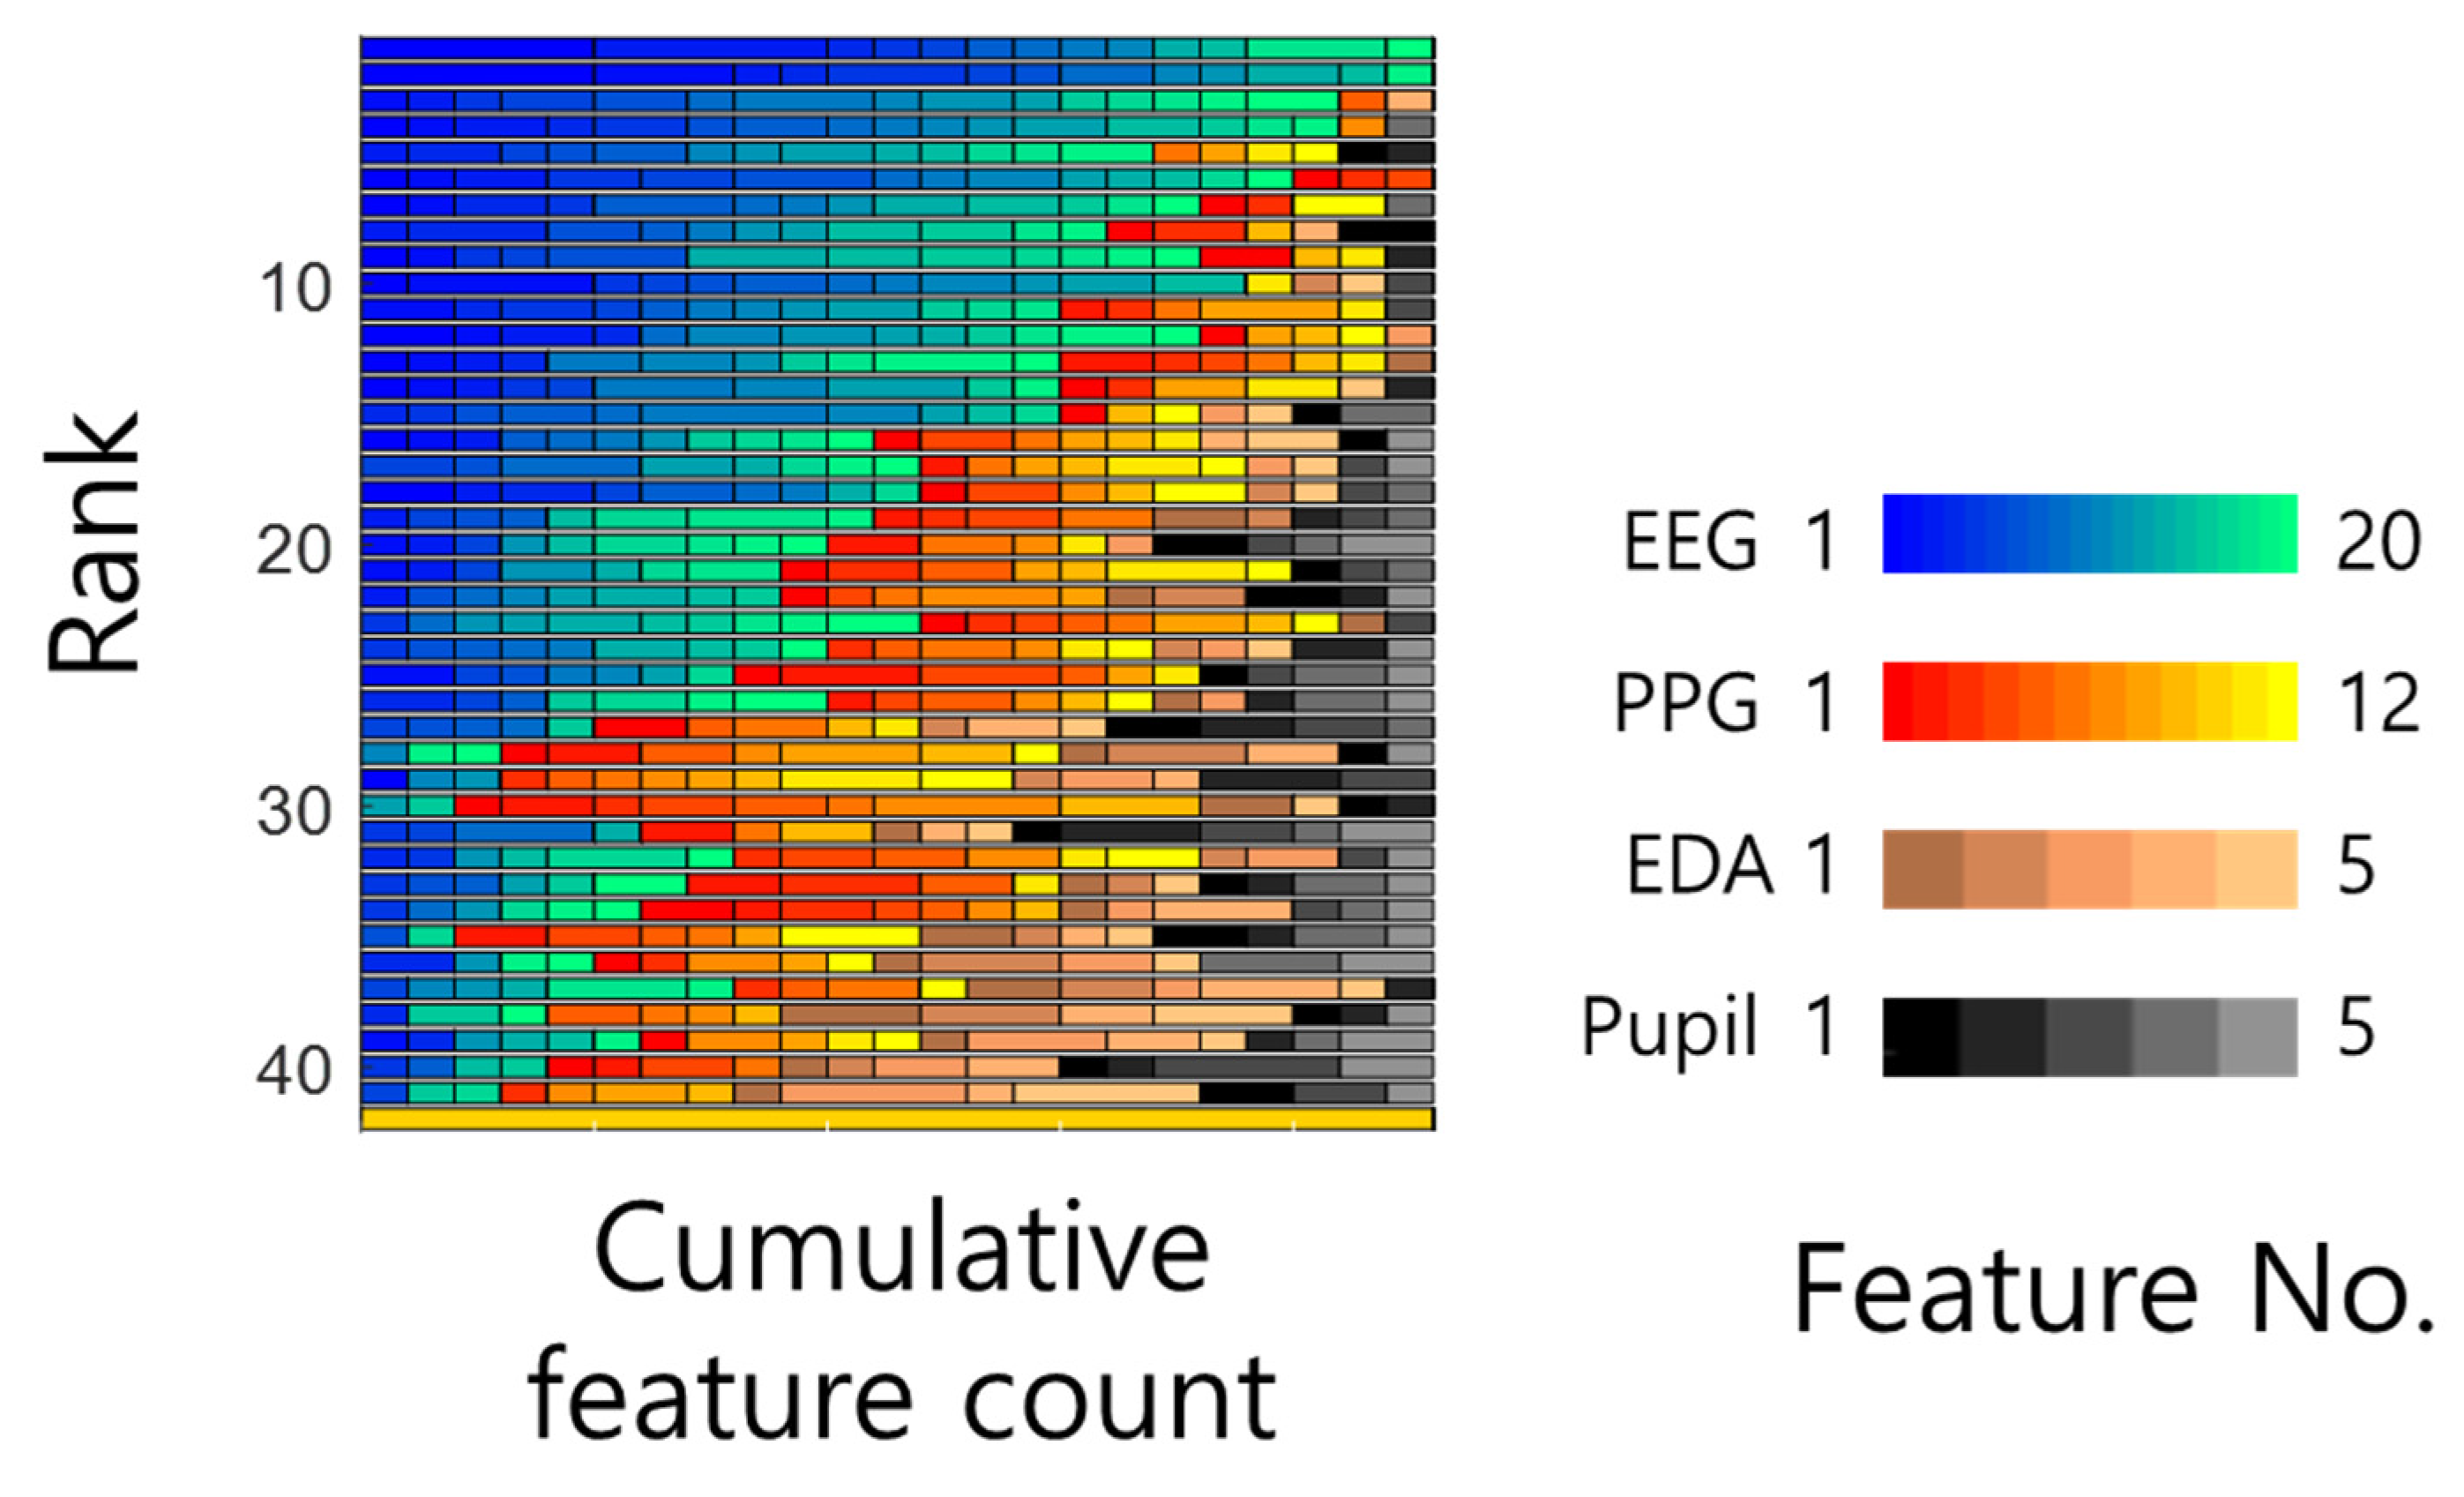
The cumulative feature count according to rank of weights from the classifier using the feature set composed of all 4 signals.
Figure 7.
The cumulative feature count according to rank of weights from the classifier using the feature set composed of all 4 signals.

Figure 8.
Improved decoding accuracy of best multimodal feature set compared to uni-modal feature set of EEG.
Figure 8.
Improved decoding accuracy of best multimodal feature set compared to uni-modal feature set of EEG.

Figure 9.
Frequencies of selected features by least absolute shrinkage and selection operator (LASSO). (a) The sum of participants out of 23 for the features that were selected by LASSO for more than 50% of trials. The darker colored feature represents that it was used for decoding anxiety by more participants. (b) The sum of training sets out of 17,775 for the features that were selected by LASSO.

Table 1.
The descriptions of photoplethysmography (PPG) features.
| No. | Feature | Description |
|---|---|---|
| 1 | PPG amplitude mean | The average of PPG amplitude [0 10] |
| 2 | PPG amplitude std. | The standard deviation of PPG amplitude [0 10] |
| 3 | PPG amplitude max | The maximum amplitude of PPG [0 10] |
| 4 | PPG amplitude min | The minimum amplitude of PPG [0 10] |
| 5 | PPI mean difference | PPG amplitude mean [0 10]—PPG amplitude mean [−10 0] |
| 6 | PPI std. difference | PPG amplitude std. [0 10]—PPG amplitude std. [−10 0] |
| 7 | PPI length difference | Mean PPG length [0 10]—Mean PPG length [−10 0] |
| 8 | PPI irregularity difference | Mean PPG irregularity [0 10]—Mean PPG irregularity [−10 0] |
| 9 | nPPI difference | nPPI [0 10]—nPPI [−10 0] |
| 10 | Fast PPIpost count difference | Fast PPIpost count [0 10]—Fast PPIpost count [−10 0] |
| 11 | LF/HF ratio | The ratio of low frequency (LF: 0.04~0.15 Hz) to high frequency (HF: 0.15~0.4 Hz) [0 10] |
| 12 | PPI coefficient of variation | PPI std. [0 10]/PPI mean [0 10] |
Table 2.
The estimated number of anxiety moments for each video with anxiety events.
| Stimuli No. | Lambda from Poisson Fitting | |||||||||
|---|---|---|---|---|---|---|---|---|---|---|
| 1–10 | 1.103 | 1.034 | 1.000 | 1.000 | 1.138 | 0.828 | 1.000 | 1.276 | 1.103 | 1.345 |
| 11–20 | 1.034 | 1.000 | 0.897 | 1.034 | 1.000 | 1.138 | 1.069 | 1.138 | 0.966 | 0.655 |
| 21–30 | 1.276 | 0.931 | 0.552 | 0.414 | 0.483 | 1.069 | 1.034 | 1.103 | 1.172 | 1.103 |
Table 3.
The performance comparison between feature sets.
| No. | Feature Set | Average Accuracy | Maximum Accuracy | # Participants Above Chance Level | # Participants Above Accuracy of EEG |
|---|---|---|---|---|---|
| 1 | EEG | 0.7701 | 1.0000 | 22 | - |
| 2 | PPG | 0.4975 | 0.6750 | 11 | 1 |
| 3 | EDA | 0.4253 | 0.5789 | 11 | 0 |
| 4 | PS | 0.4262 | 0.5714 | 6 | 0 |
| 5 | EEG + PPG | 0.7310 | 0.9412 | 23 | 3 |
| 6 | EEG + EDA | 0.7681 | 1.0000 | 23 | 7 |
| 7 | EEG + PS | 0.7567 | 1.0000 | 22 | 9 |
| 8 | PPG + EDA | 0.4926 | 0.6471 | 11 | 0 |
| 9 | PPG + PS | 0.4920 | 0.6500 | 12 | 0 |
| 10 | EDA + PS | 04347 | 0.7500 | 5 | 0 |
| 11 | EEG + PPG + EDA | 0.7202 | 0.8864 | 23 | 5 |
| 12 | EEG + PPG + PS | 0.7178 | 1.0000 | 22 | 4 |
| 13 | EEG + EDA + PS | 0.7486 | 0.6875 | 22 | 7 |
| 14 | PPG + EDA + PS | 0.4934 | 1.0000 | 11 | 0 |
| 15 | All | 0.7093 | 0.9376 | 22 | 2 |
© 2020 by the authors. Licensee MDPI, Basel, Switzerland. This article is an open access article distributed under the terms and conditions of the Creative Commons Attribution (CC BY) license (http://creativecommons.org/licenses/by/4.0/).
Share and Cite
MDPI and ACS Style
Lee, S.; Lee, T.; Yang, T.; Yoon, C.; Kim, S.-P. Detection of Drivers’ Anxiety Invoked by Driving Situations Using Multimodal Biosignals. Processes 2020, 8, 155. https://0-doi-org.brum.beds.ac.uk/10.3390/pr8020155
AMA Style
Lee S, Lee T, Yang T, Yoon C, Kim S-P. Detection of Drivers’ Anxiety Invoked by Driving Situations Using Multimodal Biosignals. Processes. 2020; 8(2):155. https://0-doi-org.brum.beds.ac.uk/10.3390/pr8020155
Chicago/Turabian StyleLee, Seungji, Taejun Lee, Taeyang Yang, Changrak Yoon, and Sung-Phil Kim. 2020. "Detection of Drivers’ Anxiety Invoked by Driving Situations Using Multimodal Biosignals" Processes 8, no. 2: 155. https://0-doi-org.brum.beds.ac.uk/10.3390/pr8020155
Note that from the first issue of 2016, this journal uses article numbers instead of page numbers. See further details here.