Article

Hydrothermal Polymerization Catalytic Process Effect of Various Organic Wastes on Reaction Time, Yield, and Temperature

1
PCS Technologies Inc., #204-3800 Westbrook Mall, UBC, Vancouver, BC V6S 2L9, Canada
2
Department of Mechanical Design Engineering, Hanyang University, Seongdong-gu, Seoul 04763, Korea
3
Department of Mechanical Engineering, Hanyang University, Ansan, Gyeonggi-do 15588, Korea
*
Author to whom correspondence should be addressed.
Submission received: 13 November 2019 / Revised: 29 February 2020 / Accepted: 3 March 2020 / Published: 6 March 2020

Abstract

:
The purpose of this study is to optimize the processing conditions (temperature, pressure, process time, yield rate) for the conversion of biomass to a high-energy density biofuel. The hydrothermal polymerization (HTP) catalytic process has been developed for production of biofuel via hydrothermal processing using an acid-based catalyst. This study has shown that the HTP catalytic process for a reference feedstock lowered the temperature by 10 to 40 °C, reduced the pressure requirement by 1 to 2 MPa, increased the rate of yield by 22%, and shortened the total processing time by up to 3 h when compared to the conventional hydrothermal carbonization (HTC) process. FTIR spectrum analysis of the HTP catalytic biofuel has shown that lignin in the biomass is preserved, while the pure HTC process destroyed the lignin in the biomass. GC/MS analysis of the process liquid determined the changes of the intermediate soluble components as a function of time. By measuring the 2,5-hydroxymethyl furfuralde concentration in solution, an endpoint determination could be made. This study also determined the approximate analysis of the HTP biofuel from various organic wastes such as cotton, cow manure, wood waste, paper waste, sugarcane bagasse waste, and food waste.

1. Introduction

Four different methods for hydrolysis of cellulose have been developed over the last several decades—catalysis using mineral acids, enzyme-driven reactions, subcritical and supercritical water, and solid catalysts for hydrogenolysis [1]. Recently, the solid catalyst has been in the spotlight due to its ability to overcome drawbacks of the first three methods, such as separation of products and catalysts, corrosion hazards, and severe controls of enzymes, waste fluids, and reaction conditions [2]. However, for commercial purposes, the solid catalysts face cost issues against the sulfuric and mineral acid catalyst, which are widely accepted technologies that have been used in the industry since 1940 [3,4].
Cellulose, a β1-4 polymer of glucose, is the most abundant organic compound on the planet, but there are other aldose and ketose polymers that are important in a typical organic waste stream. For example, glucose can be easily fermented to alcohol for a fuel, while xylose, an important ketose, cannot be fermented. The lignin and extractives found in many of the feedstock can actually poison the biological processes used in the production of an ethanol. Thus, the process we are working towards is nonspecific, in that all the components of the organic waste stream should be utilized in producing the fuel. The hydrothermal polymerization (HTP) catalytic process in our study uses the acid catalyst to convert the biomass, not to a char, but to a solid branched polymer that makes a hard pellet with a high energy density. The acid catalyst is comprised of an acid having a pKa in the range of 1.5 to 3.85. Specifically, a weak organic acid such as oxalic, citric, or malonic acid has been used. The process maintains the acidic conditions of a pH less than 4 to convert the feedstock to biofuels in the temperature range of 180 to 240 °C [5,6]. The process conditions for the HTP catalytic process are milder than the typical hydrothermal carbonization (HTC) process, thus resulting in a lower capital cost and operating costs of an operating biofuel plant. Additionally, the material produced by HTC is a char-like material that has little binding abilities and needs a binder to make the material into a pellet. In contrast, the HTP catalytic process developed is a polymer that easily binds into pellets without a binder.
We have looked at several feedstocks that could be processed in the polycarbon solid reactor system. In particular, the two feedstocks of interest have been studied in the project. The HTP catalytic process is based on the conversion of sugar polymers such as cellulose, amylase, hemicelluloses etc., into a solid high-energy density biofuel that can be used as a sustainable feedstock replacement for coal [5,6]. Initial work has focused on mixed wood feedstock, as it is an excellent representative feedstock for the process and will to be a main constituent for most source-separated municipal solid waste (MSW) streams.
Previous works surrounding HTC for biofuel generation have handled various feedstocks such as MSW, paper, food waste, and animal waste [7,8,9,10] that draw an immediate demand for commercialization technology of the HTC. Even though their works have had meaningful results and made significant contributions towards the production of biofuels, their cooking process time is unrealistically long for manufacturing purposes, which ranges from 3–4 to 96 h with or without a catalyst [7,8,11,12]. Therefore, the main objective of this research is to seek a feasible and economical HTP catalytic process for the production of biofuels in terms of a faster reaction time, a higher yield rate, and a lower temperature/pressure of the process, which are critical design criteria for wet-based biofuel manufacturing purposes.

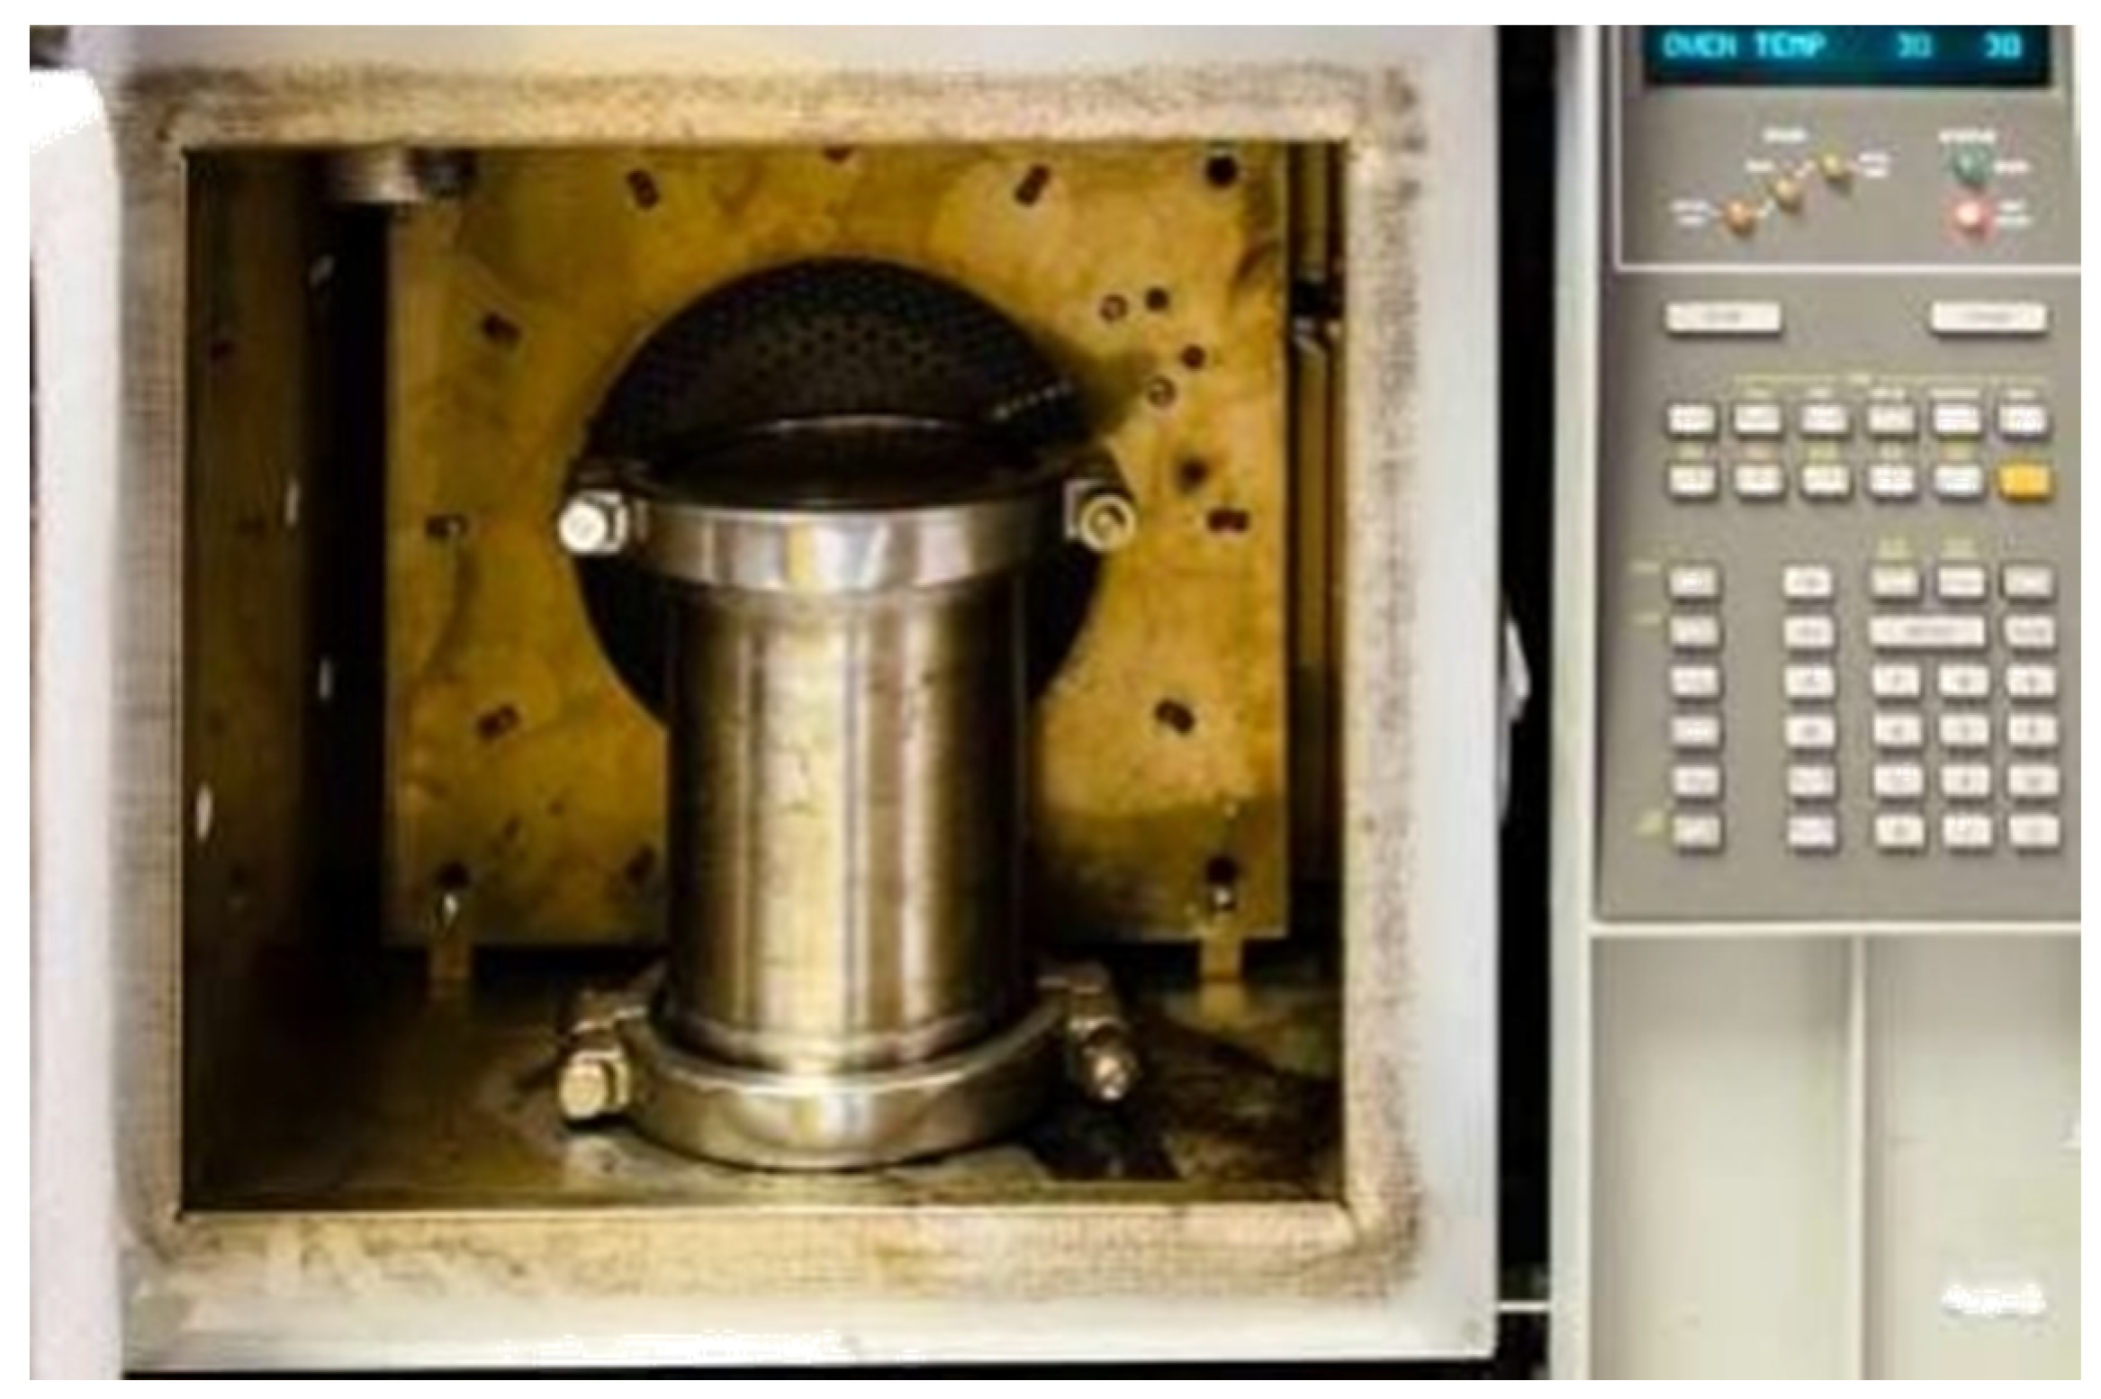
2. Experimental Setup and Procedure

The reactor has a simple design. It is a pressure vessel with large ports on the top and bottom, to allow access and egress of the feedstock and the resulting biofuel. The design was conceived as a method of utilizing the waste steam that was left over after the finishing of processing of the biofuel. The HTP biofuel process is a simple catalyzed hydrothermal polymerization of the sugar components in the waste to a solid biofuel with an energy density approximately 27 MJ/kg. The process conditions are typically 240 °C and 3.4 MPa (Figure 1).

2.1. Technical Procedures

Representative samples of the feedstock were tested in both a 1-L stainless steel reactor and in a 100 mL sealed reactor (Figure 2). The use of the smaller 100 mL reactors allowed multiple tests to occur at the same time. Thus, the use of these smaller reactors resulted in a wider survey of process conditions than would otherwise occur using a larger reactor. Preliminary results were then confirmed in the 1 L reactor, which was ten times scale up from the 100 mL reactors. The 100 mL reactor was constructed using a 10-inch-long section of 1 inch outside diameter. A total of 316 stainless steel tubes were capped at each end with a 1 inch Swageloc® fitting. The reactors were designed to withstand pressures in excess of 10 MPa, although in the experiments conducted, the pressure was typically below 3.4 MPa. The pressure in the reactor is the sum of the saturated water pressure at the operational temperature and any gas that is evolved by the reaction chemistry.
The reactors were less than 70% full of catalyst and feedstock, due to the expansion of water at the operating temperature. Once the reactors were filled, the reactors were then flushed with an inert gas and sealed. The processing was accomplished by heating the sealing the reactor in a Hewlett Packard 5890 GC oven that was repurposed for the processing of biofuel. The reactors were heated at 10 °C per minute to the process temperature and held at the proscribed time. Cooling was done by forced air or by immersion in a tank of cold water.
Postbiofuel conversion processing followed the general outline presented below. After cooling, the reactors were weighed to determine if the reactor had leaked. If the reactor leaked, the results were discarded and the experiment was repeated. After weighing, the reactor was held in an upright position and the seal on the upper Swageloc® fitting was cracked open. Any gas buildup was allowed to dissipate prior to fully opening the reactor and it was weighed again to determine the mass loss due to gas evolution. The liquid and solid biofuel from the reactor was separated using vacuum filtration with a Buchner funnel and Whatman #1 filter paper. The catalyst solution was measured and reserved for further measurement while the solid biofuel was washed with the rinse water used to flush out the reactor. The reactor was rinsed several times to ensure that most of the biofuel was recovered. The washed solids were retained and dried in an oven at 70 °C for 24 h or until dry as determined by constant mass.

2.2. Analysis for Characterization

The biofuel was tested using several methodologies in the laboratory. The recovered liquid containing the used catalyst was analyzed using GC/MS. To determine the higher heating value (HHV) of a fuel, an Oxygen Bomb Calorimeter built by the Parr Instrument Company was used, which determines the energy density or total heat content of the biofuel. The model of the calorimeter used was a Parr 6200 Isoperibol Oxygen Bomb Calorimeter that used an Isoperibol design, allowing for faster testing with less interference from external factors that are typical in a sealed-jacket design. For the measurement of mass loss during heating of a sample and the analysis of heat flow from/to a sample, the Mettler TGA/DSC1 was chosen. Samples of the feedstock and the biofuel that was produced from the feedstock were analyzed using Fourier Transform Infrared Spectroscopy (FTIR). Using Mid-Infrared spectroscopy, we can deduce functional changes that occur during the HTP catalytic process. A Thermo Scientific 6700 FTIR spectrometer equipped with a Thermo Scientific Smart iTR™ was used to collect the data. The spectra were analyzed using Onmic 9.0 and Onmic Specta.
The volatile and semivolatile components in the solution of the wastewater from the processing were analyzed through the means of Gas Chromatographic (GC)/Mass-Spectrometry (MS) using a Thermo Fisher Focus GC connected to an ISQ single quad mass spectrometer. The column used for separation was a 25 µm Thermo TG FFAP column that had a length of 30 m. A 0.1 mL sample of the residual catalyst solution was placed in a 5 mL GC/MS sample vile and 3.9 mL of ethyl acetate was added to the catalyst solution. The sample was then vortexed for one minute and then left for the phases to separate. A 2 µL sample was drawn off from the ethyl acetate phase and injected to the GC/MS.

3. Results and Discussion

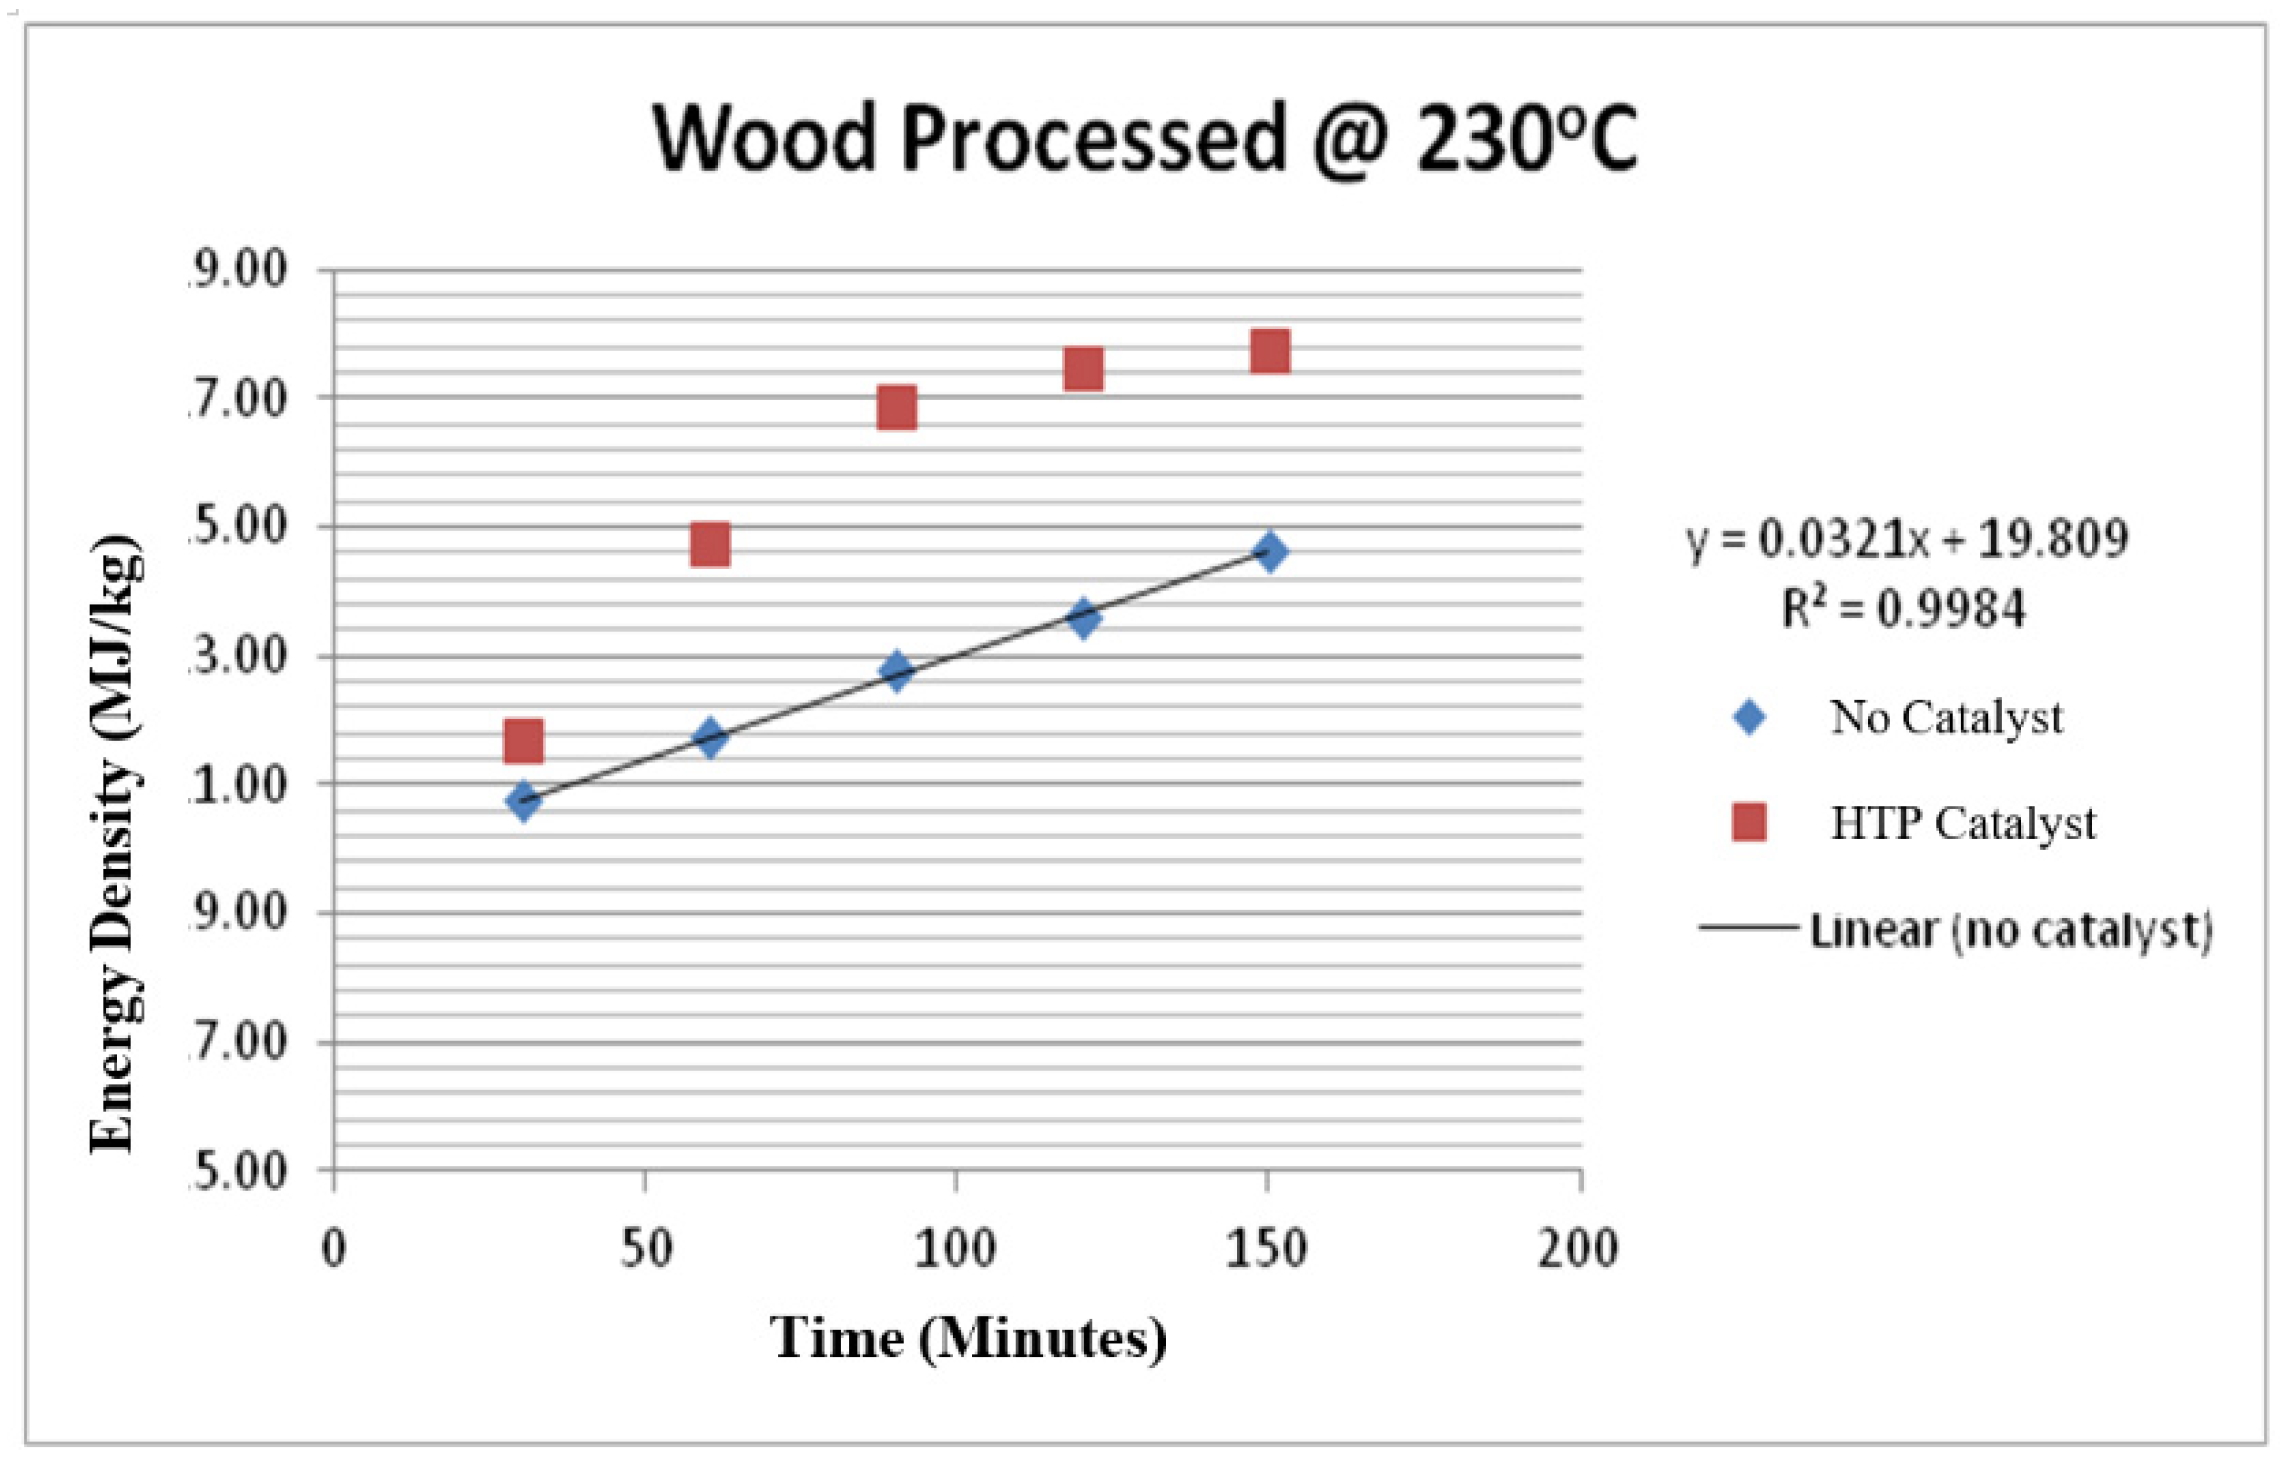
3.1. Experiment 1: Catalyst vs. No Catalyst

The first experiment compared the effect of the catalyst on a reference material (wood-pine chips) with the effect produced when the material was heated in water without a catalyst added. HTC heats biomass in water without a catalyst present to prepare a biochar material [14]. The difference in the products is that the biochar needs a binder to form pellets and the yield is lower due to the formation of excess carbon dioxide during processing. The processing conditions for HTC are more severe than for the HTP catalytic process.
The decarboxylation reaction present in HTC is strongly exothermic [14] and so can lead to a runaway temperature, resulting in a significant overpressure which can be sufficient to lead to reactor failure. The HTP catalytic process utilizes a catalyst to minimize the decarboxylation reaction. Five gram samples of ground pine were processed in water only and water with the addition of an HTP catalyst. The amount of liquid used was 50 mL. The samples were processed at 220 °C for 150 min. After cooling, filtration and drying the energy density (HHV) was measured using the Parr 6200 oxygen bomb calorimeter. The energy density of the feedstock processed in water was 24.0 MJ/kg, while the feedstock processed with the catalyst had an energy density of 27.8 MJ/kg. The research then determined the time to temperature to produce a biofuel equivalent in energy density to the sampled prepared at 220 °C with the HTP catalyst. It was found that the temperature must be increased to 260 °C to produce a 27 MJ/Kg biofuel without the catalyst. It is interesting to note that the yield of biofuel was much lower than the HTP catalytic process, with the former being 40%, while the latter was 62% yield. The mass loss is due to the loss of carbon from the biofuel in the form of CO2. A time and temperature study at 230 °C was completed using wood chips comparing the HTP catalyst to processing without a catalyst. The catalyst concentration was 2 g/L. The results are presented below (Figure 3).

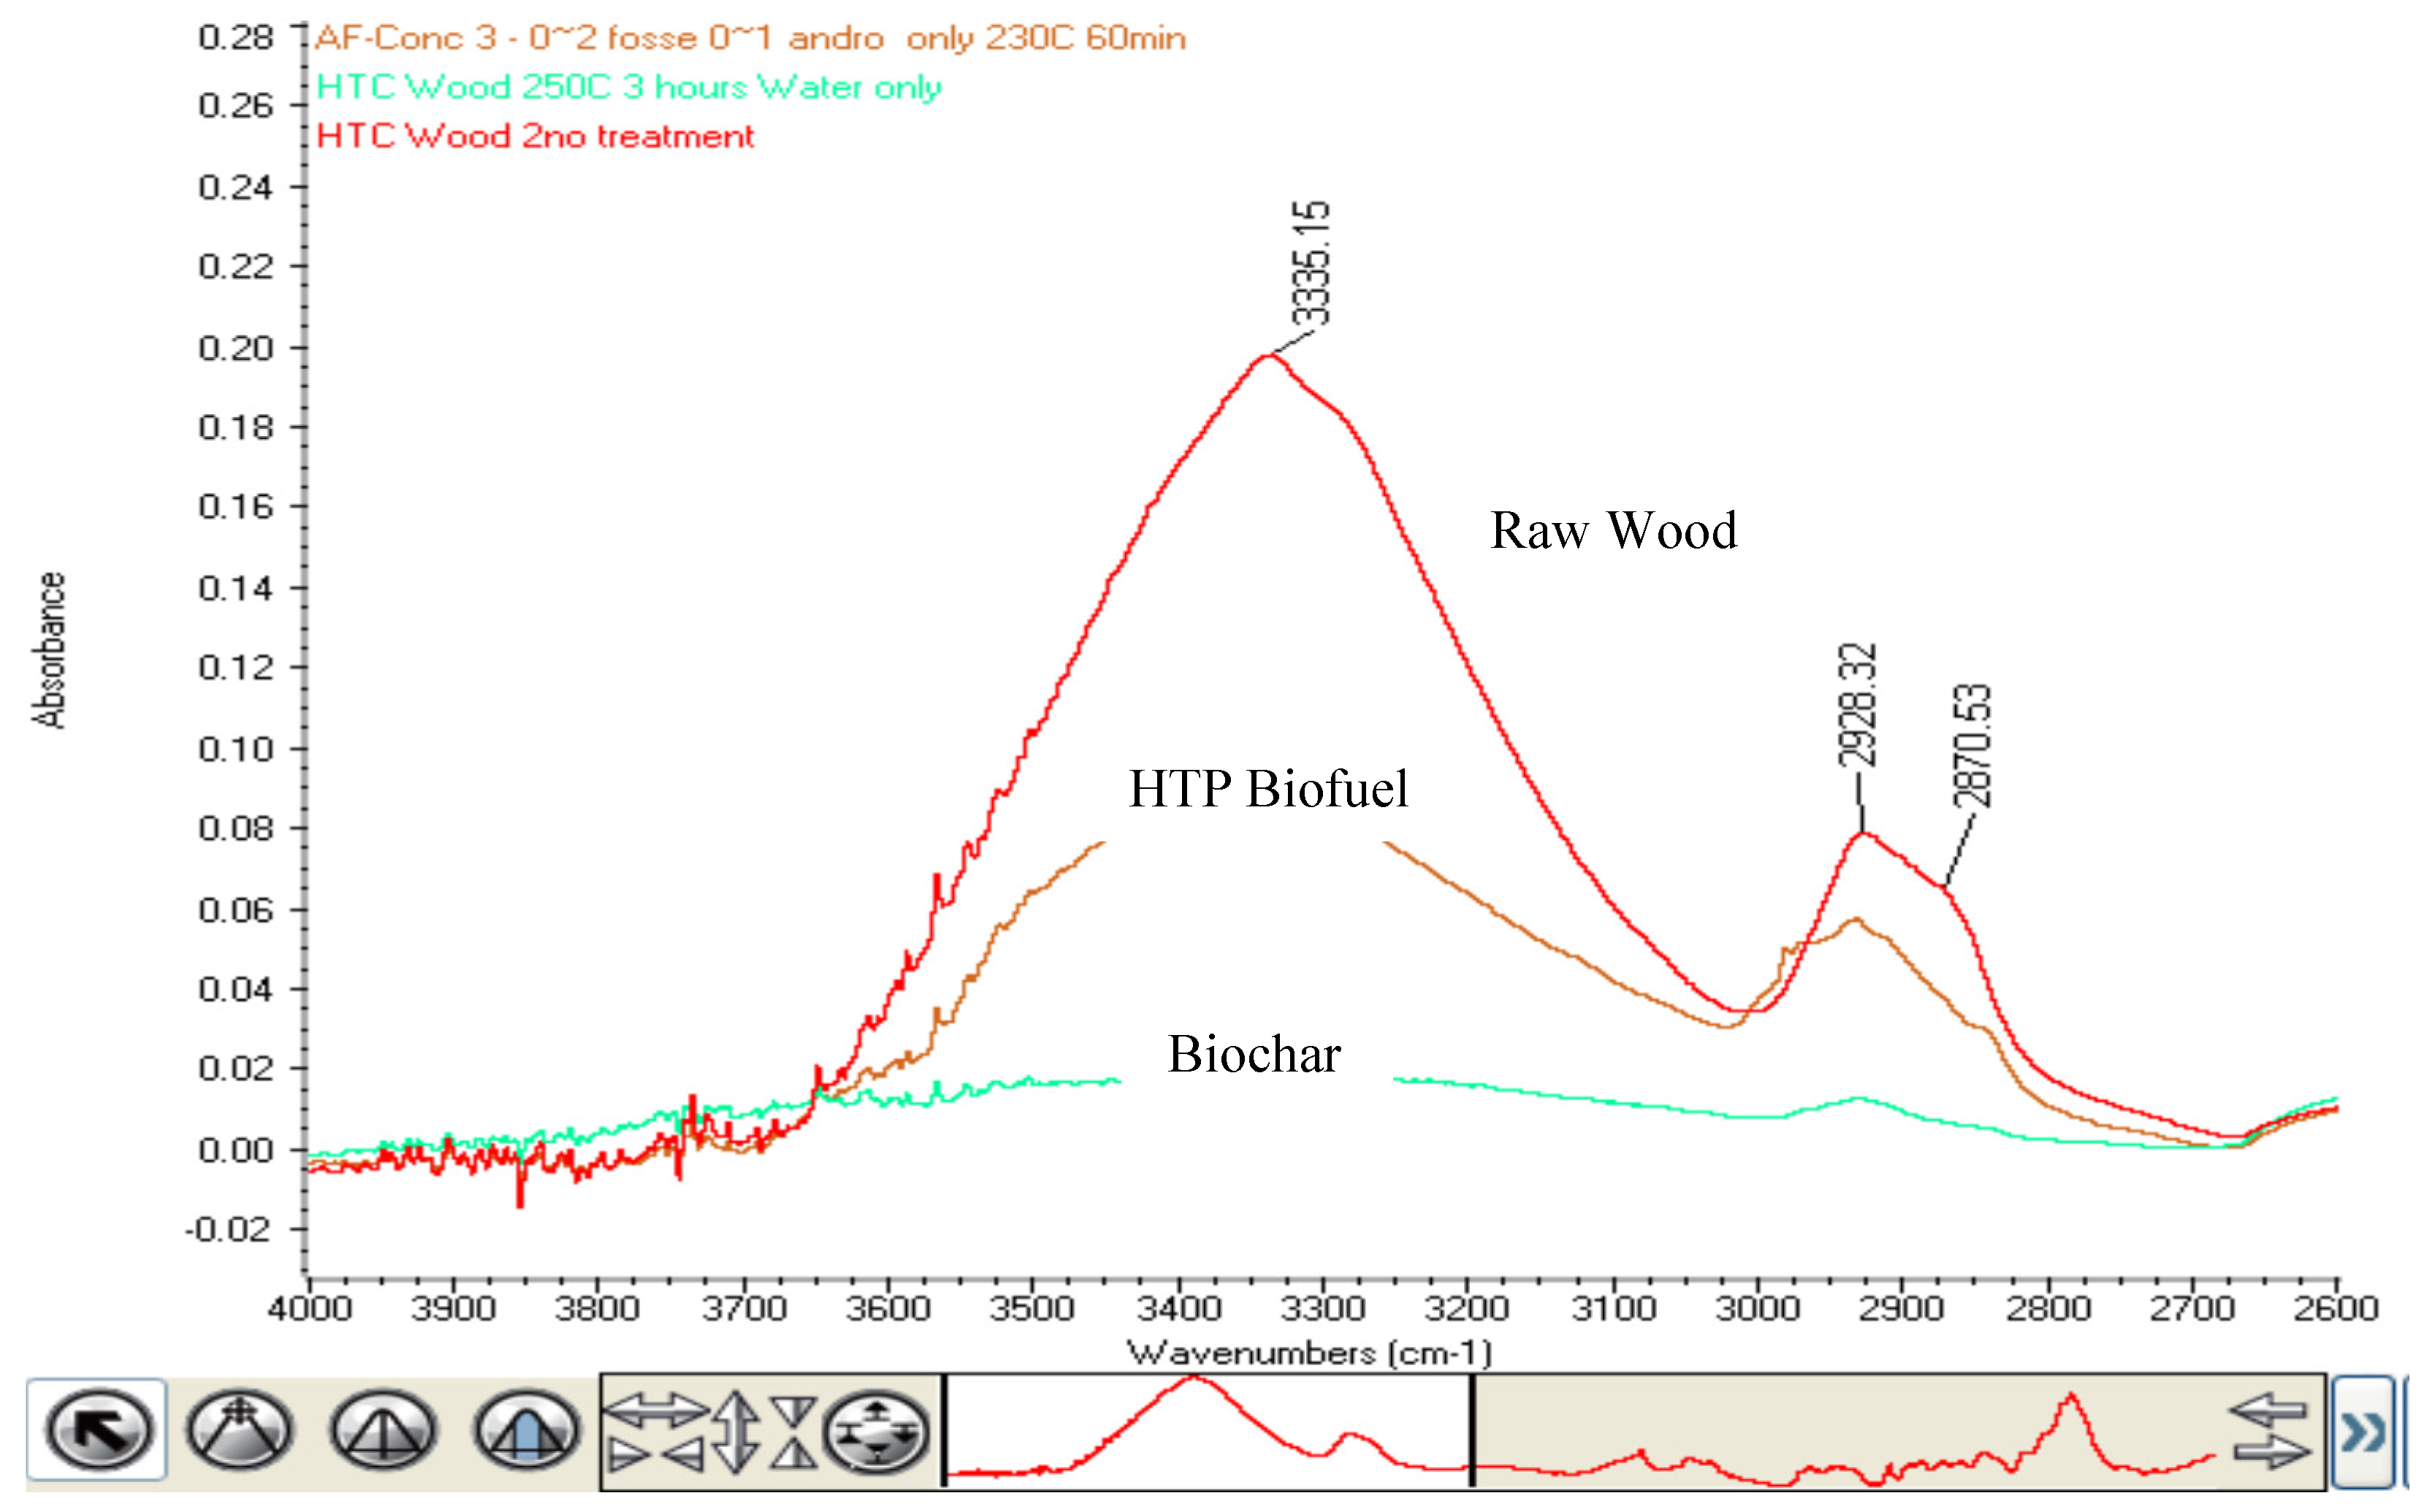
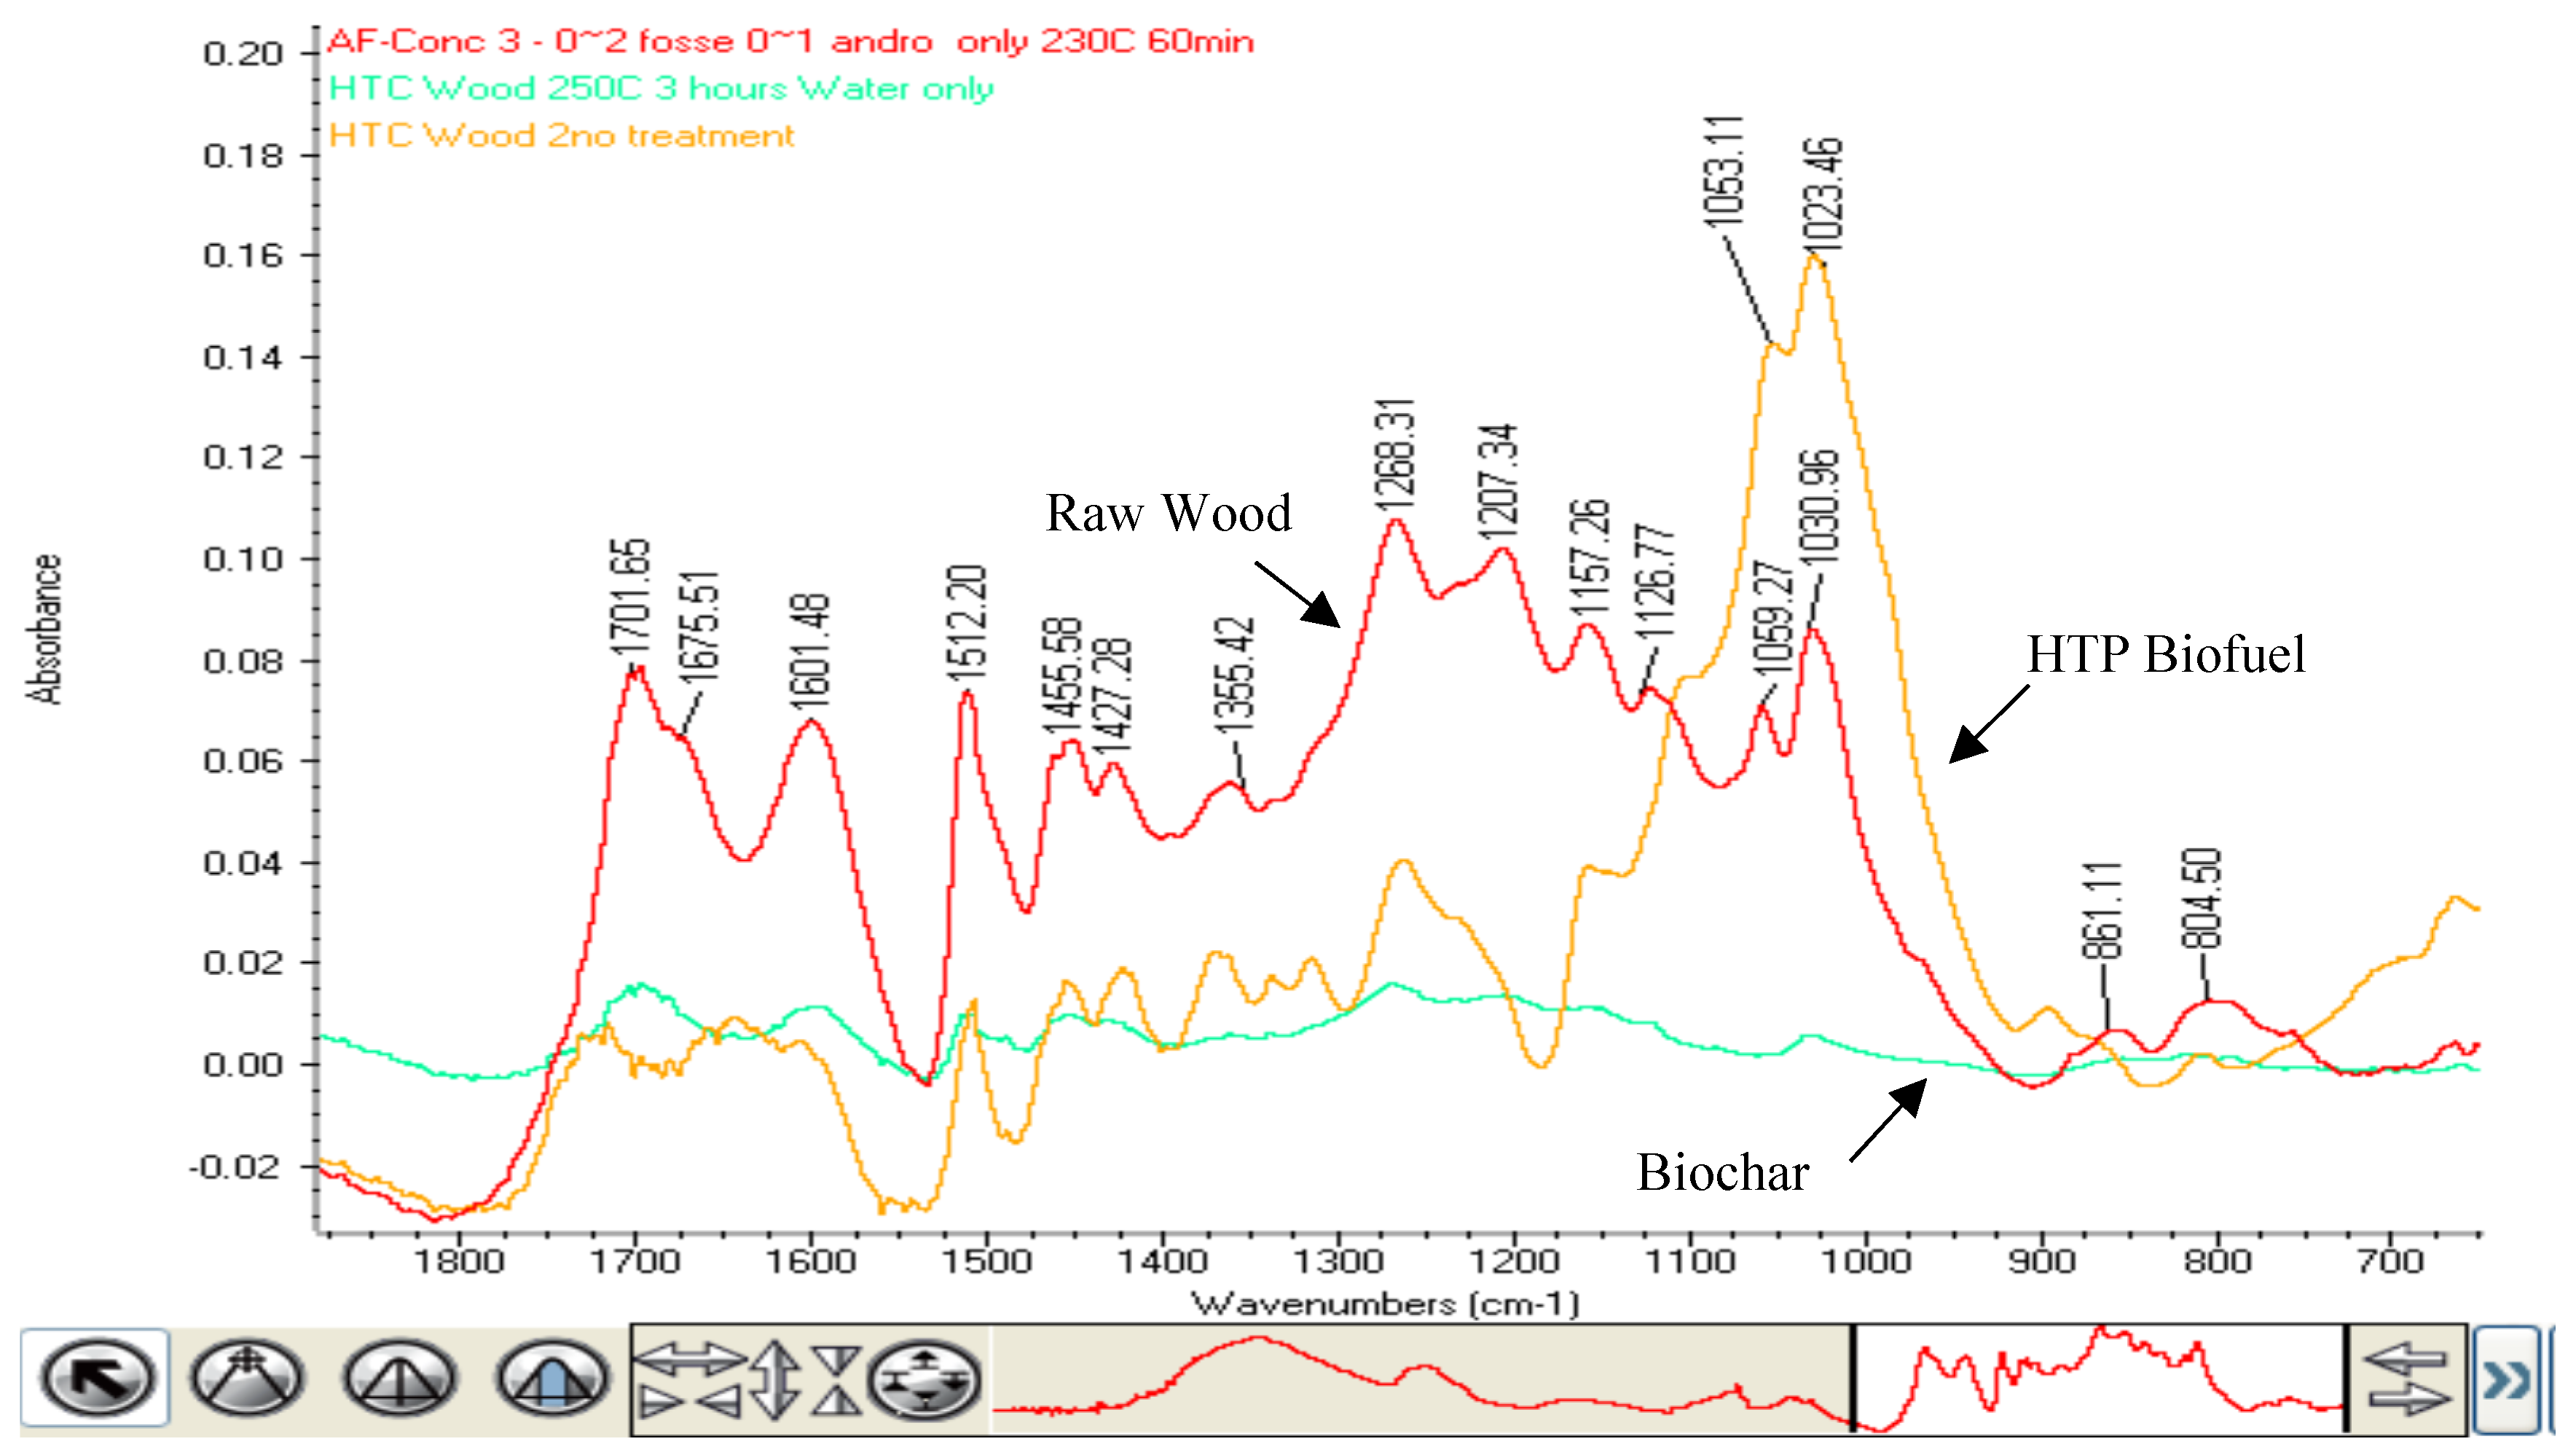
3.2. Experiment 2: FTIR Spectroscopy of HTC and HTP Biofuels

Samples of wood feedstock were treated in three conditions—the HTP catalytic process using a strong (0.2 molar) catalyst at 230 °C for 60 min, the HTC process with water only at 250 °C for 3 h, and untreated wood used as a feedstock. The HTP catalyst and HTC (noncatalyst) samples both had energy densities of 27 ± 1 MJ/Kg, while the untreated wood sample had an energy density of 18 ± 1 MJ/Kg. The samples were then analyzed using a Thermo Fisher 6700 Mid Infrared Fourier Transform spectrometer using a smart ATR accessory with a diamond anvil. The graph of the OH region (4000 to 2600 cm−1) and the fingerprint region (1800 to 650 cm−1) are presented below (Figure 4 and Figure 5). The spectra below provide evidence for the polymerization process in the HTP catalytic process in contrast to the char that is produced using HTC. The HTP catalytic process results in a biofuel that has many functional groups including ether, carboxylic, and ketone bonds. The HTC process results in a material that has few infrared absorbance peaks, looking much like the char that results from the torrefaction of biomass. If we examine the raw wood curve and the HTP curve compared with the HTC curve, we note that the HTC process destroys the lignin in the biomass while the HTP catalytic process preserves them. The peak at 1512 cm−1 is a band that is specific to aromatic skeletal vibrations [15]. We see this band in the raw wood and in the HTP sample, while the band is absent in the HTC spectrum. In addition, the bands at 1053 and 1023 cm−1 are representative of the – ν C-O in cellulose [16]. In both cases we see the reduction of these peaks in the HTP catalyst biofuel. In contrast, the peaks are absent in the HTC spectrum, indicating the absence of OH groups in the hydrochar. The peaks at 2928 and 2870 cm−1 in Figure 4 are indicative of CH2 asymmetric and symmetric stretching, respectively [17]. The loss of this peak in the HTC spectrum shows the loss of hydrocarbons in the HTC process as the biomass is converted to a carbon char. In contrast, the HTP catalytic process retains the CH2 units in the biofuel. These peaks along with the peaks at 1702, 1605, and 1268 cm−1 are good indicators that the biofuel produced by the HTP catalytic process has polymerized. The peaks at 1702 and 1605 cm−1 are due to carbonyl C=O stretching [17], while the band at 1268 cm−1 is indicative of ether C-O stretch [17] (Figure 5).
The process conditions for HTP catalyst are at a lower temperature and for a shorter time than those required for the HTC process. To produce a biofuel that has an energy density of >27 MJ/kg, the HTP catalytic process uses a temperature of 240 °C for 1 h in the dilute catalyst (~2 g/L) case and 220 °C for an hour in the stronger catalyst (~20 g/L) case. This compares with the HTC process that requires a 250 °C temperature for 4 h (Table 1 and Figure 6). Thus, the HTP catalytic process will produce four times the material that the HTC process will produce in the same time period. If the temperature of the HTC process is increased to 260 °C, the material can be produced in 1 h.

3.3. Experiment 3: Feedstock Comparison

Differing feedstocks of interest were given a preliminary test using the HTP catalyst at a concentration of 2 g/L. The process conditions for each feedstock were identical. The process temperature was 230 °C while the process time at that temperature was 130 min. The energy densities of the various feedstocks are shown in Table 2. As expected, the energy density of various waste streams is quite similar, since they all contain a high concentration of cellulose and other sugars in them. The energy density of biofuel from cow manure is lower due to the higher inclusion of ash in the biofuel.

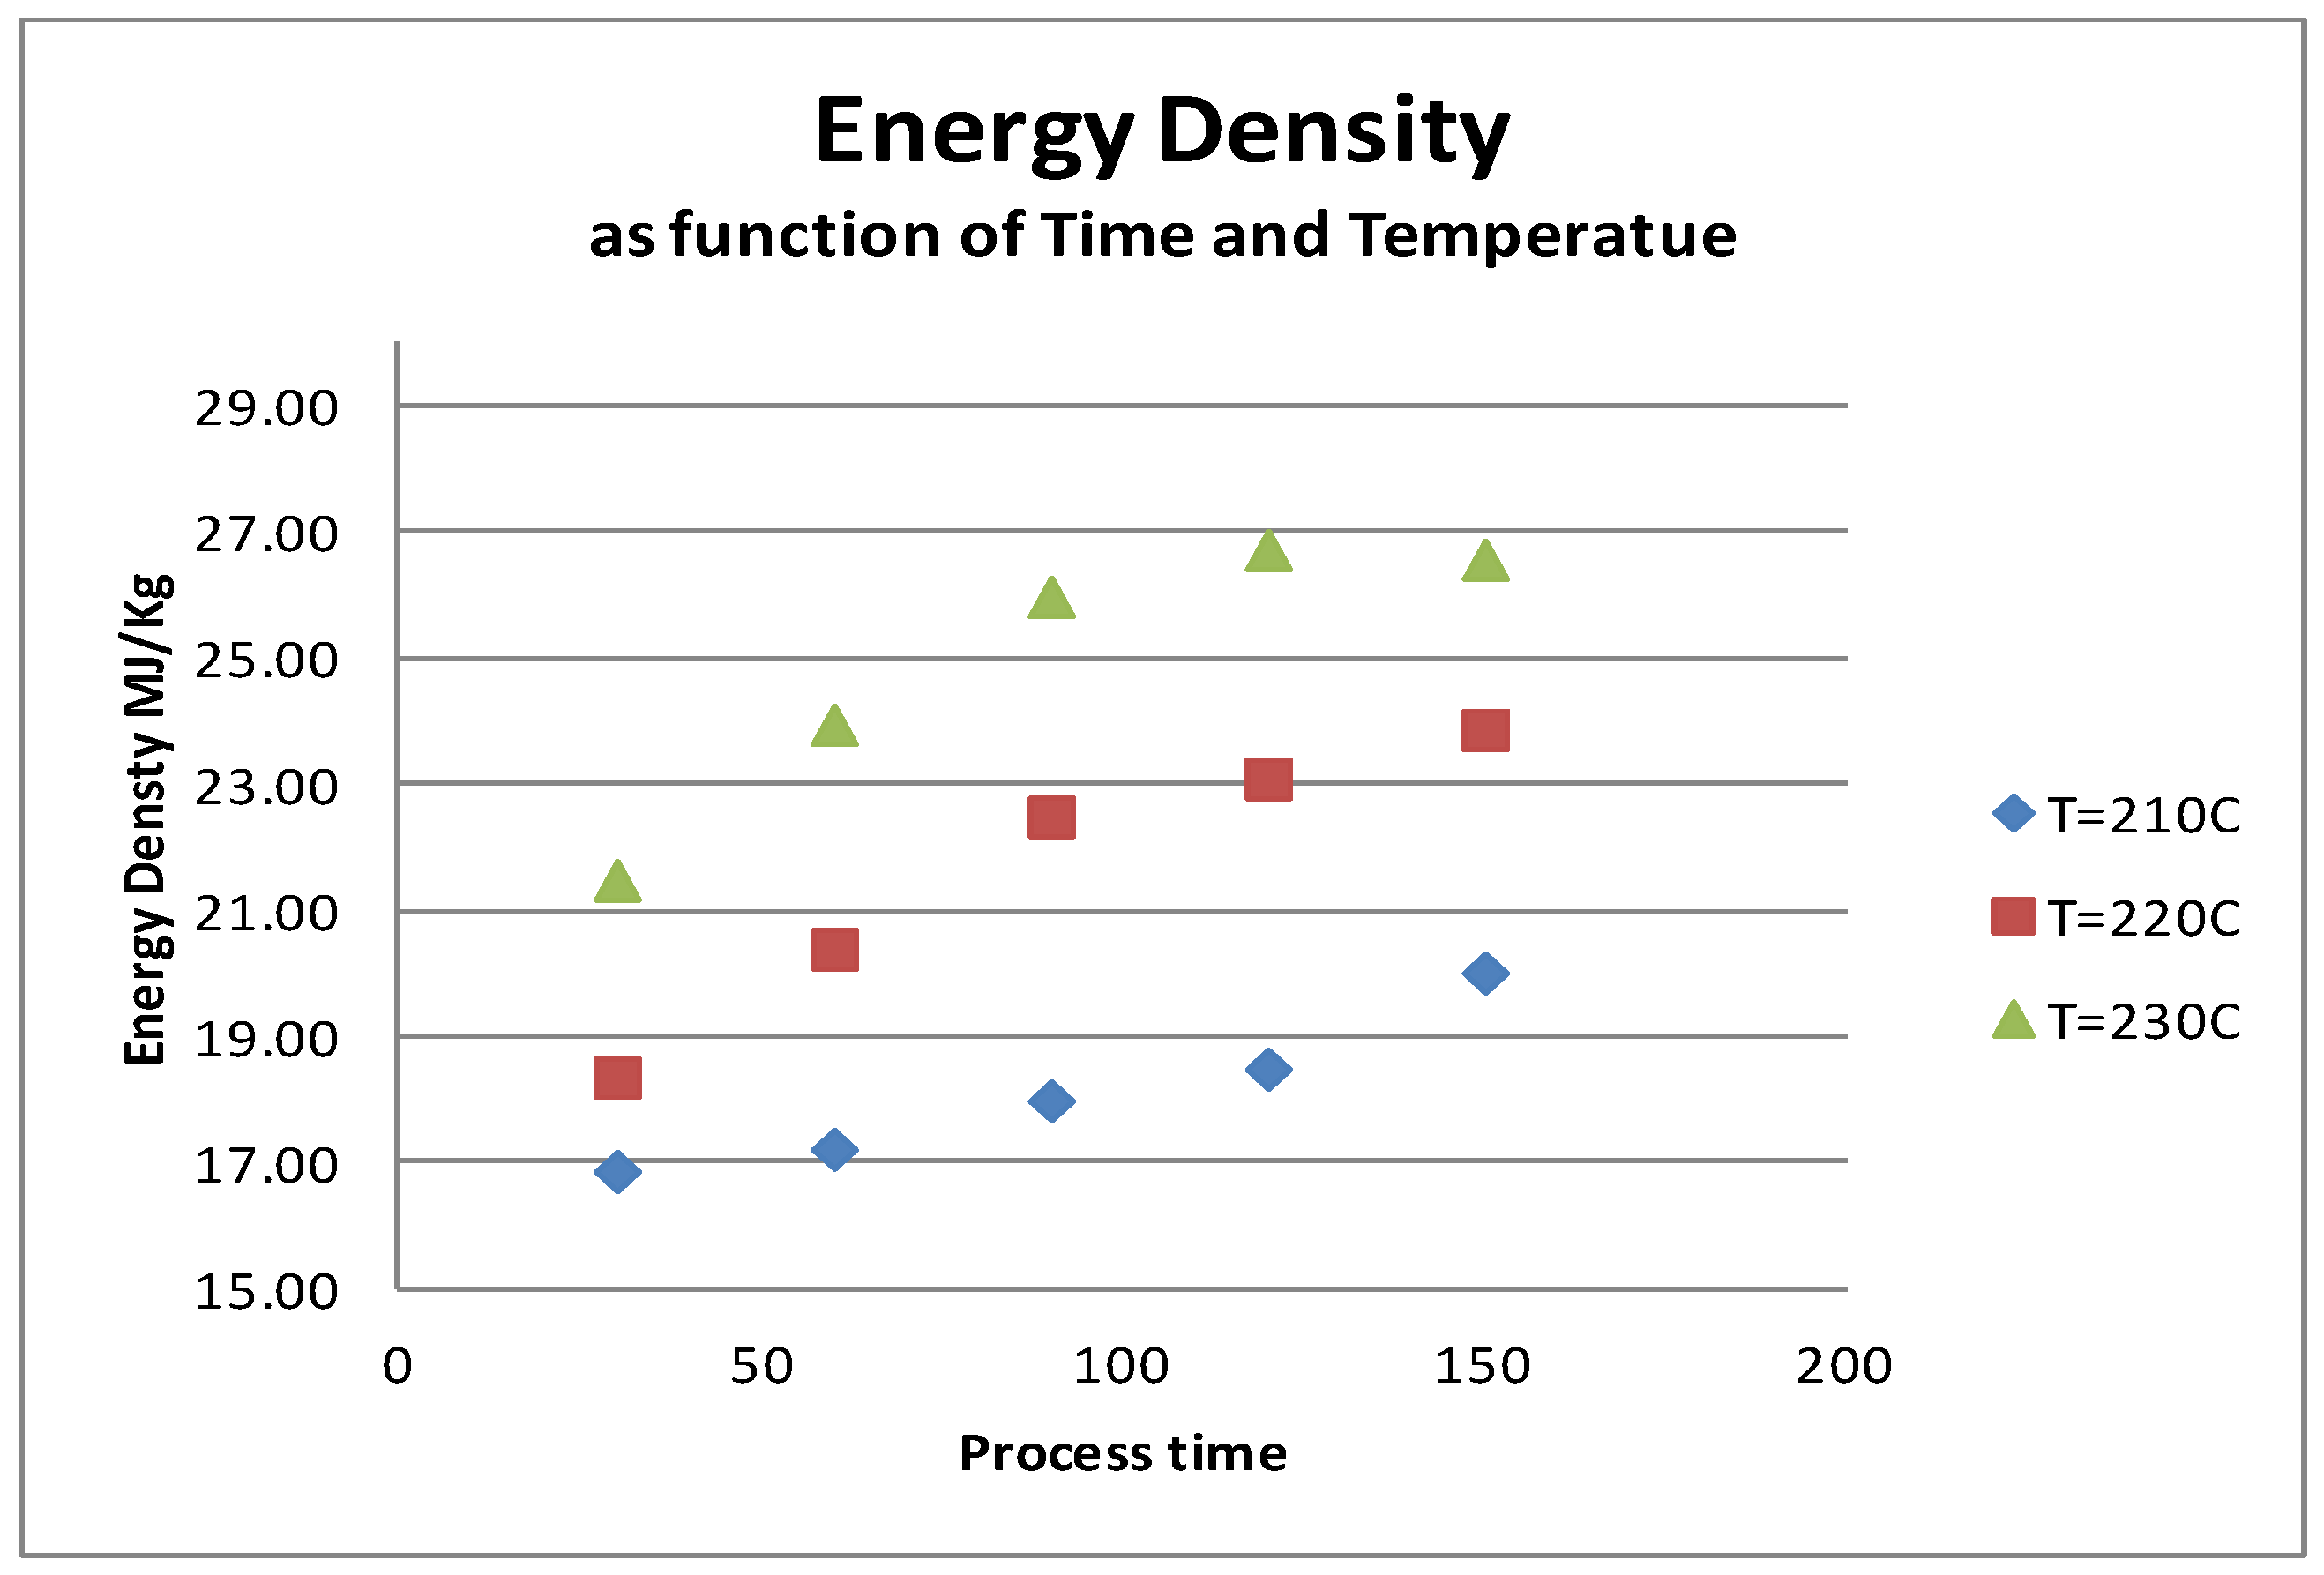
3.4. Experiment 4: Energy Density as Function of Time and Temperature

The effects of time and temperature were studied on a reference material. Cotton was chosen as the reference feedstock because it is 98% cellulose and its structure is highly crystalline, making it more difficult to process than other materials. The HTP catalyst concentration used was 2 g/L. Five grams of cotton were placed in the 100 mL pressure vessel and 70 mL of catalyst solution was added. The reactor was sealed and then processed for the time and at the temperature required. After the biofuel was separated from the catalyst solution, the material was dried in a 70 °C oven until completely dry. The energy density (HHV) was then measured and presented in the graph below (Figure 7).

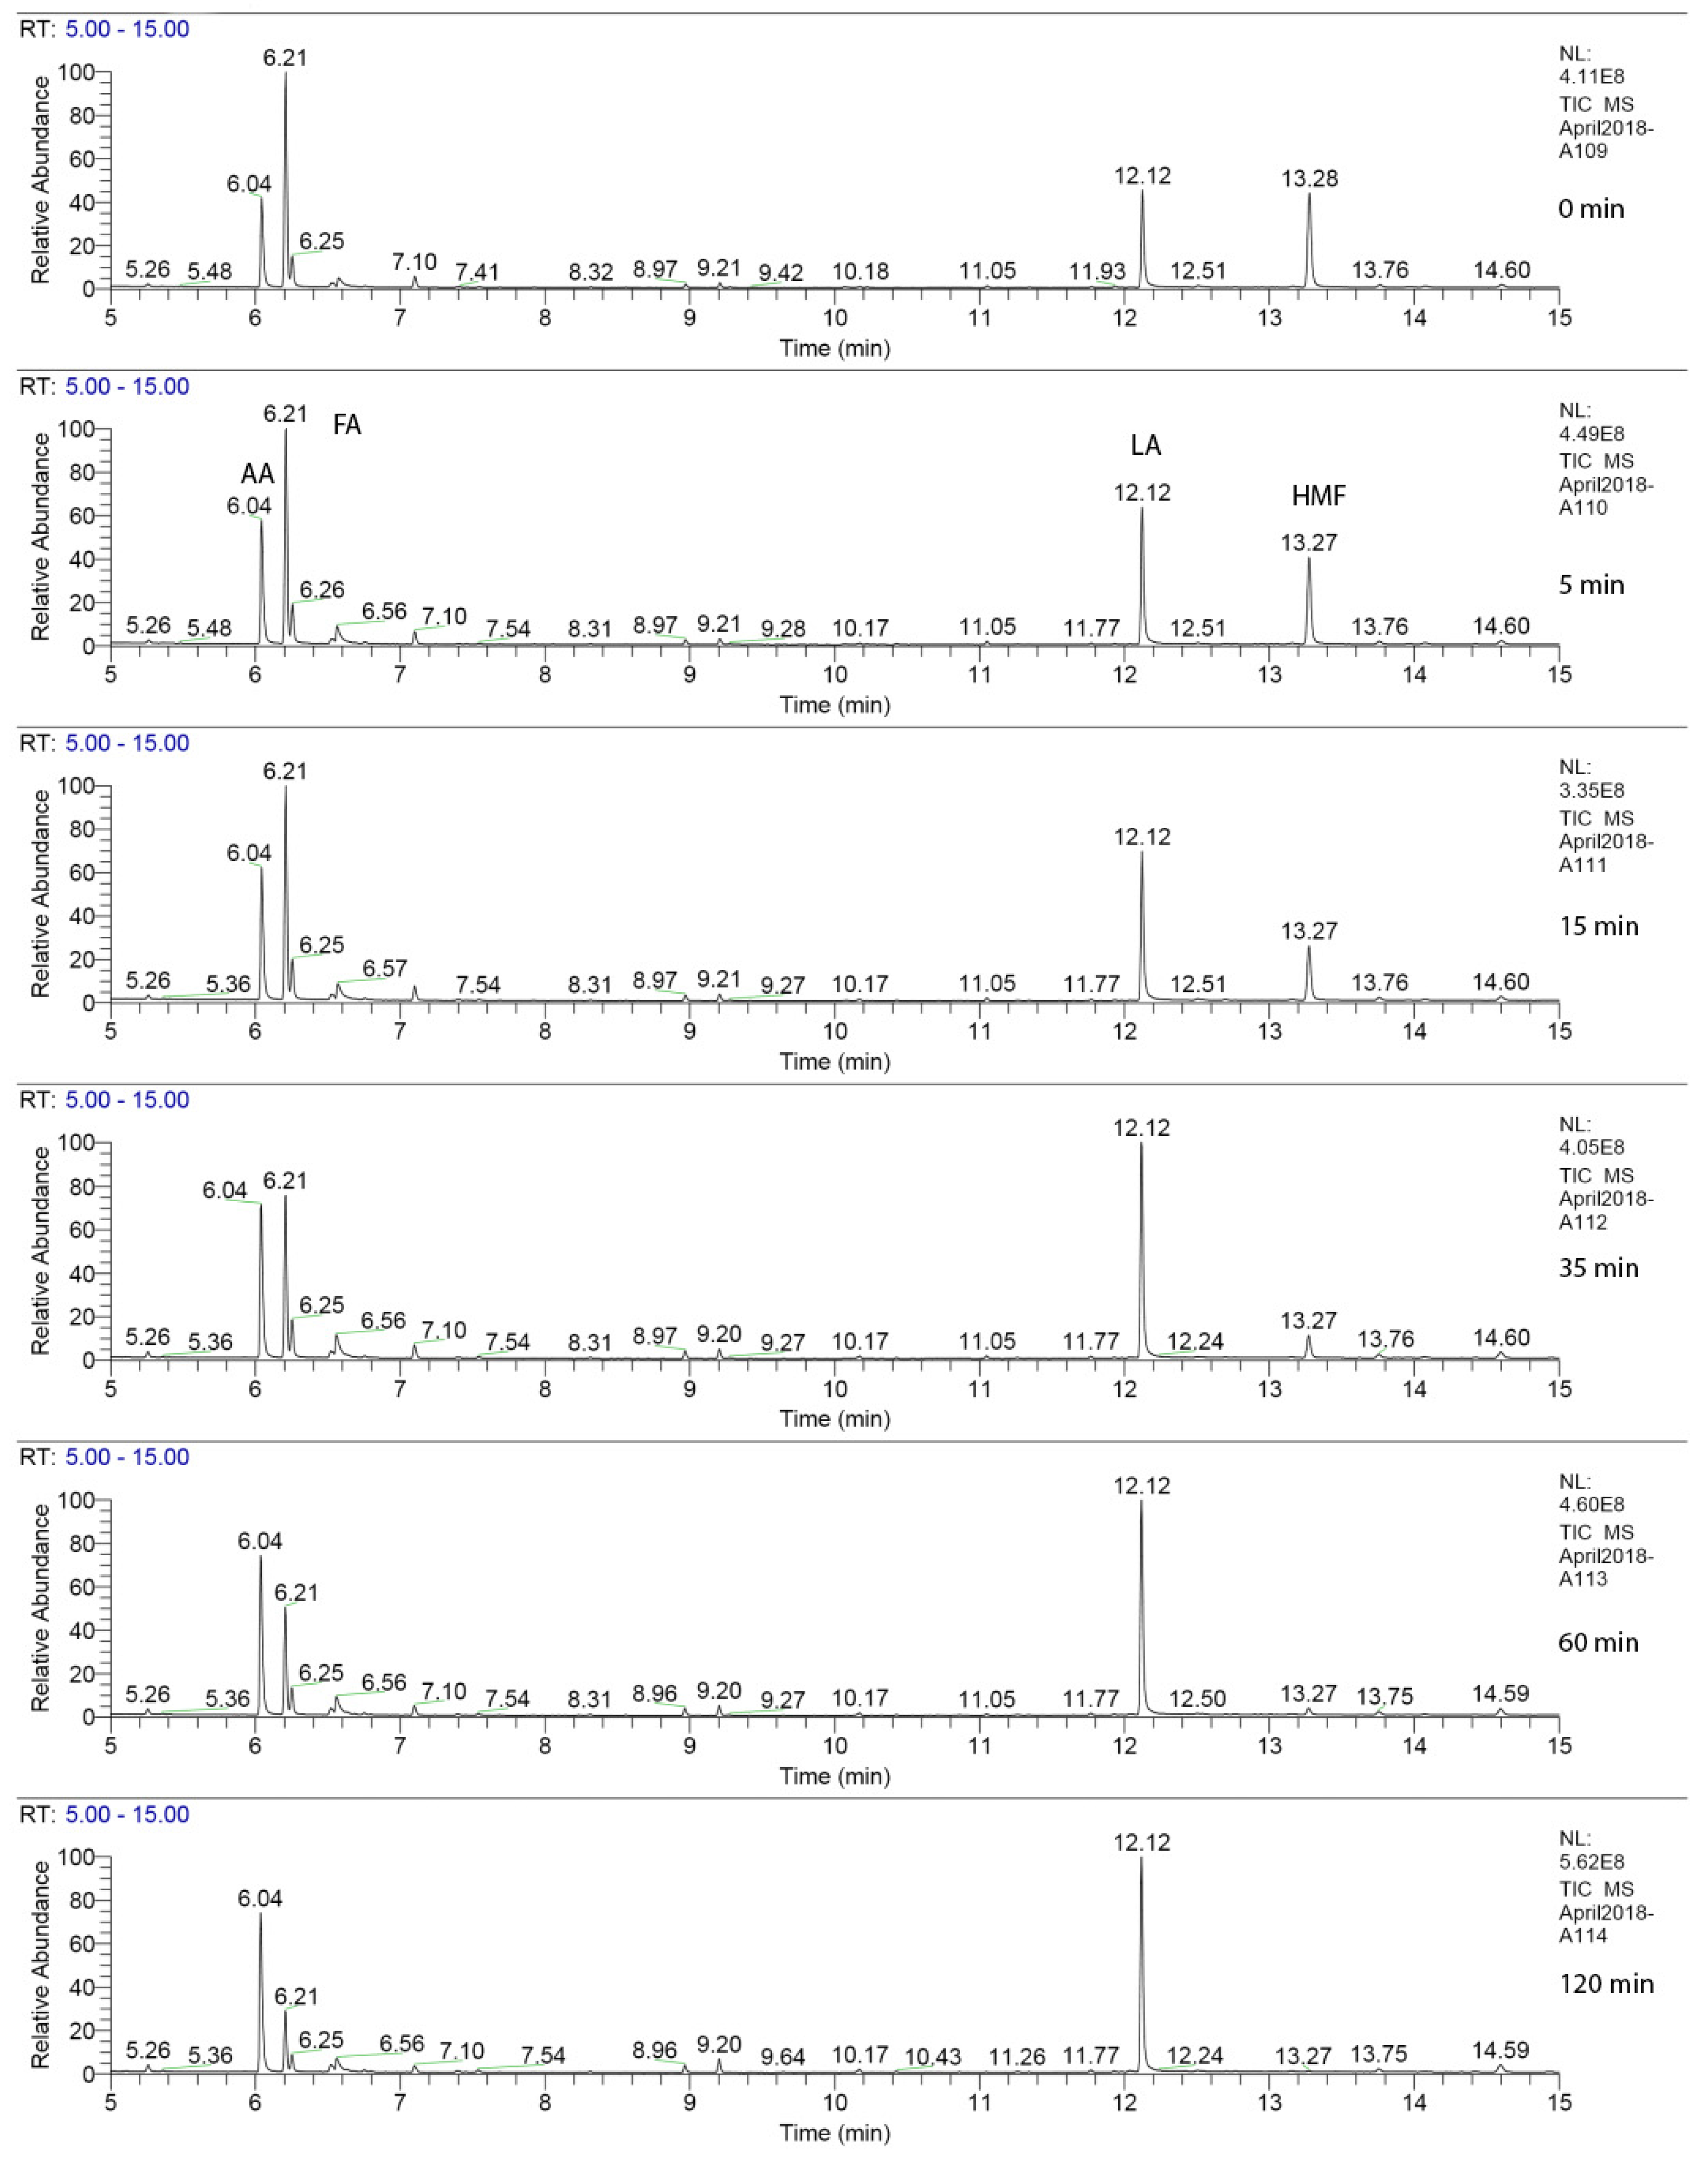
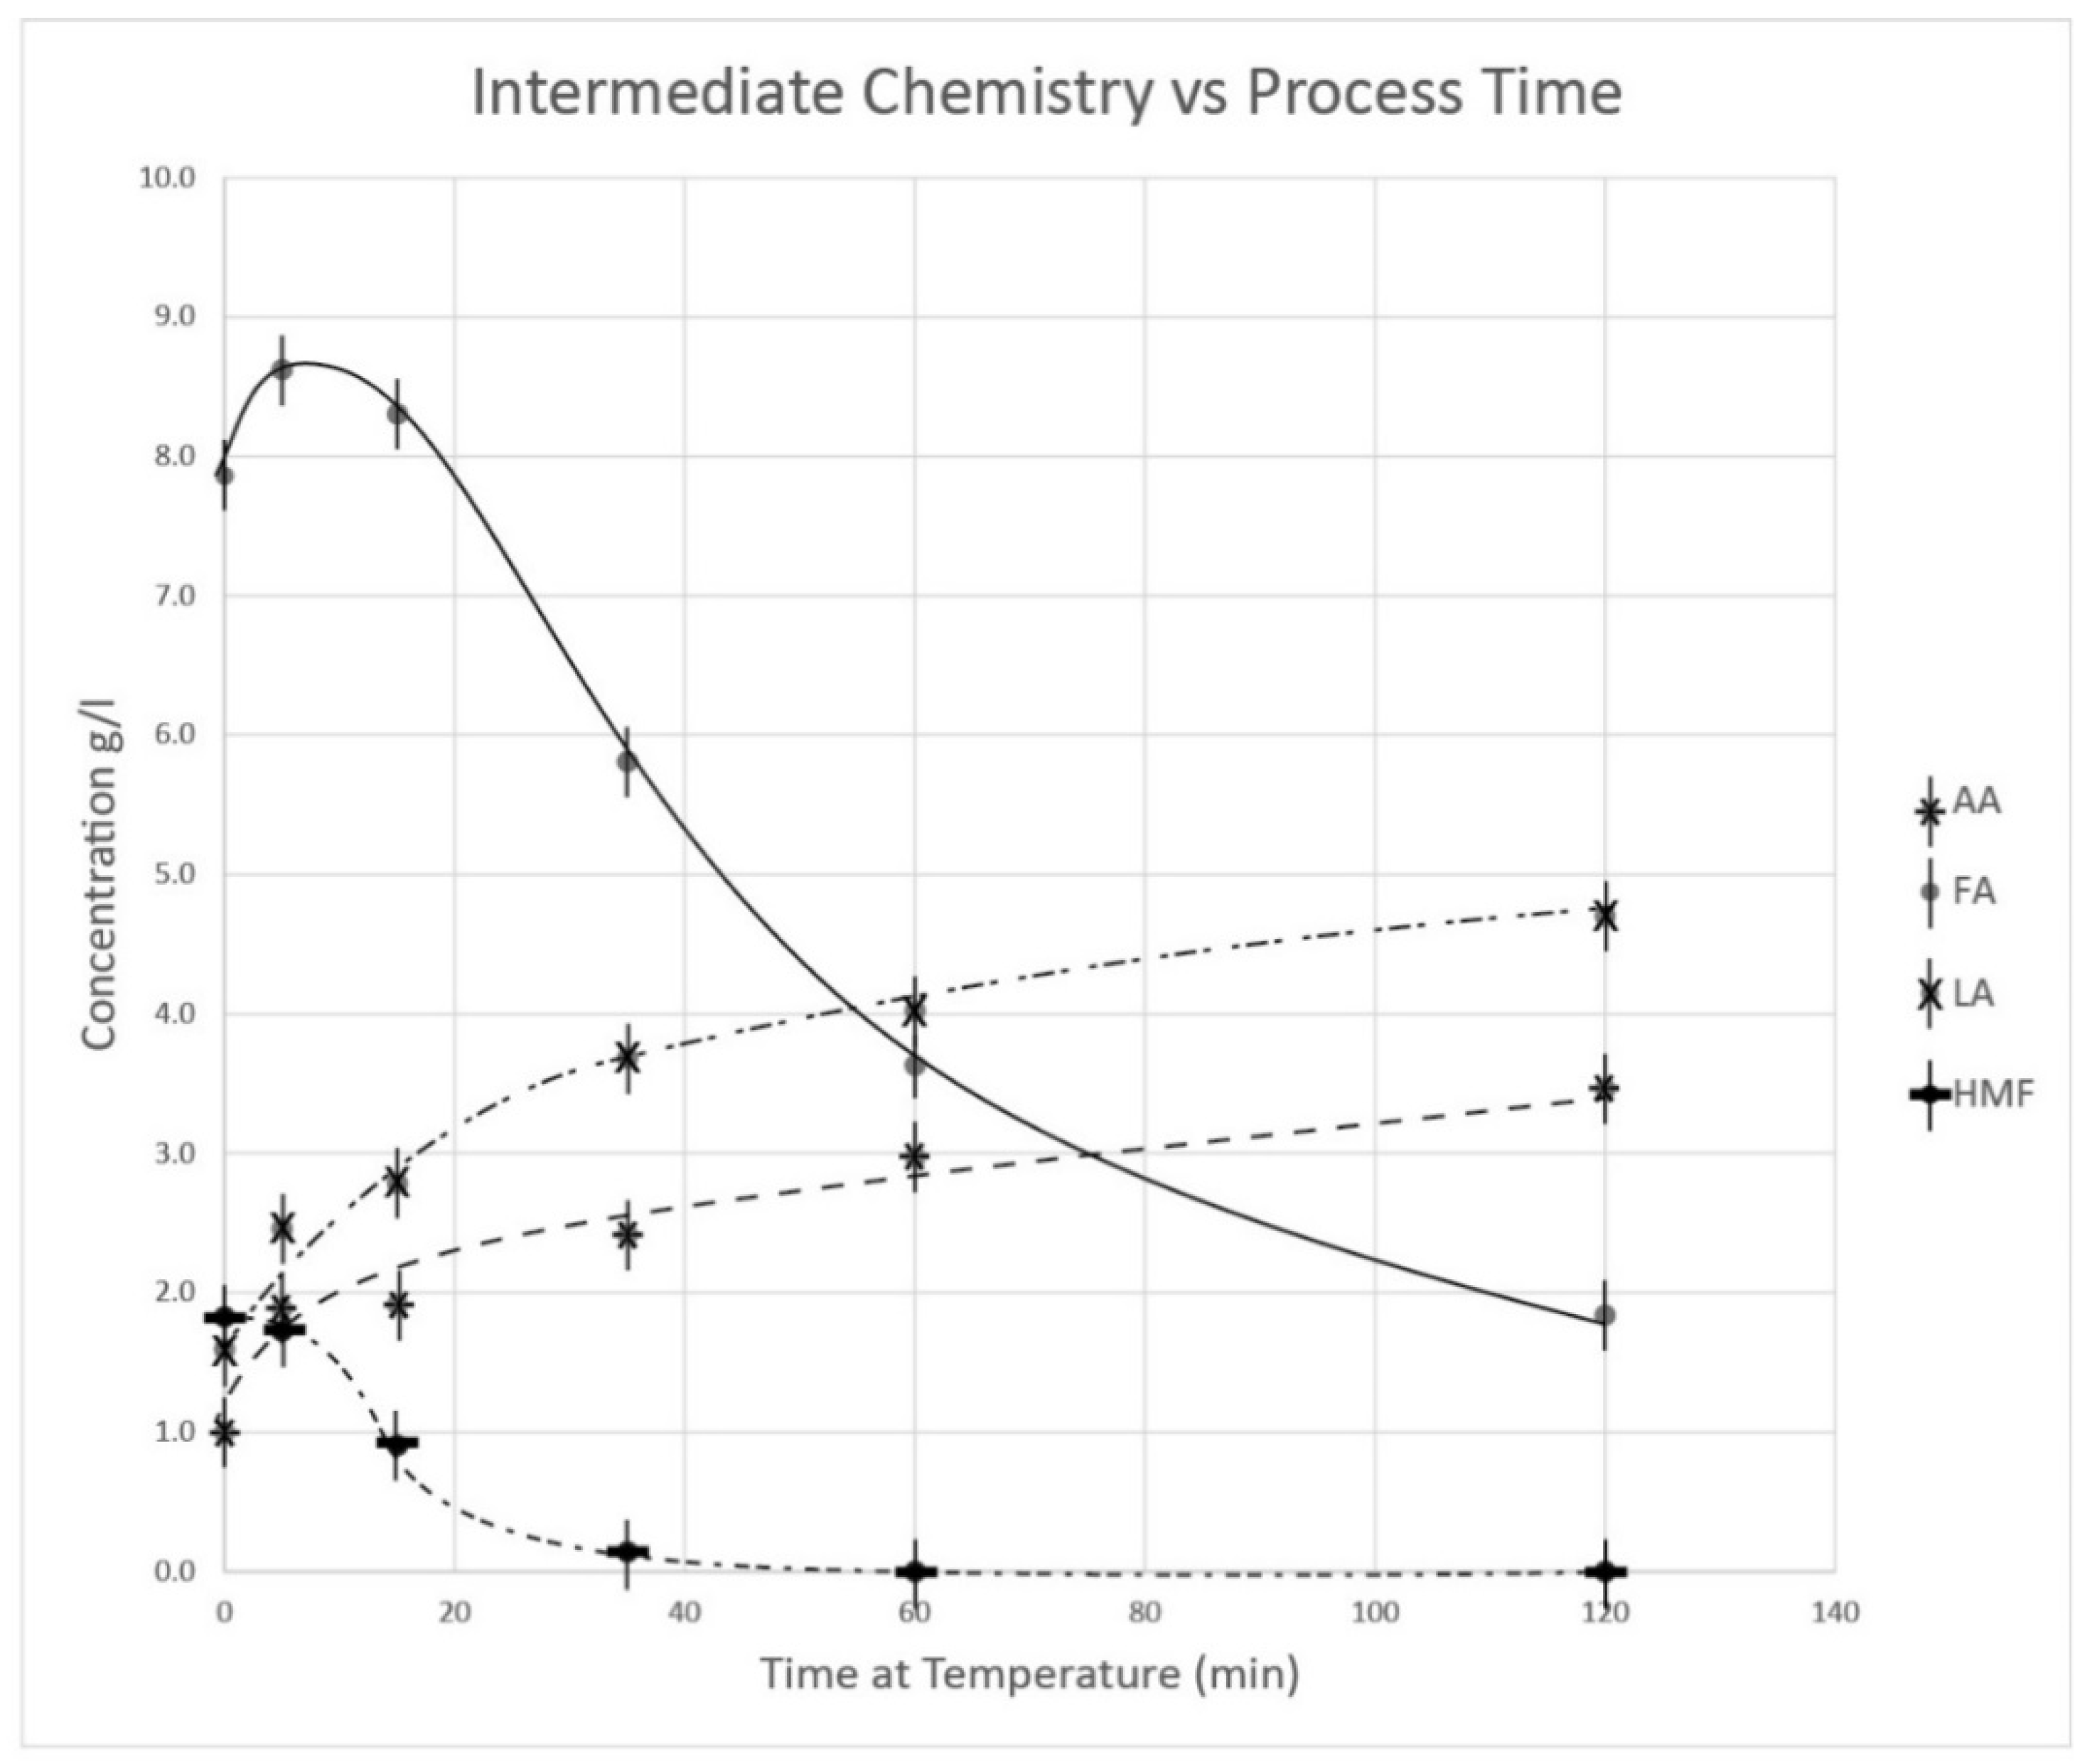
3.5. Experiment 5: GC/MS Analysis of Selected Intermediates in Solution from Woody Feedstocks

Intermediate chemicals evolved during the catalyzed HTP process was studied using Gas Chromatography and Mass Spectrometry (GC/MS) of aliquots of catalyst solution removed from the reactor during processing. Four major components were examined in this experiment—acetic acid (AA), formic acid (FA), levulinic acid (LA) and 2.5-hydroxy-methyl furfuraldehyde (HMF). Identification of retention time and mass spectra were determined using reference standards for the four compounds [18,19]. The mass spectrometer uses Xcaliber software that uses a series of standard runs to calibrate the concentration. We used standards that had 0.1, 1.0, and 10 uL/L of acetic acid, formic acid, levulinic acid, and 2,5 hydroxy furfuraldehyde.
Chromatograms of the total ion count as function of time are presented in Figure 8. The peaks examined were AA at 6.04 min, FA at 6.21 min, LA at 12.12 min, and HMF at 13.27 min. Thermo Fisher Xcaliber software was used to evaluate the peak areas and generate the standards curve from a series of five concentrations. A linear curve was used evaluate the peak area. The quality of fit for the peak areas was as follows—AA r2 = 0.9874, FA r2 = 0.9908, LA r2 = 0.9780, and HMF r2 = 9890. The concentration of selected intermediates in grams per liter are plotted graphically against process time in Figure 9.

3.6. Experiment 5: TGA Analysis of Biofuel from Selected Feedstocks

Biofuel samples were produced in the 1 L reactor from construction waste wood and sugar cane waste (bagasse). The process conditions were 2 h at 230 °C with a catalyst concentration of 2 g/L. The samples were dried and analyzed to the energy density (HHV) using both the Parr Bomb Calorimeter and Mettler TGA/DSC1. The graphs were analyzed using the Mettler TGA software.
The source of waste wood was demolition waste wood that was destined for the municipal dump. The sample was clear of nails and drywall. Drywall was not present as it was not allowed in the landfill waste stream. The sample of sugar cane was purchased in Vancouver, Canada and chopped and crushed for the experiment. By TGA/DSC analysis for three samples, the approximate test was performed and the results can be summarized below (Table 3).

3.7. Comparison with Other Catalytic and Noncatalytic Processes

For comparison with other HTC processes for feedstock of wood, the process efficiency factor is defined conveniently as below for a rough optimization:
η = Output   Factor Input   Factor =   Energy   Density   x   Mass   Yield Process   Temp   x   Process   Time   [ MJ / kg % ° C   Hr ]
This is not a conventional dimensionless efficiency for output against input. However, it shows reasonable results of optimal process estimation between two output factors (energy density and mass yield) and two input factors (process temperature and process time) with a certain degree of flexibility. One may assign a weight factor for each term, as desired, to meet one’s optimization goal. For example, if a higher caloric value of the biofuel is required for combustion purposes, then one may put a multiplying weight factor of more than one for the energy density term in the numerator. If one’s process time is more important than other terms for commercialization purposes, one may put a weight factor of less than one for the process time term in the denominator.
Table 4 collects the various results from catalytic and noncatalytic HTC processes, including process efficiency factor without weight factor. The efficiency of the HTP catalyst is 7.36, ranking the highest with the shortest process time (1 h) and lowest process temperature (220 °C) for the highest energy density (27 MJ/kg) and the second highest mass yield (60%). Therefore, without any weight factor considerations, one may conclude that the 20 g/L HTP catalytic process is the optimal methodology when compared against the others.

4. Conclusions

The research conducted followed specific tasks and delivered the following results:
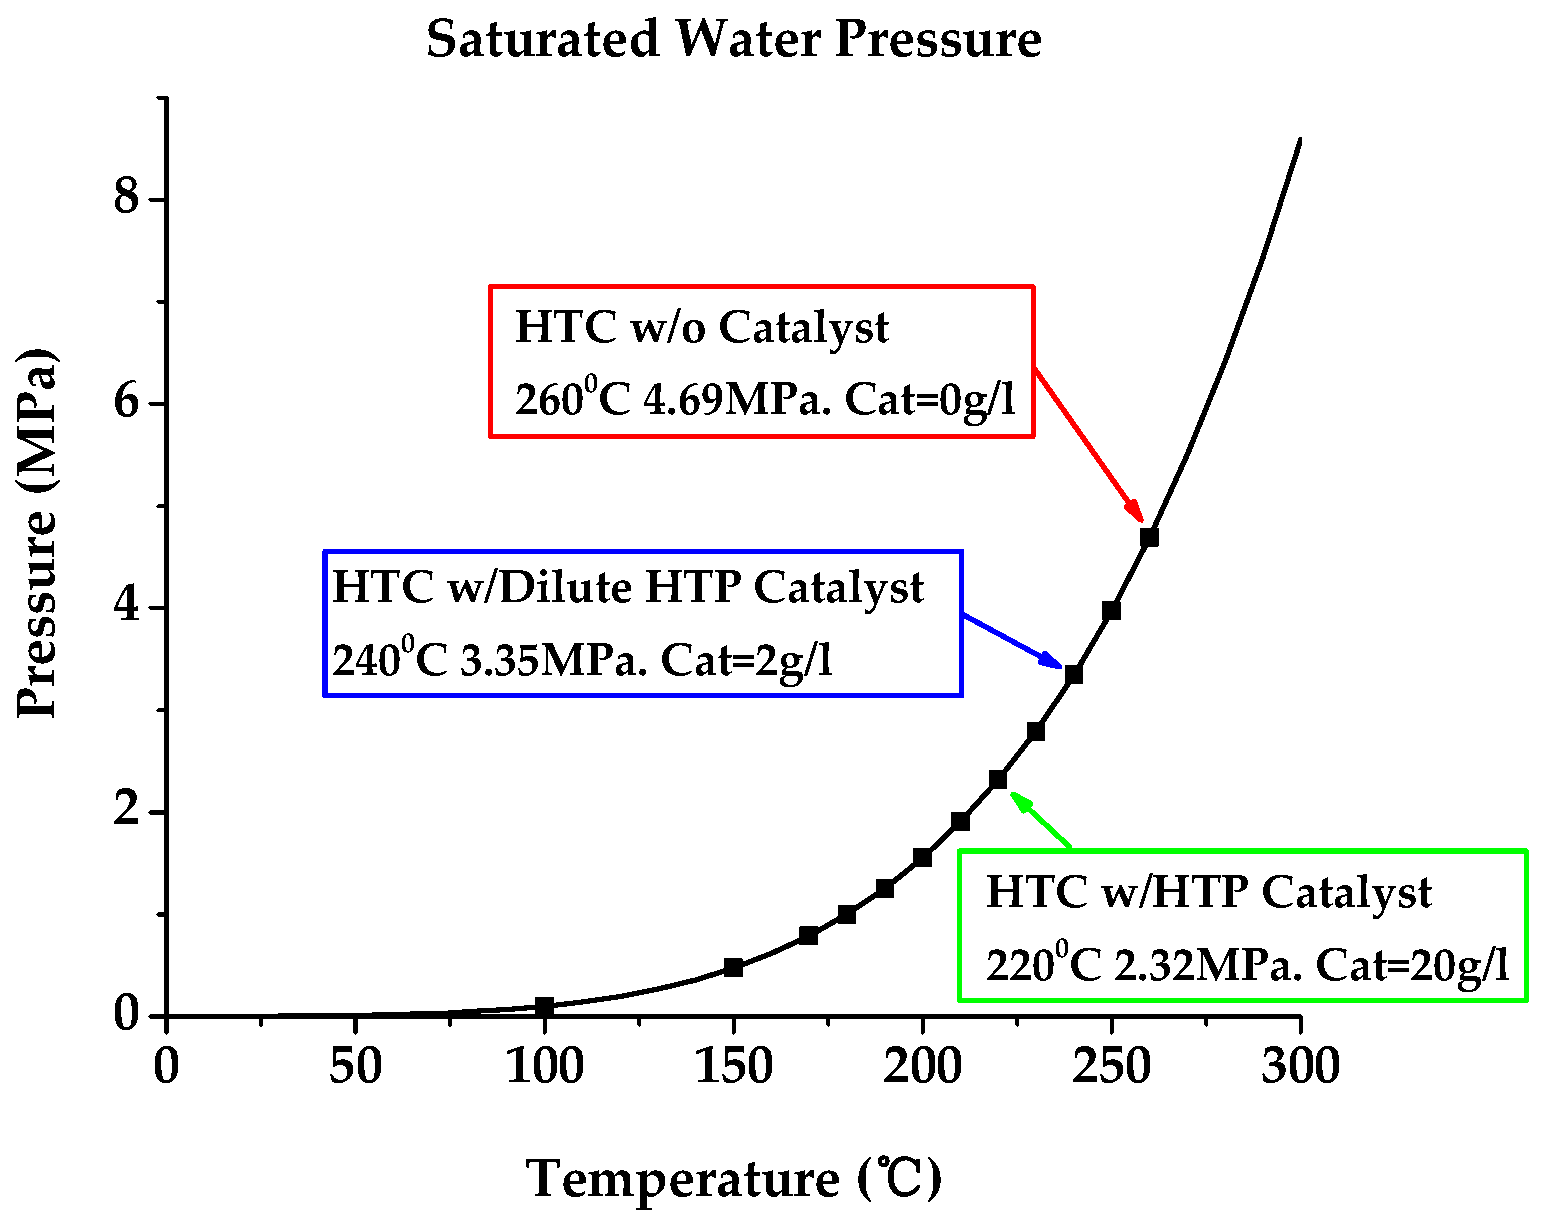
  • Provided a HTP catalytic methodology for the manufacturing process to convert biomass to a high-energy density solid biofuel. For 27 MJ/kg biofuel production, we found the optimum operating conditions—temperature = 220 °C, pressure = 2.3 MPa, process time = 1 h, and the amount of HTP catalyst = 20 g/L (Figure 1 and Table 1). This is the best result among various studies with a process efficiency of 7.36 for 60% mass yield rate biofuels (Table 4);
  • Studied the effect of the proprietary HTP catalyst on a reference feedstock. The process temperature was lowered by 10 to 40 °C, the pressure requirement was reduced by 1 to 2 MPa, the rate of yield was 22% higher, and total processing time was shortened by 3 h (Table 1);
  • Completed a detailed midinfrared analysis of feedstock that was treated by HTC with and without HTP catalyst. Unlike the pure HTC process, which produced material more like the char from torrefaction, the HTP catalytic process resulted in a biofuel that had many functional groups including ether, carboxylic, and ketone bonds (Figure 4 and Figure 5). In other words, the pure HTC process destroyed the lignin in the biomass, while the HTP catalytic process preserved the polymer of the lignin; and
  • Tested approximate analysis of the HTP catalyst biofuel from wood waste and sugarcane bagasse waste. They all had an energy density of about 26 MJ/kg but showed different results for other properties, respectively—ash (1.3%, 4.6%), fixed carbon (39.8%, 51.0%) (Table 3).
With a large quantity of the water for hydrolysis and hydration, it creates conflict with acid-catalyzed reactions and decreases the acid strength and catalytic activity. Therefore, using a catalyst often has a scalability issue. This research already attempted a 10-times stronger dilution and checked the difference of the processing temperature (20 °C lower with a 10-times stronger catalyst). However, a pilot plant for a larger scale than the lab-sized pressure vessel should be followed up for a scalability check-up, and it should be confirmed that the HTP catalyst provides a better capital cost and operating cost for a biofuel plant.

Author Contributions

The manuscript was written through contributions of all authors. All authors have given approval to the final version of the manuscript. These authors contributed individually such that A.F.M.: Writing-Original Draft Preparation, T.S.: Writing-Review & Editing, H.Y.: Supervise, K.C.: Writing-Original Draft Preparation & Funding Acquisition.

Funding

This work was supported by the Korea Institute of Energy Technology Evaluation and Planning (KETEP) and the Ministry of Trade, Industry & Energy (MOTIE) of the Republic of Korea (No. 20168520100770).

Conflicts of Interest

The authors declare no conflict of interest.

References

  1. Yamaguchi, D.; Kitano, M.; Suganuma, S.; Nakajima, K.; Kato, H.; Hara, M. Hydrolysis of Cellulose by a Solid Acid Catalyst under Optimal Reaction Conditions. J. Phys. Chem. C 2009, 113, 3181–3188. [Google Scholar] [CrossRef]
  2. Mansir, N.; Taufiq-Yap, Y.H.; Rashid, U.; Lokman, I.M. Investigation of Heterogeneous Solid Acid Catalyst Performance on Low Grade Feedstocks for Biodiesel Production: A review. Energy Convers. Manag. 2017, 141, 171–182. [Google Scholar] [CrossRef]
  3. Sherrard, E.C.; Kressman, F.W. Review of Processes in the United States Prior to World War II. Ind. Eng. Chem. 1945, 37, 4–8. [Google Scholar] [CrossRef]
  4. Harris, E.E.; Beglinger, E. Madison Wood Sugar Process. Ind. Eng. Chem. 1946, 38, 890–895. [Google Scholar] [CrossRef]
  5. Mackintosh, A.F. Process and Apparatus for Recycling Coated Paper Products. U.S. Patent 8,715,462 B2, 6 May 2014. [Google Scholar]
  6. Mackintosh, A.F. Preparation of Biofuels and Other Useful Products such as 5 (hydroxymethyl) Furfuraldehyde. World Patent WO 2010/214381 A12, 20 June 2017. [Google Scholar]
  7. Berge, N.D.; Ro, K.S.; Mao, J.; Flora, J.R.V.; Chappell, M.A.; Bae, S. Hydrothermal Carbonization of Municipal Waste Streams. Environ. Sci. Technol. 2011, 45, 5696–5703. [Google Scholar] [CrossRef] [PubMed]
  8. Hwang, I.-H.; Aoyama, H.; Matsuto, T.; Nakagishi, T.; Matsuo, T. Recovery of Solid Fuel from Municipal Solid Waste by Hydrothermal Treatment Using Subcritical Water. Waste Manag. 2012, 32, 410–416. [Google Scholar] [CrossRef] [PubMed]
  9. Cao, X.; Ro, K.S.; Chappell, M.; Li, Y.; Mao, J. Chemical Structures of Swine-Manure Chars Produced under Different Carbonization Conditions Investigated by Advanced Solid-State 13C Nuclear Magnetic Resonance (NMR) Spectroscopy. Energy Fuels 2011, 25, 388–397. [Google Scholar] [CrossRef]
  10. Goto, M.; Obuchi, R.; Hirose, T.; Sakaki, T.; Shibata, M. Hydrothermal Conversion of Municipal Organic Waste into Resources. Bioresour. Technol. 2004, 93, 279–284. [Google Scholar] [CrossRef] [PubMed]
  11. Lu, X.; Pellechia, P.J.; Flora, J.R.V.; Berge, N.D. Influence of Reaction Time and Temperature on Product Formation and Characteristics Associated with the Hydrothermal Carbonization of Cellulose. Bioresour. Technol. 2013, 138, 180–190. [Google Scholar] [CrossRef] [PubMed]
  12. Qi, X.; Lian, Y.; Yan, L.; Smith, R.L. One-step Preparation of Carbonaceous Solid Acid Catalysts by Hydrothermal Carbonization of Glucose for Cellulose Hydrolysis. Catal. Commun. 2014, 57, 50–54. [Google Scholar] [CrossRef]
  13. Efunda Steam Table: Saturated. Available online: http://www.efunda.com/materials/water/steamtable_sat.cfm (accessed on 11 November 2014).
  14. Funke, A.; Ziegler, F. Hydrothermal carbonization of biomass: A Summary and Discussion of Chemical Mechanisms for Process Engineering. Biofuels Bioprod. Biorefining 2010, 4, 160–177. [Google Scholar] [CrossRef]
  15. US Forest Service, U.S. Forest Service. 2010. Available online: http://www.fpl.fs.fed.us/documnts/pdf2010/fpl_2010_agarwal001.pdf (accessed on 30 November 2019).
  16. Ciolacu, D.; Ciolacu, F.; Popa, V.I. Amorphous Cellulose—Structure and Characterization. Cellul. Chem. Technol. 2011, 45, 13–21. [Google Scholar]
  17. Madison, W. Infrared Spectral Interpretation; Thermo Fisher Scientific Corporation: Waltham, MA, USA, 2008. [Google Scholar]
  18. Girisuta, B. Levulinic Acid from Lignocellulosic Biomass. Ph.D. Thesis, University of Groningen, Groningen, The Netherlands, 2007. [Google Scholar]
  19. Ghaziaskar, A.; McRae, G.A.; Mackintosh, A.; Lai, E.P.; Basu, O.D. Production of Organic Compounds through Catalyzed Hydrothermal Carbonization of Woody Biomass. Energy Fuels 2019, 33, 9879–9885. [Google Scholar] [CrossRef]
  20. Joo, B.; Yeon, H.; Lee, S.; Ahn, S.; Lee, K.; Jang, E.; Won, J. Conversion of Wood Waste into Solid Biofuel Using Catalytic HTC Process. J. Korean Soc. New Renew. Energy 2014, 10, 12–18. [Google Scholar] [CrossRef] [Green Version]
  21. Simsir, H.; Eltugral, N.; Karagoz, S. Hydrothermal Carbonization for The Preparation of Hydrochars from Glucose, Cellulose, Chitin, Chitosan and Wood Chips via Low-temperature and Their Characterization. Bioresour. Technol. 2017, 246, 82–87. [Google Scholar] [CrossRef] [PubMed]
Figure 1. Saturated water pressure as a function of temperature over the region from 100 to 260 °C. The data points were calculated from the EFUNDA online publisher of saturated steam tables [13]. Fine chips (wood) used for feedstock.
Processes 08 00303 g001
Figure 2. One liter tank in oven (Hewlett Packard 5890 GC) ready for heating.
Processes 08 00303 g002
Figure 3. Wood samples were processed for various times at 230 °C under two conditions—with catalyst (RED) at 2 g/L concentration and with only water (BLUE).
Processes 08 00303 g003
Figure 4. FTIR spectrum of OH region of MID INFRARED SPECTRUM. The three samples are raw wood, biofuel from hydrothermal polymerization (HTP) catalytic process and biochar from hydrothermal carbonization (HTC) process where no catalyst is used.
Processes 08 00303 g004
Figure 5. FTIR spectrum of FINGERPRINT region of MID INFRARED SPECTRUM. The three samples are raw wood, biofuel from HTC and biochar from the HTC process where no catalyst is used.
Processes 08 00303 g005
Figure 6. HTP catalyst biofuel from wood chips being separated from the catalyst solution using vacuum filtration.
Processes 08 00303 g006
Figure 7. Energy density of HTP catalyst biofuel from cotton as a function of time and temperature. The HTP catalyst concentration was 2 g/L.
Processes 08 00303 g007
Figure 8. Total ion chromatograms process solution from HTP process as a function of time. The HTP catalyst concentration was 2 g/L. Acetic acid (AA) at 6.04 min, formic acid (FA) at 6.21 min, levulinic acid (LA) at 12.13 min, and 2,5-hydroxymethyl furfuraldehyde (HMF) at 13.27 min retention time.
Processes 08 00303 g008
Figure 9. Concentration of intermediates in HTP catalyst from wood as a function of time. The HTP catalyst concentration was 2 g/L.
Processes 08 00303 g009
Table 1. Summary of properties of HTC without a catalyst vs. HTC with a HTP catalyst.
ConditionHTC w/o a CatalystHTC with HTP Catalyst
MaterialHydro char materialBranched polymer oxygenated hydrocarbon fuel.
Temperature250 °C220–240 °C 1
Pressure4.1 MPa2.3–3.3 MPa
Process Time4 h1 h
Binding propertiesPoorExcellent
Energy density24–28 MJ/kg27–28 MJ/kg
Yield~40%~60%
1 20 g/L catalyst = 220 °C; 2 g/L catalyst = 240 °C.
Table 2. Energy density for various feedstocks. Process time was 130 min and the temperature was 230 °C. The catalyst concentration was 2 g/L.
FeedstockFeedstock
HHV (MJ/kg)
HTP Biofuel
HHV (MJ/kg)
Cotton15.1726.73
Cow Manure18.0224.27
Sugar Cane Bagasse14.8527.40
Waste Paper14.1626.61
Waste Wood17.8127.49
Restaurant Waste19.0028.07
Table 3. TGA/DSC analysis of HTP catalyst biofuel for various feedstocks. Process time was 120 min and the temperature was 230 °C. The catalyst concentration was 2 g/L.
Waste WoodSugar Cane Bagasse
Feedstock (air dried)HTP BiofuelFeedstock (air dried)HTP Biofuel
Energy Density
(MJ/kg)
17.826.117.5826.0
Ash
(%)
1.21.31.24.6
Fixed Carbon
(%)
17.139.821.151.0
Volatiles
(%)
72.356.868.441.1
Moisture
(%)
9.22.19.33.3
Table 4. Comparison of hydrothermal process results for wood with catalyst and noncatalyst.
CatalystMaterialTemp (°C)Time (h)Energy Density (MJ/kg)Mass Yield (%)Efficiency of the Process ( η ) Reference
Non CatalystWood Chip250427401.08
HTP Catalyst (C4H4O4) 2 g/LWood Chip230226.1603.40
HTP Catalyst (C4H4O4) 20 g/LWood Chip220127607.36
Non CatalystWaste Wood220122.365.26.61Joo et al. [20]
CaCl2Waste Wood220125.350.15.76Joo et al. [20]
Non CatalystWooden Chopsticks234223.5592.96Hwang et al. [8]
Non CatalystWooden Chopsticks294226.79512.32Hwang et al. [8]
Non CatalystWood chip200617.3160.60.87H. Simsir et al. [21]
Non CatalystWood chip2001219.14590.47H. Simsir et al. [21]

