Methane Adsorption Interpreting with Adsorption Potential and Its Controlling Factors in Various Rank Coals


1
School of Energy Resources, China University of Geosciences, Beijing 100083, China
2
Coal Reservoir Laboratory of National Engineering Research Center of Coalbed Methane Development & Utilization, Beijing 100083, China
*
Author to whom correspondence should be addressed.
Processes 2020, 8(4), 390; https://0-doi-org.brum.beds.ac.uk/10.3390/pr8040390
Submission received: 21 February 2020
/
Revised: 18 March 2020
/
Accepted: 21 March 2020
/
Published: 27 March 2020
(This article belongs to the Section Environmental and Green Processes)
Abstract
:Water content, metamorphism (coal rank) particle size, and especially pore structure, strongly influence the adsorption capacity of coal to methane. To understand the mechanism of methane adsorption in different rank coals, and its controlling factors, isothermal adsorption experiments with different coal ranks, moisture contents and particle sizes at the temperature of 303.15 K were conducted. In addition, the pore structures of coals were investigated through N2 adsorption/desorption experiments at the low-temperature of 77 K for selected coals from the Junggar Basin of NW China, Qinshui Basin and Ordos Basin of north China. Moreover, the adsorption potential of methane on the surface of the coal matrix was calculated, the controlling factors of which were discussed. The obtained methane isothermal adsorption result shows that the Langmuir volume (VL) of coal is independent of the particle size, and decreases with the increase of moisture content, which decreases first and then increases when the coal rank increases. Combined with the pore structure by the N2 adsorption at 77 K, VL increases with the increase of pore surface area and pore volume of coal pores. Besides, the adsorption potential of all selected coals decreased with the increase of the methane adsorption volume, showing a negative relationship. The interesting phenomena was found that the surface adsorption potential of the coal matrix decreases with the increase of moisture content, and increases with the decrease of particle size at the same pressure. With the same adsorption amount, the adsorption potential on the surface of coal matrix decreases first, and then increases with the increase of coal rank, reaching a minimum at Ro,m of 1.38%, and enlarging with the increase of pore surface area and the pore volume of coal pores. These findings may have significant implications for discovering CBM accumulation areas and enhancing CBM recovery.
1. Introduction
With the increasing energy consumption, the exploration and development of unconventional oil and gas has been promoted [1], among which coalbed methane (CBM), as a kind of unconventional natural gas, has great exploitation potential [2]. Over 80% of CBM is present in the adsorbed state in the coal matrix, and a small amount exists in the pores in the free state [3,4,5]. Accurate evaluation of the CBM adsorption amount in the coal seam is the key to accurately estimate the geological reserves, which is also of great significance for the CBM development.
Since methane exists in the coal seam mainly in the adsorption state, the isothermal adsorption becomes the key way to study the methane adsorption on the coal matrix. The methane isothermal adsorption curve can be obtained by measuring the adsorption amount of methane on the coal matrix under different pressures. Factors including temperature, pressure, coal metamorphism and moisture content have significant influence on the adsorption amount of methane [6]. Therefore, understanding the factors controlling on methane adsorption is crucial for the adsorption capacity of coal to methane.
Polanyi [7] used a formula to quantitatively value the adsorption potential. The adsorption potential can be regarded as a gravity field of adsorbate, and nearby molecules are adsorbed on the surface to form a multi-molecular adsorption layer, which is based on the assumption that the adsorption potential is independent of temperature. The adsorption force is considered as “dispersion force”, that is, the closer the distance between gas molecules and the solid surface, the greater the gravity, independent of temperature [8]. In addition, Dubinin’s micropore filling theory [9] is based on the adsorption potential theory, making it the most complete, mature and practical theoretical system for the gas phase adsorption behavior of microporous adsorbents, especially carbon microporous adsorbents.
Adsorption potential has been widely used in the study of the adsorption of activated carbon and graphite on gases [10], but in the adsorption of coal, a heterogeneous substance, to methane and other gases, only a few researches have been involved in recent years [11]. For instances, some studies on factors affecting the value of the adsorption potential demonstrated that the relationship between adsorption potential and the adsorption space is unique [6], and the adsorption potential decreases with the increase of the gas adsorption volume [12]. Moreover, the adsorption potential of different structural coals having the same adsorption amount increases with the increasing coal rank [6,9]. Previous research [13] found that the larger the adsorption potential, the more conducive to methane adsorption, and other scholars have optimized the adsorption potential formula and introduced new parameters to accurately predict isothermal adsorption curves at various temperatures [14,15,16].
In this work, the adsorption capacity of variable rank coals to methane will be acquired through the basic Langmuir theory. Along with this, factors including moisture content, pore structure, coal rank and particle size influencing on the adsorption potential also will be system investigated. Moreover, the mechanism that factors the affecting of the adsorption characteristics of the coal matrix will be further elaborated. Therefore, this study will provide theoretical guidance for reducing the adsorption potential of the pore surface, improving the desorption rate and increasing gas production rate during CBM exploitation.
2. Samples and Experiments
2.1. Sample Selection
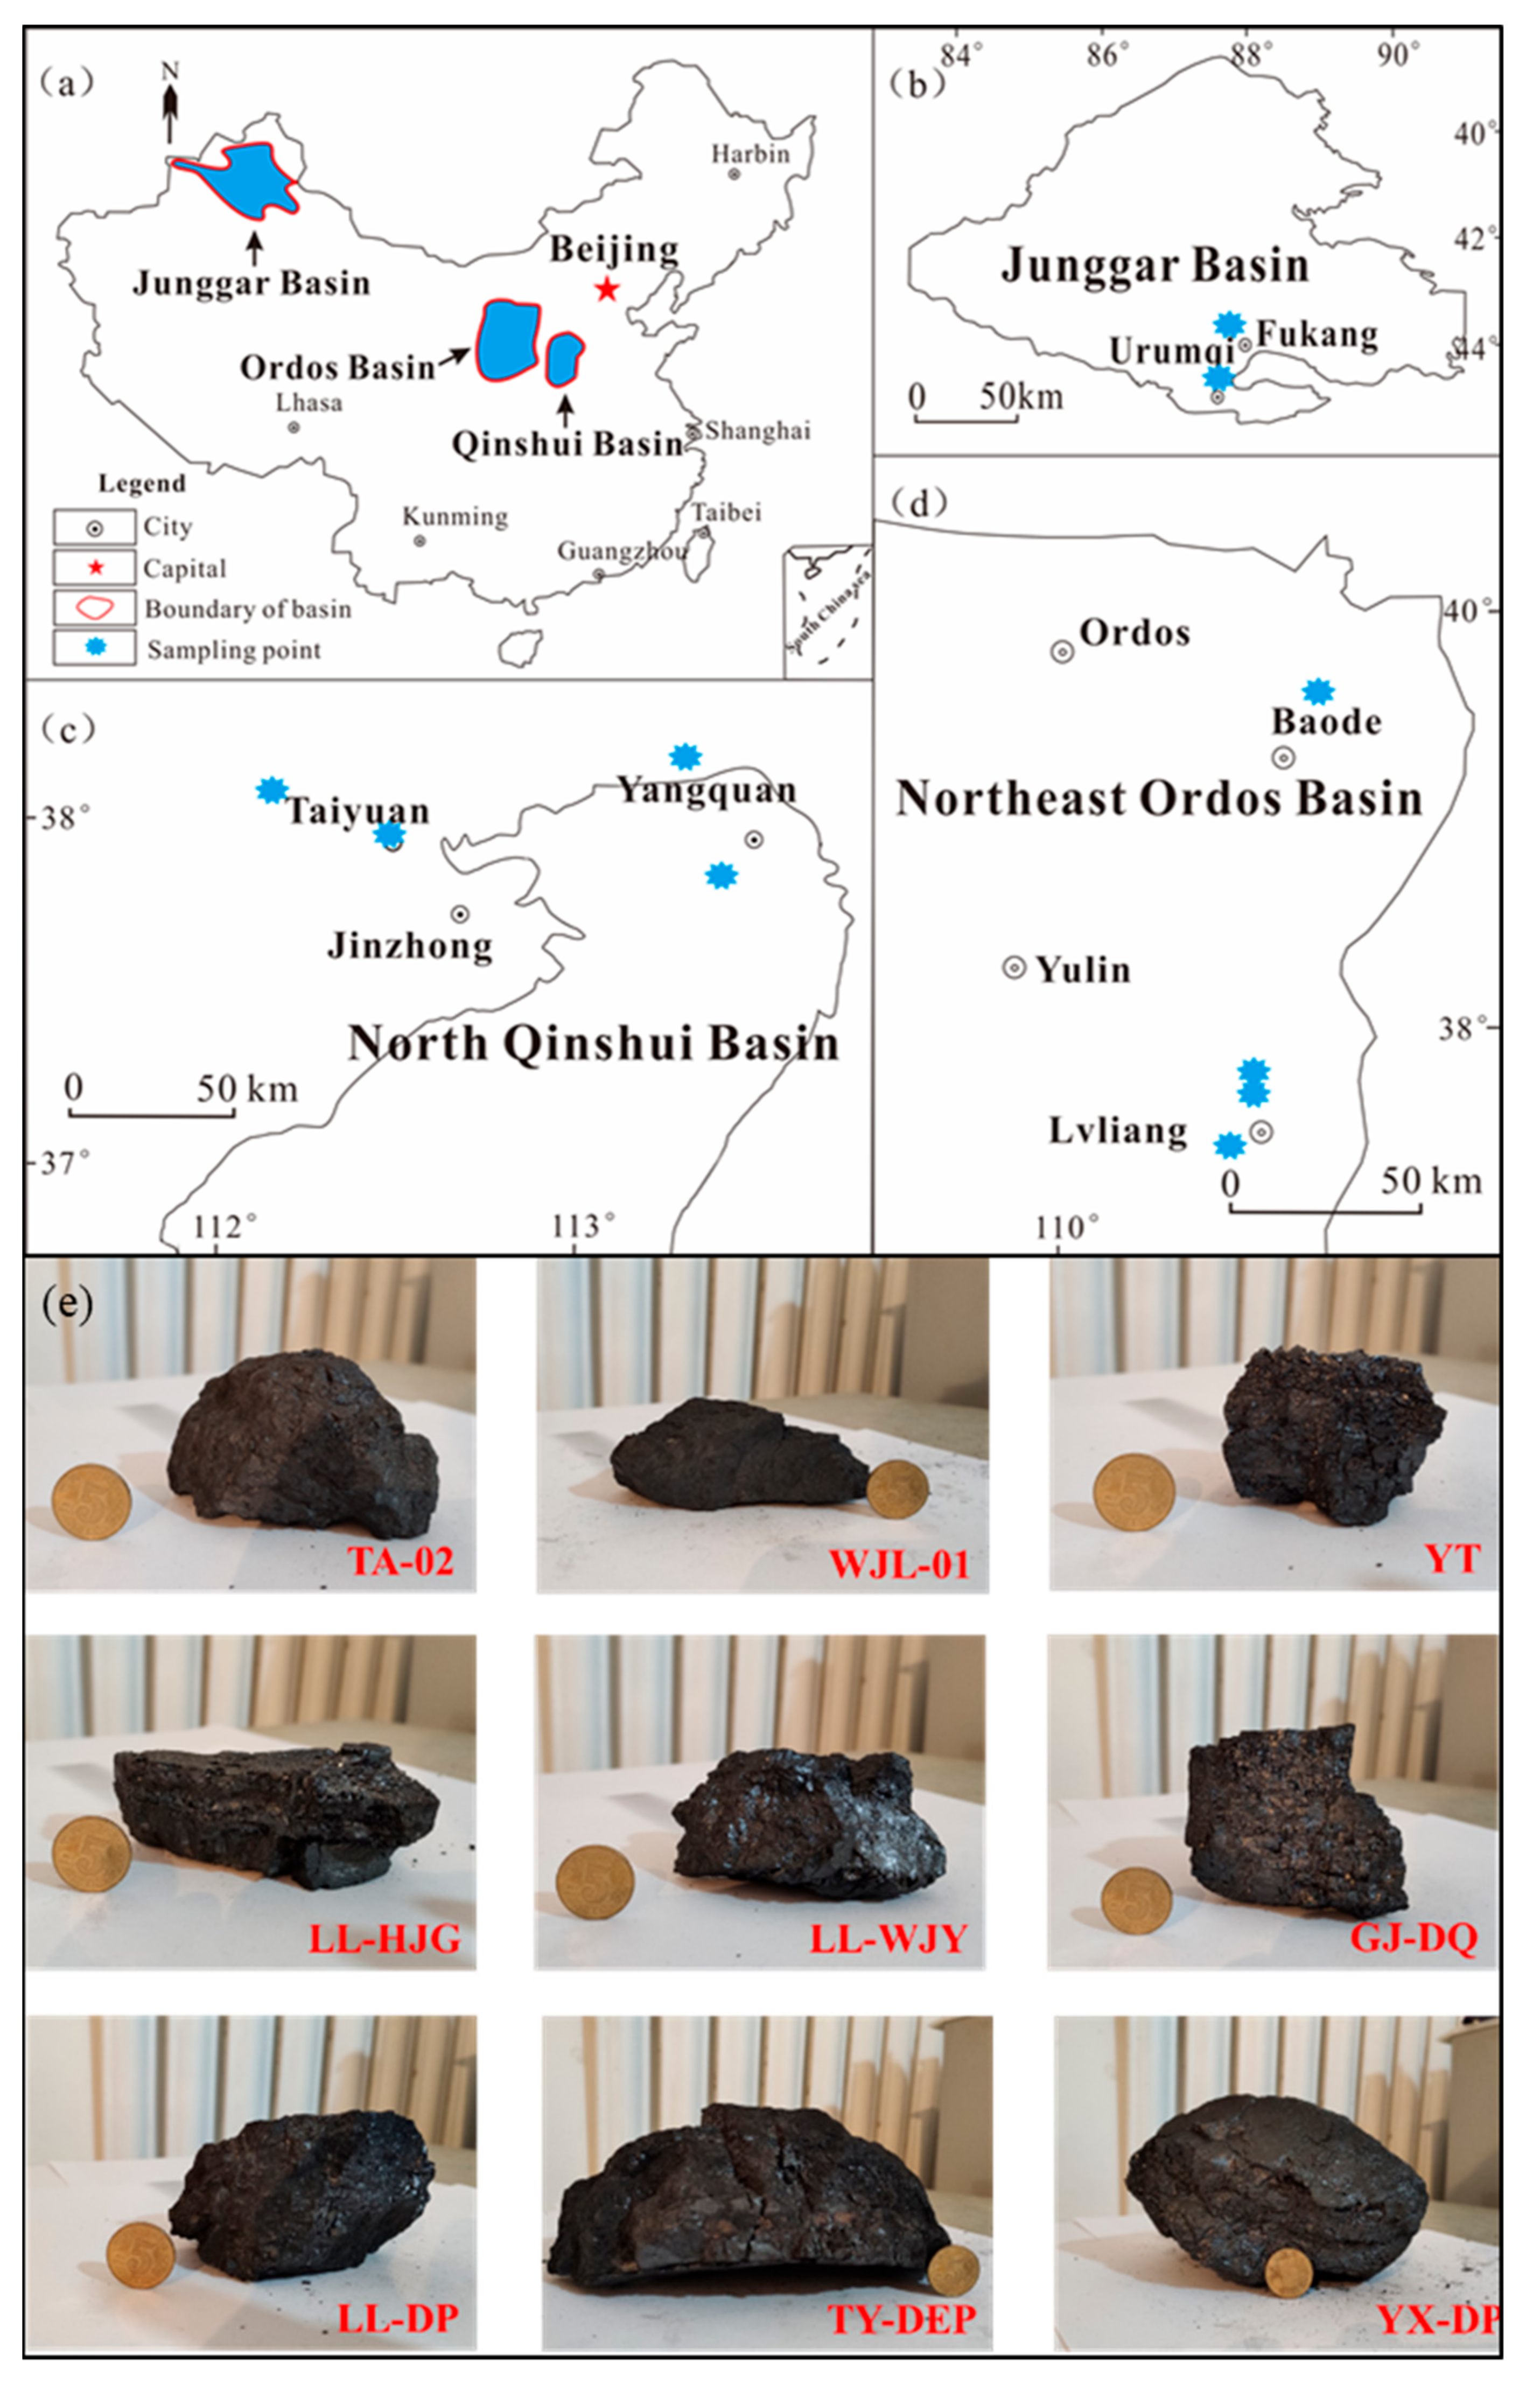
In this work, 17 coal samples were selected from different coal-bearing basins (Figure 1e), among which the low-rank coals (Ro,m = 0.51%–0.70%) were from the southern margin of the Junggar Basin in Xinjiang (Figure 1b) of NW China, the medium-rank coals (Ro,m = 0.72%–1.68%) were from the northern part of the Qinshui Basin of north China (Figure 1c), and the high-rank coals (Ro,m = 2.18%–2.54%) were from central and northern regions of Ordos Basin of north China (Figure 1d).
2.2. Experimental Method
2.2.1. Coal Basic Analysis
The coal rank is expressed by Ro,m (maximum vitrinite reflectance), which is the maximum percentage of the intensity of light (λ = 546 nm) reflected from the polished surface of the vitreous under the oil-immersed microscope objective, to the intensity of the perpendicular incident light for polished grain mounts.
The value was obtained under white light, using a luminometer system to magnify the polished coal 500 times in an oil immersion apparatus, and then perform petrological observation (500 points) according to the Chinese (GB/T) 6948-1998 experimental standard [17]. Proximate analysis of coal samples, with a particle size of less than 0.2 mm, according to the ISO 17246-2010 experimental standard, including the Ash content of the air drying base (Aad), Volatile content of the air drying base (Vad), Moisture content of the air drying base (Mad) and the Organic carbon content of the air drying base (FCad) as our previous research [18].
2.2.2. Isothermal Adsorption of Methane
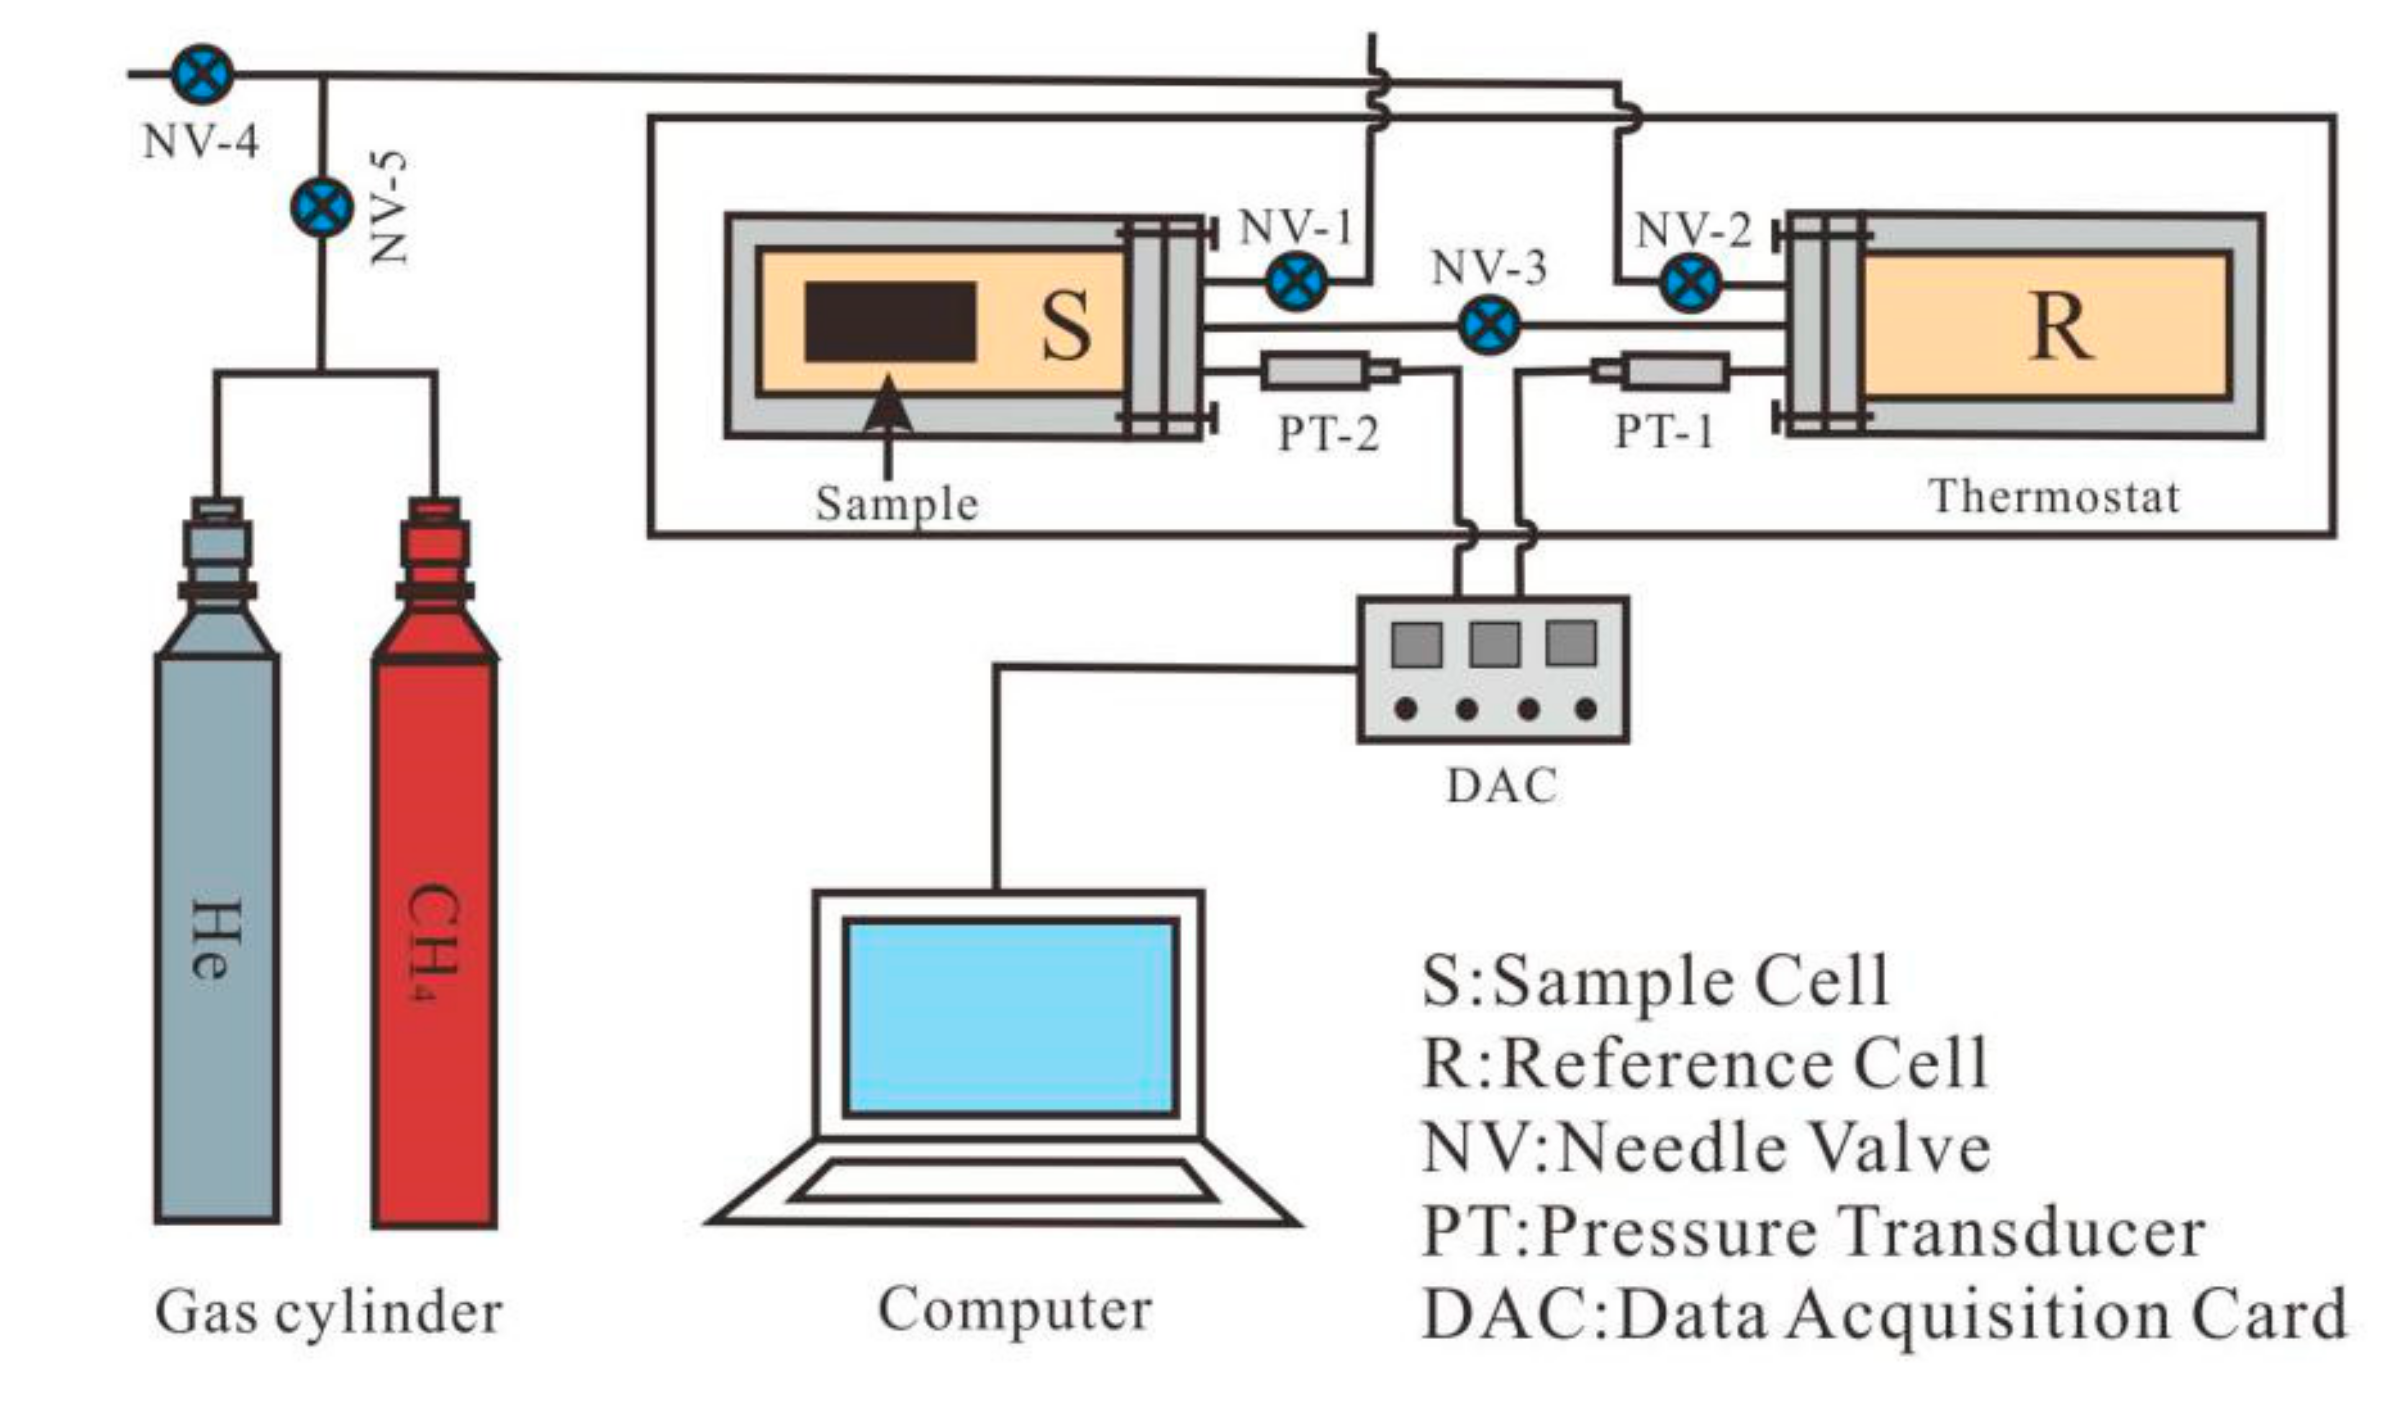
The methane isotherm adsorption experiment strictly follows the experimental criteria in GB/T19560-2008. The instrument was subjected to a TerraTek-300 isotherm adsorption tester at an experimental temperature of 303.15 K [19,20]. The purity of methane and helium used in the experiment was 99.99% (Figure 2).
Our coal sample was first ground to 0.25–0.18 mm, dried in a drying oven at 378.15 K for more than 12 h, and then cooled in an anhydrous copper sulfate drier. Determination of coal skeleton volume: filling the cell R with He, and opening the NV-3 until the pressure of the two cells is almost the same. After the two cells pressures are no longer reduced, we recorded the pressures of the two cells. We vented the cell S and repeated the above operation once. Determination of absolute adsorption capacity of coal samples: fill the cell R with CH4. Slowly open the NV-3 of the two cells to fill the sample cylinder with a certain amount of CH4, and then close the NV-3. After the pressure of the two cells was stable, we recorded the pressure values of the two cells. Then, the above operations were repeated 6–7 times to control the distribution of the pressure point of the sample cylinder in accordance with the experimental rules.
After that, the reduction of the amount of substance of CH4 in the cells was obtained by the change of the pressure value according to the equation of the state of an ideal gas:
where P is the adsorption pressure (MPa); V’ is the amount of free CH4 (cm3); n is the amount of substance of free CH4; Z is the compressibility factor; R is the universal gas, R = 8.3144 J/(mol·K); T is the absolute temperature (K).
Then we changed the reduction of amount of substance of CH4 into volume, that is, the amount of methane adsorbed on the coal matrix. The isotherm adsorption curve was fitted to obtain the Langmuir parameters. Fitting is the relationship between the adsorption volume of coal and methane by adsorption pressure according to the Langmuir equation [21]:
where V is the amount of methane adsorption (cm3/g); P is the adsorption pressure (MPa); VL is the Langmuir volume (cm3/g); PL is the Langmuir pressure (MPa).
2.2.3. Low-Temperature N2 Adsorption/Desorption Experiment
Low-temperature N2 adsorption/desorption experiments were performed using the Micromeritics ASAP-2020 automated surface analyzer at the coal reservoir physical properties laboratory of China University of Geosciences at Beijing. For sample preparation, the coal sample was also first ground to 0.25–0.18 mm. Degassing process: accurately weigh a certain amount of sample into the sample tube and record the mass of the sample tube and the sample. Then, install the sample tube on the degassing station, put on the insulation sleeve, and carry out the sample degassing. Finally, the sample that had been evacuated was allowed to stand at 105 Celsius and 0.25 Pa for more than 12 h. Analytic process: the sample tube was removed from the degassing station and reweighed to record the actual mass of the sample tube sample. Then, the sample tube was placed into the analysis station with the insulation sleeve, and a certain amount of liquid nitrogen was added to the Dewar of the analysis station to start the experimental analysis [22,23].
2.3. Methodology of Adsorption Potential
According to the theory of adsorption potential, the relationship between adsorption potential and pressure is as follows [7]:
where ε is the adsorption potential (J/mol); P is the equilibrium pressure (MPa); P0 is the saturated vapor pressure of gas (MPa); Pi is the equilibrium pressure (MPa) of the ideal gas at constant temperature; R is the universal gas, R = 8.3144 J/(mol·K); T is the absolute temperature (K).
The critical temperature of methane is 190.6 K, while the experimental temperature of the isothermal adsorption experiment is 303.15 K, which is higher than the critical temperature of methane. Therefore, the saturated vapor pressure P0 under critical conditions loses its effect. In this case, the empirical calculation formula established by Dubinin is needed to calculate the virtual saturated vapor pressure under methane supercritical conditions. The calculation expression is as follows [24]:
where Ps is the virtually saturated vapor pressure (MPa) of methane in supercritical state; Pc is the critical pressure (MPa) of methane, Pc = 4.62 MPa; Tc is the critical temperature (K) of methane, and the value is 190.6 K; T is the absolute temperature (K). Then the relationship between the adsorption potential, and the pressure is written as:
Herein, the relationship between the adsorption potential and absolute adsorption of methane are directly performed and no longer perform adsorption space calculation.
3. Results and Discussion
3.1. Ro,m and Proximate Analysis
Ro,m is the most important indicator of organic maturity. Proximate analysis is the main indicator for understanding the characteristics of coal, which is also the basic basis for evaluating coal quality. The basic results of select coals are shown in Table 1.
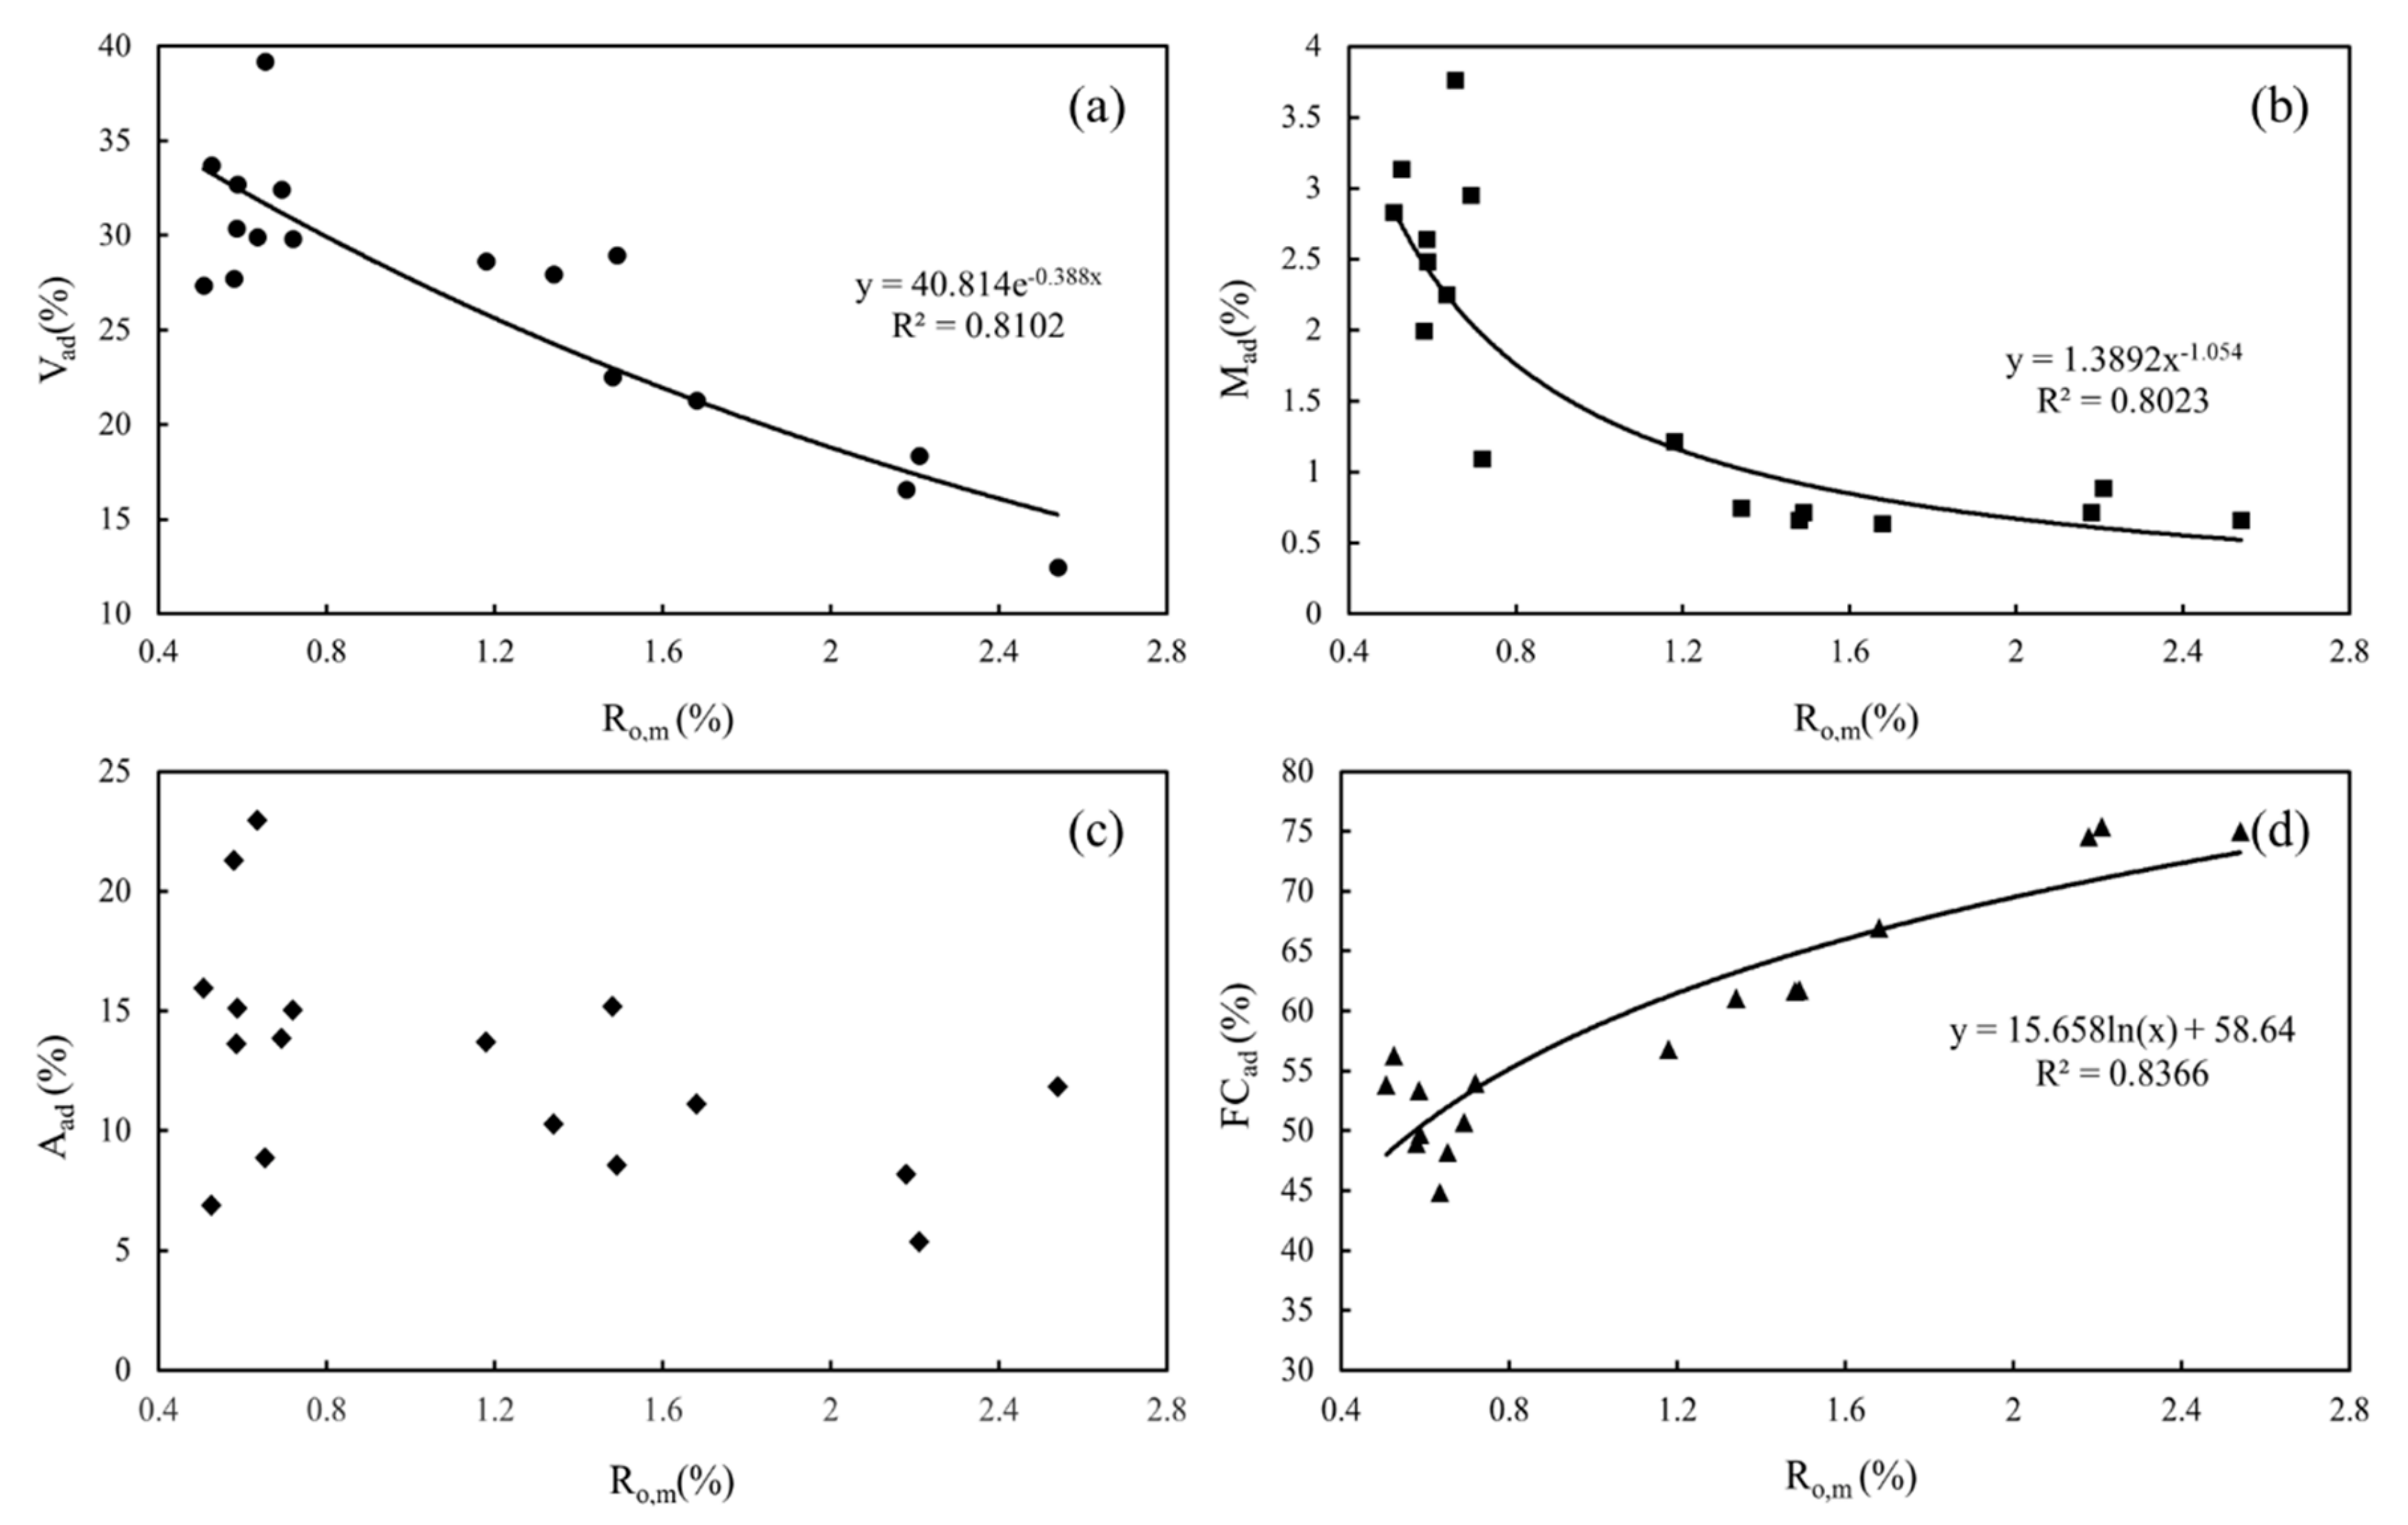
The volatile content of coal refers to the amount of gas that is decomposed and escaped from the coal under high temperature, which is an important indicator for evaluating the coalification [18]. There is a strong index correlation between the volatile content and Ro,m; that is, the volatile content decreases with the increase of Ro,m (Figure 3a). The moisture content in coal decreases with the deepening of the degree of metamorphism, and they have a strong correlation with the power function, according to Figure 3b. The decrease of moisture content is related to the enhancement of compaction and the transpiration of moisture. Moreover, the moisture content of low coal rank coal is much higher than medium and high coal rank coal, and it is stable at around 1% when Ro,m > 1%. The ash content of coal refers to the amount of residue left after complete combustion, which residue is mainly those mineral impurities in coal. The ash yields have little relationship with Ro,m, and the ash yields have a decreasing trend with the increase of metamorphism, showing that as the coalification increases, mineral filling decreases (Figure 3c). In the process of coalification, due to the loss of branched and increased degree of aromatic structuring, the organic carbon content of coal has a logarithmic correlation with Ro,m, and gradually increases with increasing Ro,m (Figure 3d).
3.2. Factors Influencing Methane Adsorption
3.2.1. Moisture Contents
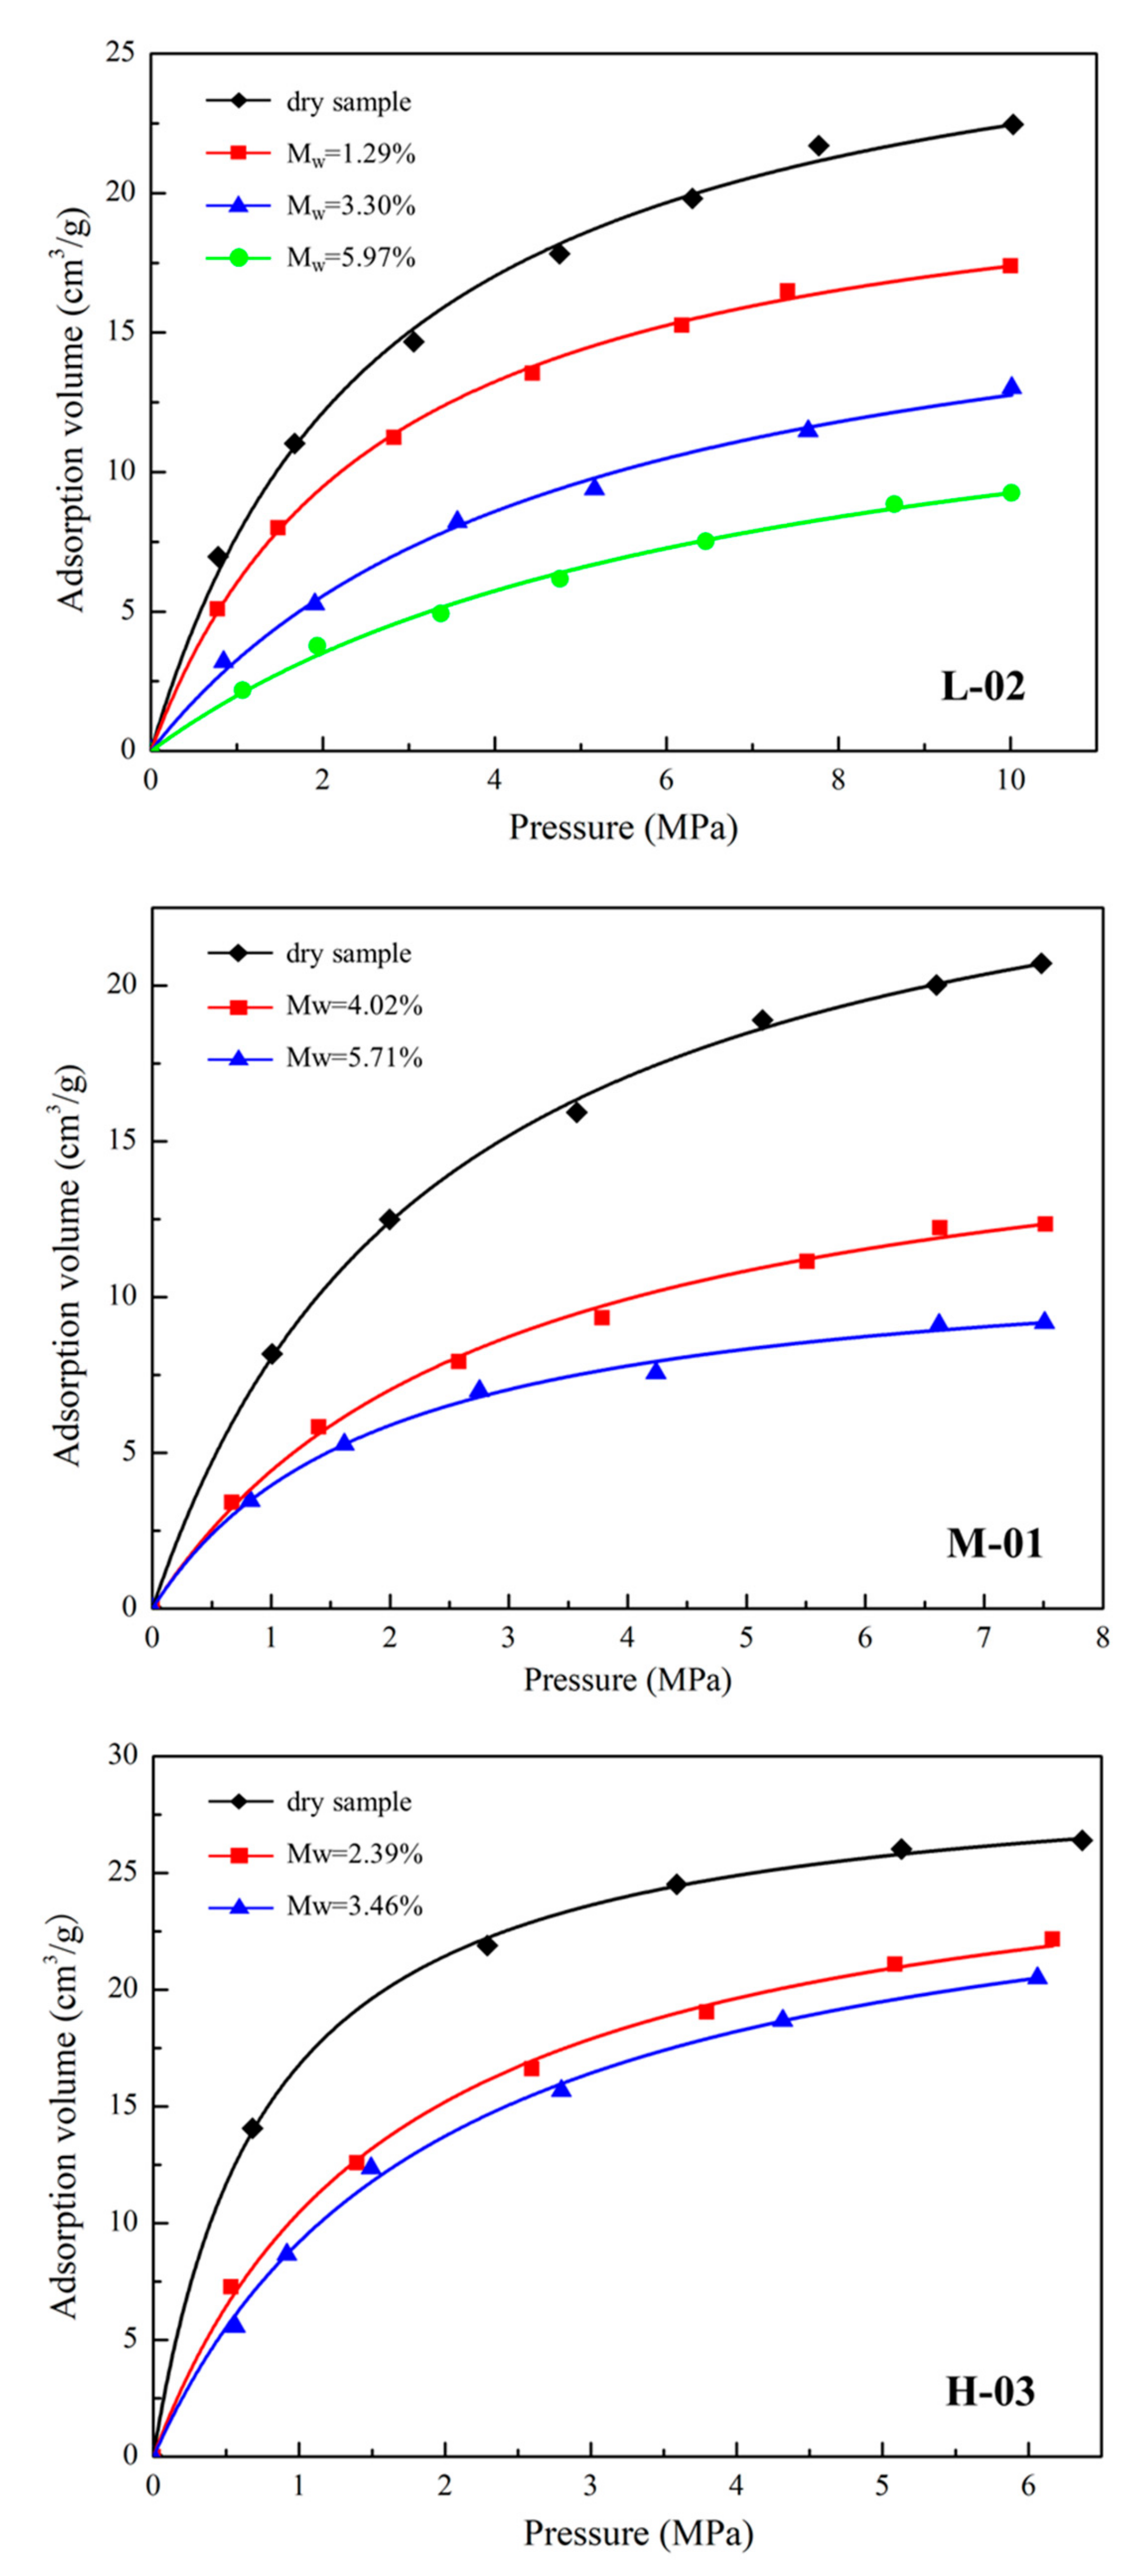
Representative coals of L-02 (low-coal rank), M-01 (medium-coal rank) and H-03 (high-coal rank) were selected for studying the effect of moisture content on methane adsorption. The experimental pressure varies from 0 to 10 MPa, and the isothermal adsorption curves of various coal rank samples under different moisture content conditions are shown in Figure 4. The adsorption amount of methane on the coals of each rank increases with increasing the adsorption pressure, but the growth rate varies at different pressure stages. At the beginning, the adsorption amount of methane increases rapidly with the increase of adsorption pressure, but the growth rate becomes smaller, and tends to be stable as the pressure increases further. The difference in the adsorption growth rate of different coal ranks may be caused by the different degrees of pore structure development.
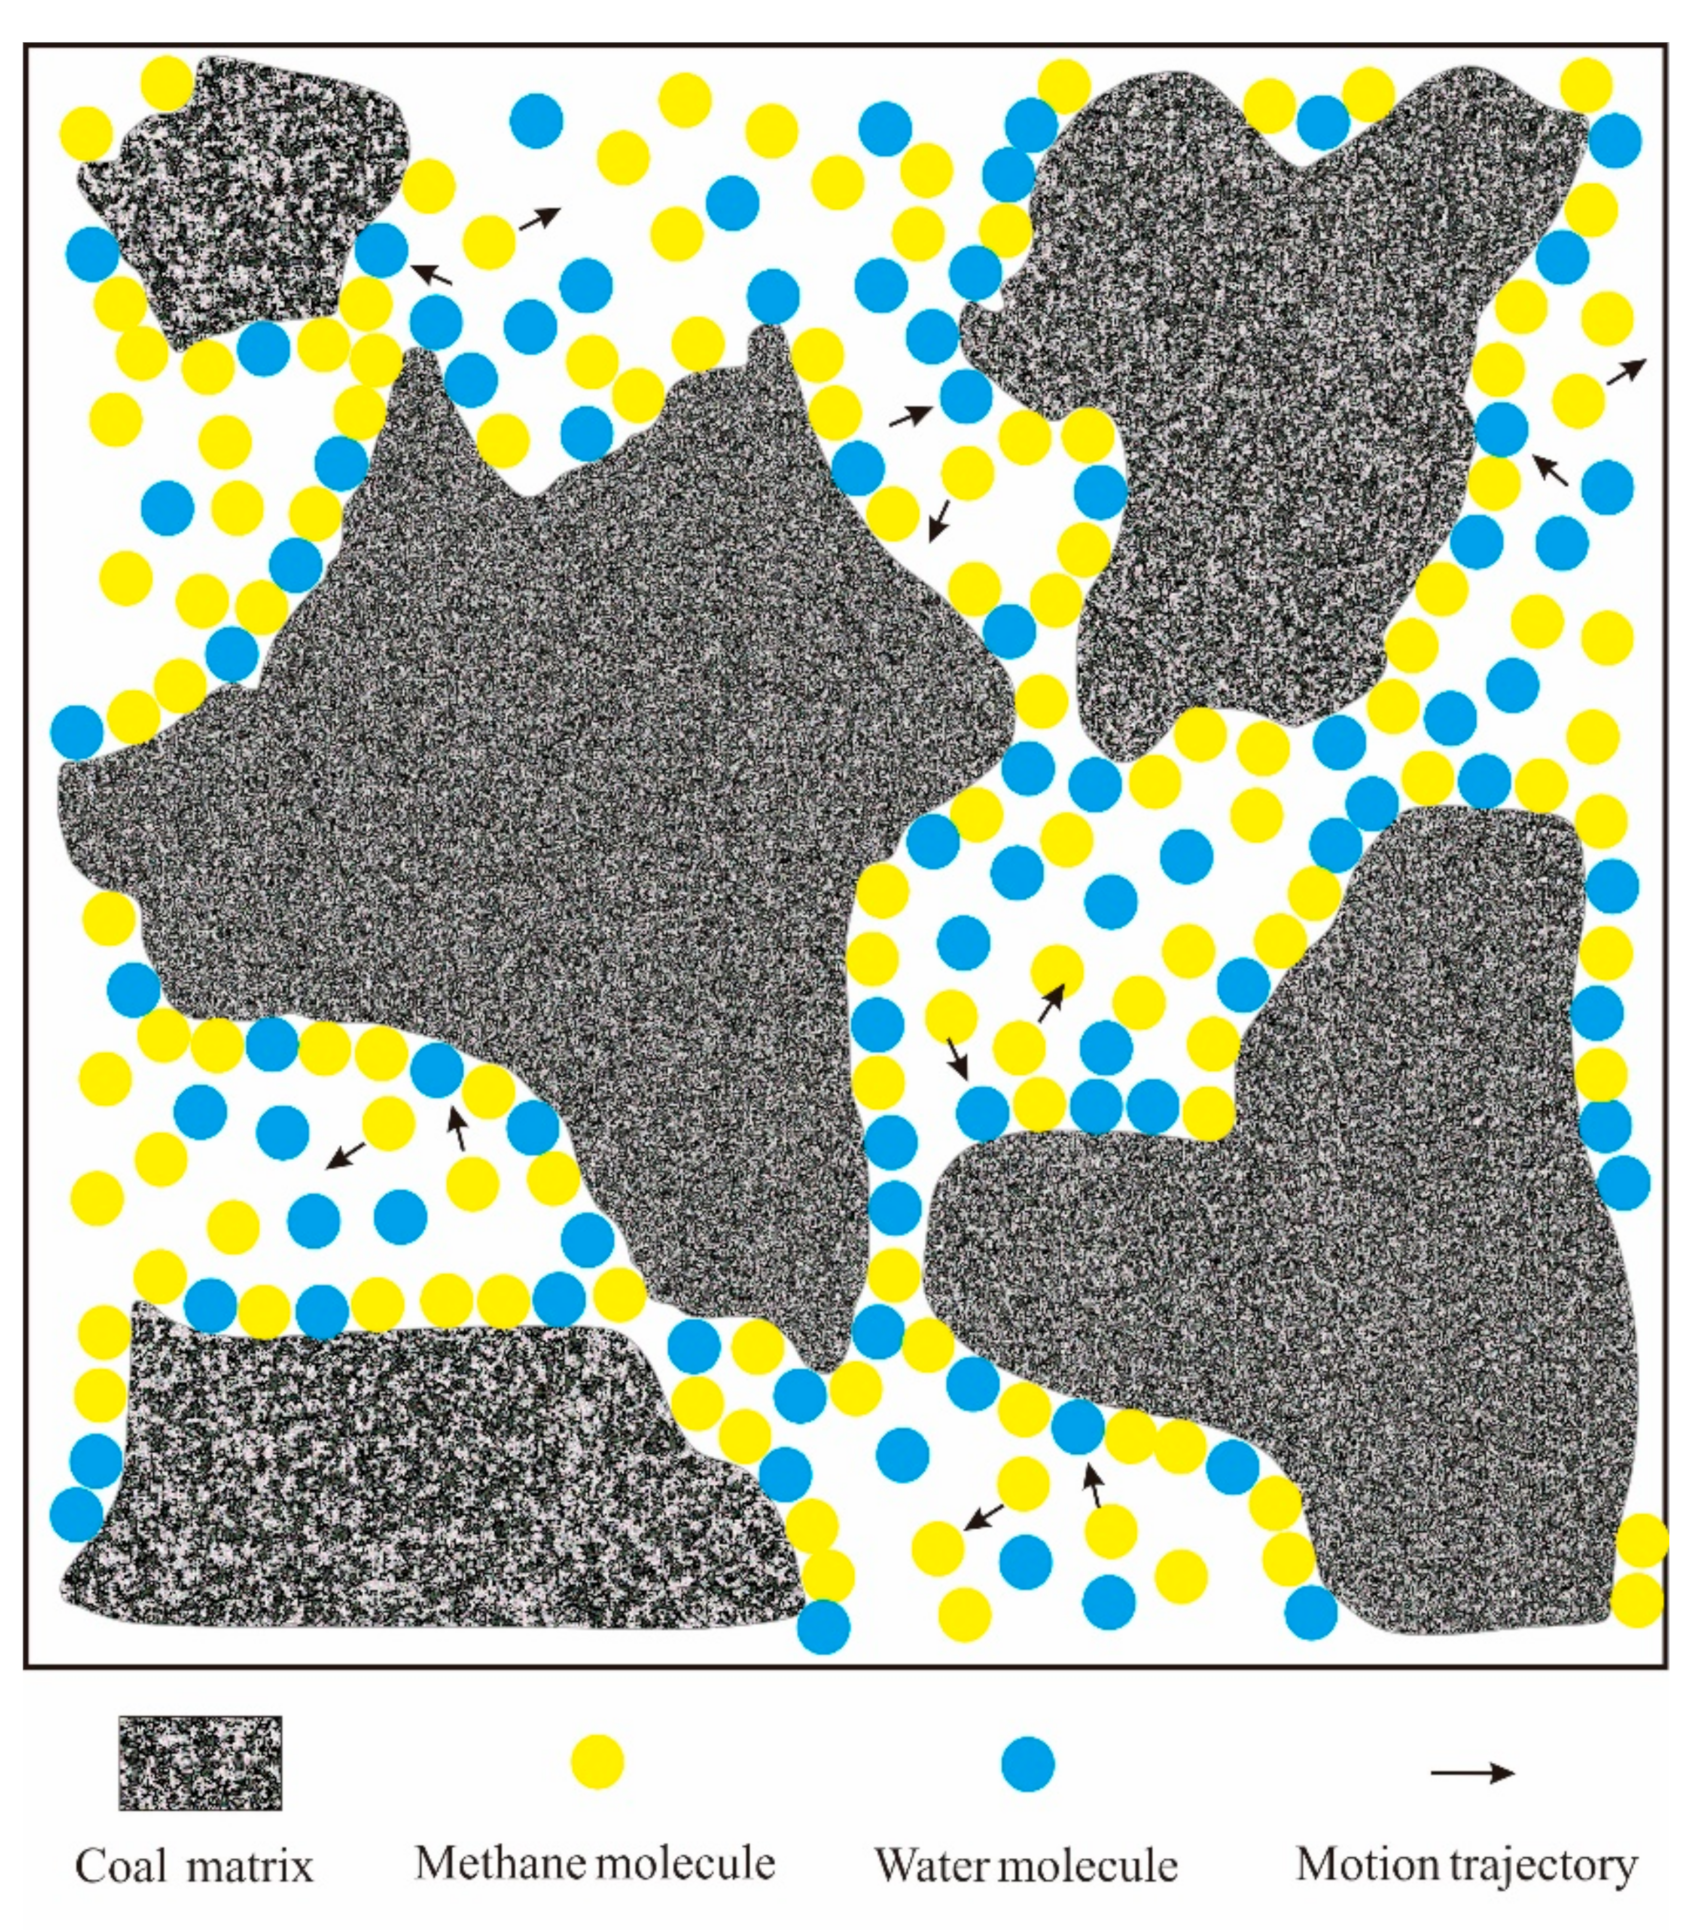
The same trend appears in the isothermal adsorption curves under different moisture conditions. For various coal ranks, when the adsorption pressure is constant, as the moisture content increases, the adsorption amount of methane gradually decreases. Therefore, the moisture should have an inhibitory effect on the adsorption capacity of coal, and an increase in the moisture content of coal leads to a decrease in the adsorption capacity of methane, which is consistent with previous research results [25,26]. The reasons for the decrease of methane adsorption as the moisture content of coal increases are as follows: (1) Water molecules are polar molecules, while methane is a non-polar molecule. The functional groups in coal tend to adsorb water molecules, which leads to a decrease in the effective adsorption sites of methane on coal and a decrease in adsorption capacity [27]; (2) The coal is rich in montmorillonites, kaolinite, illite and other clay materials, among which, kaolinite and montmorillonite, etc., have the property of water absorption and expansion, resulting in the effective pore volume in the coal, and the amount of methane adsorption reduction in the coal absorbs water and expands, which reduces the effective pore volume in the coal, and reduces the amount of methane adsorption [28,29]; (3) Part of the methane gas is dissolved in water, resulting in a decrease in the amount of methane adsorption [30,31]; (4) Water molecules block tiny pores and pore throats, so that the methane molecules cannot enter the pores for adsorption, resulting in a decrease in the amount of adsorption [32] (Figure 5).
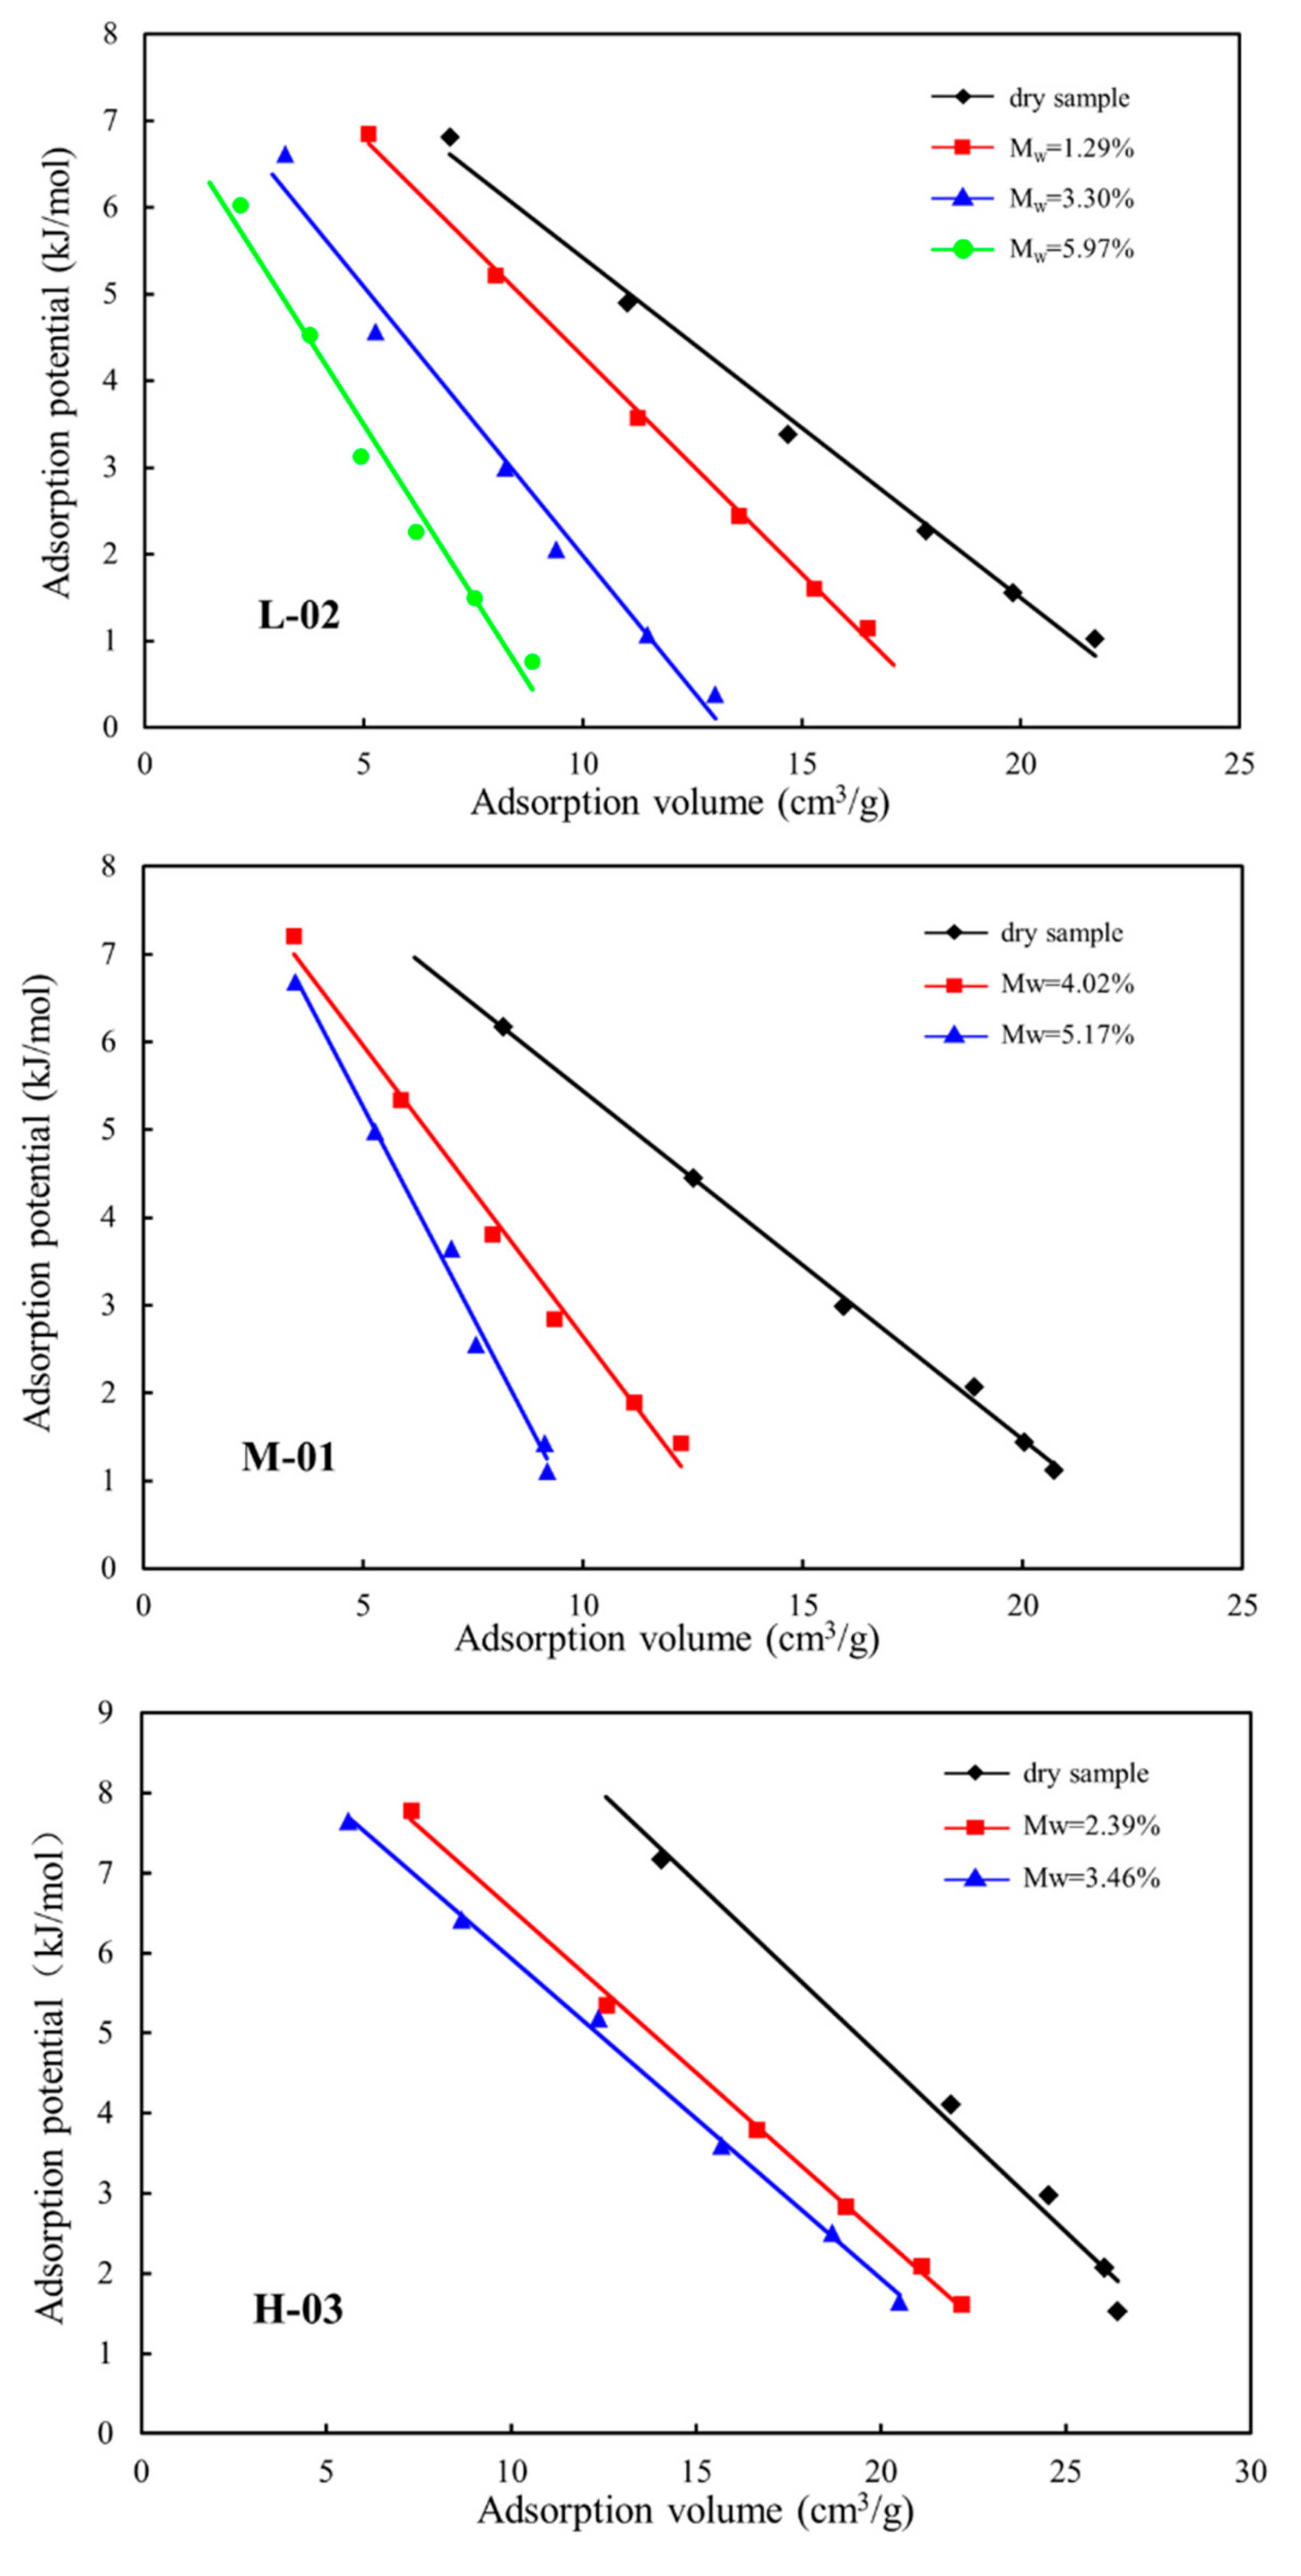
Figure 6 shows the adsorption potential of each coal sample gradually decreases with the increase of the adsorption amount of methane on the coal, showing a significant negative correlation, which is because the cumulative adsorption amount of methane molecules on coal increases as the adsorption time prolongs. The more the cumulative adsorption of methane molecules on coal, the less effective are then adsorption sites on the coal matrix. As a result, the gravitational force of the coal matrix to the methane molecules reduces, the adsorption capacity weakens, and the adsorption potential energy lowers. In addition, for the coals of all rank, as the moisture content in coal increases, the adsorption potential has a tendency to decrease when the adsorption amount of methane is the same. The smaller the adsorption potential of the coal, the greater the pressure required to adsorb the same volume of methane. Previous studies have shown that at the same temperature, the adsorption potential of water molecules is higher than methane molecules [33].
Therefore, the coal matrix is more attractive to water molecules than to methane molecules, which makes it easier for water molecules to adsorb on the surface of the coal matrix, occupying some effective adsorption sites, so that due to the gravitational reduction of the coal matrix to methane molecules, the adsorption potential and adsorption amount reduce. These interesting phenomena should explain the reason why the adsorption amount of methane on coal gradually decreases with the increase of moisture content from the perspective of adsorption potential energy.
3.2.2. Pore Structure
Coal is a kind of heterogeneous microporous material with a high surface area, whose pore size spans from as small as less than 1 nm to as large as several hundred nanometers of plant cell pores [34]. The pore surface of coal has a strong adsorption force on gas, and the amount of gas stored in the coal seam depends on the volume and surface area of pores [35,36].
Based on the study of the pore-fracture system of coal, the researchers have classified the pore-fracture system. Among them, the most widely used classification methods in the field of CBM have two kinds as follows: the first aperture classification scheme was proposed by IUPAC [37] in 1972, which divides pores into micropores (<2 nm), mesopores (2~50 nm) and macropores (>50 nm). The other is developed by the Hodot [38] in 1966, which divides pores into micropores (<10 nm), small pores (10~100 nm), mesopores (100~1000 nm) and macropores (>1000 nm). Herein, the Hodot’s pore classification method is adopted.
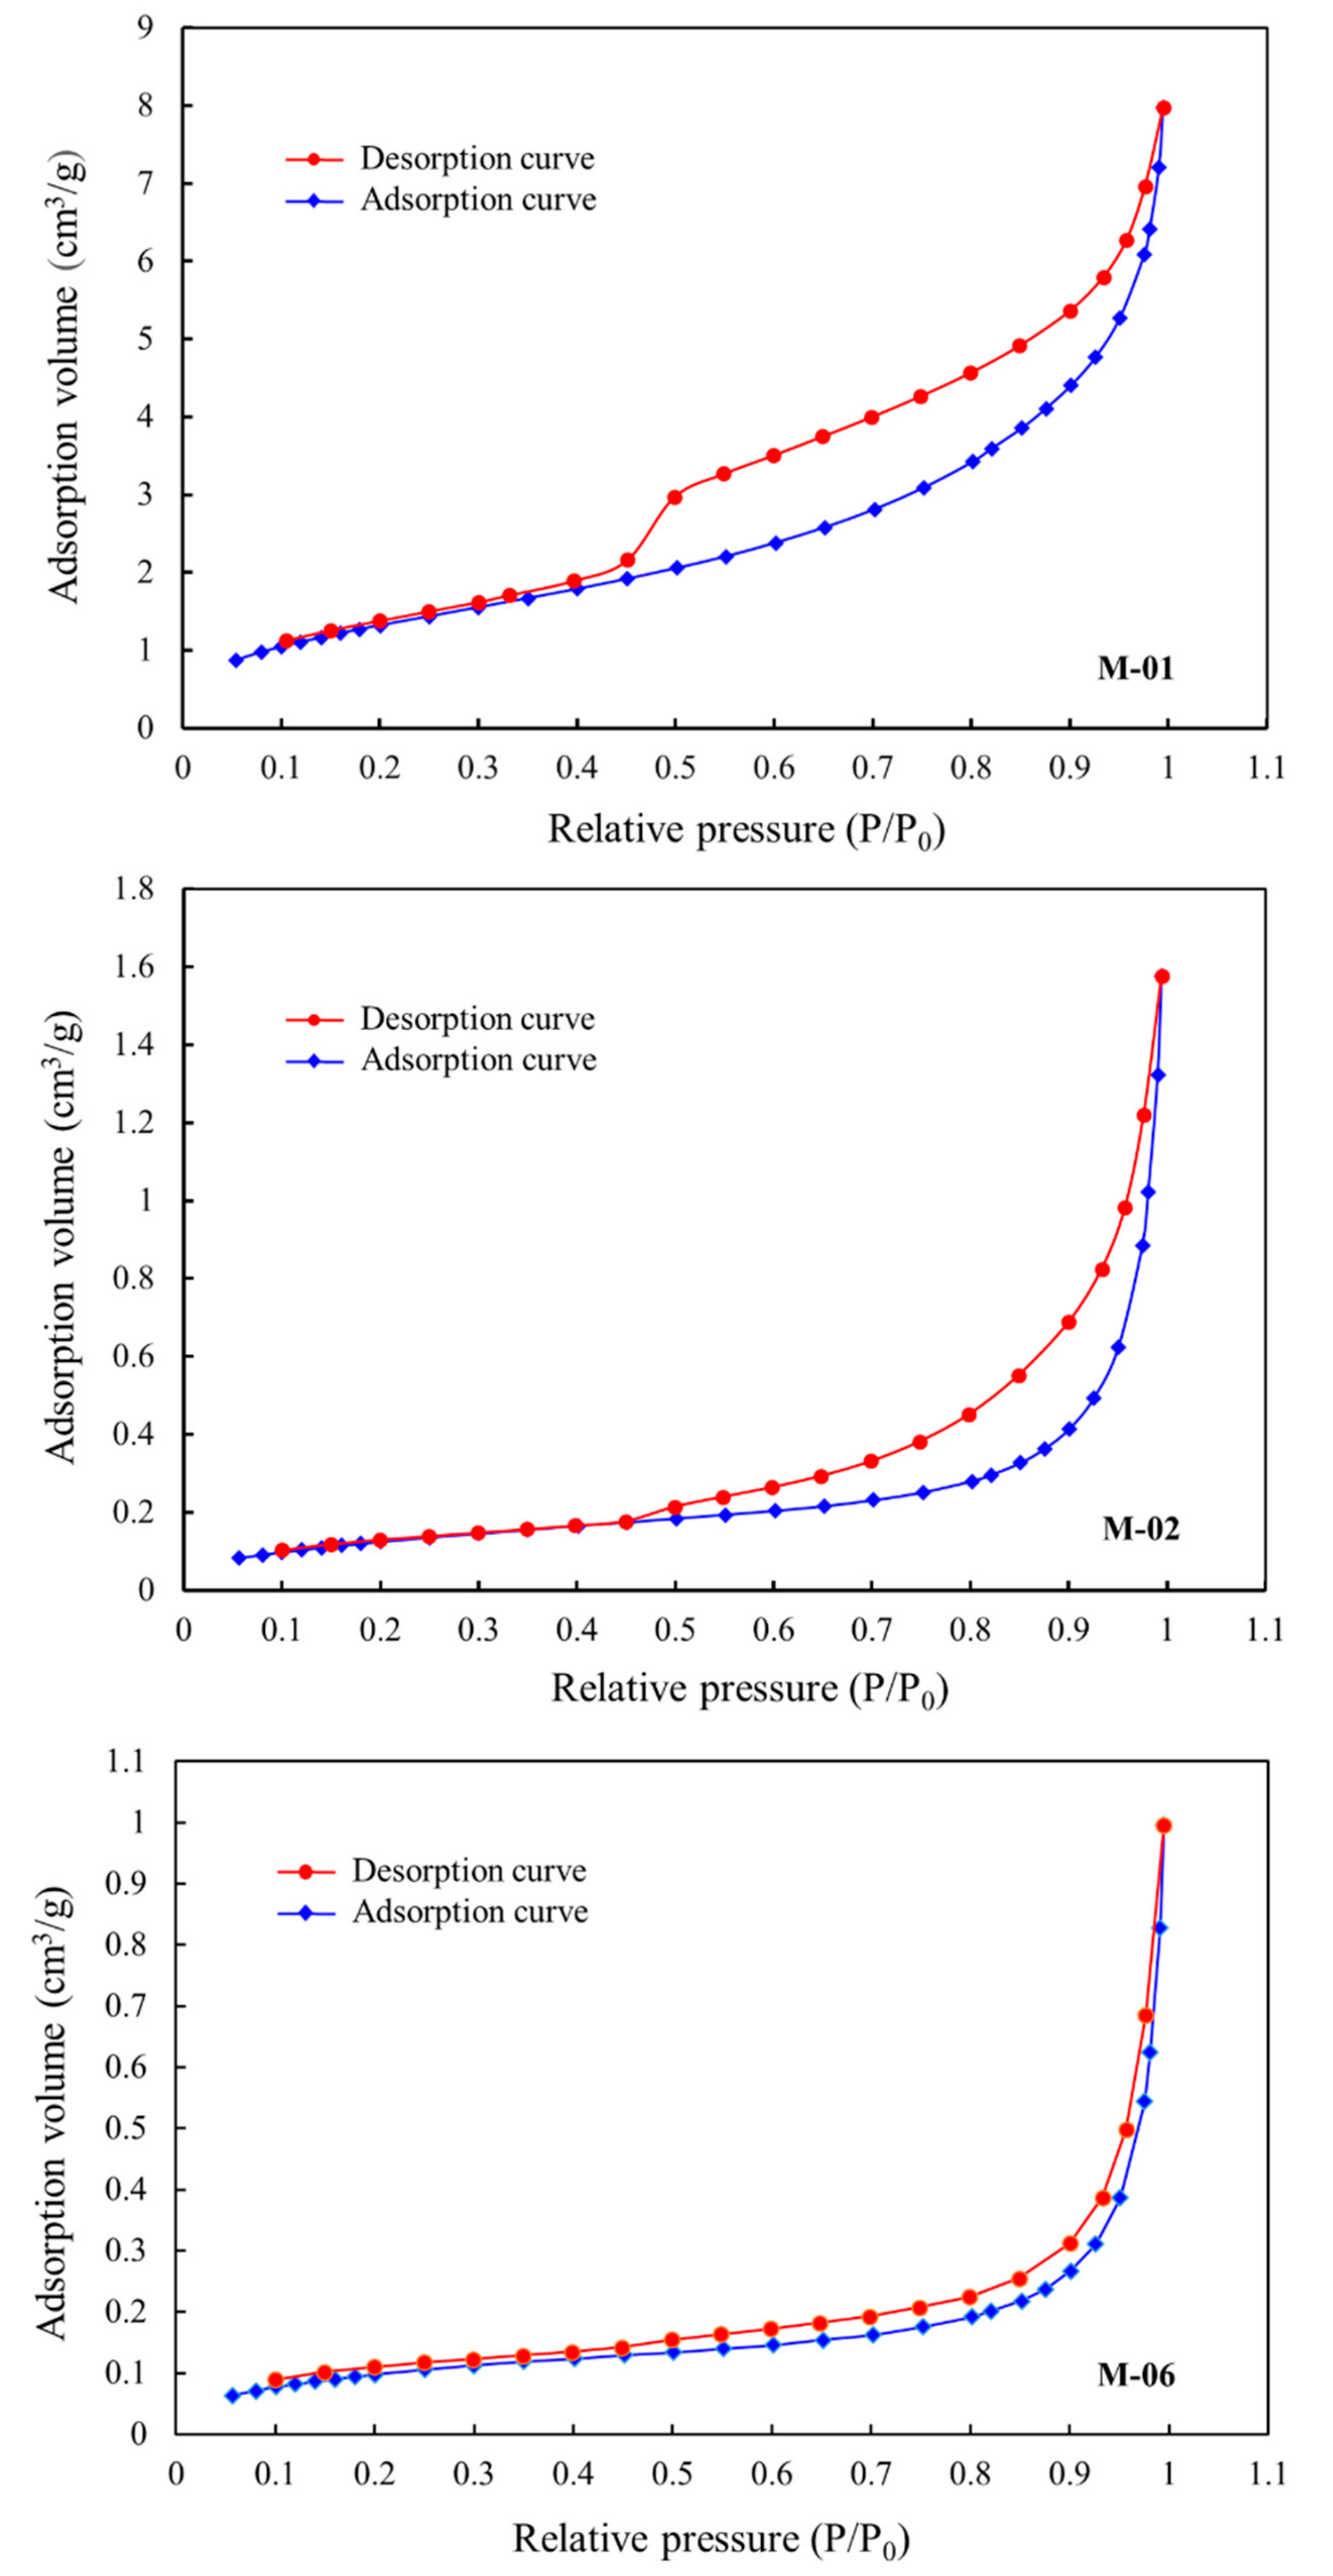
The experimental principle of low-temperature N2 adsorption/desorption conforms to the theory of the adsorption and cohesion of pore materials. Therefore, the morphology of pores in coal can be judged according to the liquid nitrogen adsorption and desorption curves of coal. [23]. In this work, low-temperature N2 adsorption/desorption were performed on M-01, M-02 and M-06 coals (Figure 7). The results show that the low-temperature N2 adsorption curves of M-01 and M-02 samples increase steadily, and the rising speed increased in the second half. The desorption curves of M-01 have a significant hysteresis loop, and appear as a sharp drop when the relative pressure is 0.5. The characteristic of this kind of curve represents that the pore morphology is usually a “necked flask” type capillary. The hysteresis loop of the M-02 is smaller, and the falling rate of the curve during desorption is slow, and finally it coincides with the adsorption curve. This kind of curve represents that the pore morphology is a “cylindrical” type capillary. The hysteresis loop of the M-06 is weak, which shows that the shape is mainly a parallel plate and a pointed shaped hole with good permeability.
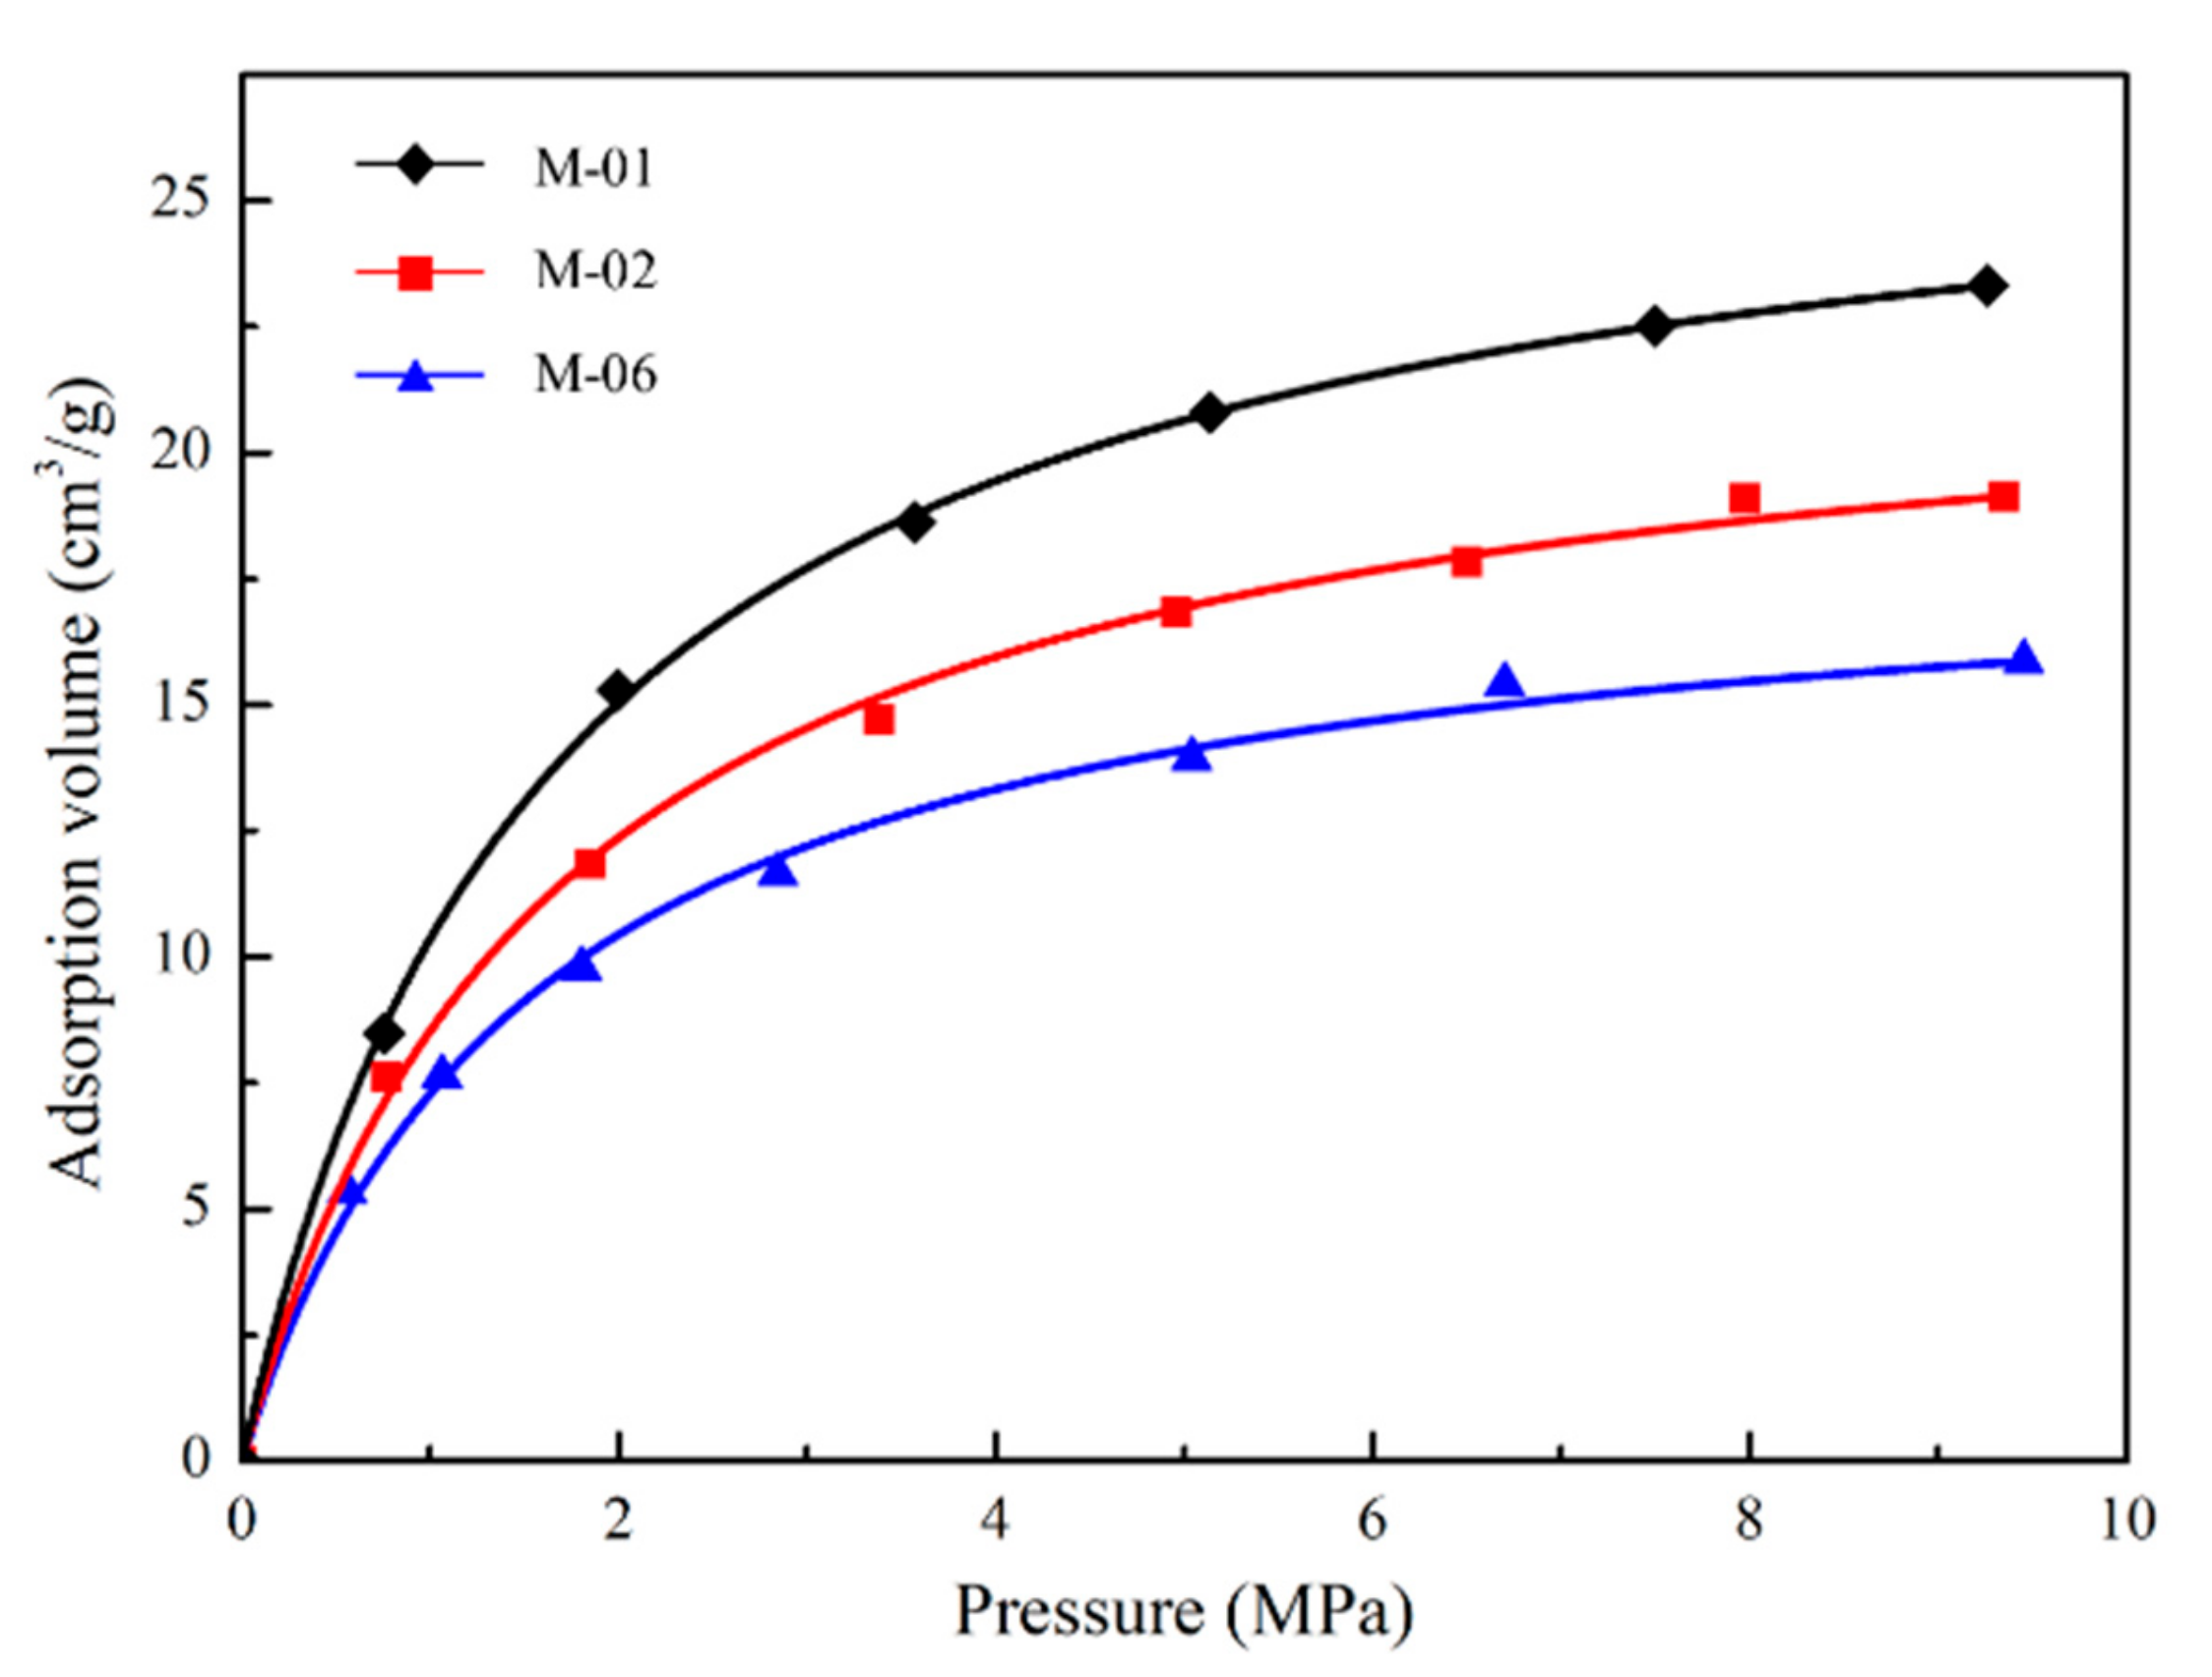
The isothermal adsorption curves of samples show that the maximum adsorption capacity of coal is M-01 > M-02 > M-06 (Figure 8). The BJH surface area, BET surface area, BJH pore volume and BET average pore diameter of selected coals are shown in Table 2.
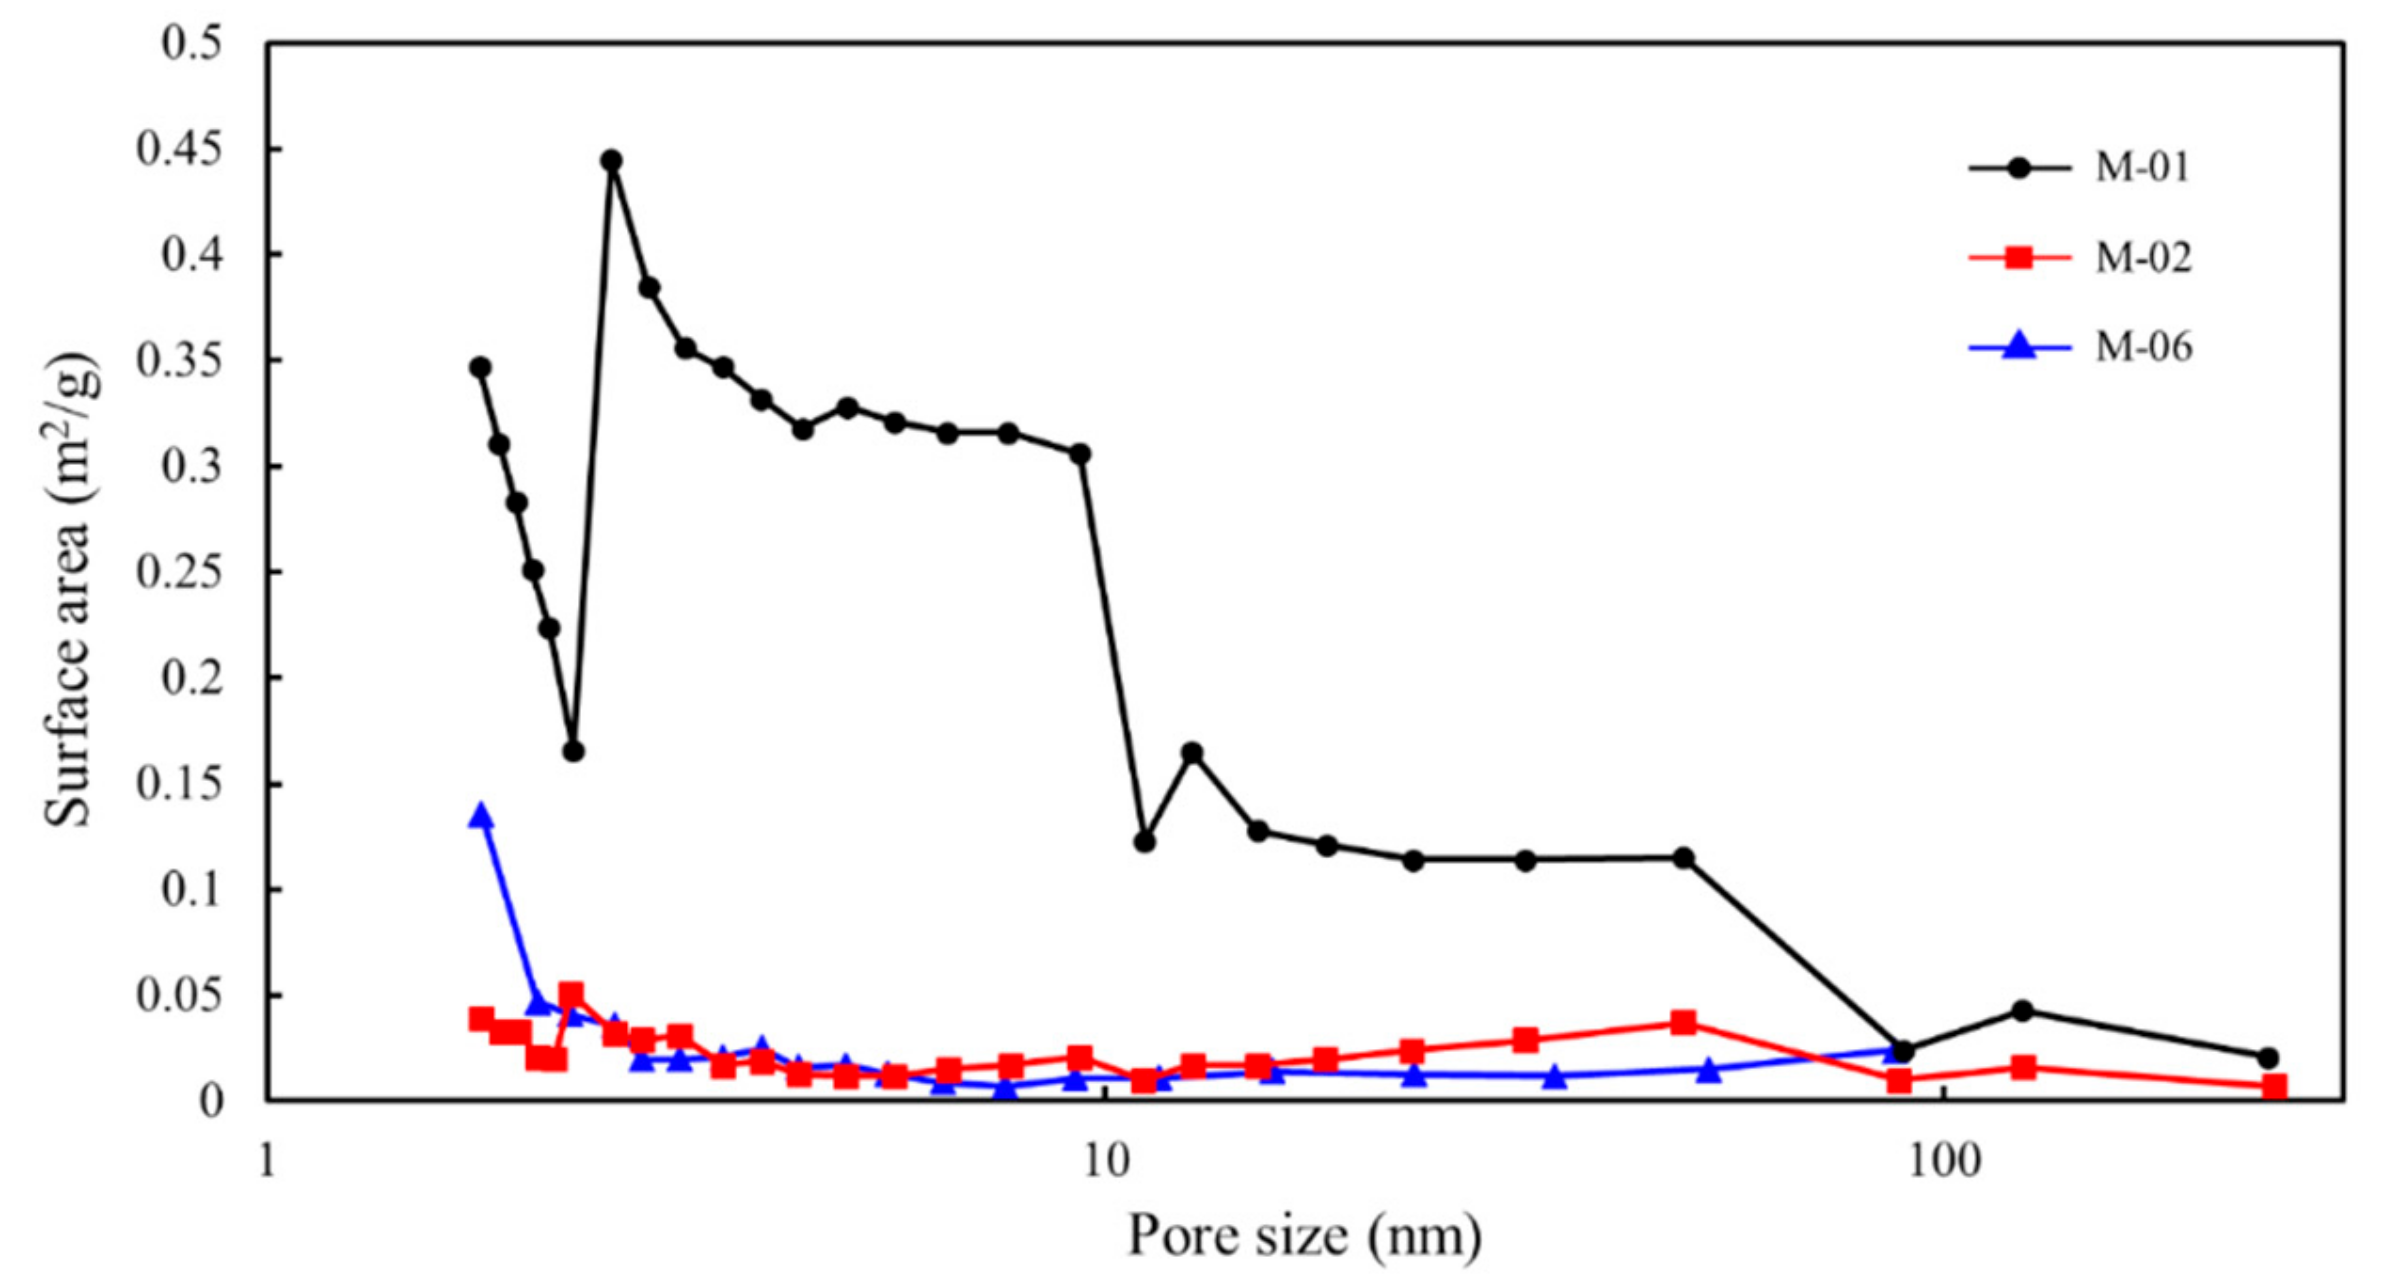
Combined with the VL of coal, VL has a positive correlation with the pore surface area and pore volume [39], that is, VL improves as the pore surface area and pore volume increase. The pore surface area of coals with different pore sizes is shown in Figure 9, which is known that the contribution of micropores to the surface area of coal is the most important [40]. The larger the ratio of the surface area of micropores to the surface area of total pores, the larger the maximum adsorption amount of coals. The reason is that the micropores plays a crucial role in the isothermal adsorption process [41]. Compared with other size pores, methane molecules preferentially adsorb on the surface of the micropores [6]. Moreover, the surface area of the micropores is larger, which causes that the methane molecules have more adsorption sites, resulting in that the amount of methane adsorbed on the coal matrix is larger. In short, the more micropores coals have, the greater becomes their ability to adsorb methane [13].
To evaluate the influence of the pore structure on the adsorption potential, the adsorption potential is calculated by the equal volume method. Additionally, the adsorption potentials of coals are shown in Table 3 when the adsorption amount is 10 cm3/g, which exhibits the fact that, when the adsorption amount is the same, the order of the adsorption potential of coals is M-01 > M-02 > M-06, which is the same as the sequence of the microporous surface area. This result indicates that the pore size has a significant influence on the value of the adsorption potential; that is, the more of micropores, the larger the specific surface area of the pores, and the larger the adsorption potential.
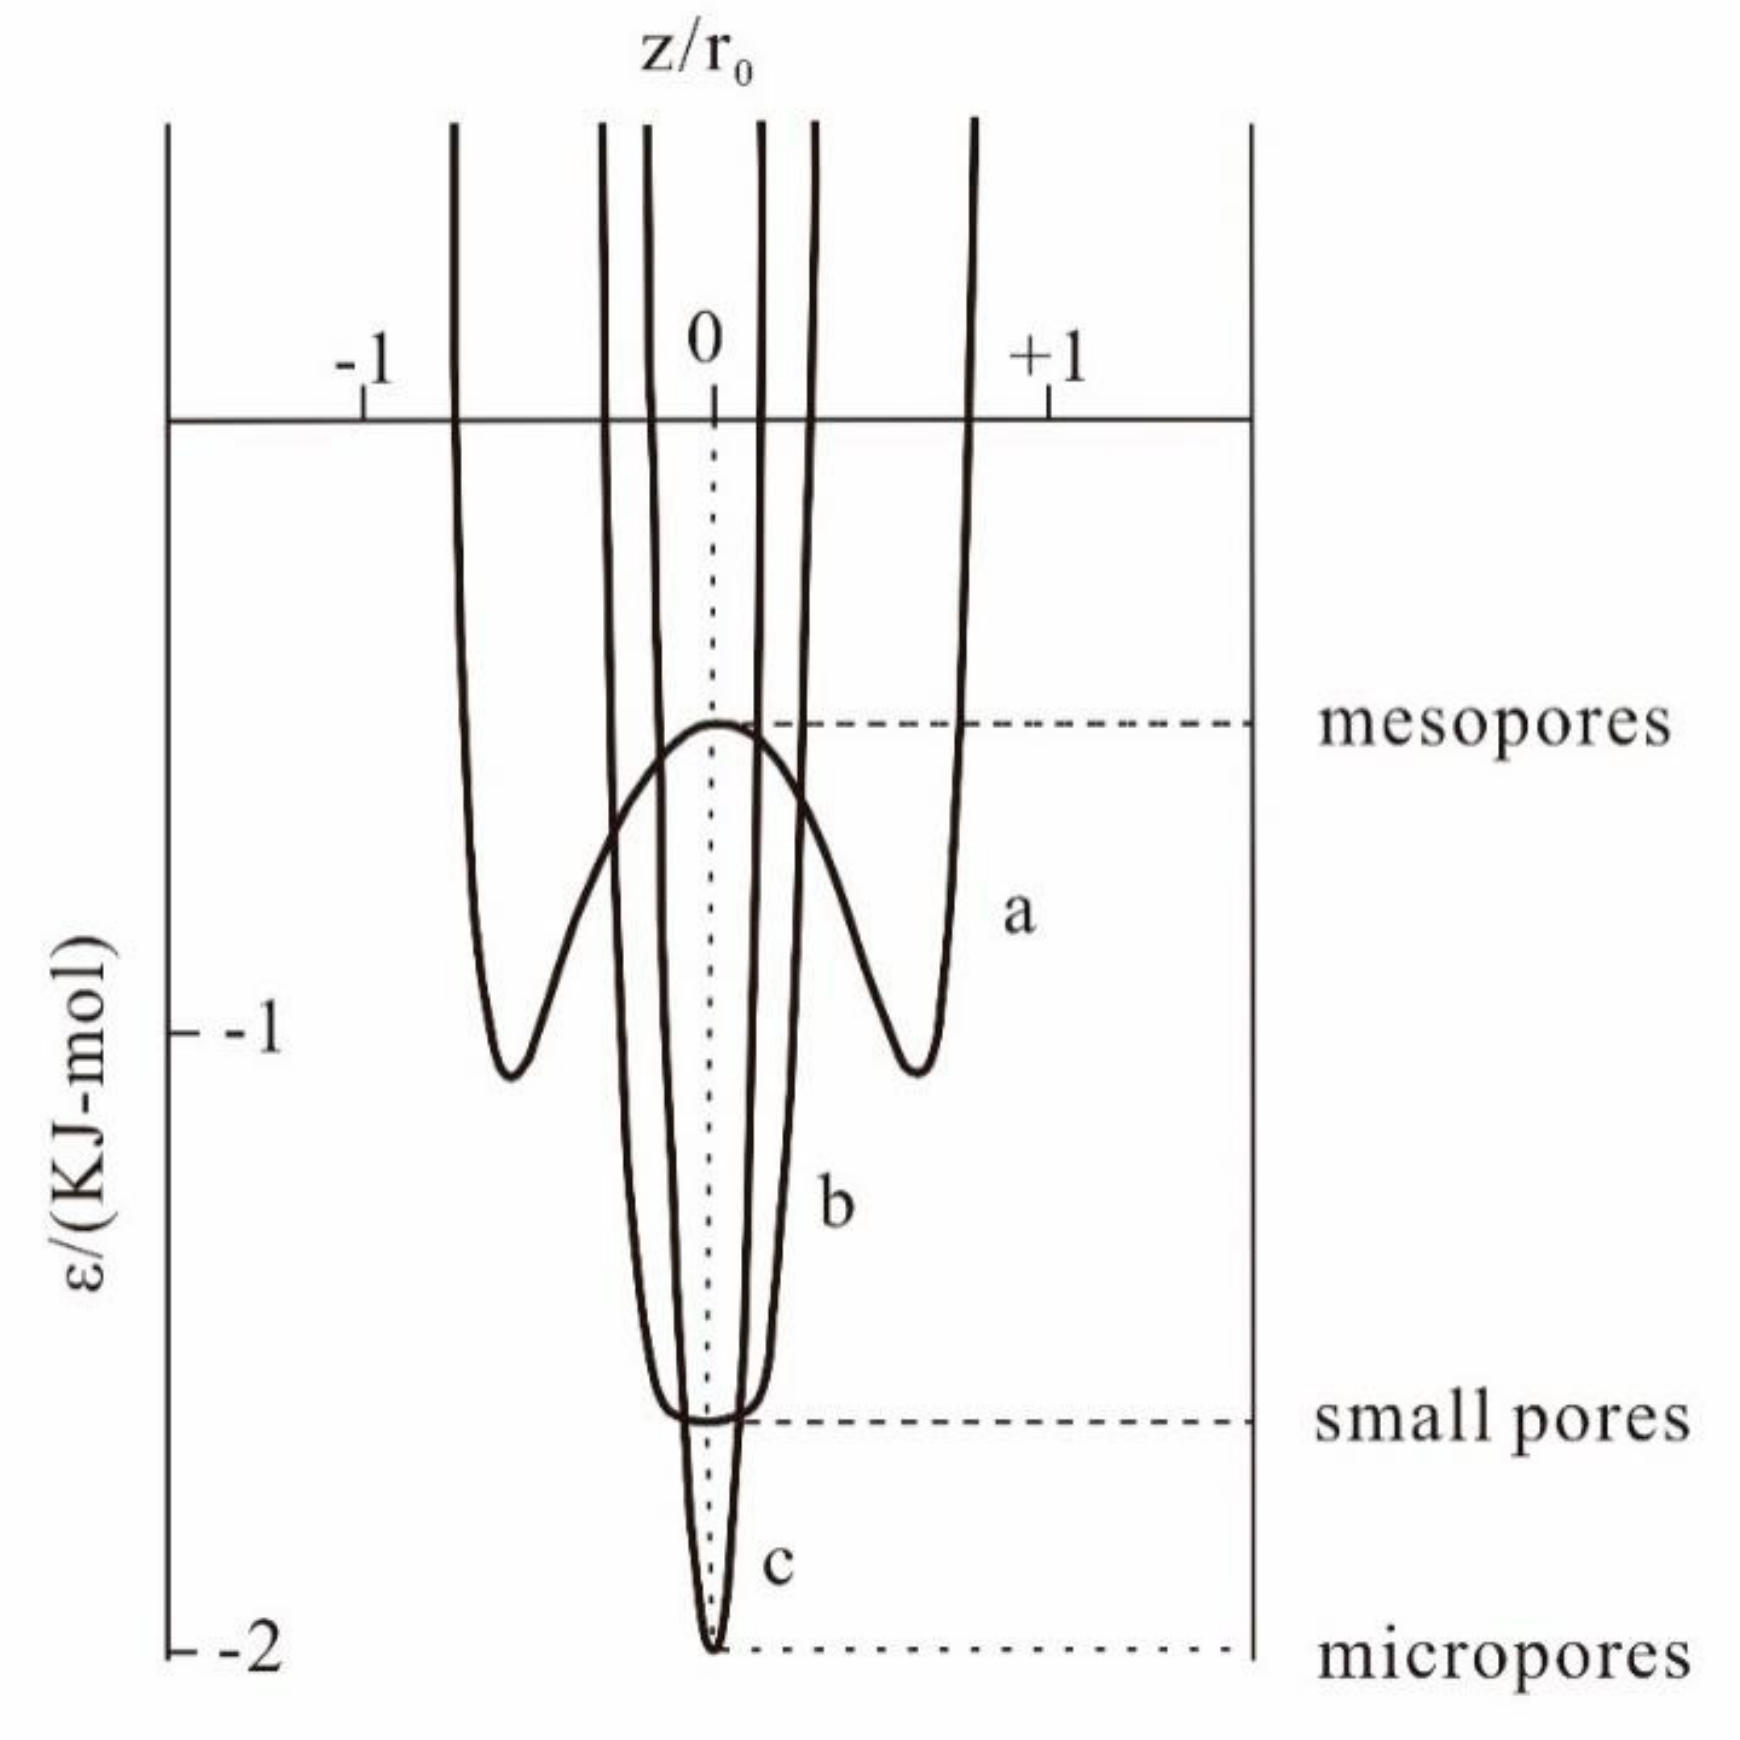
Everett et al. [42] found that in the case of a molecule between two parallel monolayer planes, when the distance between the two planes is large, the plane has a small adsorption potential, and two extreme values appear. As the distance between the two planes gradually decreases, the adsorption potential gradually increases, and becomes only one peak (Figure 10). By introducing the theory to understand the influence of the pore structure on the methane adsorption of coal, when the area is small enough, the corresponding sidewalls of the pores can be regarded as two parallel, single-layer planes. When the pore size is large, that is, the distance between the pore walls is large, the molecule has a small adsorption potential and two peaks appear, and the molecules are less attracted by gravity. As the pore size decreases, the distance between the walls of the pores decreases, and the adsorption potential gradually increases until there is only one peak [43]. Besides, the curvature of the solid surface has a positive correlation with the strength of the force field. The smaller the pore, that is, the greater the curvature, the stronger the force fields between the pore walls, the larger the adsorption potential of the coal matrix surface, resulting in the greater adsorption capacity.
3.2.3. Coal Metamorphism
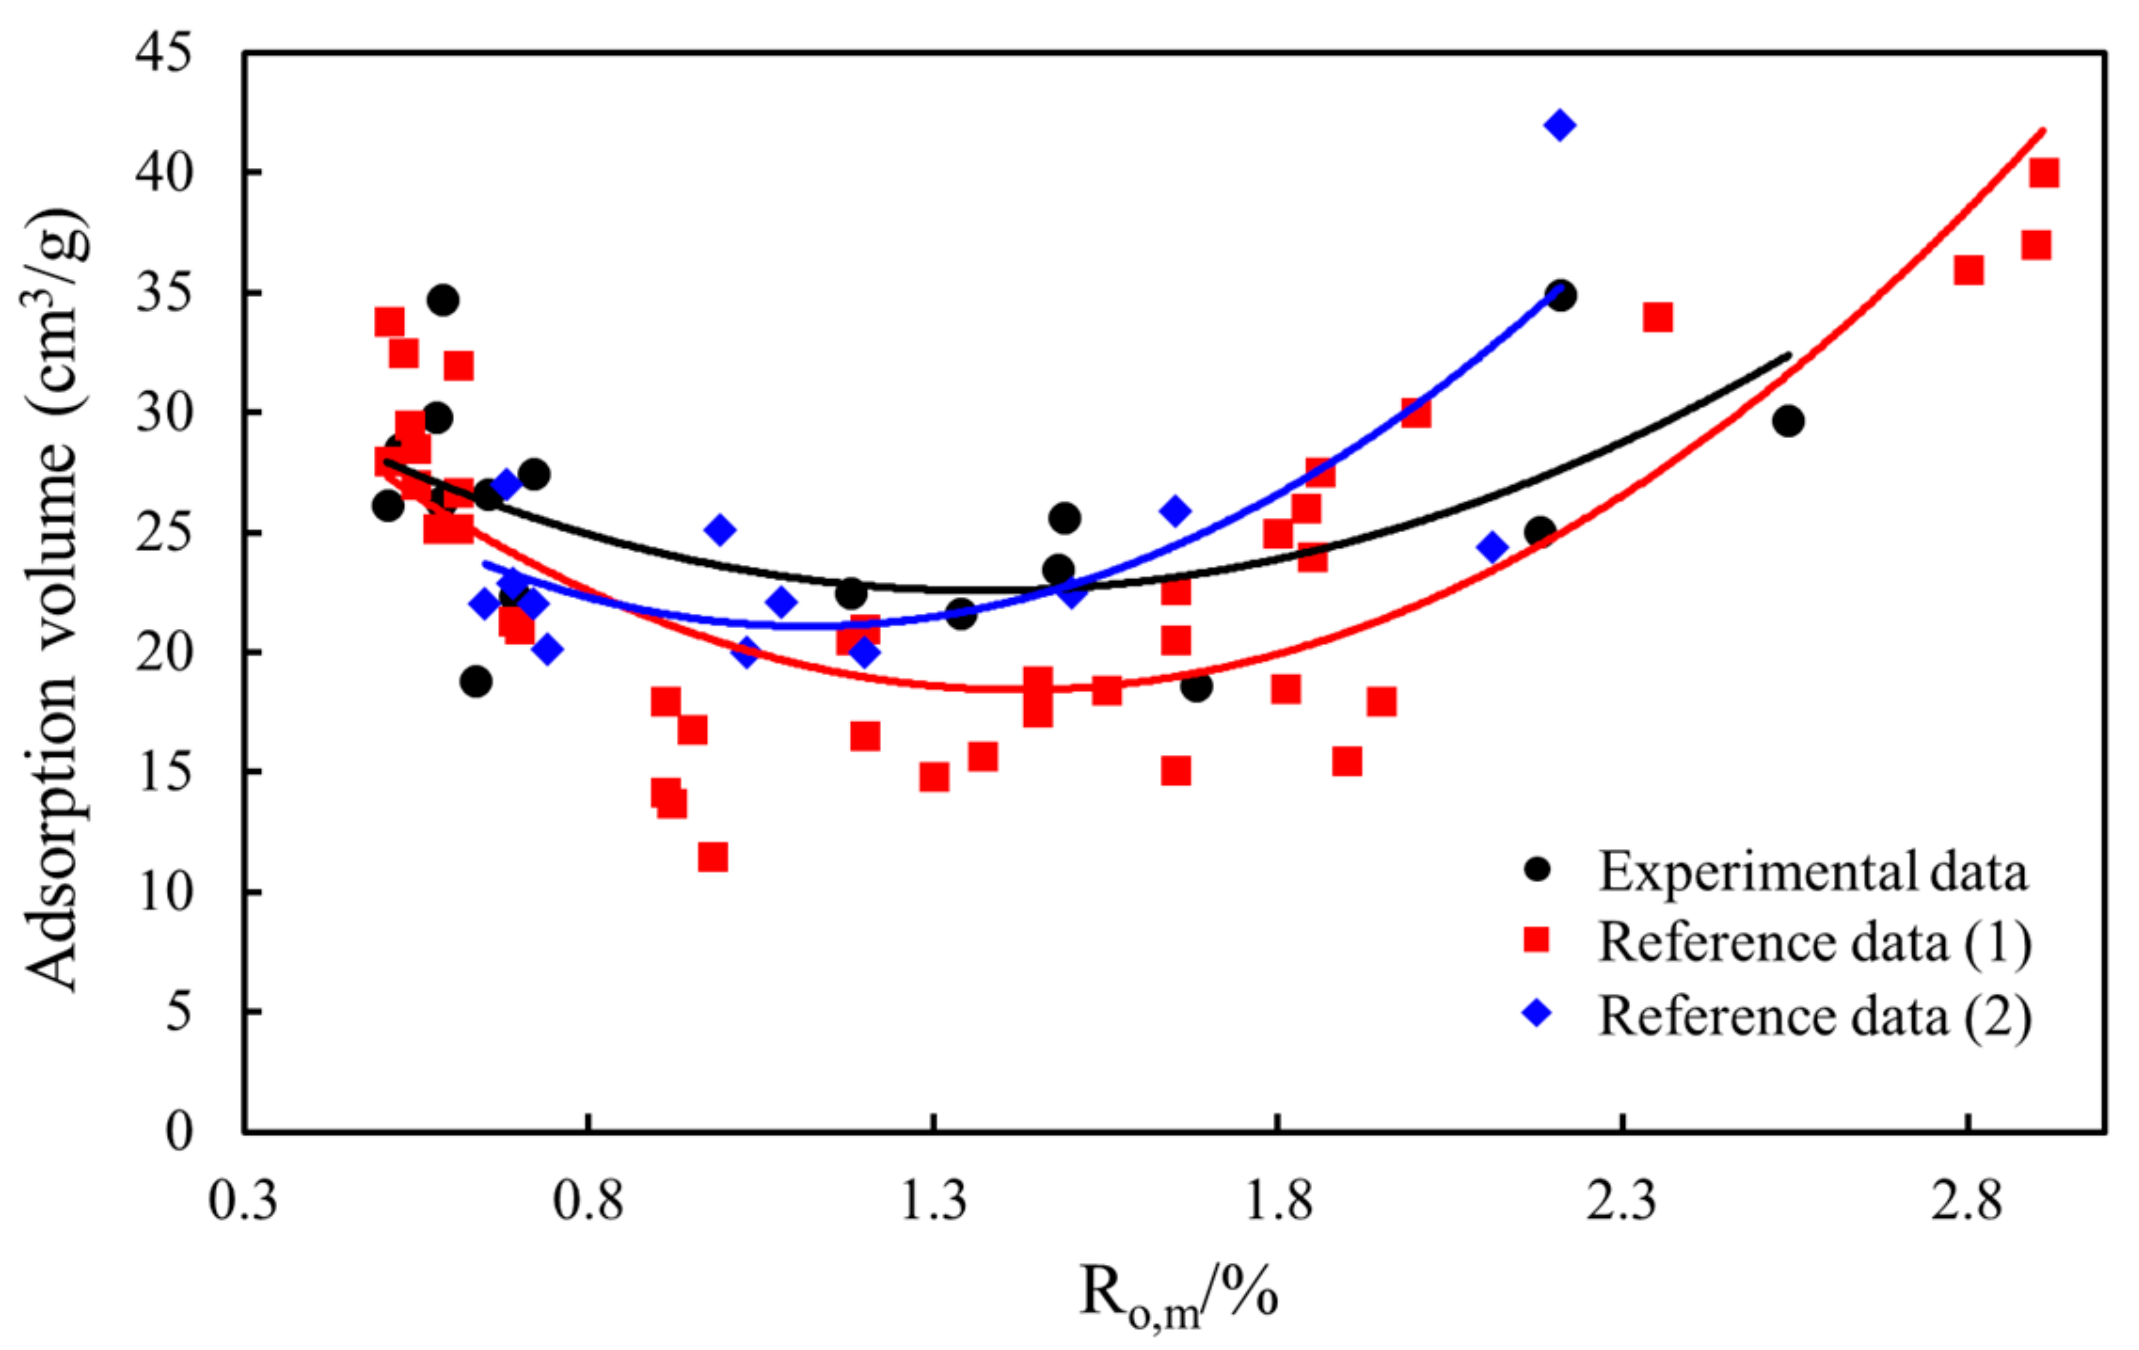
Previous researches have shown that the coal rank may have an important role among the factors affecting the adsorption capacity of coal [44,45]. Zhong et al. [46] have carried out isothermal adsorption experiments on coal from different regions of China, and found that when Ro = 0.5%–1.2%, the adsorption capacity of dry coal samples decreased with the increase of coal rank, while the adsorption capacity increases with the increase of coal rank when Ro = 1.2%–4%. Experimental studies of the isothermal adsorption on coal from the Silesian Basin by Skoczylas [47], and Godyń [48] show that the adsorption capacity of samples shows a U-shape change with the increase of coal rank. The dry coal selected in this work shows the same trend as the previous research with the change of coal rank [46]. In the range of Ro,m = 0.5%–1.38%, with the rise of the coal rank, the VL of the samples is decreasing. When Ro,m > 1.38%, the VL of samples increases with the increase of coal rank (Figure 11).
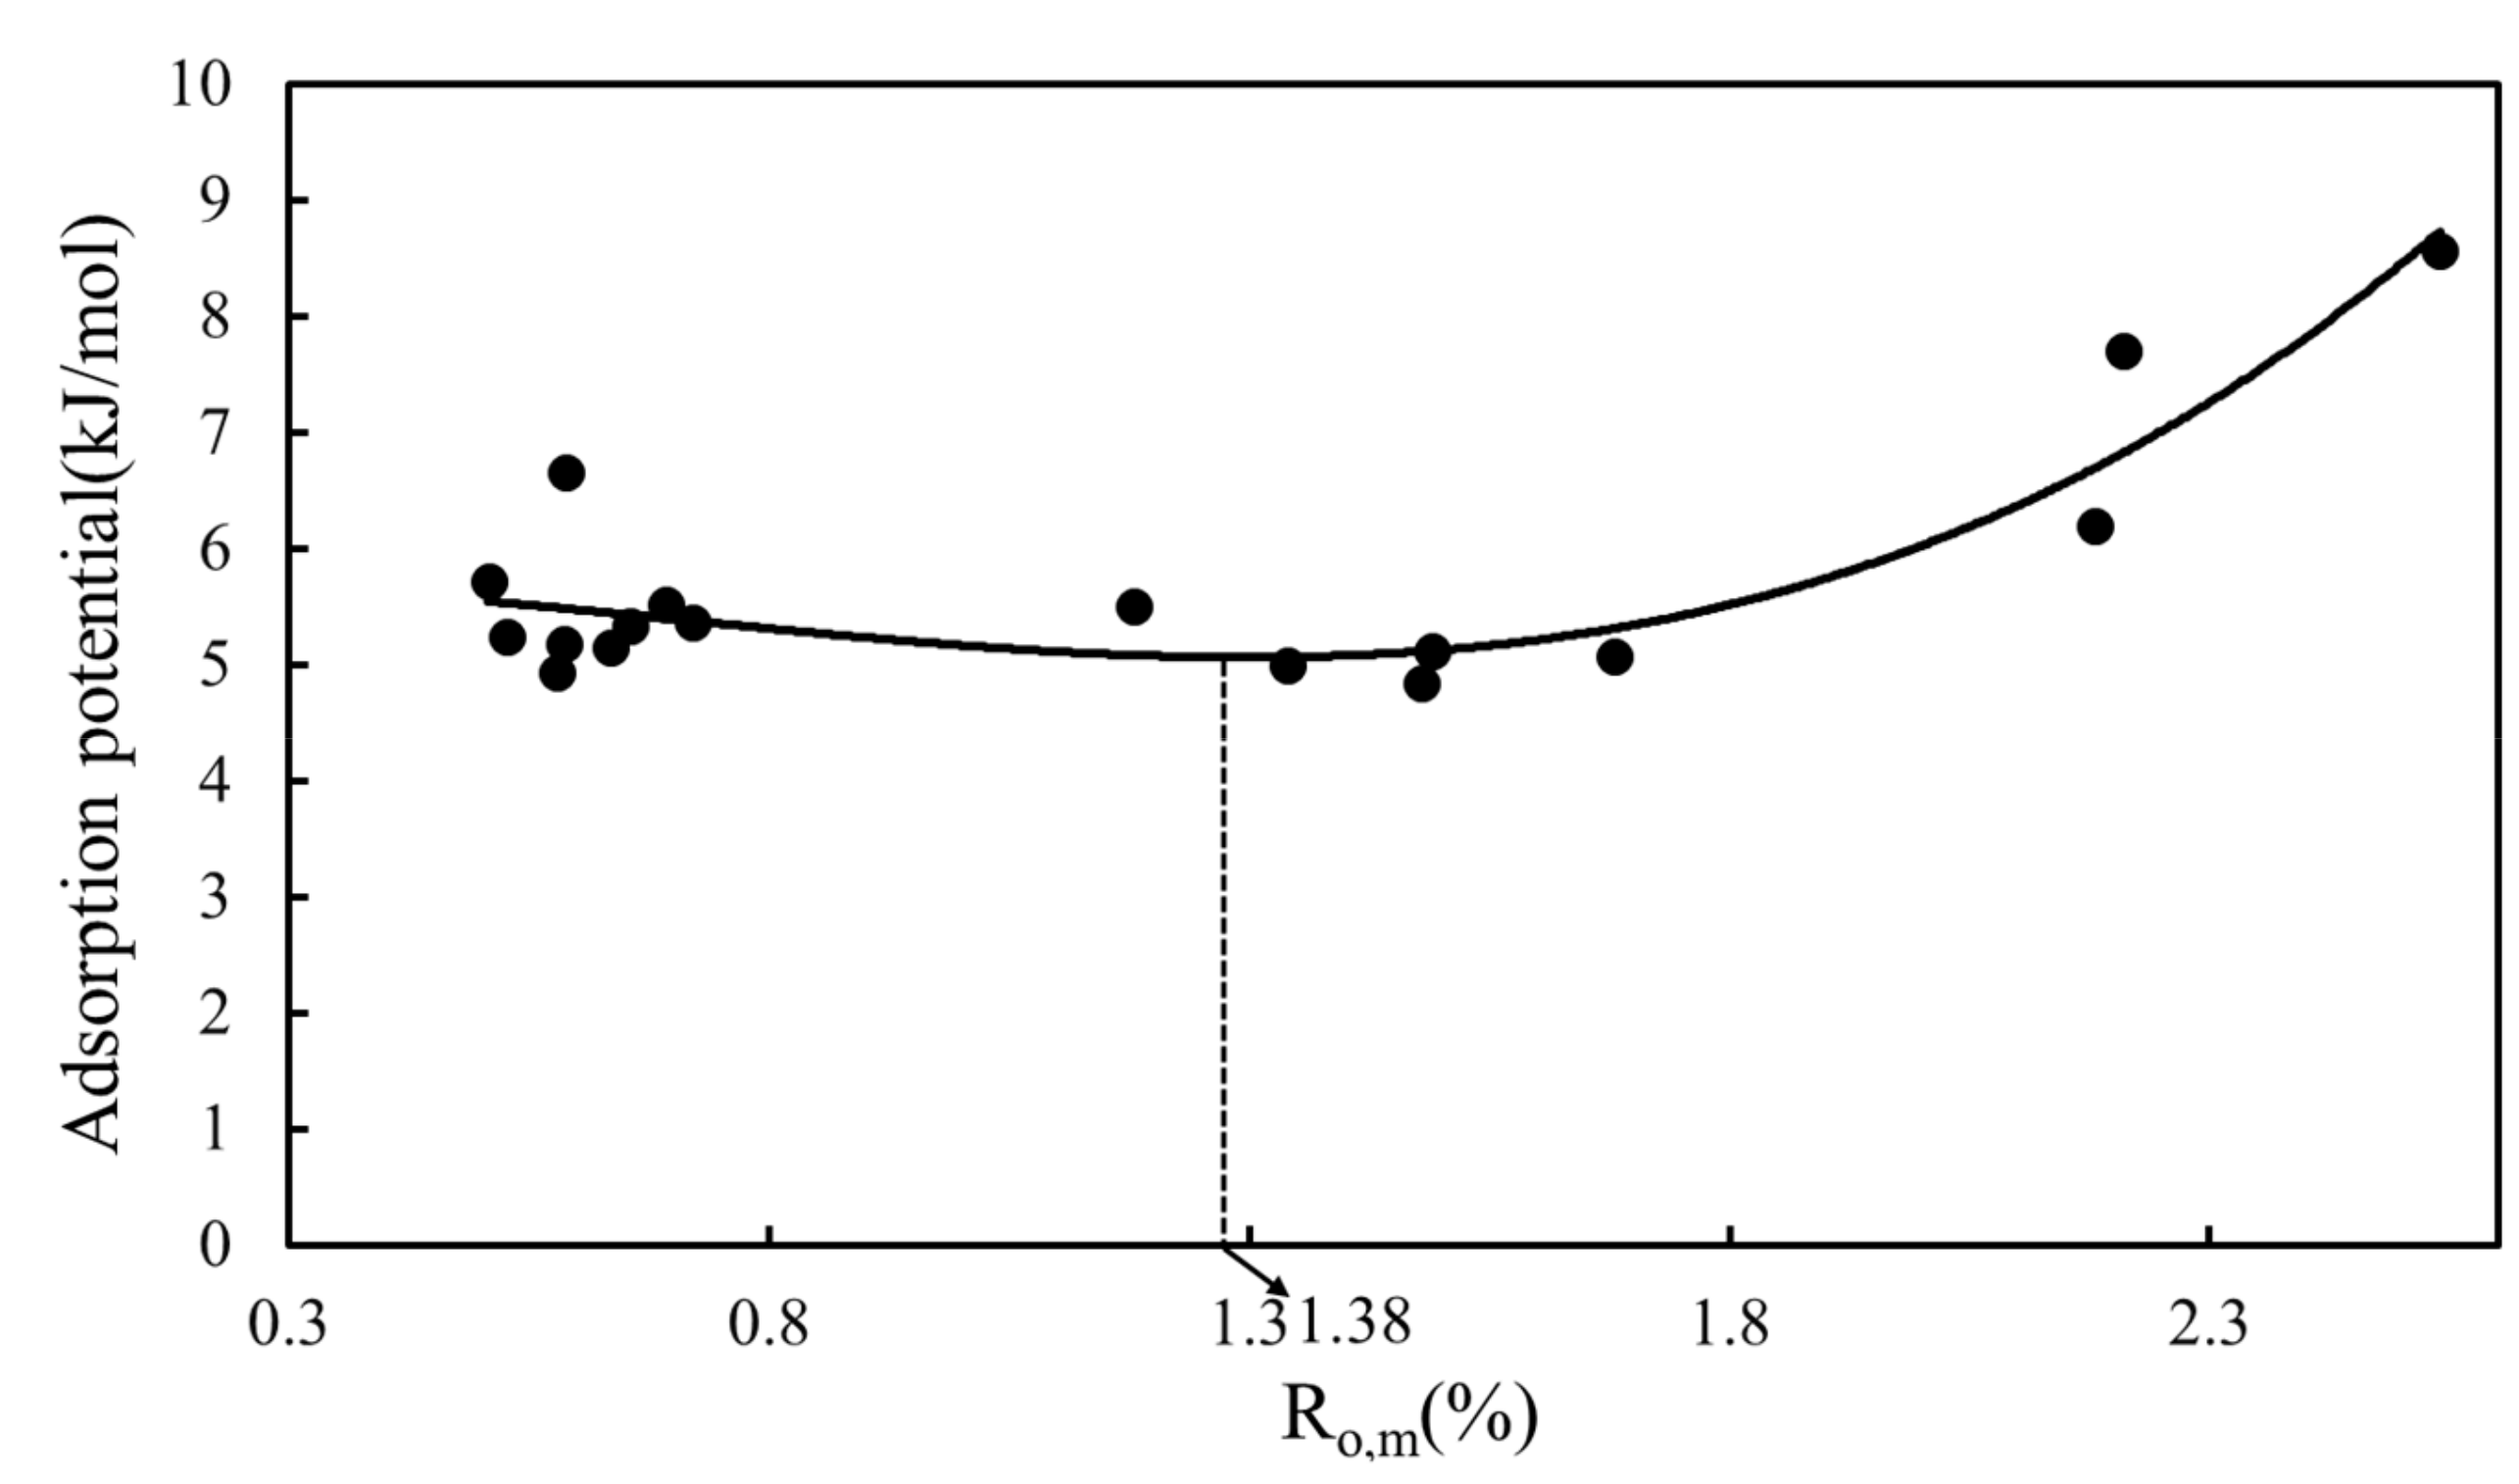
When Ro,m = 0.5%–1.38%, with the enhancement of coalification and mechanical compaction, the oxygen-containing functional groups in coal gradually fall off, and the number of micropores and the specific surface area of coal gradually decrease, resulting in a decrease in the adsorption capacity of coal. When Ro,m > 1.38%, the adsorption capacity of coal in this stage is mainly affected by the molecular structure of coal. With the increase of coalification degree, the molecular regularity is enhanced [49], the internal surface area is increased, the adsorption capacity is enhanced, and the maximum adsorption capacity is increased. In this work, the adsorption potential is calculated by the equal volume adsorption amount method and compared. That is, when the adsorption amount of methane is 10 cm3/g, the adsorption potential of each sample is calculated, and the relationship between the adsorption potential and the coal rank is plotted (Figure 12). When the adsorption amount is constant, as the adsorption potential is larger, the gravity will be larger, the adsorption capacity will be stronger, and the adsorption pressure required is smaller.
Figure 11 and Figure 12 clearly show that the adsorption capacity and adsorption potential have the same change trend to coal rank, and both of them decrease first, and then rise with the increase of the coal rank. The above clarifies that one of the key reasons for the change of gas adsorption capacity with coal rank is the pores (especially micropores) and the specific surface area change. In other words, the influence of coal rank on the adsorption potential is mainly achieved by changing the pore size and specific surface area. In addition, when the coalification increases, the change of coal structure also has a certain influence on the adsorption potential. For instance, the detachment of oxygen-containing functional groups and branches, and the enhancement of molecular regularity all increase the attraction of methane molecules on the surface of coal substrates, increasing the adsorption potential.
3.2.4. Coal Particle Sizes
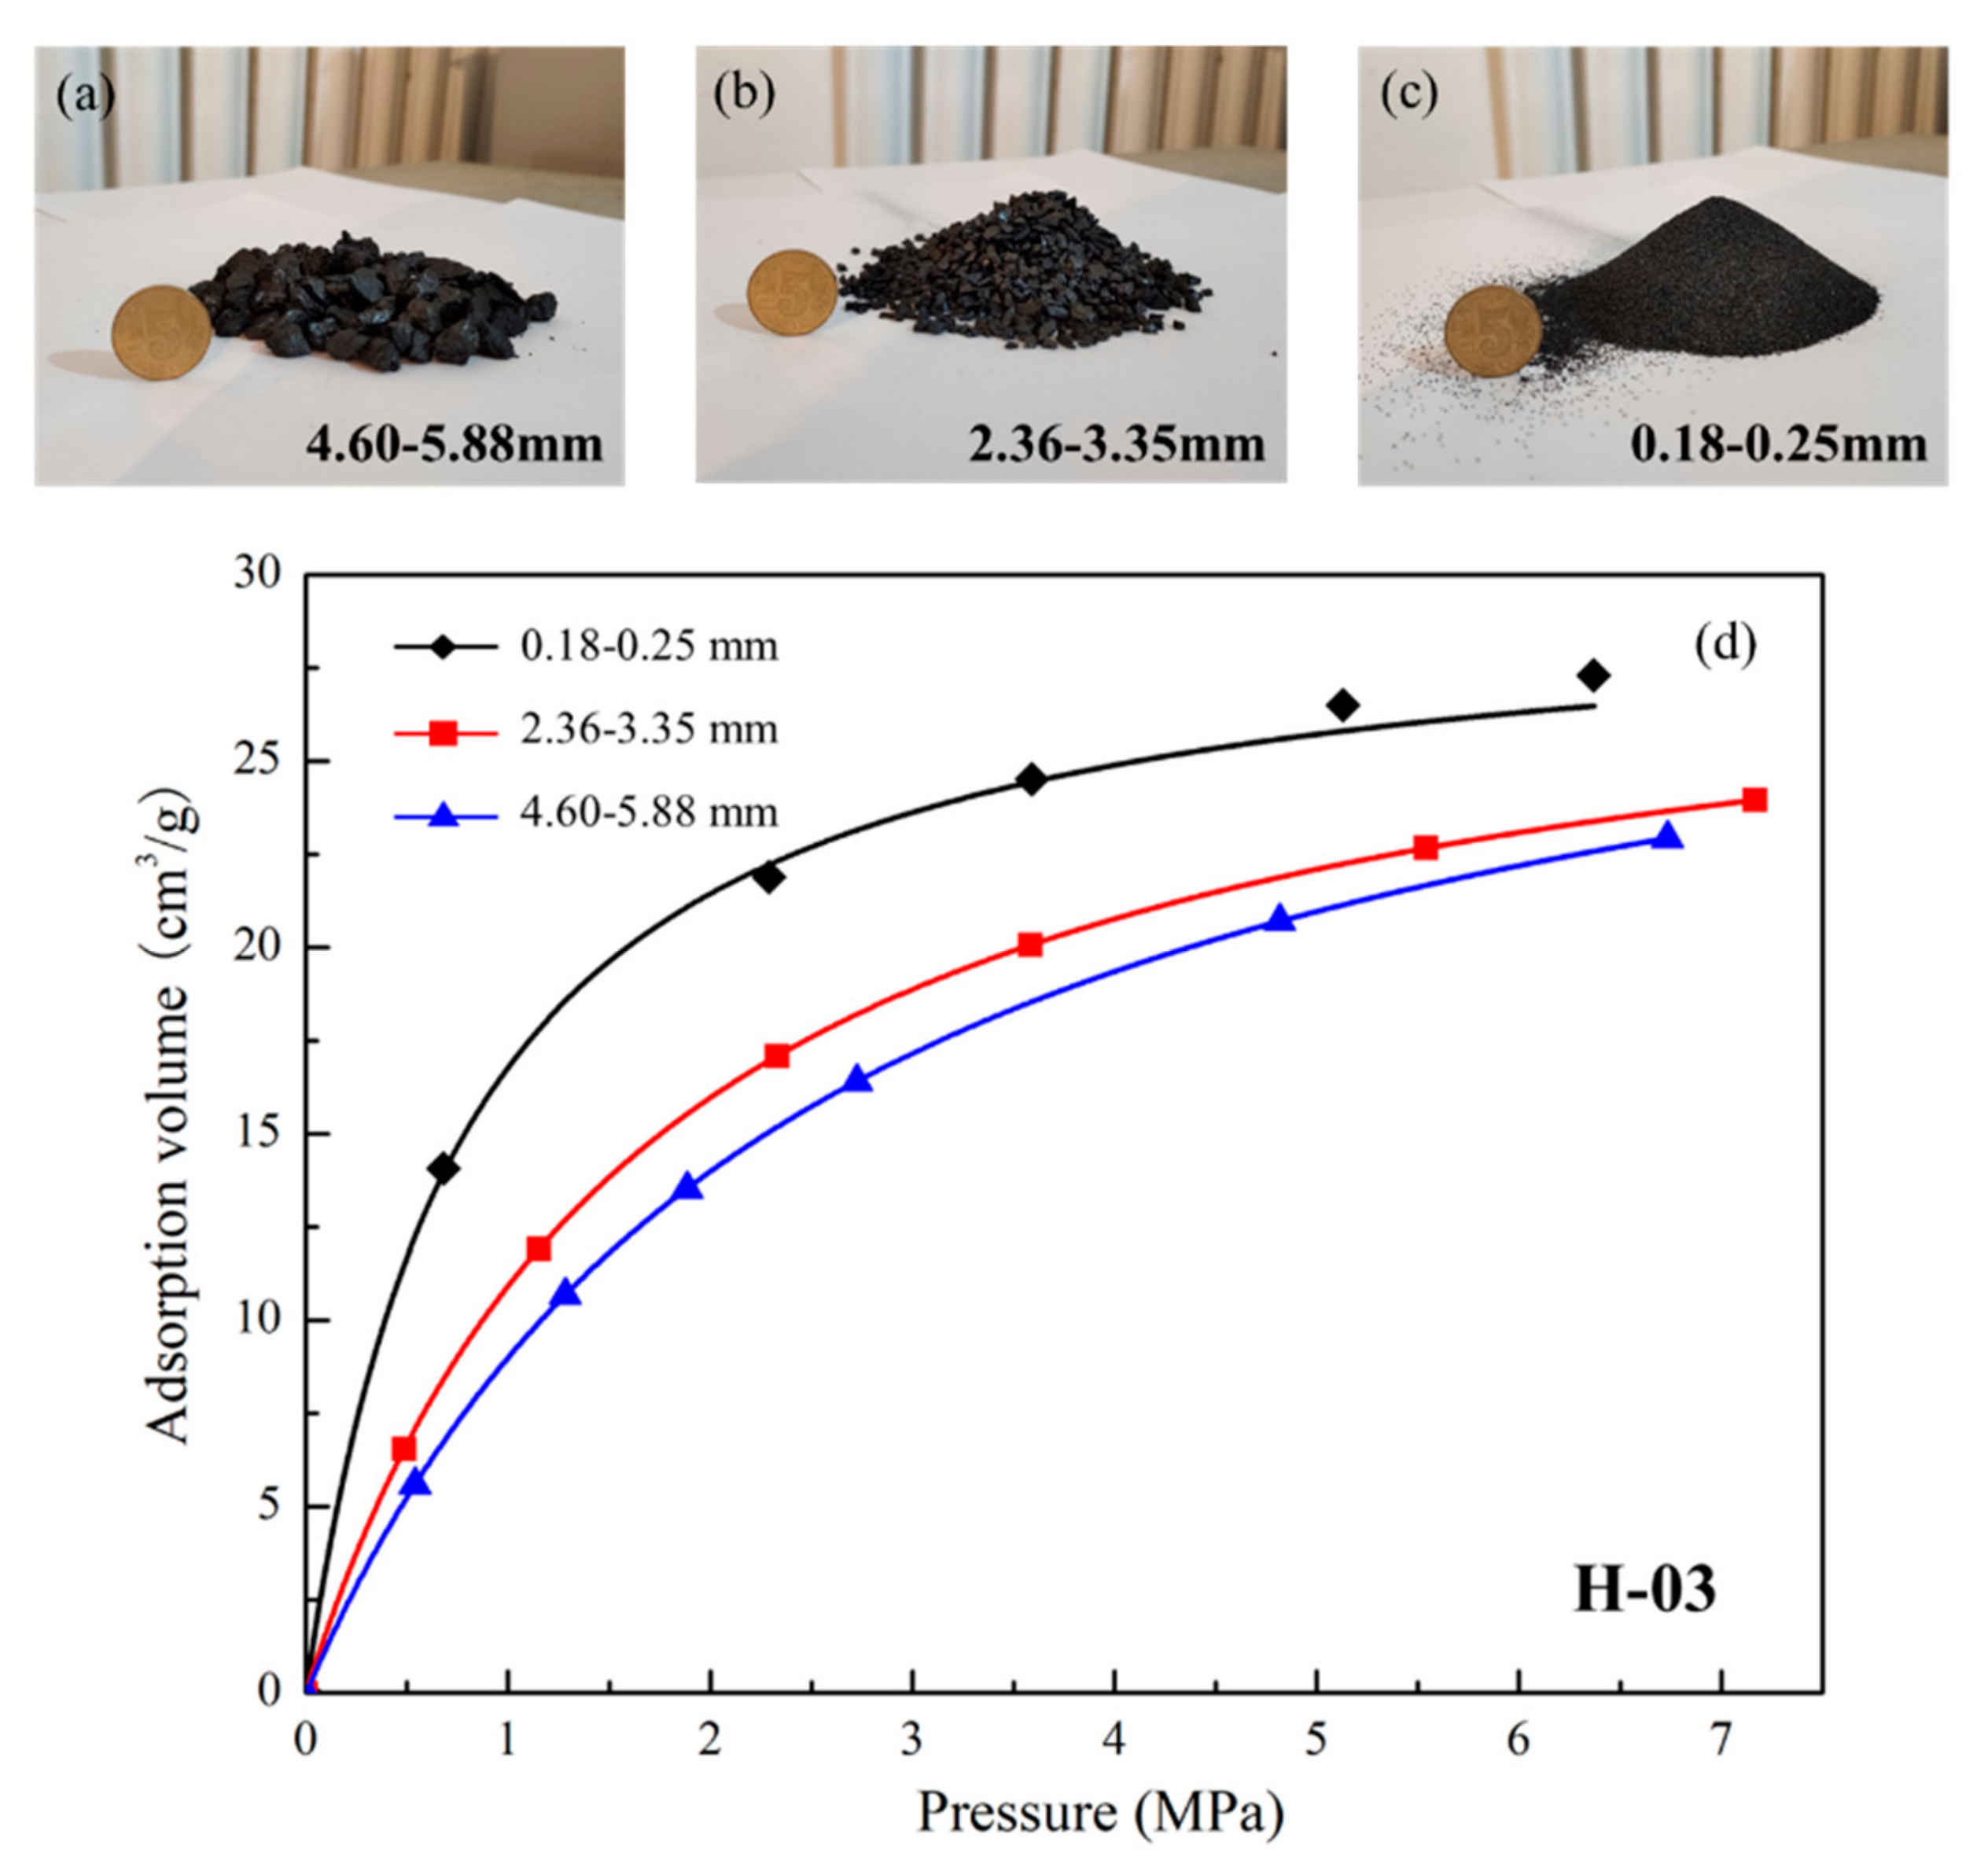
Ruppel et al. [50] used the low-temperature N2 adsorption method to test the specific surface area of different particle size coals belong to Pittsburgh and Pocahontas, and carried out isothermal experiments, showing that the difference in the particle size of the sample has no significant effect on the results of the isothermal adsorption experiments. Moffat et. al [51] also proved that the adsorption capacity of coal is independent of the particle size. This works, because the influence of coal particle size on specific surface area is weak, and the influence of coal rank on the adsorption ability is mainly achieved by changing the pore specific surface area. Therefore, any rank coal can be used to explain the effect of particle size on adsorption capacity. In this work, H-03 (high-rank coal) coal was selected, and the sample was ground to grain size (diameter), which was 0.18–0.25 mm (Figure 13a), 2.36–3.35 mm (Figure 13b) and 4.60–5.88 mm (Figure 13c). A series of isothermal adsorption experiments were carried out at the temperature of 303.15 K and a pressure range of 0–8 MPa. The isothermal adsorption curves obtained by Langmuir fitting are shown in Figure 13d.
Figure 13d shows that the isotherm adsorption curves of different particle size coals is similar to the curves of coal samples owning moisture content. The adsorption amount increases rapidly with the increase of adsorption pressure at first. After that, the growth trend becomes slow and tends to be stable. The Langmuir parameters are shown in Table 4.
The adsorption amount of methane on coals with different particle sizes increases slightly with the decrease of sample size, but the difference in VL is slight, and the equilibrium time between isothermal adsorption experiments of coals of different particle sizes is different. The larger the particle size, the longer it takes to equilibrate. This is because more time is needed for the gas to diffuse through the coal matrix and adsorb onto the surface [52]. In addition, the amount of adsorption of methane decreases as the particle size of the coal increases when the adsorption pressure is constant. This is because the smaller the particle size of the coal, the greater the degree of fragmentation, and some pores that methane molecules cannot enter are destroyed, and the rate of adsorption equilibrium is faster.
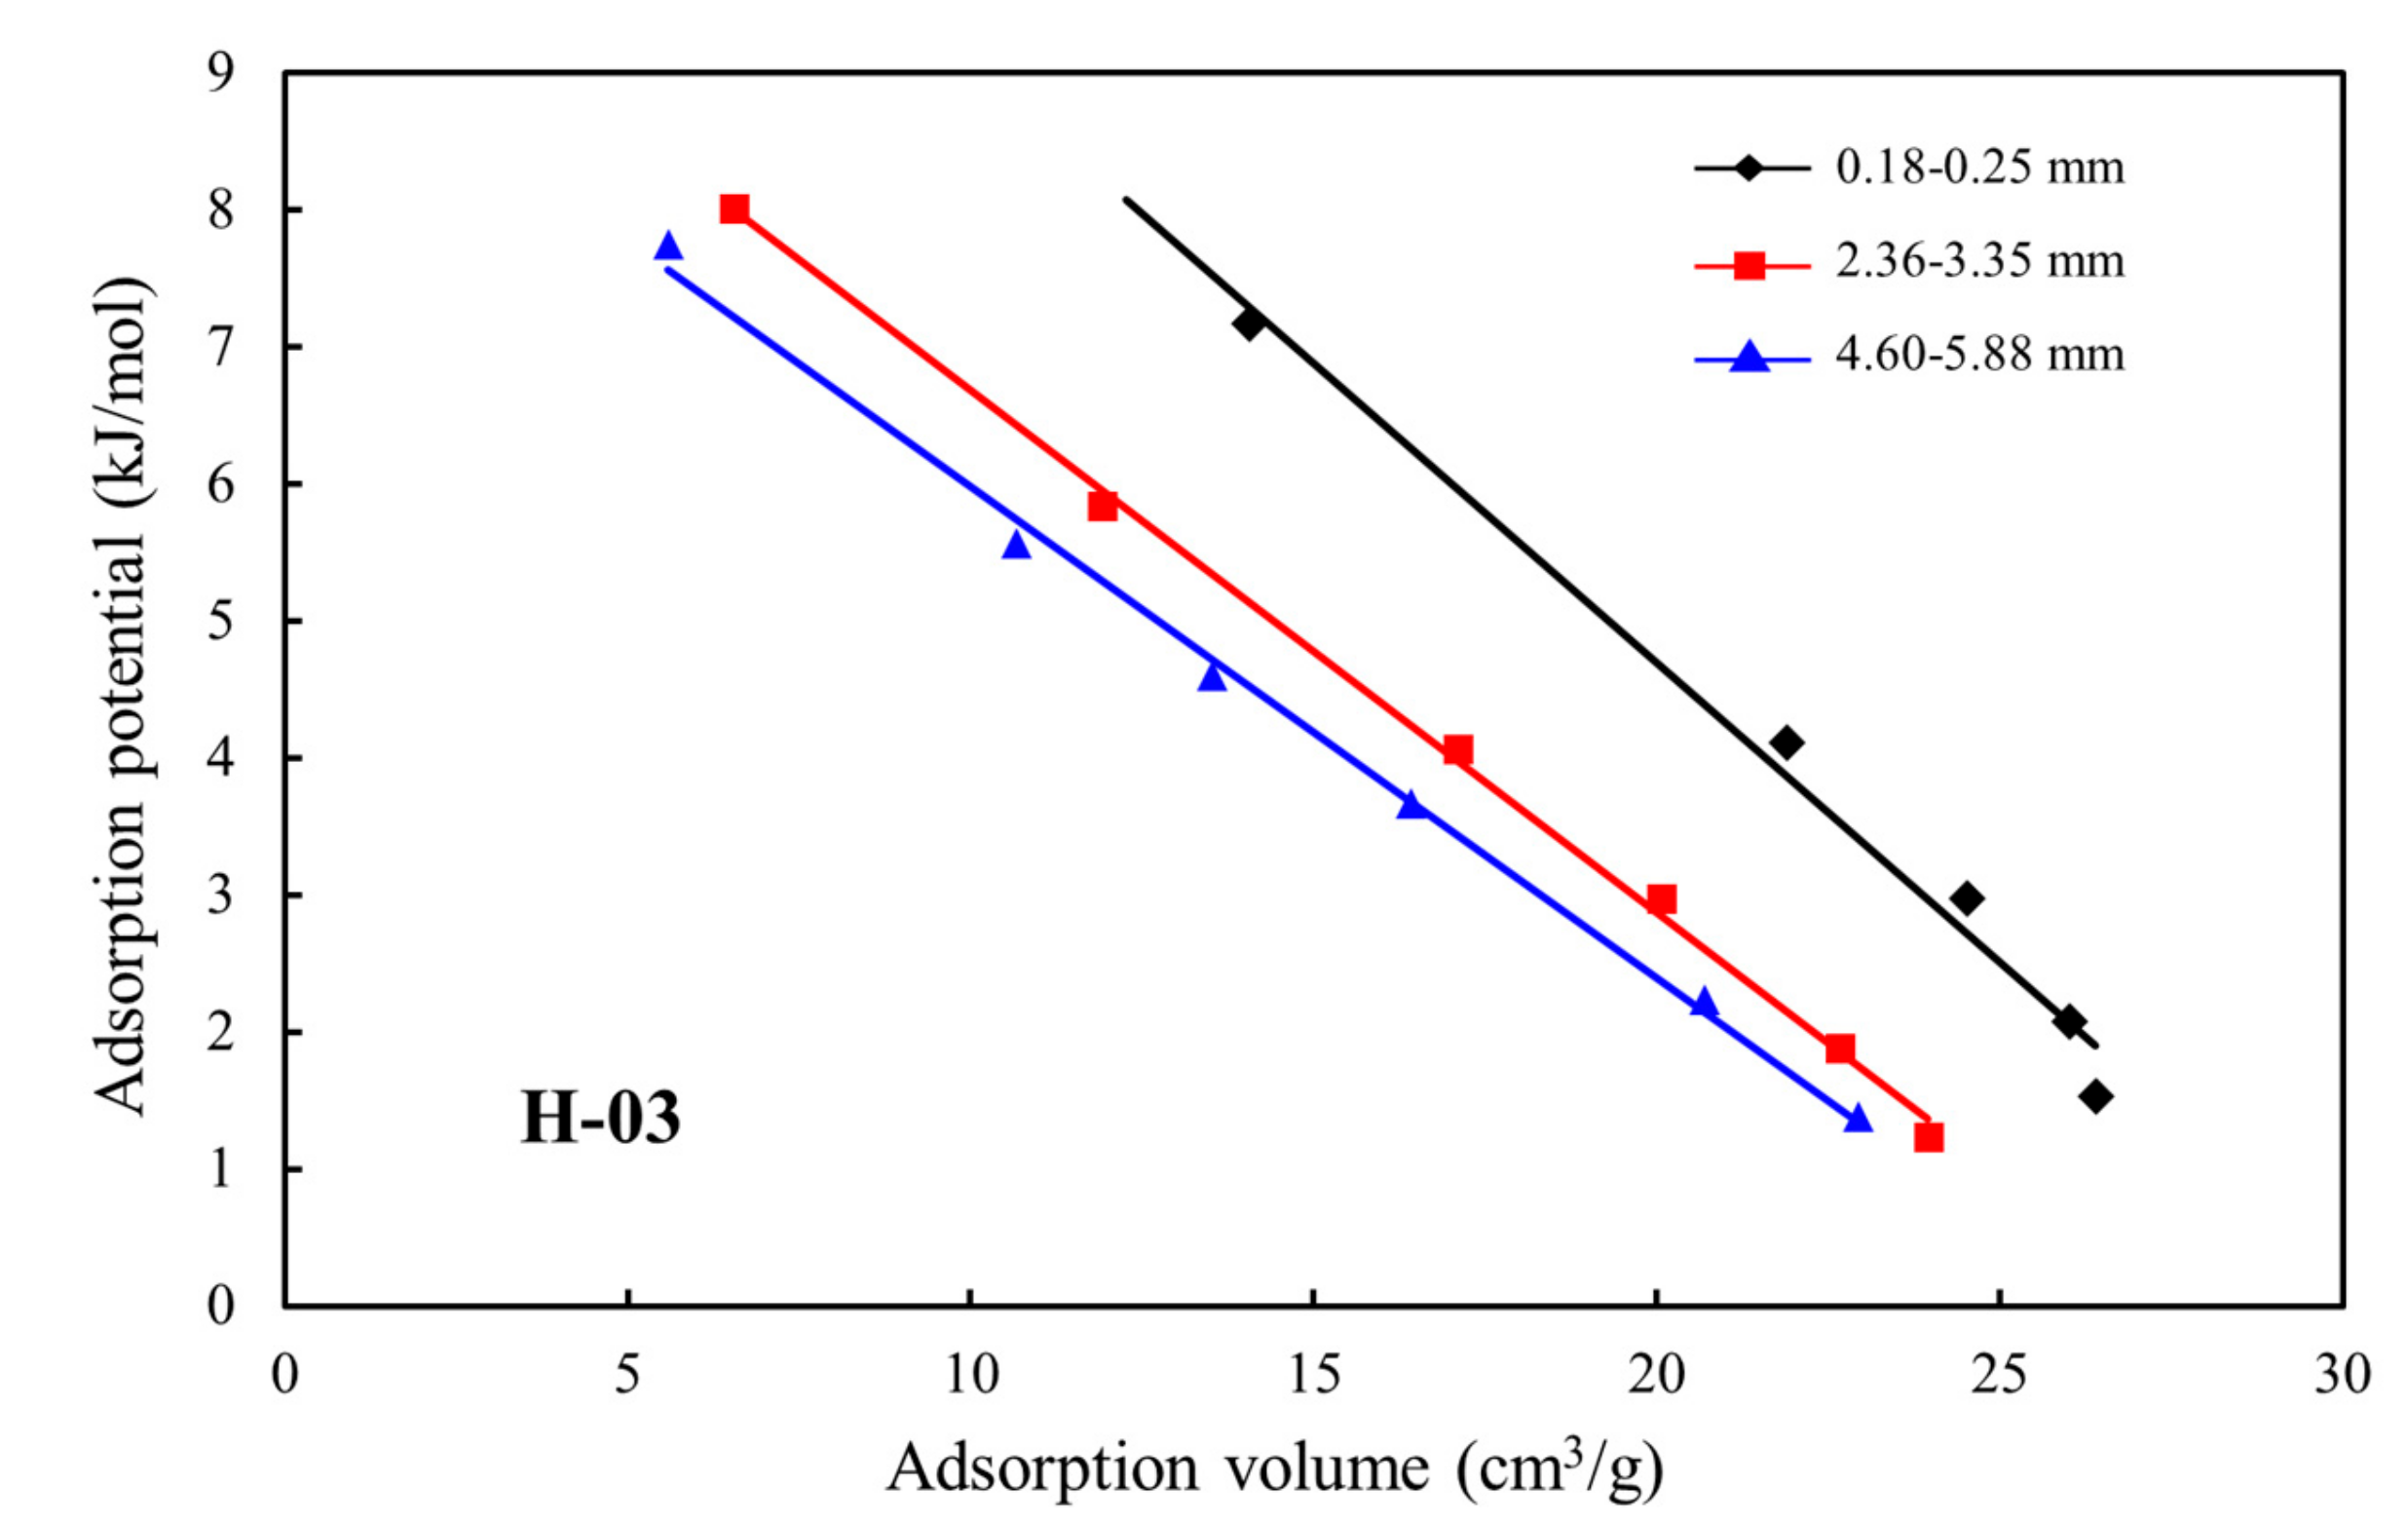
Figure 14 shows that the relationship between the adsorption potential and the adsorption amount of coals with different particle sizes decreases as the amount of methane adsorption increases. Moreover, when the adsorption amount is constant, as the particle size of the sample increases, the adsorption potential gradually decreases. The mechanism is that as the degree of coal fracture increases, the combined force of the coal matrix to the attraction of methane molecules increases at the same adsorption site. Therefore, the coal has a large adsorption potential, which is easy to adsorb methane on the surface of the coal matrix.
The mechanism explains the adsorption capacity of methane on the surface of the coal matrix from the aspect of the adsorption potential energy, and the amount of methane adsorption decreases with the increase of particle size before reaching the maximum adsorption amount.
4. Conclusions
In this work, experimental works including CH4 isothermal adsorption, proximate analysis and low-temperature N2 adsorption/ desorption on the selected coals were conducted. The coals with different ranks, particle sizes, moisture contents and pore structures were used to theoretically calculate and explore the change of adsorption potential with different controlling factors. The main conclusions are made below:
- (1)
- The Vad, Mad and Aad are all negatively correlated with Ro,m, where Vad and Ro,m are exponentially related, and Mad and Ro,m are power functions related, while the correlation between Aad and Ro,m is slight. The FCad has a logarithmic correlation with Ro,m, and gradually increases with Ro,m increasing.
- (2)
- The value of the VL of coal decreases with the increase of moisture content, and becomes bigger with the pore surface area and pore volume of coal larger, which decreases first, and then increases when the coal rank rises. In addition, VL is independent of the particle size.
- (3)
- The adsorption potential of the coals at different conditions gradually decreased with the increase of the methane adsorption on coal, the reason of which could be that the cumulative adsorption of methane molecules on coal is increasing, and the effective adsorption sites on the coal matrix are gradually reduced, resulting in a decrease in the gravitational attraction of the coal matrix to the methane molecules, a weakening of the adsorption capacity, and a decrease in the adsorption potential.
- (4)
- At the same pressure, the water molecules were more easily adsorbed onto the surface of coal matrix than the methane molecules, while the adsorption potential on the surface of the coal matrix decreases with the increase of moisture content, and the adsorption potential increases as the coal particle size decreases. When the amount of adsorption is the same, the smaller the pores, the more micropores, and the higher the adsorption potential, which leads to the decrease of the adsorption potential on the surface of coal matrix with the increasing coal rank, and increases with the increase of the micropores surface area and pore volume.
Highlights
- The adsorption potential of the coals at different conditions gradually decreased with the increase of the methane adsorption on coal.
- The adsorption potential decreases with the increase of moisture content and particle size at the same pressure.
- The adsorption potential decreases first, and then increases with the increasing of the coal rank, and increases with the increase of the micropores surface area and pore volume when the amount of the adsorption is the same.
Nomenclature List Conversion for Units of Measurements
| 1 MP = 145.0377 psi |
| 1 cm = 0.032808 ft |
| 1 mm = 0.0032808 ft |
| 1 KJ = 1000 J |
Author Contributions
D.L. and Y.C. conceived and designed the experiments; F.Q. performed the experiments and wrote the paper; F.Q. and Y.C. analyzed the data; D.L. and Y.C. revised the paper and provided language support; N.L. and Y.Q. provided technical support. All authors have read and agreed to the published version of the manuscript.
Funding
This research was funded by the National Natural Science Fund (grant nos. 41830427, 41772160 and 41922016) and the Fundamental Research Funds for Central Universities (grant no. 2652018002).
Conflicts of Interest
The authors declare no conflict of interest.
References
- Yang, F.; Ning, Z.F.; Zhang, R.; Zhao, H.W.; Krooss, B.M. Investigations on the methane sorption capacity of marine shales from Sichuan Basin, China. Int. J. Coal Geol. 2015, 146, 104–117. [Google Scholar] [CrossRef]
- Tao, S.; Chen, S.D.; Pan, Z.J. Current status, challenges, and policy suggestions for coalbed methane industry development in China: A review. Energy Sci. Eng. 2019, 7, 1059–1074. [Google Scholar] [CrossRef] [Green Version]
- Cai, Y.D.; Liu, D.M.; Jonathan, P.M.; Pan, Z.J.; Elsworth, D.; Yao, Y.B.; Li, J.Q.; Guo, X.Q. Permeability evolution in fractured coal Combining triaxial confinement with X-ray computed tomography, acoustic emission and ultrasonic techniques. Int. J. Coal Geol. 2014, 122, 91–104. [Google Scholar] [CrossRef]
- Alireza, S.; Rajabi, M.; Reynolds, P. The effect of magmatic intrusions on coalbed methane reservoir characteristics: A case study from the Hoskissons coalbed, Gunnedah Basin, Australia. Int. J. Coal Geol. 2016, 165, 278–289. [Google Scholar]
- Palmer, I. Coalbed methane completions: A world view. Int. J. Coal Geol. 2010, 82, 184–195. [Google Scholar] [CrossRef]
- Meng, Z.P.; Liu, S.S.; Li, G.Q. Adsorption capacity, adsorption potential and surface free energy of different structure high rank coals. J. Pet. Sci. Eng. 2016, 146, 856–865. [Google Scholar] [CrossRef]
- Polanyi, M. The Potential Theory of Adsorption. Science 1963, 141, 1010–1013. [Google Scholar] [CrossRef]
- Su, X.B.; Chen, R.; Lin, X.Y.; Song, Y. Application of Adsorption Potential Theory in the Fractionation of Coalbed Gas during the Process of Adsorption/Desorption. Acta Geol. Sin. 2008, 82, 1382–1389. [Google Scholar]
- Liu, S.S.; Meng, Z.P. Study on energy variation of different coal-body structure coals in the process of isothermal adsorption. J. China Coal Soc. 2015, 40, 1422–1427. [Google Scholar]
- Dubinin, M.M.; Stoeckli, H.F. Homogeneous and Heterogeneous Micropore Structures in Carboneous Adsorbents. J. Colloid Interface Sci. 1980, 75, 34–42. [Google Scholar] [CrossRef] [Green Version]
- Wood, G.O. Affinity coefficients of the Polanyi/Dubinin adsorption isotherm equations. Carbon 2001, 39, 343–356. [Google Scholar] [CrossRef]
- Jiang, W.; Wu, C.F.; Jiang, W.; Wang, C.; Chen, Z.Y.; Du, Y.F. Application of Adsorption Potentia Theory to Study on Adsorption/ Desorption of Coal Bed Methane. Coal. Sci. Technol. 2011, 39, 102–104. [Google Scholar]
- Yue, C.T.; Li, S.Y.; Li, L.Y.; Wen, H.L. Adsorption characteristics of shale reservoirs in the Jingmen area and application of adsorption potential theory. J. Petrol. Geol. 2016, 38, 346–353. [Google Scholar]
- Xie, J.; Liang, Y.P.; Zou, Q.L.; Wang, Z.Z.; Li, X.L. Prediction Model for Isothermal Adsorption Curves Based on Adsorption Potential Theory and Adsorption Behaviors of Methane on Granular Coal. Energy Fuels 2019, 33, 1910–1921. [Google Scholar] [CrossRef]
- Matias, A.M.; Alexander, A.S. Study of high-pressure adsorption from supercritical fluids by the potential theory. Fluid Phase Equilibria 2009, 283, 56–64. [Google Scholar]
- Dundar, E.; Zacharia, R.; Chahine, R.; Bénard, P. Modified potential theory for modeling supercritical gas adsorption. Int. J. Hydrogen Energy 2012, 37, 9137–9147. [Google Scholar] [CrossRef]
- Cai, Y.D.; Li, Q.; Liu, D.M.; Zhou, Y.F.; Lv, D.W. Insights into matrix compressibility of coals by mercury intrusion porosimetry and N2 adsorption. Int. J. Coal Geol. 2018, 200, 199–212. [Google Scholar] [CrossRef] [Green Version]
- Wang, Y.J.; Liu, D.M.; Cai, Y.D.; Li, X.W. Variation of Petrophysical Properties and Adsorption Capacity in Different Rank Coals: An Experimental Study of Coals from the Junggar, Ordos and Qinshui Basins in China. Energies 2019, 12, 986. [Google Scholar] [CrossRef] [Green Version]
- Fang, X.L.; Cai, Y.D.; Liu, D.M.; Zhou, Y.F. A Mercury Intrusion Porosimetry Method for Methane Diffusivity and Permeability Evaluation in Coals: A Comparative Analysis. Appl. Sci. 2018, 8, 860. [Google Scholar] [CrossRef] [Green Version]
- Cai, Y.D.; Liu, D.M.; Yao, Y.B.; Li, J.Q.; Qiu, Y.K. Geological controls on prediction of coalbed methane of No. 3 coal seam in Southern Qinshui Basin, North China. Int. J. Coal Geol. 2011, 88, 101–112. [Google Scholar] [CrossRef]
- Busch, A.; Genst, E.Y.; Kross, B.M. Methaneand CO2 sorption and desorption measurements on dry Argonnepremium coals:Pure components and mixture. Int. J. Coal Geol. 2003, 55, 205–224. [Google Scholar] [CrossRef]
- Yao, Y.B.; Liu, D.M.; Tang, D.Z.; Tang, S.H.; Huang, W.H. Fractal characterization of adsorption-pores of coals from North China: An investigation on CH4 adsorption capacity of coals. Int. J. Coal Geol. 2008, 73, 27–42. [Google Scholar] [CrossRef]
- Zheng, S.J.; Yao, Y.B.; Liu, D.M.; Cai, Y.D.; Liu, Y. Characterizations of full-scale pore size distribution, porosity and permeability of coals: A novel methodology by nuclear magnetic resonance and fractal analysis theory. Int. J. Coal Geol. 2018, 196, 148–158. [Google Scholar] [CrossRef]
- Dubinin, M. The potential theory of adsorption of gases and vapors for adsorbents with energetically nonuniform surfaces. Chem. Rev. 1960, 60, 235–241. [Google Scholar] [CrossRef]
- Gensterblum, Y.; Merkel, A.; Busch, A.; Krooss, B.M. High-pressure CH4 and CO2 sorption isotherms as a function of coal maturity and the influence of moisture. Int. J. Coal Geol. 2013, 118, 45–57. [Google Scholar] [CrossRef]
- Li, P.; Ma, D.M.; Zhang., J.C.; Huo, Z.P. Wettability modification and its influence on methane adsorption/desorption: A case study in the Ordos Basin, China. Energy Sci. Eng. 2019. [Google Scholar] [CrossRef]
- Chen, X.J.; Li, L.Y.; Cheng, Y.P.; Qi, L.L. Experimental study of the influences of water injections on CBM exploitation. Energy Sources Part A: Recovery Util. Environ. Eff. 2019, 42, 1–12. [Google Scholar] [CrossRef]
- Guo, H.J.; Cheng, Y.P.; Wang, L.; Lu, S.Q.; Jin, K. Experimental study on the effect of moisture on low-rank coal adsorption characteristics. J. Nat. Gas Sci. Eng. 2015, 24, 245–251. [Google Scholar] [CrossRef]
- Zolfagharl, A.; Dehghanpour, H.; Holyk, J. Water sorption behaviour of gas shales: I. Role of clays. Int. J. Coal Geol. 2017, 179, 130–138. [Google Scholar] [CrossRef]
- Mohammad, S.; Gasem, K. Modeling the competitive adsorption of CO2 and water at high pressures on wet coals. Energy Fuels 2012, 26, 557–568. [Google Scholar] [CrossRef]
- Liu, A.H.; Fu, X.H.; Wang, K.X.; An, H.; Wang, G. Investigation of coalbed methane potential in low-rank coal reservoirs—Free and soluble gas contents. Fuel 2013, 112, 14–22. [Google Scholar] [CrossRef]
- Andreas, B.; Han, F.; Clayton, R.M. Paleofloral dependence of coal methane sorption capacity. Int. J. Coal Geol. 2019, 211, 103232. [Google Scholar]
- Xiong, J.; Liang, L.X.; Liu, X.J.; Zhang, A.D. Adsorption Characteristics of Shale to CH4 Based on Adsorption Potential Theory. Sci. Technol. Rev. 2014, 32, 19–22. [Google Scholar]
- Wu, H.; Yao, Y.B.; Zhou, Y.F.; Qiu, F. Analyses of representative elementary volume for coal using X-ray μ-CT and FIB-SEM and its application in permeability predication model. Fuel 2019, 254, 115563. [Google Scholar] [CrossRef]
- Sun, Y.F.; Zhao, Y.X.; Yuan, L. Impact of coal composition and pore structure on gas adsorption: A study based on a synchrotron radiation facility. Greenh. Gases Sci. Technol. 2020, 10, 116–129. [Google Scholar] [CrossRef]
- Liu, Z.S.; Liu, D.M.; Karacan, C.Ö.; Cai, Y.D.; Yao, Y.B.; Pan, Z.J.; Zhou, Y.F. Application of nuclear magnetic resonance (NMR) in coalbed methane and shale reservoirs: A review. Int. J. Coal Geol. 2020, 218, 103261. [Google Scholar] [CrossRef]
- International Union of Pure and Applied Chemistry. Reporting physisorption data for gas/solid systems with special reference to the determination of surface area and porosity. Pure Appl. Chem. 1982, 54, 2201–2218. [Google Scholar] [CrossRef]
- Hodot, B.B. Outburst of Coal and Coalbed Gas (Chinese Translation); China Industry Press: Beijing, China, 1966; p. 318. [Google Scholar]
- Pan, J.N.; Hou, Q.L.; Ju, Y.W.; Bai, H.L.; Zhao, Y.Q. Coalbed methane sorption related to coal deformation structures at different temperatures and pressures. Fuel 2012, 102, 760–765. [Google Scholar] [CrossRef]
- Lai, F.P.; Li, Z.P.; Dong, H.K.; Jiang, Z.Y.; Mao, G.T. Micropore structure characteristics and water distribution in a coalbed methane reservoir. Aust. J. Earth Sci. 2019, 66, 741–750. [Google Scholar] [CrossRef]
- Sharon, M.S.; Maria, D.M.; Mark, A.E.; Brett, J.V.; Peter, D.W.; Paul, C.H.; Harvey, E.B. Pore characteristics of Wilcox Group Coal, U.S. Gulf Coast Region: Implications for the occurrence of coalbed gas. Int. J. Coal Geol. 2015, 139, 80–94. [Google Scholar]
- Everett, D.H.; Powl, J.C. Adsorption in slitlike and cylindrical micropores in the henry’s law region. A model for the microporosity of carbons. J. Chem. Soc. 1976, 1, 619–636. [Google Scholar]
- Dong, Y.T.; Ju, B.S.; Zhang, S.A.; Tian, Y.P.; Ma, S.; Liu, N.N.; Lu, G.Z. Microscopic mechanism of methane adsorption in shale: Experimental data analysis and interaction potential simulation. J. Pet. Sci. Eng. 2020, 184, 106544. [Google Scholar] [CrossRef]
- Crosdale, P.; Beamish, B.; Valix, M. Coalbed methane sorption related to coal composition. Int. J. Coal Geol. 1998, 35, 147–158. [Google Scholar] [CrossRef]
- Zhu, C.J.; Ren, J.; Wan, J.M.; Lin, B.Q.; Yang, K.; Li, Y. Methane adsorption on coals with different coal rank under elevated temperature and pressure. Fuel 2019, 254, 115686. [Google Scholar] [CrossRef]
- Zhong, L.W. Adsorptive Capacity of Coals and Its Affecting Factors. Earth Sci.-J. China Univ. Geosci. 2004, 29, 327–332. [Google Scholar]
- Skoczylas, N. The Influences of the Rank of Coal on Methane Sorption Capacity in Coals. Gospod. Surowcami Min. 2016, 32, 506–516. [Google Scholar]
- Godyń, K.; Dutka, B. The Impact of the Degree of Coalification on the Sorption Capacity of Coals from the Zofiówka Monocline. Arch. Min. Sci. 2018, 32, 727–746. [Google Scholar]
- Liu, L.T.; Jin, C.; Li, L.; Xu, C.Y.; Sun, P.F.; Meng, Z.X.; An, L.L. Coalbed methane adsorption capacity related to maceral compositions. Eng. Explor. Exploit. 2020, 38, 79–91. [Google Scholar] [CrossRef]
- Ruppel, T.; Grein, C.; Bienstock, D. Adsorption of methane on dry coal at elevated pressure. Fuel 1974, 53, 152–162. [Google Scholar] [CrossRef]
- Moffat, D.; Weale, K. Sorption by coal of methane at high pressure. Fuel 1955, 43, 449. [Google Scholar]
- Donghyeon, K.; Youngjin, S.; Juhyun, K.; Jeongmin, H.; Youngsoo, L. Experimental and simulation studies on adsorption and diffusion characteristics of coalbed methane. Energies 2019, 12, 3445. [Google Scholar]
Figure 1.
Positions of the Qinshui, Ordos and Junggar basins in China and the distribution of the sampling locations and part of samples for adsorption experiment. (a) Locations of Qinshui, Ordos and Junggar Basins in the China Map; (b) Sampling points of Junggar Basins; (c) Sampling points of North Qinshui Basins; (d); Sampling points of Northeast Ordos Basins (e) Part of selected samples.

Figure 2.
Experimental devices for CH4 adsorption.

Figure 3.
Relationship between the proximate analysis and different rank coals: (a) Volatile content (Vad, %) vs. Ro,m (%); (b) Moisture content (Mad, %) vs. Ro,m (%); (c) Ash yield (Aad, %) vs. Ro,m (%); (d).Fixed carbon (FCad, %) vs. Ro,m (%).
Figure 3.
Relationship between the proximate analysis and different rank coals: (a) Volatile content (Vad, %) vs. Ro,m (%); (b) Moisture content (Mad, %) vs. Ro,m (%); (c) Ash yield (Aad, %) vs. Ro,m (%); (d).Fixed carbon (FCad, %) vs. Ro,m (%).

Figure 4.
Isothermal adsorption curves of samples with different moisture contents.

Figure 5.
Competitive adsorption mode of methane and water molecules.

Figure 6.
Relationship between the adsorption capacity and adsorption potential of samples with different moisture contents.
Figure 6.
Relationship between the adsorption capacity and adsorption potential of samples with different moisture contents.

Figure 7.
Low-temperature N2 adsorption/desorption curves of samples.

Figure 8.
Isothermal adsorption curves of different pore structure samples.

Figure 9.
Surface area of different pore sizes.

Figure 10.
(a) d/r0 = 1.60; (b) d/r0 = 1.14; (c) d/r0 = 1.00 (ε: adsorption potential; z: The distance between the molecule and the parallel monolayer plane; d: Distance between two parallel single-layer planes; r0: The distance between the numerator and the parallel monolayer plane when ε = 0) [42].

Figure 11.
Relationship between adsorption amount and coal rank (Reference data (1) quoted from Zhong et al. [46]; Reference data (2) quoted from Skoczylas [47] and Godyń et al. [48]).

Figure 12.
Relationship between coal rank and adsorption potential.

Figure 13.
H-03 coal samples for adsorption experiment and isothermal adsorption curves. (a) Sample with particle size of 4.60–5.88 mm; (b) Sample with particle size of 2.36–3.35 mm; (c) Sample with particle size of 0.18–0.25 mm; (d) Isotherm adsorption curves of different particle size samples.
Figure 13.
H-03 coal samples for adsorption experiment and isothermal adsorption curves. (a) Sample with particle size of 4.60–5.88 mm; (b) Sample with particle size of 2.36–3.35 mm; (c) Sample with particle size of 0.18–0.25 mm; (d) Isotherm adsorption curves of different particle size samples.

Figure 14.
Isothermal adsorption curves of different particle size.


Table 1.
Result of Ro,m and proximate analysis of the coal samples.
| Sample | Ro,m | Mad (%) | Aad (%) | Vad (%) | FCad (%) |
|---|---|---|---|---|---|
| L-01 | 0.51 | 2.83 | 15.97 | 27.35 | 53.85 |
| L-02 | 0.53 | 3.13 | 6.89 | 33.73 | 56.25 |
| L-03 | 0.58 | 1.99 | 21.28 | 27.74 | 48.99 |
| L-04 | 0.59 | 2.64 | 13.62 | 30.39 | 53.35 |
| L-05 | 0.59 | 2.48 | 15.13 | 32.69 | 49.7 |
| L-06 | 0.63 | 2.25 | 22.98 | 29.91 | 44.86 |
| L-07 | 0.65 | 3.76 | 8.86 | 39.21 | 48.17 |
| L-08 | 0.70 | 2.95 | 13.87 | 32.44 | 50.74 |
| M-01 | 0.72 | 1.09 | 15.05 | 29.84 | 54.02 |
| M-02 | 1.18 | 1.21 | 13.72 | 28.64 | 56.83 |
| M-03 | 1.34 | 0.74 | 10.27 | 27.94 | 61.05 |
| M-04 | 1.48 | 0.66 | 15.19 | 22.5 | 61.65 |
| M-05 | 1.49 | 0.71 | 8.57 | 28.97 | 61.75 |
| M-06 | 1.68 | 0.63 | 11.1 | 21.3 | 66.97 |
| H-01 | 2.18 | 0.71 | 8.18 | 16.56 | 74.55 |
| H-02 | 2.21 | 0.88 | 5.35 | 18.35 | 75.42 |
| H-03 | 2.54 | 0.66 | 11.83 | 12.46 | 75.05 |
Note: Ro,m = the maximum vitrinite reflectance; Mad = Moisture content (wt %, air dry basis); Aad = Ash yield (wt %, air dry basis); Vad = Volatile matter (wt %, air dry basis). FCad = Fixed carbon (wt %, air dry basis).
Table 2.
Results of Low-temperature N2 adsorption/desorption test.
| Sample | BJH Surface Area (m2/g) | BET Surface Area (m2/g) | BJH Surface Volume (cm3/g) | BET Pore Size nm | VL cm3/g |
|---|---|---|---|---|---|
| M-01 | 6.62 | 5.03 | 0.0134 | 9.81 | 27.48 |
| M-02 | 0.60 | 0.48 | 0.0026 | 20.46 | 22.49 |
| M-06 | 0.48 | 0.39 | 0.0013 | 12.62 | 18.64 |
Table 3.
Adsorption potential of different pore structure samples.
| Sample | Langmuir Volume (cm3/g) | Adsorption Pressure (Adsorption Amount Is 10 cm3/g) (MPa) | Adsorption Potential (kJ/ mol) |
|---|---|---|---|
| M-01 | 27.48 | 0.95 | 6.34 |
| M-02 | 22.49 | 1.31 | 5.51 |
| M-06 | 18.44 | 1.82 | 4.69 |
Table 4.
Langmuir parameters for YQ-WK samples with different particle size.
| Particle size(mm) | 4.60–5.88 | 2.36–3.35 | 0.18–0.25 |
| VL(cm3/g) | 30.55 | 31.20 | 31.37 |
© 2020 by the authors. Licensee MDPI, Basel, Switzerland. This article is an open access article distributed under the terms and conditions of the Creative Commons Attribution (CC BY) license (http://creativecommons.org/licenses/by/4.0/).
Share and Cite
MDPI and ACS Style
Qiu, F.; Liu, D.; Cai, Y.; Liu, N.; Qiu, Y. Methane Adsorption Interpreting with Adsorption Potential and Its Controlling Factors in Various Rank Coals. Processes 2020, 8, 390. https://0-doi-org.brum.beds.ac.uk/10.3390/pr8040390
AMA Style
Qiu F, Liu D, Cai Y, Liu N, Qiu Y. Methane Adsorption Interpreting with Adsorption Potential and Its Controlling Factors in Various Rank Coals. Processes. 2020; 8(4):390. https://0-doi-org.brum.beds.ac.uk/10.3390/pr8040390
Chicago/Turabian StyleQiu, Feng, Dameng Liu, Yidong Cai, Ning Liu, and Yongkai Qiu. 2020. "Methane Adsorption Interpreting with Adsorption Potential and Its Controlling Factors in Various Rank Coals" Processes 8, no. 4: 390. https://0-doi-org.brum.beds.ac.uk/10.3390/pr8040390
Note that from the first issue of 2016, this journal uses article numbers instead of page numbers. See further details here.