Application of Evolutionary Game Theory in Safety Management of Chemical Production

Department of Control Science and Engineering, Hangzhou Dianzi University, Hangzhou 310018, China
*
Author to whom correspondence should be addressed.
Processes 2020, 8(4), 472; https://0-doi-org.brum.beds.ac.uk/10.3390/pr8040472
Submission received: 3 March 2020
/
Revised: 14 April 2020
/
Accepted: 15 April 2020
/
Published: 16 April 2020
(This article belongs to the Special Issue Thermal Safety of Chemical Processes)
Abstract
:The chemical industry is essential in the social economy, and the issue of production safety has aroused widespread concern. Chemical safety incidents occupy the headlines from time to time, and chemical production safety management is particularly important. This paper presents an application model based on evolutionary game theory in the assessment and analysis of chemical production safety management. The model uses evolutionary game theory to construct a strategic interactive payoff matrix between the management department of a chemical plant and the chemical plant using a replicated dynamic equation to analyze their strategic interaction and to reveal the evolution of behavioral strategy selection. The evolution results were verified and simulated. The application of this model provides an effective safety management basis and recommendations for the management of chemical plants, providing a foundation for the safe production and healthy development of chemical plants.
1. Introduction
With the rapid changes in social science and technology, as well as the continuous improvements in social and economic levels, the process of social development, in various areas, are experiencing advances. The chemical industry is no exception, gradually developing into a major industry. However, chemical plants are different from other industries and belong to the category of high-risk industries. Although chemical security has generally shown a trend of gradually improving and overall stability, chemical safety still poses challenges. Chemical safety incidents still occupy the headlines from time to time, and peoples’ confidence in chemical security has not improved significantly. Safety production accidents often causes serious economic losses, casualties, and environmental damage; for instance, the Bhopal tragedy [1,2,3], the Piper Alpha disaster [4,5], the Flixborough disaster [6,7], the BP Texas City disaster [8,9], the West Fertilizer explosion [10], and the Tianjin explosion [11]. Therefore, for chemical safety management departments, safety assessment and management of chemical production are particularly important.
Over the past decade, governments have been working to promote the development of safety risk assessment methods to guide and support safety analysis and risk assessment of chemical plant plants. For example, the American Petroleum Institute (API) [12], the American Institute of Chemical Engineering [13], Sandia National Laboratories [14], and the National Institute of Justice [15] have proposed security risk assessment methods. These methods allow for qualitative or semi-quantitative safety risk assessments, and only provide general guidance for safety risk mitigation and a list of possible solutions for security countermeasures, depending on existing security [16].
An important part of the safety analysis and risk assessment system is to identify hazards associated with the process system and to estimate the likelihood of an occurrence and the subsequent consequences [17,18]. Comprehensive analysis of how the accident process evolves from the startup phase to the termination phase is essential for designing a safe process system to avoid accidents [19,20,21]. Some research has been published on process safety analysis and risk assessment management. For example, Jain et al. provided an integrated and holistic system approach to meet the needs of the technical society [22,23].
Research on safety management of chemical parks, e.g., in the 1978 Canvey Island research program in the U.K., in the 1979 Ravenna project in Italy and the Netherlands, and in the Rijnmond research project, was used for the overall risk assessment and safety planning of the park to assess the quantitative risk assessment method [24]. In 2002, the European Union research center launched the ARAMIS (accidental risk assessment methodology for industries) project, and provided a comprehensive evaluation system [25,26] within this project. In 2004, Khan and Amyotte proposed the comprehensive essential safety index (I2SI), which consists of two main sub-indexes: the risk index (HI) and the underlying safety potential index [27]. Khakzad et al. provided an application of bow-tie and Bayesian network methods in conducting quantitative risk analysis of drilling operations [28]. Abimbola et al. conducted safety and risk analysis of a managed pressure drilling operation using a Bayesian network [29]. Goerlandt et al. held a review focusing on the validation of QRA (quantitative risk analysis) in a safety context [30]. Dianous et al. [31] studied the consequences and causes of all kinds of accidents faced by enterprises in the chemical industry, which emphasized the use of the bow structure diagram method. Delvosalle et al. analyzed the possible accident scenarios of various major hazards [32]. Bahman proposed a new approach that is able to predict and assess the impact of an accident in one process unit on other processes units [33].
However, the current research on chemical production safety analysis and risk assessment is focused on the chemical plant, such as the process, equipment, facilities, environment, personnel, and management of the production system. The production safety management of the chemical plant also includes supervision and management by the management department of the chemical plant, but this part is often ignored. Chemical production safety management needs to start from the behavioral strategic relationship between the management department of the chemical plant and the chemical plant; we used the game theory model to seek the equilibrium state of mutual restraint and supervision among the three. This would provide some recommendations for production safety to ensure that the security of chemical production in China is tangibly improved.
This paper proposes an analysis and evaluation method for chemical production safety management based on the evolutionary game model. Dynamic analysis and game theory simulation are used in this model to analyze the stability of stakeholder interactions and to determine equilibrium solutions. Evolutionary game theory was used to describe the long-term dynamic process of the game in chemical production safety supervision under the condition of bounded rationality, and the effect of different strategies on the equilibrium of the game process was analyzed.
The basic contributions of the method and framework proposed in the paper are as follows:
(1) An analysis and evaluation method for chemical production safety management based on the evolutionary game model. The current analysis and evaluation of chemical production safety management are mainly concentrated in chemical plants, filling the gap in the external management research.
(2) Use of a replication dynamic equation to construct an evolutionary game model between the two participants. According to the choice of strategy space, assuming conditions and parameter settings, the behavior choice and payment matrix of the participants in the game are obtained, and then the evolutionary game model is obtained according to the formula of the dynamic equation of the replicator.
(3) Application of the proposed model to chemical production safety management. Using the constructed evolutionary game model, taking local government or chemical park managers’ production safety management of chemical plants as an example, the motivation for strategy choice between the two participants and its influence on the strategy choice of the other party are analyzed. Scientific, reliable, and effective methods for higher management departments to manage chemical plants are provided.
(4) Actual detailed chemical production safety management data are taken as an example. Using software simulation to evolve the game model, real-time game results can be obtained. According to the actual needs, appropriate and simple adjustment of the parameters can obtain another desired game result to achieve the purpose of production safety management.
The content of the paper is distributed as follows: Section 2 explains the modeling steps and the applications of evolutionary games, the third section provides the main results and discussion of the work, and the fourth and final sections outline the conclusions.
2. Materials and Methods
2.1. Evolutionary
Evolutionary game theory no longer turns game theory human models into super rational players, but believes that humans usually achieve game equilibrium through trial and error. It has a commonality with the principle of biological evolution, and the chosen equilibrium is a function of the equilibrium process that reaches equilibrium. Thus, historical and institutional factors and certain details of the equilibrium process impact the choice of multiple equilibria in the game. Theoretically, this theory should be useful in the fields of biology, economics, finance, and securities [34,35].
In traditional game theory, it is often assumed that participants are completely rational and that participants are engaged in complete information conditions. However, in the real economic life of the participants, the conditions of the participants’ complete rationality and complete information are difficult to achieve. In the cooperative competition of plants, differences exist among the participants. The incomplete information caused by the complexity of the economic environment and the game, as well as the bounded rationality of the participants, are obvious. The concept of bounded rationality was first proposed by Simon when studying decision-making problems based on the realization that individuals have limitations in expressing their knowledge or feelings through statements, numbers, or diagrams in a way that others can understand [36].
2.2. Modelling and Analysis Steps
- (1)
- Participant confirmation
Both parties of the evolutionary game are defined as the participants of the model.
- (2)
- Strategic space between the two sides of the game
Each participant in the group has a public policy set of G = {G1, G2, …, Gn}. When participants game with each other, the strategies of both parties are recorded as Gi and Gj (i = 1, 2; j = 3, 4), and neither participant can adopt a hybrid strategy. The four policy combinations that can be formed are (G1, G3), (G1, G4) (G2, G3), and (G2, G4).
- (3)
- Assumptions and parameter settings
Assume that both parties involved in the game are bounded rational. The ratio of the strategy Gi or Gj of any one participant is only 1; for example, for the ratio x of one participant’s selection strategy G1, then the ratio of the selection strategy G2 is 1 − x. The benefits and costs of each participant in the various strategy combinations are clarified.
- (4)
- Payoff matrix
According to the policy space, assumption conditions, and parameter settings, the behavior selection and payoff matrix of the participant game can be obtained, as shown in Table 1, where gij is the comprehensive income of participant i when each participant selects a strategy, and g’ij is the comprehensive income of participant j when each participant selects a strategy.
- (5)
- The replicated dynamic equation
In terms of the replicated dynamics—that is, the game method adopted by the participants participating in the game, the difference between the game effect that can be achieved in the game environment, and the average game effect achieved by each game participant—the increase in the number of game subjects chooses this kind of game method. If the game effect of this part of the game participants is higher, then other game participants will follow suit, and, vice versa, the game will be put on hold.
The replicated dynamic equation is
where xi represents the proportion of the individual selection strategy Gi; t represents time; u(i,s) represents the expected return of the strategy Gi when the player is playing the game; and u(s,s) represents the overall average return.
- When the participant chooses the strategy Gi to obtain an expected return greater than the overall average return, i.e., u(i, s) > u(s, s), as time t increases, the participants in the overall choice strategy Gi continue to increase.
- When the participant chooses strategy Gi to obtain an expected return less than the overall average return, i.e., u(i, s) < u(s, s), as time t increases, the participants in the overall choice strategy Gi continue to decrease.
- When the participant chooses the strategy Gi to obtain an expected return equal to the overall average return, i.e., u(i, s) = u(s, s), as time t increases, the participants in the overall choice strategy Gi do not change.
- (6)
- The determinant and trace of the Jacobian matrix.
Let the replicated dynamic equation of participant i and participant j be and ; F(x), F(y) sequentially obtain partial derivatives for x, y, and obtain the Jacobian matrix of the system [37] as
The determinant and trace of matrix J are
- (7)
- The equilibrium points
Let and , solving the replicator dynamic equations of participants i and j, we obtain the five local equilibrium points of the system: O(0,0), A(l,0), B(0,1), C(l,1), and M(p1,p2) [38].
When both Condition 1 and Condition 2 are satisfied, the system local equilibrium point will become the evolutionary stability strategy (ESS):
Condition 1: Determinant .
Condition 2: Trace .
At this time, the specific values of a, b, c, and d of the five local equilibrium points of the system can be obtained, as shown in Table 2, where ai, bi, ci, and di (I = 1, 2, 3, 4, 5) are the values of the corresponding a, b, c, and d calculated from the coordinates of the equilibrium point.
According to Table 2 and Equations (3) and (4), the expressions of the determinant D and the trace T of each partial equilibrium point can be obtained, as shown in Table 3.
- (8)
- Stability analysis
Table 2 and Table 3 show that the trace T = 0 of the matrix at the equilibrium point (p1,p2) does not satisfy Condition 2. Therefore, the local equilibrium point is not an ESS, and this equilibrium point does not perform stability analysis. The only local equilibrium point that satisfies D > 0 and T < 0 at the same time is the ESS. To judge the stability of the remaining four policy combinations—that is, whether any of the four equilibrium points are an ESS—the range of values of the expressions in the determinant D and the trace T needs to be discussed.
- (9)
- Evolutionary game results
Through local stability and corresponding phase diagram analysis, the participants can achieve a stable evolutionary equilibrium result of a strategy.
- (10)
- Game result verification and simulation
According to the actual parameters of the chemical plant, the parameters are imported into the model, and application software is used to simulate and verify the evolution equilibrium results.
2.3. Application of the Evolutionary Game Model to Chemical Safety Management
This model was used for the management department of chemical plants to manage the production safety of chemical plants. The management department of chemical plants is an organization that manages chemical plants, such as the local government or the head of a chemical park; it is referred to as the management department in this article.
2.3.1. Model Establishment
- (1)
- Participating subjects
The model has two participating entities: the management department of a chemical plant and the chemical plant itself.
- (2)
- Strategy space
The strategic space that can be selected in the supervision process of the management department is Gi = (Supervision, No supervision). The strategic space for the choice of a chemical plant’s production behavior is Gj = (Safe production, Unsafe production). The set of participants consisting of M(i,j) forms four strategic combinations: (Supervision, Safe production), (Supervision, Unsafe production), (No supervision, Safe production), and (No supervision, Unsafe production).
- (3)
- Assumptions and data
- Assumption 1
Both are bounded rationality. The management department is prone to dereliction of duty, laziness, and inaction in the management process. The chemical plant may violate regulations, display avoidance, and may cut corners in production overshoot.
- Assumption 2
In the initial state, the proportion of supervision strategy adopted by the management department is x (0 < x ≤ 1), and the proportion of no-supervision strategy is 1 − x; when the proportion of the chemical plant’s adopted safe production strategy is y (0 < y ≤ 1), the proportion of unsafe production strategy is 1 − y. When the chemical plant chooses safe production, the cost is C1, the unsafe production cost is C2 (C1 < C2), and the chemical plant produces chemical products with market sales income W.
- Assumption 3
If the management department is in charge of the supervision of a chemical plant that is not producing safely, the management will be found and punished as f1; at this time, the supervision cost of the management department is P. The supervision of the management department maintains the social stability and interests of the residents, and the management department will obtain a positive incentive income Q. If the management department does not supervise, it will not generate any costs and will not receive any rewards, namely, P = 0 and Q = 0. At this time, the chemical plant has the possibility of β (0 < β ≤ 1) to choose unsafe production and cause safety accidents. Once a safety incident occurs, the management department will be punished as f2. Assume that the probability of an accident in a chemical plant and the punishment by the management department are basically the same.
- (4)
- Payoff matrix
According to the assumptions and data, the behavior selection and payoff matrix of the management department and the chemical plant itself can be obtained, as shown in Table 4.
2.3.2. Replicated Dynamic Models
According to the model and Equation (1) established above, the replicated dynamic equation of the strategic interaction between the management department and the chemical plant itself can be obtained:
Let the replicated dynamic equation of the participant be and ; F(x), F(y) sequentially obtain partial derivatives for x, y, and obtain the Jacobian matrix of the system as
The determinant and trace of matrix J are
2.3.3. The Equilibrium Points
According to Equation (4), M(p1,p2) can be obtained as shown in Equation (8):
According to Equations (5)–(7), the expressions of the determinant D and the trace T of each partial equilibrium point can be obtained, as shown in Table 5.
2.3.4. Stability Analysis
It can be seen from Table 5 that the trace T = 0 of the matrix at the equilibrium point (p1,p2) does not satisfy Condition 2. Therefore, the local equilibrium point is not an ESS, and this equilibrium point does not perform stability analysis. Only the local equilibrium point that satisfies D > 0 and T < 0 at the same time is the ESS. To judge the stability of the remaining four policy combinations—that is, whether any of the four equilibrium points are an ESS—the range of values of the expressions in the determinant D and the trace T needs to be discussed.
- (1)
- Local stability analysis when
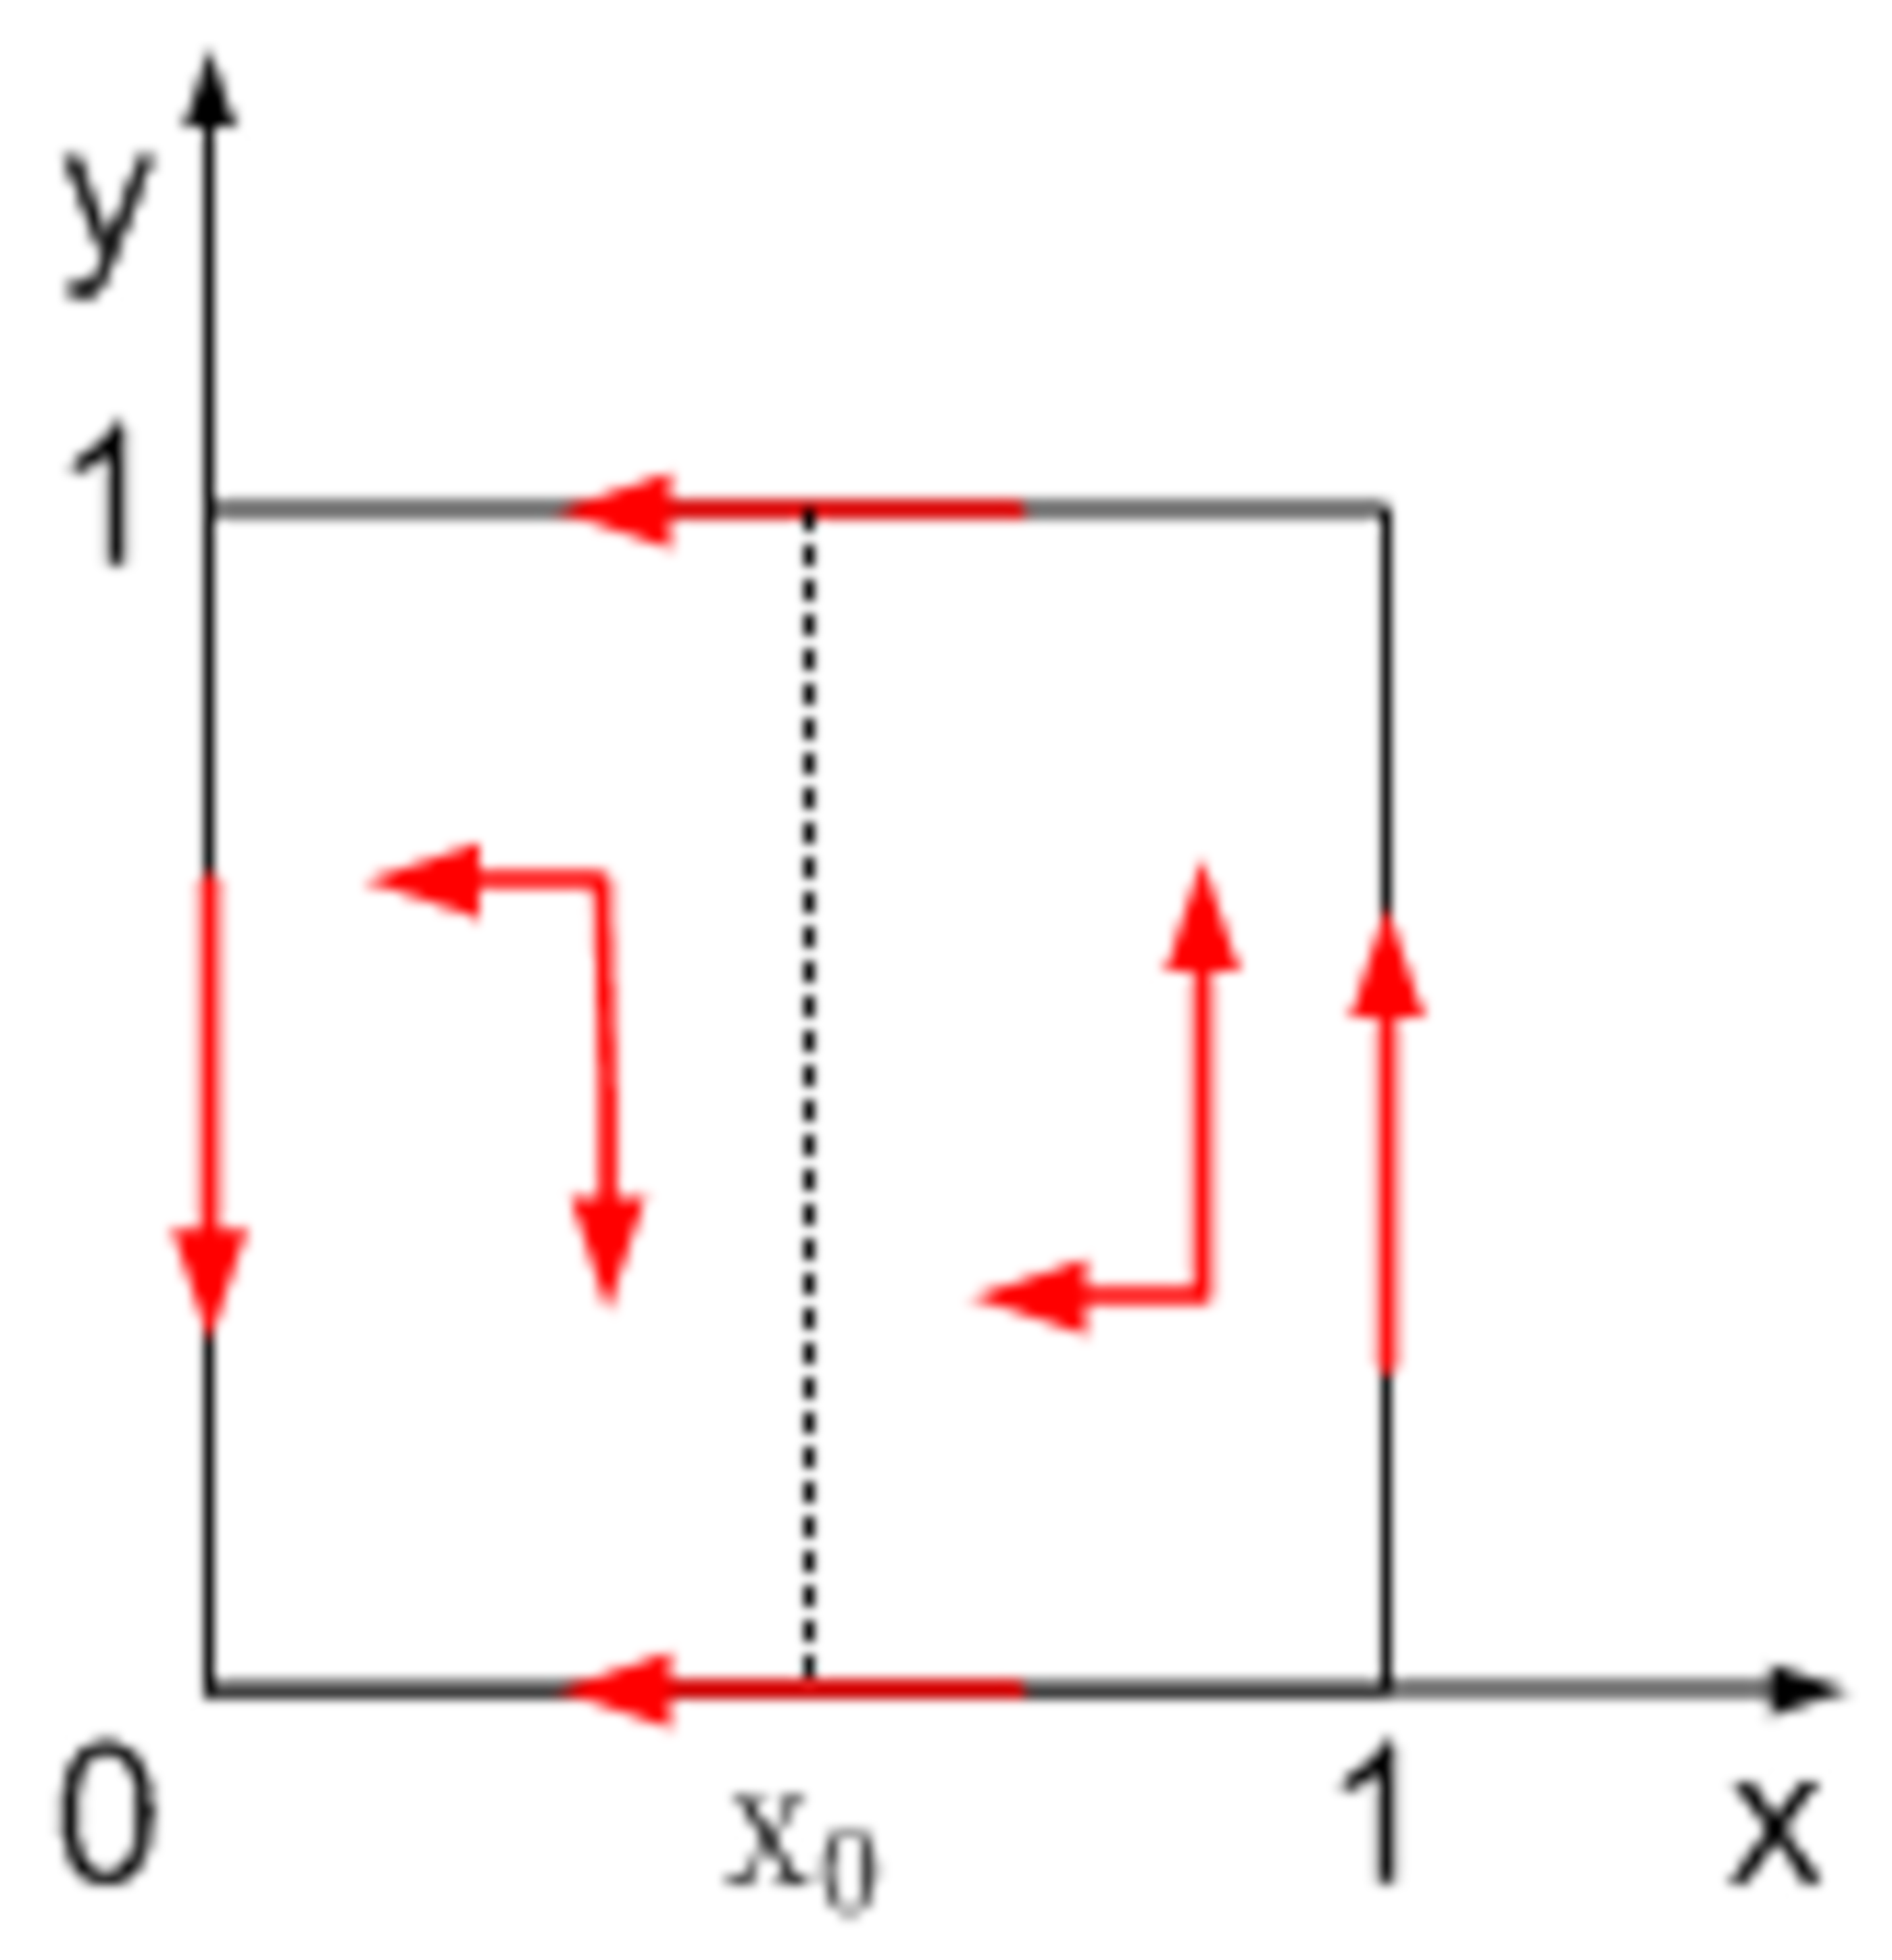
The incentive income obtained by the management department when adopting a supervision strategy is less than the difference between the cost paid by the supervision and the accident penalty caused by the unsafe production of the chemical plant. The penalty for unsafe production of the chemical plant is less than the difference between the safe production costs and unsafe production. At this point, the replicated dynamic equation has four equilibrium points, which are O(0,0), A(0,1), B(1,0), and C(1,1), and the local stability analysis is shown in Table 6. The phase diagram is shown in Figure 1.
According to the local stability in Table 6 and its corresponding phase diagram analysis in Figure 1, even if the management department supervises the chemical plant, monitoring its production process, and seriously fulfilling the safety inspection duties, the positive incentives obtained are not high in supervision costs. Based on the consideration of bounded rationality, the management department will choose a strategy that does not supervise. For chemical plants, even in the event of an accident, the penalty is no higher than the cost of the investment; thus, unsafe production is the best strategy choice based on maximizing profit. In real life, this phenomenon is widespread. Because the rewards have failed to meet expectations, the enthusiasm of the management department is reduced. The punishment for unsafe production of a chemical plant is large, and its goal of maximizing profits prompts the plant to choose to reduce the investment in safe production costs. For example, the use of non-conforming equipment reduces the cost of hiring professionals, equipment maintenance, and repair. This leads to a high incidence of chemical accidents. Through the above, the result of a stable evolutionary equilibrium between the management department and the chemical plant is (No supervision, Unsafe production).
- (2)
- Local stability analysis when
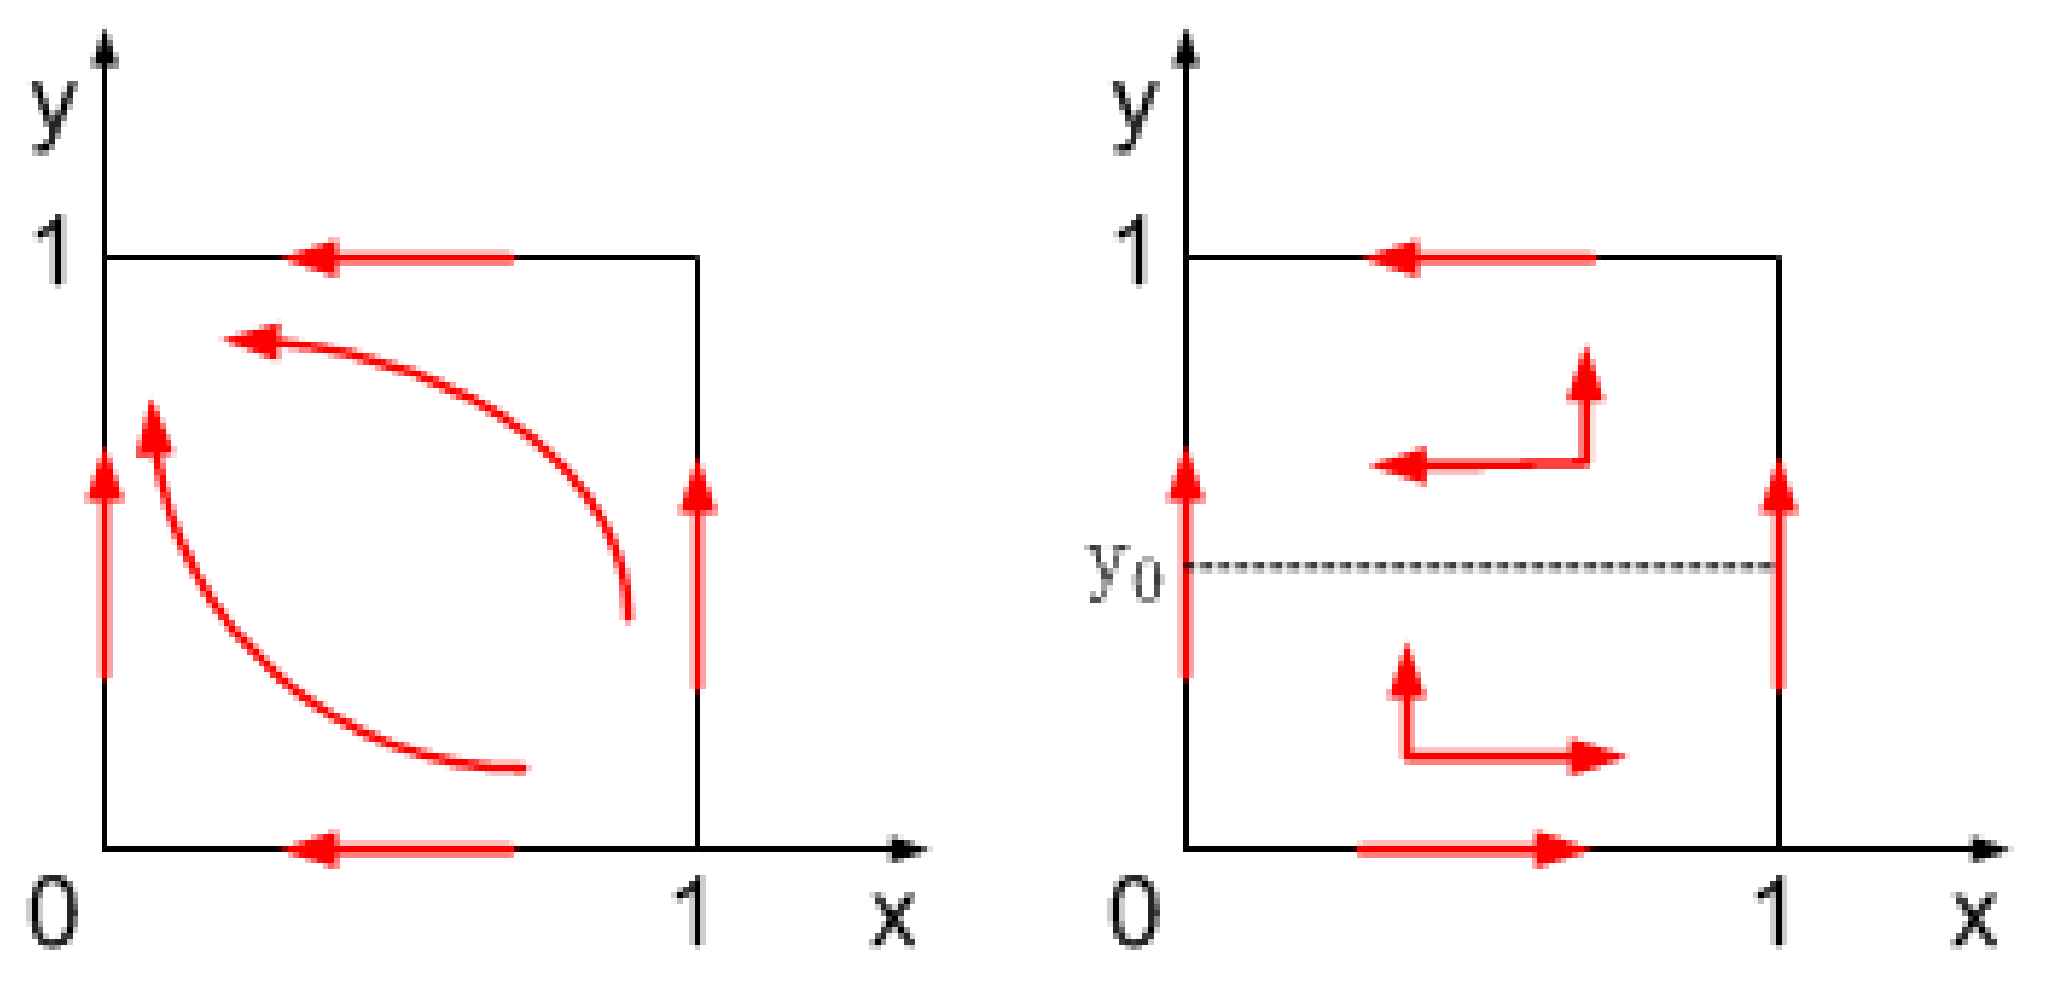
When , the incentive income obtained by the management department when adopting a supervision strategy is less than the difference between the cost paid by the supervision and the accident penalty caused by the unsafe production of the chemical plant. When , the incentive income obtained by the management department when adopting a supervision strategy is greater than the difference between the cost paid by the supervision and the accident penalty caused by the unsafe production of the chemical plant. In both cases, the penalty for unsafe production of the chemical plant is greater than the difference between the safe production costs and unsafe production. At this point, the replicated dynamic equation has four equilibrium points, which are O(0,0), A(0,1), B(1,0), and C(1,1), and the local stability analysis is shown in Table 7. The phase diagram in depicted in Figure 2, where “/” is preceded by the result of , and “/” is followed by the result of .
According to the local stability in Table 7 and its corresponding phase diagram analysis in Figure 2, although the management department pays a high amount of supervision costs, it achieves the purpose of supervising and guiding the safe production of the chemical plant. However, due to the high expected effect and higher performance appraisal indicators of the superior management department, the positive incentives received by the management department cannot compensate for the supervision costs. The enthusiasm of the management department will thus be greatly restricted, and the no-supervision strategy gradually becomes its best strategic choice. If chemical plants find out that production practices are unsafe, they will be subject to high economic fines, and those who have serious consequences will bear criminal responsibility. Based on the consideration of bounded rationality, plants will consciously choose a safe production strategy. Through the above, the result of a stable evolutionary equilibrium between the management department and the chemical plant itself is (No supervision, Safe production).
- (3)
- Local stability analysis when
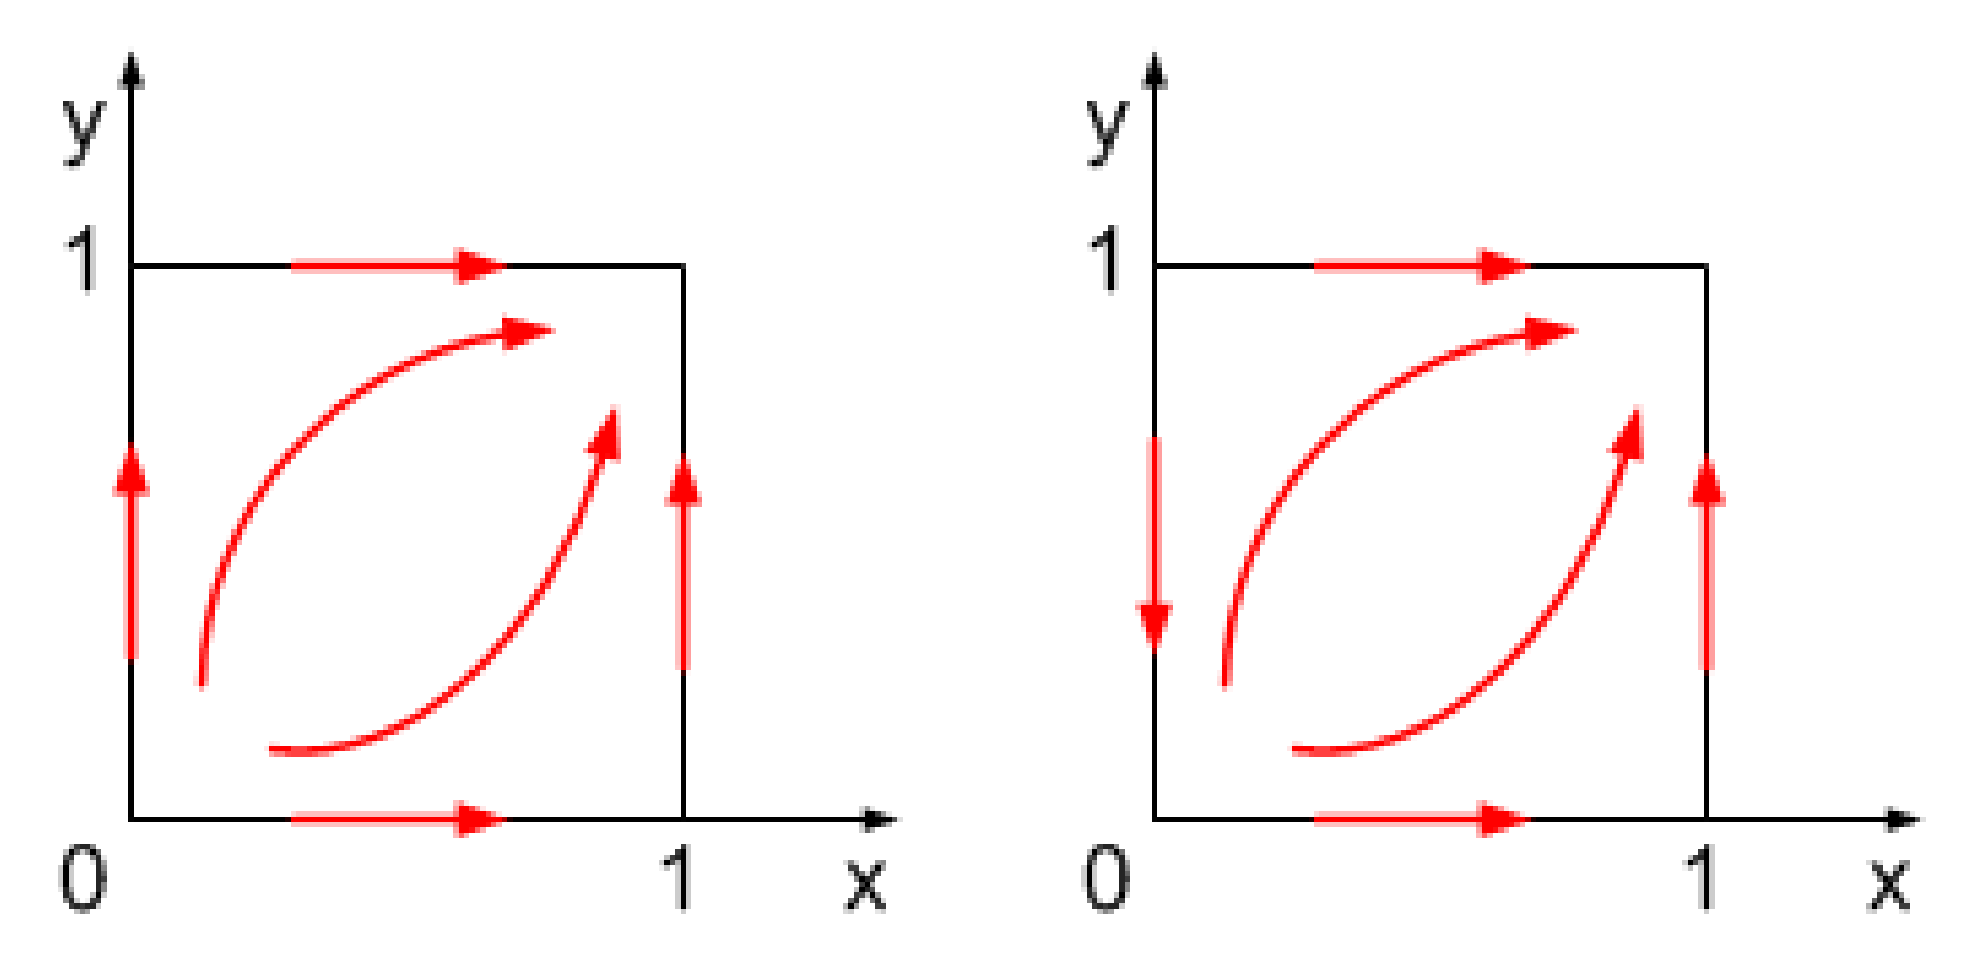
When , the punishment of a chemical plant in unsafe production is greater than the difference between the safe production costs and unsafe production. When , the penalty for a chemical plant in unsafe production is less than the difference between the safe production costs and unsafe production. In both cases, the incentive income obtained by the management department when adopting the supervision strategy is greater than the cost paid by the supervision. At this point, the replicated dynamic equation has four equilibrium points, which are O(0,0), A(0,1), B(1,0), and C(1,1), and the local stability analysis is shown in Table 8. The corresponding phase diagram is shown in Figure 3, where “/” is preceded by the result of , and “/” is followed by the result of .
According to the local stability in Table 8 and its corresponding phase diagram analysis in Figure 3, the management department pays sufficient attention to the security of the chemical plant and provides specialized funds for the management department. Not only can it provide funds for the supervision of the management department, but can even meet the funding needs of other parties. This provides material security for the smooth development of the work and supervision of the management department, and the supervision strategy becomes the best choice strategy. When the management department conducts safety production supervision of all aspects, the best strategy of the chemical plant is safe production. Through the above, the result of stable evolutionary equilibrium between the management department and the chemical plant is (Supervision, Safe production).
- (4)
- Local stability analysis when
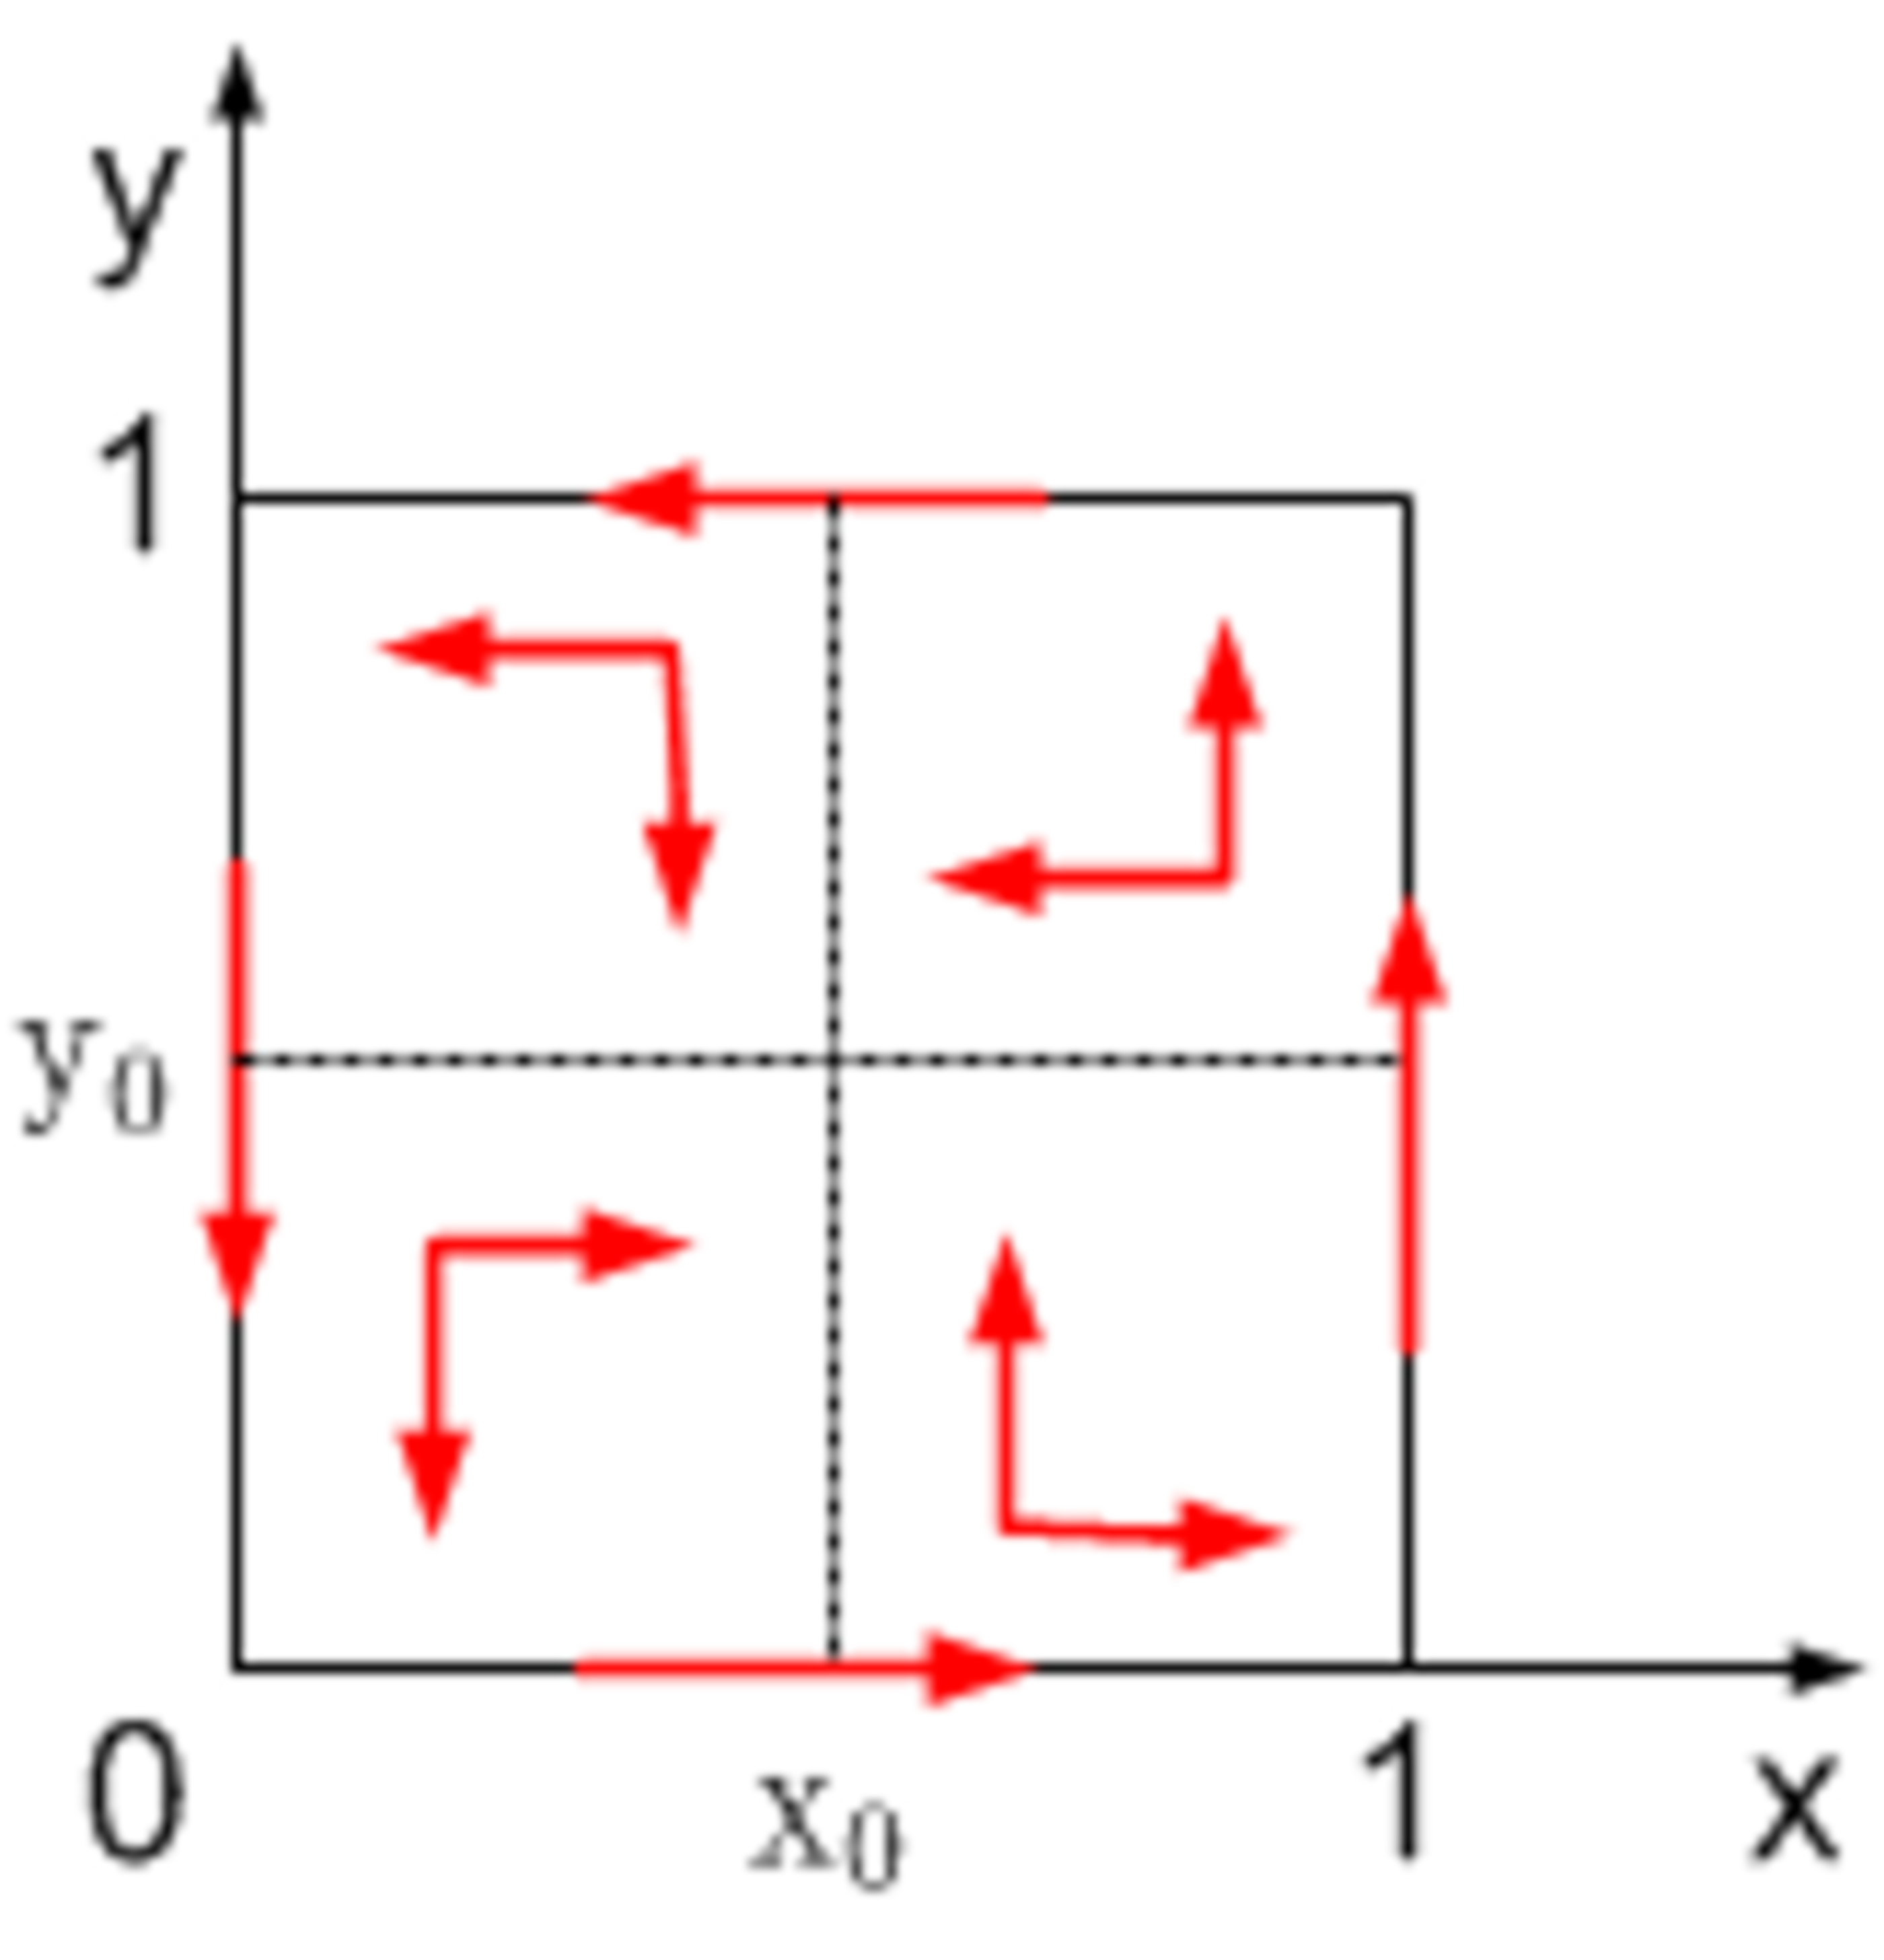
The incentive income obtained by the management department when adopting a supervision strategy is greater than the difference between the cost paid by the supervision and the accident penalty caused by the unsafe production of the chemical plant, but less than the cost paid by the supervision. When the chemical plant is in unsafe production, the penalty is less than the difference between the safe production cost and unsafe production. At this point, the replicated dynamic equation has four equilibrium points, which are O(0,0), A(0,1), B(1,0), and C(1,1), and the local stability analysis is shown in Table 9, with the phase diagram in Figure 4.
According to the local stability in Table 9 and its corresponding phase diagram analysis in Figure 4, none of the equilibrium points can satisfy the stable equilibrium condition of D > 0 and T < 0, so there is no stable point. At this time, a chemical plant faces greater production costs and difficulties in normal operation. The supervision strategy of the management department may not affect the decision-making of the plant, and the supervision strategy has to be relaxed to maintain stable growth of the local economy. The management department may not interfere too much with local economic development, nor will they provide a higher incentive policy or apply a strict performance appraisal strategy. Therefore, a roundabout phenomenon will occur between the management department and the chemical plant, and the two will not achieve a stable and balanced result. Through the above, the management department and the chemical plant will not achieve a stable evolutionary equilibrium. Thus, no simulation analysis is required.
2.4. A Case of Chemical Plant Safety Management
We selected a typical chemical plant in the current research chemical park and calculated data on a monthly basis. In the case of the management department choosing supervision, if the chemical plant is unsafe, they will be found and fined up to RMB 600,000 (f1 = 600,000), and the supervision cost of the management department will be RMB 100,000 (P = 100,000). If there is no safety incident, the management department will receive a positive incentive income of RMB 20,000 (Q = 20,000). The chemical plant will have a 20% (β = 0.2) probability of unsafe production when no supervision occurs. In the event of a safety incident, the management department will be fined RMB 300,000 (f2 = 300,000). The cost of safe production of the chemical plant will increase by RMB 200,000 compared to unsafe production (C1 − C2 = 200,000). The market sales income of chemical products produced by the chemical plant will be RMB 5 million (W = 5,000,000).
2.4.1. Current Game Results
According to the actual data in the case, that is, , and the stable analysis, the result of a stable evolutionary equilibrium between the management department and the chemical plant can be obtained as (No supervision, Unsafe production).
2.4.2. Expected Game Results
An appropriate increase in penalties (f1), adjusted to 1.01 million (f1’=1,010,000), and according to the actual data in the case, that is,, and the stable analysis, the result of a stable evolutionary equilibrium between the management department and the chemical plant can be obtained as (No supervision, Safe production).
3. Results and Discussion
3.1. Results
We combined the development status of a chemical plant, the difficulty faced by safety production management, as well as evolutionary game theory with the key players in the chemical industry system to analyze and study. The system elaborates the evolutionary strategy behavior orientation and steady state of the chemical safety management participants (management department and chemical plants) under various strategies. We analyzed the steady state of each game’s behavioral orientation in different situations.
3.2. Verification and Simulation
According to the actual parameters in the current production safety management of chemical plants, software was used to simulate evolutionary game results. The simulation results were consistent with the actual analysis results.
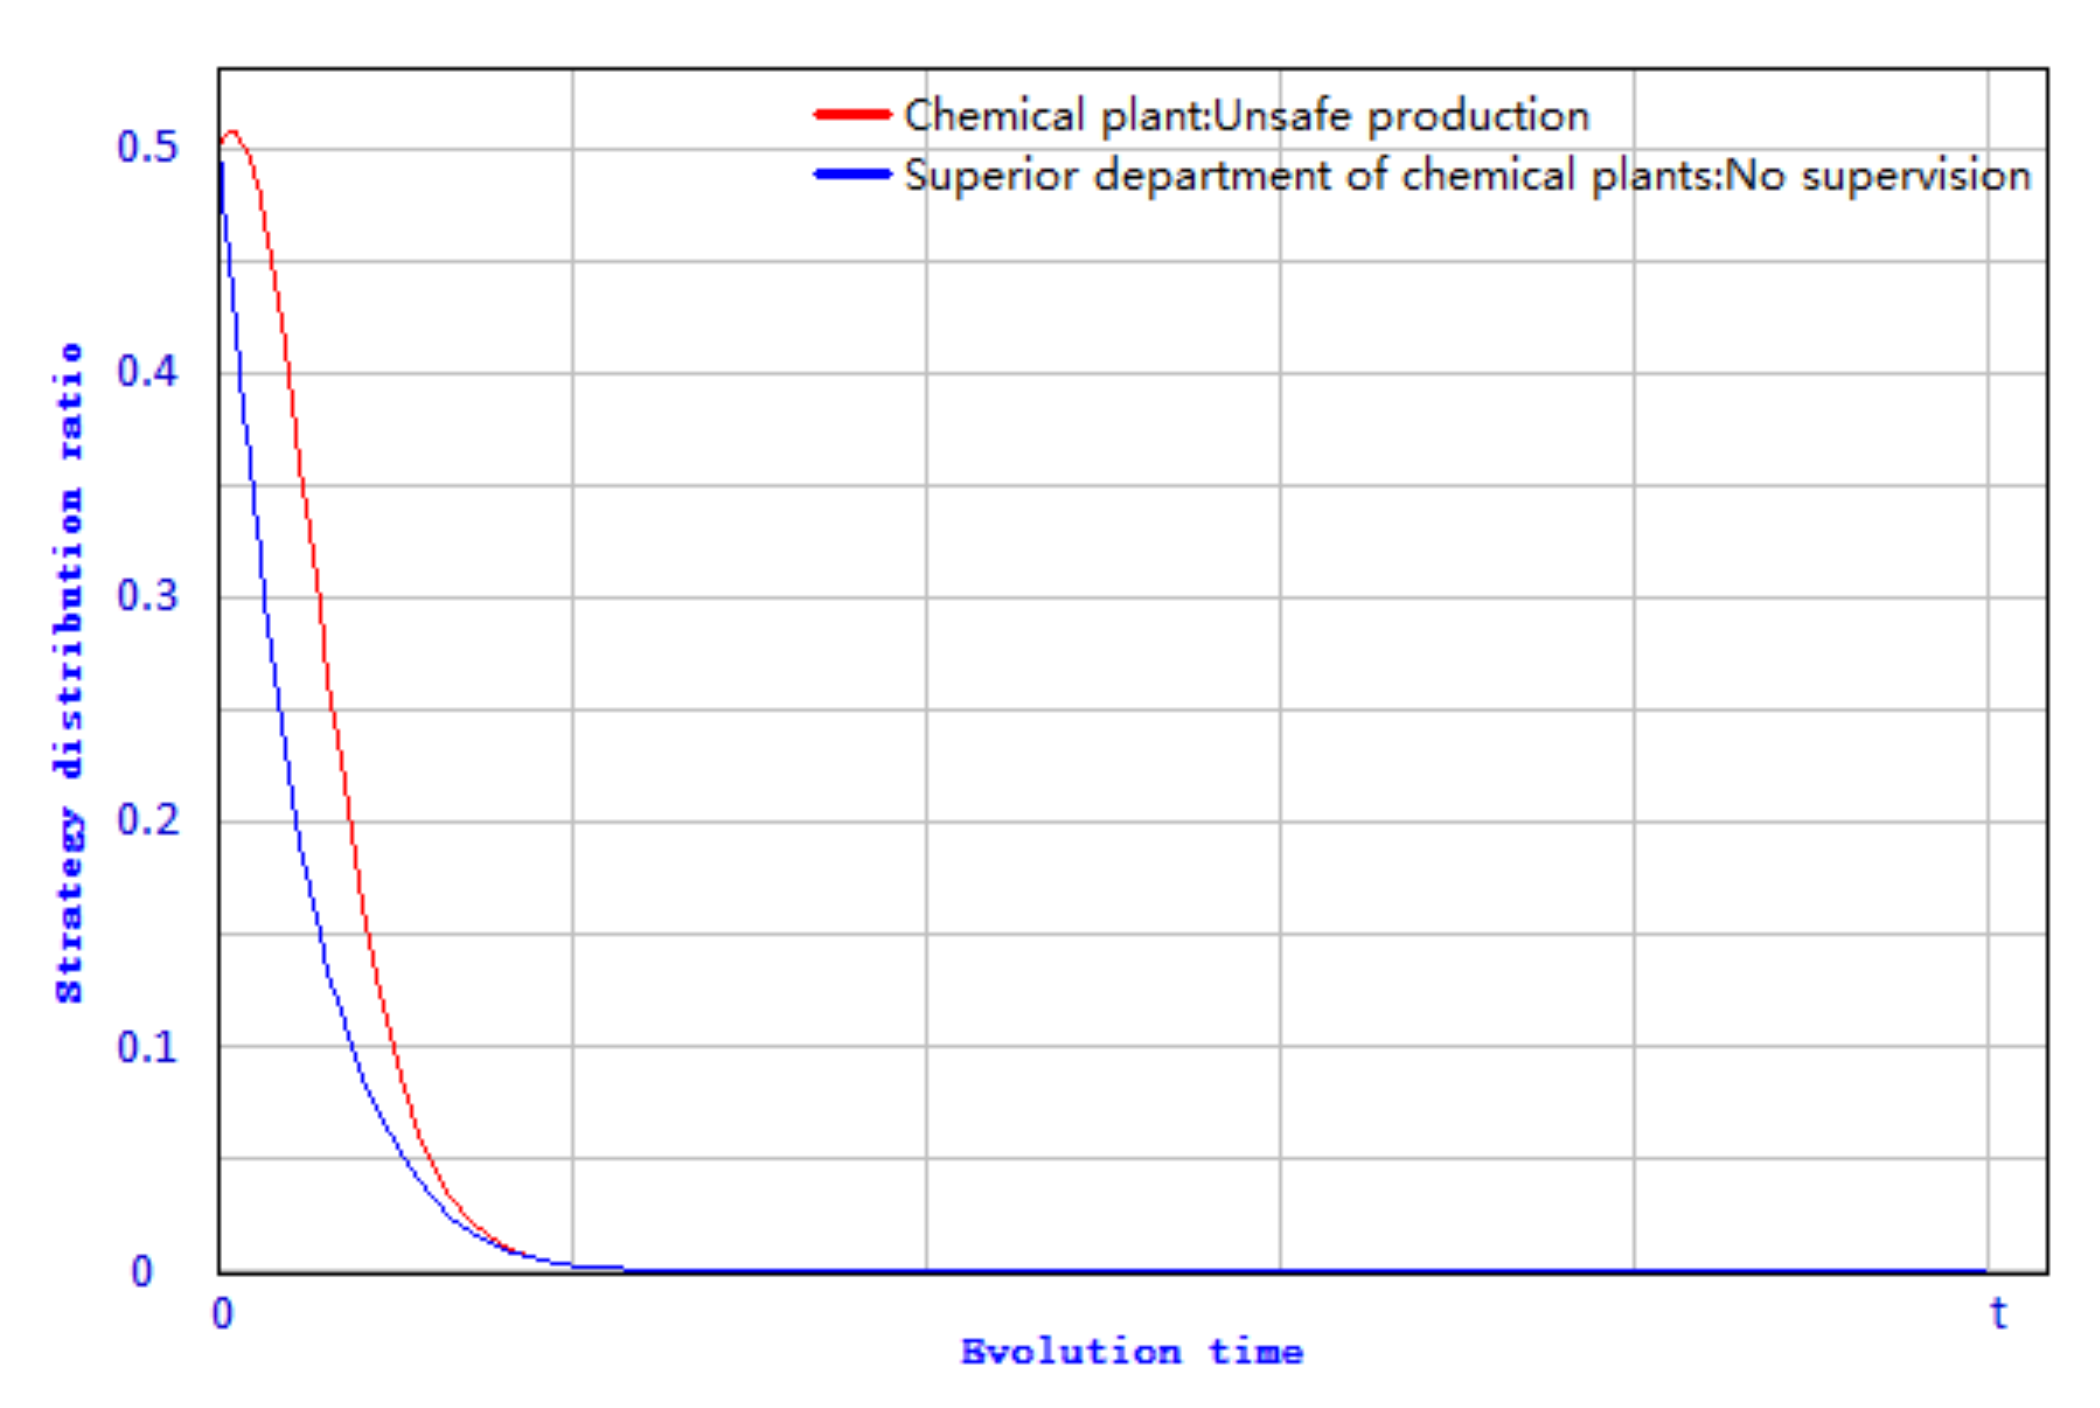
3.2.1. Simulation of the Current Game Results
The current values in the case are Q = 20,000; P = 100,000; β = 0.2; f1 = 600,000; f2 = 300,000; C1 − C2 = 200,000; and W = 5,000,000. The simulation graph is shown in Figure 5. The simulation results show that the evolutionary equilibrium results achieved by both parties in a certain evolution time are (No supervision, Unsafe production).
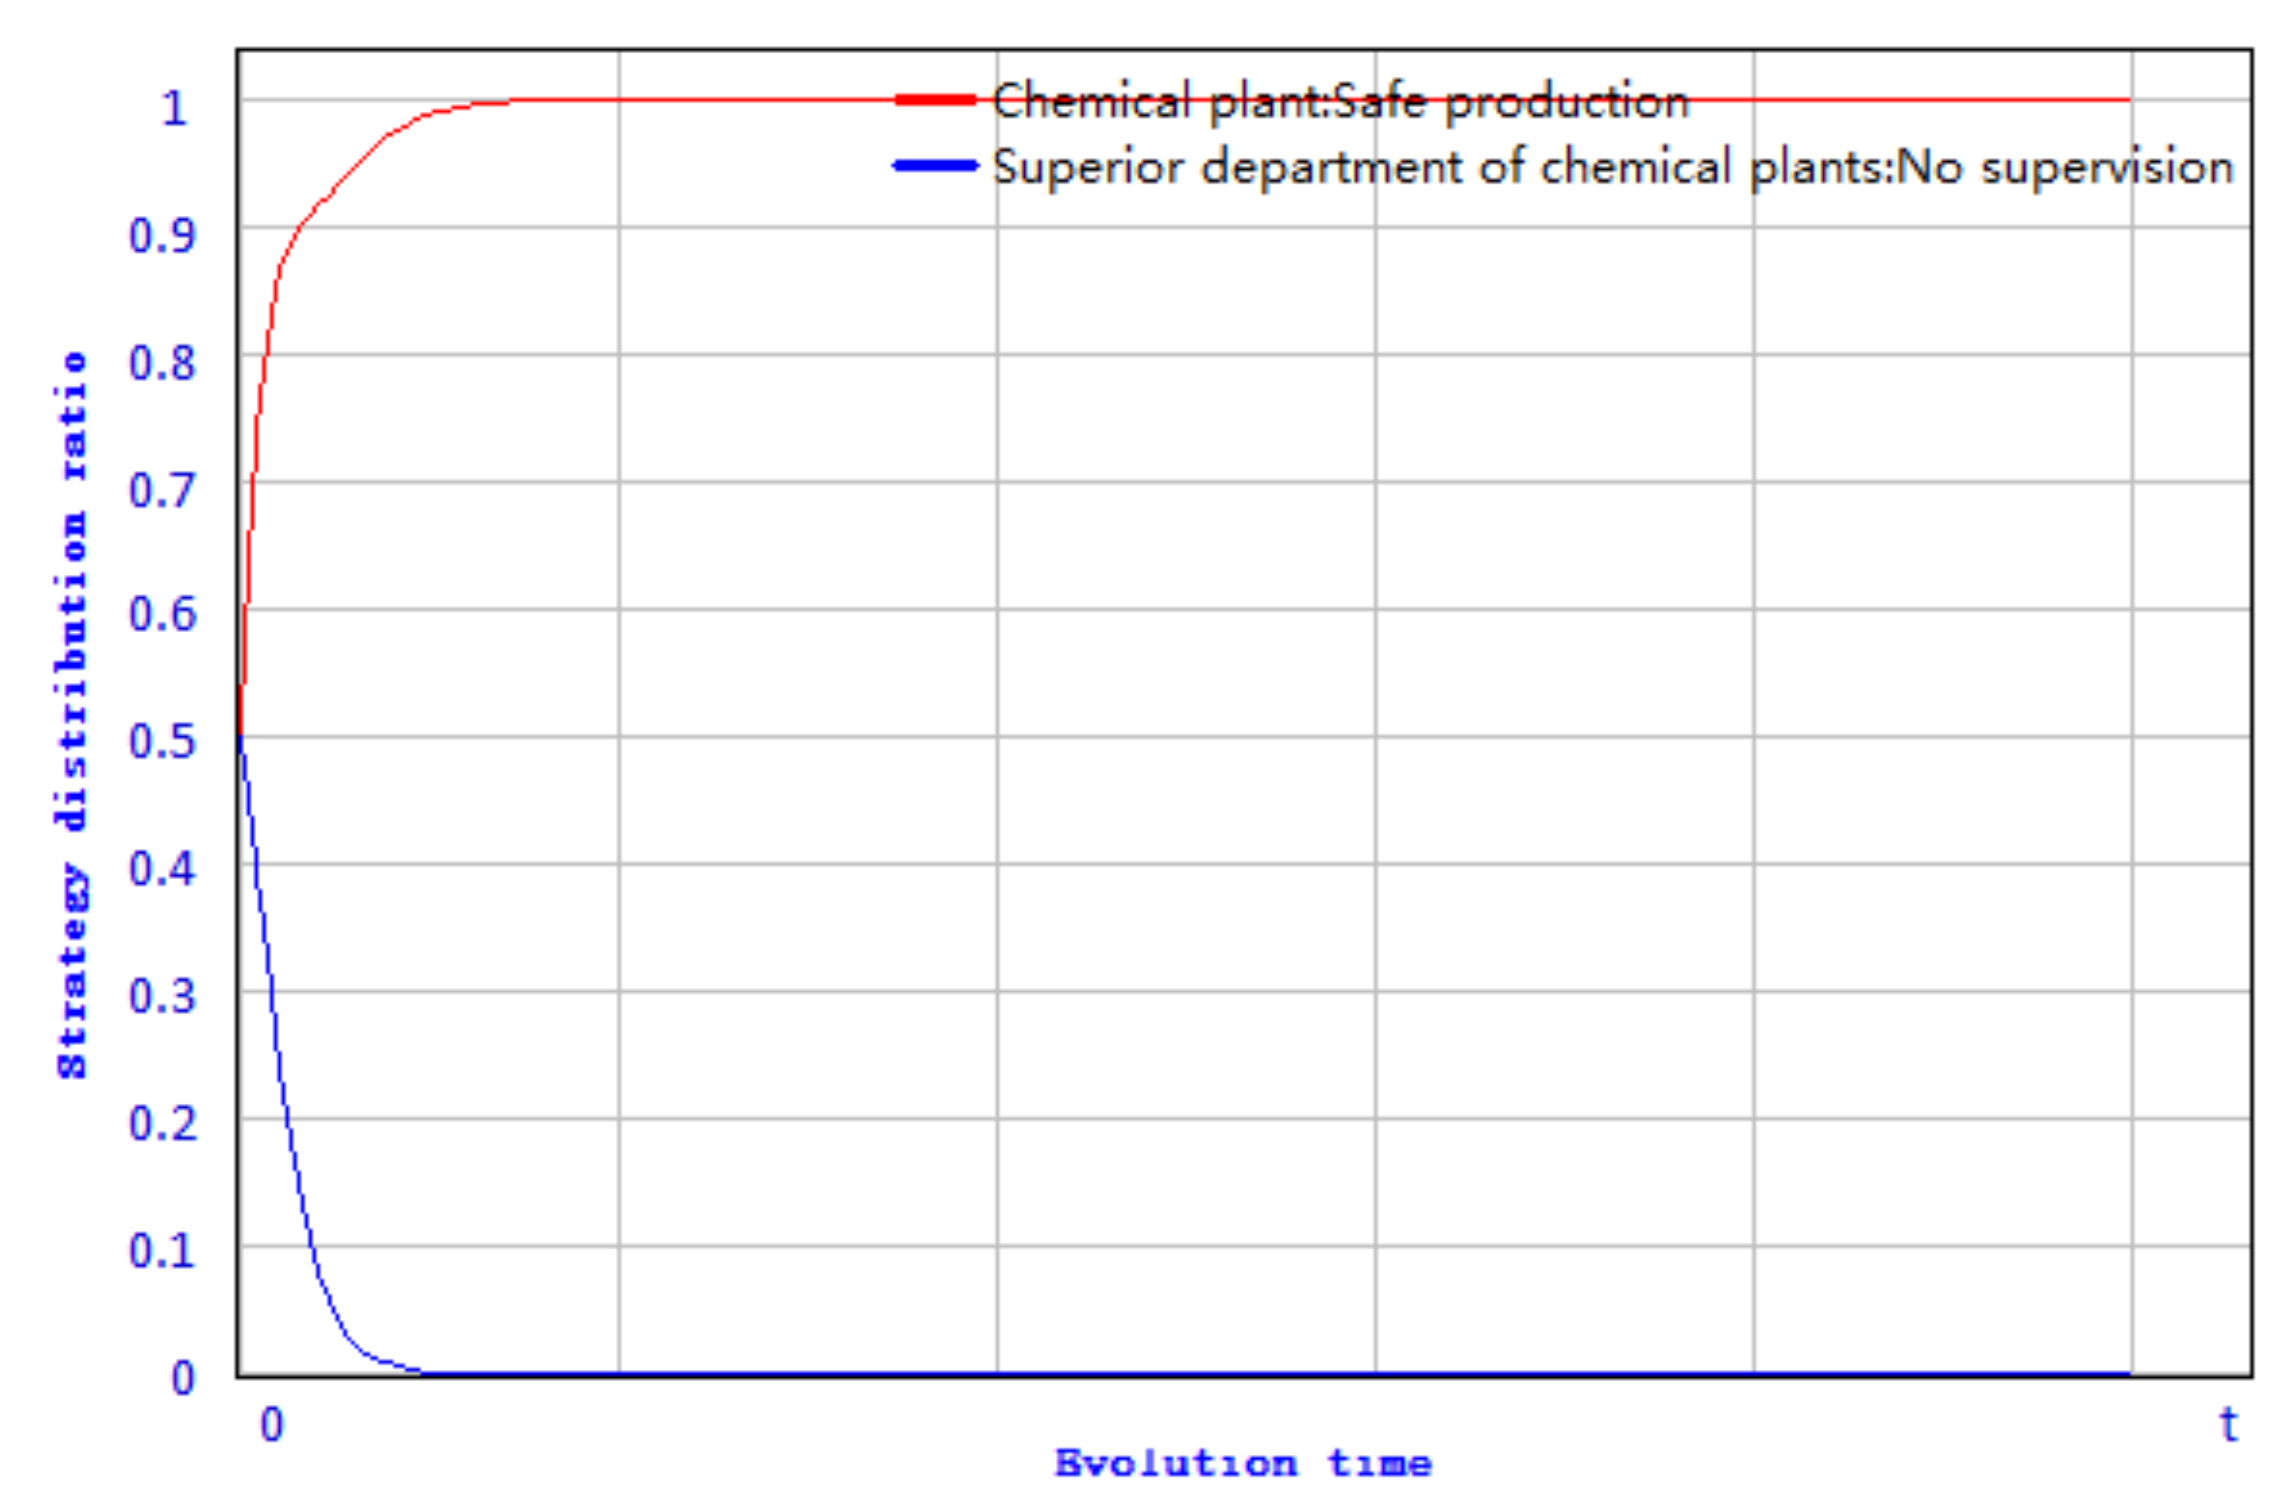
3.2.2. Simulation of the Expected Game Results
After adjustment, the values are Q = 20,000; P = 100,000; β = 0.2; f1 = 1,010,000; f2 = 300,000; C1 − C2 = 200,000; and W = 5,000,000. The simulation graph is shown in Figure 6, which shows that the evolutionary equilibrium results achieved by both parties in a certain evolution time are (No supervision, Safe production).
3.3. Discussion
The shortcoming of our study is including only two participants in the safety management of chemical production. There are three participants in a normal chemical safety system: the management department, the chemical plant, and the chemical plant employees. According to this paper, the motivation of strategic choice between the two participants can be analyzed. However, the strategic decisions of the three participants in the chemical production safety management analysis may occur simultaneously, and the strategic interaction among the three will be a more complex dynamic game process. Establishing the three participants’ dynamic game models is necessary to arrive at a conclusion that can fully reflect the system.
Another shortcoming of this study is that the current research on the game between the management department and the chemical plant does not consider the game between the management department and multiple chemical plants. Using a machine-learning-based mechanism will allow all chemical plants to choose the best equilibrium result in the case of non-cooperative games. At the lowest cost input, the overall safe production effect can be obtained. For example, Vamvakas et al. combined a machine learning provider selection process and distributed power resource management, and proposed a distributed iterative joint provider selection and resource management algorithm [39]. In addition, the use of available big data technology in various complex systems [40], combined with evolutionary games, makes the data analysis in chemical safety management clearer, more efficient, and the results obtained are closer to reality.
These will be the directions for further research, so that the conclusions will be more in line with the actual situation and more implementable.
4. Conclusions
In this paper, we illustrated the application of the evolutionary game model in the safety management of chemical production. Through the analysis of the evolutionary game model between two of the main players (the management department and the chemical plant itself) in the chemical industry, the strategic interaction was analyzed. Under the premise of limited rationality and social learning ability, the motivation of strategy selection between the two participants and the influence on the choice of the other party’s strategy were analyzed. The analysis process showed that the decision-making and supervision of the management department can guide the development of the event. If the management department obviously adopts a no supervision strategy, the chemical plant will quickly make unsafe production decisions. The management department can calculate the evolutionary game results of both parties based on the actual parameters in the current chemical production safety management. If the evolution results are not ideal, the parameters can be adjusted (such as the increase or decrease of rewards or penalties) to obtain the best game results with the lowest investment. Therefore, the application of this model provides an effective management basis and recommendations for the management department. This model is not only suitable for data analysis and policy formulation in the safety management process of the management department, but could also be applied to food industry safety management, including other similar safety management models. In the process of performing security management, only the parameters required by the model need to be clear, and the corresponding policies and states can be calculated using the model. Corresponding software can also be used to derive real-time policies and status based on real-time data. This provides strategies and recommendations for the safe management of chemical plants, and the cost of using these models and software is low.
There are three main directions for future research on this application. First, establish a dynamic evolutionary game model for the three participants in chemical safety (the management department, chemical plants, and chemical plant employees). Second, the current research is limited to pure strategic equilibrium models, and the evolutionary game of mixed strategic equilibrium must be considered in the future. Finally, a study combining mechanisms based on machine learning or big data techniques available in complex systems with evolutionary game models would make them more realistic and practical in the safety analysis of chemical production.
Author Contributions
Q.S. and P.J. proposed the computational model and wrote the paper; S.Z. contributed to the analysis of the results; all authors reviewed the manuscript. All authors have read and agreed to the published version of the manuscript.
Funding
This work was supported by the Provincial Key R&D Program of Zhejiang Province (No. 2017C03019), the National Key R&D Program of China (No. 2016YFC0201400), the Leading Talents of Science and Technology Innovation in Zhejiang Provincial Ten Thousands Plan (No. 2019R52040), the International Science and Technology Cooperation Program of Zhejiang Province for Joint Research in High-tech Plant (No. 2016C54007), the Zhejiang Joint Fund for Integrating of Informatization and Industrialization (No. U1509217), and the National Natural Science Foundation of China (No. U1609212).
Conflicts of Interest
There are no conflicts to declare.
References
- Eckerman, I. The Bhopal Saga—Causes and Consequences of the World’s Largest Industrial Disaster. Prehospital Disaster Med. 2005, 20, 92. [Google Scholar] [CrossRef] [Green Version]
- Khan, F.I.; Abbasi, S.A. Abbasi Major accidents in process industries and an analysis of causes and consequences. J. Loss Prev. Process Ind. 1999, 14, 85. [Google Scholar] [CrossRef]
- Willey, R.J.; Hendershotand, D.C.; Berger, S. The Accident in Bhopal: Observations 20 Years Later. Process Saf. Prog. 2010, 26, 180–184. [Google Scholar] [CrossRef] [Green Version]
- Shallcross, D.C. Using concept maps to assess learning of safety case studies—The Piper Alpha disaster. Educ. Chem. Eng. 2013, 8, e1–e11. [Google Scholar] [CrossRef]
- Paé-Cornell, M.E. Learning from the Piper Alpha accident: A postmortem analysis of technical and organizational factors. Insur. Math. Econ. 2010, 13, 215–232. [Google Scholar] [CrossRef]
- Cooke, D.L.; Rohleder, T.R. Learning from incidents: From normal accidents to high reliability. Syst. Dyn. Rev. 2010, 22, 213–239. [Google Scholar] [CrossRef]
- Tauseef, S.M.; Abbasiand, T.; Abbasi, S.A. Development of a new chemical process-industry accident database to assist in past accident analysis. J. Loss Prev. Process Ind. 2011, 24, 426–431. [Google Scholar] [CrossRef]
- Holmstrom, D.; Altamirano, F.; Banks, J.; Joseph, G.; Kaszniak, M.; Mackenzie, C.; Shroff, R.; Cohen, H.; Wallace, S.J. CSB investigation of the explosions and fire at the BP texas city refinery on March 23, 2005. Process Saf. Prog. 2006, 25, 345–349. [Google Scholar] [CrossRef]
- Manca, D.; Brambilla, D. Dynamic simulation of the BP Texas City refinery accident. J. Loss Prev. Process Ind. 2012, 25, 950–957. [Google Scholar] [CrossRef]
- Pittman, W.; Zhe, H.; Harding, B.; Rosas, C.; Jiang, J.; Pineda, A.; Mannan, M.S. Lessons to be learned from an analysis of ammonium nitrate disasters in the last 100 years. J. Hazard. Mater. 2014, 280, 472–477. [Google Scholar] [CrossRef]
- Jain, P.; Rogers, W.J.; Pasman, H.J.; Mannan, M.S. A Resilience-Based Integrated Process Systems Hazard Analysis (RIPSHA) Approach: Part I Plant System Layer. Process Saf. Environ. Prot. 2018, 116. [Google Scholar] [CrossRef]
- Moore, D.A. Security Risk Assessment Methodology for the petroleum and petrochemical industries. J. Loss Prev. Process Ind. 2013, 26, 1685–1689. [Google Scholar] [CrossRef]
- Scott, D. Guidelines for Analyzing and Managing the Security Vulnerabilities of Fixed Chemical Sites Center for Chemical Process Safety (CCPS) of the American Institute of Chemical Engineers, 2003 216 pp, £56, ISBN 0 8169 0877 X. Process Saf. Environ. Prot. 2004, 82, 320. [Google Scholar] [CrossRef]
- Jaeger, C.D. Chemical facility vulnerability assessment project. J. Hazard. Mater. 2003, 104, 207–213. [Google Scholar] [CrossRef]
- Carroll, J.V. Vulnerability Assessment of the U.S. Transportation Infrastructure that Relies on the Global Positioning System. J. Navig. 2003, 56, 185–193. [Google Scholar] [CrossRef]
- Norman, T.L. Risk Analysis and Security Countermeasure Selection; CRC Press: Boca Raton, FL, USA, 2015. [Google Scholar]
- Sklet, S. Comparison of some selected methods for accident investigation. J. Hazard. Mater. 2004, 111, 29–37. [Google Scholar] [CrossRef]
- Brambilla, S.; Manca, D. The Viareggio LPG railway accident: Event reconstruction and modeling. J. Hazard. Mater. 2010, 182, 346–357. [Google Scholar] [CrossRef]
- Rathnayaka, S.; Khanand, F.; Amyotte, P. SHIPP methodology: Predictive accident modeling approach. Part II. Validation with case study. Process Saf. Environ. Prot. 2011, 89, 75–88. [Google Scholar] [CrossRef]
- Khakzad, N.; Khanand, F.; Amyotte, P. Dynamic safety analysis of process systems by mapping bow-tie into Bayesian network. Process Saf. Environ. Prot. 2013, 91, 46–53. [Google Scholar] [CrossRef]
- Tan, Q.; Chen, G.; Lei, Z.; Fu, J.; Li, Z. Dynamic accident modeling for high-sulfur natural gas gathering station. Process Saf. Environ. Prot. 2014, 92, 565–576. [Google Scholar] [CrossRef]
- Jain, P.; Pasman, H.J.; Waldram, S.P.; Rogers, W.J.; Mannan, M.S. Did we learn about risk control since Seveso? Yes, we surely did, but is it enough? An historical brief and problem analysis. J. Loss Prev. Process Ind. 2016, S0950423016302674. [Google Scholar] [CrossRef]
- Ayyub, B.M. Systems Resilience for Multihazard Environments: Definition, Metrics, and Valuation for Decision Making. Risk Anal. 2014, 34, 340–355. [Google Scholar] [CrossRef] [PubMed]
- Bottelberghs, P.H. Risk analysis and safety policy developments in the Netherlands. J. Hazard. Mater. 2000, 71, 59. [Google Scholar] [CrossRef]
- Zarei, E.; Azadeh, A.; Khakzad, N. Aliabadi, M.M.; Mohammadfam, I. Dynamic safety assessment of natural gas stations using Bayesian network. J. Hazard. Mater. 2017, 321, 830–840. [Google Scholar] [CrossRef] [Green Version]
- Cahen, B. Implementation of new legislative measures on industrial risks prevention and control in urban areas. J. Hazard. Mater. 2006, 130, 293–299. [Google Scholar] [CrossRef]
- Khan, F.I.; Amyotte, P.R. I2SI: A comprehensive quantitative tool for inherent safety and cost evaluation. J. Loss Prev. Process Ind. 2005, 18, 310–326. [Google Scholar] [CrossRef]
- Khakzad, N.; Khanand, F.; Amyotte, P. Quantitative risk analysis of offshore drilling operations: A Bayesian approach. Saf. Sci. 2013, 57, 108–117. [Google Scholar] [CrossRef]
- Abimbola, M.; Khan, F.; Khakzad, N.; Butt, S. Safety and risk analysis of managed pressure drilling operation using Bayesian network. Saf. Sci. 2015, 76, 133–144. [Google Scholar] [CrossRef]
- Goerlandt, F.; Khakzadand, N.; Reniers, G. Validity and validation of safety-related quantitative risk analysis: A review. Saf. Sci. 2016, 99, 127–139. [Google Scholar] [CrossRef]
- De, D.V.; Fiévez, C. ARAMIS project: A more explicit demonstration of risk control through the use of bow-tie diagrams and the evaluation of safety barrier performance. J. Hazard. Mater. 2006, 130, 220–233. [Google Scholar]
- Delvosalle, C.; Fievez, C.; Pipart, A.; Debray, B. ARAMIS project: A comprehensive methodology for the identification of reference accident scenarios in process industries. J. Hazard. Mater. 2006, 130, 200. [Google Scholar] [CrossRef] [PubMed]
- Abdolhamidzadeh, B.; Abbasi, T.; Rashtchian, D.; Abbasi, S.A. A new method for assessing domino effect in chemical process industry. J. Hazard. Mater. 2010, 184, 416. [Google Scholar] [CrossRef] [PubMed]
- Hamilton, J. Game theory: Analysis of conflict, by Myerson, R. B., Cambridge: Harvard University Press. Manag. Decis. Econ. 2010, 13, 369. [Google Scholar] [CrossRef]
- Malhotra, D. Decision Making Using Game Theory: An Introduction for Managers by Anthony Kelly. Acad. Manag. Rev. 2003, 30, 193–194. [Google Scholar] [CrossRef]
- Dixit Avinash, K.; Susan, S. Games of Strategy; W.W. Norton & Co.: New York, NY, USA, 1999. [Google Scholar]
- Friedman, D. A simple testable model of double auction markets. J. Econ. Behav. Organ. 1991, 15, 47–70. [Google Scholar] [CrossRef]
- Ritzberger, K.; Weibull, J.W. Evolutionary Selection in Normal-Form Games. Econometrica 1995, 63, 1371–1399. [Google Scholar] [CrossRef] [Green Version]
- Vamvakas, P.; Tsiropoulou, E.E.; Papavassiliou, S. Dynamic Provider Selection & Power Resource Management in Competitive Wireless Communication Markets. Mob. Netw. Appl. 2017, 23, 86–99. [Google Scholar]
- Thai, M.T.; Wu, W.; Xiong, H. Big Data in Complex and Social Networks; CRC Press: Boca Raton, FL, USA, 2016. [Google Scholar]
Figure 1.
Phase diagram of .

Figure 2.
Phase diagram of and .

Figure 3.
Phase diagram of and .

Figure 4.
Phase diagram of .

Figure 5.
Current game simulation analysis evolution processes.

Figure 6.
Optimal game simulation analysis evolution processes.


Table 1.
Behavioral choice payoff matrix for both parties.
| Participant (i) | |||
|---|---|---|---|
| G1 (x) | G2 (1 − x) | ||
| Participant (j) | G3 (y) | g13,g’13 | g23,g’23 |
| G4 (1 − y) | g14,g’14 | g24,g’24 | |
Table 2.
Specific values of a, b, c, and d at the local equilibrium point.
| Equilibrium Points | a | b | c | d |
|---|---|---|---|---|
| (0,0) | a1 | 0 | 0 | d1 |
| (0,1) | a2 | 0 | 0 | d2 |
| (1,0) | a3 | 0 | 0 | d3 |
| (1,1) | a4 | 0 | 0 | d4 |
| (p1,p2) | 0 | b5 | c5 | 0 |
Table 3.
Expressions of determinant (D) and trace (T) of local equilibrium points.
| Equilibrium Points | D | T |
|---|---|---|
| (0,0) | a1d1 | a1 + d1 |
| (0,1) | a2d2 | a2 + d2 |
| (1,0) | a3d3 | a3 + d3 |
| (1,1) | a4d4 | a4 + d4 |
| (p1,p2) | −b1c1 | 0 |
Table 4.
The behavior selection and payoff matrix.
| Management Department (i) | |||
|---|---|---|---|
| Supervision (x) | No Supervision (1 − x) | ||
| Chemical plant (j) | Safe production (y) | W − C1, Q − P | W − C1, 0 |
| Unsafe production (1 − y) | W − C2 − f1, Q − P | W − C2 − βf1, −βf2 | |
Table 5.
Expressions of determinant D and trace T of the local equilibrium points.
| Equilibrium Points | D | T |
|---|---|---|
| (0,0) | ||
| (0,1) | ||
| (1,0) | ||
| (1,1) | ||
| (p1,p2) | 0 |
Table 6.
Local stability analysis table on .
| Equilibrium Point | D | T | Local Stability |
|---|---|---|---|
| (0,0) | + | − | Stable point |
| (0,1) | − | Uncertainty | Saddle point |
| (1,0) | + | + | Unstable point |
| (1,1) | − | Uncertainty | Saddle point |
Table 7.
Local stability analysis table of and .
| Equilibrium Point | D | T | Local Stability |
|---|---|---|---|
| (0,0) | −/+ | Uncertainty/+ | Saddle point/Unstable point |
| (0,1) | +/+ | −/− | Stable point/Stable point |
| (1,0) | +/− | +/Uncertainty | Unstable point/Saddle point |
| (1,1) | −/− | Uncertainty/Uncertainty | Saddle point/Saddle point |
Table 8.
Local stability analysis table of and .
| Equilibrium Point | D | T | Local Stability |
|---|---|---|---|
| (0,0) | +/− | +/Uncertainty | Unstable point/Saddle point |
| (0,1) | −/+ | Uncertainty/+ | Saddle point/Unstable point |
| (1,0) | −/− | Uncertainty/Uncertainty | Saddle point/Saddle point |
| (1,1) | +/+ | −/− | Stable point/Stable point |
Table 9.
Local stability analysis table of .
| Equilibrium Point | D | T | Local Stability |
|---|---|---|---|
| (0,0) | − | Uncertainty | Saddle point |
| (0,1) | − | Uncertainty | Saddle point |
| (1,0) | − | Uncertainty | Saddle point |
| (1,1) | − | Uncertainty | Saddle point |
© 2020 by the authors. Licensee MDPI, Basel, Switzerland. This article is an open access article distributed under the terms and conditions of the Creative Commons Attribution (CC BY) license (http://creativecommons.org/licenses/by/4.0/).
Share and Cite
MDPI and ACS Style
Song, Q.; Jiang, P.; Zheng, S. Application of Evolutionary Game Theory in Safety Management of Chemical Production. Processes 2020, 8, 472. https://0-doi-org.brum.beds.ac.uk/10.3390/pr8040472
AMA Style
Song Q, Jiang P, Zheng S. Application of Evolutionary Game Theory in Safety Management of Chemical Production. Processes. 2020; 8(4):472. https://0-doi-org.brum.beds.ac.uk/10.3390/pr8040472
Chicago/Turabian StyleSong, Qiusheng, Peng Jiang, and Song Zheng. 2020. "Application of Evolutionary Game Theory in Safety Management of Chemical Production" Processes 8, no. 4: 472. https://0-doi-org.brum.beds.ac.uk/10.3390/pr8040472
Note that from the first issue of 2016, this journal uses article numbers instead of page numbers. See further details here.