Article

Fabrication of Ultrathin MoS2 Nanosheets and Application on Adsorption of Organic Pollutants and Heavy Metals

1
Fujian Provincial Engineering Research Center of Rural Waste Recycling Technology, College of Environment & Resources, Fuzhou University, Fuzhou 350116, China
2
Research Institute of Photocatalysis, Fuzhou University, Fuzhou 350116, China
*
Author to whom correspondence should be addressed.
Submission received: 10 April 2020 / Revised: 23 April 2020 / Accepted: 24 April 2020 / Published: 26 April 2020
(This article belongs to the Special Issue Gas, Water and Solid Waste Treatment Technology)

Abstract

:
Owing to their peculiar structural characteristics and potential applications in various fields, the ultrathin MoS2 nanosheets, a typical two-dimensional material, have attracted numerous attentions. In this paper, a hybrid strategy with combination of quenching process and liquid-based exfoliation was employed to fabricate the ultrathin MoS2 nanosheets (MoS2 NS). The obtained MoS2 NS still maintained hexagonal phase (2H-MoS2) and exhibited evident thin layer-structure (1–2 layers) with inconspicuous wrinkle. Besides, the MoS2 NS dispersion showed excellent stability (over 60 days) and high concentration (0.65 ± 0.04 mg mL−1). The MoS2 NS dispersion also displayed evident optical properties, with two characteristic peaks at 615 and 670 nm, and could be quantitatively analyzed with the absorbance at 615 nm in the range of 0.01–0.5 mg mL−1. The adsorption experiments showed that the as-prepared MoS2 NS also exhibited remarkable adsorption performance on the dyes (344.8 and 123.5 mg g−1 of qm for methylene blue and methyl orange, respectively) and heavy metals (185.2, 169.5, and 70.4 mg g−1 of qm for Cd2+, Cu2+, and Ag+). During the adsorption, the main adsorption mechanisms involved the synergism of physical hole-filling effects and electrostatic interactions. This work provided an effective way for the large-scale fabrication of the two-dimensional nanosheets of transition metal dichalcogenides (TMDs) by liquid exfoliation.

1. Introduction

Given the special structure and potential applications, two-dimensional materials have drawn plenty of concerns [1,2], such as graphene, boron nitride, and molybdenum disulfide. Among them, the ultrathin molybdenum disulfide (MoS2) nanosheets, which exhibit an evident layered structure, have attracted ample attentions because of their excellent performance on several fields, such as catalysis, sensors, and pollution remediation [1,3]. Recently, the ultrathin MoS2 nanosheets were reported to show excellent prospects in pollution control [3,4]. Therefore, it was urgent to explore an effective method to produce ultrathin MoS2 nanosheets.
To date, a few methods have been reported for efficient preparation of ultrathin MoS2 nanosheets [5,6,7,8,9,10], for example, mechanical exfoliation, sputtering, atomic layer deposition, chemical methods, and liquid-based exfoliation. In spite of the excellent performance of the prepared monolayer or few-layer MoS2 nanosheets through mechanical methods, the production efficiency was rather low, which severely limited the large-scale applications. Meanwhile, although most of the chemical methods like hydrothermal and solvent thermal routes could produce large-scale few-layer MoS2 nanosheets, they generally needed strict reaction control, such as high temperature and pressure. Instead, due to the controllable operation and high production, liquid-based exfoliation was regarded as the most promising way for the production of ultrathin MoS2 in large scale. According to previous studies [7,8], the solvent showed a significant impact on the exfoliation of MoS2. Among which, pyrrolidone-based solvents like N-methyl-2-pyrrolidone displayed excellent MoS2 exfoliation efficiency with 0.3 mg mL−1 of MoS2 nanosheets concentration, because they showed similar surface energy with MoS2. Nevertheless, considering their significant environmental risk, high toxicity and high-boiling points of the pyrrolidone-based solvents probably limited the large-scale application. To replace these toxic solvents, a number of polar solvents that own low boiling point and molecular weight were tested, such as water, methanol, ethanol, and isopropanol [11,12]. Unfortunately, given the different surface energy between the MoS2 and polar solvents, most of the polar solvents showed dissatisfactory exfoliation efficiency [11]. Interestingly, it was reported that the MoS2 exfoliation efficiency in the mixed solution with two of the polar micromolecular solvents was much better than those in the single solvent [13,14]. Meanwhile, it was worth noting that the MoS2 exfoliation efficiency could be significantly improved when some organic small molecules, surfactants, or polymers were added in the polar micromolecular solvents, such as sodium cholate, Tween 80, Tween 85, sodium naphthalenide, Brij 30, Brij 700, Triton X-100, and so on [15,16,17]. Nevertheless, the strong van der Waals interaction between the MoS2 layers still limited the MoS2 nanosheets production.
Recently, owing to the effective break of the van der Waals force between the MoS2 layers, quenching was found to be an effective way to exfoliate the graphene analogues [18,19,20,21]. Previous investigation showed that the high-quality ultrathin graphene sheets were fabricated by rapidly cooling the hot bulk graphite and pre-expanded graphite in aqueous solutions of NH4HCO3 and hydrazine hydrate, respectively [19,20]. Meanwhile, the boron nitride and MoS2 nanosheets were also synthesized via the rapid quenching of hot bulk boron nitride and MoS2 in the liquid N2 [18,21]. Although the production efficiency of the nanosheets was dissatisfactory, we suspect that if the bulk MoS2 was pretreated with the quenching process, the exfoliation efficiency of MoS2 nanosheets in the polar micromolecular solvents could be significantly improved.
Herein, a hybrid strategy with the combination of quenching process and liquid-based exfoliation was employed to fabricate the ultrathin MoS2 nanosheets. The microstructures, morphology, and optical properties were analyzed. In addition, the adsorption performance of dyes and heavy metals was also discussed.

2. Material and Methods

2.1. Materials

Ammonium tetrathiomolybdate ((NH4)2MoS4) was provided by Sam Chemical Technology Co., Ltd. (Shanghai, China). Hydrazine monohydrate (N2H4·H2O) was provided by Aladdin Reagent Co., Ltd. (Shanghai, China). Sodium hydroxide (NaOH), sulfuric acid (H2SO4), nitric acid (HNO3), methylene blue (MB), methyl orange (MO), AgNO3, CuSO4, and CdCl2 were obtained from Sinopharm Chemical Reagent Co. Ltd. (Shanghai, China). The double-distilled water was prepared with a Milli-Q water purification system (Milli-Q® Reference, Millipore, Billerica, Massachusetts, USA).

2.2. Fabrication of the MoS2 Nanosheets

The MoS2 nanosheets (MoS2-NS) were prepared through a novel combined method including calcination at high temperature, quenching with liquid nitrogen, and ultrasonic-assisted peeling with hydrazine hydrate. Firstly, 4.000 g of (NH4)2MoS4 was calcinated under nitrogen atmosphere at 800 °C for 5 h with a rate of 5 °C/min and then a black powder (named bulk MoS2) was obtained. After that, the high-temperature bulk MoS2 was quickly transferred into a Dewar bottle containing liquid nitrogen until the liquid nitrogen gasified completely. Subsequently, the pre-expanded bulk MoS2 was transferred into a serum bottle with 100 mL of hydrazine hydrate and the bottle was sonicated at a frequency of 40 kHz for 24 h. After centrifugation, the residual MoS2 powders were added into another serum bottle with deionized water and sonicated for 12 h (In addition, the recycled hydrazine hydrate can be reused in a new procedure.). Finally, the resulting suspensions were centrifuged at 3000 rpm for 2 h and then the dark green MoS2-NS dispersions were obtained. After dialyzed with dialysis tubing with 3000 dalton of molecular weight cut off, the obtained ultimate green dispersions were close to 7 of pH and stored in the fridge at 4 °C.

2.3. Adsorption Batch Experiments

Adsorption isotherm batch experiments were carried out in a 40-mL serum bottle containing 10 mL liquid with 0.1 g L−1 of the adsorbent concentration. The adsorption isotherm for MB and MO was conducted under 25 °C in the range of 0.5 to 50 mg L−1 of the MB and MO concentration and the pH was adjusted to 6.0 ± 0.1 with 1 M H2SO4 solution, while the experiments for heavy metals were conducted under 25 °C with metal concentration from 0.5 to 30 mg L−1 and the pH was adjusted to 5.0 ± 0.1 with 1 M H2SO4 solution. After sealed with polytetrafluoroethylene (PTFE) caps, all the bottles were shaken at 250 rpm for 6 h. At sampling points, one bottle was taken out. After filtered with 0.22 μm glass fiber filters (Tianjin Branch billion Lung Experimental Equipment Co., Ltd., Tianjin, China), the MB/MO concentrations were determined by UV-vis spectroscopy (UV-1780, SHIMADZU, Japan) at 664/464 nm, while the residual Cu2+/Cd2+/Ag+ concentrations were analyzed with ICP-MS (XSERIES 2, Thermo). The adsorption isotherms data were treated with Langmuir and Freundlich models [22,23]. The experiments for the adsorption kinetics study were operated at 25 °C and 6.0 ± 0.1/5.0 ± 0.1 of pH (adjusted with 1 M H2SO4 solution) in 300 mL dyes/heavy metals solution (20 mg L−1 for dyes and 15 mg L−1 for heavy metals). All the samples were shaken at 250 rpm for 6 h. At sampling points, 1.5 mL of the solution was taken out and then filtered through the filters. The residual dyes/heavy metals concentrations were determined with ICP-MS. The adsorption kinetics data were treated with the pseudo-first order kinetic and pseudo-second-order non-linear kinetic models.
To study the effects of pH values (2–10)/(3–7) on dyes/heavy metals adsorption, the batch experiments were conducted at 25 °C in a serum bottle with 20 mg L−1/15 mg L−1 of dyes/heavy metals concentration and 0.10 g L−1 of adsorbents.

2.4. Characterization

The X-ray powder diffraction (XRD) data of the bulk MoS2 and MoS2-NS were tested with X-ray powder diffractometer (MiniFlex600, Rigaku, Milwaukee, Wisconsin, USA) coupled with a Cu line at 40 kV and 40 mA.
The microstructural features of prepared bulk MoS2 and MoS2-NS were observed with field emission scanning electron microscope (FESEM, Nova NanoSEM 230, FEI, Hillsboro, Oregon, USA), atomic force microscope (AFM, 5500, Agilent USA), and transmission electron microscope (TEM, TECNAI G2F20, FEI, Hillsboro, Oregon, USA).
The Raman data of bulk MoS2 and MoS2-NS were recorded by a confocal laser Raman microscopy (Invia Reflex, Renishaw, UK) with 532 nm of laser wavelength and 0.6 mW of laser energy.
The X-ray photoelectron spectroscopy (XPS) data were recorded with X-ray photoelectron spectrometer (ESCALAB 250, Thermo Scientific, Waltham, Massachusetts, USA) coupled with the Al Ka radiation at 15 kV and 51 W. The binding energies were confirmed by using the C1s component as the reference and the binding energy of C-C/H bonds were set at 284.5 eV.
The concentrations of MoS2-NS dispersions were analyzed using UV-vis spectrophotometer (UV-2500, Shimadzu, Japan).
The Brunauer–Emmett–Teller (BET) surface areas of the bulk MoS2 and MoS2-NS were obtained from the analysis of N2-adsorption isotherms at 77 K using the N2 physisorption analyzer (ASAP2020, Micromeritics, Norcross, Georgia, USA).

3. Results and Discussion

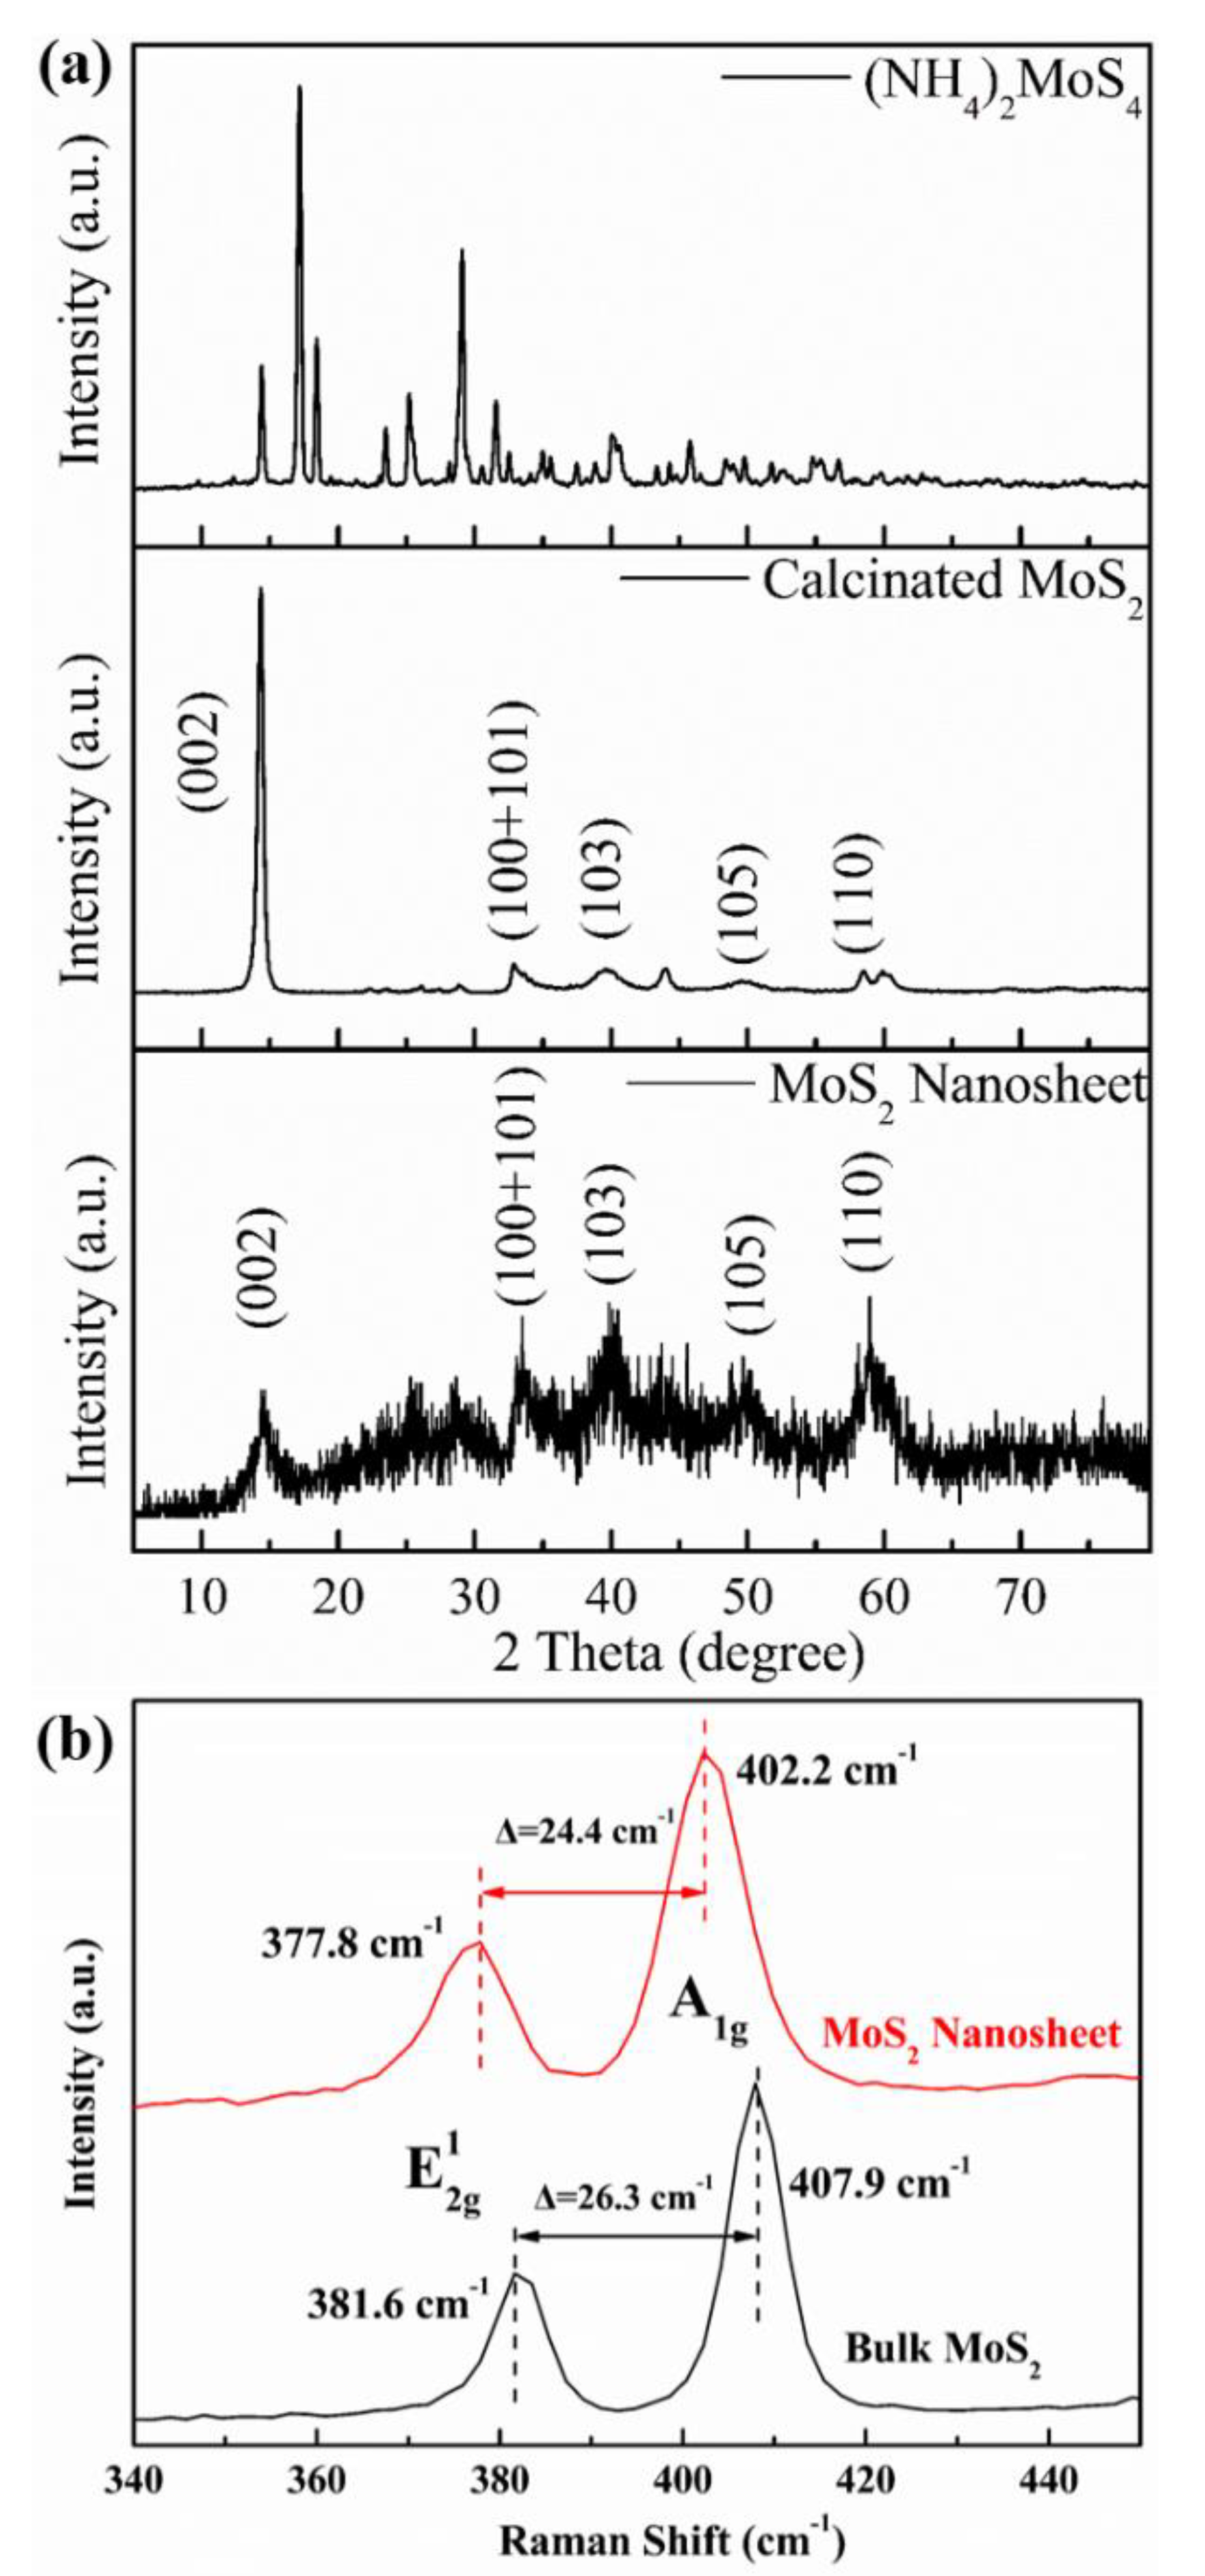
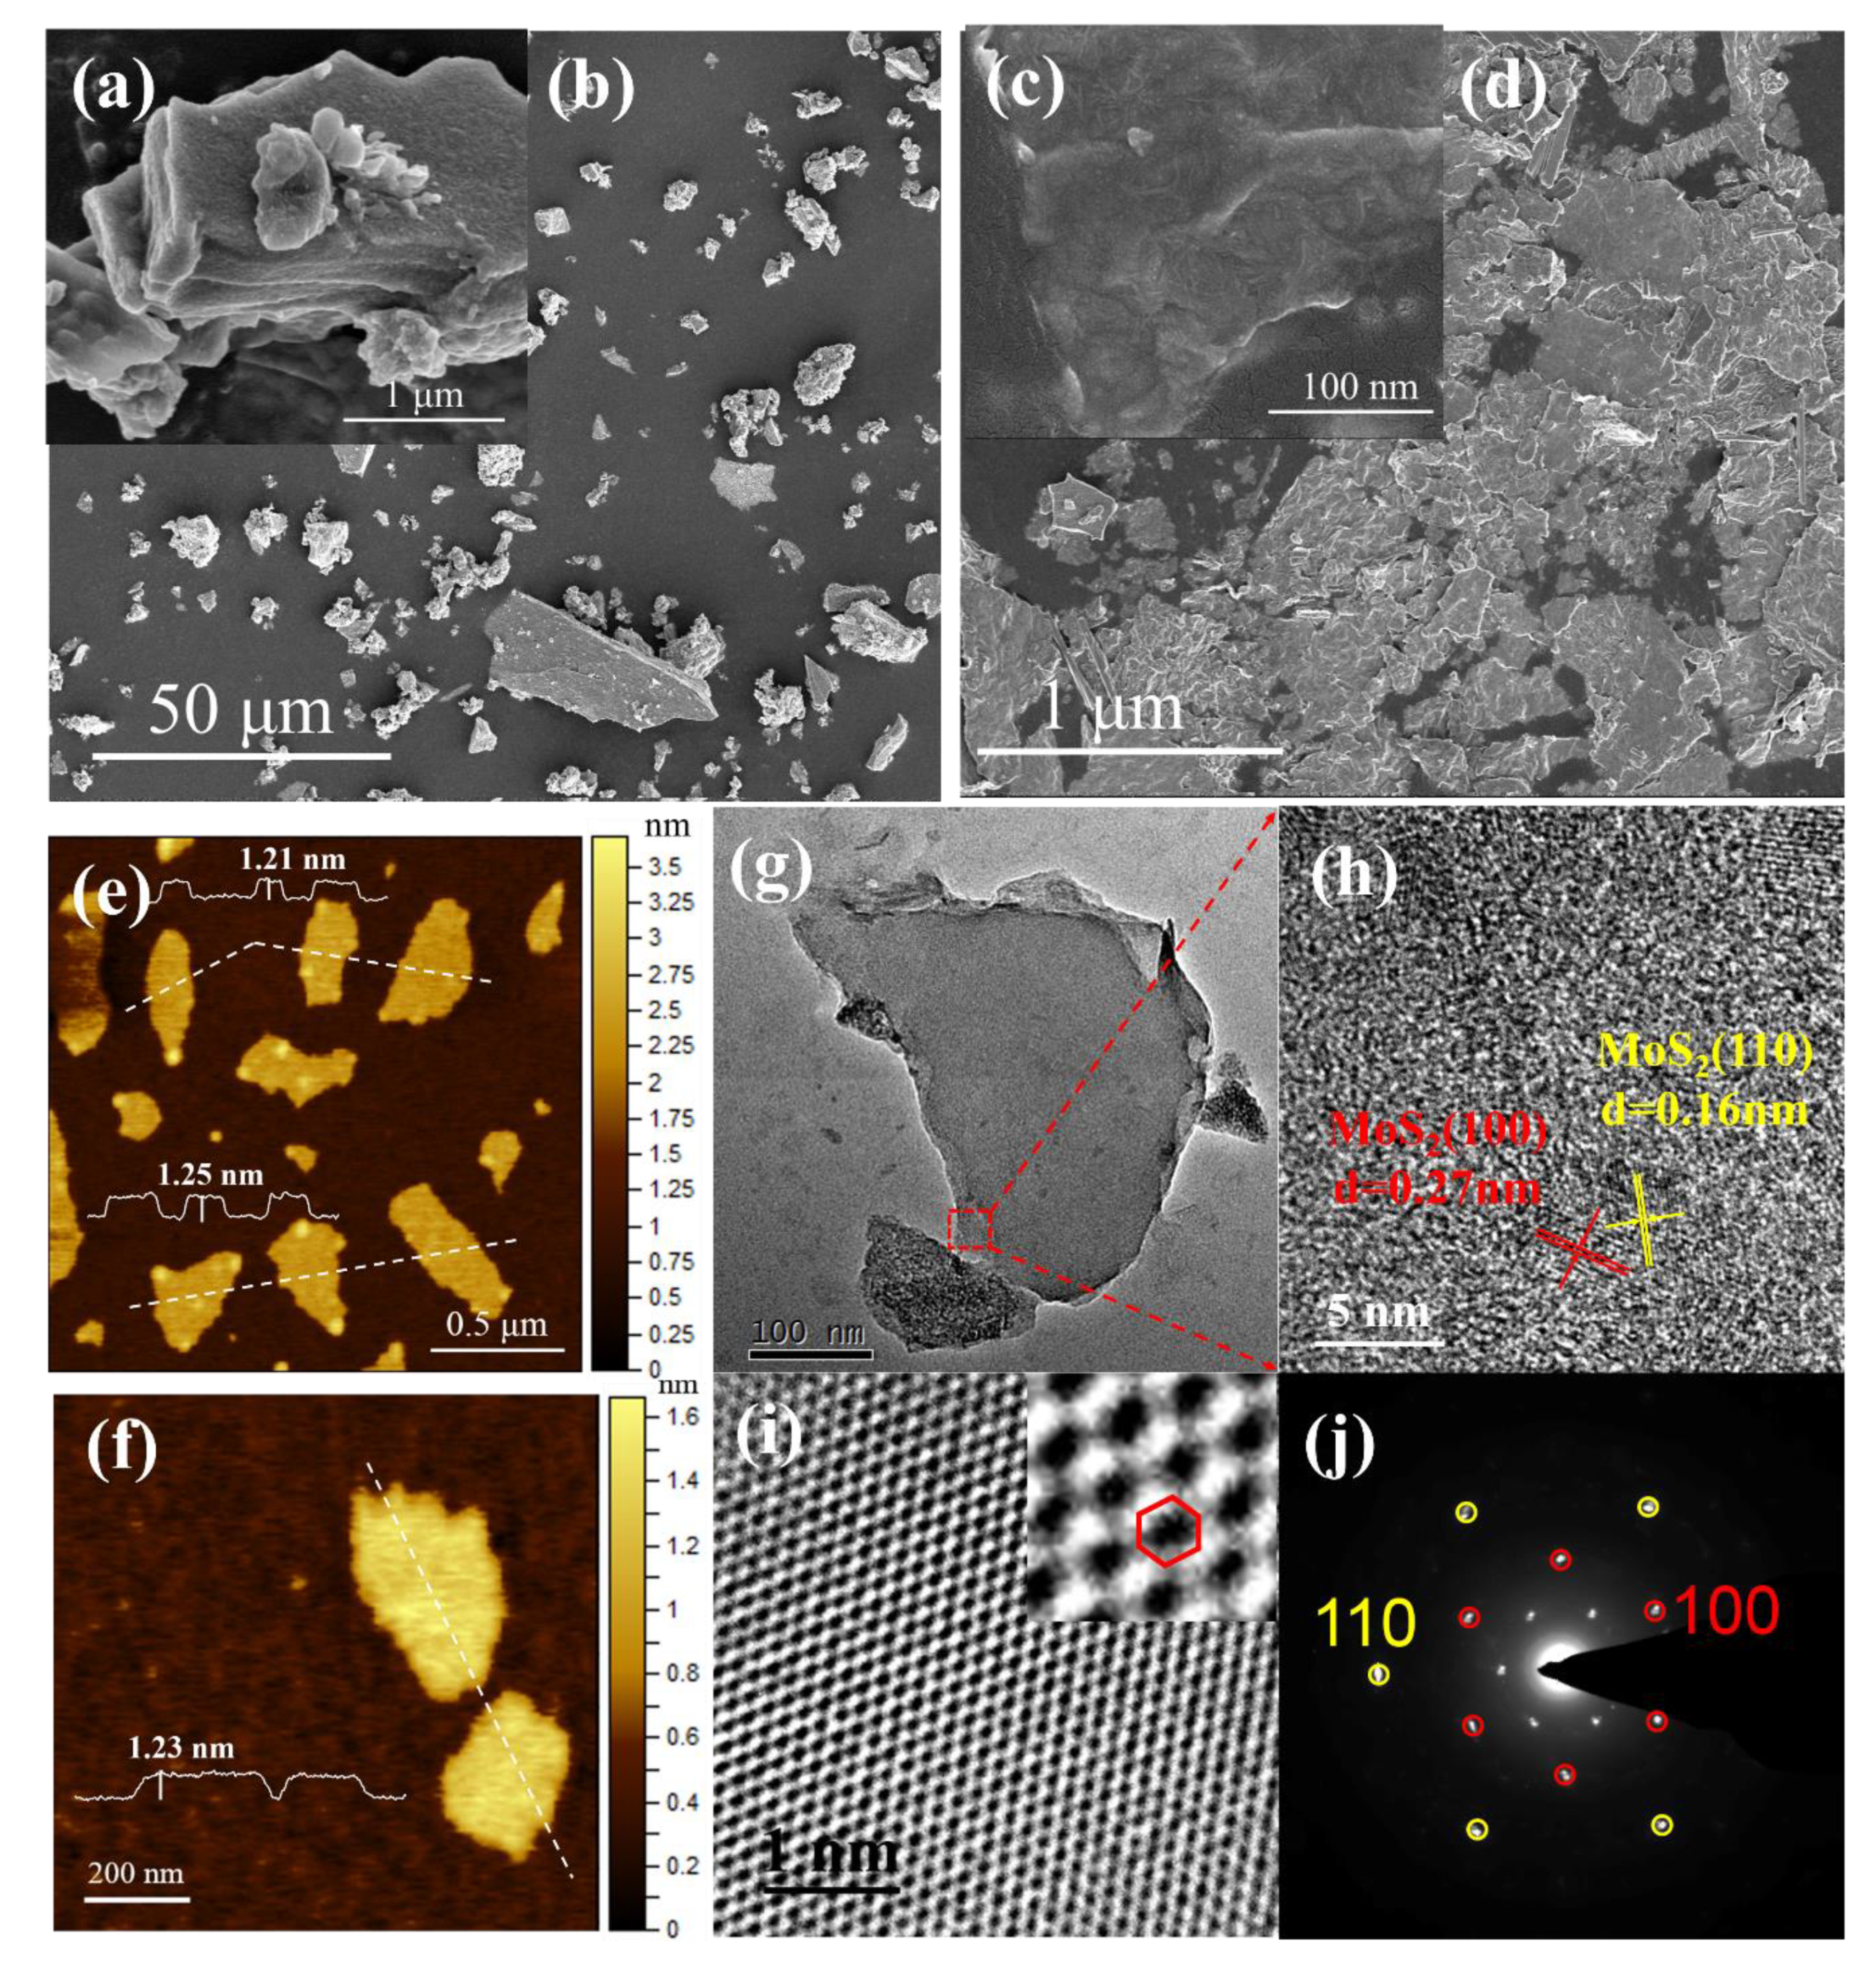
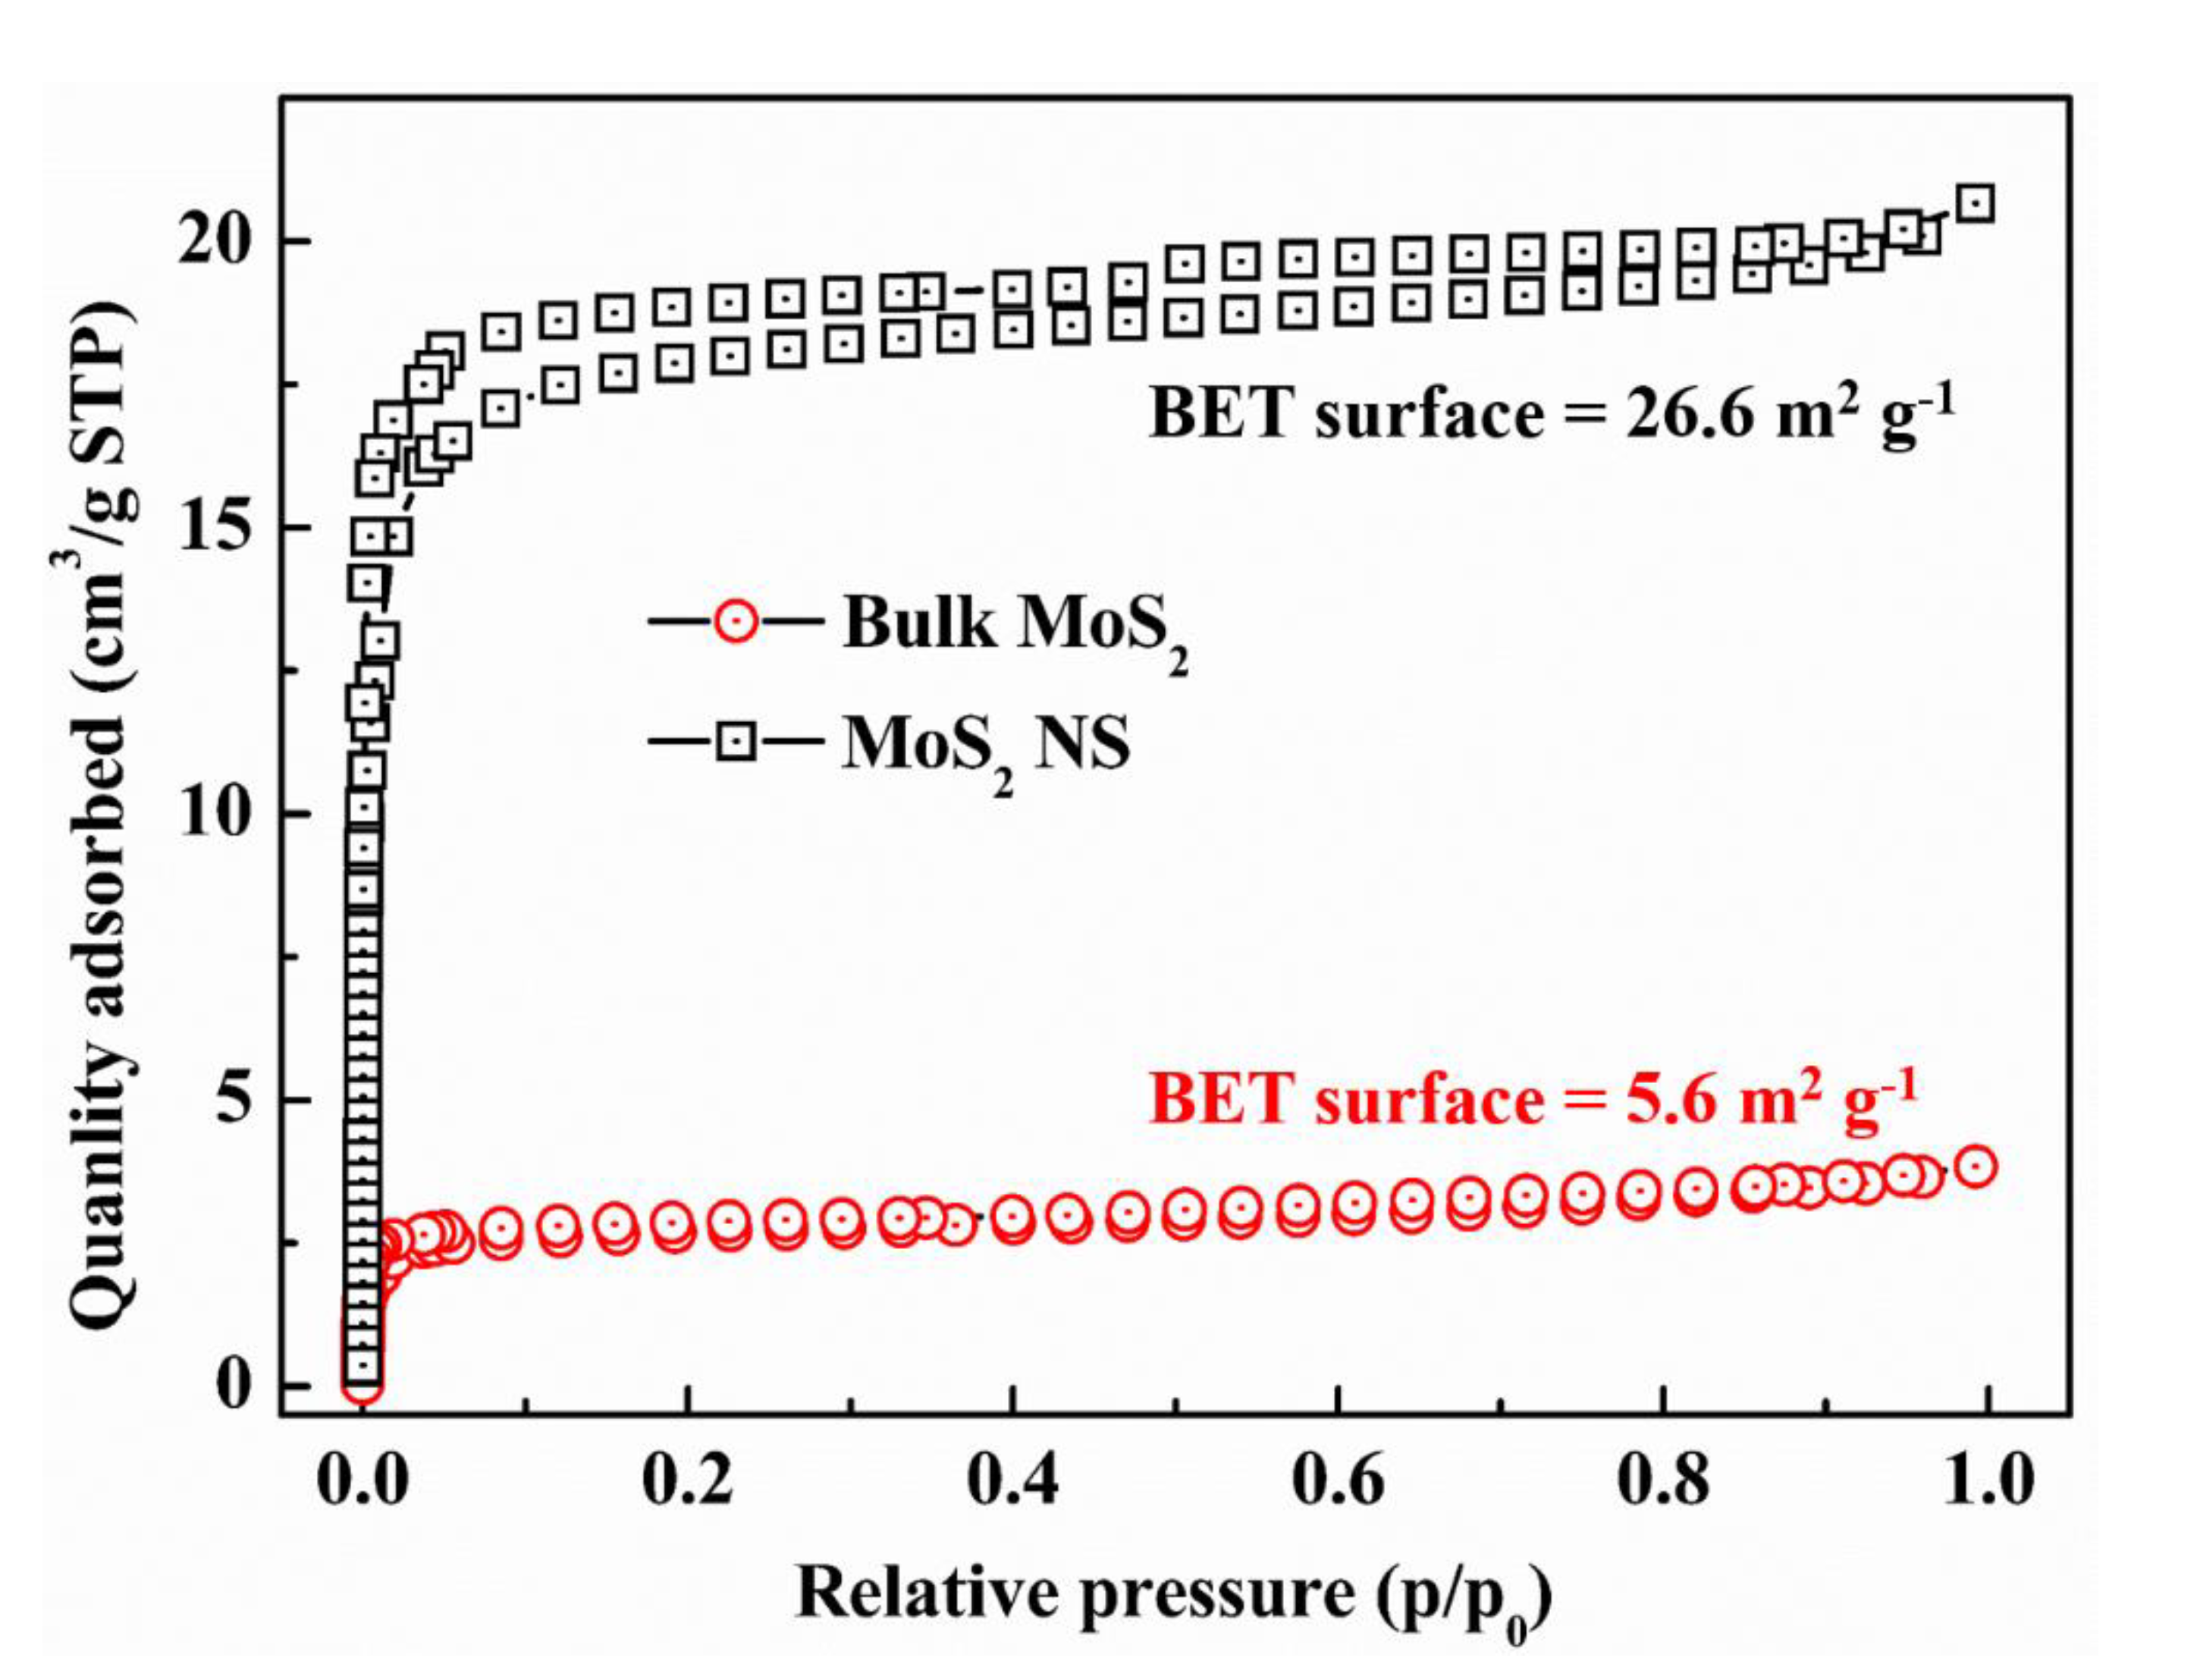
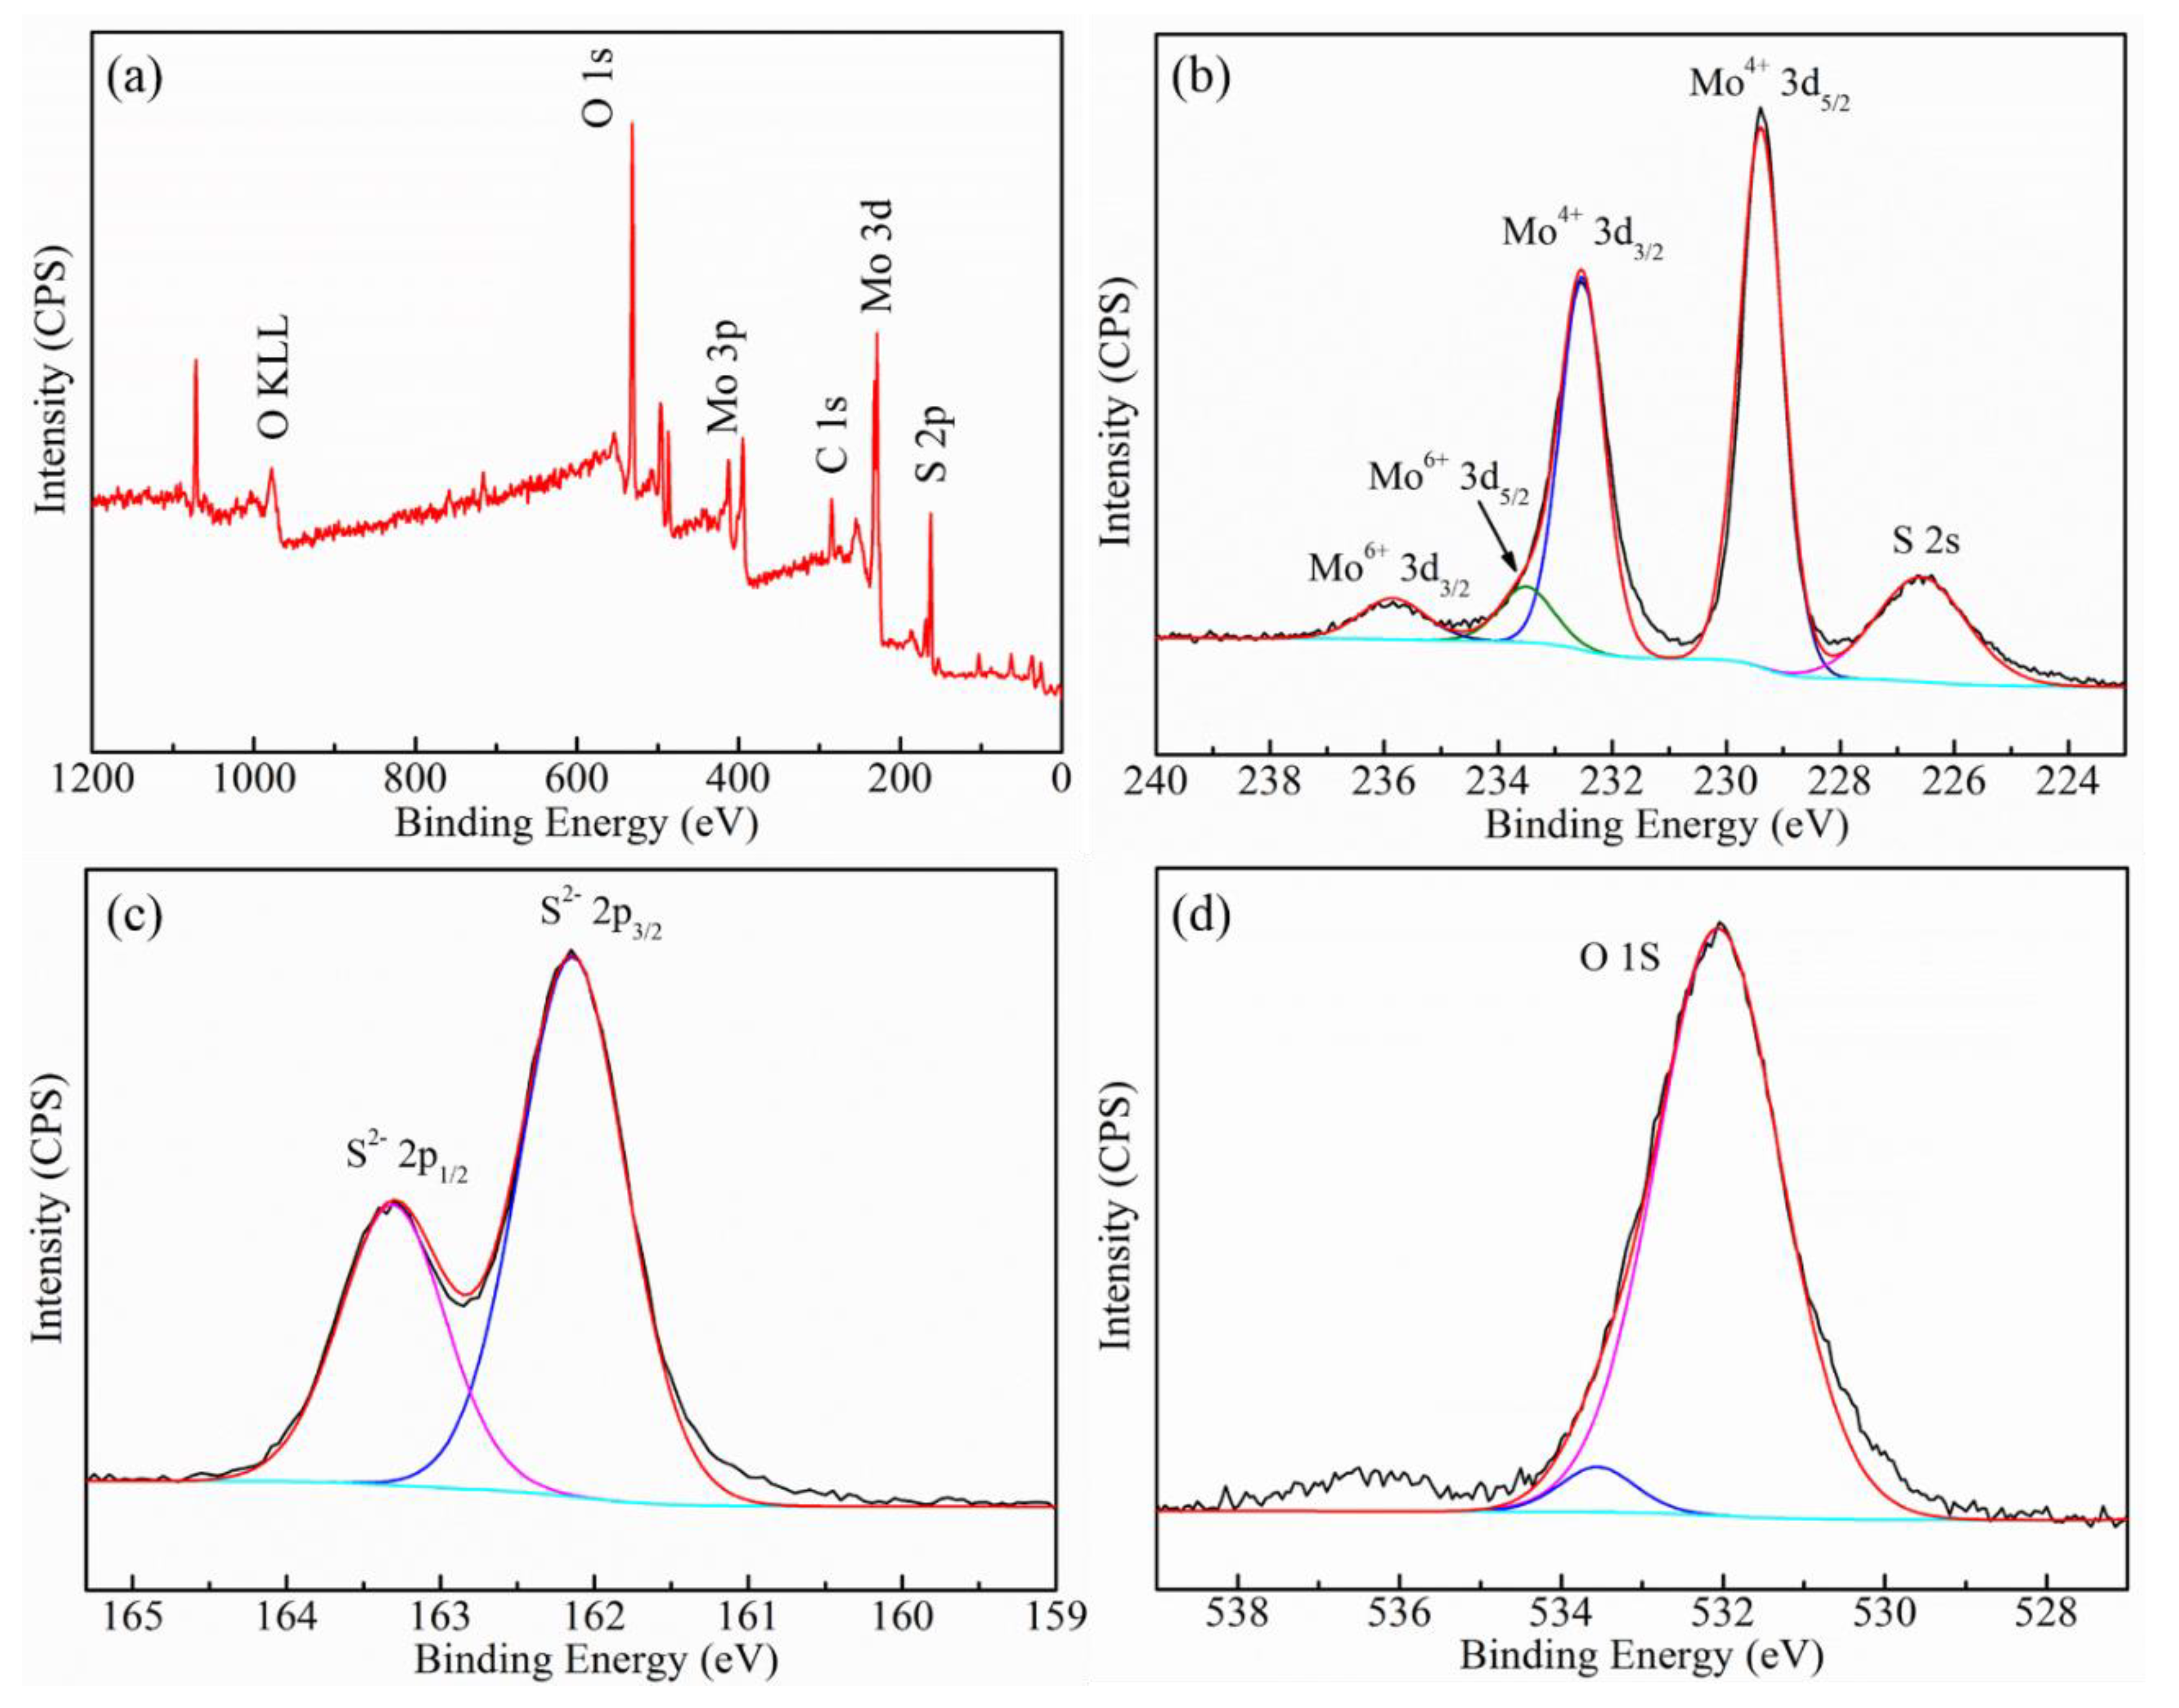
3.1. Characterization of MoS2 Nanosheets

3.1.1. Microstructures and Morphology

To study the variation of the crystal structure during the MoS2-NS preparation, the precursor ((NH4)2MoS4), bulk MoS2 and MoS2-NS were analyzed by XRD and the results were illustrated in Figure 1. As shown in Figure 1, after calcination under N2, the characteristic peaks of (NH4)2MoS4, located at 2θ = 17.2°, 18.44°, and 29.08°, fully vanished, suggesting the evident change of crystal structure. Instead, the peaks at 2θ = 14.6°, 33.48°, 39.82°, and 58.94° were assigned to the (100), (103), (105), and (110) plane of hexagonal MoS2 phase (JCPDS card No. 65-0160), indicating that after calcination, the obtained bulk MoS2 was hexagonal phase. The results were similar to Zhang et al.’s findings [24,25]. In addition, after exfoliation by sonication, the resulting MoS2-NS still kept the same peaks with bulk MoS2, manifesting that the 2H-MoS2-NS was successfully obtained. However, compared to the bulk MoS2, the (002) plane peak of MoS2-NS became broadened and lower, suggesting an increase of the d spacing between MoS2 layers [26]. Based on the full width at half maximum (FHWM) of the (002) plane, the layer number of the prepared MoS2-NS could be calculated to be about ~2 layers through Scherrer’s equation. To further confirm the structure of the exfoliated MoS2-NS, Raman spectroscopy (Figure 1b) was employed to characterize the bulk MoS2 and MoS2-NS. Both the bulk MoS2 and MoS2-NS exhibited two dominant peaks ranging from 340 to 450 cm−1, corresponding to the E12g and A1g mode of the hexagonal MoS2, respectively [26,27], which convincingly proved the successful exfoliation of MoS2-NS. Among which, the E12g mode peak at 381.6 cm−1 involved the in-layer displacements of Mo and S atoms, whereas the A1g mode peak at 407.9 cm−1 represented the out-of-layer symmetric displacements of S atoms along the c-axis [28]. Noticeably, compared to the bulk MoS2, the E12g (377.8 cm−1) and A1g (402.2 cm−1) mode peaks displayed evident blue shift, and the interval (Δ = 24.4 cm−1) between E12g and A1g peaks was lower than that of bulk MoS2 (Δ = 26.3 cm−1), which was ascribed to the decrease of the MoS2 thickness. According to the previous literature [4,25,29], it was found that both E12g and A1g peaks were the characteristic peaks of MoS2 and their frequencies would vary with the layer number. When the layer number increases, the interlayer van der Waals force in MoS2 suppressed atom vibration, resulting in higher force constants [30]. On the contrast, the force constants between the layers would weaken with the layer number decreases. Thus, both E12g and A1g modes were supposed to stiffen (blue-shift) along with the reduction of MoS2 layers.
Figure 2a–d presented the FESEM images of the bulk MoS2 and MoS2-NS. As seen in Figure 2a,b, the bulk MoS2 displayed varisized particle-like morphology but clearly thick layer-structure. After exfoliation, the MoS2-NS exhibited evident thin layer-structure with inconspicuous wrinkle (Figure 2c,d), which suggested the successful exfoliation of MoS2-NS. Similar to the bulk MoS2, the size of prepared MoS2-NS still differed widely. In addition, the thickness of the prepared MoS2-NS was analyzed by atomic force microscopy (AFM) (Figure 2). As seen in the AFM images (Figure 2e,f), the height profile of the two selected regions displayed a height of ~1.20 nm (±0.03 nm) for MoS2-NS, which was about 2 times as thick as the theoretical thickness of monolayer MoS2 (~0.65 nm) [27]. The evident platform of the height curves of the selected MoS2-NS revealed the smooth surface for MoS2-NS. Low-resolution TEM image (Figure 2g) also clearly depicted well-stacked layered structures (~2 layers) of the MoS2-NS, which strongly confirmed the results of XRD and AFM. In the high-resolution TEM (HRTEM) images (Figure 2h), the lattice spacing of 0.27 and 0.16 nm between two adjacent lattice planes could be resolved, which were assigned to the (100) and (110) plane of MoS2. In addition, the HRTEM image (Figure 2i) and associated fast Fourier transforms (FFT) (Figure 2j) from the center of the MoS2-NS evidently exhibited hexagonally symmetric structure, which was consistent with the results of XRD analysis. All the above results manifested that the obtained MoS2-NS still retained hexagonal single crystalline nature during pre-expansion and sonication treatments, which agreed with the previous findings [25,31,32]. However, the BET analysis (Figure 3) showed that the specific surface areas of bulk MoS2 and MoS2-NS were 5.6 and 26.6 m2 g−1, respectively, indicating that the exfoliation greatly changed the specific surface area of the MoS2 materials. With the decreasing of the layers, more and more MoS2 was exposed, resulting in a promotion of the BET surface.
The chemical composition and element valence on the surface of MoS2 NS were analyzed with XPS (Figure 4). As depicted in Figure 4a, the survey spectra clearly confirmed the presentence of C, O, NS, and Mo elements. The weak C1s (~284 eV) peak was attributed into the calibration of binding energy with carbon, while the N1s (~400 eV) peak was ascribed into the adsorbed hydrazine hydrate during the sonication. In Mo3d core-level spectra (Figure 4b), the appearance of Mo3d5/2 (233.5 eV) and Mo3d3/2 (232.6 eV) peaks for Mo3d doublet indicated the characteristic +4 oxidation state [1]. Besides, two weak Mo6+ 3d peaks (3d5/2 peak at 233.5 eV and 3d3/2 peak at 235.9 eV) were ascribed to the slight oxidation of MoS2 NS edge during the MoS2 transfer under high temperature [25]. In the high-resolution scans of S2p (Figure 4c), two feature peaks (S2p1/2 and S2p3/2) were observed at 162.0 and 163.3 eV, respectively, which greatly matched the binding energy of S2 ions in 2H-MoS2 [2]. In addition, the appearance of O1s also confirmed the oxidation of MoS2. In the high-resolution spectra of O1s (Figure 4d), the peak of O2− species located at 532.0 eV and the peak at 533.5 eV was attributed into the absorbed oxygen-containing material like H2O [3].

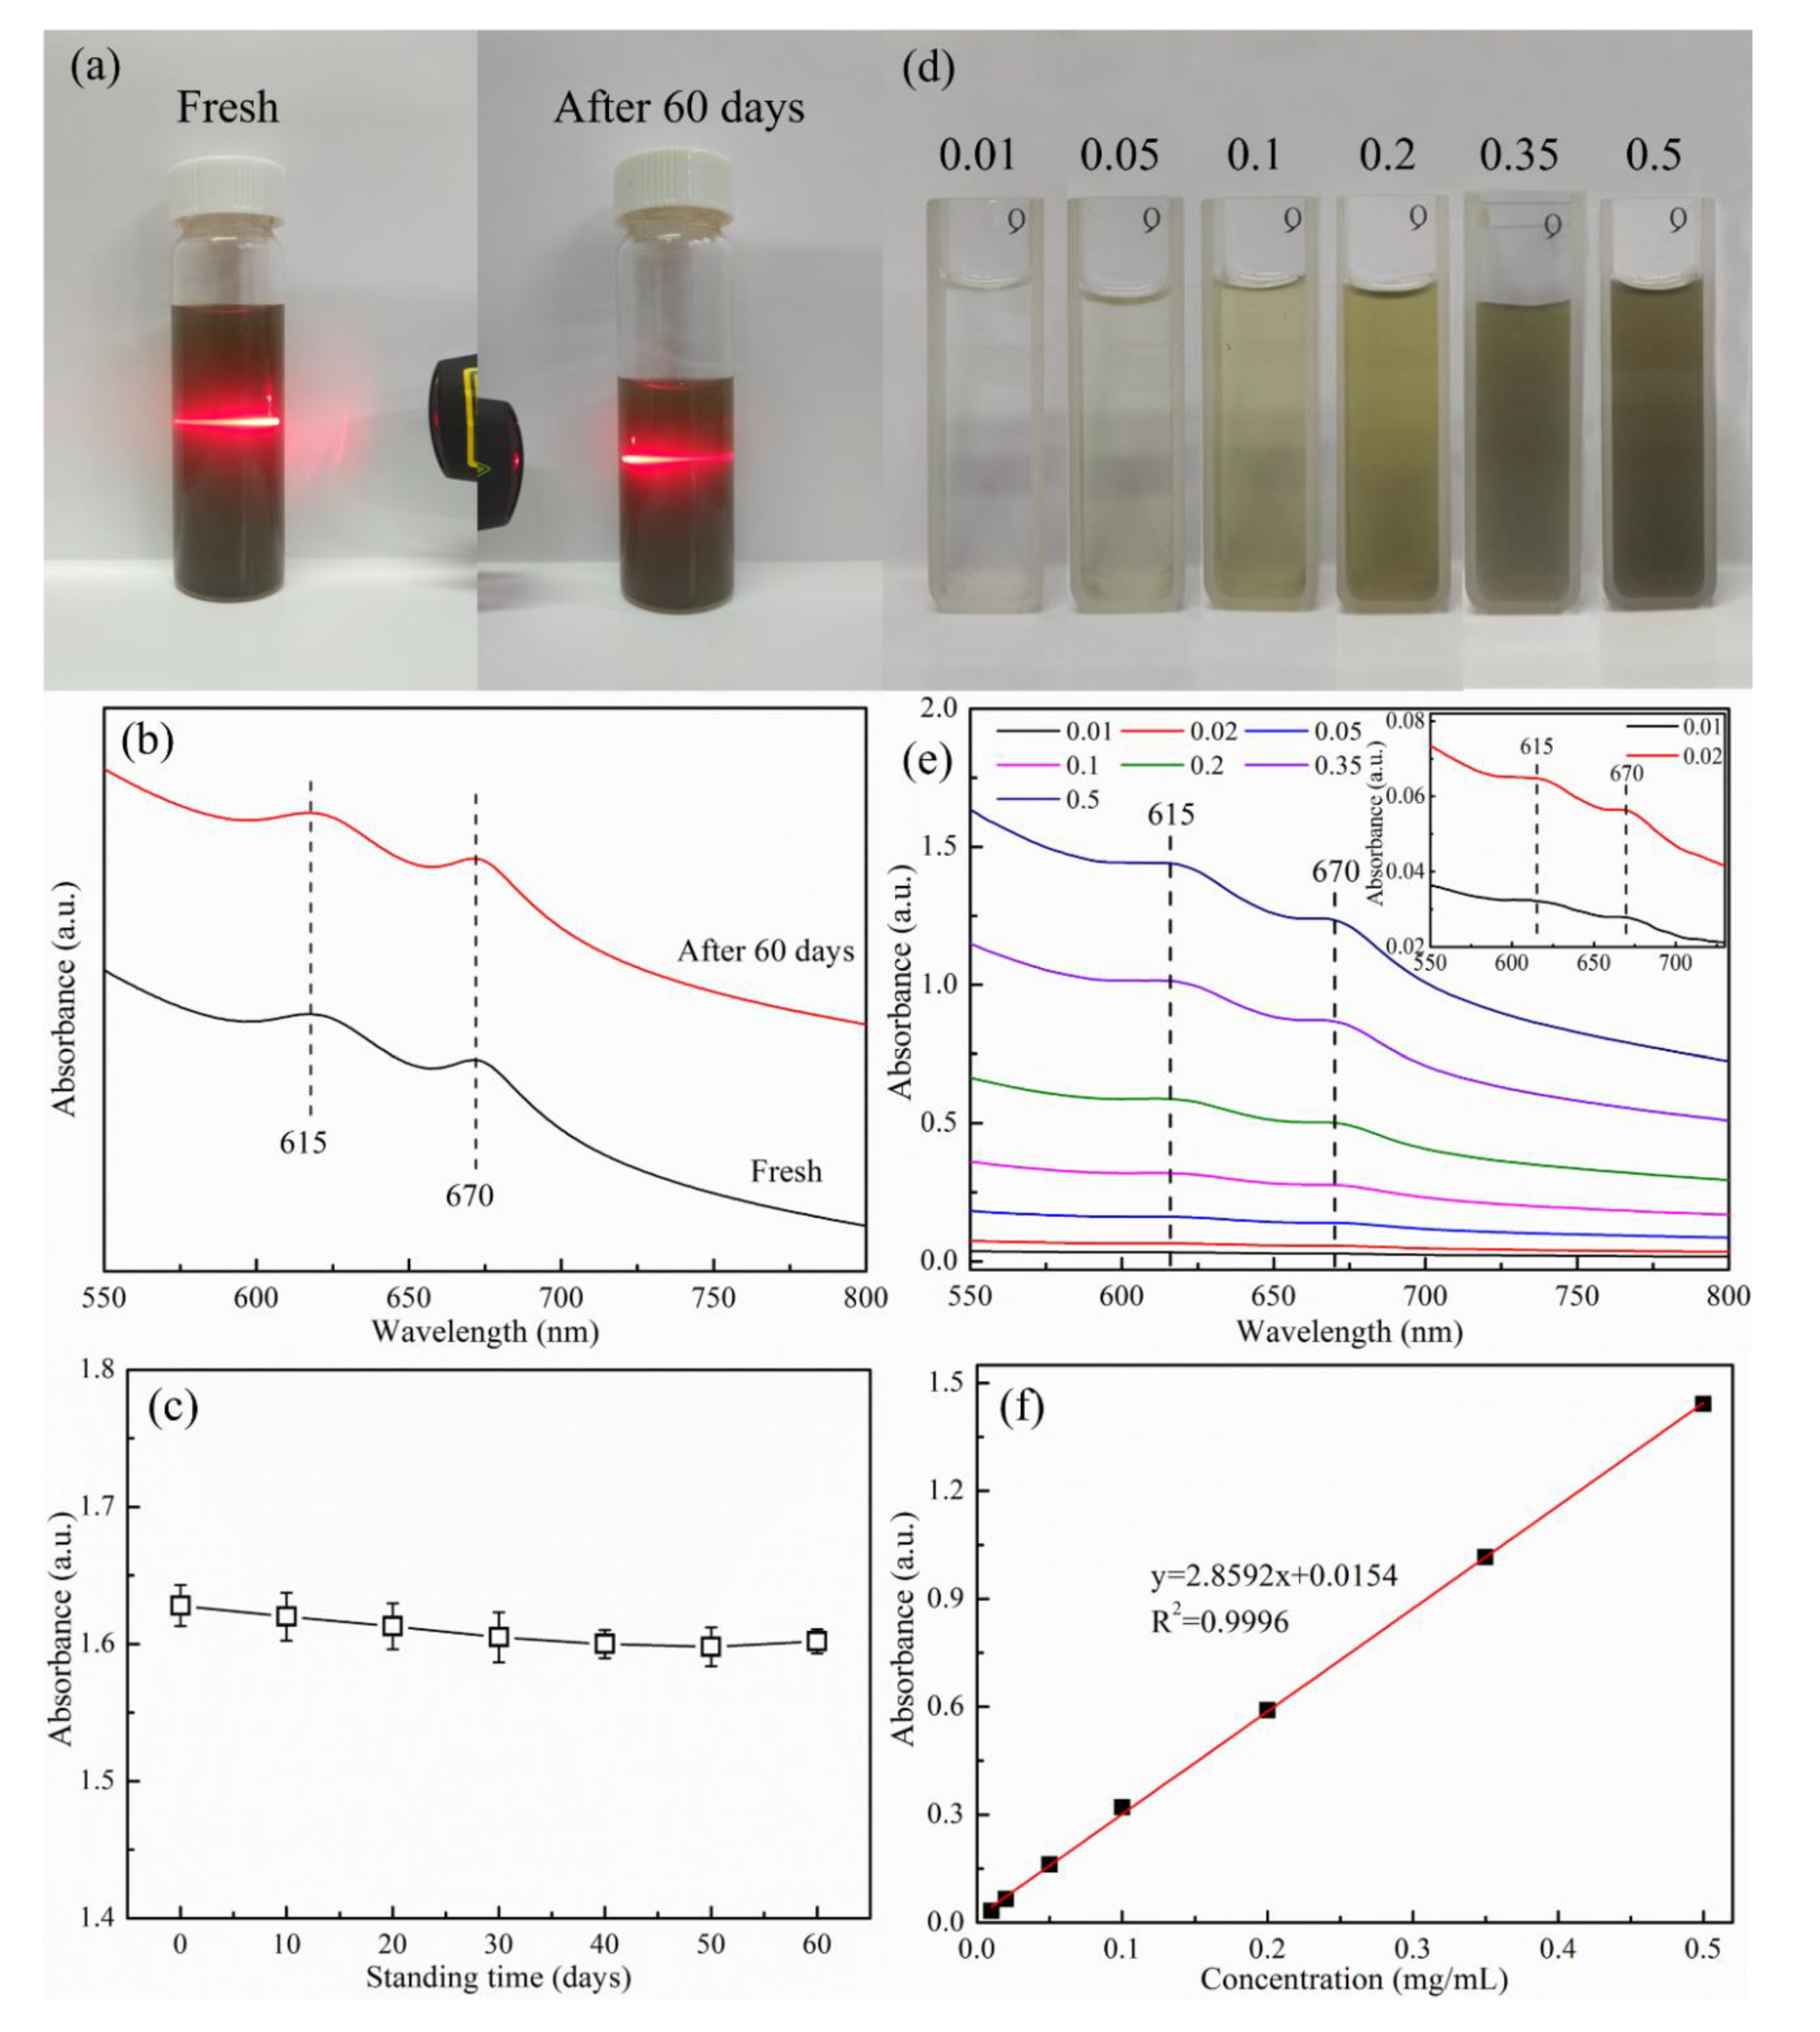
3.1.2. Optical Properties of MoS2 Nanosheets Dispersion

To obtain pure few-layer MoS2 NS, the suspensions were first centrifuged at 3000 rpm for 2 h to remove the no exfoliated precipitate. Figure 5a displayed the photographs of the as-prepared MoS2 NS in water. As shown in the Figure 5a, the evident Tyndall phenomenon was observed both of the fresh MoS2 NS dispersions and the dispersions after 60 days. Meanwhile, the UV-vis absorption spectra (Figure 5b,c) also exhibited no evident change during 60 days. All the results suggested the excellent stability (stable for over 60 days) of as-prepared MoS2 NS dispersions. In addition, the UV-vis absorption spectra (Figure 5e) of the resulting MoS2 NS dispersions with different concentrations (Figure 5d) displayed two distinctly characteristic peaks for 2H-MoS2 [33]. The two peaks located at 615 (B-exciton) and 670 nm (A-exciton) were attributed to the direct excitonic transitions of MoS2 at the K point of the Brillouin zone [34,35]. According to Hai et al.’s study [25], the relationship between the concentrations of MoS2 NS dispersions and the measured absorbance at a given wavelength (615 or 670 nm) were estimated by using the Beer–Lambert law. The fitting results (Figure 5f) proved that the concentrations of the dispersions showed good linear relationship (R2 = 0.9996) with the absorbance at 615 nm in the range of 0.01–0.5 mg L−1, which meant that the quantitative analysis of the MoS2 NS dispersions was available. Based on the above relationship, the concentration of the as-prepared MoS2 NS dispersions was 0.65 ± 0.04 mg mL−1, which was much higher than previous findings [7,25]. The initial concentration of the bulk MoS2 (2.510 g of bulk MoS2 were obtained after the calcination of (NH4)2MoS4) was 2.51 mg mL−1, and the corresponding few-layer MoS2 NS yield was calculated to be as high as 25.9% in water.

3.2. Adsorption Behavior of MoS2-NS Towards Dyes and Heavy Metals

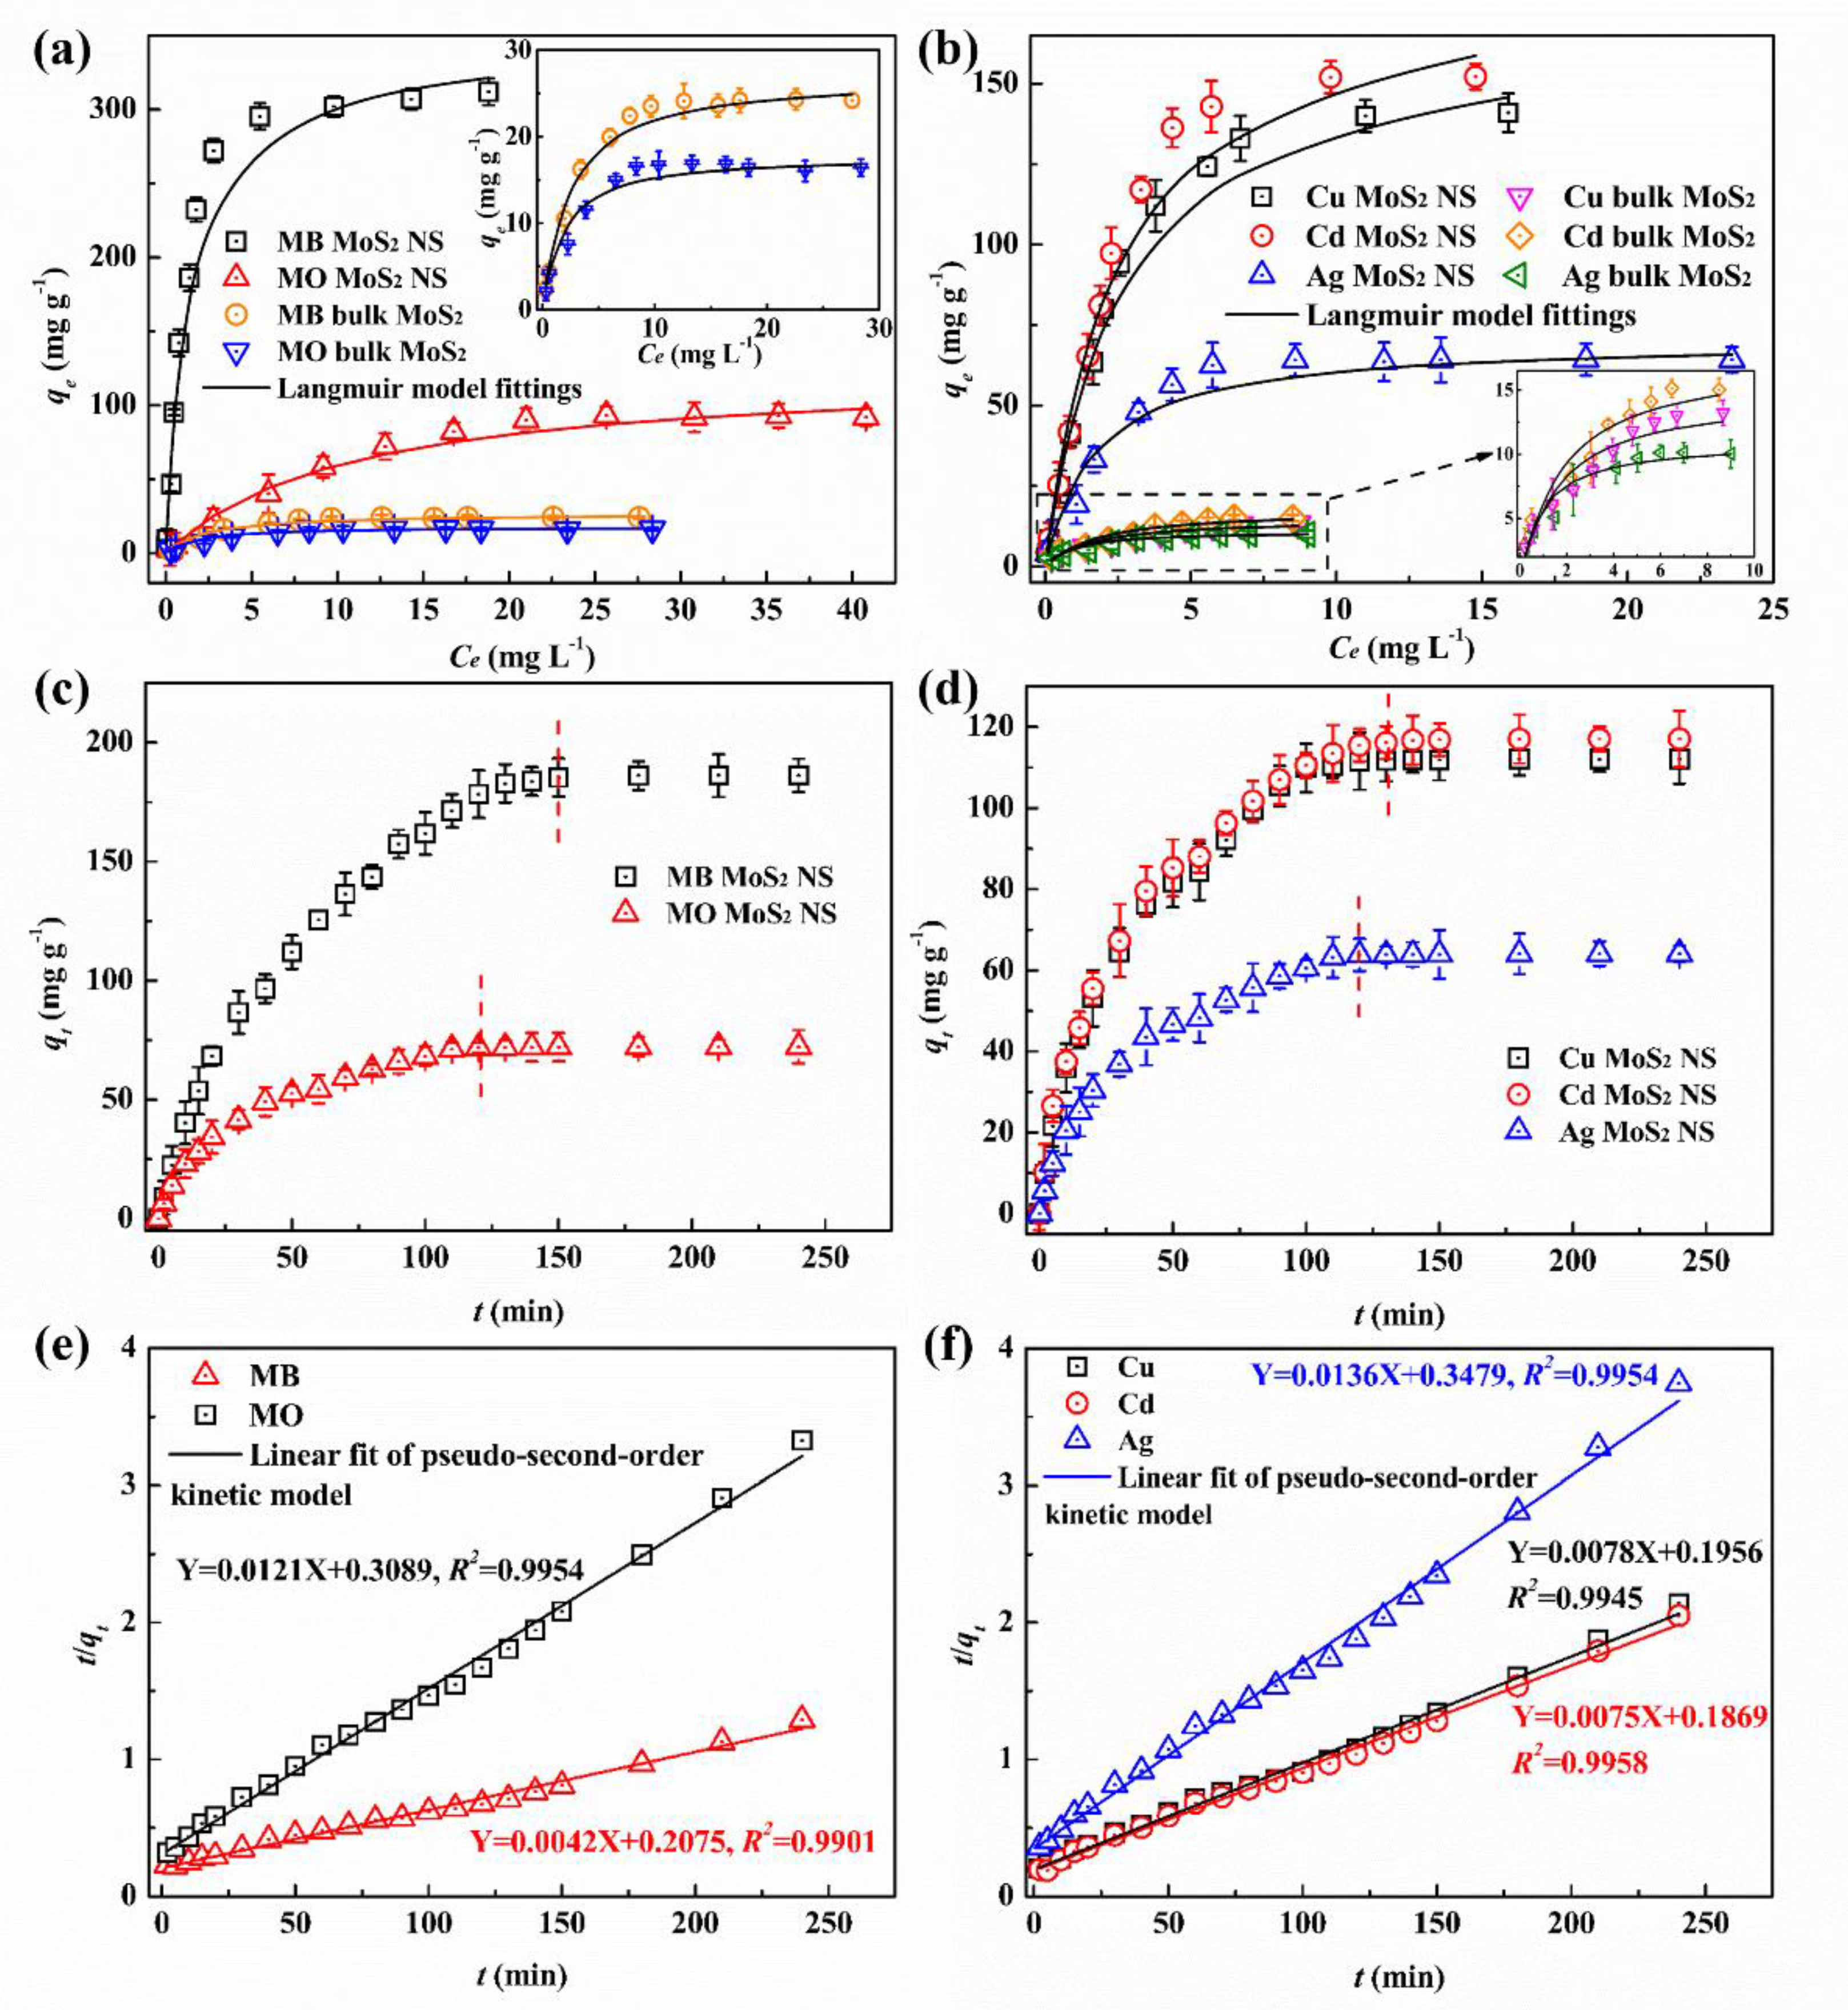
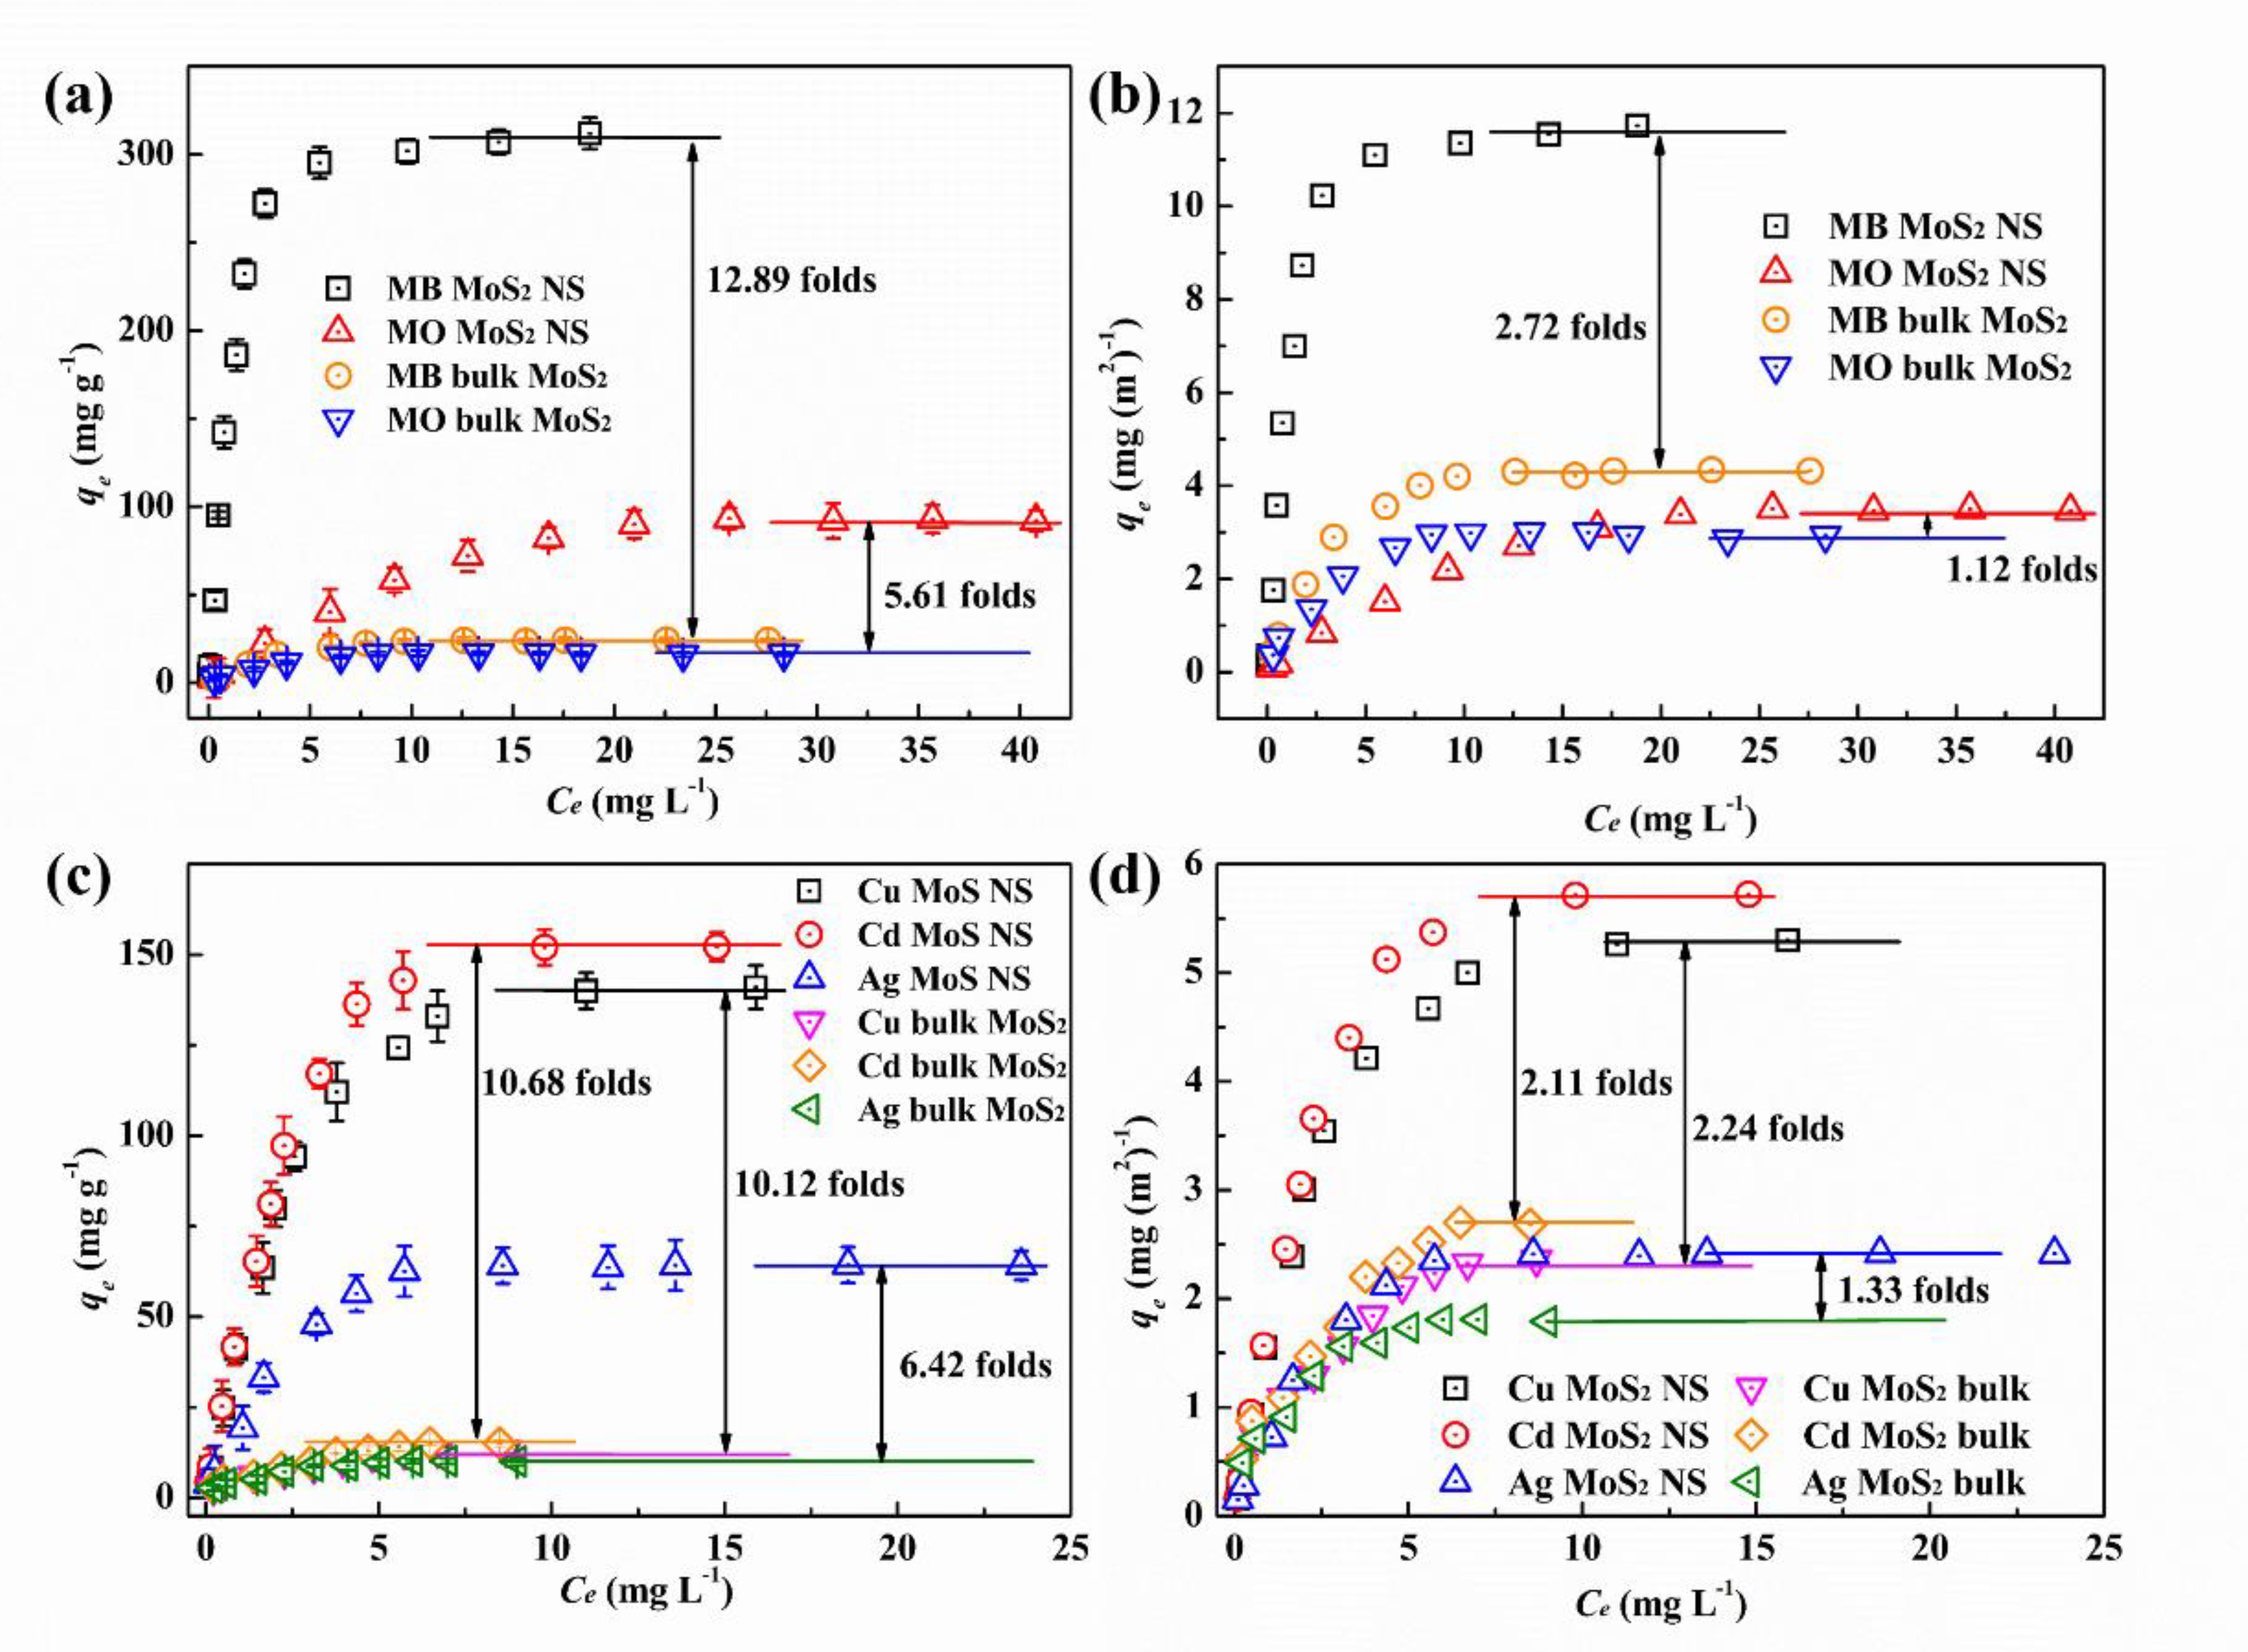
3.2.1. Adsorption Isotherms and Kinetics

The adsorption performance of the MoS2 NS was tested by selecting two dyes (methylene blue, MB and methyl orange, MO) and three heavy metal ions (Cu2+, Cd2+, and Ag+) as the targets. As seen in Figure 6a, in the bulk MoS2 systems, the equilibrium adsorption capacities of the two dyes only slightly increased with the increasing of the dye concentrations, manifesting that the bulk MoS2 exhibited unsatisfactory adsorption performance of MB and MO. Instead, the equilibrium adsorption capacities of MoS2 NS for MB and MO significantly increased under high concentration of dyes, which were much larger than those of bulk MoS2. Meanwhile, the as-prepared MoS2 NS also displayed more excellent adsorption performance on heavy metals than the bulk MoS2. All the results indicated that the exfoliation was beneficial to improve the adsorption performance of MoS2, which was in accordance with previous studies [3,36,37].
In addition, to well study the adsorption behavior, the Langmuir and Freundlich models were employed to fit the experimental data (Figure 6a,b, Figure S1). As listed in Table 1, the high R2 values suggested that the Langmuir model better described the adsorption of dyes and heavy metals onto MoS2 NS and bulk MoS2 than the Freundlich model. Based on the Langmuir model fitting, the relative parameters like the maximum adsorption capacity (qm) and affinity constant (KL) for dyes and heavy metals were obtained and listed in Table 1. The qm values of MB and MO for MoS2 NS were 344.8 and 123.5 mg g−1, respectively, which were 12.77 and 6.94 larger than those (27.0 and 17.8 mg g−1 for MB and MO, respectively) of bulk MoS2. Meanwhile, the similar results were observed in the heavy metal adsorption, indicating that the MoS2 NS exhibited much more excellent adsorption performance than the bulk MoS2. In addition, for the dyes, the higher qm and KL values of MB implied that MoS2 materials exhibited better adsorption capacity and affinity to MB. For heavy metals, the highest qm value occurred to Cd2+ (185.2 mg g−1), following Cu2+ (169.5 mg g−1) and Ag+ (70.4 mg g−1), indicating that MoS2 NS were more beneficial to Cd2+ and Cu2+ adsorption than Ag+.
Figure 6c,d displayed adsorption kinetics data for dyes and heavy metals over MoS2 NS. As revealed in Figure 6c, both MO and MB adsorption increased rapidly at the beginning, then proceeded at a slower rate, and tended to equilibrium at the end. The similar results occurred to the adsorption of heavy metals. Besides, to further analyze the time-dependent variation during the adsorption process, pseudo-first-order and pseudo-second-order kinetic models were employed to fit the dyes and heavy metals adsorption on MoS2 NS (Figure 6e,f). As shown in Table S1, the higher R2 values suggested that the pseudo-second-order model better described both dyes and heavy metals adsorption than the pseudo-first-order model, suggesting that the electron transfer between MoS2 NS and dye molecule or metal ions played a controlling role during the adsorption [38].

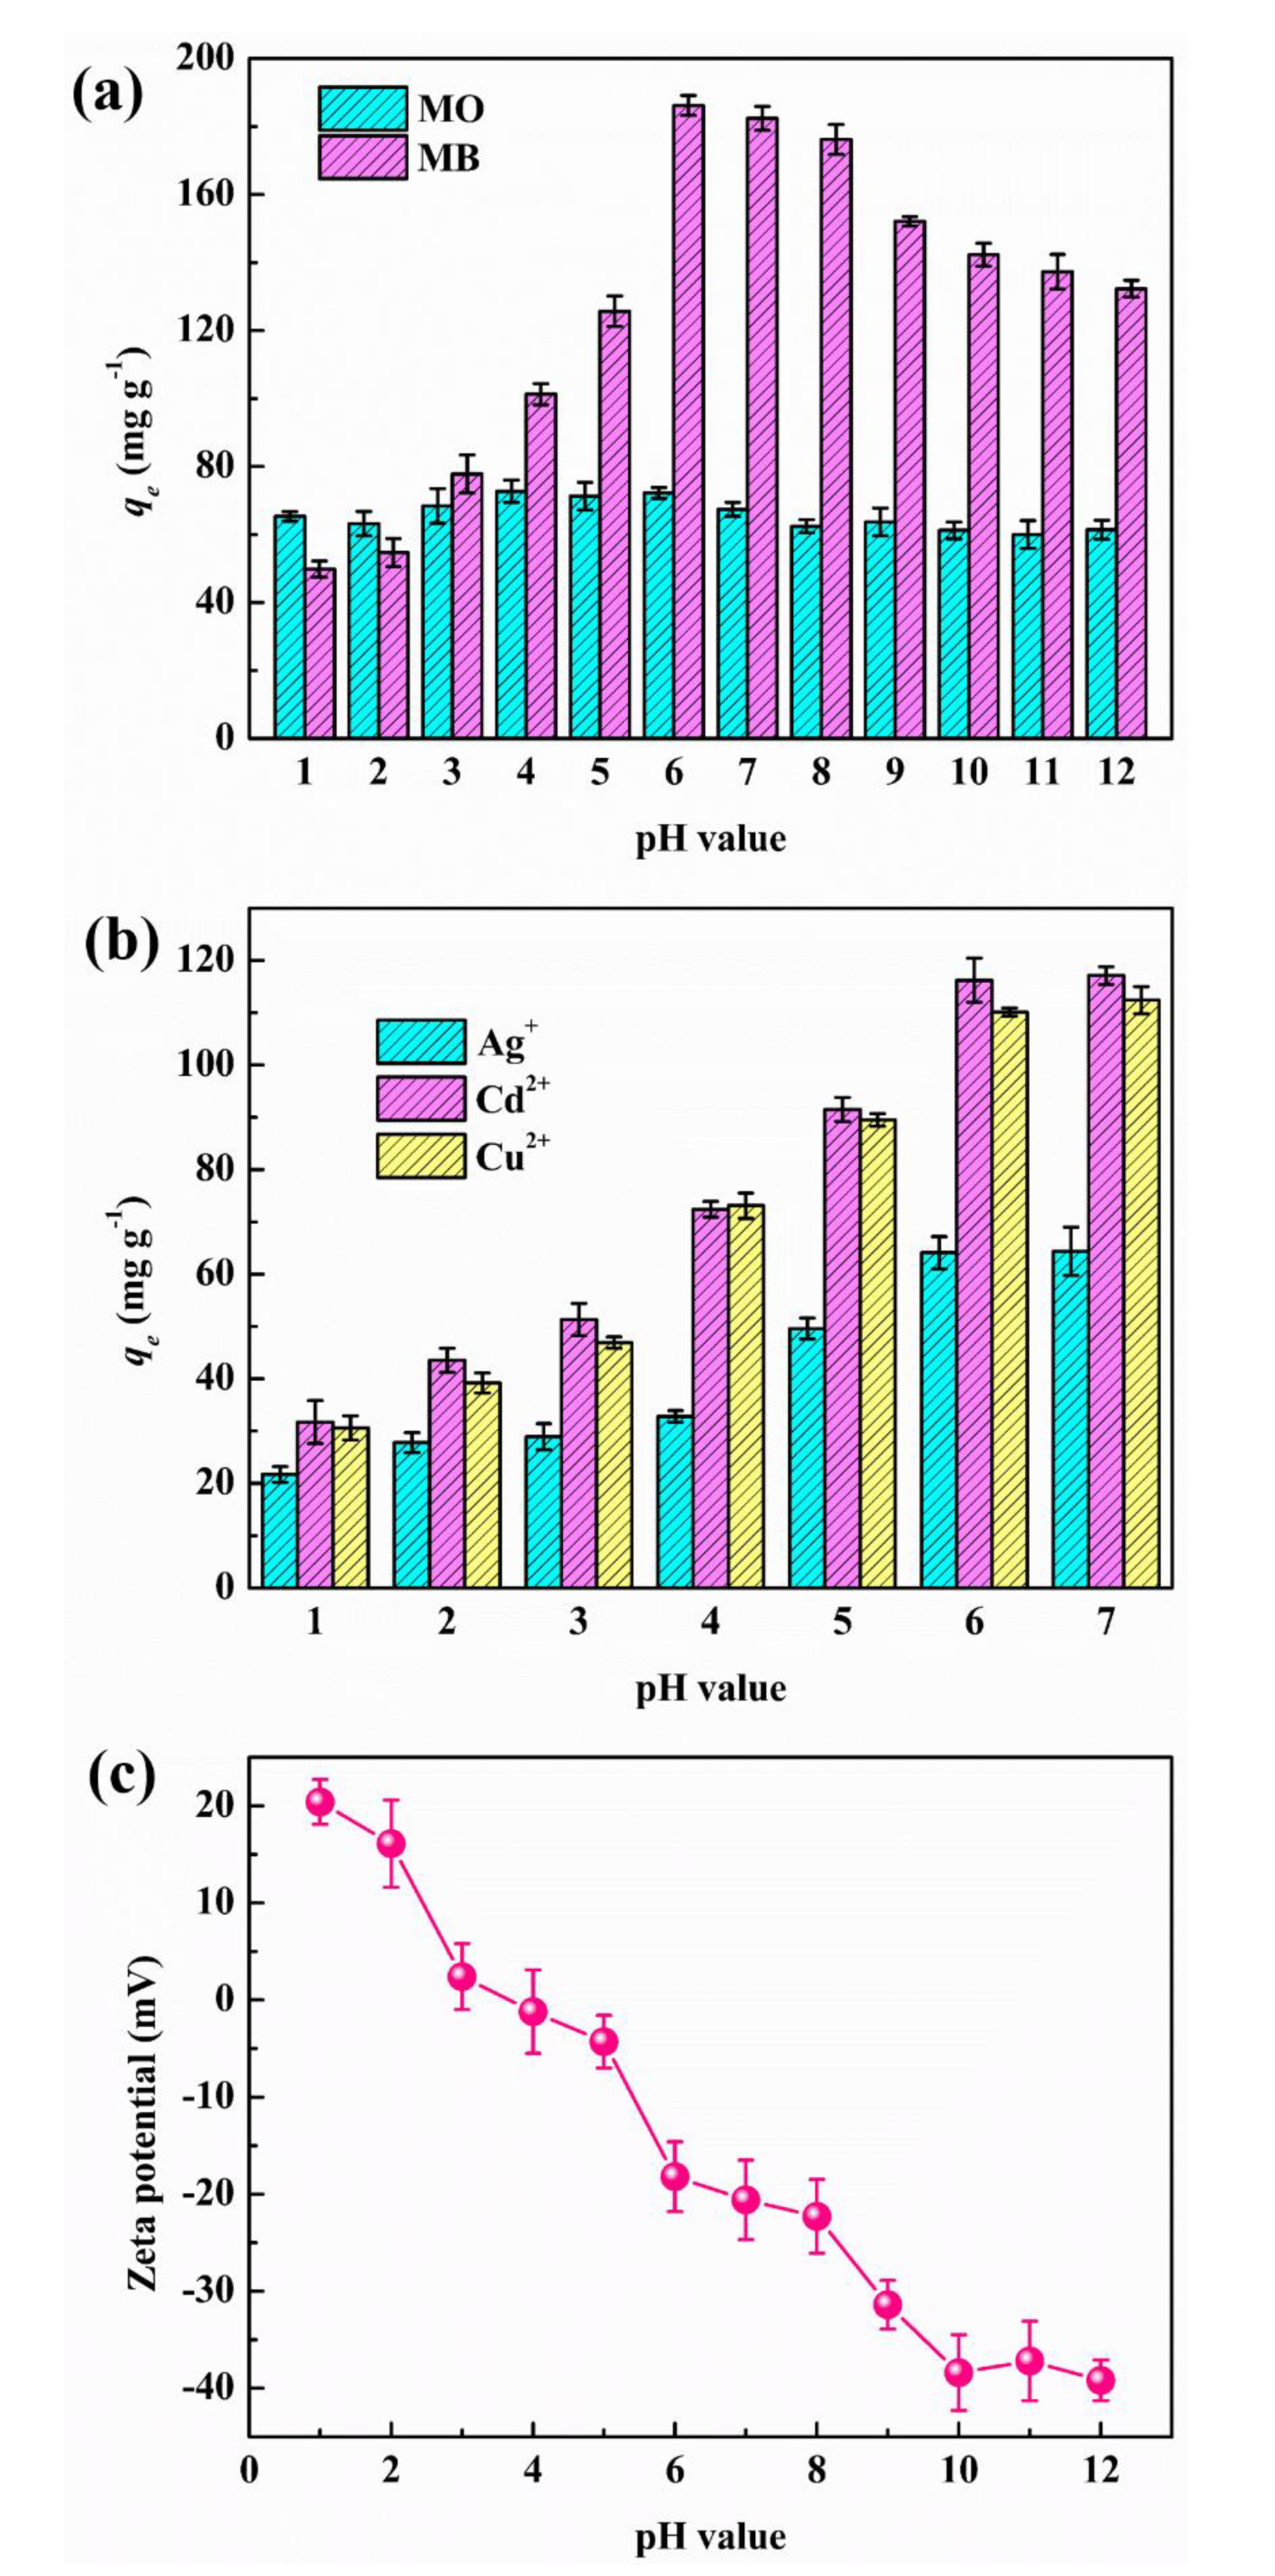
3.2.2. Adsorption Mechanism

Based on the results, the MoS2 NS showed much better dye or metal adsorption performance than bulk MoS2. According to the previous studies [3,37,39,40], the main mechanisms reported during the adsorption of dyes or metal by the inorganic materials involved physical hole-filling effects, electrostatic interactions, and ion exchange.

Physical Hole-Filling Effects

The specific surface area often displayed significant effect on the adsorption of the pollutants [41,42,43]. The adsorbents with large specific surface area usually owned abundant pores, which greatly provided a sufficient adsorption site to capture the pollutants, resulting in the promotion of their adsorption performance. For nano materials, the physical hole-filling effect was considered as one of the important adsorption mechanisms [41]. According to above-mentioned results, the obtained MoS2 NS owned much larger specific surface area than bulk MoS2, while the MoS2 NS also exhibited more excellent adsorption performance on dyes and heavy metals. Thus, it could be inferred that the physical hole-filling effect probably played a vital role in the promotion of dyes or heavy metal adsorption. Herein, to verify the role of specific surface area during the dyes or heavy metal adsorption over MoS2 NS and bulk MoS2, the obtained qe data were standardized with the BET surface area and the results were showed in Figure 7. As shown in Figure 7a, for dyes, the equilibrium adsorption capacities of MoS2 NS for MB and MO were 312.0 and 92.6 mg g−1, which were 12.89 and 5.61 times larger than those of bulk MoS2, respectively. Meanwhile, the as-prepared MoS2 NS also displayed excellent adsorption performance on heavy metals (Figure 7c), with 141.0, 152.8, and 64.2 mg g−1 for Cu2+, Cd2+, and Ag+, respectively, which were 10.68, 10.12, and 6.42 folds larger than those of bulk MoS2 (13.2, 15.1, and 10.0 mg g−1 for Cu2+, Cd2+, and Ag+, respectively). After standardization (Figure 7b,d), all of the qe ratios between the MoS2 NS and bulk MoS2 significantly decreased from 12.89 (MB), 5.61 (MO), 10.12 (Cu2+), 10.68 (Cd2+), and 6.42 (Ag+) to 2.72, 1.12, 2.24, 2.11, and 1.33, respectively, suggesting that the physical hole-filling effect played positive role in the promotion of dyes or heavy metal adsorption over MoS2.
In addition, no evident variation was observed between the standardized qe values of MoS2 NS and bulk MoS2 (Figure 7b), meaning that the physical hole-filling effect was the sole mechanism during MO adsorption over MoS2 NS. However, the significant enhancement between the standardized qe values of MoS2 NS and bulk MoS2 (Figure 7b,d) suggested that besides the physical hole-filling effect, some other mechanisms were involved during the adsorption of MB and heavy metals over MoS2 NS.

Electrostatic Interactions

Electrostatic interaction was often considered as a possible mechanism to explain the adsorption of dyes and heavy metals [37,40,44]. To confirm the role of electrostatic interaction during dyes and heavy metals adsorption over MoS2 NS, the adsorption efficiency in various pH values were conducted. As depicted in Figure 8a, the slight fluctuation among the qe values for MO suggested that the MB adsorption over MoS2 NS was not controlled by the pH values. Instead, the MB adsorption was notably influenced by the pH values. At low pH (<6) conditions, the qe values increased with the pH value and reached a peak (186.2 mg g−1) at pH = 6.0, and then gradually declined when pH > 6. Meanwhile, Zeta potential results (Figure 8c) showed that the isoelectric point of MoS2 NS was about 3.8. This meant that the surface of MoS2 NS displayed a positive charge when the pH value was below 3.8, while a negative charge above 3.8. As a typical cationic dye, MB molecules could strongly adhere to the MoS2 NS through the electrostatic interaction once the surface charge of MoS2 NS turned to negative, leading to an increasing of the qe values.
Similarly, the pH also markedly influenced the adsorption of heavy metals over MoS2 NS (Figure 8b). The qe values of Cu2+, Cd2+, and Ag+ evidently increased with an increasing pH, and stabilized at about 112.4, 117.0, and 64.4 mg g−1, respectively. When the pH increased, the surface charge of MoS2 NS turned to negative and the values gradually increased, which meant that stronger electrostatic interaction occurred between the heavy metal ions and MoS2 NS at higher pH, resulting in improvement of the adsorption performance. In addition, the charge values of the heavy metal ions also showed visible effects on the adsorption capacity. Due to the lower value of the charge for Ag+, the qe value of Ag+ was much lower than those of Cu2+ and Cd2+, which was ascribed into the weaker electrostatic interaction between Ag+ and MoS2 NS. According to the Coulomb law, electrostatic interaction was in direct proportion to the value of the surface charge. The similar results were also found in Yang at al.’s studies [45].

Ion Exchange

According to previous studies [43,46], the ion exchange only occurred with heavy metals adsorption. It was well known that the affinity to the metal ions in the ion exchange process increased with the ion radius and the ion radius of Cd2+ and Cu2+ were 0.97 Å and 0.73 Å, respectively. If the ion exchange was the main adsorption mechanism, the number of the adsorbed Cd2+ should be larger than that of Cu2+. Actually, in the system of 15 mg−1 L (Figure 8b), the molar adsorption capacity of Cd2+ (1.04 mmol g−1, 117.0 mg g−1) was visibly lower than that of Cu2+ (1.75 mmol g−1,112.4 mg g−1), which indicated that the ion exchange was not the main mechanism during the heavy metals over MoS2 NS. Similarly, Nguyen et al. also found that the ion exchange played a negligible role during the Cd2+ and Cu2+ adsorption over the activated carbon [43].

4. Conclusions

In summary, the ultrathin 2H-MoS2 nanosheets with 1–2 layers were successfully obtained via a hybrid stagey with combination of quenching process and liquid-based exfoliation. The as-prepared 2H-MoS2 nanosheets exhibited evident optical properties and could be accurately quantified with the absorbance at 615 nm in the range of 0.01–0.5 mg L−1. Besides, the obtained 2H-MoS2 nanosheets also showed a promising application in pollution control. It could be a candidate absorbent for the removal of dyes and heavy metals. This work provided an effective way for the large-scale fabrication of the two-dimensional nanosheets of transition metal dichalcogenides (TMDs) by liquid exfoliation.

Supplementary Materials

The following are available online at https://0-www-mdpi-com.brum.beds.ac.uk/2227-9717/8/5/504/s1, Figure S1. Linear fittings of dyes adsorption (a) and heavy metals (b and c) over bulk MoS2 and MoS2 NS with the Freundlich model, Table S1 Adsorption kinetics parameters of dyes and heavy metals adsorption over MoS2 NS.

Author Contributions

S.H. and Y.L. (Yifan Liu) conceived the study, designed the experiments and wrote the manuscript. S.H., Z.Y. and Y.J. performed the experiments. F.Z. and K.L. finished the characterization and data analysis. Y.L. (Yuancai Lv) and X.C. edited the manuscript. All authors have read and agreed to the published version of the manuscript.

Funding

This research was funded by by the Open Project Program of National Engineering Research Center for Environmental Photocatalysis (Grant No. 201904), Fuzhou University.

Conflicts of Interest

The authors declare no conflict of interest.

References

  1. Kibsgaard, J.; Chen, Z.; Reinecke, B.N.; Jaramillo, T.F. Engineering the surface structure of MoS2 to preferentially expose active edge sites for electrocatalysis. Nat. Mater. 2012, 11, 963–969. [Google Scholar] [CrossRef] [PubMed]
  2. Oakes, L.; Carter, R.; Hanken, T.; Cohn, A.P.; Share, K.; Schmidt, B.; Pint, C.L. Interface strain in vertically stacked two-dimensional heterostructured carbon-MoS2 nanosheets controls electrochemical reactivity. Nat. Commun. 2016, 7, 11796. [Google Scholar] [CrossRef] [PubMed]
  3. Qiao, X.-Q.; Tian, F.-Y.; Hou, D.-F.; Hu, F.-C.; Li, D.-S. Equilibrium and kinetic studies on MB adsorption by ultrathin 2D MoS2 nanosheets. RSC Adv. 2016, 6, 11631–11636. [Google Scholar] [CrossRef]
  4. Ye, L.; Xu, H.; Zhang, D.; Chen, S. Synthesis of bilayer MoS2 nanosheets by a facile hydrothermal method and their methyl orange adsorption capacity. Mater. Res. Bull. 2014, 55, 221–228. [Google Scholar] [CrossRef]
  5. Lee, C.; Yan, H.; Brus, L.E.; Heinz, T.F.; Hone, J.; Ryu, S. Anomalous Lattice Vibrations of Single- and Few-Layer MoS2. ACS Nano 2010, 4, 2695–2700. [Google Scholar] [CrossRef] [PubMed] [Green Version]
  6. Zhang, Y.; Ye, J.; Matsuhashi, Y.; Iwasa, Y. Ambipolar MoS2 Thin Flake Transistors. Nano Lett. 2012, 12, 1136–1140. [Google Scholar] [CrossRef]
  7. Coleman, J.N.; Lotya, M.; O’Neill, A.; Bergin, S.D.; King, P.J.; Khan, U.; Young, K.; Gaucher, A.; De, S.; Smith, R.J.; et al. Two-Dimensional Nanosheets Produced by Liquid Exfoliation of Layered Materials. Science 2011, 331, 568–571. [Google Scholar] [CrossRef] [Green Version]
  8. O’Neill, A.; Khan, U.; Coleman, J.N. Preparation of High Concentration Dispersions of Exfoliated MoS2 with Increased Flake Size. Chem. Mater. 2012, 24, 2414–2421. [Google Scholar] [CrossRef]
  9. Tao, J.; Chai, J.W.; Lü, X.; Wong, L.M.; Wong, T.I.; Pan, J.; Xiong, Q.; Chi, D.; Wang, S. Growth of wafer-scale MoS2 monolayer by magnetron sputtering. Nanoscale 2015, 7, 2497–2503. [Google Scholar] [CrossRef]
  10. Motola, M.; Baudys, M.; Zazpe, R.; Krbal, M.; Michalicka, J.; Rodriguez-Pereira, J.; Pavlinak, D.; Prikryl, J.; Hromadko, L.; Sopha, H.I.; et al. 2D MoS2 nanosheets on 1D anodic TiO2 nanotube layers: An efficient co-catalyst for liquid and gas phase photocatalysis. Nanoscale 2019, 11, 23126–23131. [Google Scholar] [CrossRef] [PubMed]
  11. Shen, J.; He, Y.; Wu, J.; Gao, C.; Keyshar, K.; Zhang, X.; Yang, Y.; Ye, M.; Vajtai, R.; Lou, J.; et al. Liquid Phase Exfoliation of Two-Dimensional Materials by Directly Probing and Matching Surface Tension Components. Nano Lett. 2015, 15, 5449–5454. [Google Scholar] [CrossRef] [PubMed]
  12. Kim, J.; Kwon, S.; Cho, D.-H.; Kang, B.; Kwon, H.; Kim, Y.; Park, S.O.; Jung, G.Y.; Shin, E.; Kim, W.-G.; et al. Direct exfoliation and dispersion of two-dimensional materials in pure water via temperature control. Nat. Commun. 2015, 6, 8294. [Google Scholar] [CrossRef] [PubMed]
  13. Dong, L.; Lin, S.; Yang, L.; Zhang, J.; Yang, C.; Yang, D.; Lu, H. Spontaneous exfoliation and tailoring of MoS2 in mixed solvents. Chem. Commun. 2014, 50, 15936–15939. [Google Scholar] [CrossRef] [PubMed]
  14. Zhou, K.-G.; Mao, N.-N.; Wang, H.; Peng, Y.; Zhang, H.-L. A Mixed-Solvent Strategy for Efficient Exfoliation of Inorganic Graphene Analogues. Angew. Chem. Int. Ed. 2011, 50, 10839–10842. [Google Scholar] [CrossRef] [PubMed]
  15. Guardia, L.; Paredes, J.I.; Rozada, R.; Villar-Rodil, S.; Martinez-Alonso, A.; Tascón, J.D. Production of aqueous dispersions of inorganic graphene analogues by exfoliation and stabilization with non-ionic surfactants. RSC Adv. 2014, 4, 14115–14127. [Google Scholar] [CrossRef]
  16. Smith, R.J.; King, P.J.; Lotya, M.; Wirtz, C.; Khan, U.; De, S.; O’Neill, A.; Duesberg, G.S.; Grunlan, J.C.; Moriarty, G.; et al. Large-Scale Exfoliation of Inorganic Layered Compounds in Aqueous Surfactant Solutions. Adv. Mater. 2011, 23, 3944–3948. [Google Scholar] [CrossRef]
  17. Zheng, J.; Zhang, H.; Dong, S.; Liu, Y.; Nai, C.T.; Shin, H.S.; Jeong, H.Y.; Liu, B.; Loh, K.P. High yield exfoliation of two-dimensional chalcogenides using sodium naphthalenide. Nat. Commun. 2014, 5, 2995. [Google Scholar] [CrossRef]
  18. Zhuc, W.; Gao, X.; Li, Q.; Li, H.; Chao, Y.; Li, M.; Mahurin, S.M.; Li, H.; Zhu, H.; Dai, S. Controlled Gas Exfoliation of Boron Nitride into Few-Layered Nanosheets. Angew. Chem. Int. Ed. 2016, 55, 10766–10770. [Google Scholar] [CrossRef]
  19. Jiang, B.; Tian, C.; Wang, L.; Xu, Y.; Wang, R.; Qiao, Y.; Ma, Y.; Fu, H. Facile fabrication of high quality graphene from expandable graphite: Simultaneous exfoliation and reduction. Chem. Commun. 2010, 46, 4920. [Google Scholar] [CrossRef]
  20. Tang, Y.B.; Lee, C.-S.; Chen, Z.; Yuan, G.D.; Kang, Z.H.; Luo, L.B.; Song, H.S.; Liu, Y.; He, Z.; Zhang, W.; et al. High-Quality Graphenes via a Facile Quenching Method for Field-Effect Transistors. Nano Lett. 2009, 9, 1374–1377. [Google Scholar] [CrossRef]
  21. Van Thanh, D.; Pan, C.-C.; Chu, C.-W.; Wei, K.-H. Production of few-layer MoS2nanosheets through exfoliation of liquid N2–quenched bulk MoS2. RSC Adv. 2014, 4, 15586–15589. [Google Scholar] [CrossRef]
  22. Zhao, J.; Wang, Z.; Zhao, Q.; Xing, B. Adsorption of Phenanthrene on Multilayer Graphene as Affected by Surfactant and Exfoliation. Environ. Sci. Technol. 2013, 48, 331–339. [Google Scholar] [CrossRef] [PubMed]
  23. Cao, Q.; Huang, F.; Zhuang, Z.; Lin, Z. A study of the potential application of nano-Mg(OH)2 in adsorbing low concentrations of uranyl tricarbonate from water. Nanoscale 2012, 4, 2423. [Google Scholar] [CrossRef] [PubMed]
  24. Zhang, D.-Q.; Chai, J.-X.; Jia, Y.-X.; Wang, L.-J.; Zhao, Z.-L.; Cao, M. Facile Preparation of Few-layer MoS2-NS by Liquid-Phase Ultrasonic Exfoliation. In Proceedings of the 2017 International Conference on Manufacturing Engineering and Intelligent Materials (ICMEIM 2017), Guangzhou, China, 25–26 February 2017. [Google Scholar]
  25. Hai, X.; Chang, K.; Pang, H.; Li, M.; Li, P.; Liu, H.; Shi, L.; Ye, J. Engineering the Edges of MoS2 (WS2) Crystals for Direct Exfoliation into Monolayers in Polar Micromolecular Solvents. J. Am. Chem. Soc. 2016, 138, 14962–14969. [Google Scholar] [CrossRef]
  26. Ma, L.; Huang, G.; Chen, W.; Wang, Z.; Ye, J.; Li, H.; Chen, D.; Lee, J.Y. Cationic surfactant-assisted hydrothermal synthesis of few-layer molybdenum disulfide/graphene composites: Microstructure and electrochemical lithium storage. J. Power Sources 2014, 264, 262–271. [Google Scholar] [CrossRef]
  27. Li, H.; Zhang, Q.; Yap, C.C.R.; Tay, B.K.; Edwin, T.H.T.; Olivier, A.; Baillargeat, D. From Bulk to Monolayer MoS2: Evolution of Raman Scattering. Adv. Funct. Mater. 2012, 22, 1385–1390. [Google Scholar] [CrossRef]
  28. Korn, T.; Heydrich, S.; Hirmer, M.; Schmutzler, J.; Schüller, C. Low-temperature photocarrier dynamics in monolayer MoS2. Appl. Phys. Lett. 2011, 99, 102109. [Google Scholar] [CrossRef] [Green Version]
  29. Chakraborty, B.; Matte, H.R.; Sood, A.K.; Ra, C.N.R. Layer-dependent resonant Raman scattering of a few layer MoS2. J. Raman Spectrosc. 2013, 44, 92–96. [Google Scholar] [CrossRef]
  30. Bagnall, A.; Liang, W.; Marseglia, E.; Welber, B. Raman studies of MoS2 at high pressure. Phys. B+C 1980, 99, 343–346. [Google Scholar] [CrossRef]
  31. Chou, S.S.; De, I.; Kim, J.; Byun, S.; Dykstra, C.; Yu, J.; Huang, J.; Dravid, V.P. Ligand Conjugation of Chemically Exfoliated MoS2. J. Am. Chem. Soc. 2013, 135, 4584–4587. [Google Scholar] [CrossRef] [Green Version]
  32. Wang, L.; Xu, Z.; Wang, W.; Bai, X. Atomic Mechanism of Dynamic Electrochemical Lithiation Processes of MoS2 Nanosheets. J. Am. Chem. Soc. 2014, 136, 6693–6697. [Google Scholar] [CrossRef]
  33. Wilcoxon, J.P.; Newcomer, P.P.; Samara, G.A. Synthesis and optical properties of MoS2 and isomorphous nanoclusters in the quantum confinement regime. J. Appl. Phys. 1997, 81, 7934–7944. [Google Scholar] [CrossRef]
  34. Guan, G.; Zhang, S.; Liu, S.; Cai, Y.; Low, M.; Teng, C.P.; Phang, I.Y.; Cheng, Y.; Duei, K.L.; Srinivasan, B.M.; et al. Protein Induces Layer-by-Layer Exfoliation of Transition Metal Dichalcogenides. J. Am. Chem. Soc. 2015, 137, 6152–6155. [Google Scholar] [CrossRef] [PubMed]
  35. Mak, K.F.; Lee, C.; Hone, J.; Shan, J.; Heinz, T.F. Atomically Thin MoS2: A New Direct-Gap Semiconductor. Phys. Rev. Lett. 2010, 105, 1–4. [Google Scholar] [CrossRef] [PubMed] [Green Version]
  36. Wu, P.; Yin, N.; Li, P.; Cheng, W.; Huang, M. The adsorption and diffusion behavior of noble metal adatoms (Pd, Pt, Cu, Ag and Au) on a MoS2 monolayer: A first-principles study. Phys. Chem. Chem. Phys. 2017, 19, 20713–20722. [Google Scholar] [CrossRef]
  37. Zhan, W.; Jia, F.; Yuan, Y.; Liu, C.; Sun, K.; Yang, B.; Song, S. Controllable incorporation of oxygen in MoS2 for efficient adsorption of Hg2+ in aqueous solutions. J. Hazard. Mater. 2020, 384, 121382. [Google Scholar] [CrossRef]
  38. Lv, Y.; Zhang, R.; Zeng, S.; Liu, K.; Huang, S.; Liu, Y.; Xu, P.; Lin, C.; Cheng, Y.; Liu, M. Removal of p-arsanilic acid by an amino-functionalized indium-based metal–organic framework: Adsorption behavior and synergetic mechanism. Chem. Eng. J. 2018, 339, 359–368. [Google Scholar] [CrossRef]
  39. Yang, H.; Yuan, H.; Hu, Q.; Liu, W.; Zhang, D. Synthesis of mesoporous C/MoS2 for adsorption of methyl orange and photo-catalytic sterilization. Appl. Surf. Sci. 2020, 504, 144445. [Google Scholar] [CrossRef]
  40. Luo, J.; Fu, K.; Sun, M.; Yin, K.; Wang, D.; Liu, X.; Crittenden, J.C. Phase-Mediated Heavy Metal Adsorption from Aqueous Solutions Using Two-Dimensional Layered MoS2. ACS Appl. Mater. Interfaces 2019, 11, 38789–38797. [Google Scholar] [CrossRef]
  41. Choi, M.; Jang, J. Heavy metal ion adsorption onto polypyrrole-impregnated porous carbon. J. Colloid Interface Sci. 2008, 325, 287–289. [Google Scholar] [CrossRef]
  42. Li, H.; Xie, F.; Li, W.; Fahlman, B.D.; Chen, M.; Li, W. Preparation and adsorption capacity of porous MoS2 nanosheets. RSC Adv. 2016, 6, 105222–105230. [Google Scholar] [CrossRef]
  43. Nguyen, H.D.; Tran, H.N.; Chao, H.-P.; Lin, C.-C. Activated Carbons Derived from Teak Sawdust-Hydrochars for Efficient Removal of Methylene Blue, Copper, and Cadmium from Aqueous Solution. Water 2019, 11, 2581. [Google Scholar] [CrossRef] [Green Version]
  44. Li, R.; Deng, H.; Zhang, X.; Wang, J.J.; Awasthi, M.K.; Wang, Q.; Xiao, R.; Zhou, B.; Du, J.; Zhang, Z. High-efficiency removal of Pb(II) and humate by a CeO2–MoS2 hybrid magnetic biochar. Bioresour. Technol. 2019, 273, 335–340. [Google Scholar] [CrossRef] [PubMed]
  45. Yang, K.; Chen, B.; Zhu, X.; Xing, B. Aggregation, Adsorption, and Morphological Transformation of Graphene Oxide in Aqueous Solutions Containing Different Metal Cations. Environ. Sci. Technol. 2016, 50, 11066–11075. [Google Scholar] [CrossRef] [PubMed] [Green Version]
  46. Wang, C.; Yang, R.; Wang, H. Synthesis of ZIF-8/Fly Ash Composite for Adsorption of Cu2+, Zn2+ and Ni2+ from Aqueous Solutions. Materials 2020, 13, 214. [Google Scholar] [CrossRef] [PubMed] [Green Version]
Figure 1. (a) XRD patterns of (NH4)2MoS2, bulk MoS2, and MoS2-NS and (b) Raman spectra of bulk MoS2 and MoS2 nanosheets.
Processes 08 00504 g001
Figure 2. Field emission scanning electron microscope (FESEM) images (ad) of the bulk MoS2 and MoS2-NS, atomic force microscope (AFM) images (e,f), height profiles (inset), (transmission electron microscope) TEM and high-resolution transmission electron microscope (HRTEM) images of MoS2 nanosheets (gi), and the fast Fourier transforms (FFT) pattern of MoS2 NS (j).
Processes 08 00504 g002
Figure 3. Brunauer–Emmett–Teller (BET) N2 isotherms of the bulk MoS2 and MoS2 NS.
Processes 08 00504 g003
Figure 4. XPS survey spectra of MoS2 (a) and high-resolution scans of Mo3d (b), S2p (c), O1s (d).
Processes 08 00504 g004
Figure 5. Photographs (a), UV-vis absorption spectra (b), absorbance change with standing time (c) of the prepared MoS2 NS dispersions and photographs (d), UV-vis absorption spectra (e) and standard curve (f) of MoS2 NS dispersion in different concentrations.
Processes 08 00504 g005
Figure 6. Adsorption isotherms (a) and kinetics (c,e) of MB, MO for bulk MoS2 and MoS2 NS at 20 mg L−1; adsorption isotherms (b) and kinetics (d,f) of Cu2+, Cd2+ and Ag+ for bulk MoS2 and MoS2 NS at 15 mg L−1.
Processes 08 00504 g006
Figure 7. Equilibrium adsorption capacity (a,c) and standardized equilibrium adsorption capacity (b,d) of dyes (MO and MB) and heavy metals (Cu2+, Cd2+, and Ag+) for bulk MoS2 and MoS2 NS.
Processes 08 00504 g007
Figure 8. Effects of pH on dyes (a) and heavy metals (b) over MoS2 NS, and the Zeta potential (c) of MoS2 NS at different pH values. For dyes: 20 mg L−1 of the initial concentration, for heavy metals: 15 mg L−1 of the initial concentration.
Processes 08 00504 g008
Table 1. Fitted parameters for the adsorption of dyes and heavy metals on MoS2 NS and bulk MoS2.
SamplesTargetsLangmuir ModelFreundlich Model
qm (mg g−1)KL (L mg−1)R21/nKf (L g−1)R2
MoS2 NSMB344.80.7250.9940.64892.7960.875
MO123.50.3930.9800.7249.0230.969
Bulk MoS2MB27.00.2380.9960.5046.3810.915
MO17.80.1870.9920.4494.9880.904
MoS2 NSCd2+185.20.6060.9850.70840.4960.943
Cu2+169.50.5880.9890.69335.8480.938
Ag+70.40.3390.9930.53318.3260.914
Bulk MoS2Cd2+18.70.2970.9520.4636.0690.979
Cu2+16.30.2850.9630.4595.3210.991
Ag+11.70.1340.9870.3894.9130.968

