Hydrodynamics of Pulsed Fluidized Bed of Ultrafine Powder: Fully Collapsing Fluidized Bed


Department of Chemical Engineering, King Saud University, P.O. Box 800, Riyadh 11421, Saudi Arabia
*
Author to whom correspondence should be addressed.
Processes 2020, 8(7), 807; https://0-doi-org.brum.beds.ac.uk/10.3390/pr8070807
Submission received: 8 June 2020
/
Revised: 6 July 2020
/
Accepted: 7 July 2020
/
Published: 9 July 2020
(This article belongs to the Special Issue Recent Advances in Fluidized Bed Hydrodynamics and Transport Phenomena)
Abstract
:The processing of fine and ultrafine particles using a fluidized bed is challenging in view of their unpredictable hydrodynamic behavior due to interparticle forces. The use of assisted fluidization techniques in such cases can be effective in improving the bed hydrodynamics. This work investigates the dynamics of pulsed fluidized bed of ultrafine nanosilica subjected to square-wave flow pulsations. The pulse duration used in this study is sufficient to allow the complete collapse of the pulsed fluidized bed between two consecutive flow pulsations. The proposed pulsation strategy is carefully implemented using electronic mass flow controllers with the help of analog output signals from data acquisition system. Given that the different regions of the fluidized bed exhibit varying dynamics, which together contribute to overall bed dynamics, the bed transients in the upper, central, and lower regions of the fluidized bed are monitored using several sensitive pressure transducers located along the height of the bed. The effect of the flow pulsation on the hydrodynamics of the fluidized bed is rigorously characterized. A significant reduction in the minimum fluidization velocity was obtained and an increase in the bed homogeneity was observed due to flow pulsations. The frequency domain analysis of the signals clearly delineated the frequency of the various events occurring during the fluidization.
1. Introduction
Fluidized beds are widely used in particle processing operations owing to intimate contact between phases and efficient mixing that lead to high rates of heat and mass transfer. Moreover, unlike the inverse square dependence of the pressure drop on the particle size for fixed beds at low velocities, the fluidized bed mode of operation limits the pressure drop to the effective weight of the bed. This feature of the of fluidized bed allows the use of small particles with high effectiveness factor as catalytic support, thereby ensuring improved catalyst utilization that ultimately results in enhanced process efficiency.
Fine and ultra-fine particles possess extremely high specific surface areas that can tremendously enhance the surface-based rate processes. However, the extremely small particle sizes lead to strong interparticle forces. Therefore, such particles often exhibit unpredictable hydrodynamics when processed using fluidized beds. The interrelation of particle sizes with their fluidization hydrodynamics has been pointed out by Geldart [1], who classified fine particles with a diameter less than 30 μm as group C because of their cohesive behavior. Such particles’ fluidization behavior is generally characterized by agglomeration, channeling and gas by-passing, resulting in poor interphase mixing and other non-homogeneities, which if not properly addressed can compromise their effective utilization [2,3].
The common strategy used to improve the fluidization hydrodynamics is the augmentation of extra energy to the bed of particles to overcome interparticle forces, thereby promoting de-agglomeration and eliminating bed non-homogeneities. Common assisted fluidization techniques are based on the use of acoustics [4,5,6,7,8], particle-mixing [9,10,11,12,13,14,15], flow pulsations [16,17,18,19,20,21,22,23,24,25,26], and mechanical vibrations [27,28,29,30,31,32,33]. The combination of two of assisted fluidization techniques has also been suggested in some cases [15,34,35,36].
The successful scale up of any assisted fluidization technique will ultimately depend upon its cost-effectiveness. Flow pulsation, unlike other assisted fluidization strategies, is an especially promising technique given that no additional energy input is required in its implementation. The bed is subjected to intense mixing due to periodic changes in the velocity of the fluidizing medium, which invariably results in a significant improvement in the fluidization hydrodynamic. For example, pulsating flow was used to improve the bed homogeneity and significantly reduce the drying time of pharmaceutical granules [19]. Significant reduction in the minimum fluidization velocity (Umf) and improvement in the bed homogeneity have been observed in a bed of hydrophilic nanopowder subjected to flow pulsations [20]. Another study has reported improved fluidization behavior and approximately 72% reduction in the Umf with pulsed gas flow [21]. The collapse data of a pulsed fluidized bed have also suggested a significant decrease in the size of nanoagglomerates [22]. However, the mean agglomerate diameter evaluated from the bed collapse data was not affected by the pulsation frequency [23]. The flow pulsation has helped to decrease the Umf and enhance the fluidization hydrodynamics of cohesive powder of micron-sized particles [24]. Even low frequency pulsations have proved to significantly improve the hydrodynamics of ultrafine hydrophilic nanopowder with strong agglomeration tendencies [26].
A close look on the experimental setup used for assisted fluidization technique of flow pulsation reveals that most studies have relied on the solenoid valve to introduce the square-wave flow pulsations [20,24,35]. However, this configuration leads to pressure buildup in the inlet line when the flow is stopped during the “off” position of the solenoid valve. Consequently, when the flow starts again after the interruption, the inlet line pressure buildup causes a flow impulse in the bed leading to a pressure-drop spike. This phenomenon is more prominent for low velocity and low frequency pulsations [23]. Recently, Zhu et al. [37] suggested using a special purpose solenoid valve that vents the fluidizing gas to the atmosphere during the “off” position. However interesting, its usefulness is limited only to cases where the fluidizing gas is the ambient air. Therefore, instead of using solenoid valve, electronic mass flow controllers are used in this study for a precise control of the gas flow to the fluidized bed. The flow and its duration are accurately controlled using analog output from an 18-bit data acquisition system. Another aspect of the fluidized bed hydrodynamics that has recently attracted attention is the non-uniformity along the height of the fluidized bed. Agglomerates present in the lower region of a mechanically vibrated fluidized bed of nanopowders were reported to be approximately 10 times larger than the ones in the upper region of the bed. Stirring using an impeller in the bottom of the bed somehow helped to mitigate this axial agglomerate size non-uniformity. However, the combination of assisted-fluidization techniques of vibration and stirring failed to completely eliminate the size segregation of agglomerates [36]. Therefore, the pulsed bed dynamics is carefully monitored in the upper, central, and lower regions of the fluidized bed using several sensitive pressure transducers located along the height of the fluidized bed to delineate the local fluidization behavior. Since the pulsation frequency has been reported to affect the behavior of pulsed beds [24,35], the pulse duration in this study is fixed to ensure complete collapse of the bed between two consecutive pulsations. Besides analyzing the frequency response of bed transients, the experimental data are processed to evaluate the effect of pulsation on the mean pressure drop characteristics of different regions of the fluidized bed and the minimum fluidization velocity.
2. Experimental
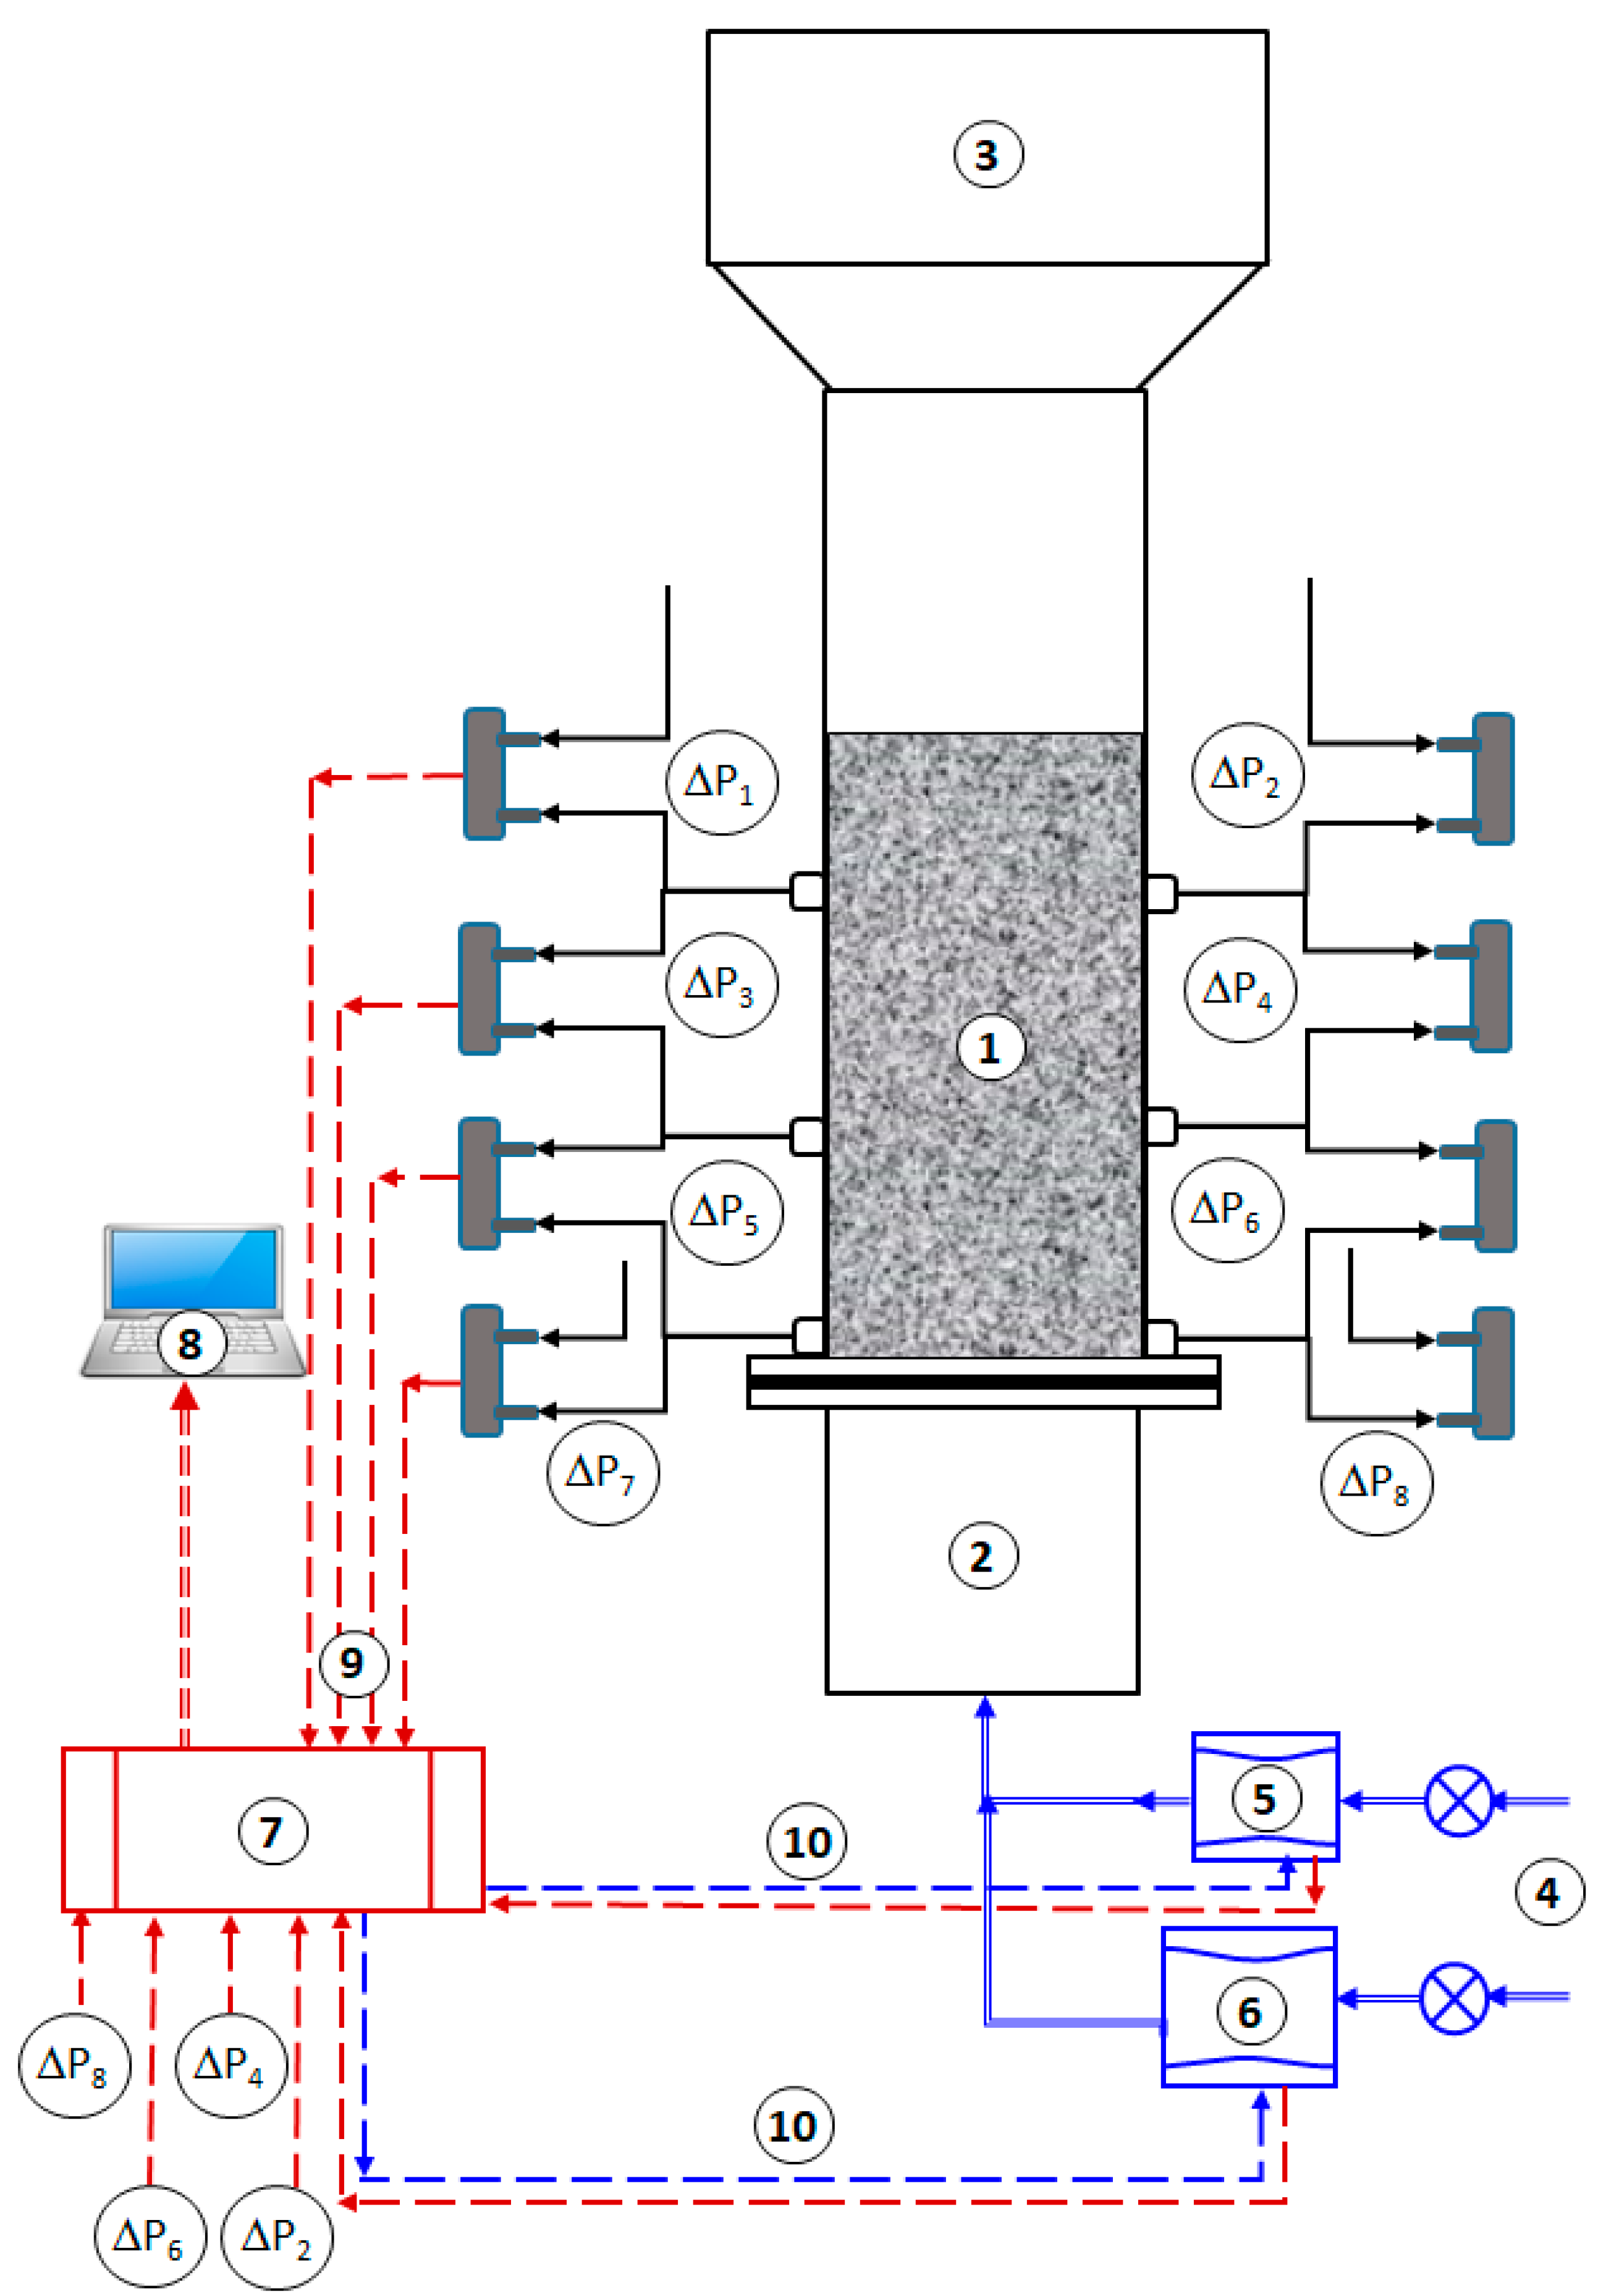
The schematic of the experimental setup is shown in Figure 1. The test-section was a 1.5-m long transparent cylindrical Plexiglas column of 70 mm internal diameter. A 0.5-m long calming section before the test-section was used to eliminate the entry effects of the inlet fluidizing air. Located between the test and calming sections, a 9 mm thick perforated plate with 2 mm holes arranged on a square pitch and 4% fractional open area was used as distributor to ensure uniform air distribution across the cross-section of the test-section. Such a design of the distributor was used to ensure sufficient pressure drop across the distributor and eliminate the dead-zones in the distributor region [38]. A fine nylon mesh was used to cover the distributor to prevent the clogging of its perforations with the fine solid particles present in the bed. Another 0.5-m long disengagement section of 140 mm internal diameter was placed above the test-section for the suppression of the carryover loss of the solid particles present in the bed. Pressurized air from the central compressed air supply available at 3 atm. gauge pressure was used for the experiments.
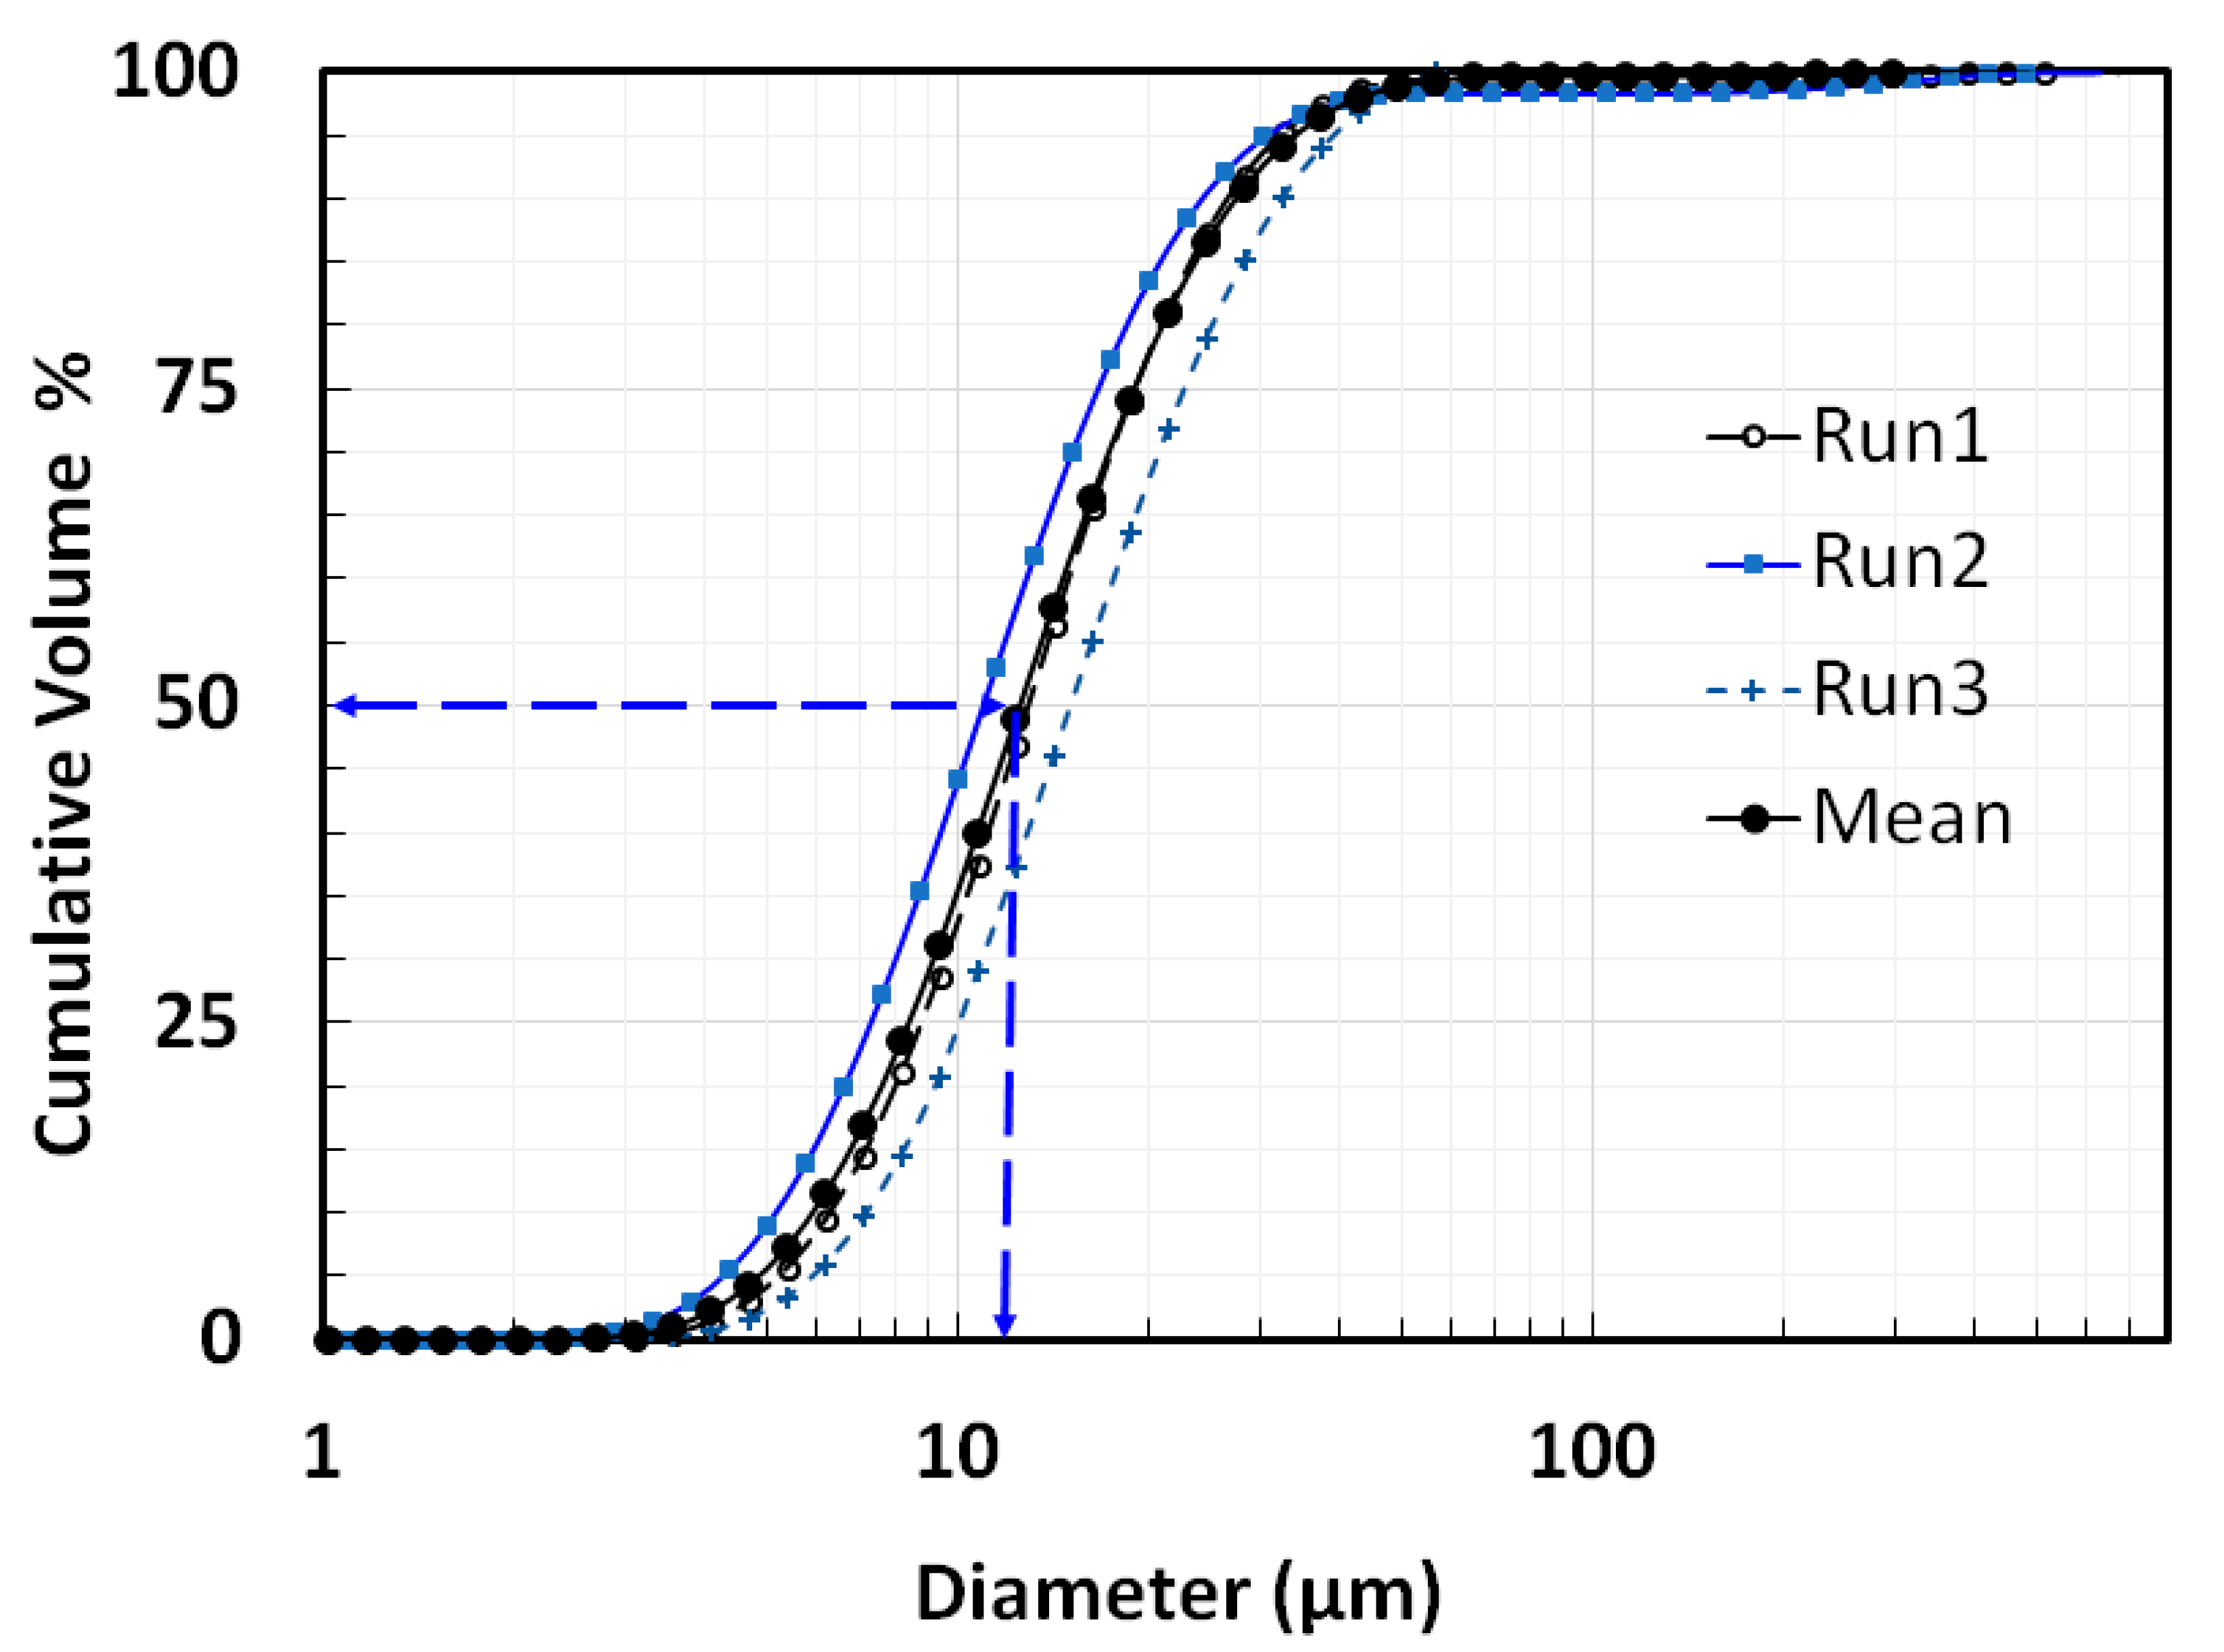
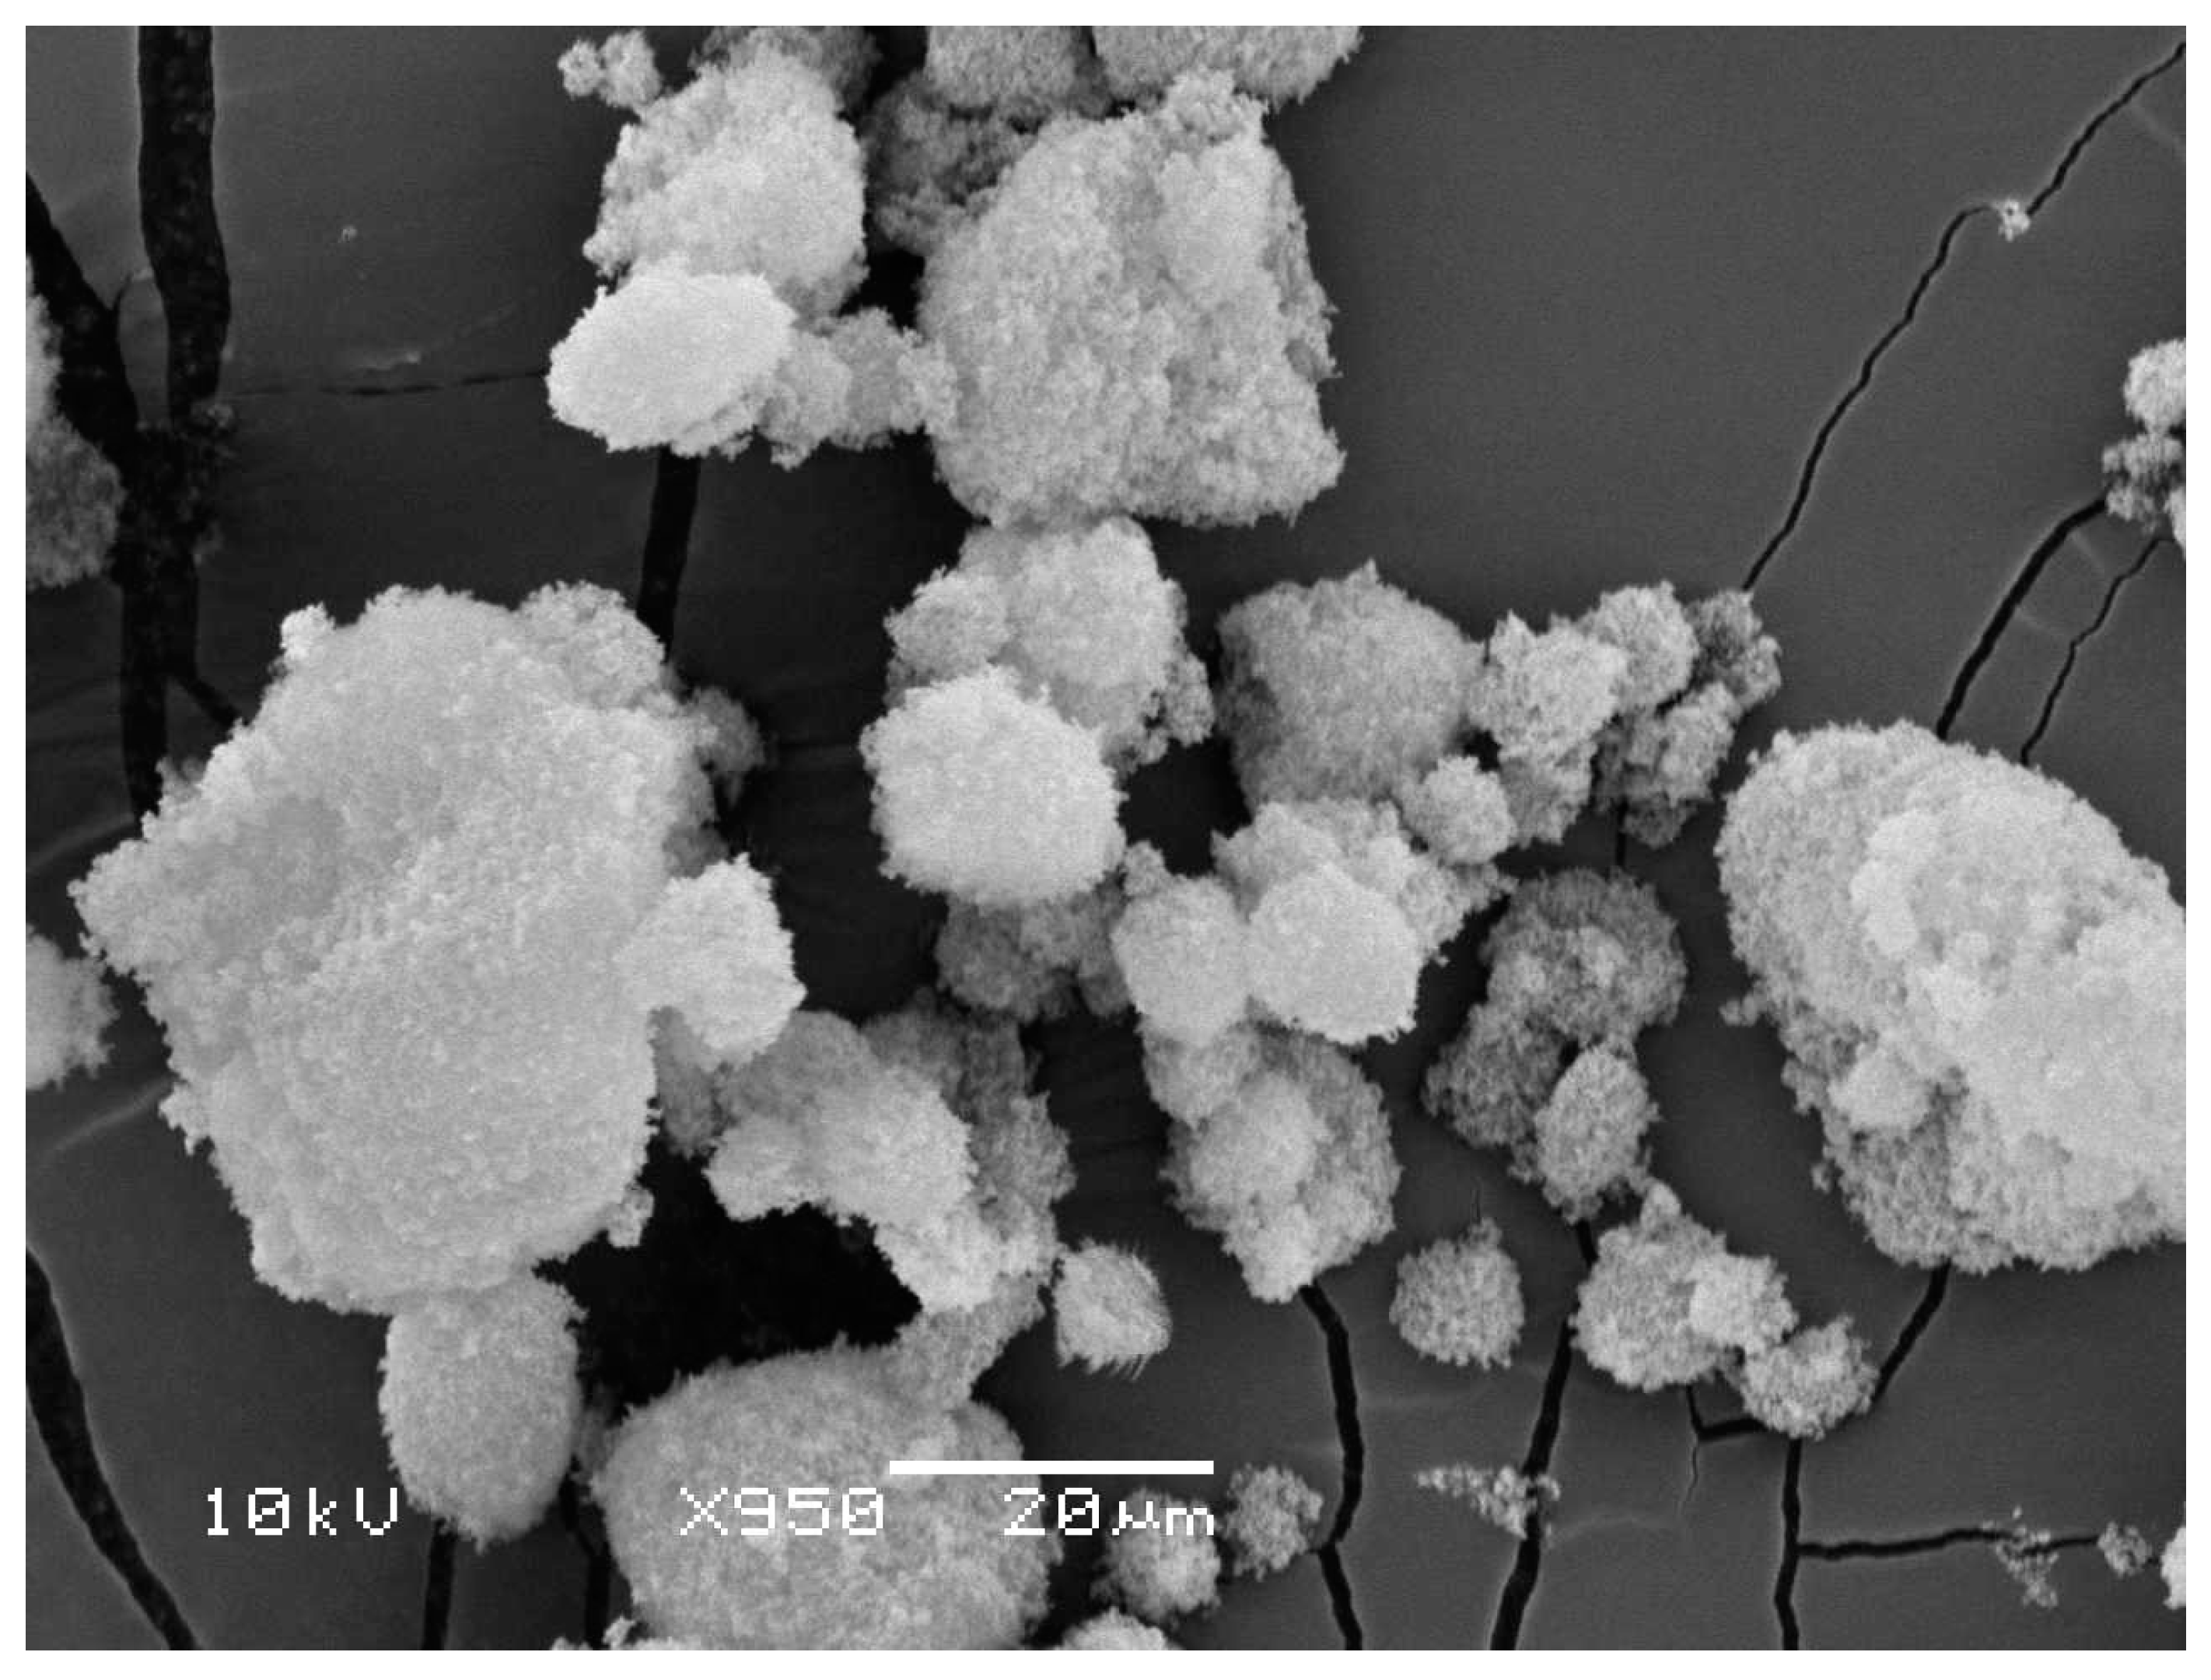
Hydrophilic fumed nanosilica (AEROSIL 200) with a reported surface area of 200 m2/g was used in our experiments. The sample was sieved to remove the large agglomerates. The particle size analysis results of dry nanosilica sample obtained from using Mastersizer 2000 (Malvern Panalytical Ltd, Malvern, UK) are shown in Figure 2. Although the reported primary size the nanoparticles was 12 nm, the average size was found to be 12.5 µm due to their agglomeration. The scanning electron microscope (SEM) image of sieved sample is shown in Figure 3. While a few agglomerates were as large as 50 µm, most agglomerates size appears to be approximately 10 µm. Thus, wide size distribution obtained in the particle size analysis was confirmed from the SEM imaging.
Pressure transients in the different regions of the bed were carefully monitored using several sensitive pressure transducers with a response time of 1 ms. The lowest pressure tap was 11 mm above the distributor plate, whereas the two other taps were located at a distance of 110 mm and 230 mm from the distributor. As shown in Figure 1, two pressure taps were located at diametrically opposite sides of the test-section to monitor the occurrence of radial non-uniformities. Thus, ∆P1 (i.e., left side) and ∆P2 (i.e., right side) monitored the transients in the upper region of the test-section. The upper port of ∆P1 and ∆P2 was open to the atmosphere, whereas the lower port was connected to the pressure tap located 230 mm above the distributor. Similarly, ∆P3 (i.e., left side) and ∆P4 (i.e., right side) recorded the bed transients in the middle region of the fluidized bed. These pressure transducers were connected to pressure taps located 110 mm and 230 mm above the distributor. The bed dynamics in the lower region was monitored using pressure transducers ∆P5 (i.e., left side) and ∆P6 (i.e., right side) with their upper and lower ports connected, respectively, with taps located 110 mm and 11 mm above the distributor (Figure 1). Moreover, two pressure transducers ∆P7 and P8 were used for monitoring global pressure transients. In this case, the lower port was connected with lower pressure tap, whereas the upper port was open to the atmosphere. Thus, the sum of local pressure drops would ideally yield the global pressure drop as follows:
A fine nylon mesh screen was used to cover the openings of the pressure taps to prevent the clogging of the pressure tap lines due to the entrainment of the solid particles present in the bed. To ensure the accuracy of measurements, Fluke 718 Pressure Calibrator (Everett, WA, USA) were used for the calibration of the pressure transducers.
The pressure transducers were connected to a USB-6289 data acquisition system (DAQ), which is a 32 AI (18-Bit, 625 kS/s), 4 AO (2.86 MS/s) system obtained from National Instruments, located in Texas, US. The sampling frequency of the pressure transients was kept at 100 Hz to record 100 samples in one second. This sampling rate was sufficient to delineate the bed dynamics.
Inlet flow of the fluidizing air to the test-section was carefully monitored using two electronic mass controllers of different ranges, which were connected to separate stable supplies of compressed air. Both mass flow controllers were connected to DAQ, which controlled flow rates of the input air. Two DAQ analog outputs were used (i.e., one for each mass flow controller) to generate the flow pulsation of required frequency. National Instruments LabVIEW software was used to generate pulsation signals. Such signals were transmitted to DAQ, and subsequently to the mass flow controllers as an analog output in volts corresponding to the required flowrate in liters per minute (LPM).
The fumed nanosilica sample was first carefully sieved to remove large agglomerates, which often formed due to storage over time. A total of 62 g of the sieved nanosilica was then loaded into the test-section with frequent tapping. The bed material was left overnight to allow its settling. These steps were taken to ensure bed homogeneity before conducting the experiments. The static bed height was 370 mm.
The experimental strategy was a two-step procedure. In the first step, the hydrodynamics of the conventional unassisted fluidization was studied for a wide range of velocities. A total of 18 different velocity steps were considered by increasing and then decreasing the flow rate of the fluidizing gas. Each velocity step lasted for 80 s. Hydrodynamics of the fluidized bed subjected to flow pulsations was rigorously investigated in the second stage of this work. Similar to unassisted fluidization, 18 velocity step changes were introduced by progressively increasing the velocity during the fluidization cycle followed by a similar step-wise decrease during the defluidization cycle. Each velocity step in the experiment lasted for 50 s. The inlet flow was regularly pulsed with the help of DAQ-controlled mass flow controllers at a frequency of 0.1 Hz. This process composed of 5 s of uninterrupted inlet air flow to the bed followed by 5 s of complete flow interruption (i.e., zero flow).
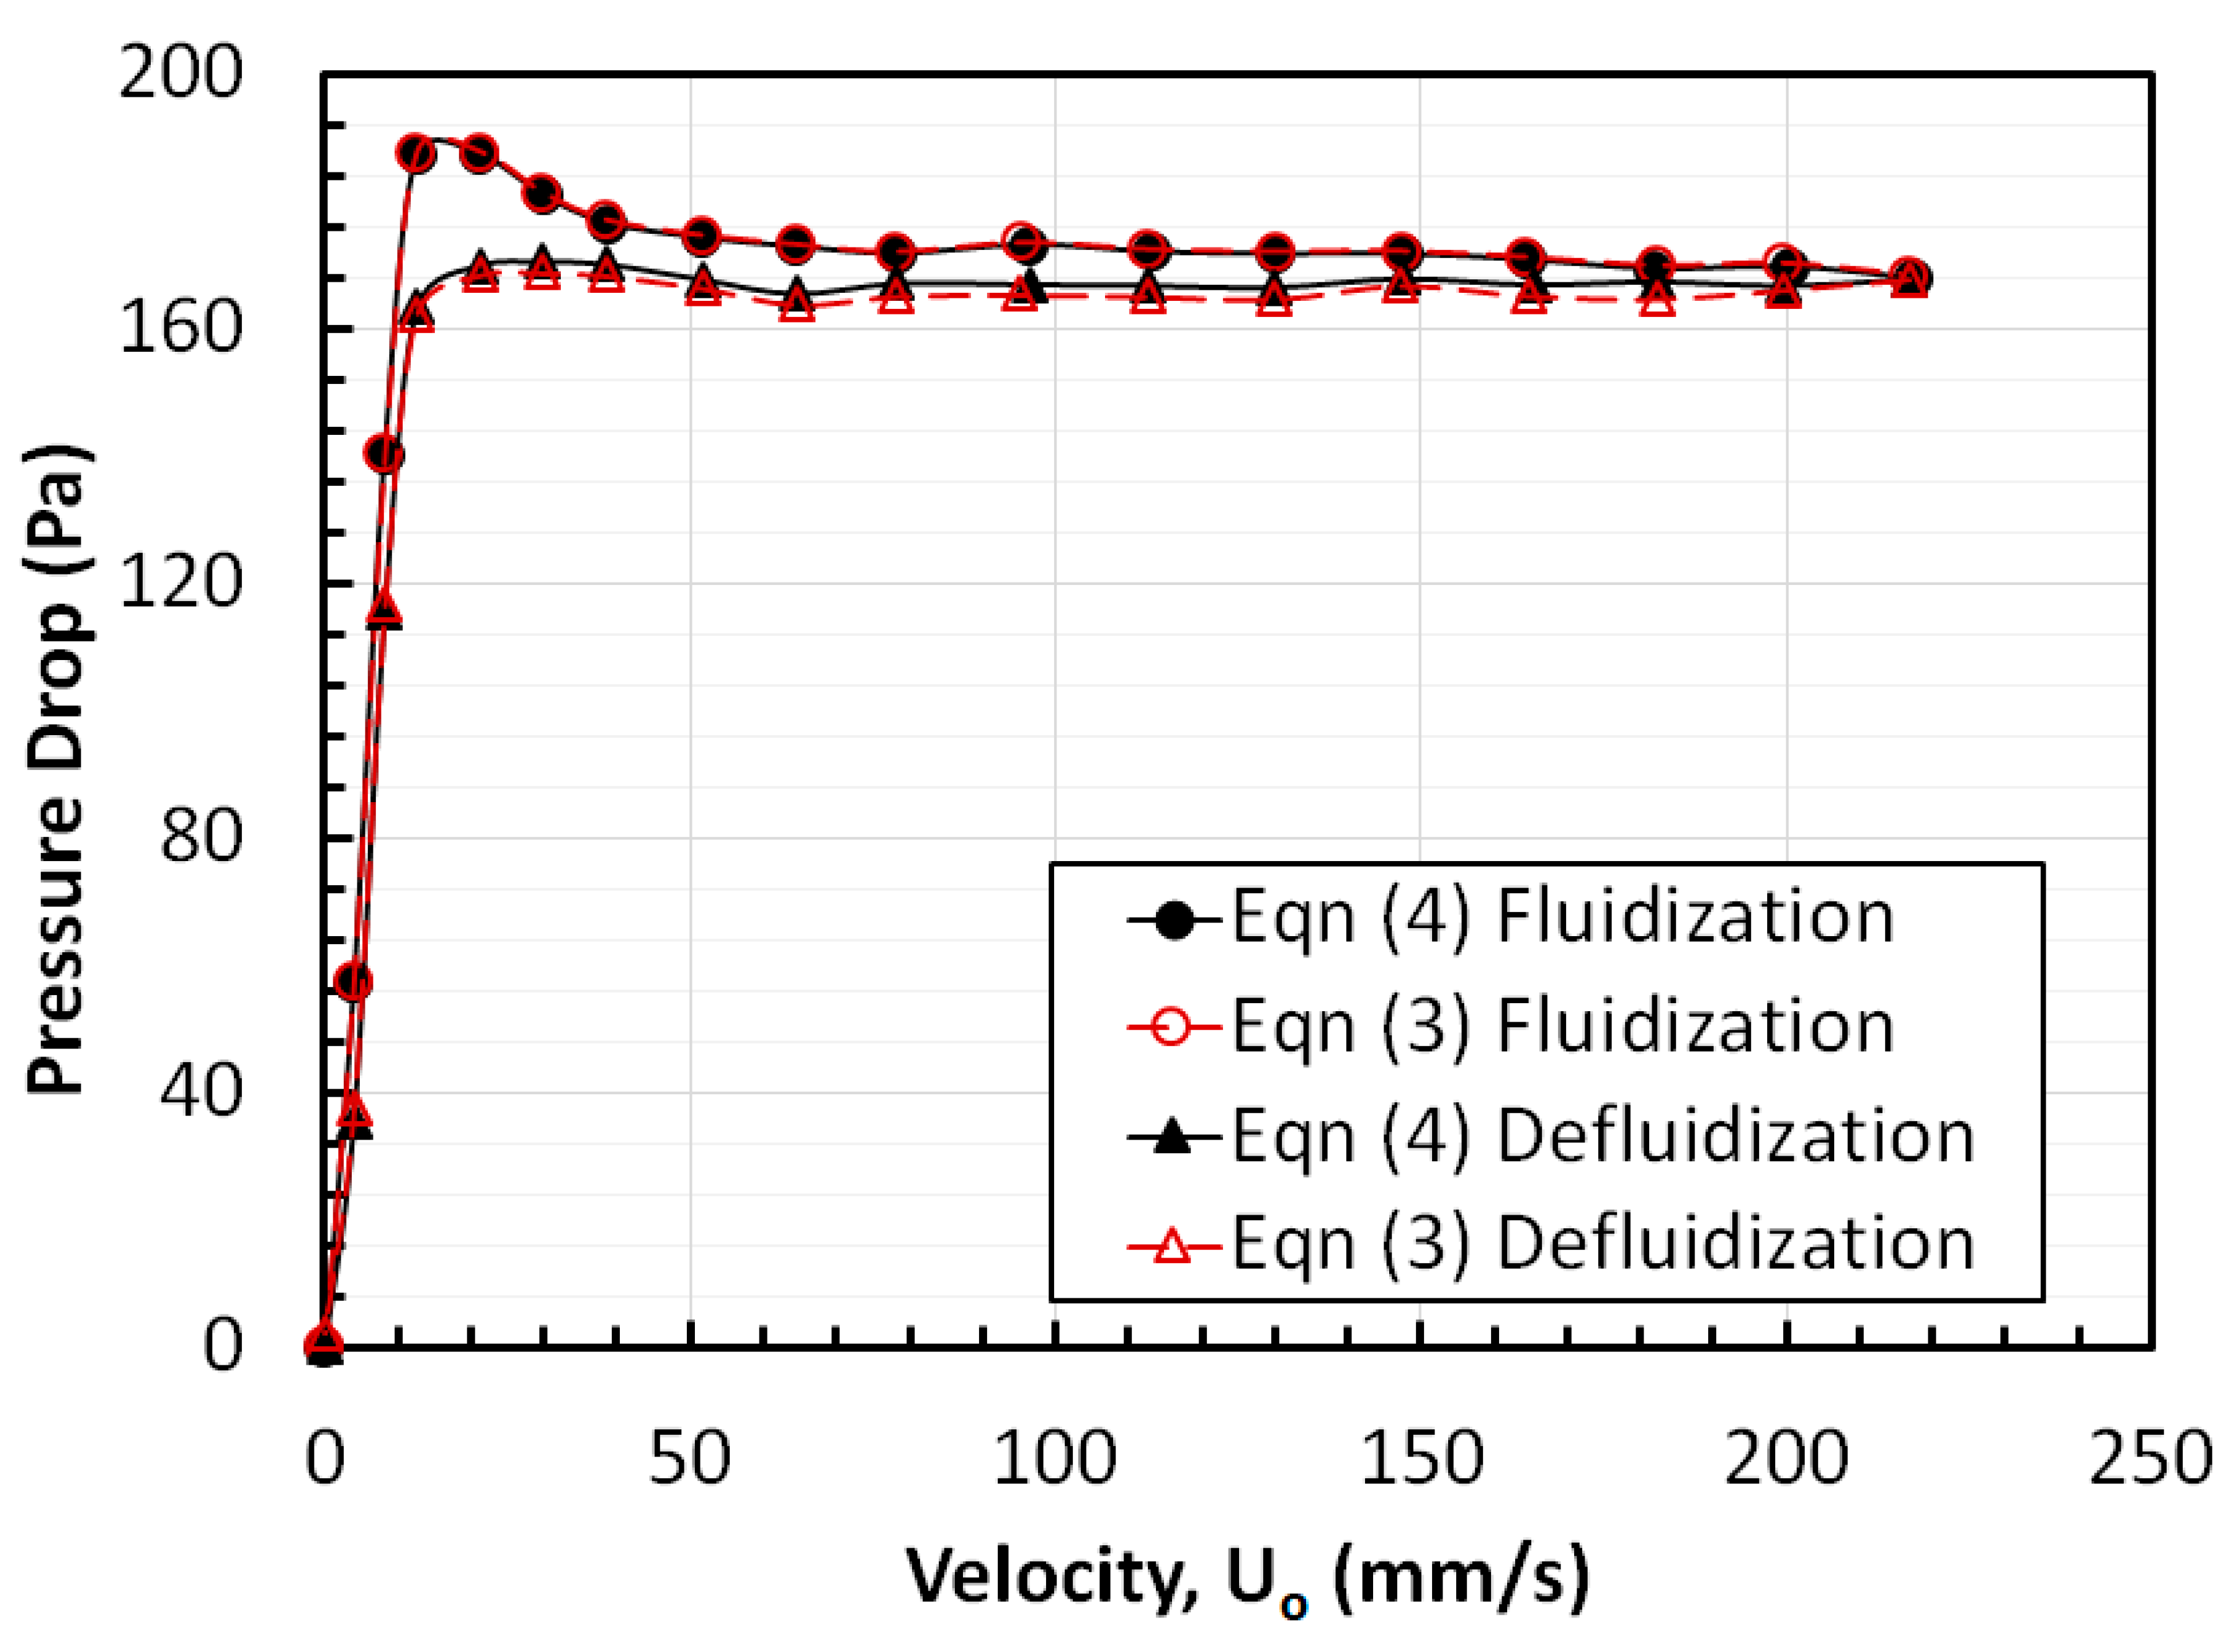
To ensure the reproducibility of the experimental data, two experimental runs were conducted for the same set of experimental conditions. An excellent agreement was mostly observed between the two runs. To verify the reliability of pressure drop measurements of different pressure transducers, the local pressure drops of all the three regions, namely lower, middle, and upper regions, were summed using Equation (3) as follows,
and compared with the global pressure drop across the bed, which was evaluated as follows,
The results of the comparison for fluidization and defluidization are shown in Figure 4. The observed excellent agreement confirmed the reliability of the pressure drop measurements in the experiments.
3. Results and Discussion
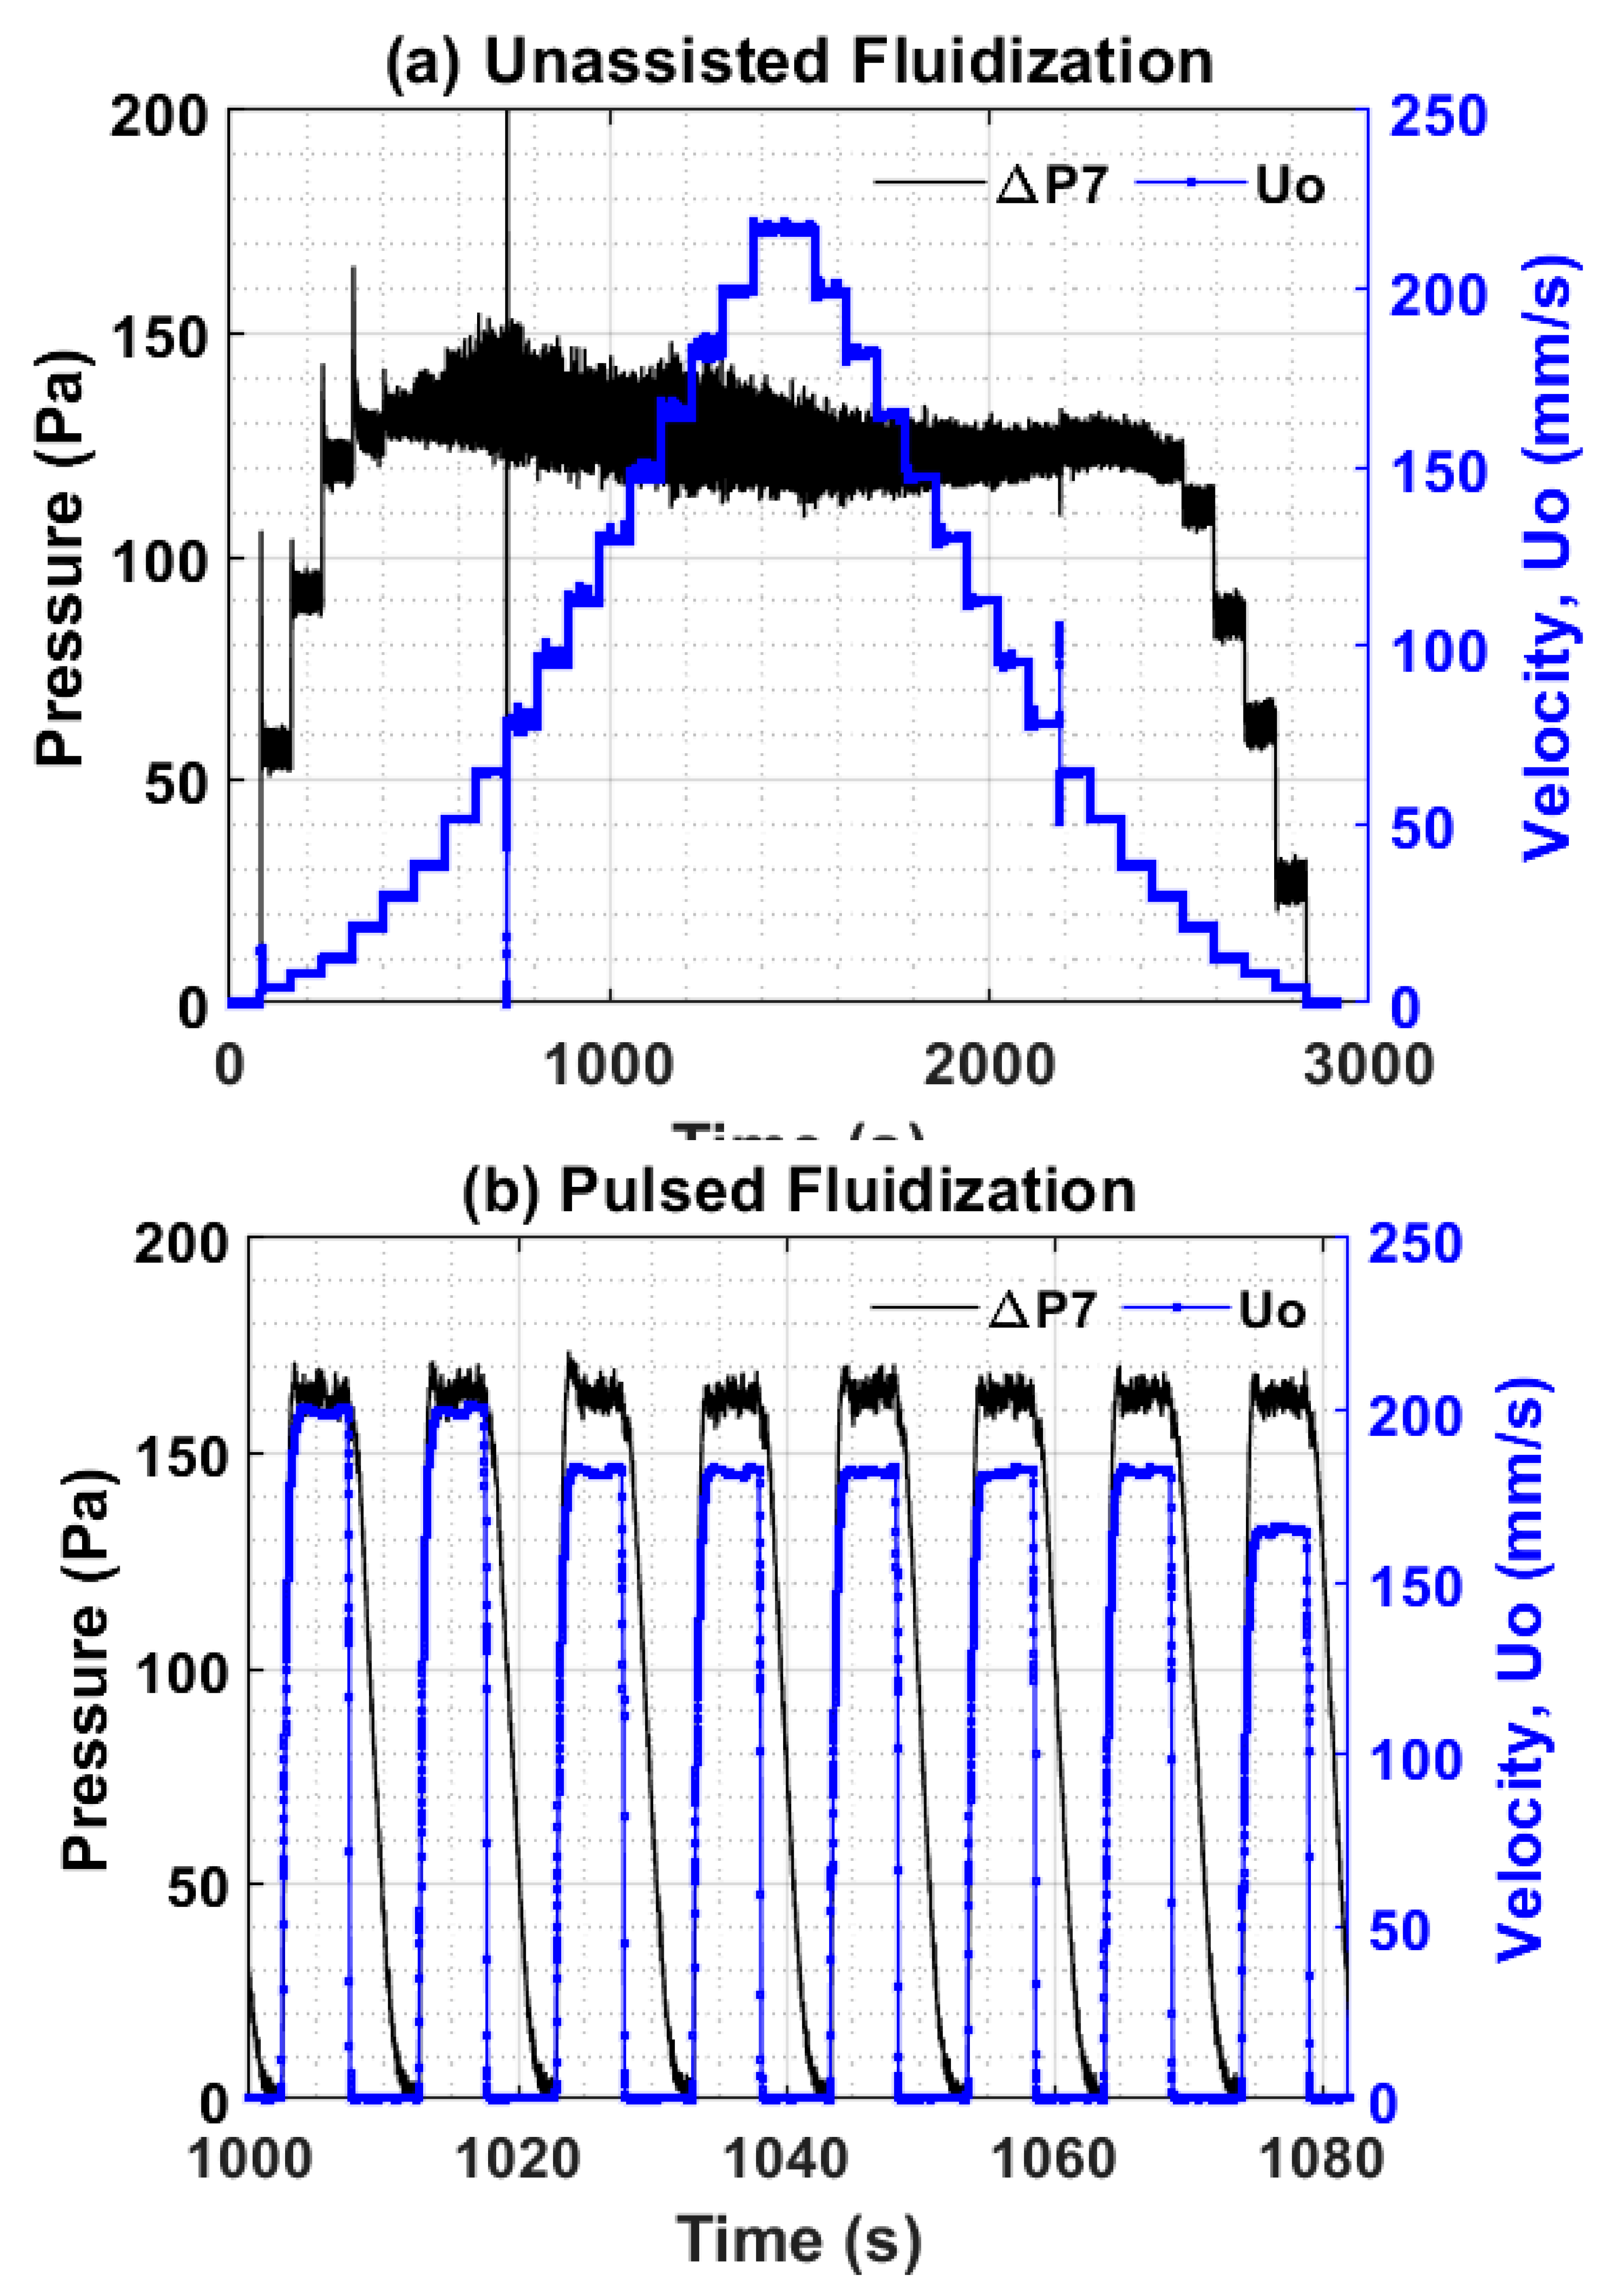
The velocity and the overall pressure drop data of a single complete unassisted fluidization experimental run is presented in Figure 5a. There are 18 velocity steps of 80 s duration in the fluidization cycle of the experiment followed by an equal number of velocity steps during the defluidization cycle. Even a small change in the velocity at small flows causes a big change in the pressure drop due to the fixed bed mode of fluid-solid contact. When the bed is fluidized, the change in the velocity hardly affects the magnitude of the pressure drop. However, the bed dynamics showed substantial fluctuations. During the defluidization cycle of the experiment, the pressure drop fluctuations show significant attenuation due to greater bed homogeneity, which was also reflected by a relatively low pressure drop when the bed settles at low velocities.
Figure 5b presents the case of pulsed fluidized bed for the duration of 80 s lasting from 1000s to 1080s. There are two pulses of 200 mm/s, five pulses of 182 mm/s, and one pulse of 165 mm/s. Each 50 s velocity step was in fact composed of five identical square pulses as observed for the case of 182 mm/s in the figure. The global pressure drop transients are also shown in the figure. Evidently, when the flow pulse begins, the bed shows a simultaneous rapid increase in the pressure drop along with the velocity. Although the velocity shows an instantaneous response to the end of the flow pulse, there was nevertheless a delay of approximately 5 seconds in the completion of the bed collapse process. The end of the collapse process was indicated by the zero pressure drop across the fluidized bed. Therefore, we choose 0.1 Hz flow pulsation in this study to ensure the complete collapse of the fluidized bed between two consecutive pulses.
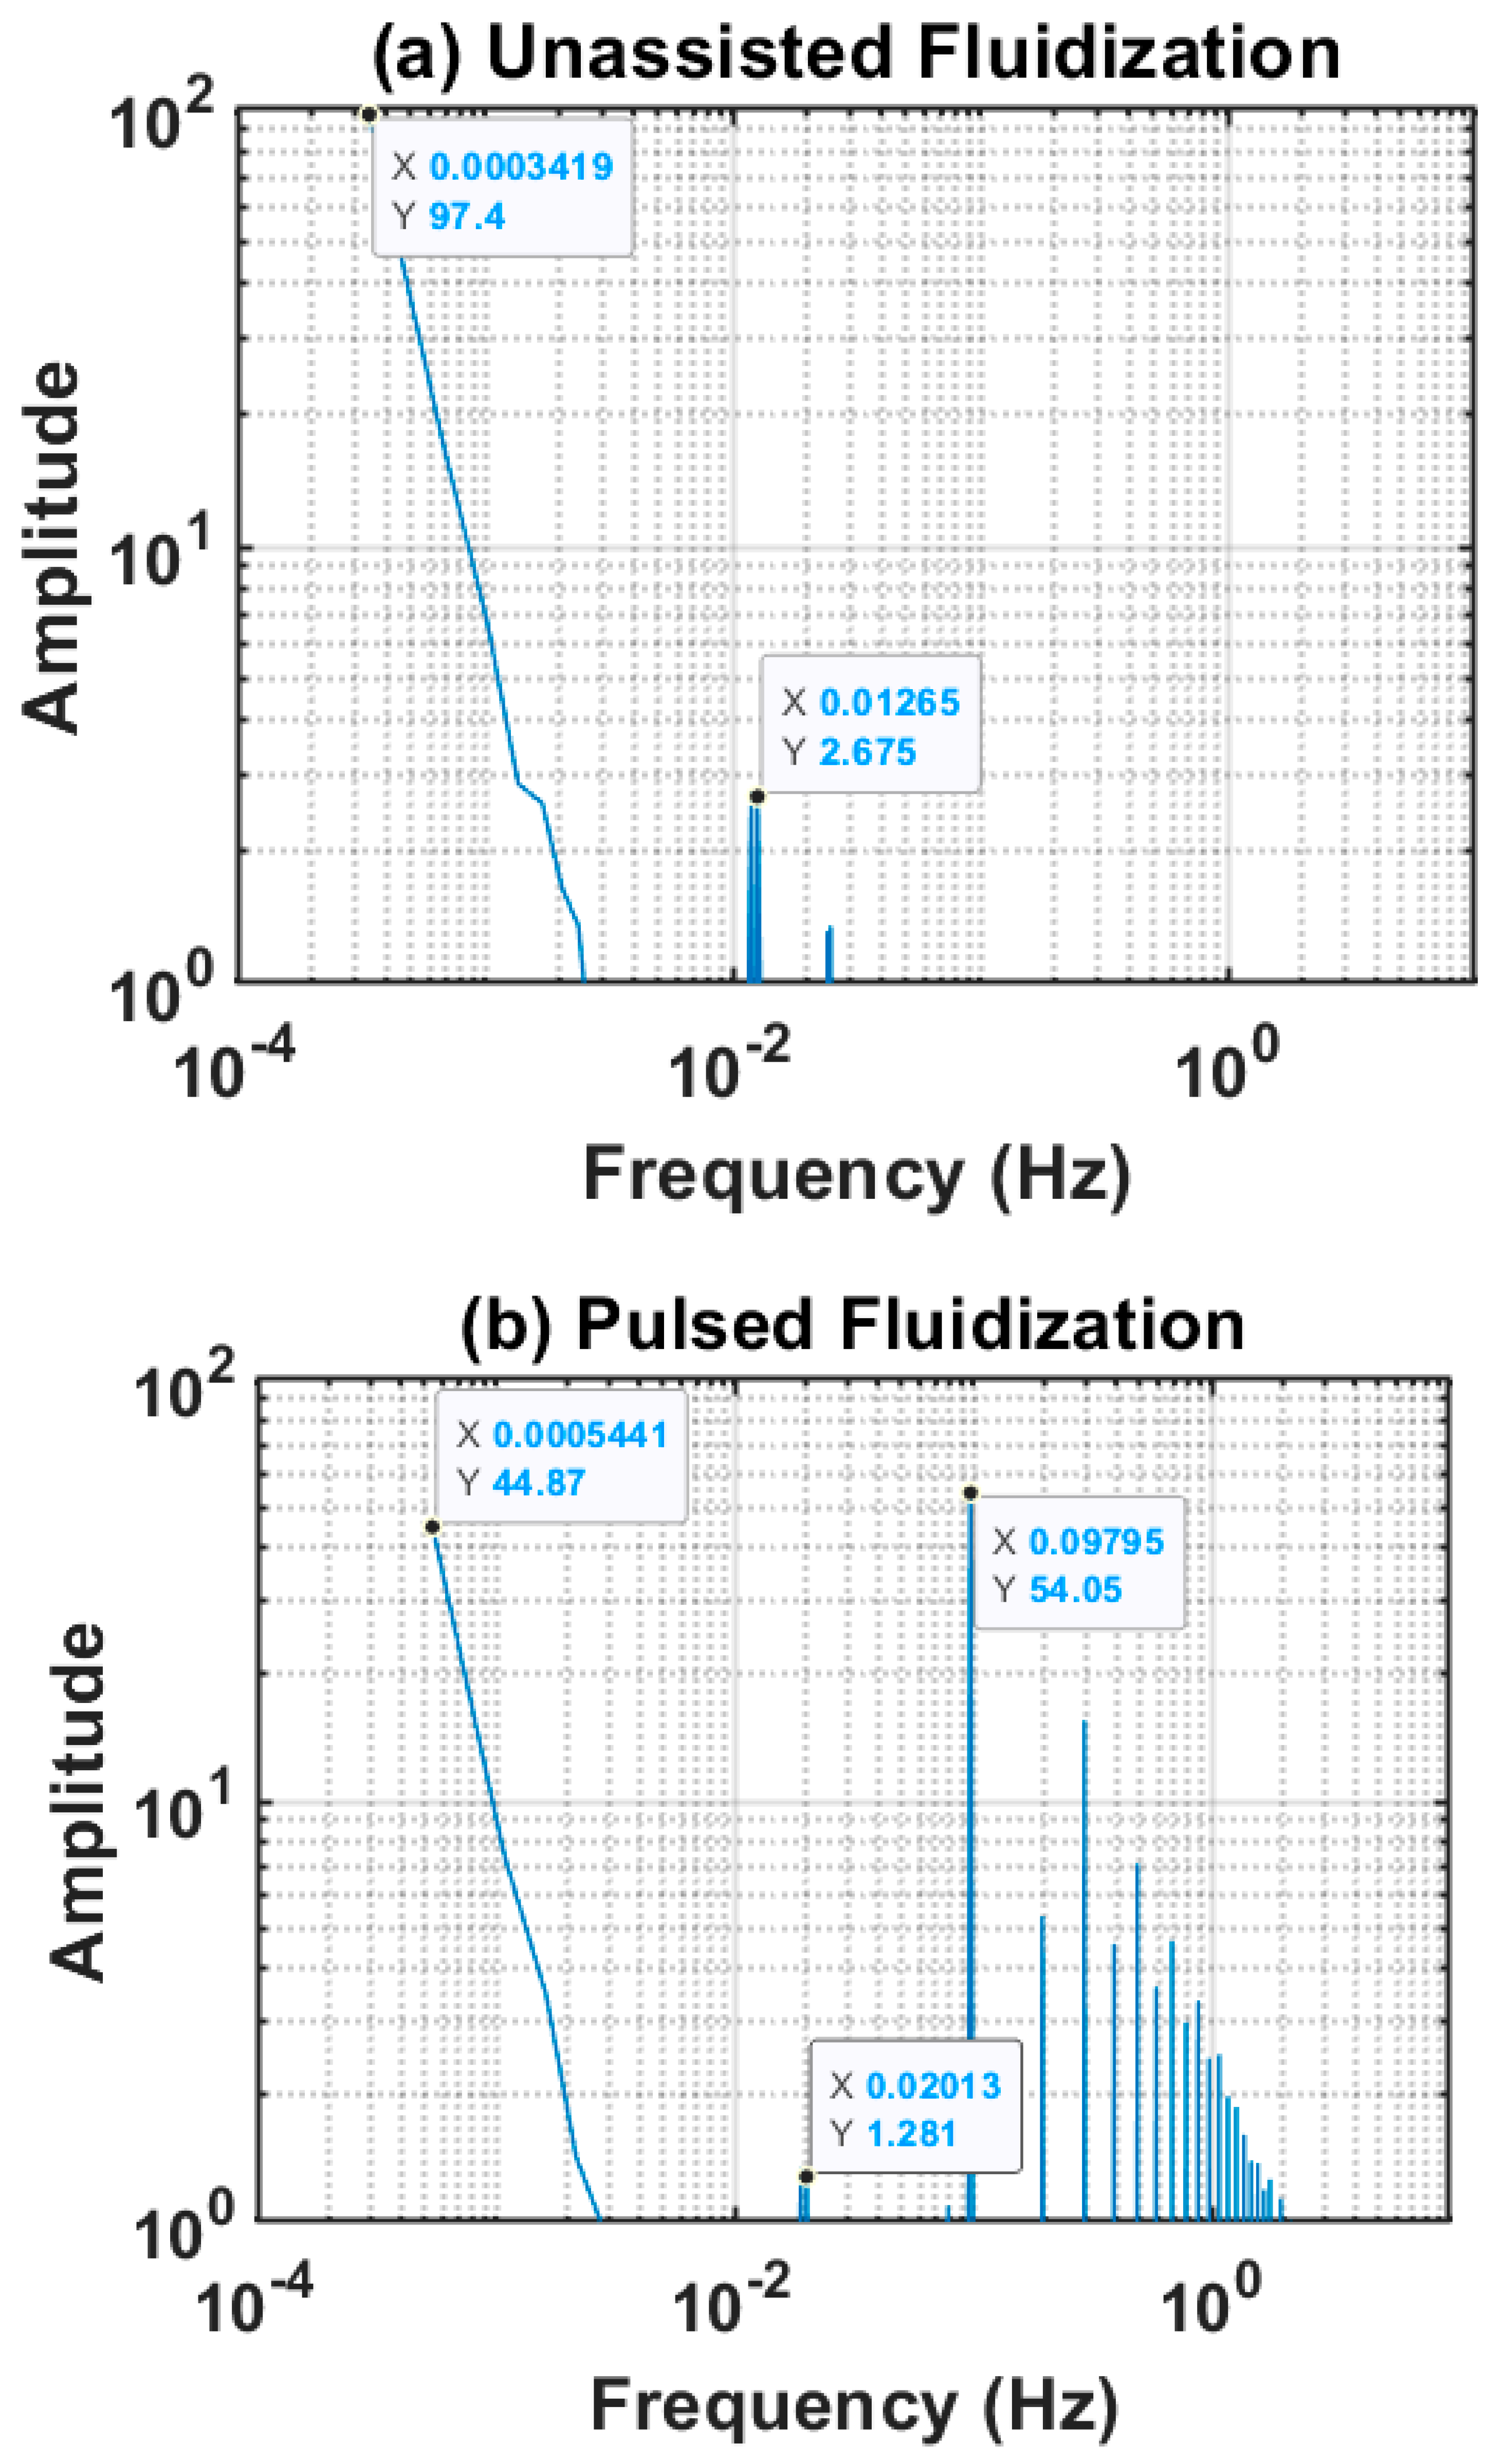
The frequency spectra for both cases are shown in Figure 6. A peak at 0.01265 Hz for the unassisted fluidization corresponds to an event with a time interval of 80 s, which in the present study are velocity steps of 80 s duration. A prominent peak at approximately 0.1 Hz in Figure 6b corresponds to flow pulsations of 10 s duration. Another smaller peak at 0.02 Hz for the pulsed fluidization correspond to velocity steps of 50 seconds.
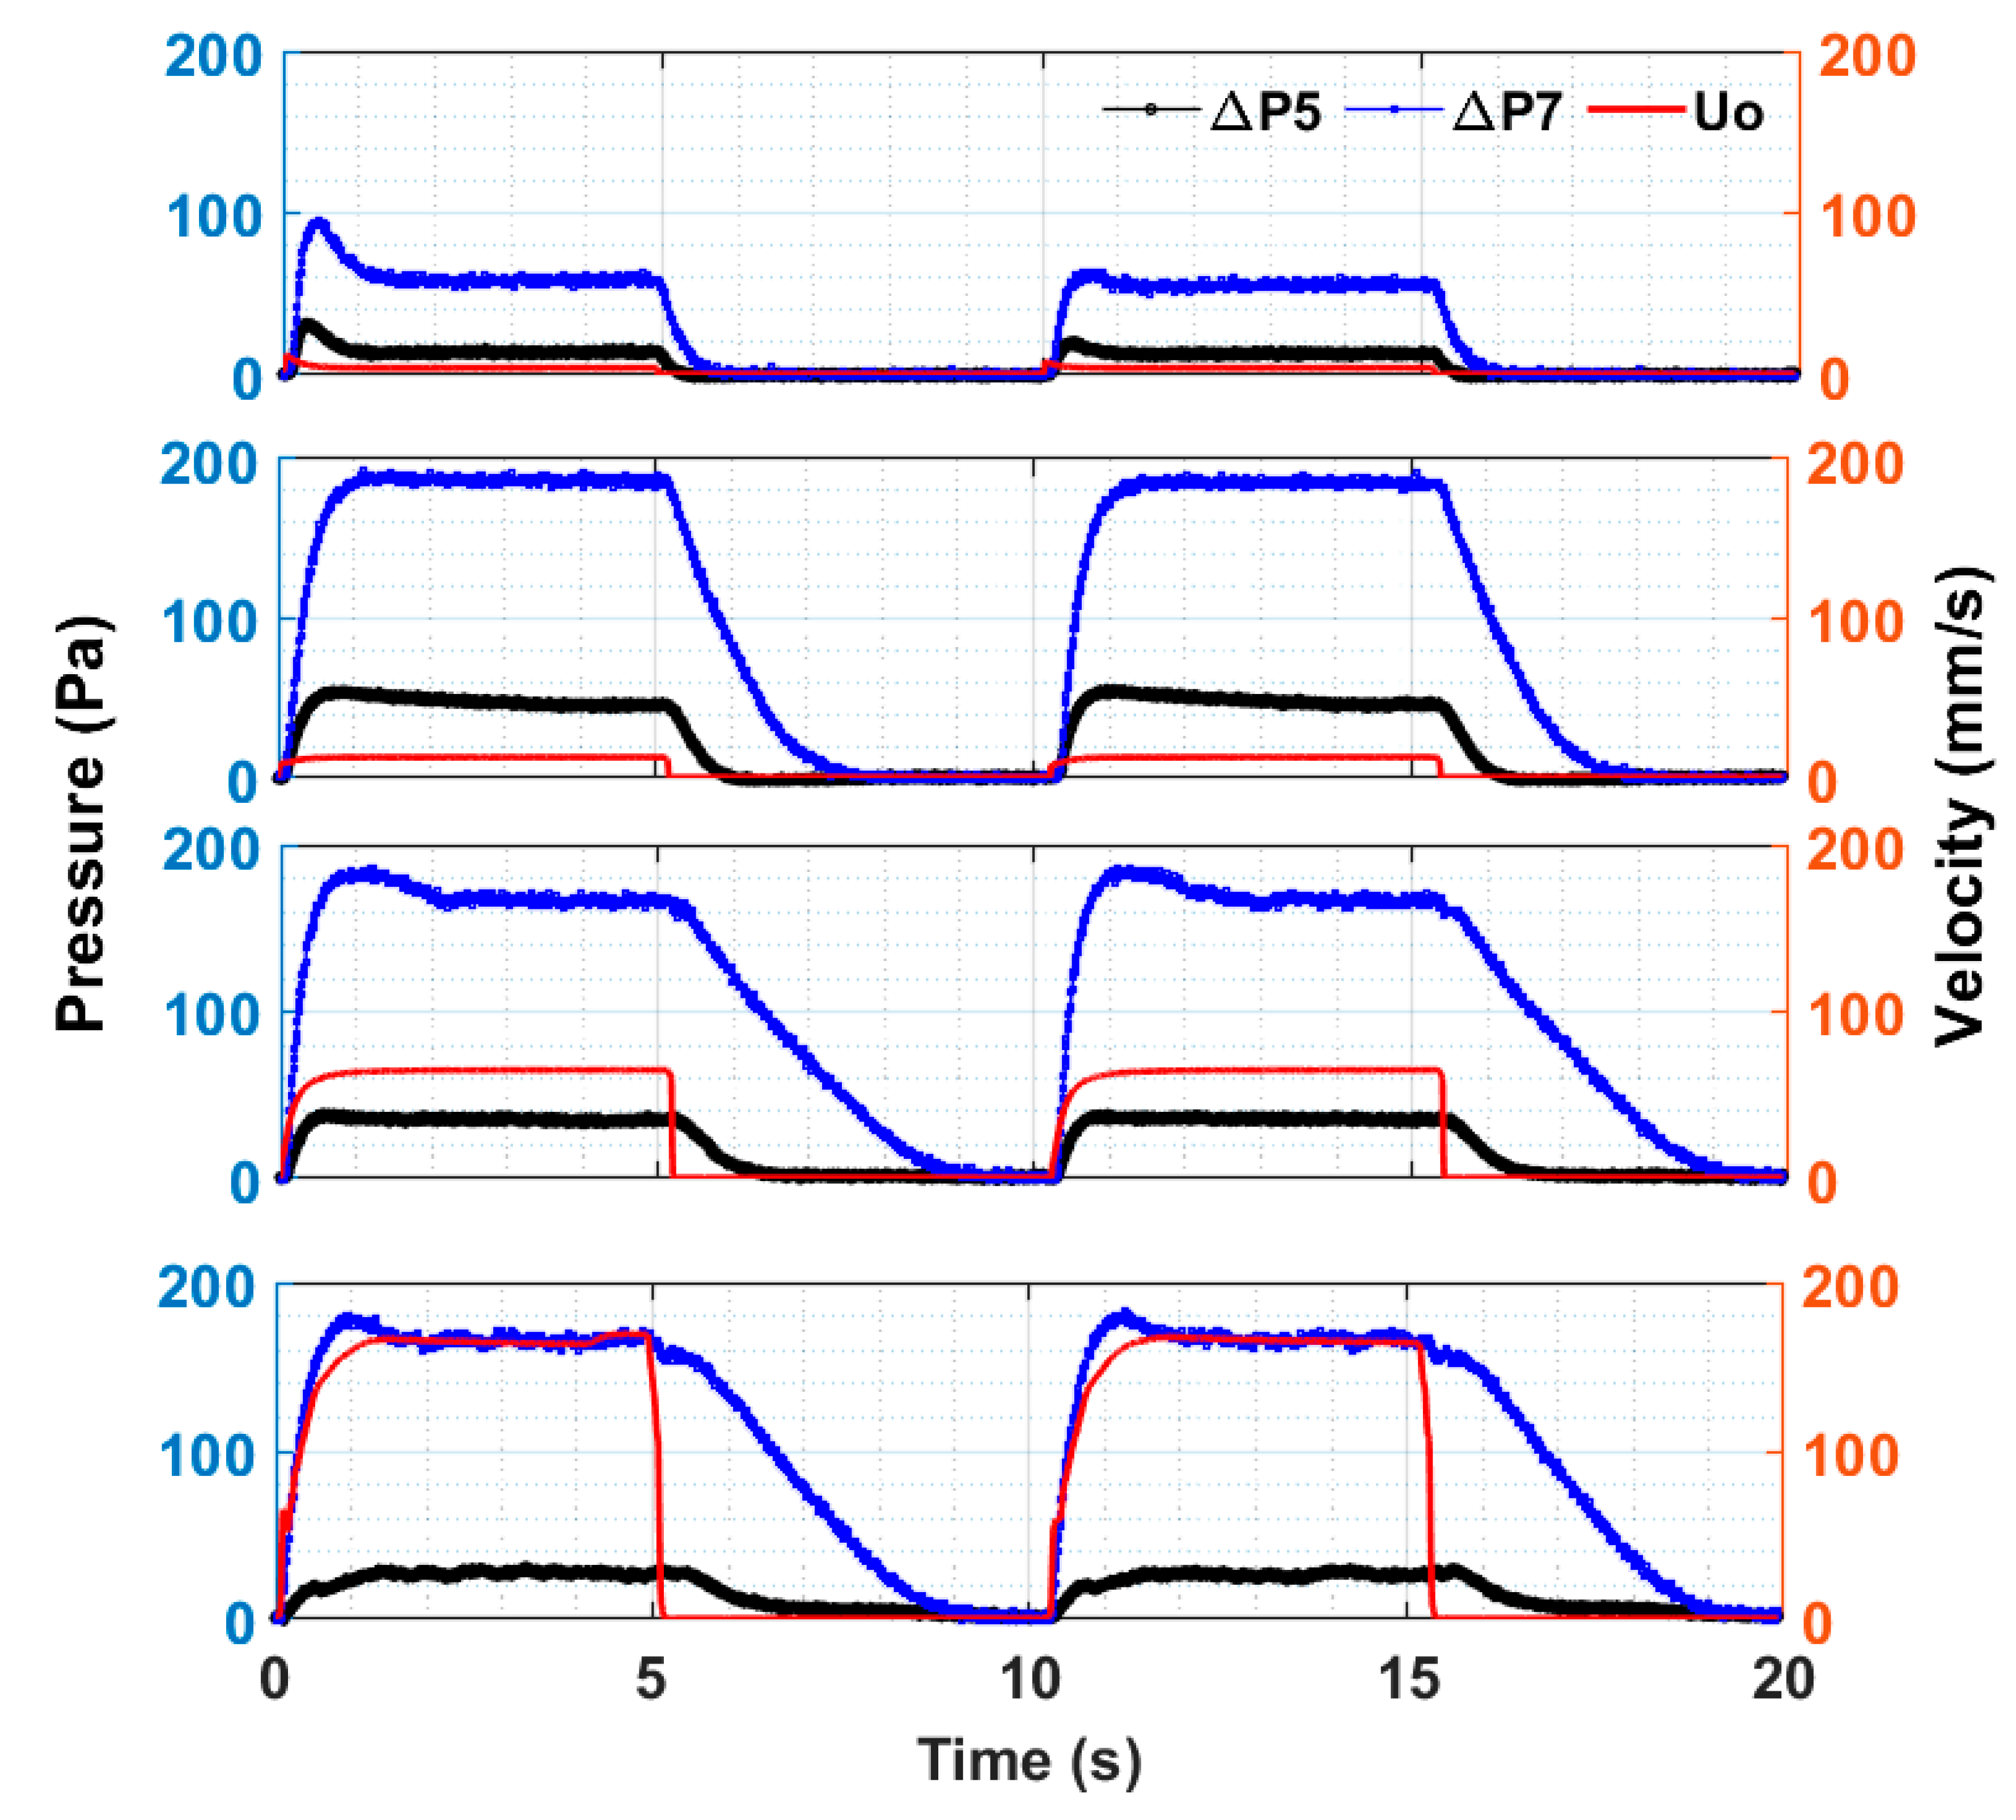
Figure 7 shows pulsed bed dynamics considering two identical pulses at four different velocities. The velocity is depicted on the right-hand side, whereas the overall bed and lower region dynamics are represented on the left-hand side of the figure. The pressure drop is low at low velocities (i.e., 4 mm/s). A threefold increase in the velocity to 12 mm/s leads to a several fold increase in the pressure drop due to the fixed bed mode of gas-solid contact prevailing at this velocity. However, another fivefold increase (i.e., 65 mm/s) in the velocity fails to cause any increase in the pressure drop. Instead, a small decrease in the pressure drop is observed owing to the fluidization of the bed material. Further increase in the velocity to 165 mm/s does not affect the overall pressure drop (i.e., ), which is usually equal to the effective weight of the fluidized bed.
The pulsed bed expansion shows rather instantaneous response to the step change in the fluidization velocity. Similarly, the bed collapse starts as soon as the flow to the bed is discontinued. However, the collapse process shows a slower response. Interestingly, the total time of the collapse remains relatively unaffected even when the collapse of a fully fluidized bed is initiated at two widely different velocities. For example, the collapse time is approximately same for 65 mm/s and 165 mm/s despite a threefold difference in the two velocities. Moreover, the collapse time is significantly different for different regions of the fluidized bed. The lower part of the pulsed fluidized bed shows a much shorter settling time than the rest of the bed since attains zero value significantly before .
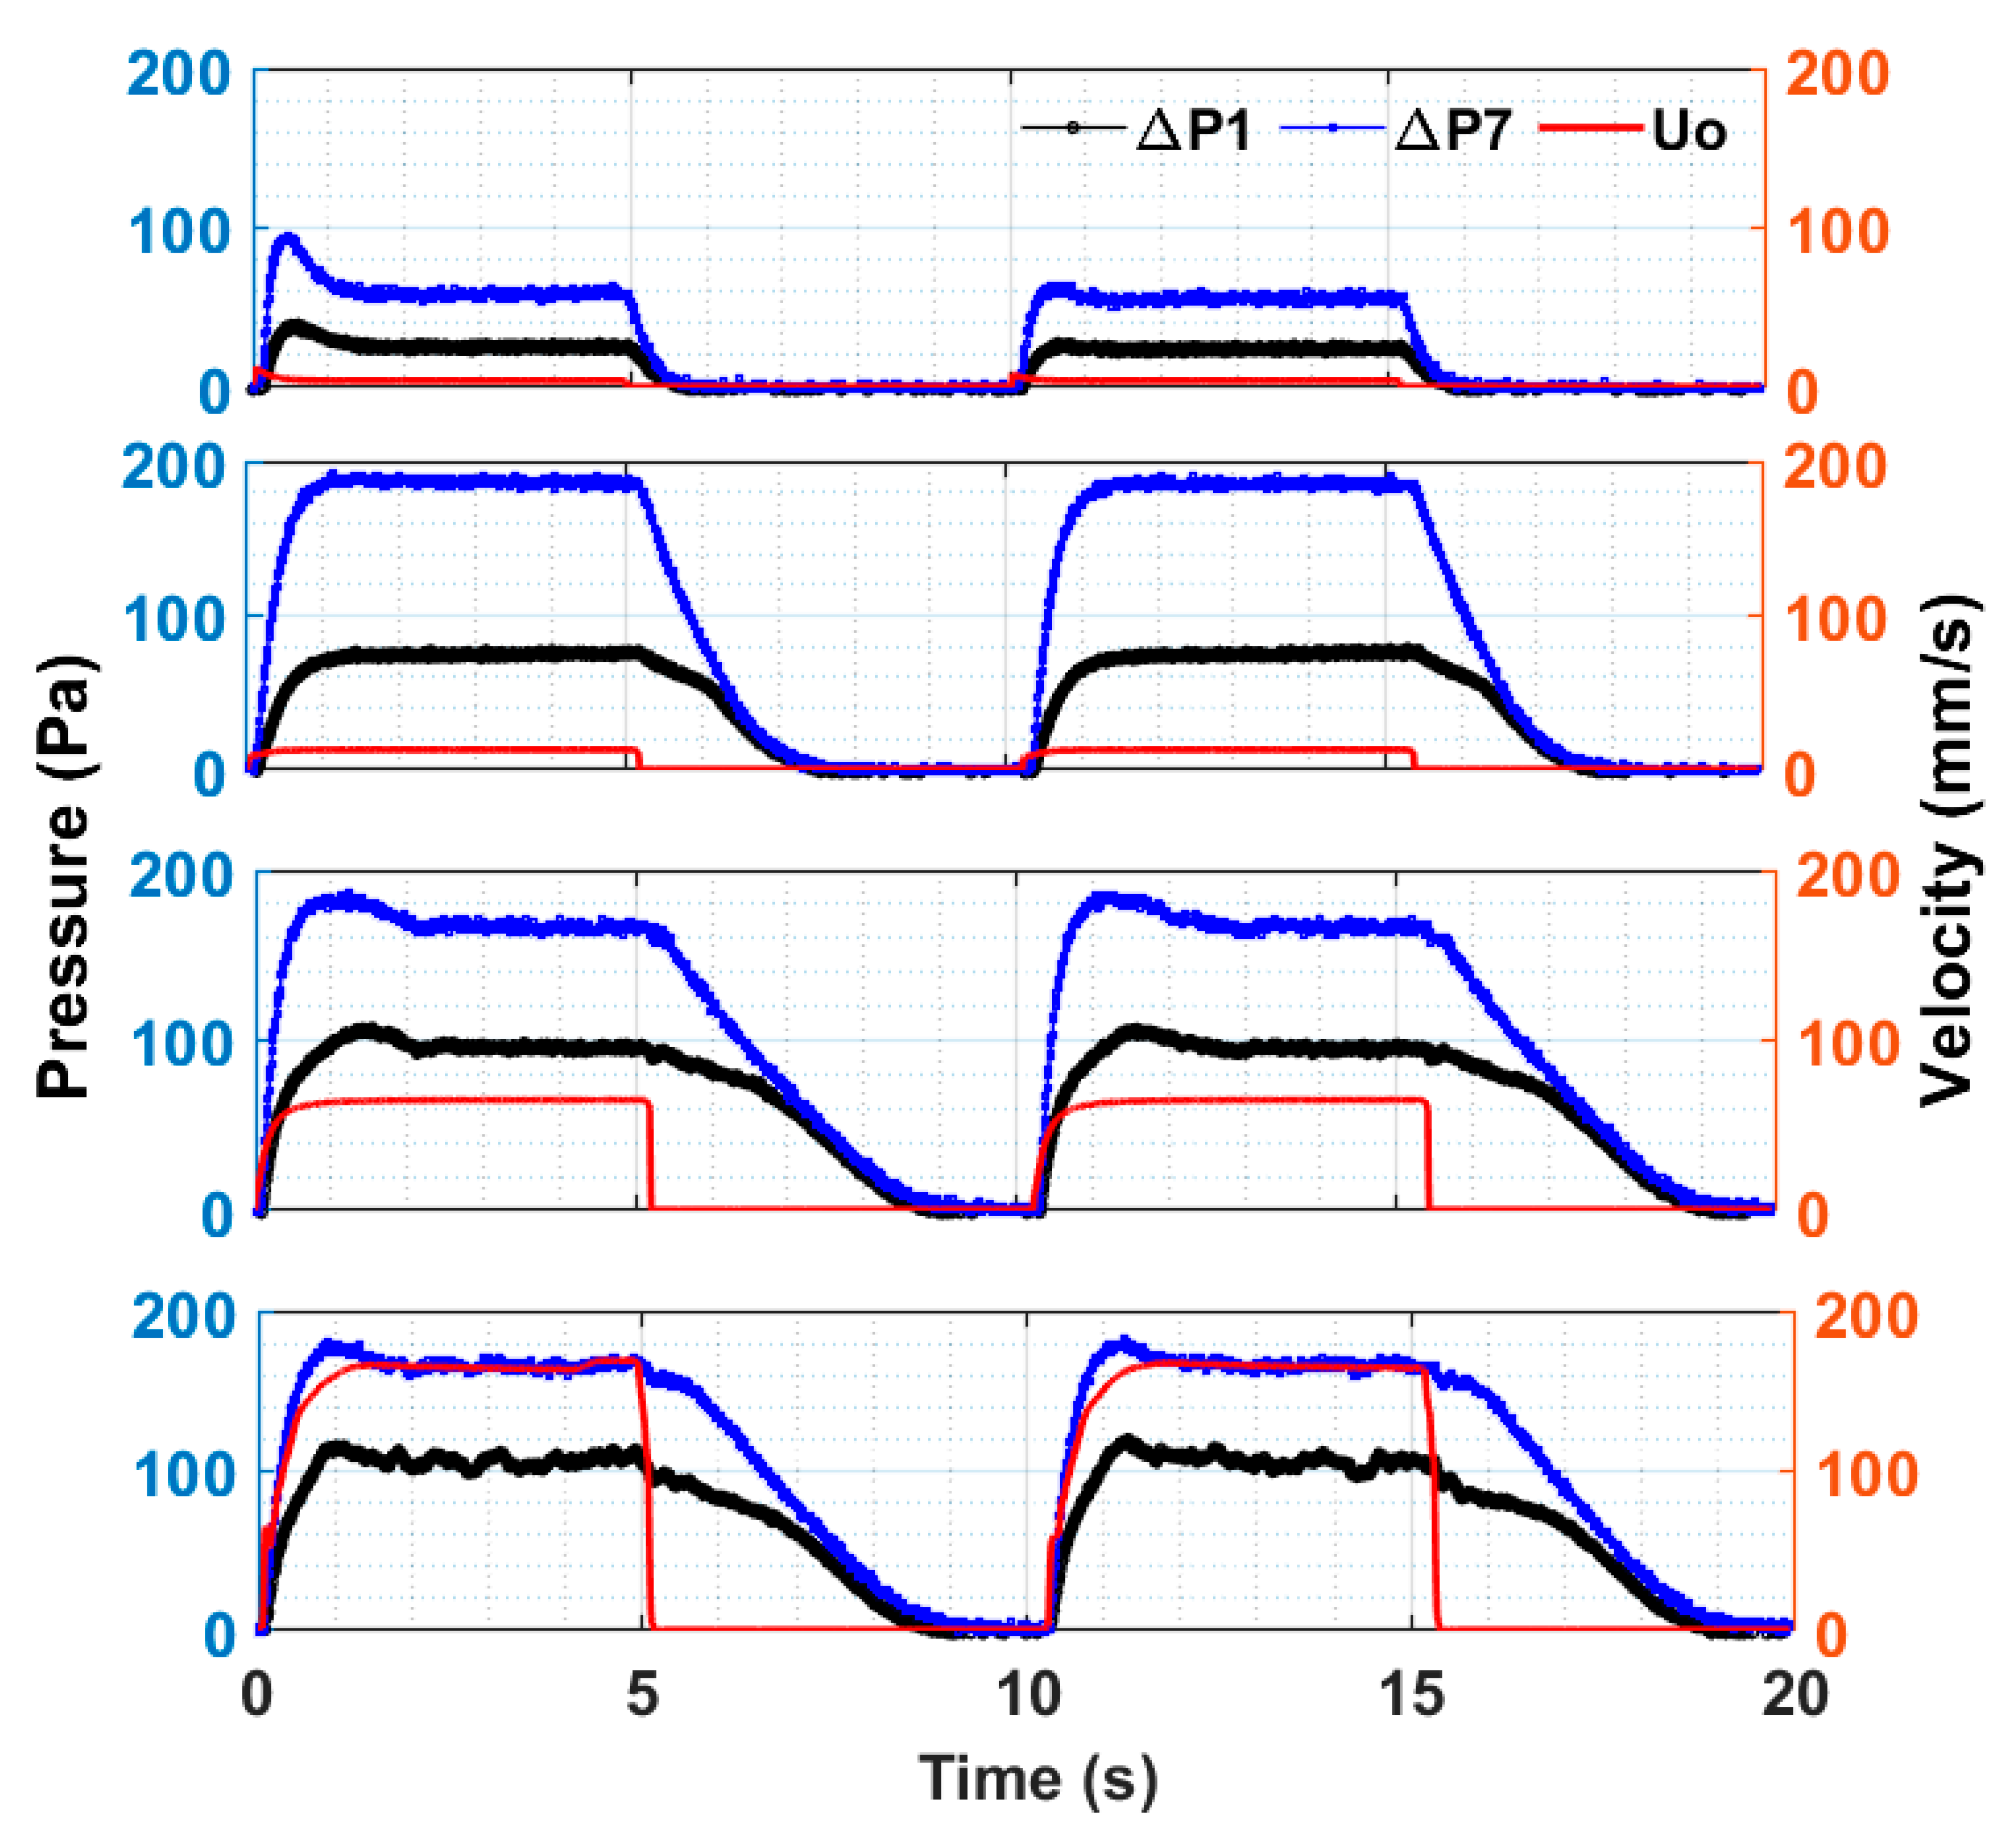
The bed dynamics of the upper region of the pulsed bed is shown in Figure 8 along with the global dynamics. In spite of obvious similarities with Figure 7, there is however an important difference. Specifically, the upper region shows slower response than the lower region of the bed. The pressure drop profile of the upper region merges with its global counterpart after approximately 3 s since the beginning of the collapse process. Thus, the slower dynamics of the upper region controls the overall bed collapse process.
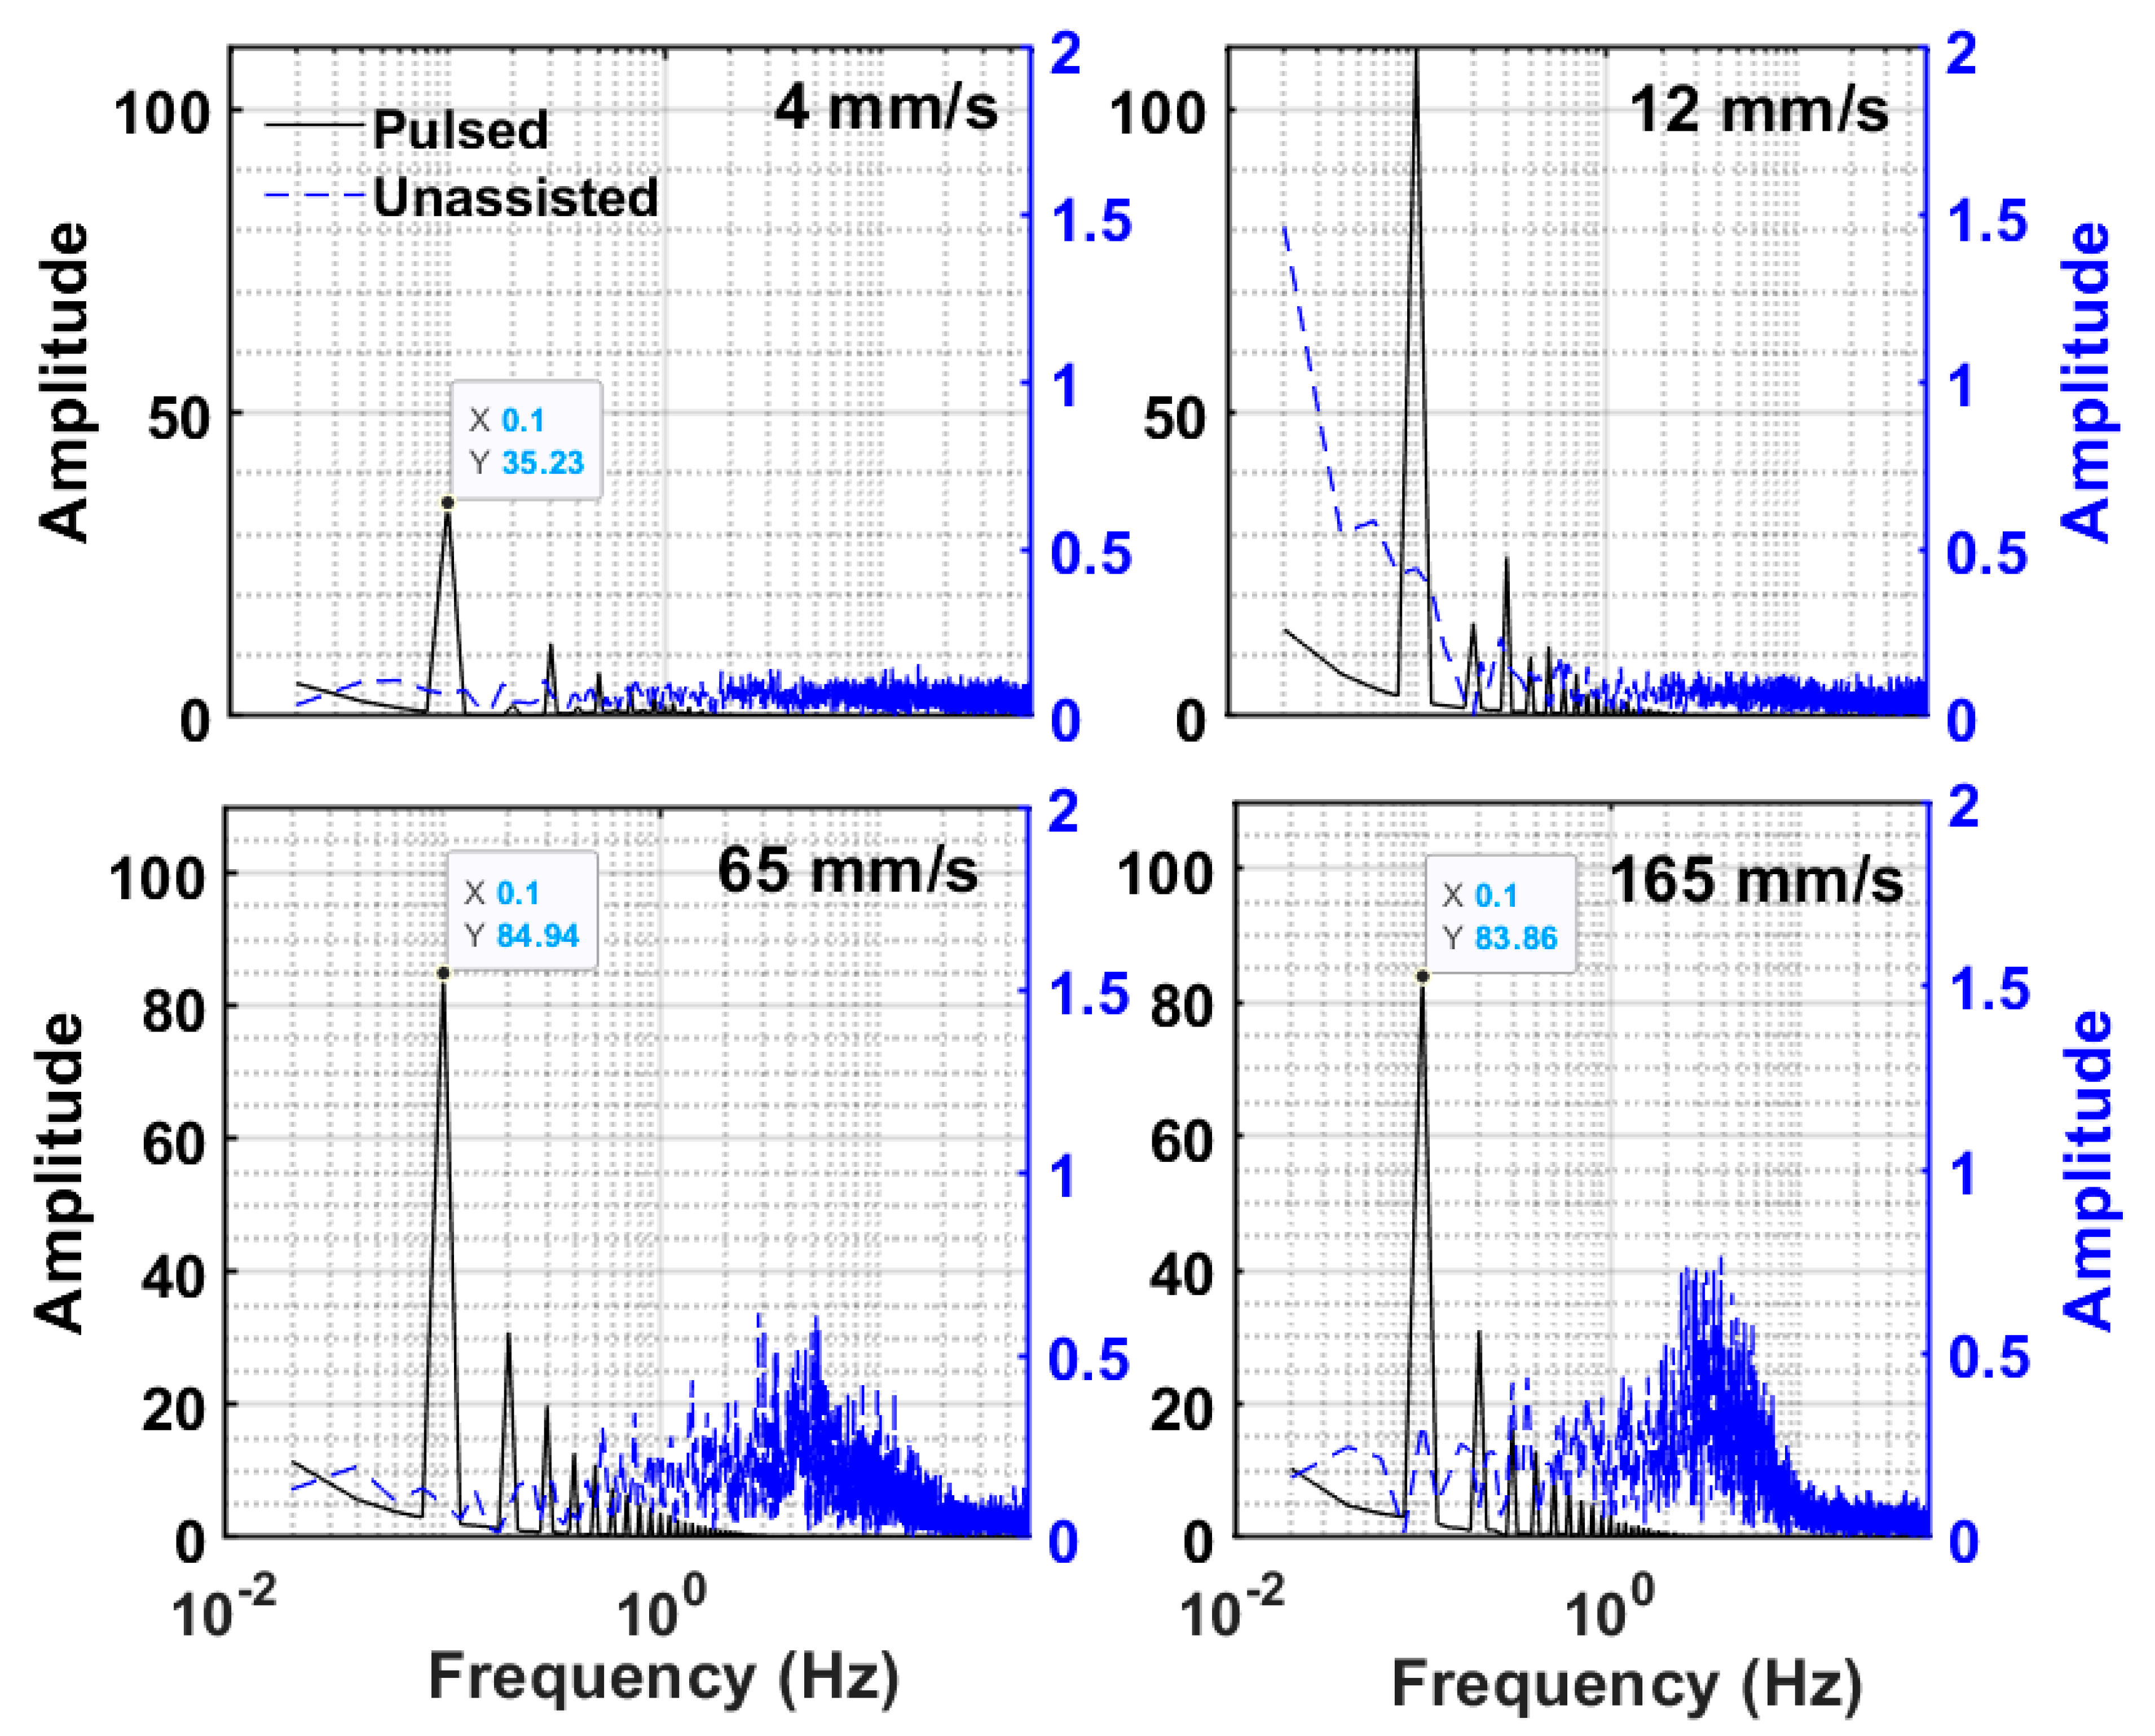
Figure 9 shows the frequency responses of unassisted and pulsed fluidized beds. As the representative of the overall bed dynamics, the global pressure drop transients of the fluidization are considered in the figure. The data are first detrended by ensuring zero value of the mean pressure drop before analyzing the frequency response of the signal. When the velocity is very low (e.g., 4 mm/s), fluctuations are hardly observed in the unassisted fluidized bed because of the fixed-bed mode of the gas-solid contact. However, when the velocity is increased to 12 mm/s, a relatively prominent peak is observed at an extremely low frequency even though the bed is not fluidized. Thus, the occurrence of an event is indicated, most probably by the movement of a stray air bubble rising through the bed. As the velocity is increased further to 65 mm/s, small amplitude events are observed to occur in the frequency range of 1–20 Hz due to the formation of bubbles and the movement of agglomerates owing to the passage of air through the bed of the nanosilica. Increasing the velocity further to 165 mm/s has enhanced the magnitude of fluctuations given the rather vigorous motion introduced in the solid particles due to higher velocity of the fluidizing air.
On the other hand, the square-wave flow pulsations have introduced a prominent peak at 0.1 Hz for the pulsed fluidized bed. The amplitude of the frequency peak increases when the velocity is increased from 4 mm/s to 12 mm/s due to an increase in the global pressure drop. Further increase in the velocity to 65 mm/s has led to small decrease in the pressure drop due to the fluidization of the solids present in the bed. When the velocity is further increased to 165 mm/s, the amplitude remains almost unaffected because the pressure drop during fluidization remains unchanged.
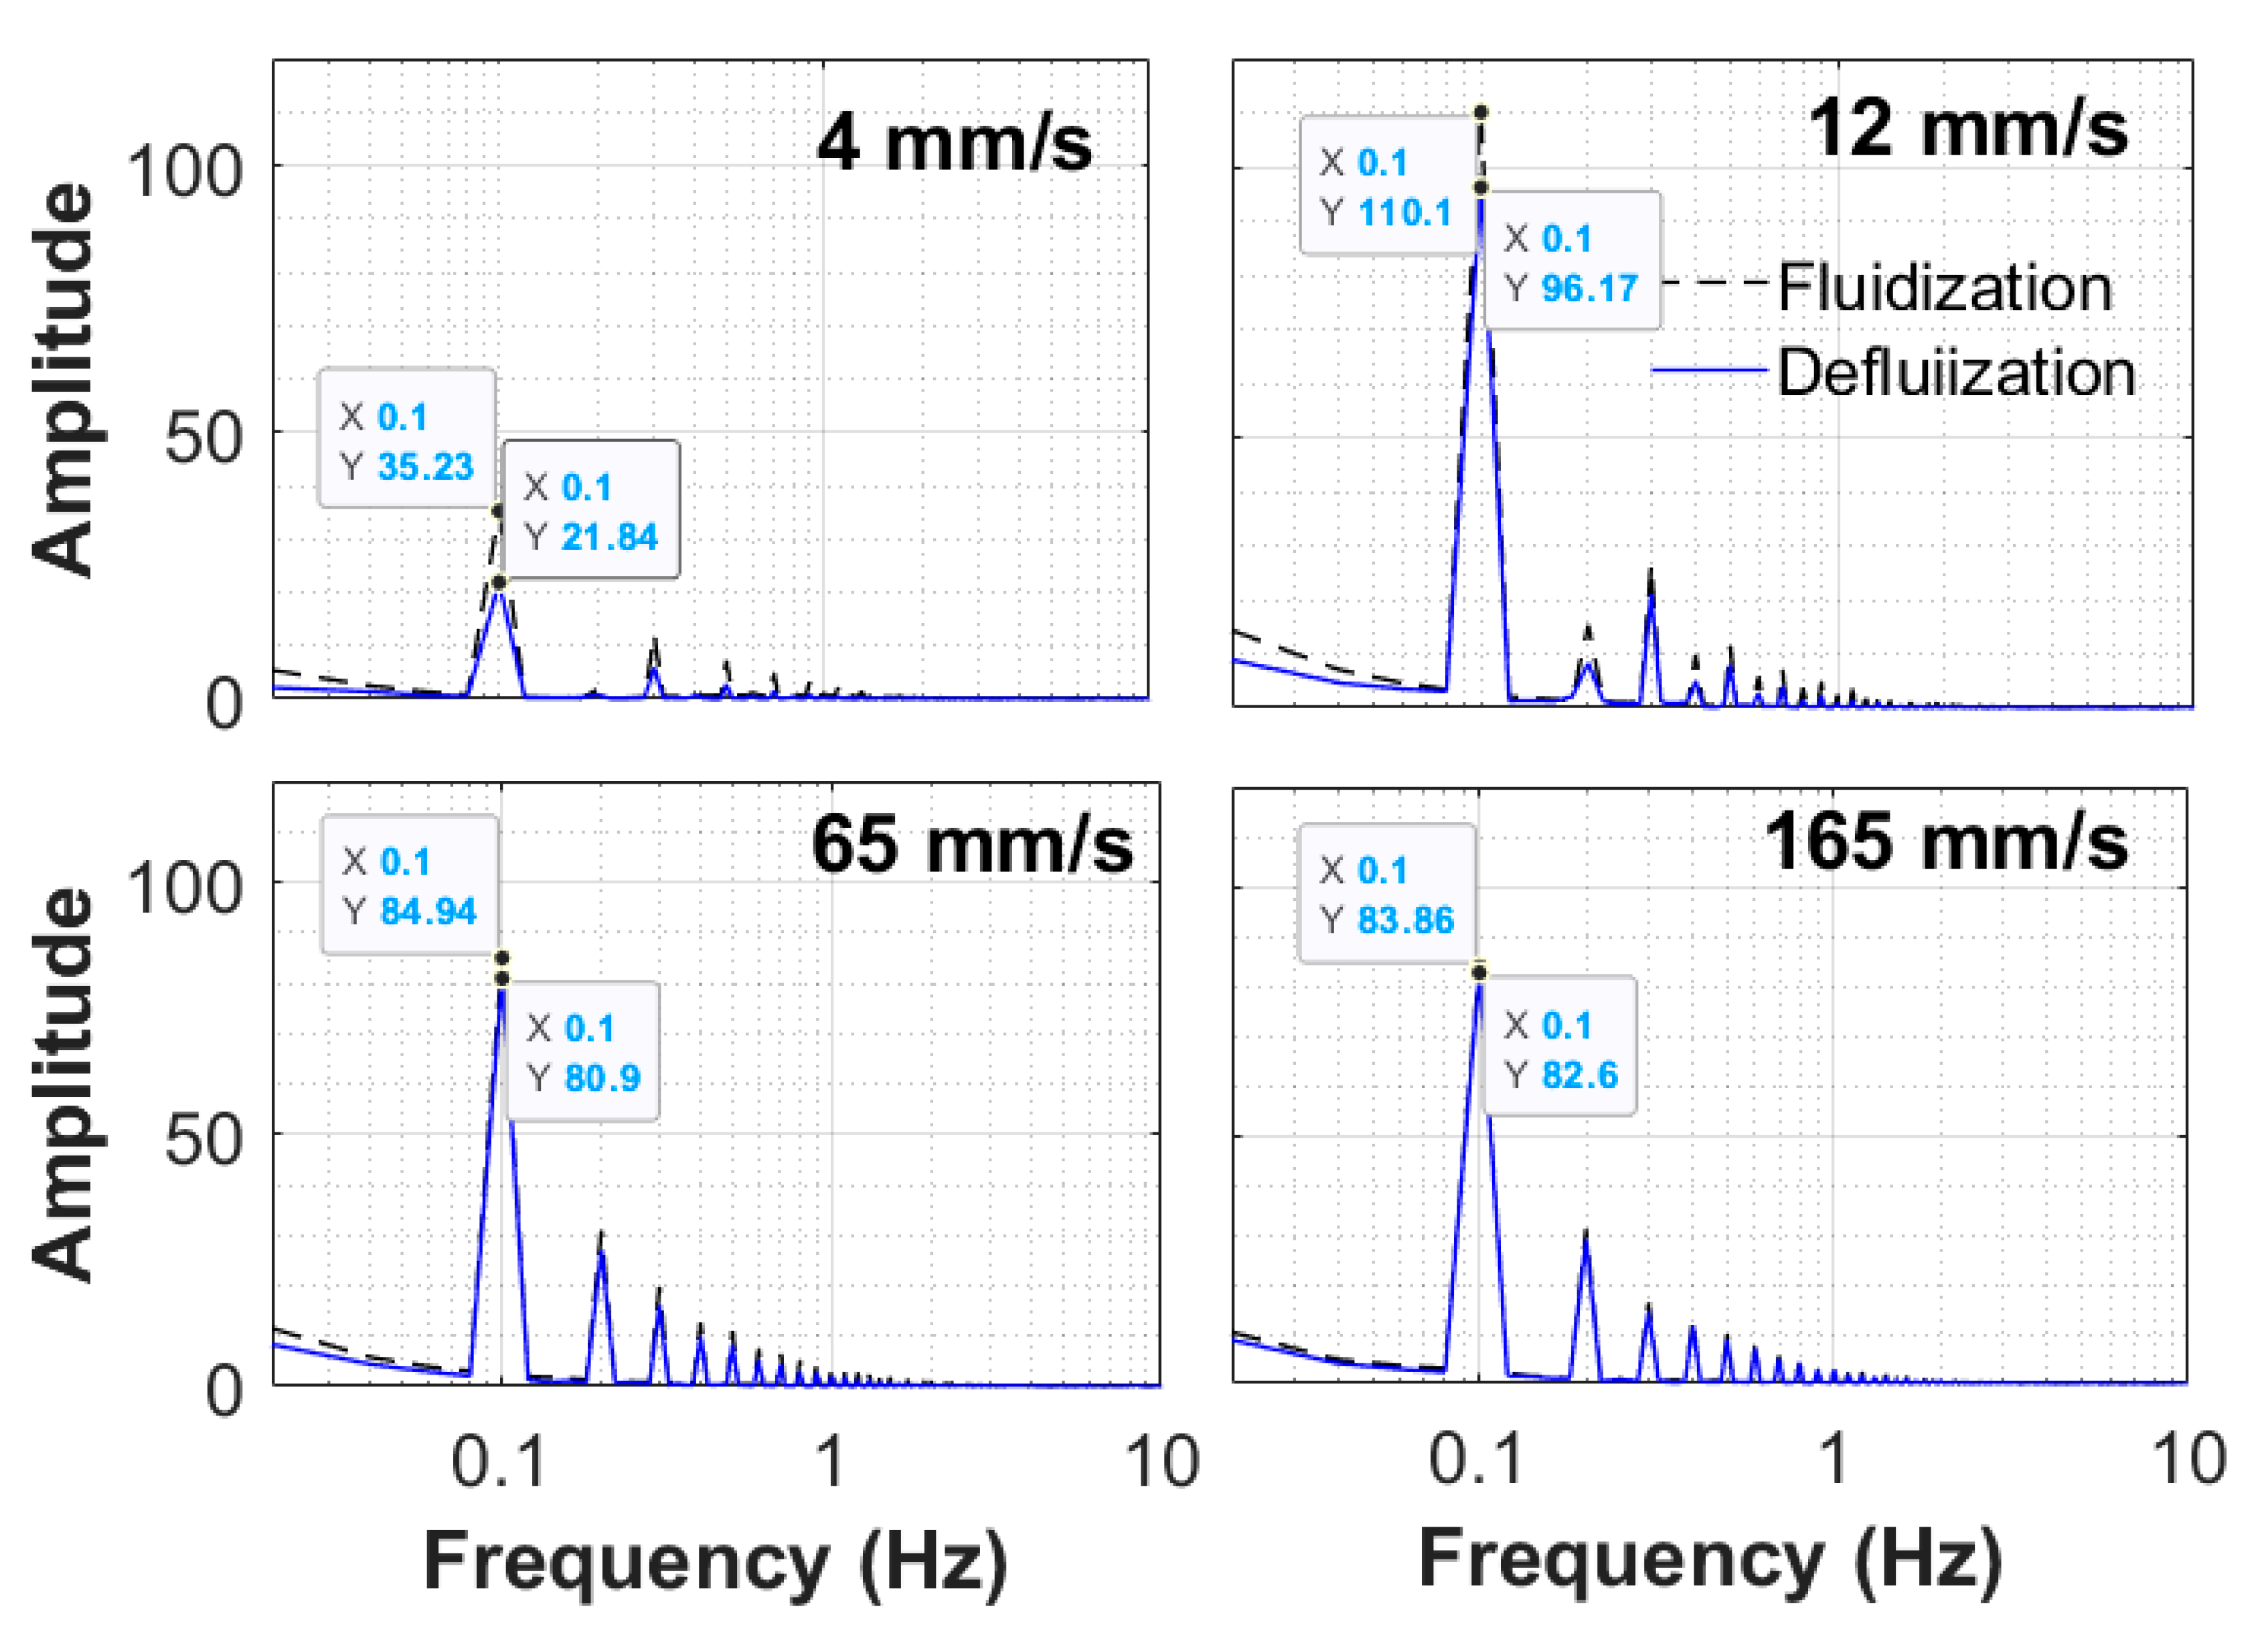
Figure 10 compares the bed dynamics of the fluidization and defluidization cycles at four different velocities. Initial non-homogeneities have evidently affected the bed dynamics. The fluidization amplitude at low velocities (e.g., 4 mm/s) is initially higher than the one during the defluidization cycle at the same velocity. The difference is quite significant. Although the same phenomenon is also evident at 12 mm/s, the difference is not as significant. Note that the bed is incipiently fluidized at 12 mm/s. When the bed is fully fluidized at 65 mm/s, the difference in bed dynamics during the fluidization and defluidization cycles is almost negligible. When the velocity is further increased to 165 mm/s, the bed dynamics between both cycles shows an excellent agreement.
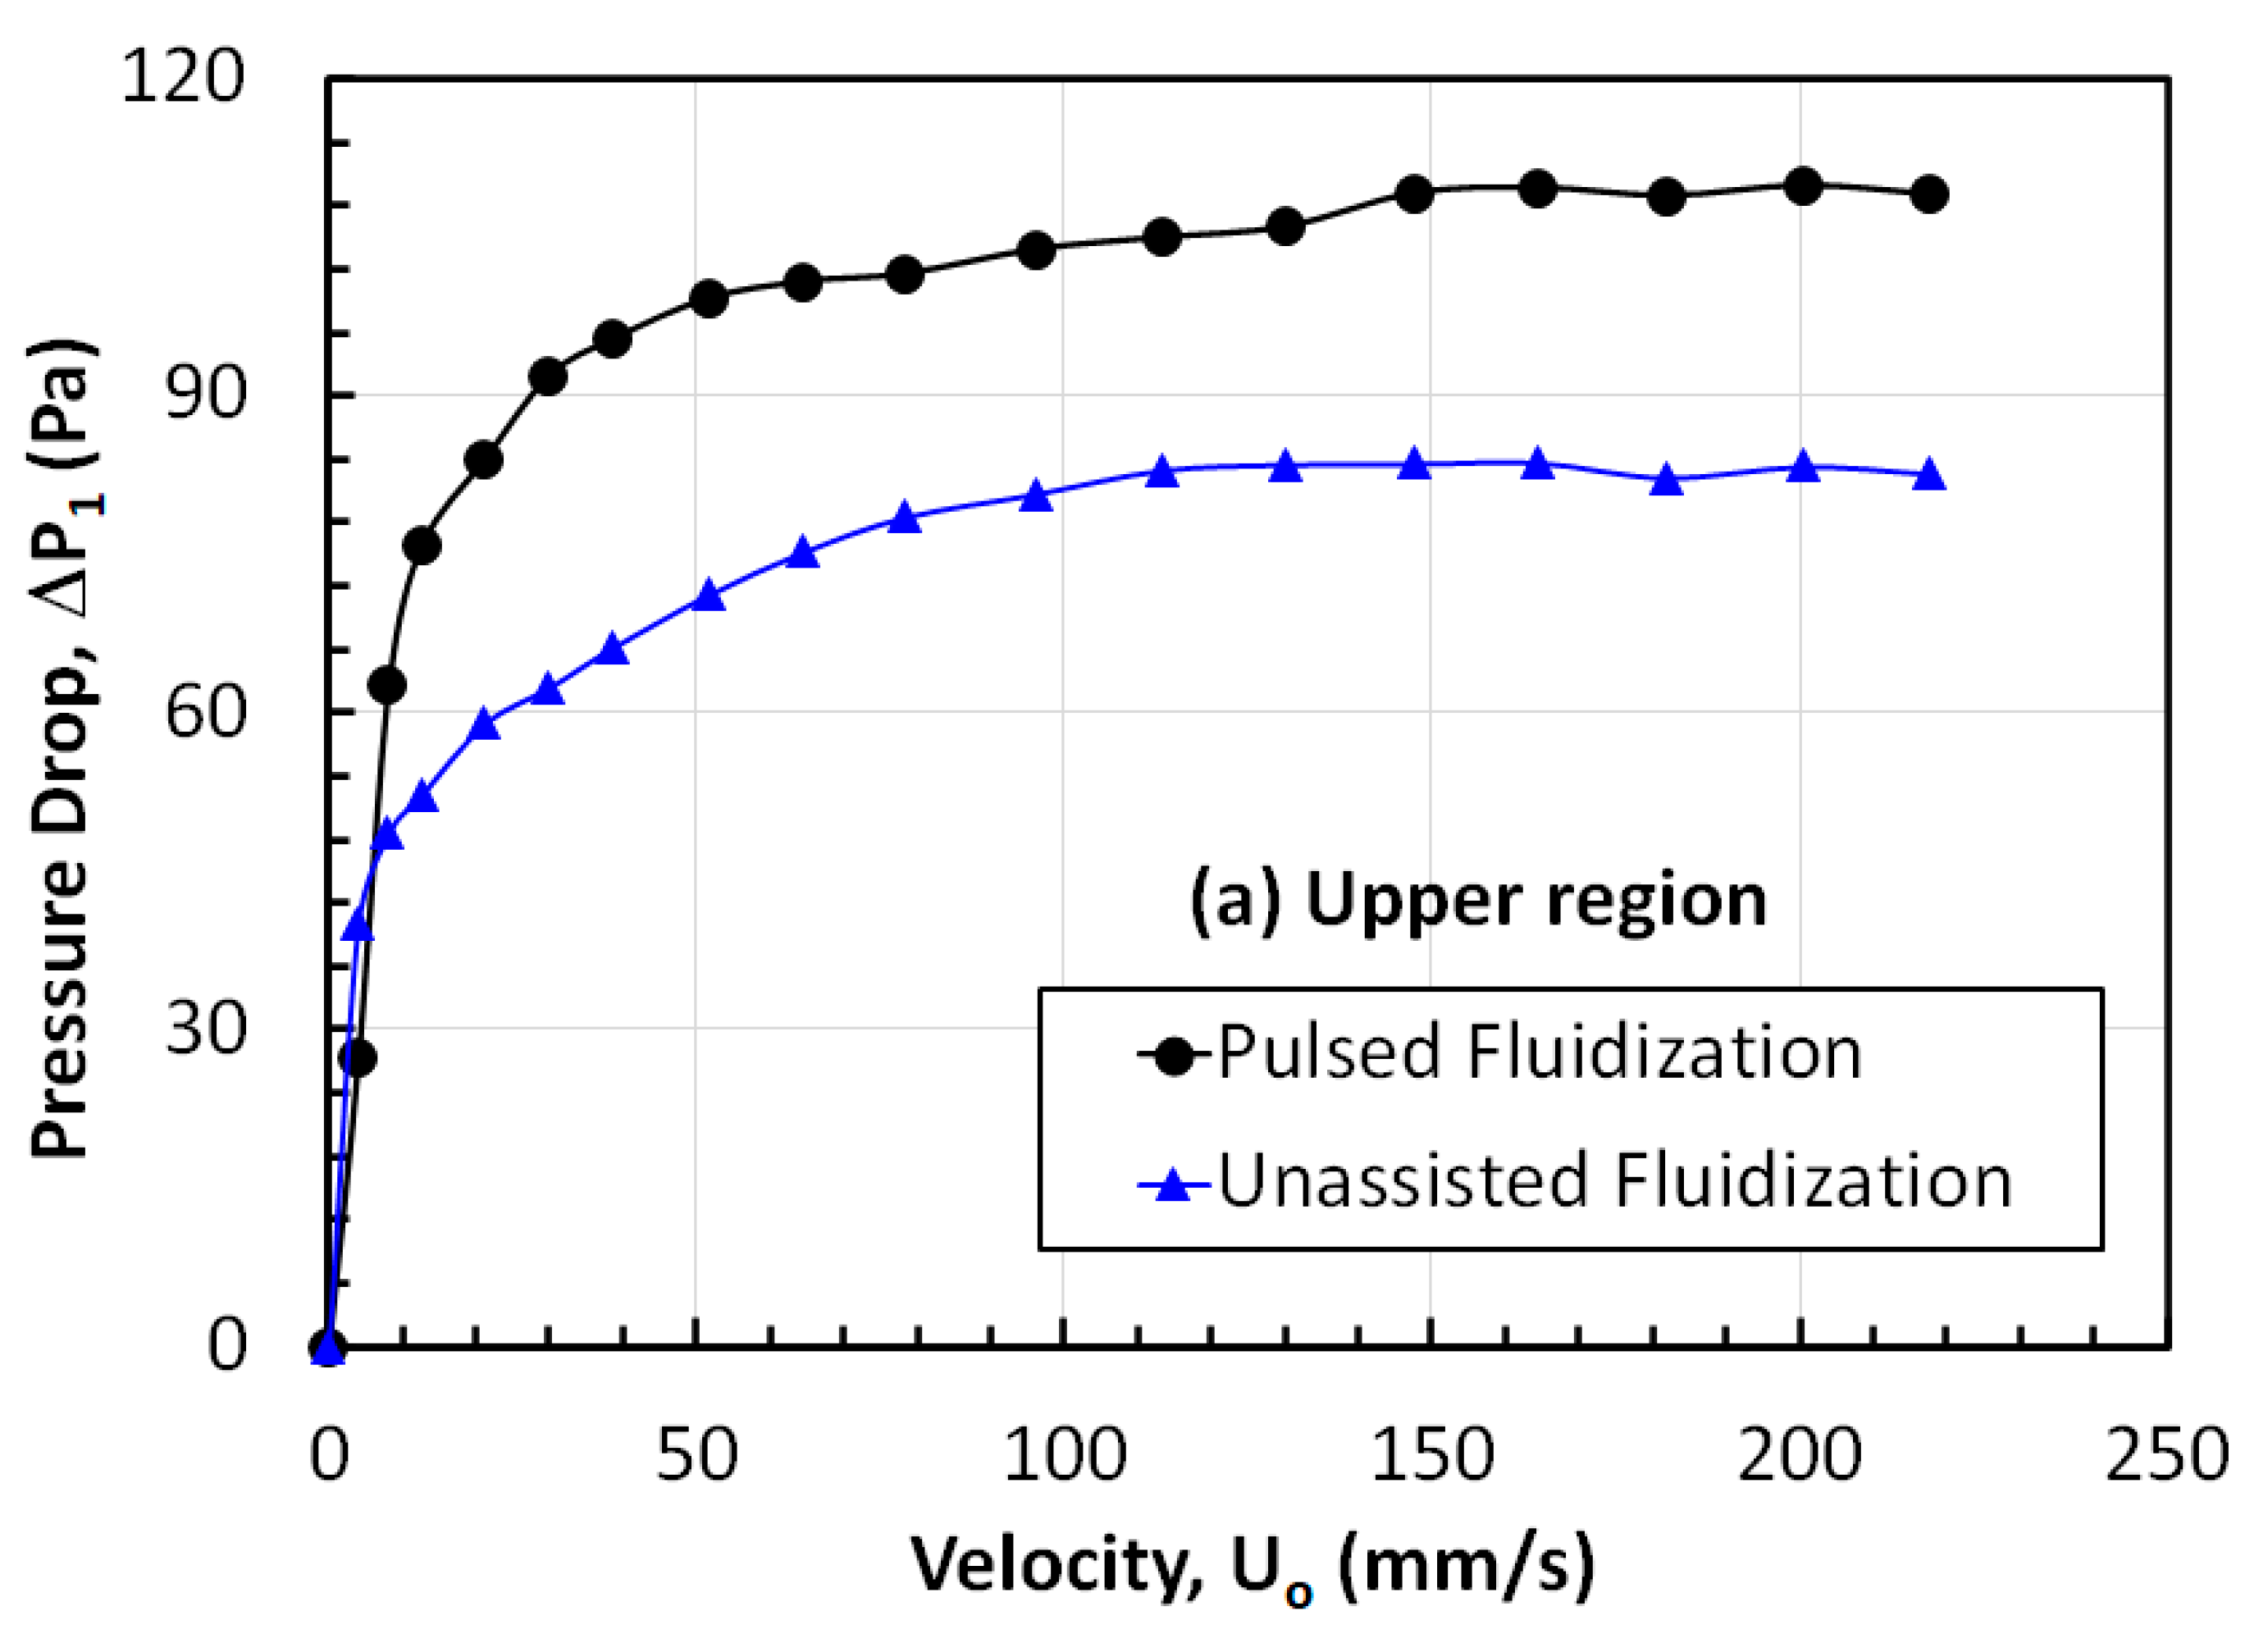
Figure 11 shows the effect of the velocity on the local pressure drops in different regions of the fluidized bed for unassisted and pulsed bed. The velocity dependence of the upper region pressure drop is shown in Figure 11a. The pressure drop of the pulsed fluidized bed is consistently higher than that of the unassisted fluidized bed at all velocities. Note that the pressure drop in a fluidized bed is equal to the effective weight of the solids present between the pressure taps across which the pressure drop is being measured. Thus, higher pressure drop is a clear indication of a greater amount of solids present in the upper region of the pulsed bed than the unassisted fluidized bed. Since the amount of solids loaded for both cases are the same, the greater expansion of the pulsed fluidized bed can be attributed to greater amount of solid particles in the upper region of the pulsed bed. According to the well-known Richardson–Zaki equation, lower terminal velocity yields higher bed expansion, which in turn depends upon the particle diameter. Therefore, greater bed expansion due to pulsation can be attributed to the pulsation induced de-agglomeration resulting in lower terminal velocity as described by the Stokes law. However, greater bed expansion in some cases of vibrated fluidized bed might lead to irreversible coalescence of voids into large bubbles, resulting in an increase in the particle fraction that cannot be predicted using the Richardson–Zaki equation [28]. There was a progressive increase in the pressure drop with the increase in the velocity. Such an increase is caused by the migration of solids from the lower regions of the fluidized bed to the upper region because of the bed expansion.
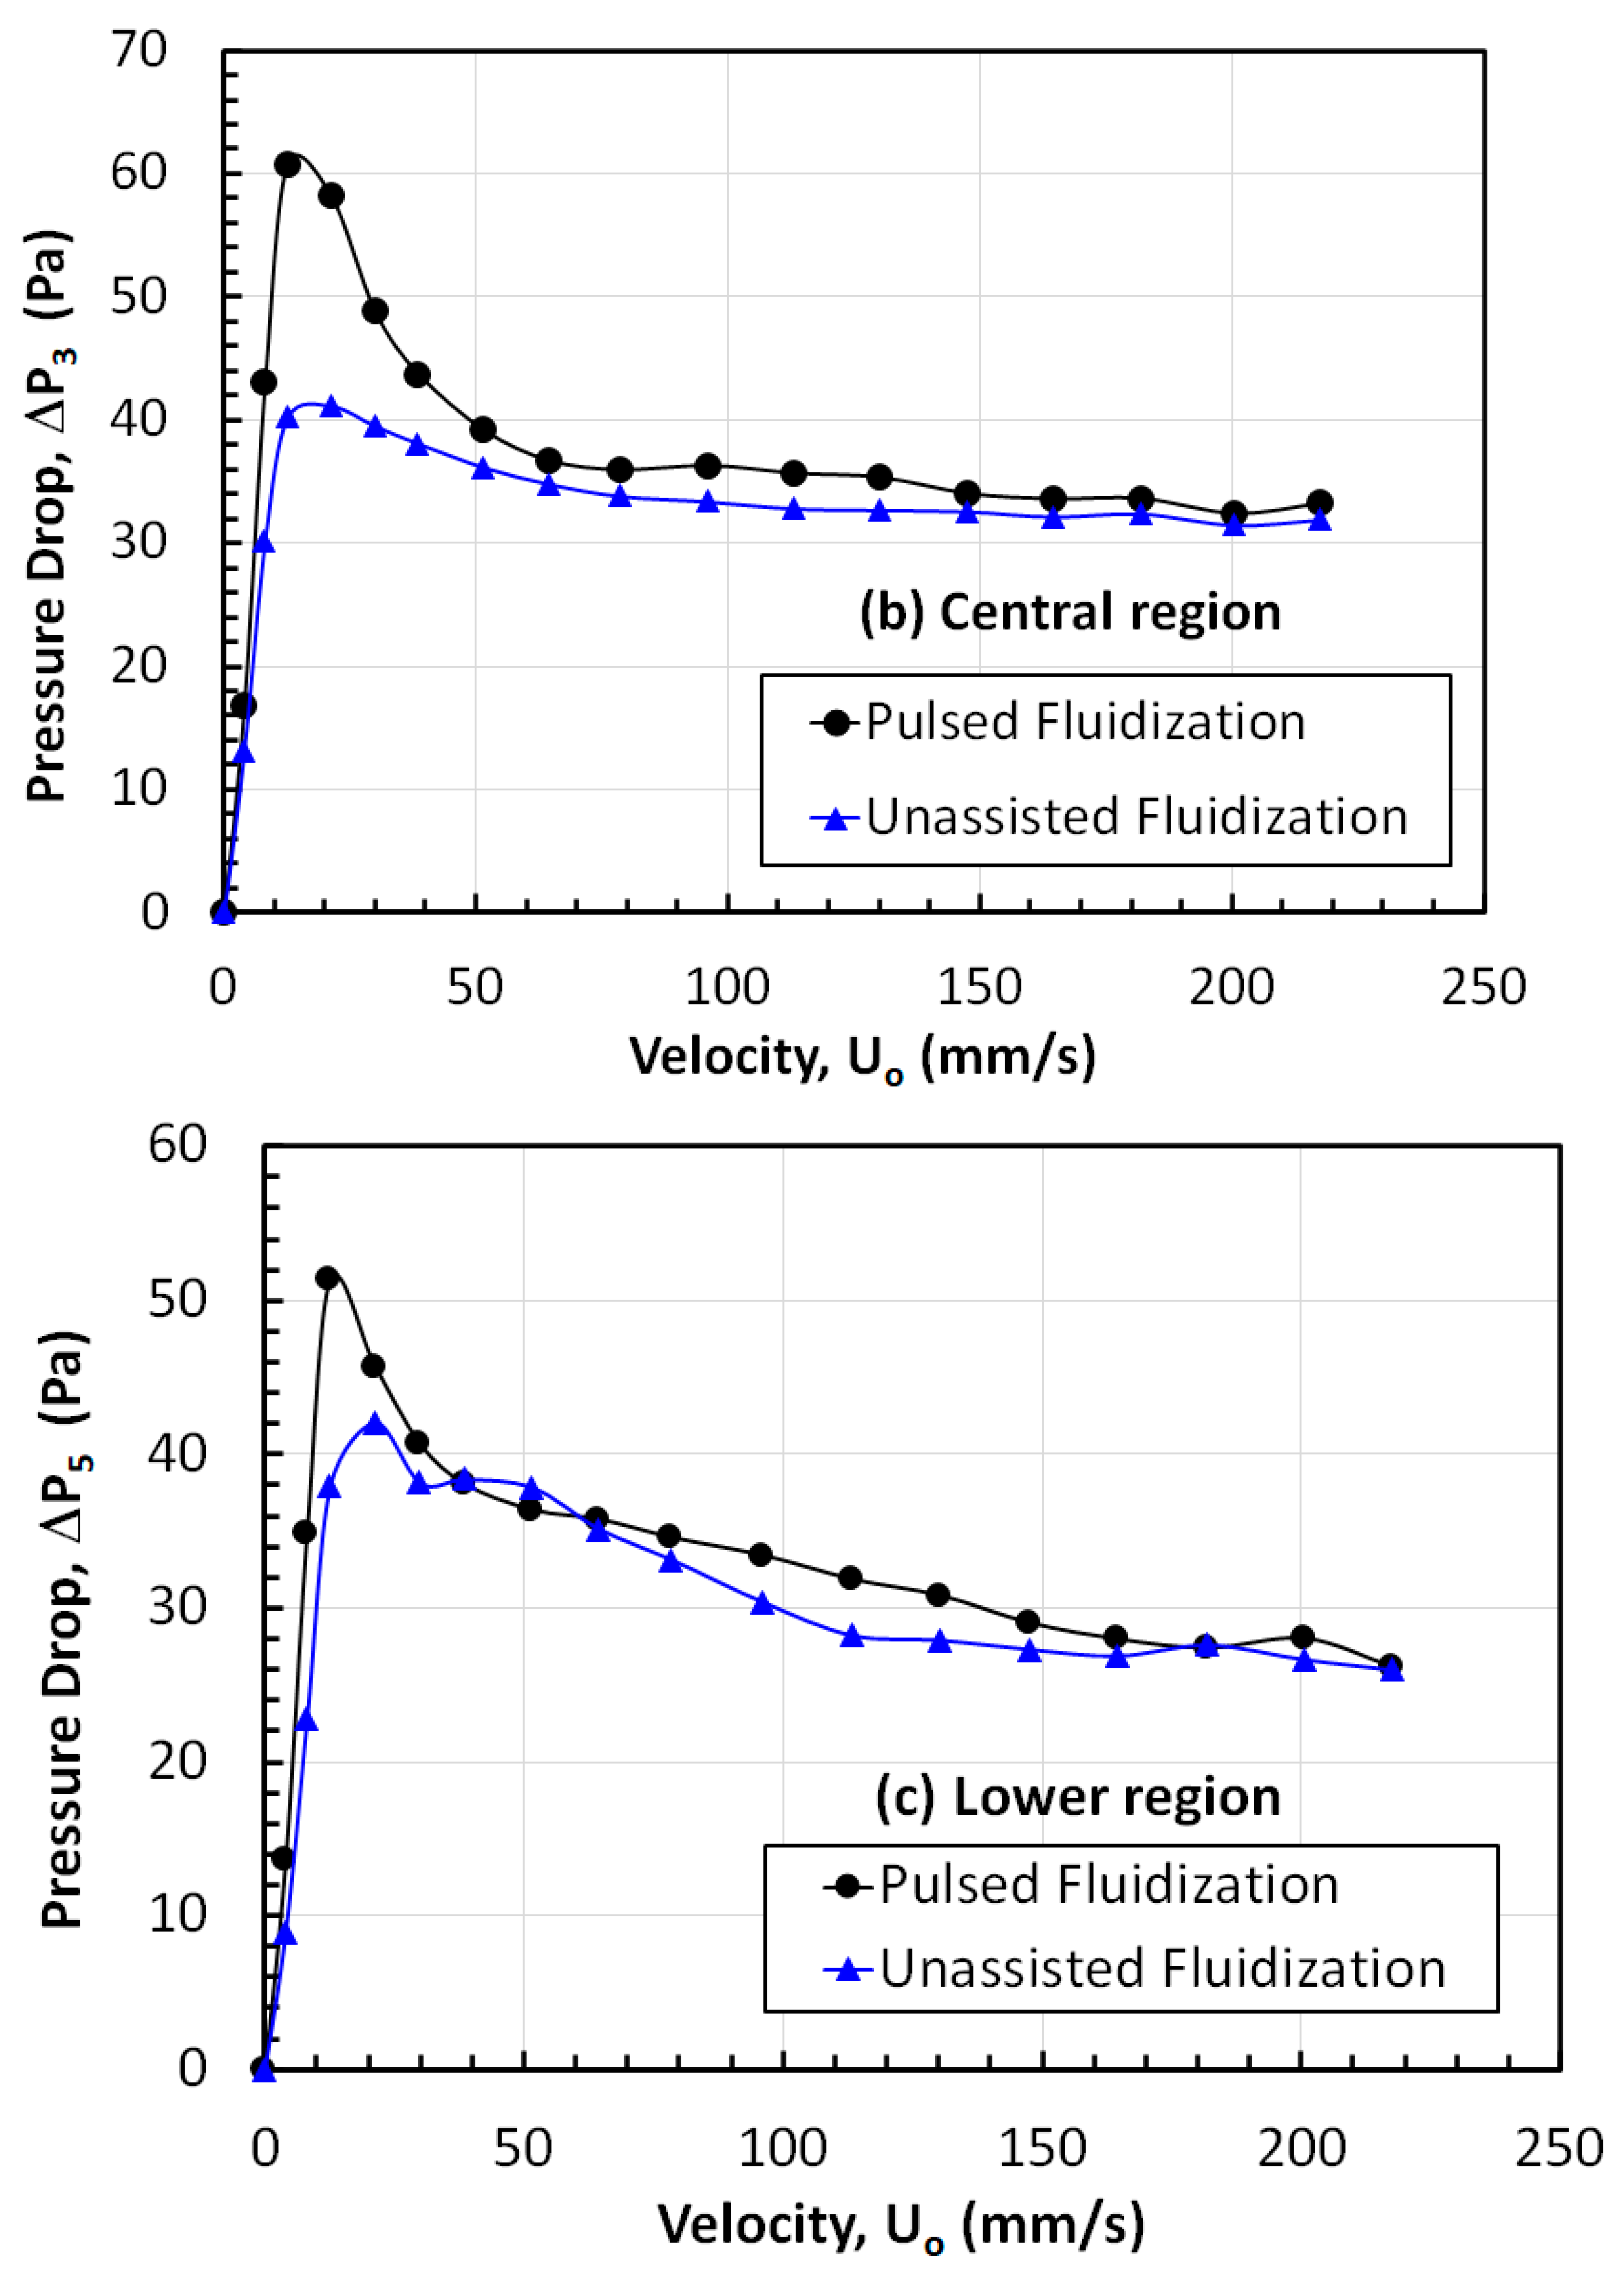
Figure 11b shows the pressure drop profiles for the central region of the pulsed and unassisted fluidized beds. The initial part of the two profiles shows a significant difference. The pressure drop in the case of the pulsed bed is much higher than that of the unassisted bed at the same velocity. The initial part of the pressure drop profiles represents the fixed bed mode of gas–solid contact, wherein the pressure drop is inversely related with the diameter of the solid particle. Consequently, smaller particle size will give rise to higher pressure drops. Therefore, a higher pressure drop for the case of the pulsed fluidization is due to de-agglomeration caused by the flow pulsation.
Figure 11c compares the pressure drop profiles of the lower region of the unassisted and pulsed fluidized bed. A significant difference in the initial part of the profile is observed owing to the de-agglomeration promoted by the pulsation in the bed. In the fluidized bed mode, the pressure drop is higher due to the elimination of dead zones when the fluidized bed is pulsed.
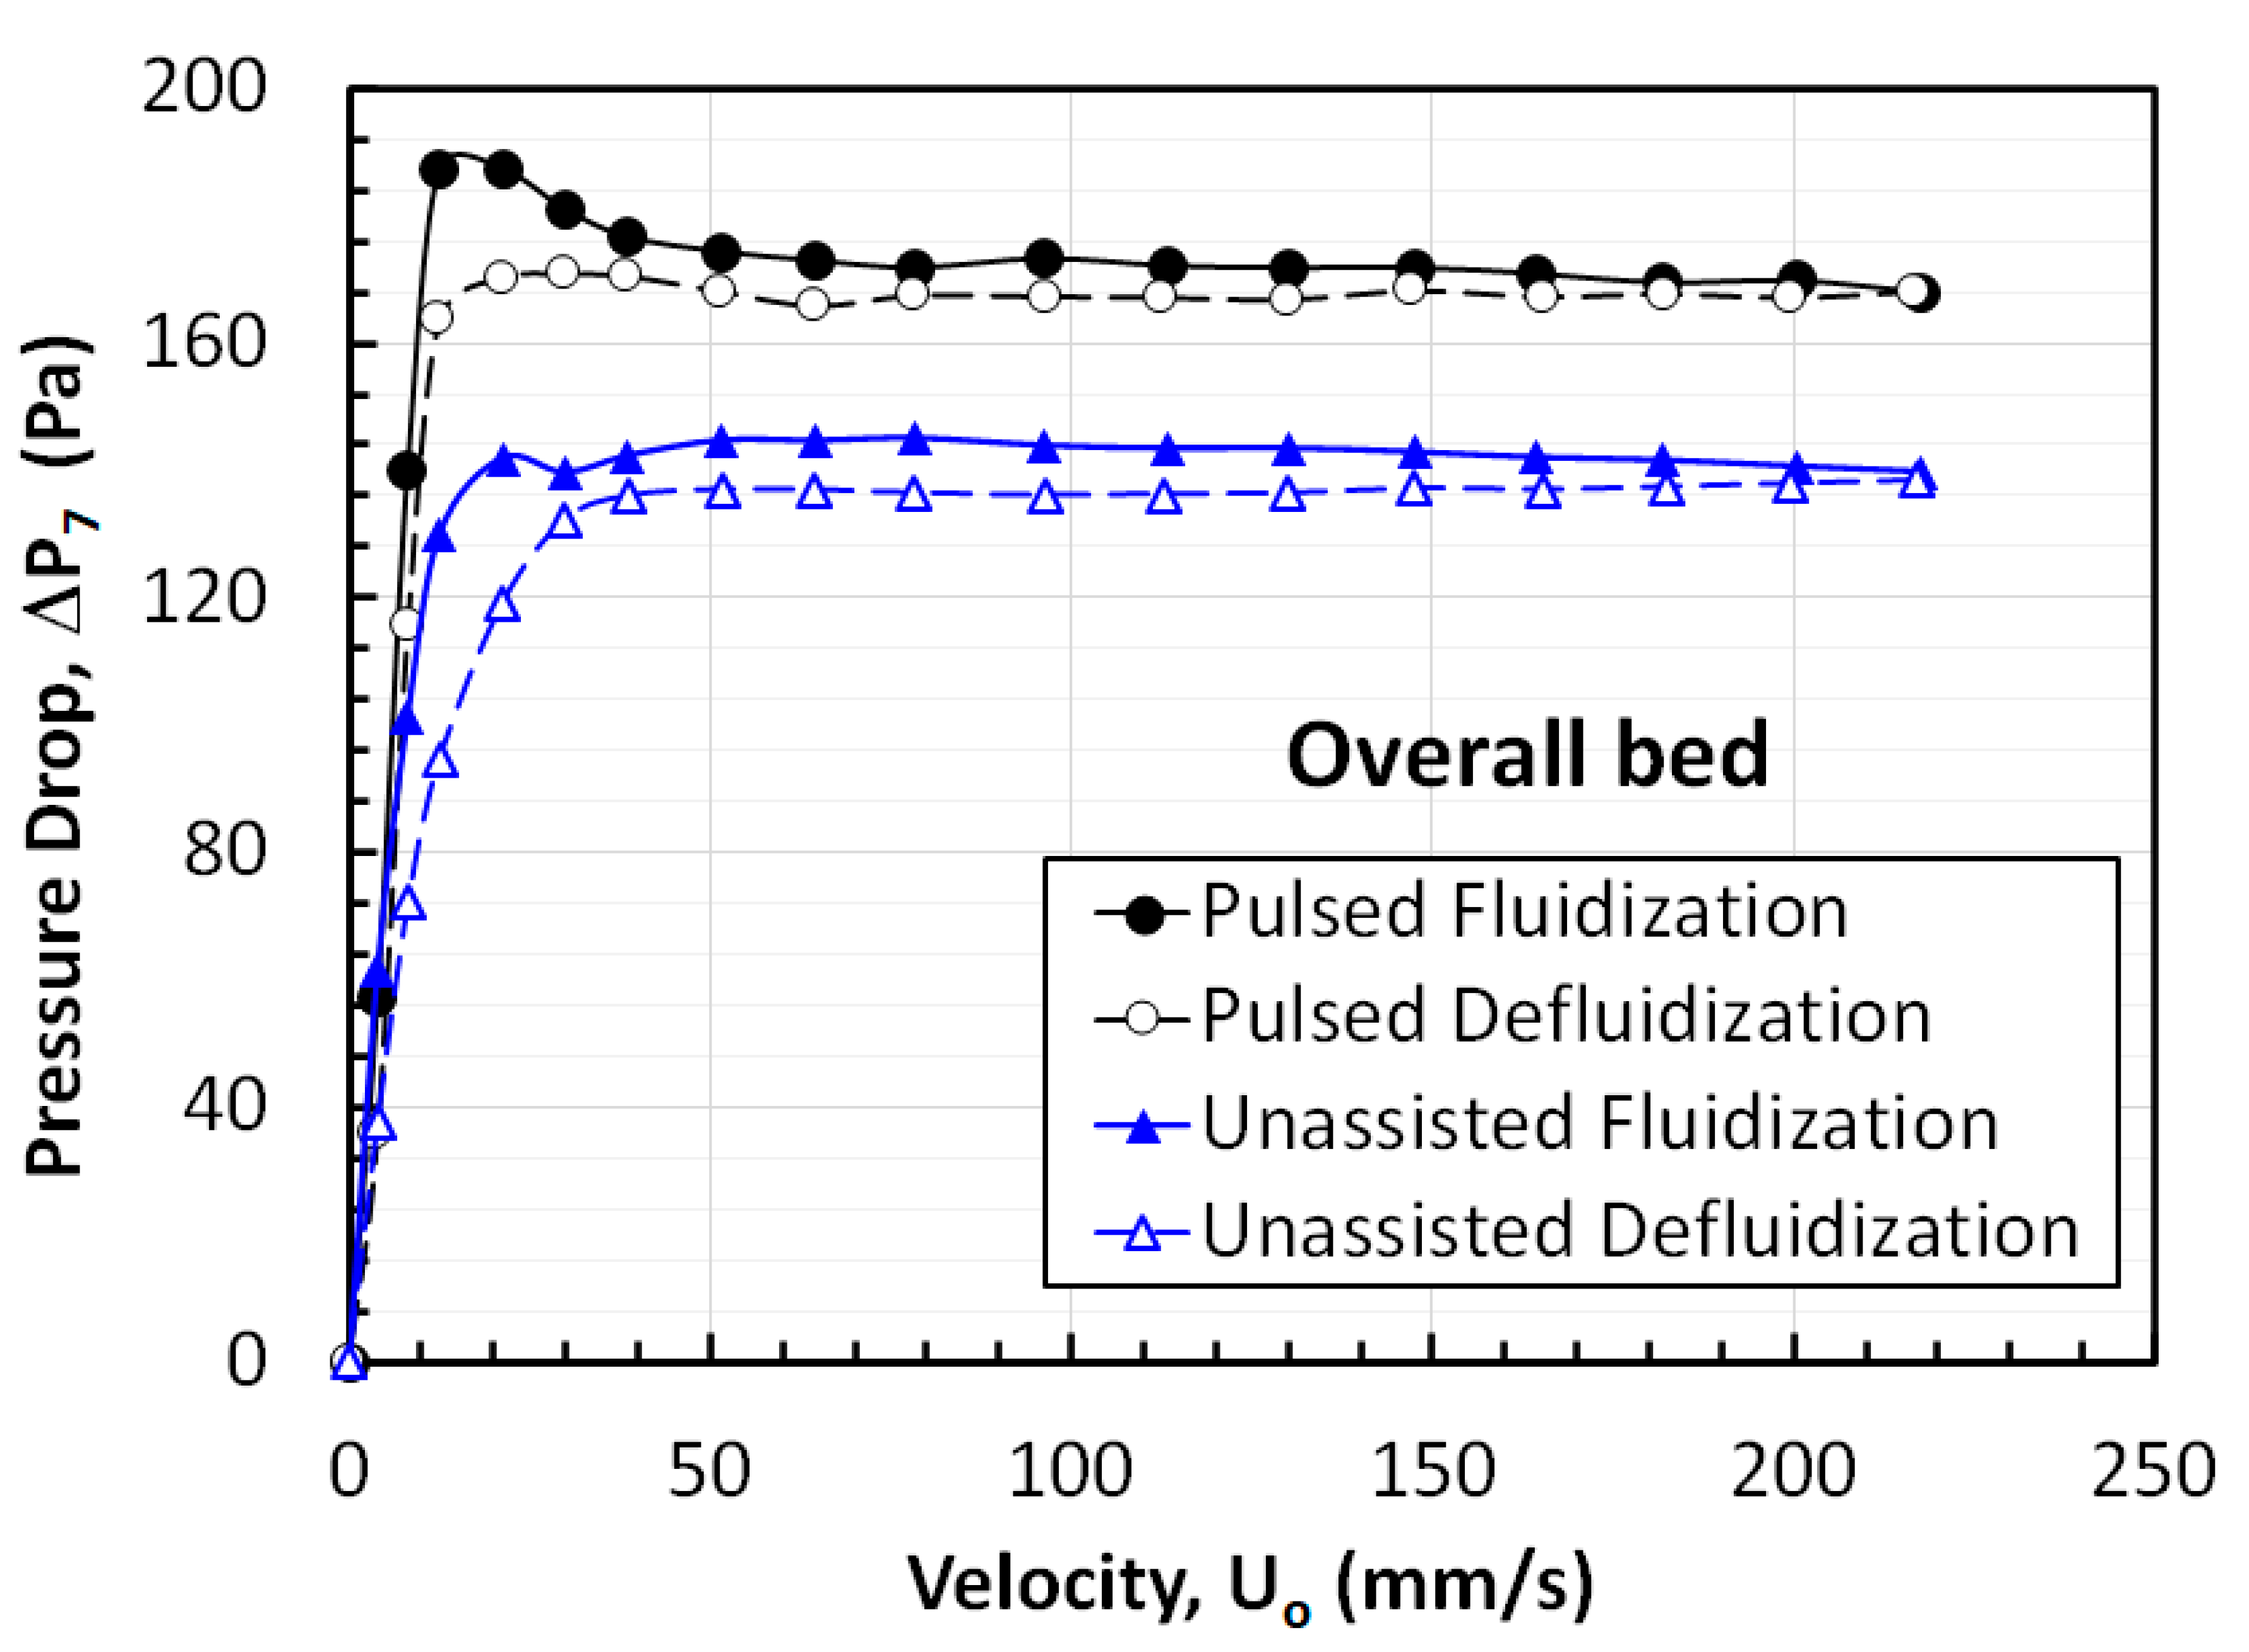
Figure 12 depicts the global pressure drops for fluidization and defluidization cycles of the experiments. The pressure drops for the pulsed fluidized bed are consistently higher than those of the unassisted fluidized bed. This phenomenon can be attributed to the elimination of non-homogeneities that cause the local gas by-passing through large interstitial spaces of the bed of agglomerated nanosilica due to flow pulsation. The pulsed flow also leads to higher pressure drop than the unassisted flow in the fixed bed mode of gas-solid contact when the velocity is low. This phenomenon arises due to the particle size reduction brought by the deagglomeration caused by the flow pulsation.
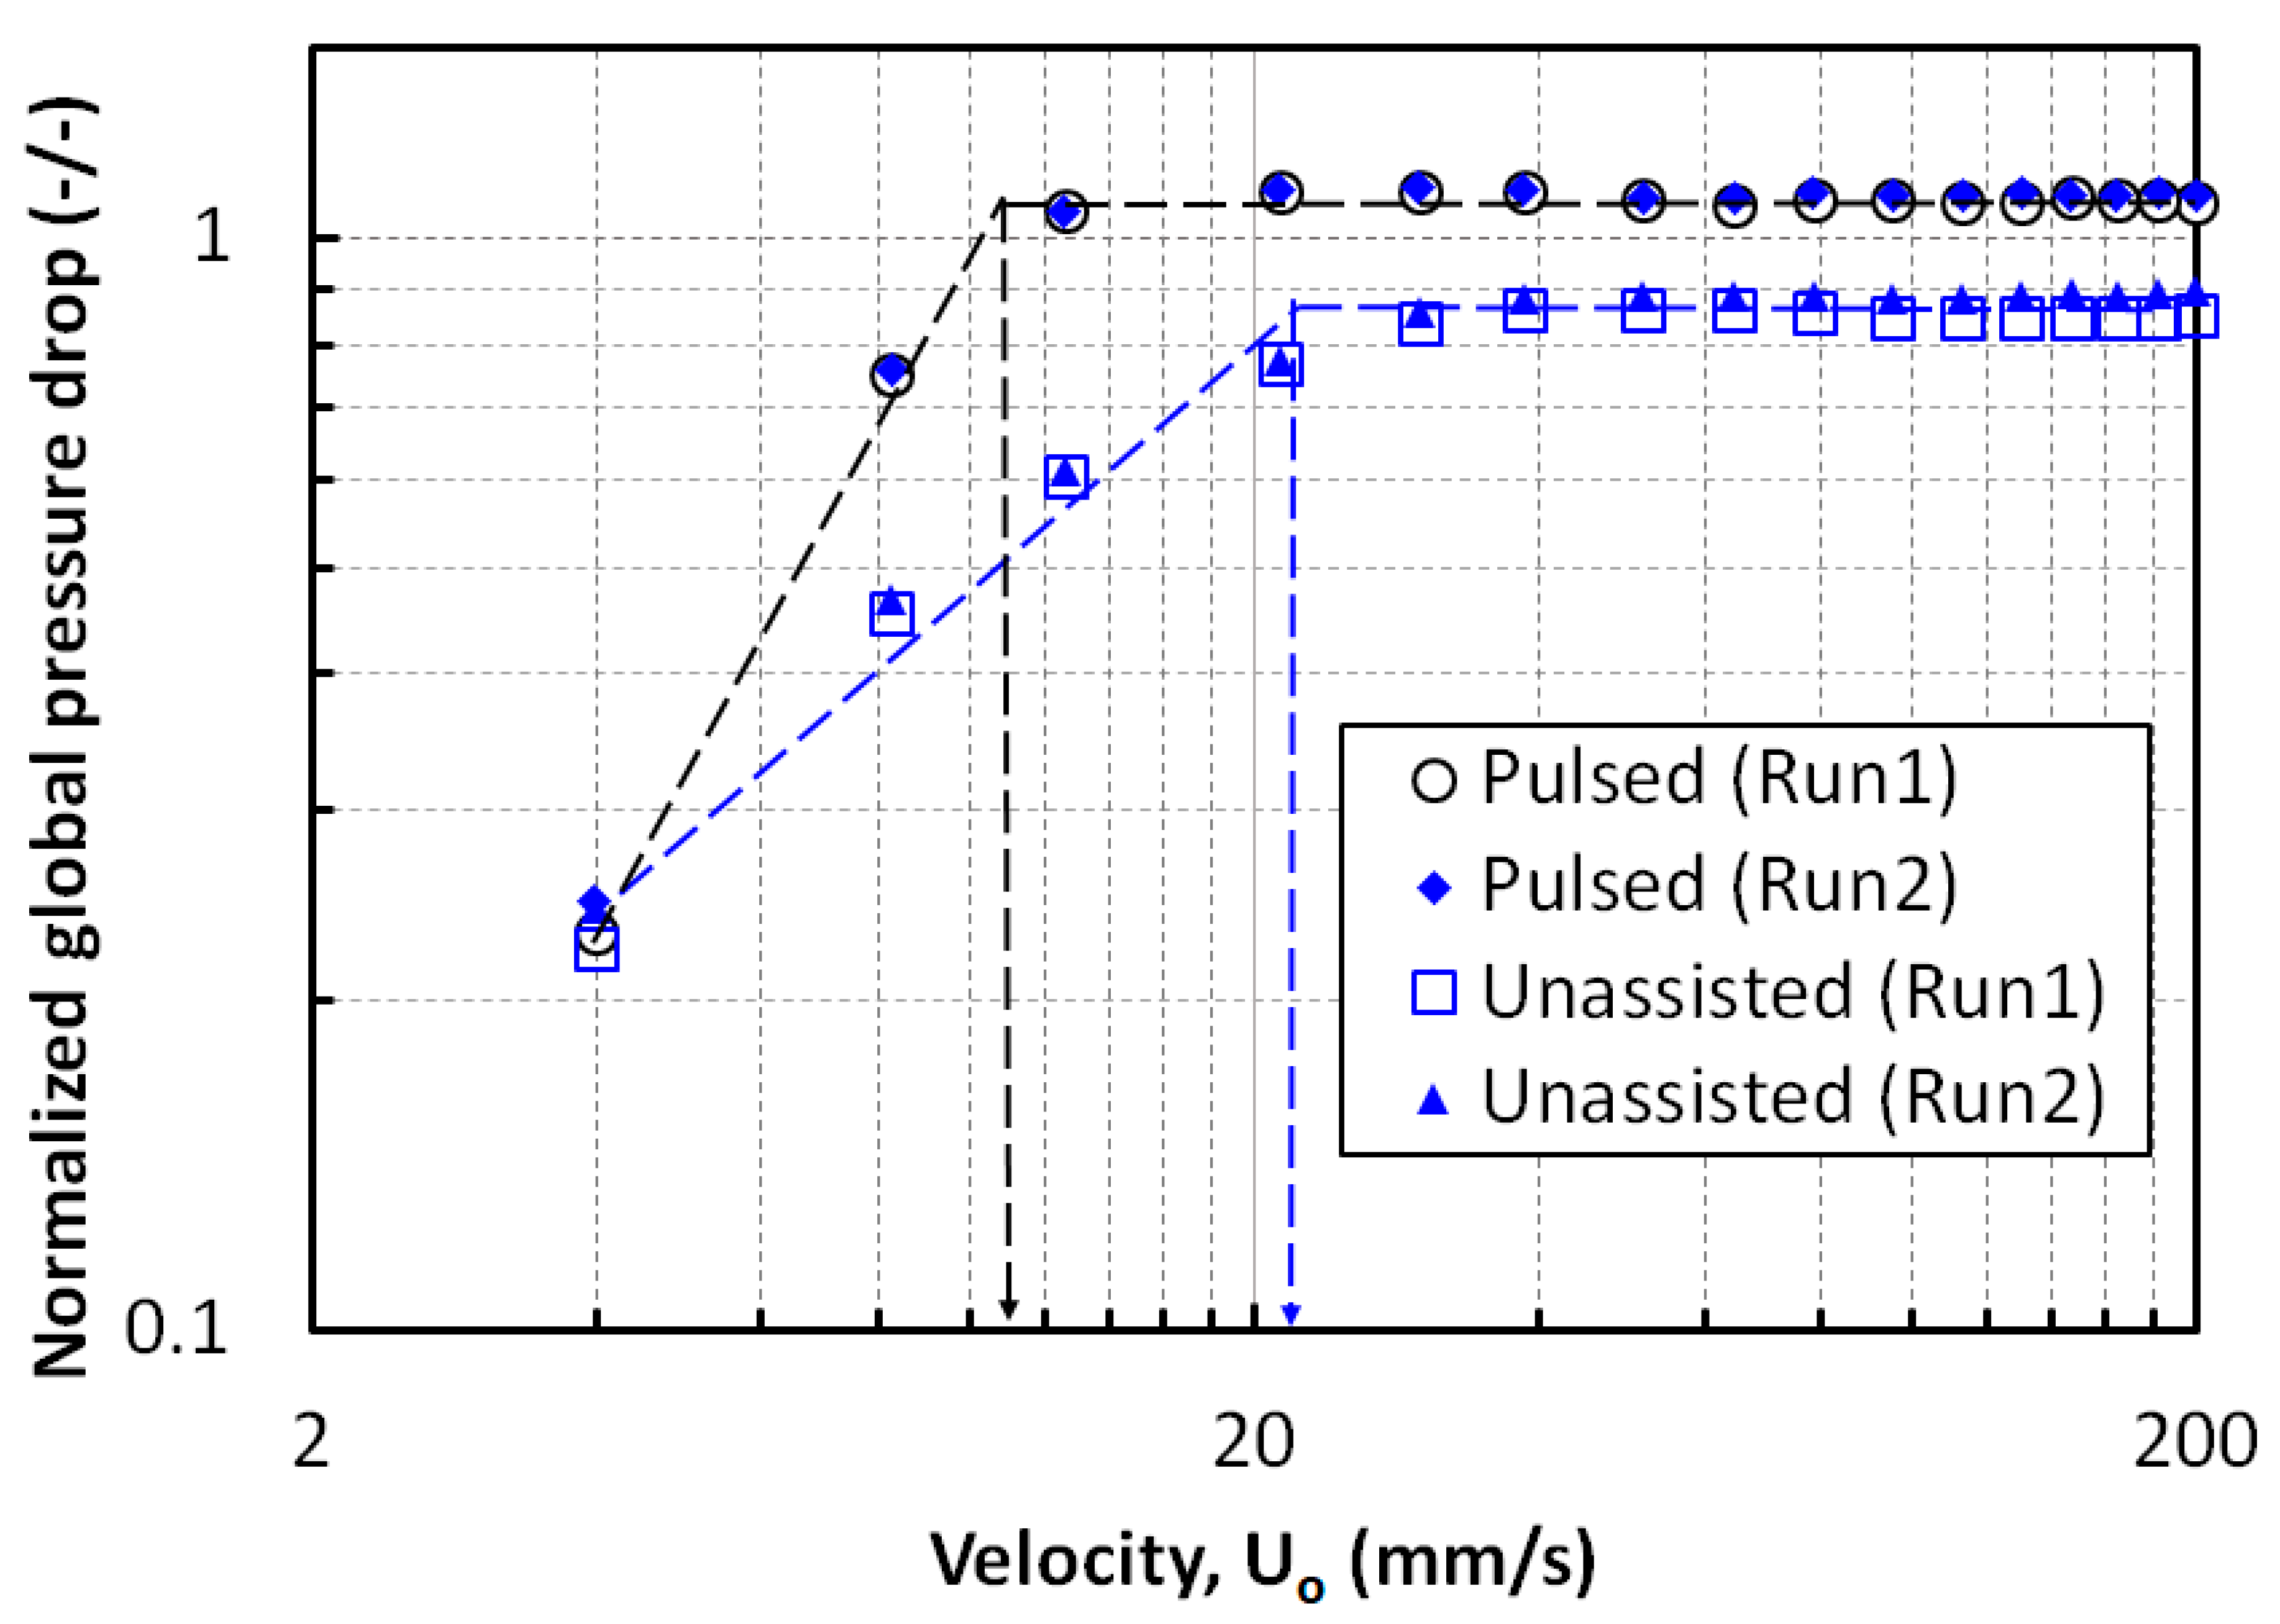
An important hydrodynamic parameter of fluidization is the minimum fluidization velocity (Umf). Data of both defluidization experimental runs are presented in Figure 13 for pulsed fluidization and unassisted fluidization. An excellent agreement between the both runs confirms the reproducibility of the experiment data in the present study. The Umf values for the unassisted and pulsed fluidized beds are approximately 22 mm/s and 11 mm/s, respectively. Evidently, flow pulsation caused a reduction of approximately 50% in the minimum fluidization velocity due to the pulsation induced deagglomeration of nanosilica agglomerates.
4. Conclusion
The hydrodynamics of pulsed fluidized bed was rigorously investigated in this work. The bed was subjected to square wave flow pulsation with adjusted frequency to allow complete collapse of the fluidized bed between two consecutive pulsations. This strategy suppressed non-homogeneities and led to greater expansion of the fluidized bed. Moreover, an approximately 50% reduction in the minimum fluidization velocity was obtained while the pressure drop in the fixed bed mode of contact was significantly higher for the pulsed fluidized bed at the same superficial velocity of the fluidizing air.
The frequency response analysis provided interesting insights with regard to the bed dynamics. The amplitude of the peak initially increased with the increase in the velocity owing to the increase in the pressure drop. However, when the bed was fully fluidized at a higher velocity, the response of the bed remained apparently unaffected by the change in the velocity. The 0.1 Hz peak represents the frequency of the pulsation event, while other smaller peaks occurring at higher frequency represent sinusoids used for approximating the square wave pulsation function. Frequency responses at higher velocities showed greater reproducibility between the fluidization and defluidization cycles than those at lower velocities. This difference was observed due to the initial non-homogeneities present in the bed.
Author Contributions
M.A. conceptualization; M.A., and N.S.K. methodology; M.A. and E.H.A.-G. software; M.A., and A.A. validation; M.A., and A.A. formal analysis; E.H.A.-G., M.A., and A.A. investigation; M.A. and N.S.K. resources; E.H.A.-G. data curation; M.A., A.A., and N.S.K. writing—original draft preparation; M.A., A.A., and N.S.K. writing—review and editing; M.A. supervision; M.A. project administration; M.A. funding acquisition. All authors have read and agreed to the published version of the manuscript.
Funding
The Researchers Supporting Project at King Saud University Project No (RSP-2020/42).
Acknowledgments
The authors would like to thank the Researchers Supporting Project, RSP-2020/42, King Saud University, Riyadh, Saudi Arabia for the financial support.
Conflicts of Interest
The authors declare no conflict of interest. The funders had no role in the design of the study; in the collection, analyses, or interpretation of data; in the writing of the manuscript, or in the decision to publish the results.
References
- Geldart, D. Types of Gas Fluidization. Powder Technol. 1973, 7, 285–292. [Google Scholar] [CrossRef]
- Lee, J.R.; Lee, K.S.; Park, Y.O.; Lee, K.Y. Fluidization characteristics of fine cohesive particles assisted by vertical vibration in a fluidized bed reactor. Chem. Eng. J. 2020, 380, 122454. [Google Scholar] [CrossRef]
- Raganati, F.; Chirone, R.; Ammendola, P. Gas-solid fluidization of cohesive powders. Chem. Eng. Res. Des. 2018, 133, 347–387. [Google Scholar] [CrossRef]
- Al-Ghurabi, E.H.; Ali, S.S.; Alfadul, S.M.; Shahabuddin, M.; Asif, M. Experimental investigation of fluidized bed dynamics under resonant frequency of sound waves. Adv. Powder Technol. 2019, 30, 2812–2822. [Google Scholar] [CrossRef]
- Chirone, R.; Raganati, F.; Ammendola, P.; Barletta, D.; Lettieri, P.; Poletto, M. A comparison between interparticle forces estimated with direct powder shear testing and with sound assisted fluidization. Powder Technol. 2018, 323, 1–7. [Google Scholar] [CrossRef] [Green Version]
- Viscusi, A.; Ammendola, P.; Astarita, A.; Raganati, F.; Scherillo, F.; Squillace, A.; Chirone, R.; Carrino, L. Aluminum foam made via a new method based on cold gas dynamic sprayed powders mixed through sound assisted fluidization technique. J. Mater. Process. Technol. 2016, 231, 265–276. [Google Scholar] [CrossRef]
- Si, C.D.; Wu, J.J.; Wang, Y.; Zhang, Y.X.; Liu, G.J. Effect of acoustic field on minimum fluidization velocity and drying characteristics of lignite in a fluidized bed. Fuel Process. Technol. 2015, 135, 112–118. [Google Scholar] [CrossRef]
- Zhu, C.; Liu, G.L.; Yu, Q.; Pfeffer, R.; Dave, R.N.; Nam, C.H. Sound assisted fluidization of nanoparticle agglomerates. Powder Technol. 2004, 141, 119–123. [Google Scholar] [CrossRef]
- Al-Ghurabi, E.H.; Ajbar, A.; Asif, M. Enhancement of CO2 Removal Efficacy of Fluidized Bed Using Particle Mixing. Appl. Sci. Basel 2018, 8, 1467. [Google Scholar] [CrossRef] [Green Version]
- Al-Ghurabi, E.H.; Ajbar, A.; Asif, M. Improving Fluidization Hydrodynamics of Group C Particles by Mixing with Group B Particles. Appl. Sci. Basel 2018, 8, 1469. [Google Scholar] [CrossRef] [Green Version]
- Ammendola, P.; Chirone, R.; Raganati, F. Fluidization of binary mixtures of nanoparticles under the effect of acoustic fields. Adv. Powder Technol. 2011, 22, 174–183. [Google Scholar] [CrossRef]
- Ajbar, A.; Alhumazi, K.; Asif, M. Improvement of the fluidizability of cohesive powders through mixing with small proportions of group a particles. Can. J. Chem. Eng. 2005, 83, 930–943. [Google Scholar] [CrossRef]
- Ajbar, A.; Bakhbakhi, Y.; Ali, S.; Asif, M. Fluidization of nano-powders: Effect of sound vibration and pre-mixing with group A particles. Powder Technol. 2011, 206, 327–337. [Google Scholar] [CrossRef]
- Ali, S.S.; Asif, M. Effect of particle mixing on the hydrodynamics of fluidized bed of nanoparticles. Powder Technol. 2017, 310, 234–240. [Google Scholar] [CrossRef]
- Ali, S.S.; Basu, A.; Alfadul, S.M.; Asif, M. Nanopowder Fluidization Using the Combined Assisted Fluidization Techniques of Particle Mixing and Flow Pulsation. Appl. Sci. Basel 2019, 9, 572. [Google Scholar] [CrossRef] [Green Version]
- Saidi, M.; Basirat Tabrizi, H.; Grace, J.R. A review on pulsed flow in gas-solid fluidized beds and spouted beds: Recent work and future outlook. Adv. Powder Technol. 2019, 30, 1121–1130. [Google Scholar] [CrossRef]
- Ireland, E.; Pitt, K.; Smith, R. A review of pulsed flow fluidisation; the effects of intermittent gas flow on fluidised gas-solid bed behaviour. Powder Technol. 2016, 292, 108–121. [Google Scholar] [CrossRef]
- Zhou, C.Y.; Dong, L.; Zhao, Y.M.; Fan, X.C. Studies on Bed Density in a Gas-Vibro Fluidized Bed for Coal Cleaning. ACS Omega 2019, 4, 12817–12826. [Google Scholar] [CrossRef] [PubMed] [Green Version]
- Akhavan, A.; van Ommen, J.R.; Nijenhuis, J.; Wang, X.S.; Coppens, M.O.; Rhodes, M.J. Improved Drying in a Pulsation-Assisted Fluidized Bed. Ind. Eng. Chem. Res. 2009, 48, 302–309. [Google Scholar] [CrossRef]
- Ali, S.S.; Asif, M. Fluidization of nano-powders: Effect of flow pulsation. Powder Technol. 2012, 225, 86–92. [Google Scholar] [CrossRef]
- Akhavan, A.; Rahman, F.; Wang, S.; Rhodes, M. Enhanced fluidization of nanoparticles with gas phase pulsation assistance. Powder Technol. 2015, 284, 521–529. [Google Scholar] [CrossRef]
- Ali, S.S.; Asif, M.; Ajbar, A. Bed collapse behavior of pulsed fluidized beds of nano-powder. Adv. Powder Technol. 2014, 25, 331–337. [Google Scholar] [CrossRef]
- Ali, S.S.; Al-Ghurabi, E.H.; Ajbar, A.; Mohammed, Y.A.; Boumaza, M.; Asif, M. Effect of Frequency on Pulsed Fluidized Beds of Ultrafine Powders. J. Nanomater. 2016. [Google Scholar] [CrossRef] [Green Version]
- Bizhaem, H.K.; Tabrizi, H.B. Experimental study on hydrodynamic characteristics of gas-solid pulsed fluidized bed. Powder Technol. 2013, 237, 14–23. [Google Scholar] [CrossRef]
- Dong, L.; Zhou, E.H.; Cai, L.H.; Duan, C.L.; Zhao, Y.M.; Luo, Z.F. Fluidization Characteristics of a Pulsing Dense-Phase Gas-Solid Fluidized Bed for High-Density Separation of Fine Anthracite. Energy Fuels 2016, 30, 7180–7186. [Google Scholar] [CrossRef]
- Al-Ghurabi, E.H.; Shahabuddin, M.; Kumar, N.S.; Asif, M. Deagglomeration of Ultrafine Hydrophilic Nanopowder Using Low-Frequency Pulsed Fluidization. Nanomaterials Basel Switz. 2020, 10, 388. [Google Scholar] [CrossRef] [PubMed] [Green Version]
- Janssen, L.P.B.M.; Marring, E.; Hoogerbrugge, J.C.; Hoffmann, A.C. The mechanical behaviour of vibrated, aerated beds of glass and starch powder. Chem. Eng. Sci. 1998, 53, 761–772. [Google Scholar] [CrossRef] [Green Version]
- Valverde, J.M.; Castellanos, A. Effect of vibration on agglomerate particulate fluidization. AIChE J. 2006, 52, 1705–1714. [Google Scholar] [CrossRef]
- Barletta, D.; Donsi, G.; Ferrari, G.; Poletto, M.; Russo, P. The effect of mechanical vibration on gas fluidization of a fine aeratable powder. Chem. Eng. Res. Des. 2008, 86, 359–369. [Google Scholar] [CrossRef]
- Barletta, D.; Poletto, M. Aggregation phenomena in fluidization of cohesive powders assisted by mechanical vibrations. Powder Technol. 2012, 225, 93–100. [Google Scholar] [CrossRef]
- Zhang, W.; Zhao, M. Fluidisation behaviour of silica nanoparticles under horizontal vibration. J. Exp. Nanosci. 2010, 5, 69–82. [Google Scholar] [CrossRef] [Green Version]
- Barletta, D.; Russo, P.; Poletto, M. Dynamic response of a vibrated fluidized bed of fine and cohesive powders. Powder Technol. 2013, 237, 276–285. [Google Scholar] [CrossRef]
- Lehmann, S.E.; Hartge, E.U.; Jongsma, A.; deLeeuw, I.M.; Innings, F.; Heinrich, S. Fluidization characteristics of cohesive powders in vibrated fluidized bed drying at low vibration frequencies. Powder Technol. 2019, 357, 54–63. [Google Scholar] [CrossRef]
- An, K.; Andino, J.M. Enhanced fluidization of nanosized TiO2 by a microjet and vibration assisted (MVA) method. Powder Technol. 2019, 356, 200–207. [Google Scholar] [CrossRef]
- Jia, D.; Cathary, O.; Peng, J.; Bi, X.; Lim, C.J.; Sokhansanj, S.; Liu, Y.; Wang, R.; Tsutsumi, A. Fluidization and drying of biomass particles in a vibrating fluidized bed with pulsed gas flow. Fuel Process. Technol. 2015, 138, 471–482. [Google Scholar] [CrossRef]
- Zhao, Z.; Liu, D.; Ma, J.; Chen, X. Fluidization of nanoparticle agglomerates assisted by combining vibration and stirring methods. Chem. Eng. J. 2020, 388, 124213. [Google Scholar] [CrossRef]
- Zhu, L.; Lu, H.; Poletto, M.; Liu, H.; Deng, Z. Hopper discharge of cohesive powders using pulsated airflow. AIChE J. 2020, 66, 16240. [Google Scholar] [CrossRef]
- Asif, M.; Kalogerakis, N.; Behie, L.A. Hydrodynamics of Liquid Fluidized-Beds including the Distributor Region. Chem. Eng. Sci. 1992, 47, 4155–4166. [Google Scholar] [CrossRef]
Figure 1.
Experimental setup. (1) Fluidized bed test section; (2) Calming section; (3) Disengagement section; (4) Compressed air supply; (5) Low range mass flow controller; (6) High range mass flow controller; (7) Data acquisition system; (8) Computer with LabVIEW software; (9) Analog input signals (red broken lines); (10) Analog output signals (blue broken lines).

Figure 2.
Cumulative particle size distribution of dry sample of sieved nanosilica.

Figure 3.
SEM image showing size distribution of nanoagglomerates of sieved sample.

Figure 4.
Comparison of pressure drops measurement using local and global pressure drops.

Figure 5.
Velocity (Uo) and overall pressure drop transients () for (a) unassisted fluidization and (b) pulsed fluidization.
Figure 5.
Velocity (Uo) and overall pressure drop transients () for (a) unassisted fluidization and (b) pulsed fluidization.

Figure 6.
Frequency spectra of velocity. (a) unassisted fluidization; (b) pulsed fluidization.

Figure 7.
Overall () and lower region ( ) pressure transients for Uo = 4 mm/s, 12 mm/s, 65 mm/s, and 165 mm/s in pulsed fluidized beds.
Figure 7.
Overall () and lower region ( ) pressure transients for Uo = 4 mm/s, 12 mm/s, 65 mm/s, and 165 mm/s in pulsed fluidized beds.

Figure 8.
Overall () and upper region ( ) pressure transients for Uo = 4 mm/s, 12 mm/s, 65 mm/s, and 165 mm/s in pulsed fluidized beds.
Figure 8.
Overall () and upper region ( ) pressure transients for Uo = 4 mm/s, 12 mm/s, 65 mm/s, and 165 mm/s in pulsed fluidized beds.

Figure 9.
Overall bed dynamics at different velocities for unassisted and pulsed fluidizations.

Figure 10.
Comparison of frequency responses of overall bed dynamics for fluidization and defluidization at different velocities.
Figure 10.
Comparison of frequency responses of overall bed dynamics for fluidization and defluidization at different velocities.

Figure 11.
Effect of the velocity on the local pressure drop profiles for unassisted and pulsed fluidized beds during the fluidization cycle, (a) upper region, (b) central region, and (c) lower region.
Figure 11.
Effect of the velocity on the local pressure drop profiles for unassisted and pulsed fluidized beds during the fluidization cycle, (a) upper region, (b) central region, and (c) lower region.


Figure 12.
Effect of the velocity on the global pressure drop profiles for unassisted and pulsed fluidized beds during fluidization and defluidization.
Figure 12.
Effect of the velocity on the global pressure drop profiles for unassisted and pulsed fluidized beds during fluidization and defluidization.

Figure 13.
Effect of the velocity on the normalized global pressure drop for the defluidization cycles of unassisted and pulsed fluidizations.
Figure 13.
Effect of the velocity on the normalized global pressure drop for the defluidization cycles of unassisted and pulsed fluidizations.

© 2020 by the authors. Licensee MDPI, Basel, Switzerland. This article is an open access article distributed under the terms and conditions of the Creative Commons Attribution (CC BY) license (http://creativecommons.org/licenses/by/4.0/).
Share and Cite
MDPI and ACS Style
Asif, M.; Al-Ghurabi, E.H.; Ajbar, A.; Kumar, N.S. Hydrodynamics of Pulsed Fluidized Bed of Ultrafine Powder: Fully Collapsing Fluidized Bed. Processes 2020, 8, 807. https://0-doi-org.brum.beds.ac.uk/10.3390/pr8070807
AMA Style
Asif M, Al-Ghurabi EH, Ajbar A, Kumar NS. Hydrodynamics of Pulsed Fluidized Bed of Ultrafine Powder: Fully Collapsing Fluidized Bed. Processes. 2020; 8(7):807. https://0-doi-org.brum.beds.ac.uk/10.3390/pr8070807
Chicago/Turabian StyleAsif, Mohammad, Ebrahim H. Al-Ghurabi, Abdelhamid Ajbar, and Nadavala Siva Kumar. 2020. "Hydrodynamics of Pulsed Fluidized Bed of Ultrafine Powder: Fully Collapsing Fluidized Bed" Processes 8, no. 7: 807. https://0-doi-org.brum.beds.ac.uk/10.3390/pr8070807
Note that from the first issue of 2016, this journal uses article numbers instead of page numbers. See further details here.