Solid Particle Erosion Behaviour and Protective Coatings for Gas Turbine Compressor Blades—A Review


1
School of Aerospace, Transport and Manufacturing (SATM), Cranfield University, Cranfield MK43 0AL, UK
2
Kuwait Army, Kuwait Ministry of Defence, Safat 13128, Kuwait
3
Nanotechnology and Advanced Materials Program, Energy and Building Research Center, Kuwait Institute for Scientific Research, Safat 13109, Kuwait
*
Author to whom correspondence should be addressed.
Processes 2020, 8(8), 984; https://0-doi-org.brum.beds.ac.uk/10.3390/pr8080984
Submission received: 2 July 2020
/
Revised: 22 July 2020
/
Accepted: 7 August 2020
/
Published: 13 August 2020
(This article belongs to the Special Issue Feature Review Papers)
Abstract
:Gas turbines (GTEs) are often utilised in harsh environments where the GT components, including compressor vanes and rotor blades, are subject to erosion damage by sand and dust particles. For instance, in a desert environment, the rate of damage made by solid particles erosion (SPE) becomes severe, and therefore results in degradation to the GTE parts, lowering the cycle efficiency, reducing the device lifetime, and increasing the overall cost of the operation. As such, understanding the erosion mechanism caused by solid particles and the effects associated with it is crucial for selecting the appropriate countermeasures and maintaining the system performance. This review paper provides a survey of the available studies on SPE effects on GTEs and surface protective coatings. Firstly, the ductile and brittle SPE mechanism is presented, as well as the ductile-brittle transition region. Then, an in-depth focus on the parameters associated with the SPE, such as particles properties and impingement conditions, is introduced. Furthermore, the existing theoretical models are shown and discussed. Afterwards, erosion resistant coating materials for surface protection and their selection criteria are covered in the review. Finally, the gap in knowledge and future research direction in the field of SPE on GTEs are provided.
1. Introduction
The demand for energy is rising globally due to economic and population growth. Concerns regarding energy security will also grow as more energy resources are required. As a result, the performance criteria of modern machines and cycles must be ever more rigorously defined in terms of pushing components to the limit of their capabilities [1]. The gas turbine engine (GTEs) industry is a crucial contributor to the global economy and has seen continuous growth since its early years [2,3]. GTEs are widely employed in propulsion and power generation in ships, aircraft, and industry because of their ability to operate in a wide range of environmental conditions and with high operating efficiency. The engine functions by exchanging the combustion heat energy into mechanical work which is achieved through means of a working fluid (air in most cases). Concerns for GTE life cycle management includes maintenance and operating costs, reliability, and availability of replacement parts [4,5,6,7]. Modern operating concepts require GTEs to operate with the highest performance factors while also complying with the environmental regulations and being operational feasible. The availability and performance of GTEs can be improved through an understanding of the mechanisms that contribute to the degradation of components. This will help recognise the causes of reduced performance and should significantly reduce the cost of operation. Availability of advanced numerical computational techniques improves design capabilities, enabling identification of loss generating flow patterns and the introduction of relevant degradation tolerances in the design of future components [8]. Knowledge of the operating conditions of GTEs is essential for assessing operational efficiency, performing diagnosis of the engine deterioration, and permitting an early prediction of the failures. In most cases, the GTE components gets exposed to harsh operating environments, which leads to degradation in its overall performance over time [9]. Such degradation in the components can result from various factors such as (1) erosion due to ingestion of particles, (2) fouling (3) hot corrosion/oxidation, (4) corrosion, and (5) foreign object damages (FOD) [10]. A comprehensive review of the research into turbomachinery deterioration was previously presented by Hamed et al. [11], where they concluded that the deterioration factors in turbomachinery components accompany performance loss of the system. In particular, the compressors can undergo various geometric modifications due to erosive degradation such as increases in tip clearance, blade chord reductions, increase in pressure losses due to increased roughness of the surfaces, and increased sharpness of the trailing edge. An example of the materials used in manufacturing compressor blades, their applications, advantages, and disadvantages are shown in Table 1. In GTs, the impact of particles with high velocities and of diameters more than about 10 microns on the leading edges of aerofoils, and other surfaces often causes deposition or erosion depending on the balance of molten versus hard particles [11]. It can be seen in Figure 1 how degradation can affect compressor and turbine blades, while Figure 2 demonstrates the interdependency of degradation phenomena in GTEs, as described by Saravanamutto [12].
Kurz and Brun [18] and Kurz et al. [19] studied the mechanisms of degradation and how degredation of individual components impacted on the overall performance of GTEs, and established a close co-relation between element degradation and mechanical reliability. They explained that compressor degradation could affect compressor isentropic efficiency and flow capacity, which resulted in a “re-matching” of the GTE and led to an overall drop in both power output and thermal efficiency. A characterisation of five key degradation mechanisms is presented in Table 2. Lie [20] afterwards confirmed that such physical defects cause changes to the GTEs thermodynamic performance which can be determined by assessing component flow rate to its efficiency. This generates observable changes in engine measurable parameters such as fuel consumption, speed of rotation, pressure, and temperature. The consequent degredation of performance as determined by these measurements enables the detection, identification, and replacement/repair of the defective components.
It is essential that any device associated with a GTE be maintained effectively to ensure a high level of reliability, and Figure 3 illustrates one approach to diagnose GTE defects. Hanachi et al. [22] demonstrated that a dominant performance deterioration mode was a result of congestion and airborne deposition foulants in the GTE upstream stages which led to decreases in compressor mass flow capacity, and an increase in GTE fuel consumption. Kurz and Brun [23,24] and Meher-Homji et al. [25] have proposed critical deterioration mechanisms, and concluded that the causes of the degredation of a GTE can be classed in two major categories:
- (1)
- Mechanical degradation: the wearing of seals and bearings, coupling problems with high levels of noise and vibration, or difficulties with the lubrication system. It is crucial to realize that on many occasions high levels of vibration will be a sign of an underlying problem, which could be aerodynamic in nature and impinge on performance; and
- (2)
- Performance degradation: this is seen in the form of component and/or performance deterioration which can be remedied by actions taken while the GTE is operating, such as compressor fouling (recoverable deterioration), by overhaul at shutdown such as surface erosion (unrecoverable deterioration), and/or cannot be fully removed and residual deterioration will remain even after major overhauls such as airfoil platform distortion (permanent deterioration).
The effects of solid particles erosion (SPE), which were initially studied back in the 19th century by Reynolds [27], can be reduced by using surface protection methods. Of these methods, erosion resistant coatings (ERC) have shown to greatly decrease the impact of SPE on GTEs [28,29]. The first-generation of these coatings was fabricated from single phase metal nitrides (e.g., TiN). However, it was found that the added layer did not perform as expected for the normal angle as a result of its high internal stress and low toughness [30,31,32]. This obstacle was afterwards resolved by using the second generation of ERC, which consists of multi-layered structures of metal/ceramic, where the crack generated by the SPE on the exposed surface layer is blocked by the layer that follows it. Another advantage of the second-generation ERCs is that coatings with increased thickness that give greater control of internal stress can be deposited on the targeted surface, and that the fabricated films show much better resistance to corrosion when in a NaCl environment [33]. Recently, erosion resistant coatings of nanocomposite have been developed, and have been shown to perform better than the conventional second-generation multi-layered films [32,34]. The enhancement in the performance is due to the deposited layers containing ultra-fine grain sizes (≤10 nm), which greatly increases the number of interfaces between materials with different shear moduli, and the sharp boundaries between these very thin layers prevents the developed cracks from penetrating into the substrate [33,35].
A measure of the relevance of the use of SPE protective coatings for GTEs can be obtained from a survey of published works. According to the Scopus database, there are at the time of writing 4015 papers on SPE (1957–2019), of which only 58 cover the implementation of coatings for GTEs (1984–2019) [36]. Figure 4a shows the number of published documents on SPE protective coatings for GTEs per year, while Figure 4b demonstrates the percentage of each type of these documents. The results from Scopus were obtained by first searching for “Solid particle erosion”, then carrying out a second search on the results obtained for “Coating” and “Gas turbine”.
On the basis of the search the author has concluded that the availability of up-to-date review articles on SPE for GTEs and the selection along with the usage of ERC for components protection are minimal, if any. Thus, this review article will focus on providing an overview on the previously mentioned aspects to the reader through its upcoming sections. Section 2 presents a review on ductile and brittle mechanisms of SPE, along with the mechanism at the ductile-brittle transition (DBT) region. In addition, Section 3 covers the parameters that influences the SPE effect on the targeted surface, such as particles properties and impingement conditions. Furthermore, Section 4 reviews the different SPE theoretical models, while details on ERCs, their different fabrication methods, and material selection criteria, is given in Section 5. Finally, Section 6 highlights the present gap in knowledge that researchers need to fill to reduce the impact of SPE on GTEs and better utilize ERCs.
2. Solid Particle Erosion Mechanism
As mentioned previously, SPE is a material removal phenomenon that the targeted material surface experiences due to the repeated impact on it from differing sized solid particles of high striking speeds [37]. Furthermore, the kinetic energy (KE) of these particles should be high enough to cause structural damage to the contacted material surface. For instance, particles smaller than 10 µm, in contrast to those of larger sizes, usually do not possess sufficient KE to erode the blades [18]. The medium itself, in which the solid particles flow to cause surface erosion, can be of gaseous or liquid phase [38,39]. Meng and Ludema [40] illustrated in their work the impingement concept of SPE, where they explained that this particular type of erosion occurs due to a number of changeable permutations of brittle fracture, cutting, fatigue, and melting. Figure 5 shows the four mechanisms of SPE and their associated material behaviour. In addition, the cutting erosion mechanism can be further divided into two sub processes, namely 1—cutting edge penetration, and 2—failure due to plastic deformation. This is because the aforementioned consist of infiltration of strain to failure (plastic) and cutting (resisted by hardness) [40].
Brun el at. [41] have concluded that in turbomachinery SPE is a major failure mechanism in centrifugal and axial compressors. This is because the material removal from the compressor blades leading and trailing edges, as a result of SPE, negatively deforms the airfoil shape, lowers the compressor pressure ratio, and lowers the overall efficiency of the GT. Schmucker and Schaffler [42] studied the particles mass effect on a compressor, where they have found that increasing the total mass of the ingested sand particle into the compressor results in a reduction in the blades rotation speed, blade total area, and efficiency of the device. The following observations were also noticed:
- (1)
- Two-thirds of the rotor blades are impacted at the leading edge, while the other one-third are hit at the trailing edge.
- (2)
- Two-thirds of the stator blades are hit at the trailing edge, while the other one-third are hit at the leading edge.
- (3)
- Cracks are equally distributed over blade height.
- (4)
- Thickening of the well-rounded leading edge and the decreased chord length caused the flow to reduce along with the isentropic compressor efficiency by 1.2% and 0.8%, respectively.
Levin et al. [43] observed that plastic deformation of the impacted material, by solid particle, takes place at its surface, especially near the eroded area, and yield strength increased, due to strain hardening. Eventually, the maximum stress sustainable by the target material surface will, due to the additional deformation be reduced to its fracture strength. There is no further plastic deformation, instead the surface material becomes brittle. These researchers suggested a model for the behaviour of materials subject to SPE which links the mechanical properties of the material to its deformation when subject to SPE. They have also proposed a technique that can be used to evaluate the material mechanical properties during SPE through using a high-strain-rate compression testing method. Their findings have shown that materials with high strain rates, hardness, and tensile toughness have excellent erosion resistance characteristics. Balan and Tabakoff [44,45] and Hamed et al. [46] experimentally measured the compressor performance in terms of cascade and single-stage compressors after the ingestion of several loads of sand particles. The performance of both compressors decreased as the sand ingestion rate increased. They referred the performance loss in the compressor, for both cases, as due to: (1) increased roughness of the surface of the blade, (2) blade tip clearance increased, (3) leading edge of the blade blunted, (4) thickness of blade trailing edge reduced, and (5) chord shortening. Operating GTEs under such conditions would lead to lower output performance, and off-design conditions with reduced surge margin [47]. The GTE system would also experience lower pressure ratio and reduced compressor efficiency, accompanied by higher specific fuel consumption and increased exhaust gas temperature [48].
Hamed el at. [49] experimentally illustrated the effects of sand ingestion when operating a GTE in a sandy atmosphere. The results revealed that the greatest erosion rate for the first rotor of the compressor at high impact velocity was close to the leading edge. They noted that the sand particles impacting on the first rotor were given a movement in the radial direction; and that the maximum erosion rates in the subsequent blade rows were observed at the leading edge tip. In particular, this tip erosion of the rotor blades reduced chord length and resulted in thinning and rounding of the tip of the leading edge, increasing tip clearance, as shown in Figure 6.
Lombardo and Torella [51] developed a real-time GTE gas path analysis nonlinear model capable of simulating compressor behavioural response when subject to SPE. To investigate the effects of SPE, the three key compressor parameters were varied: (1) delivered mass flow rate, (2) exit pressure, and (3) exit temperature. The simulation results confirmed that deformation of blade geometry reduced the GTE mass flow rate because the mass flow rate delivered by the compressor was reduced. Additionally, the results showed a pressure reduction in all GTE main components as an outcome of the SPE effects on the compressor.
It can be concluded that the reduction in mass flow rate decreased compressor efficiency with a consequent drop in power. It was shown that the ingested particles affected the compressor components in such a way as to decrease the airflow and reduce component efficiency, and thus GTE power output and thermal efficiency [47]. To avoid decreasing GTE availability and reliability, and increasing operating and maintenance costs, a deeper understanding of the material loss mechanisms is needed. The following sub-sections will discuss in detail the effects of SPE on brittle and ductile materials, and the transitions between the two.
2.1. Ductile Solid Particles Erosion (SPE) Mechanism
It is well known that the ductility of a material is determined by the capability of the material to experience elongation (i.e., decrease in its cross-section) or curvature without fracture. In contrast, plasticity is where the deformation of the material in response to an applied load/force produces an irreversible change in shape [52]. Several researchers, since the late 1950s, have investigated the ductile SPE behaviour of materials. Finnie [53] was the first to model the mechanism, on the basis of the cutting of the surface by the impacting particles. Biswas et al. [54] experimentally investigated the response of mild steel and aluminium surfaces, to SPE using angular silicon carbide (SiC) particles with radius 60 μm. The SiC particles entered a stream of compressed air, impacting the target surface at different velocities and angles of impact by using a gas-blast erosion tester. Erosion rates were plotted against impact energy of the particles and, as seen in Figure 7, were seen to vary with the angle of incidence (impact angle), with the greatest erosion rate at 15° for both materials. The lowest erosion rate was observed at an impact angle of 90° for both materials. The results verified that for 15°, the mass lost from the surface was due to cracking of the subsurface. However, at an angle of incidence of 90° surface mass was removed by cutting to the subsurface. The angle of incidence can be used to decompose the energy contained in the impacting particles into two mutually orthogonal forces, (1) a force parallel to the surface, which determines the amount of sliding; and (2) a force normal to the surface, which determines the duration of the impact.
Chang et al. [55] used four different iron matrices (ductile materials with diverse hardnesses: ferrite, lower and upper bainite, and martensite) to experimentally investigate the erosion rate at various angles of incidence with different mechanical properties. Figure 8 illustrates typical erosion behaviour of the four different materials. With increase in the angle of incidence from zero, there was a corresponding increase in the erosion rate, until it reached a maximum at a particular angle after which it decreased. The four cases (tested materials) showed comparable erosion rates at angles of incidence of 15° and 30°, though ferritic ductile iron did exhibit a significantly greater erosion rate at 15°. Figure 9 shows the proposed sequence of events in the ductile materials subject to SPE. The lip of platelet extruded out of the crater caused by the impact. It can also be seen that the sequence of extrusion followed by forging of the extruded material can readily account for the surface and sub-surface locations of a ductile material.
Once the solid particles impact the material surface, heat starts to generate due to friction. In a multi-impact process, the heat transfer is adiabatic because the area of the solid particle in contact with the material surface is minimal, as is the localised shear force generated by the high-speed impact of the particle [57,58]. Molinari and Ortiz [59] studied the SPE of a substrate that was made of mild steel. The solid particles employed were of spherical steel and the angles on incidence on the examined surface were in a range of 0° to 90°. The experimental results showed that the angle of incidence effect was linked to the average temperature rise. Furthermore, in the analysis, two primary sources of heat were studied, which are (1) the friction heat source, and (2) the material plastic working heat source. It was found that, once the angle of incidence is close to 0°, the sliding velocity tends to reach to its maximum value, while both shearing stress and contact pressure are minimised. On the other hand, higher angles of incidence (i.e., >0°) cause the supplied heating rate from the plastic work in the boundary in contact and the friction mechanism to initially rise monotonically, hence resulting in a monotonically rise in the temperature as shown in Figure 10.
Finnie [60] explains that the particle cutting action discontinues once the particle’s horizontal movement comes to a stop or the solid particle leaves the targeted surface. Thus, he proposed his famous erosion equation for the ductile materials that is grounded on kinetic energy mechanisms and the examination of the interchange over the single solid particle impact where the primary mechanism is cutting, as illustrated in Equations (1) and (2):
where E, , , , , α, and are the erosion rate, the solid particles impacting the amount of cutting the target surface in a typical method, the impact velocity, the material density, the hardness of the material, the impact angle, and the constant force component ratio of particle, respectively.
Particles impacting on a surface of ductile material will erode the surface by generating a lamina of material that lies parallel to the target surface, before finally separating [61]. Hutchings [62] developed a model that presented the properties of the target material in terms of: (1) density, (2) dynamic hardness, and (3) erosion ductility (). For a metal, its dynamic hardness may be found by measuring the indentation generated by an impacting sphere travelling with known speed in a given direction and is thus suited to independent experimental analysis. Erosion ductility, on the other hand, must be derived, together with the ratio .
Equation (3) is the proposed expression derived by Hutchings [62].
where is the material density, is the material hardness, is particles density, is the particle velocity and /εc2 = 0.7.
Sundararajan and Shewmon [63] developed an expression by considering the parameters then believed to affect the erosion rate; particle size, density, and impact velocity, and the properties of the target material. They obtained a general expression for the erosion rate, Equation (4):
where represent the velocity of the particle. is the particles density, is the specific heat, is the melting temperature, and is the targeted material hardness.
2.2. Brittle SPE Mechanism
The maximum erosion of brittle materials, unlike ductile materials, typically occurs for impact angles near 90° [64]. Brittle material erosion occurs when the target surface cracks, and thus resulting in material removal as multiple cracks intersect [65]. The removal of material from brittle materials by SPE is a complex process dominated by brittle fracture [66]. The surface crack types and sizes are influenced by the particle velocity, mass, shape, and target material hardness along with its toughness [67,68]. Figure 11 shows an illustration of cracks produced by a solid particle impacting on a brittle surface. We see that the resulting cracks are formed in the lateral direction, and these are the cause of most of the mass removed from the surface, and in the radial direction.
Furthermore, Bousser et al. [31] observed that deformations caused by impacting solid particles were similar to the indentation cracking of brittle materials subject to pressure from the sharp tip of a pyramid, as shown in Figure 12a–e. At impact, the high pressure generated deforms the surface as a plastic zone which continues to grow until the particle reaches maximum depth of permeation. Further, brittle surfaces show not only plastic and elastic deformation but also cracking (Hertzian, lateral, and radial). These deformations can take place according to applied load, indenter geometry and properties of the material. Therefore, the occurrence of transitions are governed by the operational conditions, including size and shape of the impacting particles [31]. See Figure 13 for some of the common impact deformation patterns noticed in the brittle material plastic deformation regimes.
El Tobgy et al. [66] developed a model and then used it to study material losses in terms of the sum of plastic deformation of the material lost () along with the assumption that the material elastic limit is overridden through the impact. Equation (5) shows the material lost:
where M is the total mass, is the particle velocity, α is the impact angle, is the deformation factor, and is the collision velocity that reaches the material to the elastic limit. Moreover, can be determined by using Equation (7).
where is the limit of elastic load, is the particle density, and are the Poisson’s ratios, and are the elasticity moduli of the particle and target material, respectively.
Sheldon and Finnie [71,72] pioneered the modelling of the erosion of brittle materials for two different types of particles. They approached the problem from the perspective that for brittle materials, brittle fracture was the most common cause of the erosion, due to crack propagation and intersection. The following equations represent brittle material erosion:
where Vol is the material loss volume per impacting particles mass, and are an amount involving material constants. r is the particle radius, = , = , and = represent the functions of the Weibull fracture strength distribution parameters.
Amaral et al. [73] demonstrated that the strength of a body affected survival prospect of products for individual volume factors. When an element is fractured, the strength of the remaining elements is defined by the strength of the following frail element. A Weibull analysis was adopted for the chain of surviving elements using a comparative simple power-law stress function [74]. Vardar and Finnie [75] explained that by using the Weibull distribution, the failure possibility () of material can be modelled using Equations (10) and (11):
As the integral is evaluated over the region stressed in tension with dv corresponding to a volume element in polycrystalline materials or to a surface area element in the case of glass. Where σ is the stress applied on substance, is the material volume, is the scale parameter, is the location parameter, and is the shape parameter
2.3. Ductile-Brittle Transition Mechanism
Erosion of brittle materials leads to material elimination by crack formation, whereas ductile erosion leads to material deformation by cutting [76]. Between the two mechanisms, the impact angle and the particle velocity are primary considerations leading to significant variance in the erosion process. Sheldon and Finnie [71] proposed that when solid particles decrease in speed or size, the particles will cause the targeted surface to deform plastically but will not initiate cracking process at this stage. This alteration in erosion manner is known as the DBT. This transition frequently demonstrates a change in the fracture amount or type, which results in influencing the erosion mechanism rate [77]. Liu et al. [78] demonstrate that the erosion begins at the bottom of the cut, at zero, and subsequently gradually increases with time. Therefore, causing the target material surface, which was smooth at the beginning, to roughen in the DBT region as the cracks propagating into the target material surface. Furthermore, their experimental outcome has shown three zones on the target material surface, namely the brittle, ductile and DBT cutting zones. The existence of these zones strongly suggests a gradual change in cutting mode from ductile to brittle with increase in depth. Figure 14 is a schematic of the DBT phases.
Wensik and El-wenspoek [77] studied the erosion of three brittle materials, namely, soda-lime glass, Pyrex glass, and single crystalline silicon. The solid particles were alumina powder, with diameters in the range of 3–29.2 µm and impingement velocities from 200 down to 75 m/s. The researchers confirmed that crack formation increased significantly with increase in impact speed and resolved that the kinetic energy (KE) of the impacting particles was the main feature controlling erosion rate. They also found that at sufficiently high kinetic energies, neither shape nor hardness of the impacting particles affected the erosion process significantly.
Finnie [79] has demonstrated that the transition of ductile-to-brittle erosion has usually been considered by analysing Hertzian models in terms of lateral fracture and fracture related to angular and spherical particles with standard indentation. In practical conditions, at shallow angles of impact, the particles attack the target surface and move for a limited distance along the surface. The cuts formed on the surface of the target usually have a width smaller than their length. Moving the particles along the target surface alternatively in the vertical direction led to patterned permanent deformation on the surface. Therefore, the ductile-brittle transition is more likely to be noticeable similarly to the mechanism of scribing lateral cracking in this case. Equation (12) shows the expression for a spherical particle attack on a semi-infinite body:
where d represent the particle size, D is the material properties constant, is the velocity of particles, and is the threshold load for cracking.
According to Grant and Tabakoff [80], in turbomachinery, the paths of the solid particles, including the many impingements that take place, need to be traced through the flow field. If this were possible, and the co-ordinates of the impinging particles relative to the high-speed rotors known, then erosion could be predicted, and even controlled. As stated above, particles impacting on high speed rotors will rebound with enhanced velocity, increasing their capacity for further erosion. In addition, as a result of these impacts the solid particles will centrifuge outwards towards the blade tips, to produce a local high concentration of particles that could severely damage a vulnerable region of the blade.
Most, if not all, materials no matter how brittle will exhibit a degree of ductile behaviour, the main difference lies in the range of plasticity or ductility variation between each material type [81]. Accordingly, Laguna-Camacho et al. [64] and Biswas et al. [54] have concluded that:
- For brittle materials, e.g., ceramics, the maximum rate of erosion rate typically takes place at an incidence angle of 90°;
- For ductile materials, e.g., metals, the maximum rate of erosion typically takes place at angles of impact between 20° and 30°.
Figure 15 illustrates the typical erosion behaviour of brittle and ductile materials at diverse angles of impact. From the figure, it is clear that for both materials the erosion rate is strongly related to the angle of incidence. It is noted that at high angles of incidence, brittle materials show fracture, while ductile materials exhibit plastic deformation. With increase in impact velocity, damage to the surface increases with increase in KE of the particle. The previous observations can deliver useful guidance towards the selection of the fabricated materials of the blades, and hence can be used to minimise the SPE mechanism [82]. Manufacturers can use this knowledge to identify how variations in these circumstances will affect the erosion rate and mechanism that results in SPE on the blades surface.
3. SPE Effective Parameters
The influence of SPE on the operation of GTE has been the subject of many studies as this wear phenomenon involves several processes and parameters that need to be analysed. An understanding of the SPE phenomena is required to increase the mechanical component’s lifetime when operating within erosive climates. Thus, recognising the critical parameters of erosion is fundamental to the improvement of any SPE resistance approaches. There are many studies that illustrate the development of erosion wear in terms of equations, models, and variables. For example, in literature, there are around 300 equations and approximately 600 variables documented for erosion wear [83,84]. From the available publications one can conclude that the surface wear caused by SPE is affected by numerous factors including particle shape, size and velocity, and material properties [85,86]. Neilson and Gilchrist [87] have confirmed that, in terms of solid particles, the parameters that most effect the SPE are the particle properties and impingement conditions. The first is concerned with the solid particles, material type, size, and shape, while the second considers velocity and angle of incidence of the particle. Examples of different particle materials, shapes, and sizes that were used in studying SPE are shown in Figure 16.
Chen and Li [93] have demonstrated an SPE model that considered the material removal process in a realistic mode, where the model showed that the rate of erosion is greatly affected by the shape of the impacting particles. The researchers simulated single impact erosion for a range of dissimilar particle shapes (triangular, square, and circular). The simulation results demonstrated that higher erosion rates were obtained from particles of triangular shape, followed by those of circular and square shapes. In another study, Winter and Hutchings [94] investigated the SPE that results from steel particles, of various shapes, on a substrate that is made of mild steel. The study found that the particles of spherical shape often causes ploughing deformation, while those having sharp angular shapes usually resulted in cutting deformation. Levy and Chik [95] investigated erosion behaviour AISI 1020 steel using spherical and angular shaped steel particles to improve understanding of how the shape of the particles affected erosion behaviour. They reported that rate of erosion for the rounded particles was only one-quarter that generated by the angular steel particles. This was explained as the particles of angular shape concentrating the KE more efficiently, and hence giving a higher erosion rate. Particle size was the most significant influence on erosion of target material though frequency of impact must be allowed for [96,97].
Hamed and Fowler [96] used a technique where the prediction model combined the computations method to study the particle trajectory and experimental data to study the particles and target material characteristics. According to the results, erosion material distribution is highly influenced by the size of the particle. Large particles (i.e., those > 100 µm) increase the SPE of a turbomachine blade. However, as the particle size decreases, the erosion process becomes less damaging [71]. This is because the small particles quickly adjust to the surrounding gas velocity after each impact, after which their proceeding impacts result in the most significant erosion damage [96,98]. However, the velocities of large particles are reduced after each impact stage. Particle velocity and angle of impact are both important because, as mentioned earlier, they determine the impingement condition. A particle of high impact velocity would increase SPE [99] because the relation between rate of erosion and particle velocity can be found from expression [100]:
where is the particle velocity, km is constant of the material, n is the test conditions functions values between 2 to 3.5 for ductile materials [88] and 2 to 6.5 for the brittle materials [101].
An experimental study [102] has confirmed that the erosion rate for brittle materials increases as the angle of impact increases, see Figure 15, and this leads to significant surface layer deformation. In contrast, at small angles of impact, particle impact causes scratches to the surface, resulting in less surface deformation [102]. Oka et al. [103] have derived an expression relating angle of impact and erosion rate, E, both brittle and ductile materials, see Equation (14):
where the erosion rate is E, the impact angle is α, the A, B, C, D, and n2 are constants and exponents, which are affected by impact conditions.
4. Solid Particle Erosion Modelling
SPE impacts the base material of the compressor blade and weakens its structure, leading to increased roughness of the blade surface, and increases in cycle losses [104]. There is a need for particle flows to be modelled mathematically to be able to predict erosion rates and improve the design efficiency of turbomachinery components. However, investigation of the erosion rate using mathematical models remains very challenging because of the substantial number of inter-related and sometimes unknown parameters that need to be included in such models [105]. One example of such models is provided by Hamad et al. [46] who focused on examining the performance of a compressor subjected to SPE. The researchers aimed at studying the operation of an axial compressor by simulating a single stage fitted with the National Advisory Committee for Aeronautics (NACA) 65 airfoils that operated under the following conditions:
- Spool speed = 9170 rpm;
- Pressure ratio = 1.252;
- Mass flow = 9.475 kg/s;
- Blade tip speed = 243.9 m/s;
The researchers used the experimental results obtained from a single-stage compressor which was erosion free to test the model. The model predicted a decrease of 3–4% in the compressor’s adiabatic efficiency due to increased tip clearance and roughness of the blade’s surface. The following Equation (15) correlation was used for the drag on a rough plate, which models the surface roughness effects on compressor blade losses:
where Cd is drag coefficient, is equivalent sand grain roughness, and is blade chord.
Equation (16) represents the effect of surface roughness on loss coefficient, , and is used to assess profile loss contribution:
where is blade solidity, is blade angle, and is mean angle of the compressor.
It has been shown by Finnie [30,53] that surface wear as a result of SPE will vary with particle speed and direction, and the response of the surface material when the particles impact on it. These factors are inter-related because an erosion roughened surface could enhance the level of turbulence of the fluid and so increase the rate at which material is removed. How erosion rates depends on particle velocity and angle of incidence are well known for ductile materials, so maximum erosion is predictable. This is similar for brittle materials, though the latter is very different from ductile materials. Researchers have demonstrated that for low angles, the impacting particle strikes the surface, removes a small portion of the surface, and then rebounds. Removal of surface material ceases immediately as the particle leaves the surface. As the angle of incidence increases, the movement of the particle in the horizontal direction can stop before it rebounds from the surface. Removal of surface material stops when the horizontal velocity is equal to zero (dxt/dt = 0). Integration over the time of cutting gives Equation (17) for the erosion rate, E, detached by one abrasive grain of mass, m, and velocity, . Equation (17) predicts the same loss of mass when α = ½tan−1 (K/6), and the greatest erosion takes place at a somewhat smaller angle, α = ½tan−1 (K/3). The former expression corresponds to those angles of incidence for which the abrasive particle rebounds whilst still cutting. The latter expression corresponds to greater angles of impact when cutting ceases because the horizontal particle movement stops.
Bitter [102,106] has shown that in fluid-bed systems, the lines transporting solids can experience serious erosion, comprising two separate wear mechanisms. The one is due to cutting by freely-flowing particles, the other is due to recurring deformations caused by impacts and the breaking off of material from the surface. In reality, both kinds of wear take place at the same time. It is possible to derive expressions for the erosion in terms of the particle’s mass, density, shape, velocity, and angle of incidence, and the physical characteristics of the surface being eroded. Well-known and widely-used methods of reducing erosion at bends in lines transporting solids or solids in liquids are to have a large radius of curvature, and use a hard material for the bend. The conditions for the flow should be that the flow velocity component perpendicular to the pipe surface should have a value less than, or close to, the value at which it is known no erosion occurs. For example, a cyclone with a tangential inlet of rectangular cross-section can have a narrow inlet to minimise the angle of incidence, α, in the cyclone. A hard facing (e.g., a hard-wearing concrete) can considerably reduce erosion. However, for large angles of impact the dominant wear mechanism is repetitive surface distortions, in which case inhibition of erosion is not easy. Application of hard materials is suitable for low velocity particles, but for most conventional construction materials velocity component normal to surface () is less than about 10 m/s. Soft rubber is an exception, as because of its lower elastic modulus it has a larger value of . Equations (18) presents the aforementioned modified model, which shows better results at higher impact angles.
Neilson and Gilchrist [87] have shown experimentally that both forms of erosion can, and will, act concurrently. With glass, considered a hard-brittle material, the principal process is surface cracking followed by inter-connection of the cracks and removal of surface material. The most likely explanation of the process seems to be the existence of forces acting perpendicular to the surface. With aluminium, a ductile material, we see both wear due to repeated deformation (work hardening, followed by surface cracking) which explains the erosion occurring at typical angles of incidence, and we also see cutting wear as described by Finnie [30,53]. Cutting wear is produced by forces working in the surface of the material. Deformation refers to wear resulting from forces acting perpendicular to the surface. Finnie [30,53] and Bitter [102,106] have confirmed experimentally and analytically that any expression for erosion damage should include: (1) the KE of particles whose line of action is perpendicular to the surface because this is absorbed into the surface and causes wear by deformation, (2) some hard materials, when subject to deformation wear, show a limit to the normal velocity component below which there is no erosion, however the particle’s shape may determine this value, (3) cutting wear is related to the component of the particle’s KE acting parallel to the surface, (4) for small angles of impact, the particles grazing the surface do not rebound, and all of the KE parallel to the surface contributes to wear by cutting, (5) when the angles of impact are large, the particles tend to experience a relatively large coefficient to restitution and are likely to rebound, with residual KE. Assuming that cutting wear consumes a certain amount of KE to release unit mass of the surface, then with a corresponding deformation factor, , we obtain Equation (19).
Finnie [60] examined the idealised behaviour of a particle in two dimensions, though his analysis could be extended to particles of arbitrary size and shape. The surface volume that this particle displaced was assumed to be, to a first order, the volume swept by the particle tip during the time when cutting occurred. Thus, it is necessary to establish the trajectory of the tip of the particle and period of time for which cutting took place. To simplify the analysis, it was assumed: (1) the particle had zero rotation on impact, did not fracture and was rigid, (2) the volume displaced was equal to that which the particle removed, (3) during cutting the particle underwent minimal rotation, (4) throughout the cutting process the particle and the deformed material remained geodetically similar, which means that the ratio of vertical to horizontal forces on the particle could be assumed constant, (5) as large values of strain were attained from the start of cutting, the plastic flow pressure between metal and particle could be presumed unvarying, and finally, (6) from practical observations of metal cutting, the contact area between metal surface and impacting particle could be assumes to be approximately twice the depth of cut, giving Equation (20).
Sheldon and Kanhere [107] studied the erosion of aluminium surfaces using single large particles. The action by which material was removed from the surfaces by particles of size greater than 100 µm, was demonstrated to be very similar to loss due to multiple smaller particle impacts. Using photos of single-particle impacts, a model was developed based on the material removal process as a flowing motion around the impacting particle; not, as previously assumed, by chip cutting. Inspection of the craters generated by single particle impacts suggested that material removal was by displacement resulting from sufficient strain to fracture the material in a manner reminiscent of single point cutting. To obtain a simulation of the procedure, an equation representing particle penetration according to indentation hardness theory was developed. The model is demonstrated as valid for comparatively low impact speeds, even though it did not include consideration of either the inertia or strain hardening of the surface subject to the impacts. The researchers proposed Equation (21) as their erosion model.
Tilly [108] showed ductile materials can be subject to erosion in two phases: the impact of the particle and resulting dent in the surface, during which a fragment of the surface may be detached; or the particle fragments, and these fragments are projected radially outwards to create further damage. These processes were modelled and the model was tested then presented, as illustrated in Equation (22). Particle velocity and size were included in the model [22]. The resulting numerical estimates were in good agreement with practical observations. The effects of particle velocity and size and angle of impact can be satisfactorily modelled by bearing in mind the relative effects of the two phases for different conditions.
Jennings et al. [109] used a scanning electron microscope to investigate erosion of ductile materials by dust particles, and develop a predictive model using dimensional analysis. The model was based on target melting, an established erosion process. The model was validated using erosion testing of steel, aluminium, copper, and titanium alloys as target materials, with the erosive dusts comprised of hard particles, both spherical and angular. Maximum particle speeds were 250 and 130 m/s, respectively. Jennings et al. used their own judgement based on experience to determine: (1) the physical properties of the targets (including, density, latent heat of fusion, melting point and thermal conductivity), (2) the roundness of the dust (erosive agent), (3) the KE transferred to target from the impacting particles. Dimensional analysis was used to assess the form and nature of the relationship between the variables. Equation (23) is the resulting erosion model.
Hutchings et al. [110] have shown experimentally that irregular particles striking a surface can be modelled as spherical, when rounded parts of the particle surface strike the surface or when a leading edge strikes the surface at an angle of incidence of less than about 15°. A study by the researchers of 9.5 mm diameter steel ball bearings striking mild steel showed that the surface material was displaced in the form of an elongated impact crater with a lip at the end, see Figure 9. However, some material was ejected from the crater, most of which spread over an area adjacent to the crater, but some was ejected to greater distances. Given specific conditions the lips formed on impact are detached, becoming the most significant material removal mechanism. The average coefficient of friction during impact was determined by video recording the change in rotation of the impacting steel sphere. Hutchings et al. proposed a model which accurately predicted crater volumes, rebound energies and angles, if angle of impact and impact velocity were known. Model 24 simulates the material removed when the angle of impact was 30°. Equation (24) demonstrates the proposed erosion model by the researchers.
Evans et al. [70] investigated the damage generated above the fracture threshold level by hard projectiles impacting on brittle materials and considered Equation (25) as the recommended erosion model. The study included a thorough scrutiny of both the radial fractures developed immediately after impact, and the lateral fractures formed later. Fracture mechanics and dynamic stress analysis were used to evaluate the damage and demonstrate how the extent of radial fracturing depended primarily on how tough the target material was, and then on the mass and speed of the impacting object. The penetration of the lateral fractures depended not only on the size, velocity, and density of the projectile but also the hardness of the target surface. The categorisation of fractures due to impacts has been a factor in assessing erosion and strength degradation in fracture-controlled regimes. It was reported that comparison of predicted behaviour with published data (for the relevant erosion regime) was encouraging, and suggests that further study, along these lines, could contribute to a fuller explanation of erosion and degradation phenomena.
Tabakoff et al. [111] studied erosion in two parts. Knowing the relevant parameters, including mass, speed, and impact angle of particles striking a given surface, the material removed from the surface was determined. These have invariably been considered independent events, but that assumption may not be correct for the very complicated fluid flows that exist within rotating machines. The particle’s impact angle on the surface is a very influential parameter determining the degree of erosion of surfaces. It was found by Tabakoff et al. [111] that for the range of velocities they used, the erosion (defined as the ratio of eroded mass to the mass of abrasive material impacting on the surface), reached a maximum value when the angle of impact was about 70°. The erosion decreases with impact angle and is close to zero at 0°. Relatively, erosion at any given angle of impact appears to be largely independent of particle speed; however, the definition of the point of maximum erosion becomes much more explicit with increasing velocity, as shown in Equation (26).
Sundararajan [112] has presented Equation (27) as their model for SPE which is a development of a previous model used for erosion under normal impact, and has been shown to be suitable for all impact angles. The model assumes that the impacting particle generates localised plastic flow beneath it, forming a lip, and thus causing the erosion. It was shown that the model could incorporate the experimentally determined observations, i.e., material surface properties, and particle shape, speed, and angle of impact. The researcher listed the key assumptions behind the model as: (1) lip extrusion and formation, and its subsequent fracture rather than general surface fracturing controls the erosion rate, (2) localised plastic deformation is what leads to lip formation, (3) the speed of the process and relatively small area of impact means the process of surface deformation can be considered adiabatic, (4) a relatively simple constitutive equation as presented in model 27 can be used to model the erosion as plastic deformation caused by very high strain rates.
Chen et al. [83] showed that the processes suggested by Sundararajan [112] did not constitute a general material removal mechanism. It is possible to estimate erosion ductility by considering erosion mechanisms, including tensile residual stresses and the ratio of crater volume to that of the material removed. This model can assess how the erosion rate is affected by temperature increase and strain rate. Predictions based on this model were compared with experimentally observed erosion rates and found to be acceptably accurate. Chen et al. also observed that: (1) using finite differences to numerically simulate lip formation it was found that mechanical and geometric parameters are of greater importance than thermal when ascertaining the extent of lip formation; (2) the ratio of crater volume to that of the material removed can be found if it is accepted that the eroded material is fully detached, and it is assumed that residual tensile stresses are the cause of the removal of particles from the crater; (3) the erosion ductility can be estimated by assuming erosion is due mainly to tensile residual stresses; and (4) Equation 28 can be used to assess how increase in temperature and strain rate influence erosion.
Nsoesiea et al. [113] have analytically modelled the erosion of Stellite alloys subject to impact by solid particles. Five Stellite alloys were chosen to be representative of those used where erosion resistance was important. The alloys were tested experimentally with speeds of 98 and 84 m/s at impact, and at angles of incidence of 90° and 30°. The main modification over previous work was to include two angles of impact which was expected to improve the accuracy of prediction of rate of erosion and it was claimed to accurately estimate the erosion rate for those alloys with chemical components similar to the five alloys investigated. The model fitted to the experimental data was generally useful, subject to the proviso that only two impact velocities were used. However, it was found that for the Stellite alloys investigated there existed a critical angle of impact at around 30°, at which the erosion rate changed and that meant the prediction model developed was limited when the angle of impact was less than 30°. Nsoesiea et al. [113] proposed model is shown in Equation (29), where they considered this model to be the most suited for the comparison of erosion resistances between Stellite alloys.
Thirteen erosion models (Equations (17) to (29)) were examined, and these are listed in Table 3. All models were adjusted using appropriate forms and common symbols. Table 4 presents the 46 parameters contained in the models. No single model contains all possible variables, in fact the average number of parameters per model is six. Some parameters that would be considered likely to be found in the models, Poisson and critical Poisson coefficients appear in no models. Each of the models was produced as the result of a specific, individual approach with a particular aim in view. The models range from those that contain a single parameter to the most complex models which contain ten parameters, such as particle size, particle density, flow stress, heat capacity, angle of impact, etc. Comparison of the selected models for erosion rate (E) within their limitations show them to be reasonable and rational.
5. SPE Protection Coatings
Coating technology plays a significant role in industries ranging from under-sea to space applications [115,116,117,118,119,120]. It is mainly used to enhance the performance and reliability of components through external deposited thin layer/s on the surface of the material whose characteristics need to be improved. In GTEs, metallic and ceramic coatings, or a combination of both, are usually used to enhance/maintain the system efficiency, thus minimising the maintenance costs [121,122,123,124,125]. It is now generally accepted in the literature that by using coatings in mechanical components, for instance, blades and vanes, the cycle reliability and performance can be protected against the aggressive degradation phenomena, which can cause component failure at an early stage [122,126]. Protection coating is a highly cost-effective technique that helps to increase GTE reliability, availability, and performance. The benefits of coatings may include (1) up to 1% gas turbine power output ageing recovery (2), up to 0.3% of the gas turbine efficiency ageing recovery, (3) minimisation of erosion and wear, and (4) surface roughness reduction [127]. Rajendran [128] demonstrated that there are particular requirements for the surface design properties of the selected substrate material. In order to reach the designer’s needs, the coating is used on bulk materials to enhance component mechanical strength. The coating provides the necessary protection for components that operate in harsh environments. There is not any one coating material that is resistant against all hostile environments, so the coating material and the application process used are chosen specifically for a given material surface and a particular operating environment. Figure 17 shows an example of coated and uncoated compressor blades, and Table 5 lists some of the materials commonly used to form the deposited films on compressor blades.
Coating processes are usually classified as one of the following three groups [137,138,139,140,141,142,143,144,145,146,147,148,149,150].
- Vapour phase: including physical and chemical vapour deposition (PVD and CVD) methods. With PVD, the material to be used for the coating is evaporated from a source (either solid or liquid) with an atomic composition that travels and condenses on the substrate exposed surface under vacuum or gaseous environments. However, the CVD is a combination process where the chemical component is introduced in the vapour phase on a heated surface to form a layer of solid deposit.
- Liquid phase or direct liquid coating technique: this approach contains any process of precursor-containing liquid deposition on an underlying layer or surface, after which there as a suitable thermal or/and chemical treatment to produce the required film layer.
- Solid phase: this process consists of solid-state deposition and unification of high-speed particles of powder entrained in a gas jet onto the substrate surface. These particles of powder experience a plastic deformation when they impact the surface and in this way adheres to the surface while simultaneously undergoing inter-particle bonding.
Table 6 shows the typical surface coating protection applications used for GTE components (Ex: compressor, combustion chamber, and turbine), while Table 7 presents the advantages and limitations of various coating techniques.
PVD techniques have enabled the achievement of highly resistant erosion coatings that protect the GTE compressor components and ensure long term reliability and availability, while reducing maintenance and operating costs [132,154,155,156]. The coatings obtained with PVD techniques have shown considerable erosion resistance when compared to other coating techniques due to the exceptional homogeneous deposition and the elimination of additional treatment on the thickness and surface smoothing, necessary to increase the coating’s wear resistance [157]. The three-key state-of-the-art PVD coating technologies for GTE compressor blades material are illustrated in Figure 18. See Table 8 for a description of their advantages and limitations.
Most commonly, the PVD technique is used for the enhancement of the material’s mechanical and functional properties, where during the coating process heat treatment, the possibility of losing the acquired properties is very low compared to the CVD process [171,172,173]. Usually, the PVD process is carried out at temperatures lower than 500 °C, and therefore, it is an ideal technique for coating materials without changes in their microstructures. Moreover, previous studies that have investigated SPE did reveal that the optimum coating process within the PVD technology is the sputtering deposition technique, as this has been shown by many authors to provide an excellent erosion resistance results [174,175,176].
On the other hand, any novel coating design procedure would involve a logical selection of the source material, alongside with the suitable fabrication process, so that the desired microstructures of the component/s surface can be achieved and produced [154,177,178]. Such a task is seen as an interesting area of scientific exploration for many researchers. For example, Zhaoa et al. [179] explained that, as the material selection process commences with the design requirement specifications, the process of selection can be completed through experiments of trial-and-error, or by an analysis collection of rationalised scientific studies. Material databases can also be used as a guide to developing specific patterns of required material properties. The selection of coating materials contains three main elements in the following sequence: (1) collection of material properties; (2) examination of these properties; and (3) selection of materials based on the coating requirements. According to Chauhan and Vaish [180], multi-criteria decision-making algorithm (MCDM) is an additional method of coating material selection that can assist in the selection between more than one alternative element based on the arrangement of several properties. The process includes formulating the performance guides or featured data which are derived from the functional links that occur between the different characteristics. Satisfactorily combining the necessary characteristics would produce a suitable material for the given application of low cost and weight, and high strength. TOPSIS ranks the materials considered suitable for a given application based on their properties, as compared to an ideal solution. TOPSIS evaluates a so-called Euclidean distance that separates the possible materials solution from the ideal, and the worst case, respectively. TOPSIS attempts to minimise the separation from the ideal case and maximise the separation from the worst case [180]. Moreover, the Young’s modulus of elasticity (E) of a material is an important consideration when considering wear resistance, and needs to be included for consideration with material properties such as degree of ductility, when planning the anti-corrosion coating [181]. Chauhan and Vaish have published a list of commonly used coating materials found in the literature [180] ranked according to TOPSIS. Figure 19 illustrates the E, H, α, and TOPSIS of the top ten ranked coating materials, as concluded by previous authors.
Hassania et al. [182] showed that the coating materials which showcase both high and low E values deliver the lowest volume removal (Vol) in terms of degradation. To study how the the/E ratio affects SPE, finite element analysis was used to investigate TiN coatings, of 8 µm thickness, through a wide choice of /E and 3/E2 ratios. The variation of Vol for the diverse coatings under particle impact, of Al2O3 with a diameter of 100 µm, was afterwards investigated. They have found that the erosion rate has reduced when the values of /E and 3/E2 increases. Hence, to obtain a high SPE resistance coating, the previous ratios should be raised. The ratios of/E and 3/E2 that provided the best erosion resistance combination were 0.15 Gpa and 0.6 Gpa, respectively. Tabakoff [154] observed erosion on components with TiN coating deposited on the substrate using PVD technology. The coating material that he used is known to have excellent adhesion, high-temperature resistance, excellent erosion resistance, the capability to withstand high-temperatures, high tolerances, high melting point (i.e., 2930 °C), and low density (i.e., 5.22 g/cm3) [183]. Furthermore, the tested substrates used by the researcher were made of titanium of 26 mm and 13 mm in length and width, respectively, whereas the TiN coating material used was of 15 µm in thickness. One substrate was coated using the PVD technique, and the other substrate was left uncoated (i.e., reference sample). The researchers ran their experiment under room temperature with impact angle of 20°. Arizona and silica sands in the range of 0.1–100, and 0.1–500 µm, respectively, were used as test particles. Furthermore, their velocities were between 91.5 and 152.5 m/s. Their results have shown that, after 15 min of continues impacts, the coated surface had lost 1.4 mg of material, whereas the uncoated sample had lost 65 mg of material throughout the experiment duration. Thus, it can be concluded that the deposited layer had contributed to reducing the SPE phenomenon, and therefore is an advantage element that can be used on components such as compressor stages, which are subject to high levels of degradation, to improve their life duration. Eichner et al. [126] used two different thicknesses of chromium aluminium carbide (Cr2AlC) coatings (7 and 20 µm) that were deposited via sputtering technique. Sand-blast erosion was the technique used for the tests. A powder metallurgical fabricated Cr-Al-C composite target (50 × 8.8 × 1.0 cm) with a Cr:Al:C composition of 2:1:1 was used. The substrates used were made of inconel 718 (IN718), which were heat treated at 720°C for 8 h, then cooled at a rate of 50 °C/h, to 620 °C, for 8 h. Following the precipitation hardening, the IN718 substrates reached a hardness of 473 ± 7 HV30, after which they were adjusted vertically in the test rig to give a 90° angle of impact. In addition, the particle’s flux was 2 g/min, length, and diameter of the of the nozzle were 50 mm and 2 mm, respectively. For all tests, the separation of nozzle and sample was kept as 10 mm. During the erosion test, the coated material showed a non-linear material loss, however the mass change of the uncoated substrate was seen to be linear. It was observed that the erosion of the coated material was formed through 4 deformation phases, which were plastic deformation, cracking, scratch growth, and local coating push-up. Initially, particle impact caused the coating material to be partially remove, but after a certain time which was a function of coating thickness, the deposited layer was mostly removed then complex erosion took place between substratum, coating and incident particles. The 7 μm thickness coating sample was demonstrated to give an erosion rate that was as much as ten times lower than the unprotected surface. It was concluded that it added significant protection to the uncoated substratum against impacting particles.
6. Discussion and Future Directions
It was shown previously how SPE causes surfaces degradation, which can therefore cause a reduction in the overall system efficiency as a result of the defect caused to the devices parts. Furthermore, the mechanism in which the SPE effect develops or extends on a particular surface was seen to depend mainly on the impacted surface material, particles properties, and impingement conditions. One of the approaches that was demonstrated to reduce SPE mechanism is surface protective coatings, where selecting the appropriate film material, thickness, and fabrication approach are significantly crucial for enhancing the lifespan of SPE exposed equipment. Nevertheless, there are still some issues that needs to be consider for further advancement in the field, which are listed as following:
- There is still a shortage in data on SPE for newly developed advanced composite materials, such as those containing graphene, carbon nanotubes, and other nano-reinforcements of carbon base.
- Simulation studies on SPE effects on composites are still not sufficient enough and need to be further explored for quantitative purposes.
- Development of new generation of thin layer coatings that are durable, of negligible weight effect, cost effective, and can easily be applied is of great importance and remains one of the main challenges to researchers.
- Producing thin films with multifunctional properties, such as anti-erosion, corrosion, de-icing, and abrasion, would be highly attractive to the GTE industry and many other sectors.
- Advancing the coatings fabrication techniques and/or standardizing existing methods in terms of deposition rate, temperature, and surrounding pressure conditions is of high importance.
- Investigating the long-life degradation of the deposited films also needs to be covered, as the majority of the available studies focuses on the short-term behaviour of the coating layer. Therefore, they do not provide the full image to the end-user.
The earlier mentioned points are essential for controlling the SPE phenomena on surfaces and the possible commercialization of future coating materials.
7. Conclusions
This paper has reviewed the literature available in the public domain on SPE occurring when GTEs function in harsh and/or erosive conditions. The important SPE mechanisms have been described and reviewed, with an emphasis on physical phenomena, with the aim of improving control of particle motion to minimise resulting wear. Many examples are reported in the literature, some have been discussed here, particularly those due to materials-related causes in terms of ductile and brittle materials. Many key elements of the erosion process have, thus far, proved too complex to model successfully, while obtaining direct, accurate measurements remains challenging. Such processes include particle properties and the impingement conditions. Inventive theoretical and experimental approaches are very much needed. At the moment, the prediction of wear and erosion due to particle-surface impact depends primarily on empirical formulas derived by materials scientists, usually based on accelerated experiments under closely specified conditions for specific materials. Not reviewed in this paper are the recent significant developments regarding the theories of materials that hold the potential to develop more widely applicable models of erosion. The use of surface coatings can be an effective means of improving the endurance of a surface when subject to a hostile environment. Selection of an appropriate coating and method of application can prolong the active life of a substrate while reducing maintenance costs. PVD coating can be applied to an extensive array of surfaces and materials, and after application produce a surface with very low roughness. Importantly, PVD coatings have been demonstrated to possess good to excellent erosion resistance when applied to compressor blades. PVD includes a range of deposition methods including those that can produce ultra-thin covering layers. Such thin coatings, when used in combination with the close tolerances possible today, ensure that component parts—for all practical purposes—retain their original dimensions, form, and fit after coating, so there is no requirement for re-machining.
Author Contributions
J.A. and J.A.T. conducted the Introduction Section. J.A. and A.A. carried out the Solid Particle Erosion Mechanism Section. J.A., N.A. and J.A.T. conducted the SPE Effective Parameters Section. J.A.T., and J.A. worked on the Solid Particle Erosion Modelling Section. N.A. and J.A. conducted the SPE Protection Coating Section. J.A., A.A., and J.A.T. have worked on the Discussion and Future Directions Section along with the Conclusion Section. All authors have read and agreed to the published version of the manuscript.
Funding
This research received no external funding.
Acknowledgments
The authors of this article are grateful and acknowledge the help provided by their institutes.
Conflicts of Interest
The authors declare no conflicts of interest.
Nomenclature
| A, B, C, D, , n2 | constants and exponents, which are affected by impact conditions |
| Cd | drag coefficient |
| shifting coefficient | |
| shifting exponent | |
| specific heat (J/kg °C) | |
| flow stress temperature constant | |
| Cr | heat capacity of the target (J/K) |
| blade chord (m) | |
| particles influence in an idealised manner | |
| C1 | constant |
| D | constant of material properties |
| particles density (kg/m3) | |
| material density (kg/m3) | |
| d | particle diameter (µm) |
| minimum particle diameter for erosion take place (µm) | |
| D1,2,3… | fracture constants |
| E | erosion rate (g/min) |
| young’s modulus of elasticity (N/m2) | |
| , | elastic modulus (Pa) |
| loss coefficient | |
| er | restitution coefficient |
| et | tangential restitution ratio |
| amount of solid particles cutting the target surface (particles concentration) (wt. %) | |
| threshold load for cracking (MPa (m) | |
| fragmentation for test condition | |
| Evc1,2 | volume of material removed by cutting mechanism (mm3/min) |
| Evp | volume of material removed by deformation mechanism (mm3/min) |
| F(t) | constant of several impacts |
| function of impingement angle | |
| exponents are prescribed functions of m, the flaw parameter of the Weibull fracture strength distribution | |
| G | target gram molecular weight (g/mol) |
| gp | particle gyration radius (µm) |
| Hp | hardness of particle (Pa) |
| material hardness (Pa) | |
| Hv | Vickers hardness of target (kg/mm2) |
| I | the moment of inertia of particle about its center of gravity |
| constant force component ratio of particle | |
| , | quality involving material constants |
| k | constant |
| Kc | fracture toughness (MPa M1/2) |
| km | material constant |
| equivalent sand grain roughness (µm) | |
| KT | impacting particle kinetic energy (J) |
| empirical constant | |
| velocity component normal to the surface below which no erosion takes place in certain hard materials (m/s) | |
| M | total mass of particle (Kg) |
| mass of particle (Kg) | |
| mass of an individual particle (Kg) | |
| constant of shape parameter in range of 9.5 to 12.7 | |
| n | test conditions functions values |
| normal component | |
| strain harding exponent | |
| P | pressure (Pa) |
| mean stress (Pa) | |
| R | particle roundness (µm) |
| r | particle radius (µm) |
| material volume (m3) | |
| collision velocity that reaches the material to the elastic limit (m/s) | |
| Vol | material loss volume per impacting particles mass (mg/g) |
| Vr | residual component of particle velocity (m/s) |
| Vref | standard test velocity of particle (m/s) |
| threshold velocity (m/s) | |
| rebound velocity (m/s) | |
| , | Poisson’s ratios |
| melting temperature (°C) | |
| dimensionless temperature | |
| impact velocity (m/s) | |
| plastic deformation wear rate (mm3/Nm) | |
| X | factor of cutting |
| particles horizontal velocity (m/s) | |
| Greek letters | |
| α | impact angle (deg) |
| α0 | impact angle at which the horizontal velocity component has just become zero when the particle leaves the body (deg) |
| σ | stress applied (Pa) |
| scale parameter in range of 930 to 1230 | |
| blade solidity | |
| location parameter | |
| limit of elastic load (Pa) | |
| pressure-stress ratio | |
| blade mean angle (deg) | |
| blade angle (deg) | |
| deformation factor (gf cm/c) | |
| , | velocity of maximum erosion amounts (m/s) |
| dimensionless strain rate | |
| α/εc2 | constant term = 0.7 |
| depth of contact to cut ratio | |
| friction coefficient | |
| maximum value of |
References
- Goldberg, C.; Nalianda, D.; Sethi, V.; Pilidis, P.; Singh, R.; Kyprianidis, K. Assessment of an energy-efficient aircraft concept from a techno-economic perspective. Appl. Energy 2018, 221, 229–238. [Google Scholar] [CrossRef] [Green Version]
- Ahmadi, M.H.; Nazari, M.A.; Ghasempour, R.; Pourfayaz, F.; Rahimzadeh, M.; Ming, T. A review on solar-assisted gas turbines. Energy Sci. Eng. 2018, 6, 658–674. [Google Scholar] [CrossRef]
- Bazmi, A.A.; Zahedi, G. Sustainable energy systems: Role of optimization modeling techniques in power generation and supply—A review. Renew. Sustain. Energy Rev. 2011, 15, 3480–3500. [Google Scholar] [CrossRef]
- Iakimkin, V.; Kirillov, S.; Kirillov, A.; Pecht, M. Basic Principles, Models and Algorithms for Creation of Self-Maintenance and Self-Recovery Systems for Engines, Gas Turbines and Mechanics. In Proceedings of the 2018 Prognostics and System Health Management Conference (PHM-Chongqing), Chongqing, China, 26–28 October 2018; pp. 270–275. [Google Scholar]
- Steere, R.E.; Koepnick, E.G.; Dean, R.A. Progress On The Us Air Force Approach For The Practical Management Of Engine Life Cycle Costs. AGARD Lect. Ser. 2017, 4, 1–4. [Google Scholar]
- Wollmershauser, C. American Airlines Engine Management Program; Shell Aviat News: Hague, The Netherlands, 2017; pp. 6–11. [Google Scholar]
- Wróbel, M.; Richter, M.; Zimmermann, R.; Kiewel, H.; Ullrich, A. Rotor Lifecycle Management Program. In Proceedings of the ASME Turbo Expo, Dusseldorf, Germany, 16 June 2014. [Google Scholar] [CrossRef]
- Zachos, P.; Pilidis, P.; Kalfas, A. Analysis of turbine performance degradation effects due to geometry variations between actual components and design Intent. Aeronaut. J. 2010, 114, 569–578. [Google Scholar] [CrossRef]
- DiMarco, P.C. Navy Foreign Object Damage and Its Impact on Future Gas Turbine Engine Low Pressure Compression Systems. In Agard Conference Proceedings Agard Cp; AGARD: Rotterdam, The Netherlands, 1994; p. 6. [Google Scholar]
- Isaiah, T.-G.; Dabbashi, S.; Bosak, D.; Sampath, S.; Di Lorenzo, G.; Pilidis, P. Life Analysis of Industrial Gas Turbines Used As a Back-Up to Renewable Energy Sources. Procedia CIRP 2015, 38, 239–244. [Google Scholar] [CrossRef] [Green Version]
- Hamed, A.; Tabakoff, W.C.; Wenglarz, R. Erosion and Deposition in Turbomachinery. J. Propuls. Power 2006, 22, 350–360. [Google Scholar] [CrossRef] [Green Version]
- Saravanamutto, H. Erosion, Corrosion and Foreign Object Damage in Gas Turbines. Technical Evaluator’s Report. In AGARD-CP-558; North Atlantic Treaty Organization: Rotterdam, The Netherlands, 1994; p. P.T.1. [Google Scholar]
- Akca, E.; Gürsel, A. A Review on Superalloys and IN718 Nickel-Based INCONEL Superalloy. Period. Eng. Natl. Sci. (PEN) 2015, 3, 15–27. [Google Scholar] [CrossRef]
- Klocke, F.; Zeis, M.; Klink, A.; Veselovac, D. Experimental Research on the Electrochemical Machining of Modern Titanium- and Nickel-based Alloys for Aero Engine Components. Procedia CIRP 2013, 6, 368–372. [Google Scholar] [CrossRef] [Green Version]
- Salehnasab, B.; Zateajam, H.; Mousavi, S. Failure Analysis of a C450 Stainless Steel Blade in: A Compressor. Indian J. Sci. Res. Spl. 2014, 2, 143–150. [Google Scholar]
- Jahangiri, M.R.; Fallah, A.A.; Ghiasipour, A. Cement kiln dust induced corrosion fatigue damage of gas turbine compressor blades—A failure analysis. Mater. Des. 2014, 62, 288–295. [Google Scholar] [CrossRef]
- Brun, K.; Kurz, R.; Simmons, H.R. Aerodynamic Instability and Life-Limiting Effects of Inlet and Interstage Water Injection Into Gas Turbines. J. Eng. Gas Turbines Power 2004, 128, 617–625. [Google Scholar] [CrossRef]
- Kurz, R.; Brun, K. Gas Turbine Tutorial-Maintenance and Operating Practices Effects on Degradation and Life. In Proceedings of the 36th Turbomachinery Symposium; Texas A&M University: College Station, TX, USA, 2007. [Google Scholar]
- Kurz, R.; Meher-Homji, C.; Brun, K.; Moore, J.J.; Gonzalez, F. Gas turbine performance and maintenance. In Proceedings of the 42nd Turbomachinery Symposium; Texas A&M University: College Station, TX, USA, 2013. [Google Scholar]
- Li, Y.G. Performance-analysis-based gas turbine diagnostics: A review. Proc. Inst. Mech. Eng. Part A: J. Power Energy 2002, 216, 363–377. [Google Scholar] [CrossRef] [Green Version]
- Meher-Homji, C.B.; Bromley, A. Gas Turbine Axial Compressor Fouling and Washing. In Proceedings of the 33rd Turbomachinery Symposium; Texas A&M University: College Station, TX, USA, 2004. [Google Scholar]
- Hanachi, H.; Liu, J.; Banerjee, A.; Chen, Y.; Koul, A. A Physics-Based Modeling Approach for Performance Monitoring in Gas Turbine Engines. IEEE Trans. Reliab. 2014, 64, 197–205. [Google Scholar] [CrossRef]
- Kurz, R.; Brun, K. Degradation in Gas Turbine Systems. J. Eng. Gas Turbines Power 2000, 123, 70–77. [Google Scholar] [CrossRef] [Green Version]
- Kurz, R.; Brun, K. Degradation of gas turbine performance in natural gas service. J. Nat. Gas Sci. Eng. 2009, 1, 95–102. [Google Scholar] [CrossRef]
- Meher-Homji, C.B.; Chaker, M.A.; Motiwala, H.M. Gas Turbine Performance Deterioration. In Proceedings of the 30th Turbomachinery Symposium; Texas A&M University: College Station, TX, USA, 2001. [Google Scholar]
- Kassaee, M.; Zandi, H.; Akbari, J.; Motamedi, E. An efficient and mild carboxylation of multiwall carbon nanotubes using H2O2 in the presence of heteropolyacid. Chin. Chem. Lett. 2012, 23, 470–473. [Google Scholar]
- Urban, L.A. Parameter Selection for Multiple Fault Diagnostics of Gas Turbine Engines. J. Eng. Power 1975, 97, 225–230. [Google Scholar] [CrossRef]
- Reynolds, O. XLII. On the action of a blast of sand in cutting hard material. Philos. Mag. (Fourth Ser.) 1873, 46, 337–343. [Google Scholar] [CrossRef]
- Bahramnia, H.; Semnani, H.M.; Habibolahzadeh, A.; Abdoos, H. Epoxy/polyurethane nanocomposite coatings for anti-erosion/wear applications: A review. J. Compos. Mater. 2020, 0021998320908299. [Google Scholar] [CrossRef]
- Bai, X.; Yao, Y.; Han, Z.; Zhang, J.; Zhang, S. Study of Solid Particle Erosion on Helicopter Rotor Blades Surfaces. Appl. Sci. 2020, 10, 977. [Google Scholar] [CrossRef] [Green Version]
- Finnie, I. Erosion of surfaces by solid particles. Wear 1960, 3, 87–103. [Google Scholar] [CrossRef]
- Bousser, E.; Martinu, L.; Klemberg-Sapieha, J. Solid particle erosion mechanisms of protective coatings for aerospace applications. Surf. Coat. Technol. 2014, 257, 165–181. [Google Scholar] [CrossRef] [Green Version]
- Swaminathan, V.P.; Wei, R.; Gandy, D.W. Nanotechnology Coatings for Erosion Protection of Turbine Components. J. Eng. Gas Turbines Power 2010, 132, 082104. [Google Scholar] [CrossRef]
- Shukla, K.; Rane, R.; Alphonsa, J.; Maity, P.; Mukherjee, S. Structural, mechanical and corrosion resistance properties of Ti/TiN bilayers deposited by magnetron sputtering on AISI 316L. Surf. Coat. Technol. 2017, 324, 167–174. [Google Scholar] [CrossRef]
- Lin, J.; Wei, R.; Ge, F.; Li, Y.G.; Zhang, X.; Huang, F.; Lei, M. TiSiCN and TiAlVSiCN nanocomposite coatings deposited from Ti and Ti-6Al-4V targets. Surf. Coat. Technol. 2018, 336, 106–116. [Google Scholar] [CrossRef]
- Barshilia, H.C.; Prakash, M.S.; Poojari, A.; Rajam, K. Corrosion behavior of nanolayered TiN/NbN multilayer coatings prepared by reactive direct current magnetron sputtering process. Thin Solid Films 2004, 460, 133–142. [Google Scholar] [CrossRef]
- Scopus-Database. Analysis of Scopus Search Result for the Words “Solid particle Erosion”, “Coatings”, and “Gas Urbine” from 1984 to 2019; in Elsevier. 2020. Available online: www.scopus.com (accessed on 12 April 2020).
- Chahar, B.S.; Siddhartha, A.K.P. Erosion Wear of Ductile Materials: A Review. In Proceedings of the International Conference on Advancements and Recent Innovations in Mechanical, Production and Industrial Engineering (ARIMPIE—2016), ELK Asia Pacific Journal, Gaziabad, India, 15–16 April 2016; pp. 17–22. [Google Scholar]
- Budinski, K.G. Guide to Friction, Wear and Erosion Testing; ASTM International West: Conshohocken, MA, USA, 2007. [Google Scholar]
- Zdravecká, E.; Slota, J.; Tkáčová, J. Erosive failure of steel pipeline by solid pulverized particles. Eng. Fail. Anal. 2014, 46, 18–25. [Google Scholar] [CrossRef]
- Meng, H.; Ludema, K. Wear models and predictive equations: Their form and content. Wear 1995, 181, 443–457. [Google Scholar] [CrossRef]
- Brun, K.; Nored, M.; Kurz, R. Analysis of solid particle surface impact behavior in turbomachines to assess blade erosion and fouling. In Proceedings of the Forty-First Turbomachinery Symposium, Houston, TX, USA, 24–27 September 2012. [Google Scholar]
- Schmücker, J.; Schäffler, A. Performance deterioration of axial compressors due to blade defects. In AGARD Conference Proceedings Agard CP; AGARD: Rotterdam, The Netherlands, 1994; p. 16. [Google Scholar]
- Levin, B.F.; Vecchio, K.S.; Dupont, J.N.; Marder, A.R. Modeling solid-particle erosion of ductile alloys. Met. Mater. Trans. A 1999, 30, 1763–1774. [Google Scholar] [CrossRef]
- Balan, C.; Tabakoff, W. Axial flow compressor performance deterioration. In Proceedings of the 20th Joint Propulsion Conference, Cincinnati, OH, USA, 11–13 June 1984; p. 1208. [Google Scholar]
- Balan, C.; Tabakoff, W. A Method of Predicting the Performance Deterioration of a Compressorcascade due to Sand Erosion. In Proceedings of the Aerospace Sciences Meeting, Reno, NV, USA, 10–13 January 1983; p. 178. [Google Scholar] [CrossRef]
- Hamed, A.; Tabakoff, W.; Singh, D. Modeling of Compressor Performance Deterioration Due to Erosion. Int. J. Rotating Mach. 1998, 4, 243–248. [Google Scholar] [CrossRef] [Green Version]
- Kurz, R.; Brun, K. Gas turbine performance-what makes the map? Comp. Sci. 2000, 15, 247–262. [Google Scholar]
- Hartmann, M.J. Advanced technologies for turbomachinery systems: An overview. In NASA Technical Memorandum Langley Research Center; NASA: Washington, DC, USA, 1982; Volume VI, pp. 1–80. [Google Scholar]
- Hamed, A.; Tabakoff, W. Experimental and numerical simulations of the effects of ingested particles in gas turbine engines. In AGARD Conference Proceedings AGARD CP; AGARD: Rotterdam, The Netherlands, 1994; p. 11. [Google Scholar]
- Schrade, M.; Staudacher, S. High-speed Test Rig for the Investigation of Erosion Damage of Axial Compressor Blades; Deutsche Gesellschaft für Luft-und Raumfahrt-Lilienthal-Oberth eV: Bonn, Germany, 2014. [Google Scholar]
- Lombardo, G.; Torella, G. An airborne monitoring system for FOD and erosion faults. In AGARD Conference Proceedings AGARD CP; AGARD: Rotterdam, The Netherlands, 1994; pp. 1901–1911. [Google Scholar]
- Antwi, E.K.; Liu, K.; Wang, H. A review on ductile mode cutting of brittle materials. Front. Mech. Eng. 2018, 13, 251–263. [Google Scholar] [CrossRef] [Green Version]
- Finnie, I. The Mechanism of Erosion of Ductile Metals. In Proceedings of the 3rd U.S. National Congress of Applied Mechanics, Brown University, Providence, RI, USA, 11–14 June 1958; American Society of Mechanical Engineers: New York, NY, USA, 1958; pp. 527–532. [Google Scholar]
- Biswas, S.; Cenna, A.; Williams, K.; Jones, M. Subsurface Behavior of Ductile Material by Particle Impacts and its Influence on Wear Mechanism. Procedia Eng. 2014, 90, 160–165. [Google Scholar] [CrossRef] [Green Version]
- Chang, L.; Hsui, I.; Chen, L.; Lui, T. A study on particle erosion behavior of ductile irons. Scr. Mater. 2005, 52, 609–613. [Google Scholar] [CrossRef]
- Levy, A.V. The Piatelet Mechanism of Erosion of Ductile Metals. Wear 1986, 108, 1–21. [Google Scholar] [CrossRef] [Green Version]
- Hutchings, I.M.; Levy, A.V. Thermal effects in the erosion of ductile metals. Wear 1989, 131, 105–121. [Google Scholar] [CrossRef]
- Winter, R.E.; Hutchings, I.M. The role of adiabatic shear in solid particle erosion. Wear 1975, 34, 141–148. [Google Scholar] [CrossRef]
- Molinari, J.-F.; Ortiz, M. A study of solid-particle erosion of metallic targets. Int. J. Impact Eng. 2002, 27, 347–358. [Google Scholar] [CrossRef]
- Finnie, I. Some observations on the erosion of ductile metals. Wear 1972, 19, 81–90. [Google Scholar] [CrossRef]
- Hutchings, I.M. Ductile-brittle transitions and wear maps for the erosion and abrasion of brittle materials. J. Phys. D: Appl. Phys. 1992, 25, A212–A221. [Google Scholar] [CrossRef]
- Hutchings, I. A model for the erosion of metals by spherical particles at normal incidence. Wear 1981, 70, 269–281. [Google Scholar] [CrossRef] [Green Version]
- Sundararajan, G.; Shewmon, P. A new model for the erosion of metals at normal incidence. Wear 1983, 84, 237–258. [Google Scholar] [CrossRef]
- Laguna-Camacho, J.R.; Vite-Torres, M.; Gallardo-Hernández, E.; Vera-Cárdenas, E. Solid particle erosion on different metallic materials. Tribol. Eng. 2013, 5, 63–78. [Google Scholar]
- Gat, N.; Tabakoff, W. Effects of temperature on the behavior of metals under erosion by particulate matter. J. Test. Eval. 1980, 8, 177–186. [Google Scholar]
- ElTobgy, M.; Ng, E.; Elbestawi, M. Finite element modeling of erosive wear. Int. J. Mach. Tools Manuf. 2005, 45, 1337–1346. [Google Scholar] [CrossRef]
- Wiederhorn, S.M.; Hockey, B.J. Effect of material parameters on the erosion resistance of brittle materials. J. Mater. Sci. 1983, 18, 766–780. [Google Scholar] [CrossRef]
- Preece, C.M. Treatise on Materials Science and Technology. C.M. Preece 1979, 16, 1–67. [Google Scholar]
- Aquaro, D.; Fontani, E. Erosion of Ductile and Brittle Materials. Meccanica 2001, 36, 651–661. [Google Scholar] [CrossRef]
- Evans, A.G.; Gulden, M.E.; Rosenblatt, M.; Dewhurst, P. Impact damage in brittle materials in the elastic-plastic response régime. Proc. R. Soc. London. Ser. A. Math. Phys. Sci. 1978, 361, 343–365. [Google Scholar] [CrossRef]
- Sheldon, G.L.; Finnie, I. On the Ductile Behavior of Nominally Brittle Materials During Erosive Cutting. J. Eng. Ind. 1966, 88, 387–392. [Google Scholar] [CrossRef]
- Amaral, P.; Fernandes, J.; Rosa, L.G. Weibull statistical analysis of granite bending strength. Rock Mech. Rock Eng. 2007, 41, 917–928. [Google Scholar] [CrossRef]
- Le, J.-L.; Bazant, Z.P.; Bazant, M.Z. Unified nano-mechanics based probabilistic theory of quasibrittle and brittle structures: I. Strength, static crack growth, lifetime and scaling. J. Mech. Phys. Solids 2011, 59, 1291–1321. [Google Scholar] [CrossRef]
- Vardar, Ö.; Finnie, I. An analysis of the Brazilian disk fracture test using the Weibull probabilistic treatment of brittle strength. Int. J. Fract. 1975, 11, 495–508. [Google Scholar]
- Rodriguez, E.; Flores, M.; Perez, A.; Mercado-Solis, R.D.; González, R.; Rodriguez, J.; Valtierra, S. Erosive wear by silica sand on AISI H13 and 4140 steels. Wear 2009, 267, 2109–2115. [Google Scholar] [CrossRef]
- Wensink, H.; Elwenspoek, M.C. A closer look at the ductile–brittle transition in solid particle erosion. Wear 2002, 253, 1035–1043. [Google Scholar] [CrossRef]
- Liu, K.; Li, X.P.; Rahman, M.; Liu, X.D. A study of the cutting modes in the grooving of tungsten carbide. Int. J. Adv. Manuf. Technol. 2004, 24, 321–326. [Google Scholar] [CrossRef]
- Finnie, I. Some reflections on the past and future of erosion. Wear 1995, 186, 1–10. [Google Scholar] [CrossRef]
- Grant, G.; Tabakoff, W. Erosion Prediction in Turbomachinery Resulting from Environmental Solid Particles. J. Aircr. 1975, 12, 471–478. [Google Scholar] [CrossRef]
- Swain, M. Microfracture about scratches in brittle solids. Proc. R. Soc. London Ser. A Math. Phys. Sci. 1979, 366, 575–597. [Google Scholar] [CrossRef]
- Singh, R.; Tiwari, S.K.; Mishra, S.K. Cavitation Erosion in Hydraulic Turbine Components and Mitigation by Coatings: Current Status and Future Needs. J. Mater. Eng. Perform. 2011, 21, 1539–1551. [Google Scholar] [CrossRef]
- Chen, D.; Sarumi, M.; Al-Hassani, S.; Gan, S.; Yin, Z. A model for erosion at normal impact. Wear 1997, 205, 32–39. [Google Scholar] [CrossRef]
- Huang, C.; Chiovelli, S.; Minev, P.; Luo, J.; Nandakumar, K. A comprehensive phenomenological model for erosion of materials in jet flow. Powder Technol. 2008, 187, 273–279. [Google Scholar] [CrossRef]
- Walker, C.; Robbie, P. Comparison of some laboratory wear tests and field wear in slurry pumps. Wear 2013, 302, 1026–1034. [Google Scholar] [CrossRef]
- Singh, J.; Kumar, S.; Mohapatra, S.K. Tribological analysis of WC–10Co–4Cr and Ni–20Cr2O3 coating on stainless steel 304. Wear 2017, 376, 1105–1111. [Google Scholar] [CrossRef]
- Neilson, J.; Gilchrist, A. Erosion by a stream of solid particles. Wear 1968, 11, 111–122. [Google Scholar] [CrossRef]
- Desale, G.R.; Gandhi, B.K.; Jain, S. Slurry erosion of ductile materials under normal impact condition. Wear 2008, 264, 322–330. [Google Scholar] [CrossRef]
- Clark, H.; Llewellyn, R. Assessment of the erosion resistance of steels used for slurry handling and transport in mineral processing applications. Wear 2001, 250, 32–44. [Google Scholar] [CrossRef]
- Arabnejad, H.; Mansouri, A.; Shirazi, S.A.; McLaury, B.S. Development of mechanistic erosion equation for solid particles. Wear 2015, 390, 1044–1050. [Google Scholar] [CrossRef]
- Vite-Torres, M.; Laguna-Camacho, J.; Baldenebro-Castillo, R.; Gallardo-Hernández, E.; Vera-Cardenas, E.J. Study of solid particle erosion on AISI 420 stainless steel using angular silicon carbide and steel round grit particles. Wear 2013, 301, 383–389. [Google Scholar] [CrossRef]
- Feng, Z.; Ball, A. The erosion of four materials using seven erodents—Towards an understanding. Wear 1999, 20, 674–684. [Google Scholar] [CrossRef]
- Chen, Q.; Li, D. Computer simulation of solid particle erosion. Wear 2003, 254, 203–210. [Google Scholar] [CrossRef]
- Winter, R.; Hutchings, I. Solid particle erosion studies using single angular particles. Wear 1974, 29, 181–194. [Google Scholar] [CrossRef]
- Levy, A.V.; Chik, P. The effects of erodent composition and shape on the erosion of steel. Wear 1983, 89, 151–162. [Google Scholar] [CrossRef] [Green Version]
- Hamed, A.; Fowler, S. Erosion Pattern of Twisted Blades by Particle Laden Flows. J. Eng. Power 1983, 105, 839–843. [Google Scholar] [CrossRef]
- Jianren, F.; Dadong, Z.; Jun, J.; Kefa, C. Numerical simulation of tube erosion by particle impaction. Wear 1991, 142, 171–184. [Google Scholar] [CrossRef]
- Ghenaiet, A. Prediction of Erosion Induced by Solid Particles in a Water Turbine. In Proceedings of the 11th European Conference on Turbomachinery Fluid dynamics & Thermodynamics, Madrid, Spain, 23–27 March 2015. [Google Scholar]
- Zheng, Z.; Zheng, Y.; Zhou, X.; He, S.; Sun, W.; Wang, J. Determination of the critical flow velocities for erosion–corrosion of passive materials under impingement by NaCl solution containing sand. Corros. Sci. 2014, 88, 187–196. [Google Scholar] [CrossRef]
- Mbabazi, J.; Sheer, T.; Shandu, R. A model to predict erosion on mild steel surfaces impacted by boiler fly ash particles. Wear 2004, 257, 612–624. [Google Scholar] [CrossRef]
- Lindsley, B.; Marder, A. The effect of velocity on the solid particle erosion rate of alloys. Wear 1999, 225, 510–516. [Google Scholar] [CrossRef]
- Bitter, J. A study of erosion phenomena part I. Wear 1963, 6, 5–21. [Google Scholar] [CrossRef]
- Oka, Y.; Ohnogi, H.; Hosokawa, T.; Matsumura, M. The impact angle dependence of erosion damage caused by solid particle impact. Wear 1997, 203, 573–579. [Google Scholar] [CrossRef]
- Tabakoff, W. Causes for Turbomachinery Performance Deterioration. In Proceedings of the ASME Gas Turbine and Aeroengine Congress; ASME, Citeseer: Amsterdam, The Netherlands, 1988. [Google Scholar] [CrossRef]
- Mansouri, A.; Khanouki, H.A.; Shirazi, S.; McLaury, B. A combined CFD/experimental methodology for erosion prediction. Wear 2015, 332-333, 1090–1097. [Google Scholar] [CrossRef]
- Bitter, J. A study of erosion phenomena. Wear 1963, 6, 169–190. [Google Scholar] [CrossRef]
- Sheldon, G.; Kanhere, A. An investigation of impingement erosion using single particles. Wear 1972, 21, 195–209. [Google Scholar] [CrossRef]
- Tilly, G. A two stage mechanism of ductile erosion. Wear 1973, 23, 87–96. [Google Scholar] [CrossRef]
- Jennings, W.; Head, W.; Manning, C. A mechanistic model for the prediction of ductile erosion. Wear 1976, 40, 93–112. [Google Scholar] [CrossRef]
- Hutchings, I.M.; Winter, R.E.; Field, J.E. Solid particle erosion of metals: The removal of surface material by spherical projectiles. Proc. R. Soc. London. Ser. A Math. Phys. Sci. 1976, 348, 379–392. [Google Scholar] [CrossRef]
- Tabakoff, W.; Kotwal, R.; Hamed, A. Erosion study of different materials affected by coal ash particles. Wear 1979, 52, 161–173. [Google Scholar] [CrossRef]
- Sundararajan, G. A comprehensive model for the solid particle erosion of ductile materials. Wear 1991, 149, 111–127. [Google Scholar] [CrossRef]
- Nsoesie, S.; Liu, R.; Chen, K.; Yao, M. Analytical modeling of solid-particle erosion of Stellite alloys in combination with experimental investigation. Wear 2014, 309, 226–232. [Google Scholar] [CrossRef]
- Parsi, M.; Najmi, K.; Najafifard, F.; Hassani, S.; McLaury, B.S.; Shirazi, S.A. A comprehensive review of solid particle erosion modeling for oil and gas wells and pipelines applications. J. Nat. Gas Sci. Eng. 2014, 21, 850–873. [Google Scholar] [CrossRef]
- Sobota, J.; Sorensen, G.; Jensen, H.; Bochnicek, Z.; Holý, V. CN/MeN nanocomposite coatings, deposition and testing of performance. Surf. Coat. Technol. 2001, 142, 590–595. [Google Scholar] [CrossRef]
- Chin, K.; Gohel, A.; Elim, H.I.; Ji, W.; Chong, G.; Lim, K.; Sow, C.; Wee, A. Optical limiting properties of amorphous SixNy and SiC coated carbon nanotubes. Chem. Phys. Lett. 2004, 383, 72–75. [Google Scholar] [CrossRef]
- Brogren, M.; Harding, G.L.; Karmhag, R.; Ribbing, C.G.; Niklasson, G.A.; Stenmark, L. Titanium–aluminum–nitride coatings for satellite temperature control. Thin Solid Films 2000, 370, 268–277. [Google Scholar] [CrossRef]
- Holleck, H. Design of nanostructured thin films for tribological applications. In TMS Conference Proceedings on Surface Engineering: Science and Technology I; Kumar, A., Chung, Y.W., Moore, J.E., Smugeresky, J.E., Eds.; Minerals, Metals, and Materials Society: Warrendale, PA, USA, 1999. [Google Scholar]
- Nicholls, J.; Lawson, K.; Rickerby, D.; Morrel, P. Advanced Processing of TBC’s for Reduced Thermal Conductivity; Rolls-Royce plc: Aslborg, Denmark, 1998. [Google Scholar]
- Ali, N.; Sebzali, M.; Bourisli, H.; Safar, A.; Ebrahem, Z.A. Nanocoating: An Energy Efficient Solution Towards Reducing Buildings Electrical Consumption in The State of Kuwait. In Proceedings of the 2020 Advances in Science and Engineering Technology International Conferences (ASET), Dubai, UAE, 4 February–9 April 2020; pp. 1–4. [Google Scholar]
- Miller, R.A. Thermal barrier coatings for aircraft engines: History and directions. J. Therm. Spray Technol. 1997, 6, 35–42. [Google Scholar] [CrossRef]
- Ünal, Ö.; Mitchell, T.E.; Heuer, A.H. Microstructures of Y2O3-Stabilized ZrO2 Electron Beam-Physical Vapor Deposition Coatings on Ni-Base Superalloys. J. Am. Ceram. Soc. 1994, 77, 984–992. [Google Scholar] [CrossRef]
- Miller, R.A. Current status of thermal barrier coatings—An overview. Surf. Coat. Technol. 1987, 30, 1–11. [Google Scholar] [CrossRef]
- Singh, J.; Wolfe, D.E.; Singh, J. Architecture of thermal barrier coatings produced by electron beam-physical vapor deposition (EB-PVD). J. Mater. Sci. 2002, 37, 3261–3267. [Google Scholar] [CrossRef]
- Goward, G. Progress in coatings for gas turbine airfoils. Surf. Coatings Technol. 1998, 108, 73–79. [Google Scholar] [CrossRef]
- Eichner, D.; Schlieter, A.; Leyens, C.; Shang, L.; Shayestehaminzadeh, S.; Schneider, J.M. Solid particle erosion behavior of nanolaminated Cr 2 AlC films. Wear 2018, 187–195. [Google Scholar] [CrossRef]
- AG, S. Advanced Compressor Coating for Siemens Gas Turbines, in, Siemens AG. Available online: https://assets.new.siemens.com/siemens/assets/api/uuid:3d6979ec63aff8183e9dc3946e330bf9297534bd/version:1541967370/acc_e50001-g520-a445-x-7600enlrfinal.pdf (accessed on 15 April 2012).
- Rajendran, R. Gas turbine coatings—An overview. Eng. Fail. Anal. 2012, 26, 355–369. [Google Scholar] [CrossRef]
- AG, S. Advanced Compressor Coating (ACC), in Siemens Energy Sector. Available online: https://new.siemens.com/global/en/products/energy/services/performance-enhancement/modernization-upgrades/gas-turbines/acc-sgt-2000e.html (accessed on 15 April 2012).
- Kablov, E.N.; Muboyadzhyan, S.A. Erosion-resistant coatings for gas turbine engine compressor blades. Russ. Met. (Metally) 2017, 2017, 494–504. [Google Scholar] [CrossRef]
- Fotovvati, B.; Namdari, N.; Dehghanghadikolaei, A. On Coating Techniques for Surface Protection: A Review. J. Manuf. Mater. Process. 2019, 3, 28. [Google Scholar] [CrossRef] [Green Version]
- Swadźba, L.; Formanek, B.; Gabriel, H.; Liberski, P.; Podolski, P. Erosion- and corrosion-resistant coatings for aircraft compressor blades. Surf. Coat. Technol. 1993, 62, 486–492. [Google Scholar] [CrossRef]
- Bonu, V.; Jeevitha, M.; Kumar, V.P.; Srinivas, G.; Barshilia, H.C. Solid particle erosion and corrosion resistance performance of nanolayered multilayered Ti/TiN and TiAl/TiAlN coatings deposited on Ti6Al4V substrates. Surf. Coat. Technol. 2020, 387, 125531. [Google Scholar] [CrossRef]
- Sun, Z.; He, G.; Meng, Q.; Li, Y.; Tian, X. Corrosion mechanism investigation of TiN/Ti coating and TC4 alloy for aircraft compressor application. Chin. J. Aeronaut. 2020, 33, 1824–1835. [Google Scholar] [CrossRef]
- Ma, K.; Bloyce, A.; Bell, T. Examination of mechanical properties and failure mechanisms of TiN and Ti−TiN multilayer coatings. Surf. Coat. Technol. 1995, 76, 297–302. [Google Scholar] [CrossRef]
- Reedy, M.W.; Eden, T.J.; Potter, J.K.; Wolfe, U.E. Erosion performance and characterization of nanolayer (Ti,Cr)N hard coatings for gas turbine engine compressor blade applications. Surf. Coat. Technol. 2011, 206, 464–472. [Google Scholar] [CrossRef]
- Ali, N.; Teixeira, J.A.; Addali, A. Effect of Water Temperature, pH Value, and Film Thickness on the Wettability Behaviour of Copper Surfaces Coated with Copper Using EB-PVD Technique. J. Nano Res. 2019, 60, 124–141. [Google Scholar] [CrossRef]
- Ali, N.; Teixeira, J.A.; Addali, A.; Saeed, M.; Al-Zubi, F.; Sedaghat, A.; Bahzad, H. Deposition of Stainless Steel Thin Films: An Electron Beam Physical Vapour Deposition Approach. Materials 2019, 12, 571. [Google Scholar] [CrossRef] [Green Version]
- Ali, N.; Teixeira, J.A.; Addali, A.; Al-Zubi, F.; Shaban, E.; Behbehani, I. The effect of aluminium nanocoating and water pH value on the wettability behavior of an aluminium surface. Appl. Surf. Sci. 2018, 443, 24–30. [Google Scholar] [CrossRef] [Green Version]
- Saeed, M.; Robson, J.D.; Kinloch, I.A.; Derby, B.; Liao, C.-D.; Al-Awadhi, S.; Al-Nasrallah, E. The formation mechanism of hexagonal Mo2C defects in CVD graphene grown on liquid copper. Phys. Chem. Chem. Phys. 2020, 22, 2176–2180. [Google Scholar] [CrossRef] [PubMed]
- Rossnagel, S.M.; Powell, R.; Ulman, A. PVD for Microelectronics: Sputter Desposition to Semiconductor Manufacturing; Elsevier: Amsterdam, The Netherlands, 1998. [Google Scholar]
- Kumar, V.; Kandasubramanian, B. Processing and design methodologies for advanced and novel thermal barrier coatings for engineering applications. Particuology 2016, 27, 1–28. [Google Scholar] [CrossRef]
- Lu, Y.; Hao, L.; Yoshi, H. Mechanical Coating Technique for Composite Films and Composite Photocatalyst Films; IntechOpen: London, UK, 2012; pp. 323–354. [Google Scholar]
- Mehran, Q.M.; Fazal, M.A.; Razak, B.A.; Rubaiee, S. A Critical Review on Physical Vapor Deposition Coatings Applied on Different Engine Components. Crit. Rev. Solid State Mater. Sci. 2017, 43, 158–175. [Google Scholar] [CrossRef]
- Xia, L.-Q.; Chang, M. Chemical vapor deposition. In Handbook of Semiconductor Manufacturing Technology; CRC Press: Boca Raton, FL, USA, 2017; pp. 13-11–13-87. [Google Scholar]
- Kelly, P.; Arnell, R. Magnetron sputtering: A review of recent developments and applications. Vacuum 2000, 56, 159–172. [Google Scholar] [CrossRef]
- Asri, R.; Harun, W.; Hassan, M.; Ghani, S.A.C.; Buyong, Z. A review of hydroxyapatite-based coating techniques: Sol–gel and electrochemical depositions on biocompatible metals. J. Mech. Behav. Biomed. Mater. 2016, 57, 95–108. [Google Scholar] [CrossRef] [Green Version]
- Moridi, A.; Hassani-Gangaraj, S.M.; Guagliano, M.; Dao, M. Cold spray coating: Review of material systems and future perspectives. Surf. Eng. 2014, 30, 369–395. [Google Scholar] [CrossRef]
- Matthews, S.; James, B. Review of Thermal Spray Coating Applications in the Steel Industry: Part 1—Hardware in Steel Making to the Continuous Annealing Process. J. Therm. Spray Technol. 2010, 19, 1267–1276. [Google Scholar] [CrossRef]
- Alsayegh, N.M.; Saeed, M.A.; Alzubi, F.G. Method for Synthesizing a Thin Film Stainless Steel Coating. U.S. Patent No. 10,392690, 27 August 2019. [Google Scholar]
- Rhys-Jones, T. The use of thermally sprayed coatings for compressor and turbine applications in aero engines. Surf. Coat. Technol. 1990, 42, 1–11. [Google Scholar] [CrossRef]
- Drexler, J.M.; Shinoda, K.; Ortiz, A.L.; Li, D.; Vasiliev, A.L.; Gledhill, A.D.; Sampath, S.; Padture, N. Air-plasma-sprayed thermal barrier coatings that are resistant to high-temperature attack by glassy deposits. Acta Mater. 2010, 58, 6835–6844. [Google Scholar] [CrossRef]
- de Almeida, D.S.; da Silva, C.R.M.; Carmo, M.D.; Nono, A.; Cairo, C.A.A. Ni Al alloy coating deposition by electron beam physical vapour deposition. In Proceedings of the 17th Brazilian Congress of Engineering and Materials Science, Paraná, Brazil, 15–19 November 2006; pp. 15–19. [Google Scholar]
- Tabakoff, W. Protection of coated superalloys from erosion in turbomachinery and other systems exposed to particulate flows. Wear 1999, 233, 200–208. [Google Scholar] [CrossRef]
- Tabakoff, W.; Simpson, G. Experimental study of deterioration and retention on coated and uncoated compressor and turbine blades. In Proceedings of the 40th AIAA Aerospace Sciences Meeting & Exhibit, Cincinnati, OH, USA, 14–17 January 2002. [Google Scholar] [CrossRef]
- Navinšek, B.; Panjan, P.; Milošev, I. Industrial applications of CrN (PVD) coatings, deposited at high and low temperatures. Surf. Coat. Technol. 1997, 97, 182–191. [Google Scholar] [CrossRef]
- Hetmańczyk, M.; Swadźba, L.; Mendala, B. Advanced materials and protective coatings in aero-engines application. J. Achiev. Mater. Manuf. Eng. 2007, 24, 372–381. [Google Scholar]
- LTD, J.P.P. Vacuum Deposition Apparatus for Powdery Samples: Mpvap Powder, in, Jesco Project PVT LTD. 2020. Available online: http://www.jescoprojects.com/products/vacuum-deposition-apparatus-for-powdery-samples-mpvappowder (accessed on 10 May 2020).
- Sano, H.; Ishida, R.; Kura, T.; Fujita, S.; Naka, S.; Okada, H.; Takai, T. Transparent Organic Light-Emitting Diodes with Top Electrode Using Ion-Plating Method. IEICE Trans. Electron. 2015, 98, 1035–1038. [Google Scholar] [CrossRef]
- Pessoa, R.S.; Fraga, M.A.; Santos, L.; Galvão, N.; Maciel, H.; Massi, M. Plasma-assisted techniques for growing hard nanostructured coatings. An overview. In Anti-Abrasive Nanocoatings; Aliofkhazraei, M., Ed.; Woodhead Publishing: Cambridge, UK, 2015; pp. 455–479. [Google Scholar]
- Mattox, D. Vacuum Deposition Processes, in Products Finishing. 1999. Available online: https://www.pfonline.com/articles/vacuum-deposition-processes (accessed on 10 May 2020).
- Lampert, C. Vacuum Deposition and Coating Options, in Products Finishing. 2013. Available online: https://www.pfonline.com/articles/vacuum-deposition-and-coating-options (accessed on 10 May 2020).
- European Physical Society; Institute of Physics. Thin Film and Surfaces Group; Welding Inst. Surfacing Div. (Eds.) Proceedings of the International Conference—Ion Plating and Allied Techniques (IPAT 79). In Proceedings—Micro-Delcon; CEP Consultants Ltd.: London, UK, 1979. [Google Scholar]
- Mattox, D.M. The Foundations of Vacuum Coating Technology; Noyes Publications/William Andrew Pub: New York, NY, USA, 2003. [Google Scholar]
- Taschuk, M.; Hawkeye, M.; Brett, M.; Martin, P. Handbook of Deposition Technologies for Films and Coatings. Science Applications and Technology; Elsevier: Oxford, UK, 2010. [Google Scholar]
- Carlsson, J.-O.; Martin, P.M.; Martin, P. Handbook of deposition technologies for films and coatings. Science, Applications and Technology. In Chemical Vapor Deposition; Elsevier Inc.: Oxford, UK, 2010; p. 406. [Google Scholar]
- Depla, D.; Mahieu, S.; Greene, J. Sputter deposition processes. In Handbook of Deposition Technologies for Films and Coatings; Elsevier: Oxford, UK, 2010; pp. 253–296. [Google Scholar]
- Brauer, G.; Szyszka, B.; Vergöhl, M.; Bandorf, R. Magnetron sputtering—Milestones of 30 years. Vacuum 2010, 84, 1354–1359. [Google Scholar] [CrossRef]
- Braun, M. Magnetron sputtering technique. In Handbook of Manufacturing Engineering Technology; Springer: Berlin, Germany, 2015; pp. 2929–2957. [Google Scholar]
- Frach, P.; Gottfried, C.; Fietzke, F.; Klostermann, H.; Bartzsch, H.; Gloess, D. High Power Density Pulse Magnetron Sputtering-Process and Film Properties. In Proceedings of the 13th International Conference on Plasma Surface Engineering, Garmisch-Partenkirchen, Germany, 10–14 September 2012; pp. 80–83. [Google Scholar]
- Lin, J.; Jang, J.; Park, I.-W.; Wei, R. Structure and properties of CrSiCN coatings deposited by pulsed dc magnetron sputtering for wear and erosion protection. Surf. Coat. Technol. 2016, 287, 44–54. [Google Scholar] [CrossRef]
- Bromark, M.; Larsson, M.; Hedenqvist, P.; Olsson, M.; Hogmark, S.; Bergmann, E. PVD COATINGS FOR TOOL APPLICATIONS: TRIBOLOGICAL EVALUATION. Surf. Eng. 1994, 10, 205–214. [Google Scholar] [CrossRef]
- Deng, J.; Wu, F.; Lian, Y.; Xing, Y.; Li, S. Erosion wear of CrN, TiN, CrAlN, and TiAlN PVD nitride coatings. Int. J. Refract. Met. Hard Mater. 2012, 35, 10–16. [Google Scholar] [CrossRef]
- Mitterer, C.; Holler, F.; Üstel, F.; Heim, D. Application of hard coatings in aluminium die casting—Soldering, erosion and thermal fatigue behaviour. Surf. Coat. Technol. 2000, 125, 233–239. [Google Scholar] [CrossRef]
- Alegría-Ortega, J.; Ocampo-Carmona, L.M.; Suárez-Bustamante, F.; Olaya-Florez, J. Erosion–corrosion wear of Cr/CrN multi-layer coating deposited on AISI-304 stainless steel using the unbalanced magnetron (UBM) sputtering system. Wear 2012, 290, 149–153. [Google Scholar] [CrossRef]
- Lehto, S.; Likonen, J.; Coad, J.; Ahlgren, T.; Hole, D.; Mayer, M.; Maier, H.; Kolehmainen, J. Tungsten coating on JET divertor tiles for erosion/deposition studies. Fusion Eng. Des. 2003, 66, 241–245. [Google Scholar] [CrossRef]
- Holleck, H. Material selection for hard coatings. J. Vac. Sci. Technol. A 1986, 4, 2661–2669. [Google Scholar] [CrossRef]
- Levy, A.V.; Buqian, W. Erosion of hard material coating systems. Wear 1988, 121, 325–346. [Google Scholar] [CrossRef]
- Zhao, L.; Chen, K.; Yang, Q.; Rodgers, J.; Chiou, S. Materials informatics for the design of novel coatings. Surf. Coat. Technol. 2005, 200, 1595–1599. [Google Scholar] [CrossRef]
- Chauhan, A.; Vaish, R. Hard coating material selection using multi-criteria decision making. Mater. Des. 2013, 44, 240–245. [Google Scholar] [CrossRef]
- Leyland, A.; Matthews, A. On the significance of the H/E ratio in wear control: A nanocomposite coating approach to optimised tribological behaviour. Wear 2000, 246, 1–11. [Google Scholar] [CrossRef]
- Hassani, S.; Bielawski, M.; Beres, W.; Martinu, L.; Balazinski, M.; Klemberg-Sapieha, J. Predictive tools for the design of erosion resistant coatings. Surf. Coat. Technol. 2008, 203, 204–210. [Google Scholar] [CrossRef]
- Zhang, S. TiN coating of tool steels: A review. J. Mater. Process. Technol. 1993, 39, 165–177. [Google Scholar] [CrossRef]
Figure 1.
Illustration of degradation damages on the surface of: (a) compressor blades, and (b) turbine blades. Reproduced with permission from [17]. ASME, 2006.
Figure 1.
Illustration of degradation damages on the surface of: (a) compressor blades, and (b) turbine blades. Reproduced with permission from [17]. ASME, 2006.

Figure 2.
Gas turbine engine degradation factors.


Figure 4.
Results from the Scopus database for “Solid particle erosion”, “Coating”, and “Gas turbine” from 1984 to 2019, where (a) is publications per year, and (b) is the overall percentage for each topic.
Figure 4.
Results from the Scopus database for “Solid particle erosion”, “Coating”, and “Gas turbine” from 1984 to 2019, where (a) is publications per year, and (b) is the overall percentage for each topic.

Figure 5.
The mechanism of solid particles erosion (SPE). Reproduced with permission from [40]. Elsevier, 1995.
Figure 5.
The mechanism of solid particles erosion (SPE). Reproduced with permission from [40]. Elsevier, 1995.

Figure 6.
GTE compressor blades, where (a) demonstrates a new blade, and (b) shows the blade after experiencing SPE [50].
Figure 6.
GTE compressor blades, where (a) demonstrates a new blade, and (b) shows the blade after experiencing SPE [50].

Figure 7.
Erosion rate dependency on particle impact energy and angle for mild steel and aluminium. Reproduced with permission from [54]. Elsevier, 2014.
Figure 7.
Erosion rate dependency on particle impact energy and angle for mild steel and aluminium. Reproduced with permission from [54]. Elsevier, 2014.

Figure 8.
Effect of impact angle on wear rate for four different iron matrices. Reproduced with permission from [55]. Elsevier, 2005.
Figure 8.
Effect of impact angle on wear rate for four different iron matrices. Reproduced with permission from [55]. Elsevier, 2005.

Figure 9.
Proposed sequence of SPE of ductile materials. Reproduced with permission from [56]. Elsevier, 1986.
Figure 9.
Proposed sequence of SPE of ductile materials. Reproduced with permission from [56]. Elsevier, 1986.

Figure 10.
Temperature elevation due to the angle of incidence of the solid particle. Reproduced with permission from [59]. Elsevier, 2002.
Figure 10.
Temperature elevation due to the angle of incidence of the solid particle. Reproduced with permission from [59]. Elsevier, 2002.

Figure 11.
SPE on a brittle material, where (a) illustrates the cracks formed on the surface after the solid particles impact, and (b) shows the cracking propagation. Reproduced with permission from [69]. Springer Nature, 2001.
Figure 11.
SPE on a brittle material, where (a) illustrates the cracks formed on the surface after the solid particles impact, and (b) shows the cracking propagation. Reproduced with permission from [69]. Springer Nature, 2001.

Figure 12.
Typical fracture types during indentation of brittle materials, where (a–e) shows the forms of cracks generated on the surface. Reproduced with permission from [31]. Elsevier, 2014.
Figure 12.
Typical fracture types during indentation of brittle materials, where (a–e) shows the forms of cracks generated on the surface. Reproduced with permission from [31]. Elsevier, 2014.

Figure 13.
Common impact deformation patterns noticed in the brittle material as a plastic reaction regime, where (a) shows the radial cracking that generated from the central impression and material removal, (b) illustrates a surface crack caused by the lateral fracture, and (c) demonstrates a surface crack caused by lateral fracture and partial removal of the plastic impression as a result of high particle velocity impact on the surface. Reproduced with permission from [70]. The Royal Society (UK), 1978.

Figure 14.
A schematic diagram showing brittle-ductile transition phases. Reproduced with permission from [78]. Springer Nature, 2004.
Figure 14.
A schematic diagram showing brittle-ductile transition phases. Reproduced with permission from [78]. Springer Nature, 2004.

Figure 15.
Typical SPE for ductile and brittle materials at different angles of impact. Reproduced with permission from [31]. Elsevier, 2014.
Figure 15.
Typical SPE for ductile and brittle materials at different angles of impact. Reproduced with permission from [31]. Elsevier, 2014.

Figure 16.
Particle materials and shapes used in experimental studies: (a) alumina [88], (b) silicon carbide [88], (c) quartz [89], (d) glass beads [90], (e) steel round grit [91], and (f) tungsten carbide [92]. Reproduced with permission from [82,83,84,85,86]. Elsevier, 2008, 2001, 2015, 2013, and 1999, respectively.

Figure 17.
Coated and uncoated compressor blades [129].
Figure 17.
Coated and uncoated compressor blades [129].

Figure 18.
The three most common PVD coating approaches, where (a) shows a vacuum deposition process [158], (b) illustrates a schematic drawing of the ion-plating method [159], and (c) demonstrates the physical sputtering processes [160]. Reproduced with permission from [160]. Elsevier, 2015.

Figure 19.
The E, H, α, and TOPSIS values of the top ten ranked coating materials.


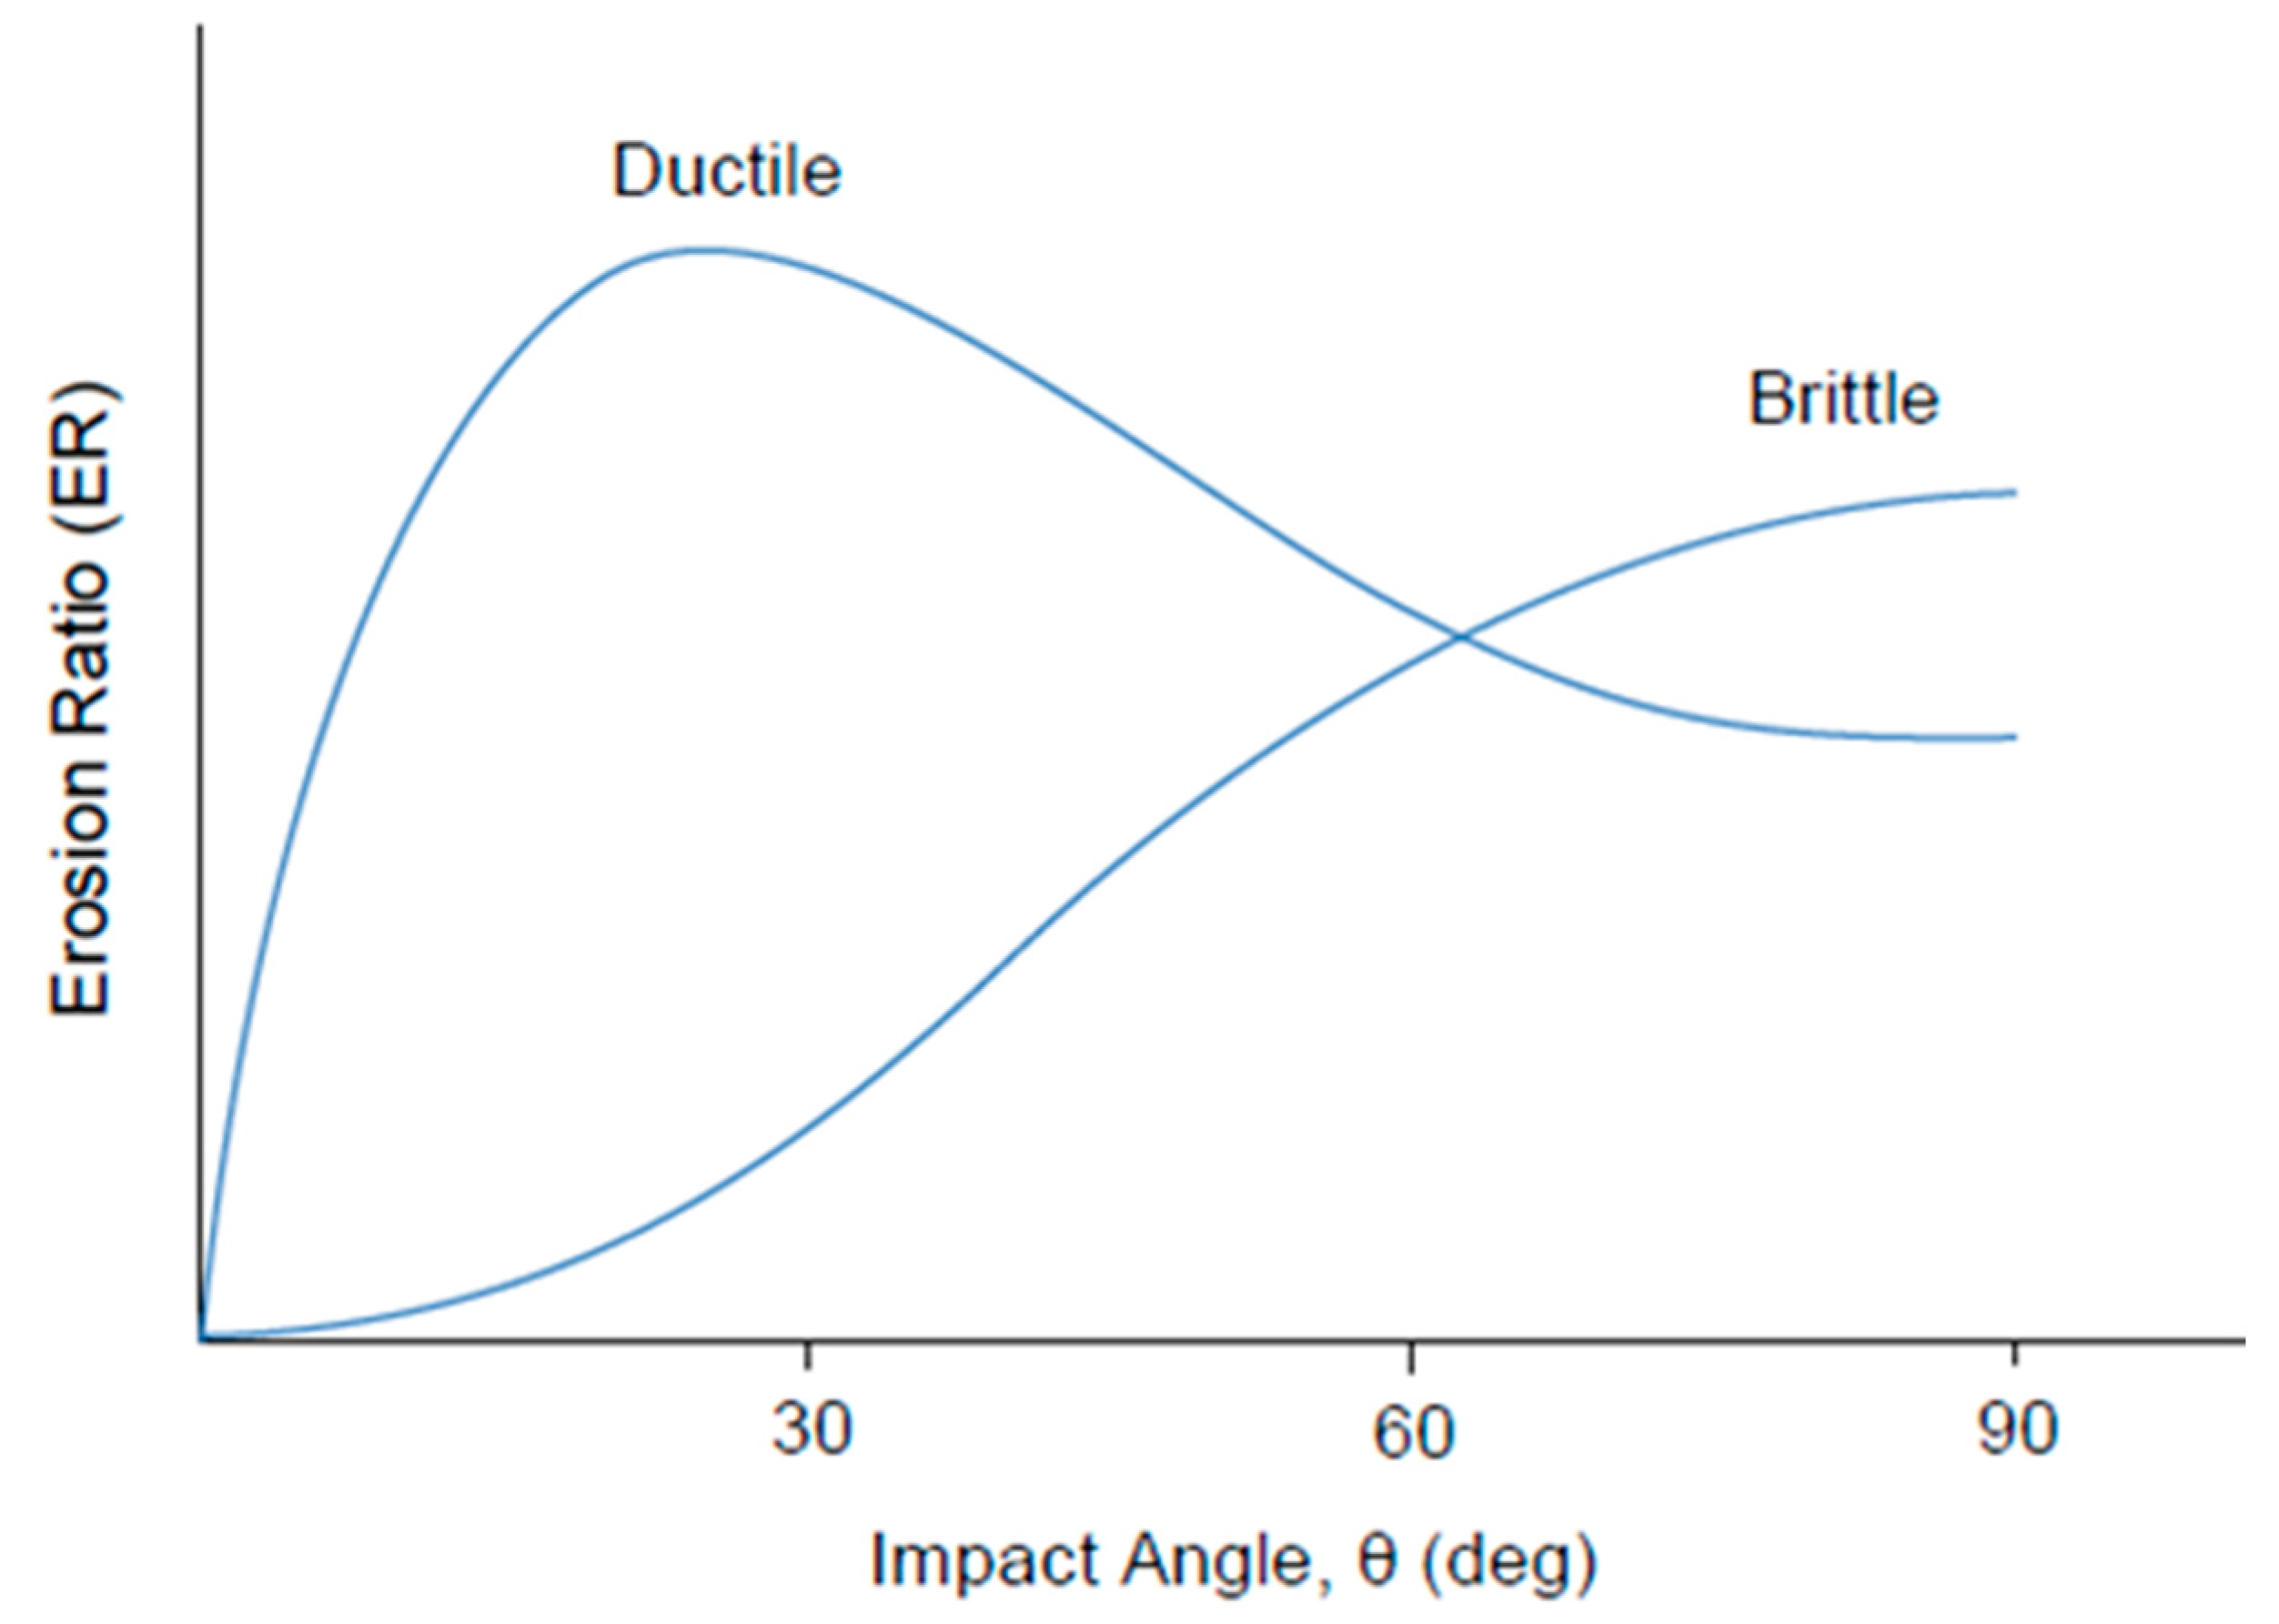
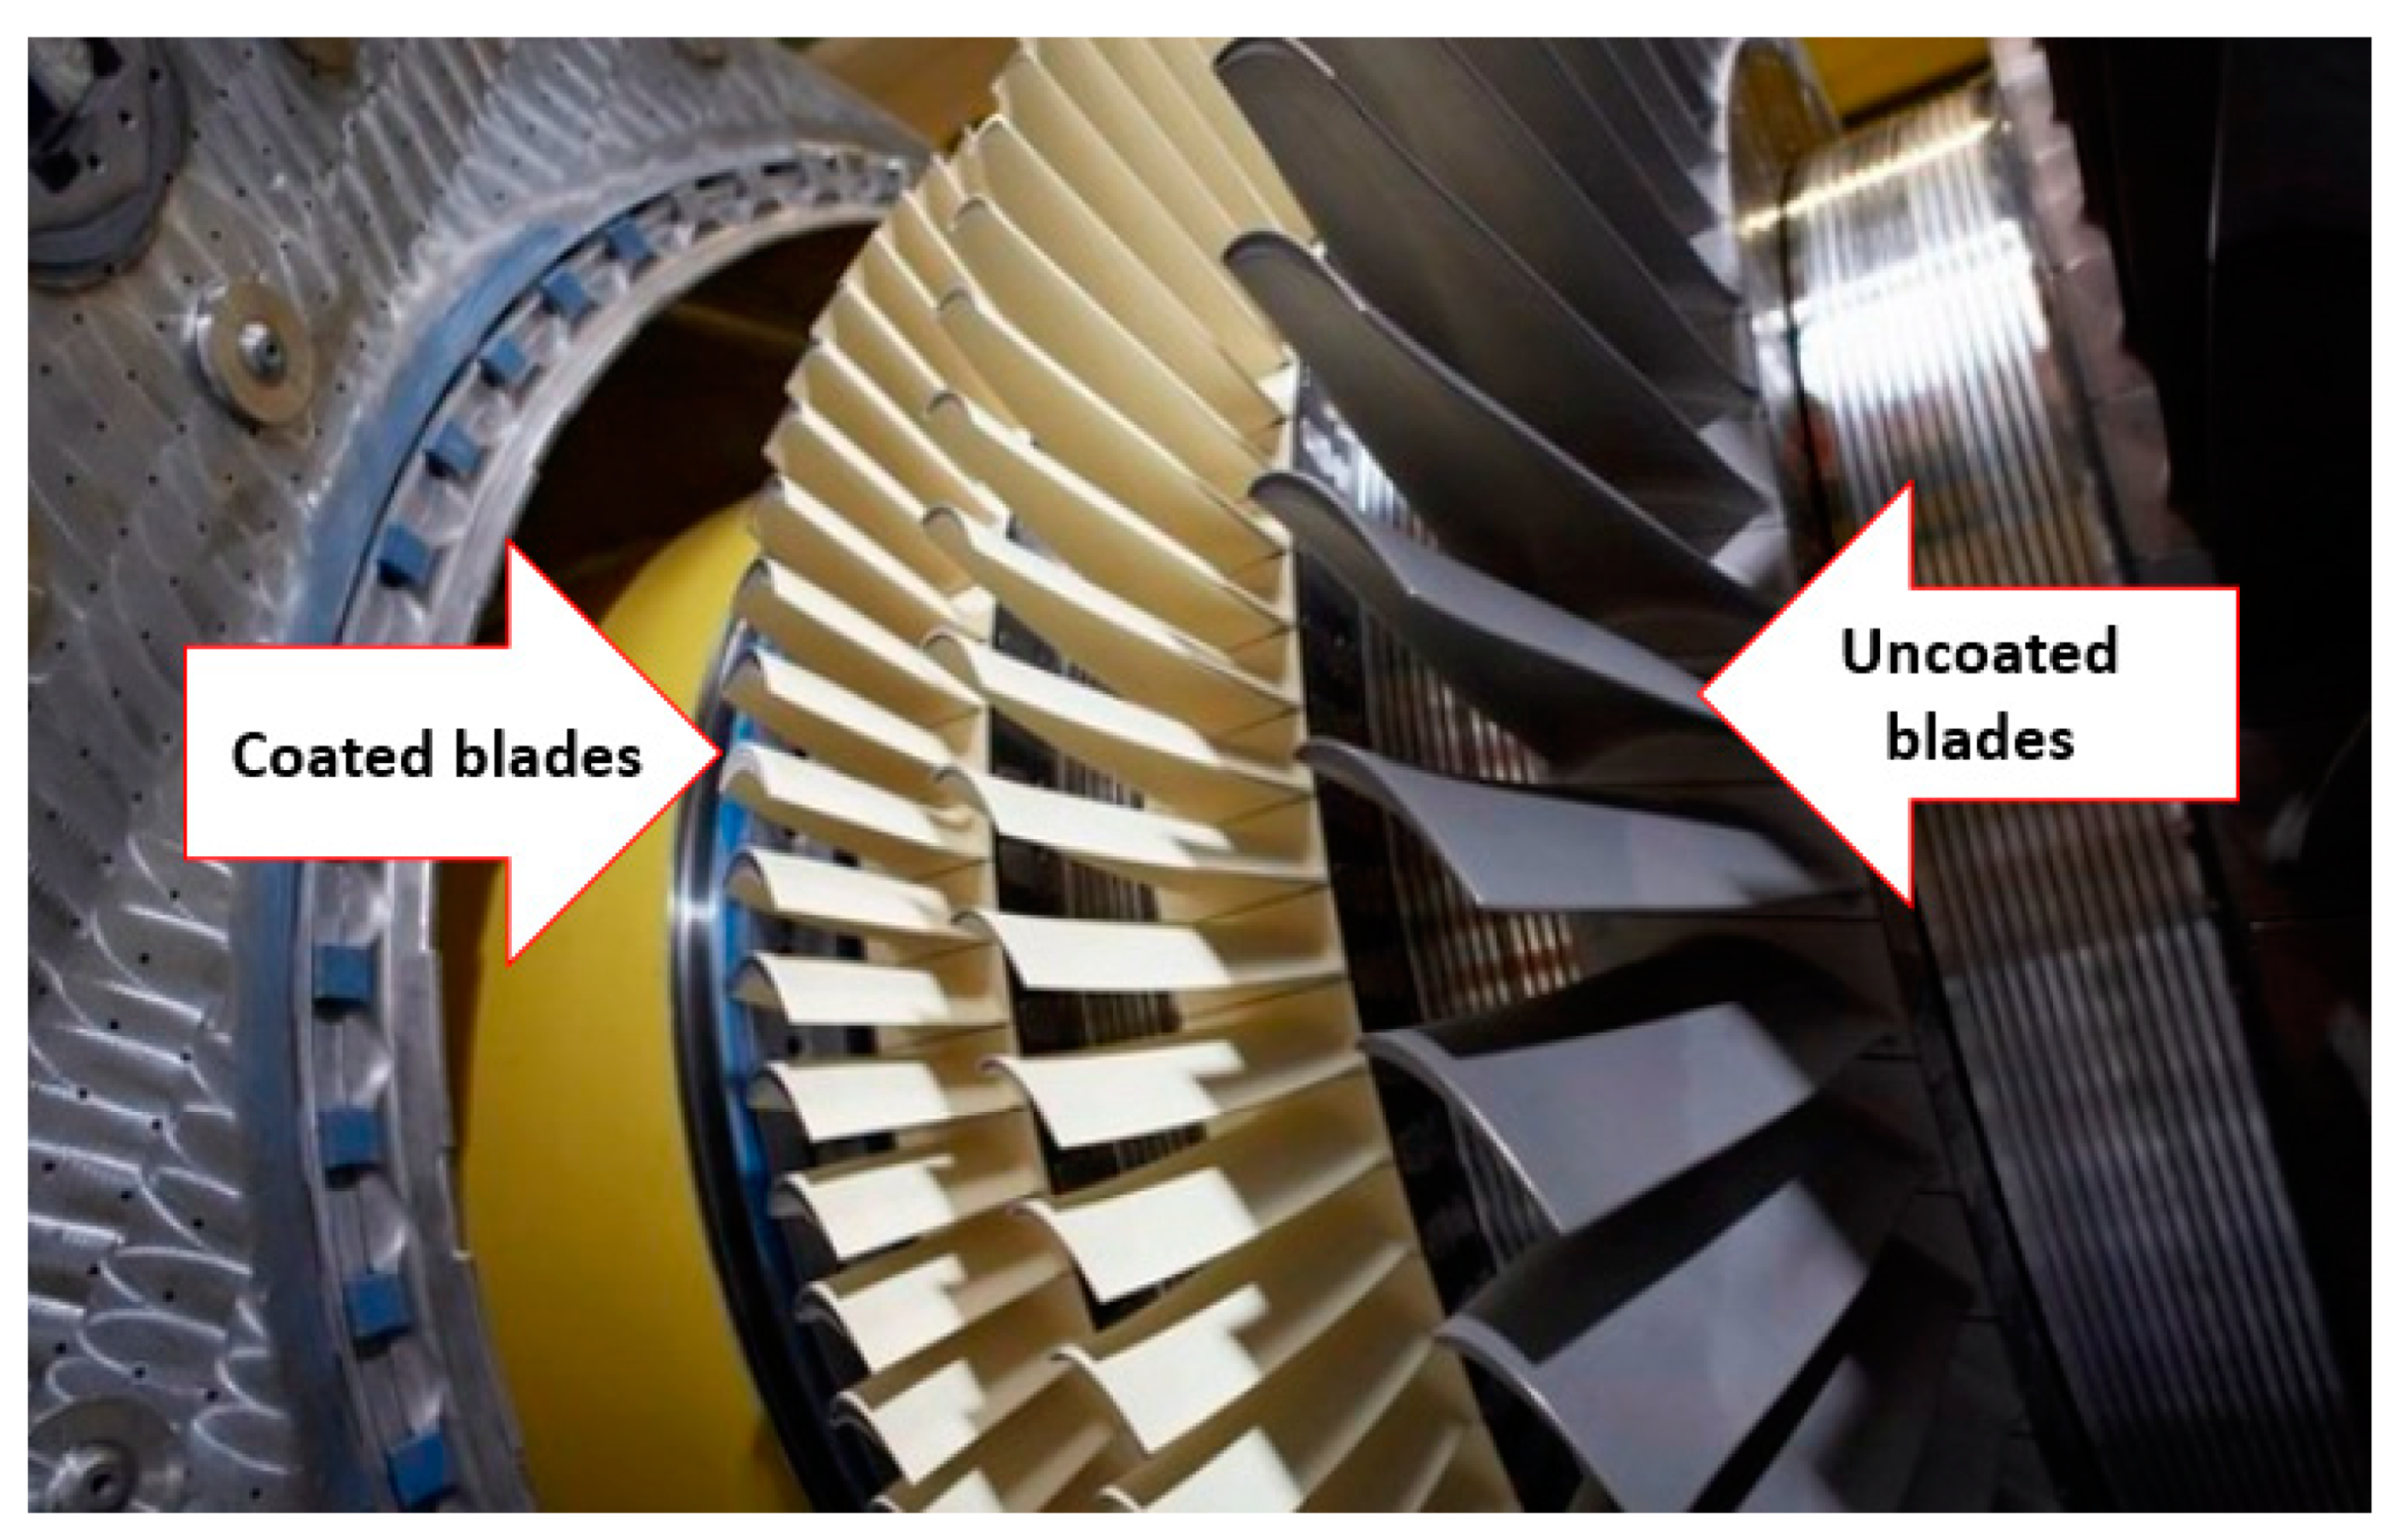
Table 1.
Example of the materials used in fabricating compressors blades.
| Material Type | Example | Application | Advantages | Disadvantages | References |
|---|---|---|---|---|---|
| Nickel based superalloys |
| Aerospace, marine, industrial and military gas turbine engines | Good mechanical properties, easy machinability, good strength properties and low material cost | High manufacturing cost | [13] |
| Titanium based superalloys |
| Aerospace and industrial gas turbine engines | Combine low densities with high strength, good weldability and high fatigue strength. | Limited by their operating temperature | [14] |
| Cobalt-based superalloys |
| Aerospace, marine and industrial gas turbine engines | The alloy retains their strength up to higher temperatures. They derive their strength greatly from a distribution of refractory metal carbides, good resistant to corrosion, not so sensitive to cracking under thermal shocks and suitable for parts that need to be rotate. | Not mechanically strong as nickel-based superalloys | [13] |
| Stainless steel |
| Aerospace, marine and industrial gas turbine engines. | Good corrosion resistance in dry environments. | Unsatisfactory corrosion resistance in wet environments (AISI 403 and 410), would suffer from thermal surface deformation in high temperatures conditions (e.g., jet turbines), can undergo pitting damages. | [15,16] |
| Degradation Mechanisms | Description |
|---|---|
| Erosion | Material removal by abrasion due to the impacts of hard, incompressible particles of, typically, a diameter greater than 10 µm on surfaces along the flow path. Modern, highly efficient, but more massive filtration systems have been introduced into industrial systems, and this problem is now predominantly one for aero-engines. |
| Corrosion | Caused by contaminants in both inlet air and fuel. Corrosion depends on the fuel used and is usually less for natural gas and increases the heavier the fuel oil, due to impurities and additives which produce aggressive deposits. Pollutants present in the inlet air can accelerate corrosion. |
| Hot corrosion | Reactive gases, mineral acids, and salts in the flow can chemically interact and cause both material deterioration and loss from exposed components in the flow path. There can also be high-temperature oxidation of the component due to chemical interaction with the surrounding hot gaseous environment. Separately, the products of these chemical processes can stick to exposed components as a film of scale. Oxide scale protection is then subjected to degradation if any surface damage (e.g., cracking) is caused during the thermal cycle. |
| Fouling | Results from particles in the flow adhering to exposed surfaces, resulting in material build up with increased roughness of the surface and even some change in aerofoil shape. Particles with the highest tendency for causing fouling are generally less than 2 µm in diameter. Typical examples are sea salts, carbon, oil or water mists, and smoke. |
| Foreign object damage | Usually generated by foreign objects in the gas and/or air streams which strike components in the flow path. These can enter via the inlet air or gas compressor, or even as a result of pieces that break off engine components. |
Table 3.
Key SPE equations available in the literature.
| Equation No. | Researchers | Model | Remarks |
|---|---|---|---|
| Equation (16) | Hamad et al. [46] | is mean angle of the compressor. | |
| Equation (17) | Finnie [30,53] | E = (sin (2α) sin2 (α)) for tan α ≤ E = () for tan α ≥ | The first cutting equation; assumes a solid particle is moving with known velocity and angle of impact striking a target surface of rigid plastic material. Where the equation parameters change according to the angle of impact α, is depth of contact to cut ratio, and k = 2 as a constant. |
| Equation (18) | Bitter [102,106] | Evp = Evc1 = . (V cos α- for α ≥ α0 Evc2 = for α ≤ α0 For the total erosion rate (cutting and deformation): E = Evp + Evc | Bitter’s equations provide better results at higher angles of impact than Finnie’s [30,53]. Four equations are presented. Where Evp and Evc1,2 are volume of surface material detached by deformation and cutting, respectively, is deformation factor, and e is the cutting wear element. |
| Equation (19) | Neilson and Gilchrist [87] | E = for α ˂ E = for α ˃ | Where Vr is residual particle velocity, X is factor of cutting, is deformation factor. |
| Equation (20) | Finnie [60] | E ( where = - | is particle’s influence in an idealised manner, and is particle horizontal velocity and is the moment of inertia of the particle about its center of gravity. |
| Equation (21) | Sheldon and Kanhere [107] | E | Where Hv is Vickers hardness of target (kg/mm2). |
| Equation (22) | Tilly [108] | E + | and is the velocity at maximum erosion rate, Vref is standard test velocity of particle, is fragmentation for test condition and is threshold velocity below which impact distortion is purely elastic and no damage takes place. |
| Equation (23) | Jennings et al. [109] | E | enthalpy of melting of target. |
| Equation (24) | Hutchings et al. [110] | E ( | This equation depend on the impact angle and particle velocity. |
| Equation (25) | Evans et al. [70] | E | is particle density, Kc is fracture toughness and Hs hardness of target material. |
| Equation (26) | Tabakoff et al. [111] | E ( sin | is the empirical constant, is a function of impact angle, et is the tangential restitution ratio, is the normal component, is the velocity of particles and is the impact angle |
| Equation (27) | Sundararajan [112] | E = ) = | Assumes that the plastic flow localisation below the particle accounts for erosion. Where represents the flow stress temperature constant, Cr is the heat capacity of the target, er is the restitution coefficient, is the strain hardening exponent, F(t) is the constant of several impacts, Hp and are particle hardness and density respectively, is the friction coefficient, is the maximum value of , and gp is radius of gyration of impacting particle. |
| Equation (28) | Chen et al. [83] | E | , is pressure-stress ratio, is dimensionless temperature and is a dimensionless strain rate. |
| Equation (29) | Nsoesiea et al. [113] | E = | Where C1 is a constant, d represents the particle diameter, Dp is particle density, Hs hardness of the target, and impacting angle correction factors (shifting coefficient) and (shifting exponent). |
is angle at which particle impacts on surface, α0 is value of which the horizontal velocity component slows to zero, d and r are diameter and radius, respectively, of impacting particle, is the minimum particle diameter for which erosion takes place, is velocity component normal to surface below which no erosion takes place, M is total mass of impinging particles, m is mass of individual impacting particle, P is pressure, is velocity of impacting particle.
| Physical Property | Equation Number | ||||||||||||
|---|---|---|---|---|---|---|---|---|---|---|---|---|---|
| 17 | 18 | 19 | 20 | 21 | 22 | 23 | 24 | 25 | 26 | 27 | 28 | 29 | |
| Cutting energy | ˟ | ˟ | |||||||||||
| cutting wear element | ˟ | ||||||||||||
| Deformation factor | ˟ | ˟ | |||||||||||
| Depth of contact to cut ratio | ˟ | ||||||||||||
| Dimensionless strain rate | ˟ | ||||||||||||
| Dimensionless temperature | ˟ | ||||||||||||
| empirical constant | ˟ | ||||||||||||
| Enthalpy of melting of target | ˟ | ||||||||||||
| Erosion resistance | |||||||||||||
| Flow stress temperature | ˟ | ||||||||||||
| Fracture toughness | ˟ | ˟ | |||||||||||
| Friction coefficient | ˟ | ||||||||||||
| Impact angle | ˟ | ˟ | ˟ | ˟ | ˟ | ˟ | |||||||
| Impacting particle kinetic energy | ˟ | ||||||||||||
| Incremental strain per impact | |||||||||||||
| Main stress | ˟ | ˟ | |||||||||||
| Mass of an individual particle | |||||||||||||
| Material fragmentation limits | ˟ | ||||||||||||
| Melting temperature | ˟ | ||||||||||||
| Minimum effective particle size | ˟ | ||||||||||||
| Particle density | ˟ | ˟ | ˟ | ˟ | |||||||||
| Particle hardness | ˟ | ˟ | |||||||||||
| Particle horizontal velocity | ˟ | ||||||||||||
| Particle mass | ˟ | ˟ | |||||||||||
| Particle roundness | ˟ | ˟ | |||||||||||
| Particle size | ˟ | ˟ | ˟ | ˟ | ˟ | ||||||||
| Particle velocity | ˟ | ˟ | ˟ | ˟ | ˟ | ˟ | ˟ | ˟ | ˟ | ˟ | ˟ | ||
| Particle velocity (residual component) | ˟ | ˟ | |||||||||||
| Pressure | ˟ | ||||||||||||
| Pressure-stress ratio | ˟ | ||||||||||||
| Reparation coefficient | ˟ | ||||||||||||
| Restitution coefficient | ˟ | ||||||||||||
| shifting coefficient | ˟ | ||||||||||||
| shifting exponent | ˟ | ||||||||||||
| Strain hardening | |||||||||||||
| Strain hardening exponent | ˟ | ||||||||||||
| Target density | ˟ | ˟ | |||||||||||
| Target gram molecular weight | ˟ | ||||||||||||
| Target hardness | ˟ | ˟ | |||||||||||
| Target heat capacity | ˟ | ||||||||||||
| Thermal conductivity | |||||||||||||
| Threshold velocity | ˟ | ||||||||||||
| Total mass | |||||||||||||
| Velocity at maximum erosion rate | ˟ | ||||||||||||
| Velocity components | ˟ | ||||||||||||
| Vickers hardness of target | ˟ | ||||||||||||
Table 5.
Example of some of the coating materials used for compressor blades.
| Coating Material Type | Advantages | Disadvantages | References |
|---|---|---|---|
| ZrN |
|
| [130] |
| Cr3C2 | • Erosion resistance enhances at 500 to 600 °C due to the formation of oxycarbonitrides on the surface. |
| [130] |
| WC-Co |
| • When formed using the cold spray method, the deposited layer cannot withstand extremely harsh operational environment. | [131] |
| TiN |
|
| [132,133] |
| TiN/Ti |
|
| [134,135] |
| TiN/CrN |
|
| [136] |
| Type | Process | Anti-Erosion Application |
|---|---|---|
| Thin hard films | PVD | Compressor blades, and brush seals |
| Diffusion | CVD | Protection of the turbine blades against the oxidation/corrosion |
| Dry film lubrication | Spray | Resistance to fretting wear of compressor blades |
| Thermal barrier system | Thermal spray, PVD | Coating for turbine combustor blades, cans and vanes |
| Wear resistance | Thermal spray | Coatings for turbine fans and stator blades |
Table 7.
Advantages and limitations of the film coating methods [143].
Table 7.
Advantages and limitations of the film coating methods [143].
| Coating Method | Advantages | Limitations |
|---|---|---|
| PVD | Thickness control; | Complicated and extensive equipment; |
| Large area coating | The coating on uniform samples | |
| CVD | Smooth coating process on a nonuniform substrate; | Complicated and extensive equipment; |
| Strong adhesion | High-temperature process | |
| Thermal spraying | Rapid coating; | High-temperature process; |
| Large specific area | Grain grows |
Table 8.
The three-key state-of-the-art PVD coating technologies for GTE compressor blades [161,162,163,164,165,166,167,168,169,170].
| Coating Method | Description | Advantages | Limitations |
|---|---|---|---|
| Vacuum deposition | The source material is vaporised and introduced to the substrate surfaces within a vacuum environment to apply the coating layer. This coating method can be employed to provide protective coatings for the following cases: (1) wear resistance; (2) corrosion; (3) electrically conducting films; (4) mirror coatings; etc. |
|
|
| Ion plating | A high energy particle flux is applied to the deposition film and substrate surface, enough to change the substrate and/or film properties. |
|
|
| Sputtering | Particle bombardment of a material results in a vapour and can be used to deposit an anti-erosion layer on a target. |
|
|
© 2020 by the authors. Licensee MDPI, Basel, Switzerland. This article is an open access article distributed under the terms and conditions of the Creative Commons Attribution (CC BY) license (http://creativecommons.org/licenses/by/4.0/).
Share and Cite
MDPI and ACS Style
Alqallaf, J.; Ali, N.; Teixeira, J.A.; Addali, A. Solid Particle Erosion Behaviour and Protective Coatings for Gas Turbine Compressor Blades—A Review. Processes 2020, 8, 984. https://0-doi-org.brum.beds.ac.uk/10.3390/pr8080984
AMA Style
Alqallaf J, Ali N, Teixeira JA, Addali A. Solid Particle Erosion Behaviour and Protective Coatings for Gas Turbine Compressor Blades—A Review. Processes. 2020; 8(8):984. https://0-doi-org.brum.beds.ac.uk/10.3390/pr8080984
Chicago/Turabian StyleAlqallaf, Jasem, Naser Ali, Joao A. Teixeira, and Abdulmajid Addali. 2020. "Solid Particle Erosion Behaviour and Protective Coatings for Gas Turbine Compressor Blades—A Review" Processes 8, no. 8: 984. https://0-doi-org.brum.beds.ac.uk/10.3390/pr8080984
Note that from the first issue of 2016, this journal uses article numbers instead of page numbers. See further details here.