Recent Development of Microfluidic Technology for Cell Trapping in Single Cell Analysis: A Review


1
Institute for Energy Research, Jiangsu University, Zhenjiang 212013, China
2
Research Center for Fluid Machinery Engineering and Technology, Jiangsu University, Zhenjiang 212013, China
3
School of Energy and Power Engineering, Lanzhou University of Technology, Lanzhou 730050, China
*
Author to whom correspondence should be addressed.
Processes 2020, 8(10), 1253; https://0-doi-org.brum.beds.ac.uk/10.3390/pr8101253
Submission received: 5 August 2020
/
Revised: 25 August 2020
/
Accepted: 28 September 2020
/
Published: 5 October 2020
(This article belongs to the Section Biological Processes and Systems)
Abstract
:Microfluidic technology has emerged from the MEMS (Micro-Electro-Mechanical System)-technology as an important research field. During the last decade, various microfluidic technologies have been developed to open up a new era for biological studies. To understand the function of single cells, it is very important to monitor the dynamic behavior of a single cell in a living environment. Cell trapping in single cell analysis is urgently demanded There have been some review papers focusing on drug screen and cell analysis. However, cell trapping in single cell analysis has rarely been covered in the previous reviews. The present paper focuses on recent developments of cell trapping and highlights the mechanisms, governing equations and key parameters affecting the cell trapping efficiency by contact-based and contactless approach. The applications of the cell trapping method are discussed according to their basic research areas, such as biology and tissue engineering. Finally, the paper highlights the most promising cell trapping method for this research area.
1. Introduction
In the past decade, single cell analysis has received significant attention from the research community due to its wide applications in pharmaceutical [1], biology [2], healthcare [3] and tissue engineering [4]. Many studies have shown that individual cells, even those that are identical in morphology, exhibit intercellular variations due to differences in their micro-environmental conditions and gene expression [5,6]. Previous cell analysis was performed based on a large population of cells, which reflected the average values derived from the bulk cell response [7]. The bulk cell analysis approach ignored the characteristics of individual cells. The limitations of bulk cell analysis have motivated the development of single cell analysis. In contrast to the bulk cell analysis, single cell analysis reveals the significant physiological characteristics of an individual cell, such as metabolism [8], protein level [9] and gene expressions [10].
Progresses in single cell analysis depend on the development of tools and equipment which allow new insights into the cell. Since the invention of the microscope, single cell analysis has been successfully carried out. Many new illumination, staining, and detection methods, such as flow cytometry [11], have been developed in order to increase the optical resolution of the microscope to observe the behavior of single cell [12]. With these methods, single cell analysis has become feasible. However, the conventional methods of observing single cell have limited the performance in terms of standardized reproducibility and high throughput, since the accuracy of a traditional single cell analysis result strongly depends on the skill level of the experimenters. A microfluidic system can provide a solution to this bottleneck, allowing for carrying out single cell analysis precisely.
Since the last few decades, the cutting-edge technology of microfluidics has been adopted for cell trapping and isolation [13,14]. Microfluidics, with the great advantage of the extremely small volume, has been utilized for carrying out single cell assays. The dimension of microchannel is the same order of magnitude as the cell size, therefore facilitating researchers to achieve many operations in the field of bio-analytical and chemistry, such as drug screening [15,16], cellular analysis [17,18], cell trapping [19,20] and biological molecular analysis [21]. With the help of Lab-on-a-chip technology and other physical/chemical units, high-throughput single cell analysis can be achieved. In addition, the transparency of a microfluidic device enables the optical observations of the dynamic process of the cells. In particular, the microfluidic device can mimic the sophisticated in vivo environment, which is important for the effective prediction of cell behaviors [22,23].
Generally, cell trapping by using microfluidic devices can be categorized into contact-based and contactless approaches. The contact-based approach refers to the cell contacts with the trap region during the capture process. There are some fundamental approaches, including capillary-based trapping in nanoliter microchambers devices [24,25,26,27], sedimentation-based trapping devices [28,29], inertial-based trapping devices [30,31] and microvalve-based devices [32,33]. It does not require external energy; it only relies on the hydrodynamic force. The contactless approach refers to the cell has no contact with the trap region during the capture process. However, it requires external energy such as electric fields and magnetic fields. Typical contactless trapping approaches include dielectrophoresis trapping [34,35], gel trapping [36], magnetic trapping [37,38], acoustic trapping [39,40] and laser trapping [41,42]. Specific cell trapping in microfluidic systems could be especially significant for separation methods which can cover many biological use, even larger that the item they selected such as bacteria cells and blood cells [43,44,45].
This review will highlight recent advances in the development of contact-based and contactless cell trapping techniques in single cell analysis, using microfluidic devices. Basic theories and mechanisms of various cell trapping techniques will also be provided in this work.
2. Contact-Based Approaches for Cell Trapping
Hydrodynamic Trapping
Hydrodynamic trapping is a method which makes use of mechanical obstacles to separate the target cells from the continuous phase [46]. The general principle relies on controlling the relative fluid flow between a trap and a bypass channel [47]. The mechanism of cell trapping can be explained by the Lagrangian approach. The forces exerted on the cell, including Stokes drag, the pressure gradient, diffusive, spring elastic and gravitational forces. The formula can be expressed as follows [48]:
where is the particle response time to changes in the flow field, and is the density ratio between the fluid and the particle. represents Brownian random force, and represents spring force. The embedded obstacles play an important role in changing the external forces exerted on the cells, such as Stokes drag and pressure gradient forces.
Once target cells are trapped in hydrodynamic trapping locations, they can be further employed for various studies. Typically, cell trapping obstacles include walls or pores with various shapes, and arrays consisting of a pattern of the trapping obstacles can be used to realize cell trapping. The development of microfluidic device has driven the evolution of various hydrodynamic trapping devices.
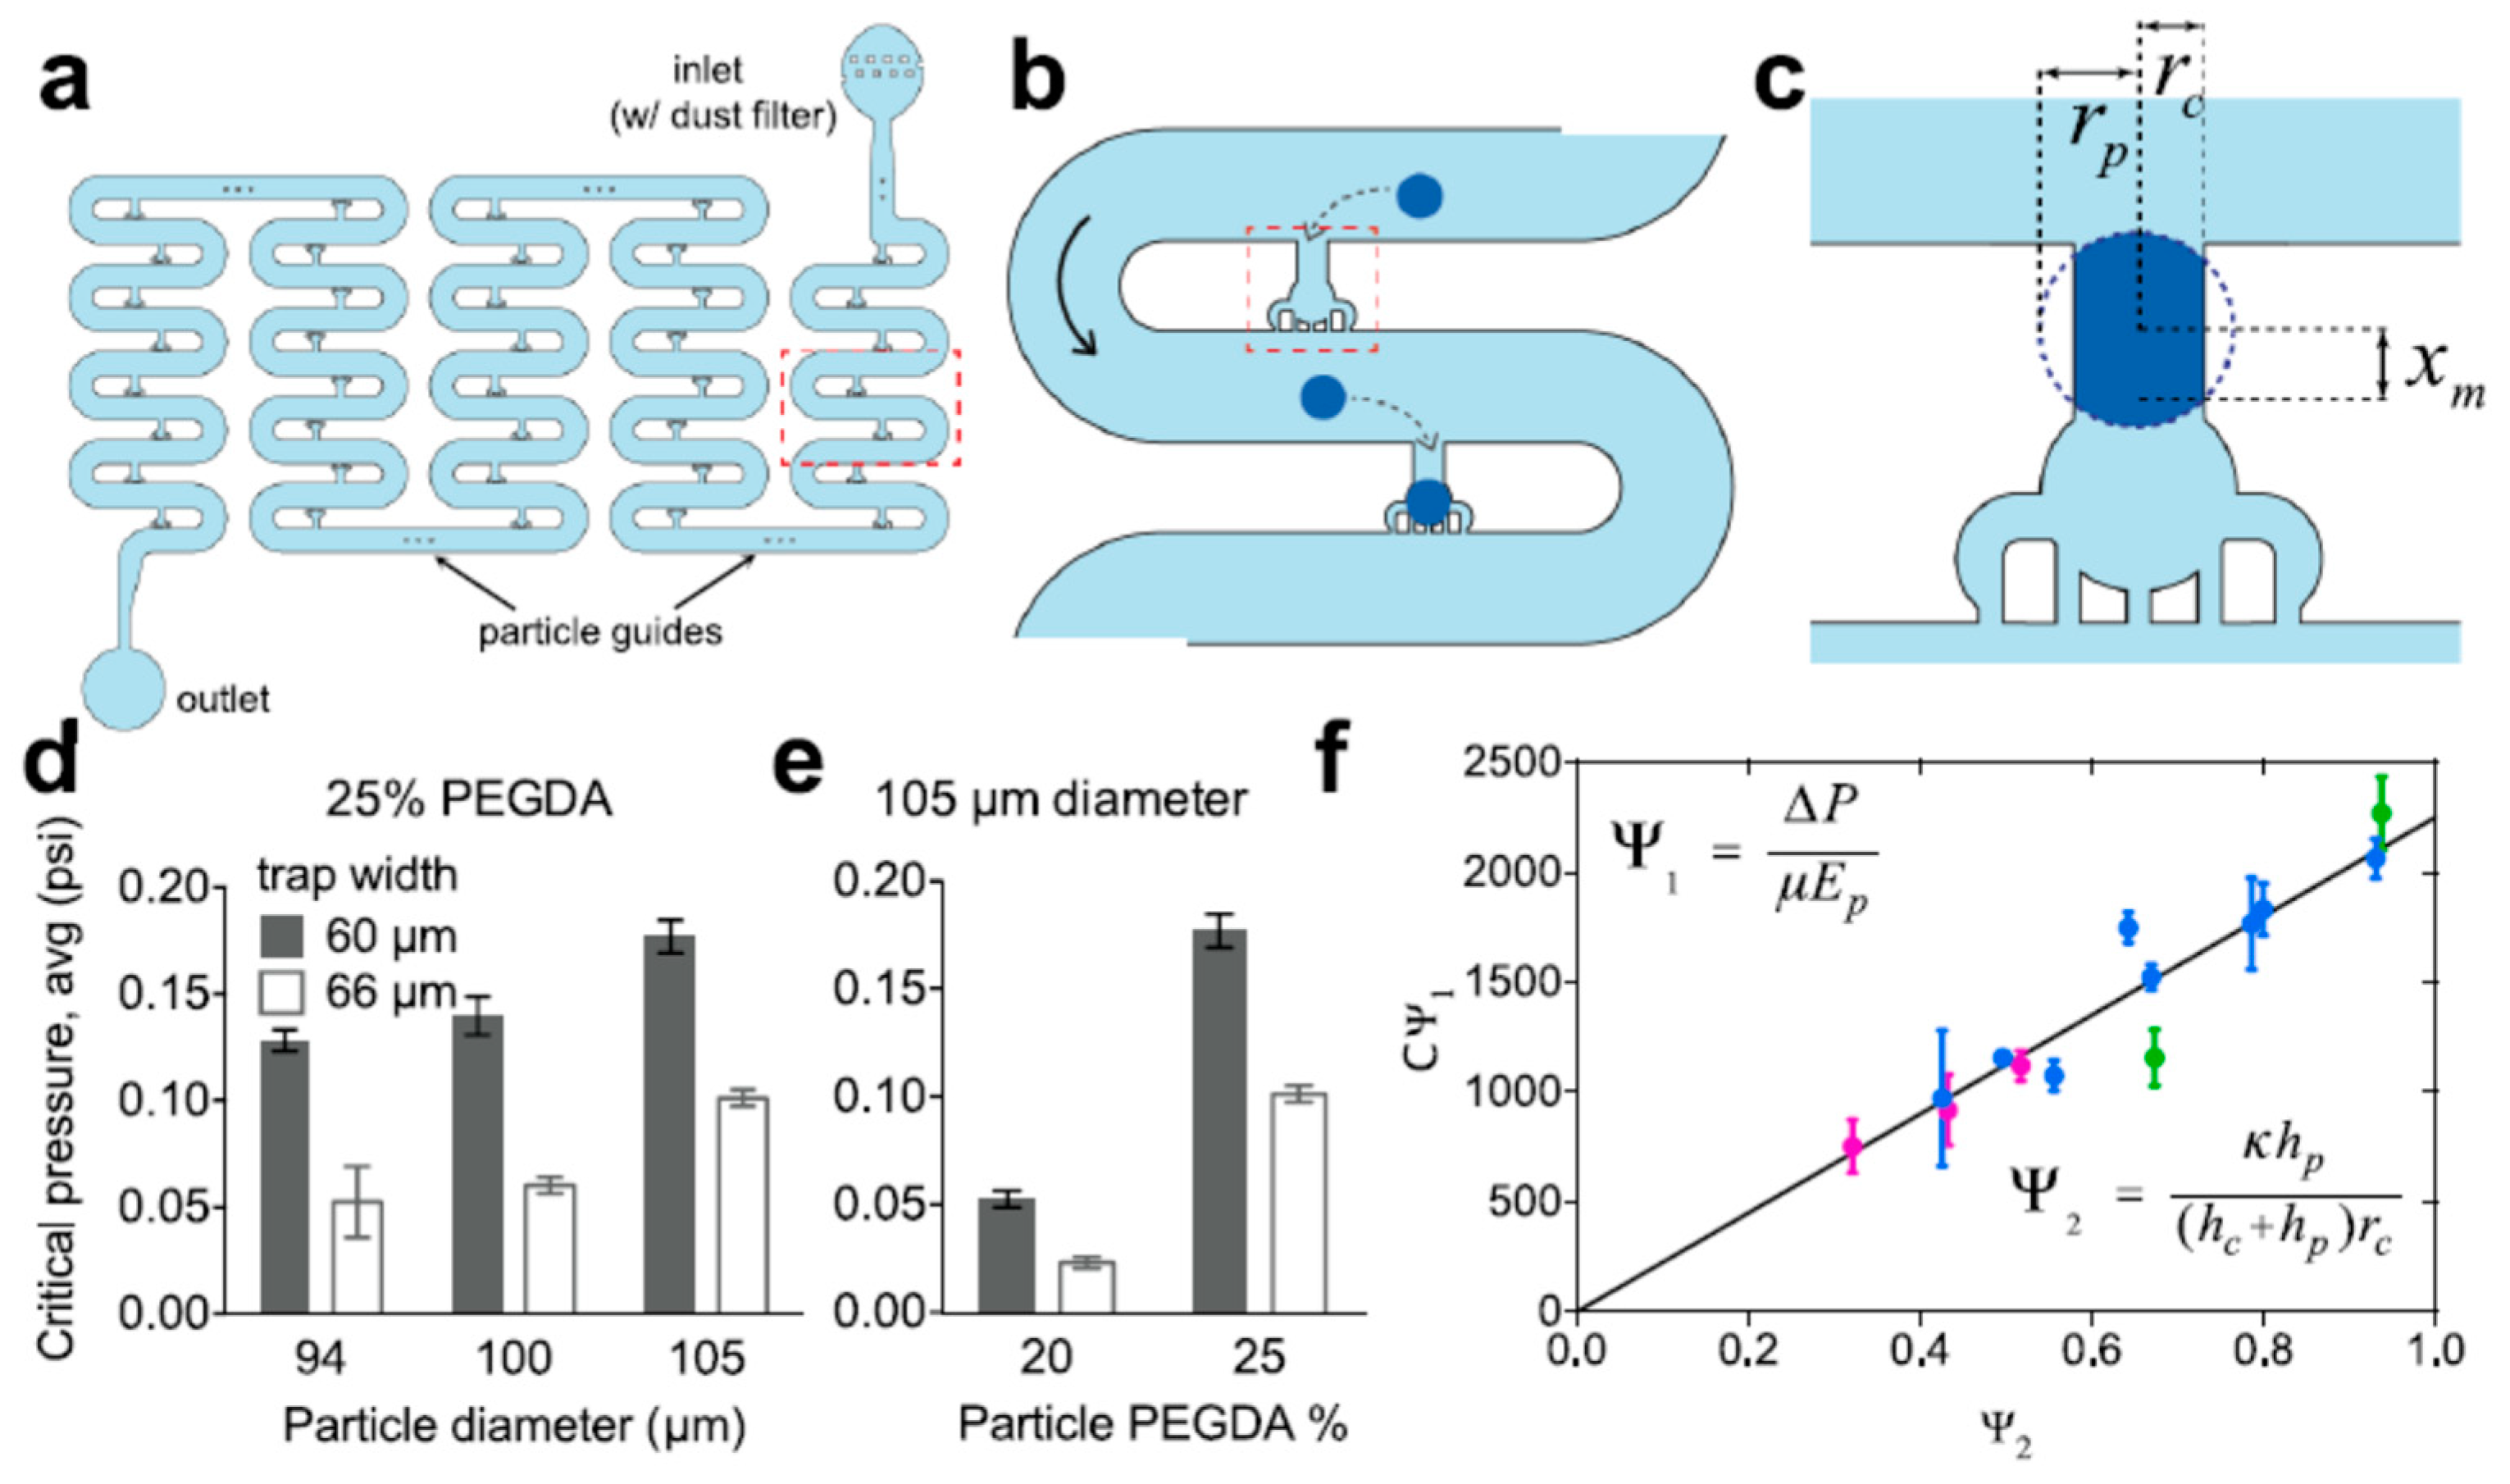
Chen et al. [49] designed an integrated microfluidic device for particle arrangement and isolation (Figure 1). The device was able to selectively immobilize desired microparticles in an array of hydrodynamic traps based on three different physical characteristics: size, elastic modulus and internal structure. A scaling theory based on particle and trap dimensions, particle elastic modules and applied pressure was also developed to define the criterion for particle parking. Moreover, rp represents the radius of the particle, rc represents the half width of the trap entrance, xm represents the height (as shown in Figure 1c), represents the friction coefficient between the flow channel and the particle, and ; additionally, hc and hp represent channel height and particle height, respectively. C is a correction factor, representing the deformation of flow channel. Critical pressure indicates that, at a certain pressure, the trapping process can be realized. The trapping process can be achieved, considering the particles with different sizes and stiffness. The isolation efficiency can reach as high as 95%. This setup can be potentially employed in trapping soft and biological objects.
Zhu et al. [50] presented a proof-of-concept microfluidic device for the immobilization, culturing and imaging of zebrafish embryos. The schematic illustration and actual photo of their microfluidic device are shown in Figure 2. The device consisted of a flat glass substrate and two layers of polydimethylsiloxane (PDMS) structures replicated from 3D-printed masters. An embryo-culturing channel and five traps were embedded at the bottom PDMS layer to load and capture embryos. The working procedure is as follows. The first step is to induce embryo through the embryo inlet. The second step is to insert the PTFE (polytetrafluoroethylene) plug to avoid the leakage of working fluid. The third step is to introduce working fluid into the device by a syringe pump. The fourth step is to tilt the device slightly, to enable embryo trapping function to trap embryos one by one. The shear stress on the immobilized embryos was estimated by using the Computational Fluid Dynamics (CFD) simulations [51]. This device could be potentially applied to monitor the development of dynamic embryonic.
Fan et al. [52] designed a microfluidic device, using flow resistance, to achieve high-efficient single-cell capture and analysis. A schematic illustration of their microfluidic device is shown in Figure 3a. Each single cell was encapsulated in a micro-droplet that was formed at the T-junction (Figure 3b). The micro-droplets at the beginning moved in the main channel at certain approximate velocity; however, once a micro-droplet was blocked in the main channel of a “main-bypass” structure unit, the rest of the micro-droplets would travel through the bypass channel into the subsequent “main-bypass” unit and another droplet would also be trapped (Figure 3c). This trapping process would repeat itself and continue. After that, the trapped cell could be further observed and analyzed (Figure 3d). The cell trapping efficiency of this device was up to 60% by controlling the injection process.
Similar to the design of Fan et al., Xu et al. [53] developed a microfluidic device with double-slit arrays, as shown in Figure 4a. The microfluidic device consisted of an inlet reservoir, support and disperse pillars, micro-array, outlet channel and outlet reservoir. The double-slit structure of micro-array is shown in Figure 4b. The effects of different combinations of flow velocity, the fluid pressure and the stress of cells on the cell trapping efficiency were also investigated, in detail, in their work. This is the inheritance of previous work, which found that the double-slit arrays perform better compared to single-slit and seamless structure [54]. The geometric effect was employed to optimize the stress that cells suffered. The trapping efficiency was found to be dependent on the flow velocity, the fluid pressure and the equivalent stress of cells. The trapping efficiency was up to 70%.
Zhu et al. [55] also developed a microfluidic device for cell trapping based on hydrodynamic method. For the first step, they tested the capabilities of cell trapping in three types of microstructures, as shown in Figure 5a. In these three designs, their gaps were embedded at different locations around the pillars. It was found that the microstructure of type C was the most efficient in cell trapping, as shown in Figure 5a(ii). The blue bar and red bar represent the trapping efficiency without reversed flow and with reversed flow. The trapping efficiency of type C with reversed flow is about 90%, which is much higher than that of type A and type B. After that, a face-to-face heart-shaped microstructure was developed to carry out cell trapping, using type C structure (Figure 5b). Oil was employed in the isolate chambers, to reduce cross-talk. To study the trapping mechanism, numerical simulation work was carried out so as to obtain the flow velocity and shear stress through the pillars. A shadow area with relatively low flow velocity was obtained behind the pillar. The finding supported the hypothesis that the cell could be trapped behind the pillar. The efficiency of cell trapping and cell pairing were 93% and 84%, respectively. The height of the gap and the height of the pillar were modified in the numerical simulation, to investigate their effect on the efficiency of cell pairing.
3. Contactless Approaches
3.1. Dielectrophoresis (DEP) Actuated Cell Trapping
Dielectrophoresis (DEP) is an effective way to realize cell trapping in microfluidic devices. The principle of DEP actuated cell trapping is to employ the DEP force imposing on a dielectric particle/cell. In a non-uniform electric field, the strength of DEP force is strongly dependent on the magnitude and polarity of the charges induced on a particle/cell. The DEP force can be expressed as follows:
where , a, f, E and represent the permittivity of the medium, radius of cell, frequency, electric field strength and conductivity, respectively.
Aslan and Kulah [56] designed a portable microfluidic DEP device to realize DEP actuated cell trapping and CMOS (Complementary Metal Oxide Semiconductor) imaging function. The manufacturing process of their microfluidic DEP device is shown in Figure 6. RIE is short for Reactive-Ion Etching. To realize the CMOS imaging function, glass was employed as the substrate due to its transparency characteristic. The channel was made of parylene material on account of its advantages of biocompatibility and bio-stability. AC (Alternating Current) signal was applied on the electrodes of microfluidic DEP device to achieve MCF-7 (Michigan Cancer Foundation-7) breast cancer cell trapping. The proposed DEP device could be potentially used where equipment is limited. The counting accuracy was up to 90%, as reported in the paper. It was dependent on the conductivity and angular frequency of the electric field.
Takeuchi et al. [57] developed an electro-active micro-well array with barriers (EMAB) to realize highly efficient single cervical cell trapping. The schematic illustration of the EMAB device is shown in Figure 7. The patterned electrodes were embedded at the bottom of cell-sized micro-wells to achieve cell trapping. The cell could be trapped in the micro wells by applying a sinusoidal electric potential (peak to peak voltage, Vpp = 5 V at 1 MHz) to the electrodes. With the help of barriers located beside the micro-well, cell holding can be realized even after shutting off the DEP, as shown in Figure 7a. The actual image of the EMAB microfluid device is shown in Figure 7b. As shown in the yellow region of Figure 7b, the microfluidic channel consisted of many microwells and barriers. Each microwell contained a pair of ITO electrodes at the bottom to achieve cell trapping and holding functions. The microfluid device could be employed for cell trapping, staining and imaging (Figure 7c). The cell trapping efficiency was up to 92%, which was determined by the permittivity of the medium, radius of cell, frequency, electric field strength and conductivity.
Puri et al. [58] presented a C-serpentine microchannel to achieve the trapping and separation of live and dead yeast cells (Saccharomyces cerevisiae) through DEP. The schematic illustration of the geometry is shown in Figure 8a,b. The C-serpentine geometry was employed to generate a gradient distribution of the electric field. To specify the electric distribution in the geometry, a yeast structure with multi-shell model was employed. The model consisted of three concentric layers of wall, membrane and nucleus (Figure 8c). Due to the differences in the electric conductivity of the cell membrane, the live and dead yeast cells would be driven to pDEP and nDEP region, respectively (Figure 8d). An average trapping efficiency of 97.9% for dead cells and 93.4% for live cells was obtained, which was determined by the applied voltage.
Fritzsch et al. [59] demonstrated contactless cell trapping with the octupole technology, using DEP. This technology can be applied in the miniaturized octupole cytometry. Compared with traditional cytometry approach, the proposed approach could trap the targeted cells for further analysis. To investigate the trapping efficiency of single cell, three different octupole nDEP field control modes were employed, including ACB (non-rotating octupolar field), ACC (non-rotating quadrupolar field) and ROTX (rotating quadrupolar field). It was found that cells could be efficiently trapped under ROTX mode. Contactless cell trapping was realized by using the octupole technology, which was independent of cell size and morphology.
Chen et al. [60] reported a microfluidic chip for trapping Shewanella oneidensis bacteria at the cell level, using positive DEP (pDEP) effect. The schematic illustration of the experimental setup was provided in Figure 9. The bacteria were first injected into the microfluidic chip, using a syringe pump. HEPES (4-(2-hydroxyethyl)-1-piperazineethanesulfonic acid) is a zwitterionic sulfonic acid buffering agent. As the bacteria traveled in the microchannel, the trapping process could be captured by a fluorescence microscope combined with a CCD (charge-coupled device) camera. This device demonstrated the possibility in trapping bacteria at the cell level.
3.2. Magnetophoresis Actuated Cell Trapping
Magnetophoresis is another effective way to realize cell trapping in microfluidic channels. The principle of magnetic actuated cell trapping is to apply magnetic force on a particle/cell. This kind of trapping method can be further classified into positive and negative magnetophoresis. Positive magnetophoresis is the migration of magnetic particle/cell in a diamagnetic medium, while negative magnetophoresis is in a magnetic medium [61]. In addition, if the susceptibility of the particle/cell is larger than the ambient medium, positive magnetophoresis would also occur. The magnetic force imposing on a particle suspended in a fluid medium is as follows:
where V is the volume of the particle, is the magnetic susceptibility, is the susceptibility of the surround medium, is the magnetic permeability of the air and B is the magnetic flux density.
Scherr et al. [62] developed a two-magnet microfluidic setup to achieve high efficiency trapping for biofluids. In this configuration, the trapping process was realized by using two magnets instead of one magnet. The experimental bead distributions in a stationary tube are shown in Figure 10. Under the configuration of one magnet, the bead dispersed along the one side wall only. However, in the presence of the second magnet, the bead dispersed along both sides of the wall. The interaction area between the beads and fluids was much larger than that in the single magnet configuration, and the bead volume fraction was found to increase three times, compared with the one-magnet system. The bead volume fraction was determined by magnetic field.
Kirby et al. [63] performed cell separation and trapping, using the magnetic force and centrifugal force. These two forces were employed in a centrifuge–magnetophoretic microfluidic device. There were six chambers embedded in the disk-shaped device. Three magnets were located besides each chamber. As the disk rotated, the centrifugal force was introduced. The combination of magnetic force and centrifugal force resulted in the separation and trapping of particles/cells of different sizes. This centrifugal microfluidic platform could be used for the separation and trapping of blood cells and tagged cancer cells.
Guo et al. [64] developed a magnetic controlled microfluidic device to trap magnetic tagged Salmonella typhimurium (Figure 11). In this microfluidic device, sample stream and buffer stream were injected into the microflow channel. The magnetic tagged Salmonella typhimurium was separated because of the lateral magnetic force. The separated Salmonella typhimurium was led toward the patterned nickel array for trapping. For the cell trapping using positive magnetophoresis technique, the major difficulty was the accumulation of magnetic particles/cells into a cluster. The formed cluster would block the microflow channel. To solve this problem, researchers tried to regulate the gradient of magnetic field. The trapping efficiency was affected by the magnetic force and the drag force.
Huang et al. [65] embedded a microwell in a microfluidic device, to achieve immunomagnetic single cell trapping function (Figure 12). A layer consisting of microwells was embedded between the microchannel and the magnet. Due to the presence of the microwell, uniform distribution of the magnetic field in the microfluidic device could be achieved. The single-particle trapping efficiency in the microwell can be up to 62%, and the purity can be up to 99.6%. The immunomagnetic labeled THP-1 cell was employed to demonstrate the feasibility of the microfluidic device. The trapping efficiency was supposed to be affected by the magnetic susceptibility of Dynabeads occupying the microwell.
If the susceptibility of the particle/cell is smaller compared to the ambient medium, negative magnetophoresis will occur. Hejazian and Nguyen [66] reported a new trapping method for the size-selective non-magnetic particles. The diluted ferrofluid was employed as the working fluid. The schematic illustration of the microchannel is shown in Figure 13a. Two arrays of magnets were embedded at the two opposite sides of a straight microchannel. The minimum and maximum of the simulated magnetic field were labeled dark blue and light blue, respectively. Figure 13b shows the experimental trapping results of small particles and large particles at the magnetic field maxima and minimum. The red spots stand for the small particles, while the green spots stand for the large particles. The physics behind the phenomena were illustrated by the combination of three kinds of forces, namely hydrodynamic force, negative magnetophoretic force and magnetoconvective force (Figure 13c). The trapping efficiency was determined by three kinds of forces, namely negative magnetophoretic, magnetoconvective and hydrodynamic forces.
Wang et al. [67] employed micro-magneto-fluidic technique to trap the bacteria suspending in flowing fluid (Figure 14a). Thermal bonding technique was employed to build the microfluidic channel using poly(methyl methacrylate) (PMMA). An island was embedded at the center of the microchannel as shown in Figure 14b. The magnetic nanoparticles in the ferrofluid were magnetite (Fe3O4). The polybeads were employed to predict the behavior of bacteria due to their similar size. The trapping behavior under the combination of ferrofluid and magnetic field is shown in Figure 14c. The variation in (x, y) coordinate of trapped bacteria with time under applied magnetic field is shown in Figure 14d. The effects of applied magnetic field, duration of application of magnetic field and fluid flow rate on the trapping efficiency were investigated systematically.
Instead of placing multiple pairs of magnets along a straight flow channel [68], Zhou et al. [69] placed the magnet near a T-junction microchannel (Figure 15a). The magnet was placed along the centerline of the main branch of T-junction. The flow direction was indicated by the blue color. The diamagnetic particles were trapped along the side wall of the main branch, while magnetic particles were trapped along the wall of side branch, indicating the existence of negative and positive magnetophoresis (Figure 15b). A 3D numerical model was developed to simulate the trapping procedure. The effect of ferrofluid was found to be important.
Wilbanks et al. [70] investigated the effects of magnet asymmetry on the trapping performance of diamagnetic particle in ferrofluid flow. The magnetic configuration is shown in Figure 16a. The asymmetric magnets were embedded at two sides of the microflow channel, to realize trapping function (Figure 16b). The dimensions of the microchannel with the magnets were provided in Figure 16c. Under the influence of magnet asymmetry, a circular streamline shape of trapping particles was obtained, and the trapping performance was found to be dependent on the asymmetry of magnets.
Gertz and Khitun [71] investigated the trapping of red blood cells (RBC), using magnetic nanoparticles. The schematic illustration of the experimental setup is shown in Figure 17a. Two Cu wires covered by silicon dioxide were embedded in the working device. A power supply was employed to provide micro-electromagnet field to trap RBCs. Without the activation of current, the RBCs were randomly distributed in the channel; once the current was on, the RBCs were trapped around the wire (Figure 17b,c). The strength of the magnetic field influenced the trapping procedure significantly.
3.3. Optical Tweezers
Optical tweezer has been regarded as an effective method to trap cell/particle at microscale [43]. Optical tweezer employs a focused laser beam to induce optical force, to realize trapping function. However, the capture efficiency of optical tweezer is not high sometimes, due to the low refractive index contrast of some biological cells [72,73]. It is still a challenge to improve the trapping efficiency of biological cells by using optical tweezer [74,75]. Recently, some researchers employed the thermal effect induced by the optical absorption, to enhance trapping efficiency. The combination of thermal effect and natural convection flow could trap the cells into a hotter region [76]. The optical force imposed on a single particle is expressed as follows:
where n is the surface normal vector, I is the unit dyadic, and and are the electric permittivity and magnetic permeability of the surrounding medium. E is electric field, and H is magnetic field.
Li et al. [77] reported a new type of optical tweezer that made use of thermophoresis and natural convection flow to trap and arrange erythrocytes (Figure 18). A schematic illustration of the thermophoresis and natural convection flow is shown in Figure 18a. Introduced by the optical absorption through a fiber, a hot zone formed on the quartz plate. This hot zone resulted in a temperature gradient on the working plate. This thermophoresis and natural convection flow under low incident power could trap the erythrocyte effectively. In addition, the optical scattering force under high incident power could be employed to arrange the erythrocytes efficiently (Figure 18b). The erythrocytes were trapped and arranged over a long distance, without injury. The enlarged view and SEM (scanning electron microscope) image of graphene-coated microfiber probe (GCMP) are provided in Figure 18c,d. Figure 18e presents the schematic diagram of the experimental setup: A 980 nm laser was focused on the GCMP through the fiber, and a CCD camera was mounted on the top to monitor the trapping and arrangement process. The AFM (atomic force microscopy) image of an erythrocyte is shown in Figure 18f. Sipova et al. [78] have also employed the photothermal effect, to probe DNA films. DNA cargo from individual gold nanoparticles were successfully trapped and manipulated by optical tweezers. The trapping procedure was affected by the natural convection flow and thermophoretic force on the particles.
Liu et al. [79] developed a microfluidic device to selectively trap Escherichia coli cells in human blood solution, based on size and shape. A fiber optical tweezer was embedded into a T-type microflow channel to realize the trapping Escherichia coli function (Figure 19). With the help of optical tweezer, the Escherichia coli cells were selectively trapped at the tip of the optical fiber tweezer. The trapping efficiency of E. coli was 39.5%, and the separation efficiency was 100%. The optical force played an important role in the trapping and separation process.
Lee et al. [80] employed optical trapping and microfluidics to investigate the mechanism of red blood cell (RBC) aggregation. Schematic illustration of the experimental chamber is shown in Figure 20, including the top view (a) and side view (b). Solution 2 (S2) was introduced into the microfluidic flow channel through pressure supply. The cells located in the larger chamber with Solution 1 (S1). Optical tweezer was employed to trap the cells to the S2. The evidence for the cross-bridge induced interaction of cells was observed in the experiment. The initial solution played an important role in measuring the cell-interaction strength.
Pilat et al. [81] developed a promising microfluidic device with many functions for assessing the optical trapping experiments quantitatively (Figure 21). The layout of the microfluidic device was designed to guarantee that the cells could not flow out of the chamber due to their low-diffusion rate. A benchmark for safe and non-invasive optical trapping of Saccharomyces cerevisiae could be achieved by using this configuration.
Zhang et al. [82] proposed and demonstrated a hollow annular-core fiber (HACF) based optical tweezer for living cell trapping and sterile transporting (Figure 22). A microfluidic channel was embedded in the optical fiber, allowing for the cells/particles flowing through the flow channel. The competition between the optical trapping forces (OTF) and the liquid viscous resistances (LVR) determined the trapping location and moving trajectory.
Liu et al. [83] proposed and demonstrated an optofluidic strategy to trap and transport cell chain using large-tapered-angle fiber probe (LTAP). In their research, Escherichia coli cells, yeast cells and red blood cells were used to study the feasibility of this approach. Their strategy employed the combination of optical force and flow drag force. The experimental results of trapping and transporting E. coli cell chain are shown in Figure 23. The trapping procedure could be controlled by adjusting the laser power and flow velocity.
Qi et al. [84] employed optical tweezer and microfluidic devices to trap and sort denitrifying anaerobic methane oxidizing (DAMO) microorganisms. This technique showed many advantages, such as high purity, low infection rates and no harm to cell viability. The schematic illustration of the chip design is shown in Figure 24. Mixed culture and buffer solution were introduced into the microfluidic channel. The optical tweezer was employed, at the outlet, to trap a target DAMO cell (marked black circle) and transport it into the collection channel. This technique could be potentially used for slow-growing microorganisms.
3.4. Acoustic Trapping
Another method for the active trapping of cells is acoustic actuated cell trapping. Ultrasonic standing waves (USWs) can be employed for contactless cell trapping in microfluidic channels. Acoustic trapping is widely used in microfluidic system for cell trapping, transportation and manipulation.
Yin et al. [85] proposed a particle-based cell manipulation method employing acoustic radiation forces, as shown in Figure 25. Three typical types of particles were selected in their investigation, which were ploy(lactic-co-glycolic acid) (PLGA) microspheres, silica-coated magnetic microbeads and polydimethylsiloxane (PDMS) microspheres. Their responses to ultrasonic standing waves (USWs) demonstrated that the PDMS microspheres were suitable for cell trapping. This proposed method did not have a harmful effect on the cells. Acoustic contrast factor played an important role in the trapping procedure.
Fornell et al. [86] established an microfluidic system to trap hydrogel droplets, using acoustic forces. The experimental setup is shown in Figure 26. A T-shaped microfluidic channel was employed to generate cell-laden droplets. The cell-laden droplets were then cross-linked with UV light. Next, the droplets were introduced into a second microfluidic channel, where they were trapped by acoustic forces. The droplets could be trapped at a flow speed of up to 3.2 mm/s. The trapping process was realized by the acoustic forces.
Lim et al. [87] reported a novel method for evaluating the acoustic trapping performance by tracking the motion of a microparticle. The acoustic trapping force was assessed based on a series of microscopy images obtained from a high-speed camera and a high-resolution microscopy. This method could be employed to estimate cell membrane deformability. The experimental setup and procedure for measuring the trapping forces are shown in Figure 27. A microparticle was randomly selected and trapped by the acoustic tweezer. Then the transducer was turned off and translated by a certain distance of 250 μm. After that, sinusoidal bursts were applied to the transducer, and the motion of the attracted particle toward the acoustic focus center was recorded, which could be further analyzed to estimate the trapping force.
Wu et al. [88] reported a simple and reliable method to generate multicellular spheroids, using acoustic method (Figure 28). Their device consisted of capillaries, a standing surface acoustic wave (SSAW) generator, a pair of interdigital transducers (IDTs) and a piezoelectric substrate. Once the radio frequency signal was applied, a periodic distributed acoustic field could be formed in the capillary. Due to the gradient of the acoustic field, an acoustic radiation force was generated, and pressure node array was generated. The suspended cells in the capillary were pushed by the acoustic force to the pressure nodes and assembled into spheroids there.
Lu et al. [89] developed a microfluidic platform, to trap and isolate cancer cells based on their size, using acoustic microstreaming (Figure 29). With the activation of acoustic microstreaming, the microtrap would discriminate and trap the cancer cells at the vicinity. The tunable and reversible properties of the acoustic microstreaming produced by the micropillar trap played an important role which affected the trapping efficiency. Hayakawa et al. [90] also proposed similar methods for trapping single motile cell.
Xu et al. [91] developed an improved method to separate sperm cells from dilute “large volume” samples that contained an abundance of female DNA, by using bead-assisted acoustic trapping (Figure 30). One PDMS fluid layer was sandwiched between two glass reflecting layers, forming a resonator. Through the employment of this three-layer structure, trapping nodes were generated based on ultrasonic standing waves. The addition of polymeric beads with a critical concentration in the dilute sample was found to initiate the aggregation and improve the sperm cell trapping significantly, while not affecting the DNA extraction and PCR (polymerase chain reaction). Hence, this successful bead-assisted trapping of sperm cells in the enclosed glass–PDMS–glass microdevice suggested that acoustic differential extraction (ADE) could be a useful tool for the processing of real forensic samples.
Lu et al. [92] investigated topographical manipulation of microparticles and cells, using acoustic microstreaming. This technique was named as acoustic topographical manipulation (ATM). The working principle is shown in Figure 31a. The microparticles were introduced into the aqueous microfluidic system and deposited on the bottom of the cell surface. Some particles became obstacles due to the existence of electrostatic and van der Waals interactions. A localized microstreaming around the obstacle would be formed upon the application of a standing acoustic wave filed. The acoustic microstreaming force, as well as radiation forces, could trap the microparticles at the vicinity of the obstacles. Noteworthy, the localized acoustic microstreaming vortex, as the manipulating force, would guide the topographic movement of the microparticle around the obstacle (Figure 31b–e). Dependence of the manipulating microparticle’s velocity on the applied driving frequency and voltage of the acoustic transducer were also studied in the work (Figure 31f,g).
Meng et al. [93] reported an improved sonoporation method to trap microcells using cavitation effect as shown in Figure 32. Multiple rectangular microchannels of uniform size were embedded staggered along the main microflow channel to produce microbubble array. The microbubble array oscillated with almost the same amplitude and resonant frequency, resulting in the homogeneous sonoporation. The microcells were trapped at the corner of the rectangular micro side channels due to the generated acoustic radiation forces introduced by the oscillating microbubbles.
4. Conclusions
This paper reviews the different methods for cell trapping. At the early development stages, hydrodynamic trapping, which is a contact-based method, has been proved to be efficacious in cell trapping. Many researchers focused on contact-based cell trapping devices due to their simple fabrication processes. With the development of microfluidic technologies, an increasing number of contactless cell trapping methods have been proposed and reported. Through contactless cell trapping approaches, cell trapping can be achieved to satisfy various requirements. Cell trapping at a precisely defined location has been receiving more and more attention from both the engineering community as end-user and research community as research tool.
Magnetophoresis is highly recommended for cell trapping in microfluidic system. This technique achieves cell trapping function without changing the physical properties of sample solution, such as pH value, ion concentration and temperature. Being easy to design, easy to operate and low-cost make it a popular option in the scientific research community.
Author Contributions
Conceptualization, Y.D. and B.X.; methodology, B.X.; software, Y.G.; investigation, Y.D. and Y.G.; writing—original draft preparation, Y.D.; writing—review and editing, Y.D and B.X.; visualization, Y.G.; supervision, B.X.; project administration, B.X.; funding acquisition, Y.D. and B.X. All authors have read and agreed to the published version of the manuscript.
Funding
This work is supported by China Postdoctoral Science Foundation (Grant No. 2019M651716), Senior Talent Foundation of Jiangsu University (Grant No. 18JDG033,18JDG034) and Jiangsu Planned Projects for Postdoctoral Research Funds (Grant No. 2018K102C).
Acknowledgments
Yilin Deng and Bin Xu extend sincere appreciation to Jiangsu Province’s Program for High-Level Innovative and Entrepreneurial Talents Introduction.
Conflicts of Interest
On behalf of all authors, the corresponding author states that there is no conflict of interest.
References
- Passarelli, M.K.; Newman, C.F.; Marshall, P.S.; West, A.; Gilmore, I.; Bunch, J.; Alexander, M.R.; Dollery, C.T. Single-Cell Analysis: Visualizing Pharmaceutical and Metabolite Uptake in Cells with Label-Free 3D Mass Spectrometry Imaging. Anal. Chem. 2015, 87, 6696–6702. [Google Scholar] [CrossRef] [PubMed]
- Fritzsch, F.S.O.; Dusny, C.; Frick, O.; Schmid, A. Single-Cell Analysis in Biotechnology, Systems Biology, and Biocatalysis. Annu. Rev. Chem. Biomol. Eng. 2012, 3, 129–155. [Google Scholar] [CrossRef] [PubMed]
- Backman, V.; Liu, Y.; Pradhan, P.; Kim, Y.L.; Li, X.; Taflove, A.; Roy, H.K.; Brand, R. Single cell partial wave spectroscopy: Understanding alterations of intracellular nanoarchitecture in cancer. Front. Opt. 2006, FTuQ2. [Google Scholar] [CrossRef]
- Li, H.; Smith, B.K.; Shrestha, B.; Márk, L.; Vertes, A. Automated Cell-by-Cell Tissue Imaging and Single-Cell Analysis for Targeted Morphologies by Laser Ablation Electrospray Ionization Mass Spectrometry; Springer Science and Business Media LLC: Berlin/Heidelberg, Germany, 2014; Volume 1203, pp. 117–127. [Google Scholar]
- Putnam, A.J. Microenvironmental Control of Stem Cell Fate; Springer Science and Business Media LLC: Berlin/Heidelberg, Germany, 2014; pp. 93–115. [Google Scholar]
- Sakata, T.; Sugimoto, H.; Saito, A. Live Monitoring of Microenvironmental pH Based on Extracellular Acidosis around Cancer Cells with Cell-Coupled Gate Ion-Sensitive Field-Effect Transistor. Anal. Chem. 2018, 90, 12731–12736. [Google Scholar] [CrossRef]
- Narayanamurthy, V.; Nagarajan, S.; Samsuri, F.; Khan, A.Y.F.; Sridhar, T.M. Microfluidic hydrodynamic trapping for single cell analysis: Mechanisms, methods and applications. Anal. Methods 2017, 9, 3751–3772. [Google Scholar] [CrossRef]
- Evers, T.M.J.; Hochane, M.; Tans, S.J.; Heeren, R.M.A.; Semrau, S.; Nemes, P.; Mashaghi, A. Deciphering Metabolic Heterogeneity by Single-Cell Analysis. Anal. Chem. 2019, 91, 13314–13323. [Google Scholar] [CrossRef] [PubMed]
- Clister, T.; Mehta, S.; Zhang, J. Single-cell Analysis of G-protein Signal Transduction*. J. Boil. Chem. 2015, 290, 6681–6688. [Google Scholar] [CrossRef] [Green Version]
- Pavel, Z.; Shreeram, A.; Wanyi, T.; Konstantin, Q.; Lawrence, D.T.; Jonathan, F.; David, W.; Peter, N.; John, A.S.; Xiaohu, G.; et al. Cross-Platform DNA Encoding for Single-Cell Imaging of Gene Expression. Angew. Chem. Int. Ed. 2016, 55, 8975–8978. [Google Scholar] [CrossRef]
- Patra, B.; Chen, Y.-H.; Peng, C.-C.; Lin, S.-C.; Lee, C.-H.; Tung, Y.-C. A microfluidic device for uniform-sized cell spheroids formation, culture, harvesting and flow cytometry analysis. Biomicrofluidics 2013, 7, 54114. [Google Scholar] [CrossRef] [Green Version]
- Hause, B.; Hause, G. Microscope Techniques and Single Cell Analysis. Ecol. Biochem. 2014, 366–382. [Google Scholar] [CrossRef]
- Deng, B.; Wang, H.; Tan, Z.; Quan, Y. Microfluidic Cell Trapping for Single-Cell Analysis. Micromachines 2019, 10, 409. [Google Scholar] [CrossRef] [PubMed] [Green Version]
- Abdelgawad, M.O.; Jack, T.L.; Sun, Y.; Chien, W.-Y. Microfluidic platform with circular microchannels for facile cell trapping and single cell analysis. In Proceedings of the 14th International Conference on Miniaturized Systems for Chemistry and Life Sciences 2010: MicroTAS 2010, Groningen, The Netherlands, 3–7 October 2010. [Google Scholar]
- Ozcelikkale, A.; Moon, H.-R.; Linnes, M.; Han, B. In vitro microfluidic models of tumor microenvironment to screen transport of drugs and nanoparticles. Wiley Interdiscip. Rev. Nanomed. Nanobiotechnol. 2017, 9, e1460. [Google Scholar] [CrossRef] [PubMed]
- Mitxelena-Iribarren, O.; Zabalo, J.; Arana, S.; Mujika, M. Improved microfluidic platform for simultaneous multiple drug screening towards personalized treatment. Biosens. Bioelectron. 2019, 123, 237–243. [Google Scholar] [CrossRef] [PubMed]
- Sato, K. Microdevice in Cellular Pathology: Microfluidic Platforms for Fluorescence in situ Hybridization and Analysis of Circulating Tumor Cells. Anal. Sci. 2015, 31, 867–873. [Google Scholar] [CrossRef] [Green Version]
- Zhuang, Q.; Wang, S.; Zhang, J.; He, Z.; Li, H.; Ma, Y.; Lin, J.-M. Nephrocyte-neurocyte interaction and cellular metabolic analysis on membrane-integrated microfluidic device. Sci. China Ser. B Chem. 2015, 59, 243–250. [Google Scholar] [CrossRef]
- Jin, D.; Deng, B.; Li, J.X.; Cai, W.; Tu, L.; Chen, J.; Wu, Q.; Wang, W.H. A microfluidic device enabling high-efficiency single cell trapping. Biomicrofluidics 2015, 9, 014101. [Google Scholar] [CrossRef] [Green Version]
- Lee, H.; Li, X.; Jiang, A.; Lee, A.P. An integrated microfluidic platform for size-selective single-cell trapping of monocytes from blood. Biomicrofluidics 2018, 12, 054104. [Google Scholar] [CrossRef] [Green Version]
- Lee, S.-K.; Kim, D.; Lee, G.; Kim, G.-S.; Kwak, M.; Fan, R. Specific rare cell capture using micro-patterned silicon nanowire platform. Biosens. Bioelectron. 2014, 54, 181–188. [Google Scholar] [CrossRef]
- Wang, J.; Feng, X.; Du, W.; Liu, B.-F. Microfluidic worm-chip for in vivo analysis of neuronal activity upon dynamic chemical stimulations. Anal. Chim. Acta 2011, 701, 23–28. [Google Scholar] [CrossRef]
- Yang, K.; Park, H.-J.; Han, S.; Lee, J.; Ko, E.; Kim, J.; Lee, J.S.; Yu, J.H.; Song, K.Y.; Cheong, E.; et al. Recapitulation of in vivo-like paracrine signals of human mesenchymal stem cells for functional neuronal differentiation of human neural stem cells in a 3D microfluidic system. Biomaterials 2015, 63, 177–188. [Google Scholar] [CrossRef]
- Hasanzadeh-Barforoushi, A.; Law, A.M.K.; Hejri, A.; Asadnia, M.; Ormandy, C.J.; Gallego-Ortega, D.; Warkiani, M.E. Static droplet array for culturing single live adherent cells in an isolated chemical microenvironment. Lab Chip 2018, 18, 2156–2166. [Google Scholar] [CrossRef] [PubMed]
- Shemesh, J.; Ben Arye, T.; Avesar, J.; Kang, J.H.; Fine, A.; Super, M.; Meller, A.; Ingber, N.E.; Levenberg, S. Stationary nanoliter droplet array with a substrate of choice for single adherent/nonadherent cell incubation and analysis. Proc. Natl. Acad. Sci. USA 2014, 111, 11293–11298. [Google Scholar] [CrossRef] [PubMed] [Green Version]
- Hassanzadeh-Barforoushi, A.; Warkiani, M.E.; Gallego-Ortega, D.; Liu, G.; Barber, T. Capillary-assisted microfluidic biosensing platform captures single cell secretion dynamics in nanoliter compartments. Biosens. Bioelectron. 2020, 155, 112113. [Google Scholar] [CrossRef]
- Bithi, S.S.; Vanapalli, S.A. Microfluidic cell isolation technology for drug testing of single tumor cells and their clusters. Sci. Rep. 2017, 7, 41707. [Google Scholar] [CrossRef] [PubMed] [Green Version]
- Rettig, J.R.; Folch, A. Large-Scale Single-Cell Trapping and Imaging Using Microwell Arrays. Anal. Chem. 2005, 77, 5628–5634. [Google Scholar] [CrossRef] [PubMed]
- Lin, C.-H.; Hsiao, Y.-H.; Chang, H.-C.; Yeh, C.-F.; He, C.-K.; Salm, E.M.; Chen, C.; Chiu, I.-M.; Hsu, C.-H. A microfluidic dual-well device for high-throughput single-cell capture and culture. Lab Chip 2015, 15, 2928–2938. [Google Scholar] [CrossRef]
- Yeo, T.; Tan, S.J.; Lim, C.L.; Lau, D.P.X.; Chua, Y.W.; Krisna, S.S.; Iyer, G.; Tan, G.S.; Lim, T.K.H.; Tan, D.S.; et al. Microfluidic enrichment for the single cell analysis of circulating tumor cells. Sci. Rep. 2016, 6, 22076. [Google Scholar] [CrossRef] [Green Version]
- Arakawa, T.; Noguchi, M.; Sumitomo, K.; Yamaguchi, Y.; Shoji, S. High-throughput single-cell manipulation system for a large number of target cells. Biomicrofluidics 2011, 5, 014114. [Google Scholar] [CrossRef] [Green Version]
- Zhou, Y.; Basu, S.; Wohlfahrt, K.J.; Lee, S.F.; Klenerman, D.; Laue, E.D.; Seshia, A.A. A microfluidic platform for trapping, releasing and super-resolution imaging of single cells. Sens. Actuators B-Chem. 2016, 232, 680–691. [Google Scholar] [CrossRef]
- Eyer, K.; Kuhn, P.; Hanke, C.; Dittrich, P.S. A microchamber array for single cell isolation and analysis of intracellular biomolecules. Lab Chip 2012, 12, 765–772. [Google Scholar] [CrossRef]
- Kumemura, M.; Collard, D.; Sakaki, N.; Yamahata, C.; Hosogi, M.; Hashiguchi, G.; Fujita, H. Single-DNA-molecule trapping with silicon nanotweezers using pulsed dielectrophoresis. J. Micromech. Microeng. 2011, 21. [Google Scholar] [CrossRef]
- Shake, T.; Zellner, P.; Sahari, A.; Breazeal, M.V.R.; Behkam, B.; Pruden, A.; Agah, M. Embedded passivated-electrode insulator-based dielectrophoresis (EπDEP). Anal. Bioanal. Chem. 2013, 405, 9825–9833. [Google Scholar] [CrossRef] [PubMed]
- Sun, Q.; Juodkazis, S.; Murazawa, N.; Mizeikis, V.; Misawa, H. Femtosecond laser photopolymerization of photonic and free-movable microstructures in sol-gel hybrid resist. In Advanced Fabrication Technologies for Micro/Nano Optics and Photonics III; SPIE-Intl Soc Optical Eng: San Francisco, CA, USA, 2010; Volume 7591, p. 75910K. [Google Scholar]
- Wang, Z.; Zhang, X.; Yang, J.; Yang, Z.; Wan, X.; Hu, N.; Zheng, X. Construction of microscale structures in enclosed microfluidic networks by using a magnetic beads based method. Anal. Chim. Acta 2013, 792, 66–71. [Google Scholar] [CrossRef]
- Feng, Z.; Zhi, S.; Guo, L.; Wei, M.; Zhou, Y.; Lei, C. A novel integrated microfluidic platform based on micro-magnetic sensor for magnetic bead manipulation and detection. Microfluid. Nanofluid. 2018, 22, 86. [Google Scholar] [CrossRef]
- Collins, D.J.; Alan, T.; Neild, A. The particle valve: On-demand particle trapping, filtering, and release from a microfabricated polydimethylsiloxane membrane using surface acoustic waves. Appl. Phys. Lett. 2014, 105, 033509. [Google Scholar] [CrossRef]
- Tang, Z.; Zhang, H.; Liu, W.; Duan, X. Trapping of biomolecules using bulk acoustic wave resonators. In Proceedings of the 2016 74th Annual Device Research Conference (DRC), Newark, DE, USA, 19–22 June 2016; pp. 1–2. [Google Scholar]
- Takai, T.; Nakao, H.; Iwata, F. Three-dimensional microfabrication using local electrophoresis deposition and a laser trapping technique. Opt. Express 2014, 22, 28109–28117. [Google Scholar] [CrossRef]
- Matsuura, T.; Takai, T.; Iwata, F. Local electrophoresis deposition assisted by laser trapping coupled with a spatial light modulator for three-dimensional microfabrication. Jpn. J. Appl. Phys. 2017, 56, 105502. [Google Scholar] [CrossRef]
- Molloy, J.E.; Dholakia, K.; Padgett, M.J. Preface: Optical tweezers in a new light. J. Mod. Opt. 2003, 50, 1501–1507. [Google Scholar] [CrossRef]
- Chiriacò, M.S.; Bianco, M.; Nigro, A.; Primiceri, E.; Ferrara, F.; Romano, A.; Quattrini, A.; Furlan, R.; Arima, V.; Maruccio, G. Lab-on-Chip for Exosomes and Microvesicles Detection and Characterization. Sensors 2018, 18, 3175. [Google Scholar] [CrossRef] [Green Version]
- Taller, D.; Richards, K.; Slouka, Z.; Senapati, S.; Hill, R.; Go, D.B.; Chang, H.-C. On-chip surface acoustic wave lysis and ion-exchange nanomembrane detection of exosomal RNA for pancreatic cancer study and diagnosis. Lab Chip 2015, 15, 1656–1666. [Google Scholar] [CrossRef]
- Huebner, A.; Bratton, D.; Whyte, G.; Yang, M.; Demello, A.J.; Abell, C.; Hollfelder, F. Static microdroplet arrays: A microfluidic device for droplet trapping, incubation and release for enzymatic and cell-based assays. Lab Chip 2009, 9, 692–698. [Google Scholar] [CrossRef] [PubMed]
- Tan, W.-H.; Takeuchi, S. A trap-and-release integrated microfluidic system for dynamic microarray applications. Proc. Natl. Acad. Sci. USA 2007, 104, 1146–1151. [Google Scholar] [CrossRef] [PubMed] [Green Version]
- Kim, M.; Wang, Z.H.; Lam, R.; Thorsen, T. Simulation of the transport of biological cells in the microfluidic device. In Proceedings of the 2007 NSTI Nanotechnology Conference and Trade Show—NSTI Nanotech 2007, Santa Clara, CA, USA, 20–24 May 2007. [Google Scholar]
- Chen, L.; Kim, J.J.; Doyle, P.S. Microfluidic platform for selective microparticle parking and paired particle isolation in droplet arrays. Biomicrofluidics 2018, 12, 024102. [Google Scholar] [CrossRef] [PubMed]
- Zhu, Z.; Geng, Y.; Yuan, Z.; Ren, S.; Liu, M.; Meng, Z.; Pan, D. A Bubble-Free Microfluidic Device for Easy-to-Operate Immobilization, Culturing and Monitoring of Zebrafish Embryos. Micromachines 2019, 10, 168. [Google Scholar] [CrossRef] [PubMed] [Green Version]
- Marzano, G.; Chiriacò, M.S.; Primiceri, E.; Dell’Aquila, M.E.; Ramalho-Santos, J.; Zara, V.; Ferramosca, A.; Maruccio, G. Sperm selection in assisted reproduction: A review of established methods and cutting-edge possibilities. Biotechnol. Adv. 2019, 107498. [Google Scholar] [CrossRef] [PubMed]
- Fan, W.; Qiao, M.; Jin, Y.; Zhou, H.; Ge, Y.; Jin, Q.-H.; Zhao, J.-L. High efficiency single-cell capture based on microfluidics for single cell analysis. J. Micromech. Microeng. 2019, 29, 035004. [Google Scholar] [CrossRef]
- Xu, J.; Chen, S.; Wang, D.; Jiang, Y.; Hao, M.; Du, G.; Ba, D.-C.; Lin, Q.; Mei, Q.; Ning, Y.; et al. A Microfluidic Chip with Double-Slit Arrays for Enhanced Capture of Single Cells. Micromachines 2018, 9, 157. [Google Scholar] [CrossRef] [Green Version]
- Liu, K.; Jiang, Y.; Hao, M.; Chen, S.; Ning, Y.; Ning, J.; Ba, D. Study of cell-trap microfluidic chip for platinum drugs treating cancer cell tests. In Proceedings of the 12th International Conference on Nano/Micro Engineered and Molecular Systems (NEMS), Los Angeles, CA, USA, 9–12 April 2017; pp. 689–693. [Google Scholar]
- Zhu, J.; Wang, Y.; Chen, P.; Su, H.; Du, W.; Liu, B.-F. Highly efficient microfluidic device for cell trapping and pairing towards cell-cell communication analysis. Sensors Actuators B Chem. 2019, 283, 685–692. [Google Scholar] [CrossRef]
- Aslan, M.K.; Kulah, H. Android based portable cell counting system for label free quantification of dep manipulated cancer cells. In Proceedings of the 19th International Conference on Solid-State Sensors, Actuators and Microsystems (TRANSDUCERS), Kaohsiung, Taiwan, 18–22 June 2017; pp. 556–559. [Google Scholar]
- Takeuchi, M.; Nagasaka, K.; Yoshida, M.; Kawata, Y.; Miyagawa, Y.; Tago, S.; Hiraike, H.; Wada-Hiraike, O.; Oda, K.; Osuga, Y.; et al. On-chip immunofluorescence analysis of single cervical cells using an electroactive microwell array with barrier for cervical screening. Biomicrofluidics 2019, 13, 044107. [Google Scholar] [CrossRef]
- Puri, P.; Kumar, V.; Belgamwar, S.U.; Ananthasubramanian, M.; Sharma, N.N. Microfluidic platform for dielectrophoretic separation of bio-particles using serpentine microelectrodes. Microsyst. Technol. 2018, 25, 2813–2820. [Google Scholar] [CrossRef]
- Fritzsch, F.S.O.; Blank, L.M.; Dusny, C.; Schmid, A. Miniaturized octupole cytometry for cell type independent trapping and analysis. Microfluid. Nanofluid. 2017, 21, 130. [Google Scholar] [CrossRef]
- Chen, X.; Liang, Z.; Li, D.; Xiong, Y.; Xiong, P.; Guan, Y.; Hou, S.; Hu, Y.; Chen, S.; Liu, G.; et al. Microfluidic dielectrophoresis device for trapping, counting and detecting Shewanella oneidensis at the cell level. Biosens. Bioelectron. 2018, 99, 416–423. [Google Scholar] [CrossRef] [PubMed]
- Munaz, A.; Shiddiky, M.J.A.; Nguyen, N.-T. Recent advances and current challenges in magnetophoresis based micro magnetofluidics. Biomicrofluidics 2018, 12, 031501. [Google Scholar] [CrossRef]
- Scherr, T.; Ryskoski, H.B.; Doyle, A.B.; Haselton, F.R. A two-magnet strategy for improved mixing and capture from biofluids. Biomicrofluidics 2016, 10, 024118. [Google Scholar] [CrossRef] [PubMed]
- Kirby, D.; Siegrist, J.; Kijanka, G.; Zavattoni, L.; Sheils, O.; O’Leary, J.; Burger, R.; Ducreé, J. Centrifugo-magnetophoretic particle separation. Microfluid. Nanofluid. 2012, 13, 899–908. [Google Scholar] [CrossRef]
- Guo, P.-L.; Tang, M.; Hong, S.-L.; Yu, X.; Pang, D.-W.; Zhang, Z.-L. Combination of dynamic magnetophoretic separation and stationary magnetic trap for highly sensitive and selective detection of Salmonella typhimurium in complex matrix. Biosens. Bioelectron. 2015, 74, 628–636. [Google Scholar] [CrossRef]
- Huang, N.-T.; Hwong, Y.-J.; Lai, R.L. A microfluidic microwell device for immunomagnetic single-cell trapping. Microfluid. Nanofluid. 2018, 22, 16. [Google Scholar] [CrossRef]
- Hejazian, M.; Nguyen, N.-T. Magnetofluidic concentration and separation of non-magnetic particles using two magnet arrays. Biomicrofluidics 2016, 10, 044103. [Google Scholar] [CrossRef] [Green Version]
- Wang, Y.; Wu, R.; Varma, V.B.; Wang, Z.; Seah, Y.; Wang, Z.; Ramanujan, R. Flowing label-free bacteria trapped by small magnetic fields. Sensors Actuators B Chem. 2018, 260, 657–665. [Google Scholar] [CrossRef]
- Zeng, J.; Chen, C.; Vedantam, P.; Brown, V.; Tzeng, T.-R.J.; Xuan, X. Three-dimensional magnetic focusing of particles and cells in ferrofluid flow through a straight microchannel. J. Micromech. Microeng. 2012, 22, 105018. [Google Scholar] [CrossRef]
- Zhou, Y.; Kumar, D.T.; Lu, X.; Kale, A.; DuBose, J.; Song, Y.; Wang, J.; Li, N.; Xuan, X. Simultaneous diamagnetic and magnetic particle trapping in ferrofluid microflows via a single permanent magnet. Biomicrofluidics 2015, 9, 044102. [Google Scholar] [CrossRef] [PubMed] [Green Version]
- Wilbanks, J.J.; Kiessling, G.; Zeng, J.; Zhang, C.; Tzeng, T.-R.; Ye, M. Exploiting magnetic asymmetry to concentrate diamagnetic particles in ferrofluid microflows. J. Appl. Phys. 2014, 115, 44907. [Google Scholar] [CrossRef] [Green Version]
- Gertz, F.; Khitun, A. Biological cell manipulation by magnetic nanoparticles. AIP Adv. 2016, 6, 025308. [Google Scholar] [CrossRef] [Green Version]
- Kim, W.; Özdemir, S.K.; Zhu, J.; He, L.; Yang, L. Demonstration of mode splitting in an optical microcavity in aqueous environment. Appl. Phys. Lett. 2010, 97, 71111. [Google Scholar] [CrossRef] [Green Version]
- He, L.; Özdemir, Ş.K.; Zhu, J.; Kim, W.; Yang, L. Detecting single viruses and nanoparticles using whispering gallery microlasers. Nat. Nanotechnol. 2011, 6, 428–432. [Google Scholar] [CrossRef] [PubMed] [Green Version]
- Nurunnabi, M.; Khatun, Z.; Revuri, V.; Nafiujjaman, M.; Cha, S.; Cho, S.; Huh, K.M.; Lee, Y.-K. Design and strategies for bile acid mediated therapy and imaging. RSC Adv. 2016, 6, 73986–74002. [Google Scholar] [CrossRef]
- Parodi, A.; Molinaro, R.; Sushnitha, M.; Evangelopoulos, M.; Martinez, J.O.; Arrighetti, N.; Corbo, C.; Tasciotti, E. Bio-inspired engineering of cell- and virus-like nanoparticles for drug delivery. Biomaterials 2017, 147, 155–168. [Google Scholar] [CrossRef]
- Liu, Y.; Poon, A.W. Flow-assisted Single-beam Optothermal Manipulation of Microparticles. Opt. Express 2010, 18, 18483. [Google Scholar] [CrossRef]
- Li, Z.; Yang, J.; Liu, S.; Jiang, X.; Wang, H.; Hu, X.; Xue, S.; He, S.; Xing, X. High throughput trapping and arrangement of biological cells using self-assembled optical tweezer. Opt. Express 2018, 26, 34665–34674. [Google Scholar] [CrossRef]
- Šípová-Jungová, H.; Shao, L.; Länk, N.O.; Andrén, D.; Käll, M. Photothermal DNA Release from Laser-Tweezed Individual Gold Nanomotors Driven by Photon Angular Momentum. ACS Photonics 2018, 5, 2168–2175. [Google Scholar] [CrossRef]
- Liu, S.; Li, Z.; Weng, Z.; Li, Y.; Shui, L.; Jiao, Z.; Chen, Y.; Luo, A.-P.; Xing, X.; He, S. Miniaturized optical fiber tweezers for cell separation by optical force. Opt. Lett. 2019, 44, 1868–1871. [Google Scholar] [CrossRef] [PubMed]
- Lee, K.; Wagner, C.; Priezzhev, A.V. Assessment of the “cross-bridge”-induced interaction of red blood cells by optical trapping combined with microfluidics. J. Biomed. Opt. 2017, 22, 091516. [Google Scholar] [CrossRef] [PubMed]
- Pilát, Z.; Jonáš, A.; Ježek, J.; Zemánek, P. Effects of Infrared Optical Trapping on Saccharomyces cerevisiae in a Microfluidic System. Sensors 2017, 17, 2640. [Google Scholar] [CrossRef] [PubMed] [Green Version]
- Zhang, Y.; Li, Y.; Zhang, Y.; Hu, C.; Liu, Z.; Yang, X.; Zhang, J.; Yang, J.; Yuan, L. HACF-based optical tweezers available for living cells manipulating and sterile transporting. Opt. Commun. 2018, 427, 563–566. [Google Scholar] [CrossRef]
- Liu, X.; Huang, J.; Li, Y.; Zhang, Y.; Li, B. Optofluidic organization and transport of cell chain. J. Biophotonics 2017, 10, 1627–1635. [Google Scholar] [CrossRef]
- Qi, X.; Carberry, D.M.; Cai, C.; Hu, S.; Yuan, Z.; Dunlop, H.R.; Guo, J. Optical sorting and cultivation of denitrifying anaerobic methane oxidation archaea. Biomed. Opt. Express 2017, 8, 934–942. [Google Scholar] [CrossRef]
- Yin, D.; Xu, G.; Wang, M.; Shen, M.; Xu, T.; Zhu, X.; Shi, X. Effective cell trapping using PDMS microspheres in an acoustofluidic chip. Colloids Surf. B Biointerfaces 2017, 157, 347–354. [Google Scholar] [CrossRef]
- Fornell, A.; Johannesson, C.; Searle, S.S.; Happstadius, A.; Nilsson, J.; Tenje, M. Trapping of Cell-Laden Hyaluronic Acid-Acrylamide Hydrogel Droplets using Bulk Acoustic Waves. In Proceedings of the 20th International Conference on Solid-State Sensors, Actuators and Microsystems & Eurosensors XXXIII (TRANSDUCERS & EUROSENSORS XXXIII), Berlin, Germany, 23–27 June 2019; pp. 2352–2355. [Google Scholar]
- Lim, H.G.; Kim, H.H.; Yoon, C. Evaluation method for acoustic trapping performance by tracking motion of trapped microparticle. Jpn. J. Appl. Phys. 2018, 57, 057202. [Google Scholar] [CrossRef]
- Wu, Y.; Ao, Z.; Chen, B.; Muhsen, M.; Bondesson, M.; Lu, X.; Guo, F. Acoustic assembly of cell spheroids in disposable capillaries. Nanotechnology 2018, 29, 504006. [Google Scholar] [CrossRef] [Green Version]
- Lu, X.; Martin, A.; Soto, F.; Angsantikul, P.; Li, J.; Chen, C.; Liang, Y.; Hu, J.; Zhang, L.; Wang, J. Parallel Label-Free Isolation of Cancer Cells Using Arrays of Acoustic Microstreaming Traps. Adv. Mater. Technol. 2018, 4, 1800374. [Google Scholar] [CrossRef]
- Hayakawa, T.; Akita, Y.; Arai, F. Parallel trapping of single motile cells based on vibration-induced flow. Microfluid. Nanofluid. 2018, 22, 42. [Google Scholar] [CrossRef]
- Xu, K.; Clark, C.P.; Poe, B.L.; Lounsbury, J.A.; Nilsson, J.; Laurell, T.; Landers, J.P. Isolation of a Low Number of Sperm Cells from Female DNA in a Glass–PDMS–Glass Microchip via Bead-Assisted Acoustic Differential Extraction. Anal. Chem. 2019, 91, 2186–2191. [Google Scholar] [CrossRef] [PubMed]
- Lu, X.; Soto, F.; Li, J.; Li, T.; Liang, Y.; Wang, J. Topographical Manipulation of Microparticles and Cells with Acoustic Microstreaming. ACS Appl. Mater. Interfaces 2017, 9, 38870–38876. [Google Scholar] [CrossRef] [PubMed]
- Meng, L.; Liu, X.; Wang, Y.; Zhang, W.; Zhou, W.; Cai, F.; Li, F.; Wu, J.; Xu, L.; Niu, L.; et al. Sonoporation of Cells by a Parallel Stable Cavitation Microbubble Array. Adv. Sci. 2019, 6, 1900557. [Google Scholar] [CrossRef] [PubMed] [Green Version]
Figure 1.
Microfluidic device for microparticle arrangement. (a) Schematic illustration of microchannel that consist one entrance and outlet with one trap per row. (b) Particles motion in each trap. (c) Particle trapping in a trap. (d) The critical pressure required to trap particles of different diameters at different entrance widths (all particles with the same modulus). (e) The pressure required to trap particles with different moduli in traps with different entrance widths (all particles with the same diameter). (f) The phase diagram for particle trapping criterion (green: particles of 0.12 kPa moduli, blue: 0.28 kPa and pink: 0.65 kPa). PEGDA represents the polyethylene glycol diacrylate. (reprinted from Biomicrofluidics 2018, 12, 024102, with the permission of AIP Publishing, Melville, NY, USA).

Figure 2.
Schematic illustration of the microfluidic device for zebrafish embryo immobilization, culturing and monitoring. (a) Device composition. (b) Actual photo of the microfluidic device. PTFE represents polytetrafluoroethylene. (reprinted with permission from Micromachines 2019, 10, 168, an open access article distributed under the terms and conditions of the Creative Commons Attribution (CC BY) license).

Figure 3.
Schematic illustration of the microfluidic device for high-efficiency cell trapping, (a) microfluidic device, (b) droplet generation, (c) cell trapping and (d) imaging and analysis.
Figure 3.
Schematic illustration of the microfluidic device for high-efficiency cell trapping, (a) microfluidic device, (b) droplet generation, (c) cell trapping and (d) imaging and analysis.

Figure 4.
Schematic illustration of the microfluidic device for enhanced cell trapping: (a) microfluidic device and (b) double-slit micro array (reprinted with permission from Micromachines 2018, 9, 157, open access by MDPI).
Figure 4.
Schematic illustration of the microfluidic device for enhanced cell trapping: (a) microfluidic device and (b) double-slit micro array (reprinted with permission from Micromachines 2018, 9, 157, open access by MDPI).

Figure 5.
(a) Comparison of three different kinds of microstructures: (i) microfluidic device and (ii) trapping capabilities. (b) Images of the microfluidic device: (i) schematic illustration of top polydimethylsiloxane (PDMS) and bottom PDMS chip, (ii) the actual appearance of the microfluidic device, (iii) an enlarged view of the black box and (iv–vii) SEM images of the microfluidic device in detail (reprinted with permission from Sensors and Actuators B: Chemical 2019, 283, 685–692. Copyright © 2019, Elsevier B.V., Amsterdam, the Netherlands).

Figure 6.
Manufacturing process of the microfluidic dielectrophoresis (DEP) device.

Figure 7.
Schematic illustration of the electro-active micro-well array with barriers (EMAB). (a) Cell trapping and holding. (b) The actual image of the EMAB device (scable bar: 50 μm). (c) Schematic illustration of the immunostaining procedure (reprinted from Biomicrofluidics 2019, 13, 044107, with the permission of AIP Publishing, Melville, NY, USA).

Figure 8.
Schematic illustration of the C-serpentine microchannel. (a) Cross-section view. (b) C-serpentine geometry. (c) Schematic illustration of the yeast cell structure. (d) Gradient distribution of the electric field. DEP represents Dielectrophoresis.
Figure 8.
Schematic illustration of the C-serpentine microchannel. (a) Cross-section view. (b) C-serpentine geometry. (c) Schematic illustration of the yeast cell structure. (d) Gradient distribution of the electric field. DEP represents Dielectrophoresis.

Figure 9.
Schematic illustration of experimental setup (reprinted with permission from Biosensors and Bioelectronics 2018, 99, 416–423. Copyright © 2018, Elsevier B.V., Amsterdam, the Netherlands). HEPES represents 4-(2-hydroxyethyl)-1-piperazineethanesulfonic acid; CCD represents charge-coupled device.

Figure 10.
Experimental results of bead (magnetic cell) distribution with one magnet (a–d) and two magnets (e–h) (reprinted from Biomicrofluidics 2016, 10, 024118, with the permission of AIP Publishing, Melville, NY, USA).
Figure 10.
Experimental results of bead (magnetic cell) distribution with one magnet (a–d) and two magnets (e–h) (reprinted from Biomicrofluidics 2016, 10, 024118, with the permission of AIP Publishing, Melville, NY, USA).

Figure 11.
Schematic illustration of the controllable magnetic microfluidic device by Guo et al. (a) Target pathogens in a tube. (b) Schematics of the microchip. (c) Working principle of the microdevice. (d) Working principle of magnetic trapping in the detection zone (reprinted with permission from Biosensors and Bioelectronics 2015, 74, 628–636. Copyright © 2015, Elsevier B.V., Amsterdam, the Netherlands). ITO stands for Indium Tin Oxide. SA-QDs represents streptavidin modified QDs.

Figure 12.
(a) Schematic illustration of the microfluidic device for immunomagnetic single cell trapping. (b) Schematic illustration of the trajectory of the magnetic beads in the continuous flow under the magnetic field. (Fm denote magnetic force, Fd denote drag force, Fg denote gravitational force, ut denote the flow velocity and up denote the particle velocity.).

Figure 13.
Trapping of non-magnetic particles. (a) The distribution of the magnetic field obtained by the simulation. (b) The experimental trapping results. (c) The schematic illustration of the working forces (reprinted from Biomicrofluidics 2016, 10, 044103, with the permission of AIP Publishing, Melville, NY, USA).

Figure 14.
Schematic illustration of the trapping process of flowing label-free bacteria by micro-magnetic-fluidic technique (a) Schematics of experimental setup, (b) 3D show of channel geometry, (c) particle movement behavior with/without magnetic field and (d) variation of trapping bacteria with time (reprinted with permission from Sensors and Actuators, B: Chemical 2018, 260, 657–665. Copyright © 2018, Elsevier B.V., Amsterdam, the Netherlands).

Figure 15.
Experimental setup. (a) Captured image of the microfluid device by Zhou et al. (b) Trapping process with the evolution of time (reprinted from Biomicrofluidics 2015, 9, 044102, with the permission of AIP Publishing, Melville, NY, USA).
Figure 15.
Experimental setup. (a) Captured image of the microfluid device by Zhou et al. (b) Trapping process with the evolution of time (reprinted from Biomicrofluidics 2015, 9, 044102, with the permission of AIP Publishing, Melville, NY, USA).

Figure 16.
Schematic illustration of the microfluidic device for diamagnetic particle concentration (a) picture of the magnetic configuration to embed the two opposite magnets into the polydimethylsiloxane (PDMS), (b) captured image of the micro-fluidic chip with trapping magnets embedded and (c) schematic of the two trapping magnets to examine the effect of asymmetry of the magnetic field on diamagnetic particle concentration (reprinted from Journal of Applied Physics 2014, 115, 044907, with the permission of AIP Publishing, Melville, NY, USA).

Figure 17.
Experimental setup. (a) Schematic illustration of the working principle. (b) Simulated magnetic energy distribution. (c) Experimental result of trapping red blood cells (RBC) (i) without current and (ii) with 100 mA current (reprinted from AIP Advances 2016, 6, 025308, an open-access article distributed under the terms and conditions of the Creative Commons Attribution (CC BY) license).

Figure 18.
Experimental setup for the trapping and arrangement process: (a) trapping process, (b) arrangement process, (c) enlarged view of graphene-coated microfiber probe (GCMP), (d) SEM view of GCMP, (e) experimental setup and (f) AFM image of erythrocyte (reprinted from Optics Express 2018, 26, 34665-34674, Copyright © 2018 Optical Society of America, Washington D.C., WA, USA). SEM (scanning electron microscope), GCMP (graphene-coated microfiber probe) and AFM (atomic force microscopy).

Figure 19.
Schematic illustration of the microfluidic device by Liu et al. for the selectively trapping of Escherichia coli cells in human blood using optical tweezer. (a) Experimental setup. (b) Trapping of E. coli cell. OFT represents optical fiber tweezers. RBC represents red blood cell. PBS represents phosphate buffer saline.

Figure 20.
Schematic illustration of the experimental chamber: (a) top view and (b) side view (reprinted from Journal of Biomedical Optics 2017, 22, 091516. Copyright © 2017 Society of Photo-Optical Instrumentation Engineers (SPIE), Bellingham, WA, USA.
Figure 20.
Schematic illustration of the experimental chamber: (a) top view and (b) side view (reprinted from Journal of Biomedical Optics 2017, 22, 091516. Copyright © 2017 Society of Photo-Optical Instrumentation Engineers (SPIE), Bellingham, WA, USA.

Figure 21.
Actual image of the microfluidic chip. (a) The design of the microfluidic chip. (b) Enlargement of the center part in the red box. (c) A microscope image of the microchamber. (d) A microscope image of trapping process: A: t = 0 min; B: t = 250 min. (reprinted from Sensors (Switzerland) 2017, 17, 2640, MDPI Open Access).

Figure 22.
Schematic illustration of the optical tweezer: (a) Image of the light field from the hollow annular-core fiber (HACF), (b) size specifications of the fiber probe tip, (c) size specifications of the HACF, (d) operation principle for the setup and (e) light intensity distribution (reprinted with permission from Optics Communications 2018, 427, 563–566. Copyright © 2018, Elsevier B.V., Amsterdam, the Netherlands).

Figure 23.
Schematic illustration of organization process for E. coli cell chain. (a) The evolution of chain length with time variation. (b) The cell train moved toward the large-tapered-angle fiber probe (LTAP) with the decrease of the laser power. (c) The cell train mover away from the LTAP with the increase of the laser power (reprinted with permission from Journal of Biophotonics 2017, 10, 1627–1635. Copyright © 2017, John Wiley and Sons, Hoboken, NJ, USA).

Figure 24.
Schematic illustration of chip design and cell sorting procedure. ROI represents region of interest. (reprinted with permission from Biomedical Optics Express 2017, 8, 934–942. Copyright © 2017 Optical Society of America, under the terms of the OSA Open Access Publishing Agreement).
Figure 24.
Schematic illustration of chip design and cell sorting procedure. ROI represents region of interest. (reprinted with permission from Biomedical Optics Express 2017, 8, 934–942. Copyright © 2017 Optical Society of America, under the terms of the OSA Open Access Publishing Agreement).

Figure 25.
Schematic illustration of experimental setup and procedure. (a) Schematic diagram of experimental procedure. (b) Cells would be aligned in the middle if the PDMS microspheres were not coated with collagen. (c) Cells would be trapped at the side walls if the PDMS microspheres were coated with collagen. (d) Actual image of experimental setup. PZT represents piezoelectric transducers. (reprinted with permission from Colloids and Surfaces B: Biointerfaces 2017, 157, 347–354. Copyright © 2017 Elsevier B.V., Amsterdam, the Netherlands).

Figure 26.
Schematic illustration of chip design and acoustic trapping by Fornell et al.

Figure 27.
Experimental setup. (a) Schematic illustration of experimental configuration of single-beam acoustic tweezer. (b) Schematic diagram of trapping force measurement.
Figure 27.
Experimental setup. (a) Schematic illustration of experimental configuration of single-beam acoustic tweezer. (b) Schematic diagram of trapping force measurement.

Figure 28.
Schematic illustration of the acoustic assembly of cell spheroids: (a) working principle, (b) culturing of the assembled cells in a non-attachable dish and (c) differentiation in an attachable dish. SSAW represents standing surface acoustic wave and IDTs stands for interdigital transducers.

Figure 29.
Schematic illustration of the trapping process: (a) trapping principle, (b) top view of the microtrap, (c) side view of the microtrap, (d) approaching, (e) capturing and (f) releasing (reprinted with permission from Advanced Materials Technologies 2019, 4, 1800374. Copyright © 2019, John Wiley and Sons, Hoboken, NJ, USA).

Figure 30.
Schematic illustration of acoustic trapping. (A) Samples with high concentration (larger than 10 cells/μL). (B) Samples with low concentration (smaller that 10 cells/μL). (C) Sperm cell trapping (reprinted with permission from Analytical Chemistry 2019, 91, 2186–2191. Copyright © 2019, American Chemical Society, Washington D.C., WA, USA) [91].

Figure 31.
Schematic illustration of topographical manipulation process: (a) working principle, (b) description of the motion of obstacles and microparticles, (c) simulated acoustic microstreaming forces, (d) fluorescent microscopic pictures of the acoustic microstreaming forces, (e) counter clockwise and clockwise motion of the microparticles, (f) relationship between manipulating velocity and frequency and (g) relationship between manipulating velocity and voltage (reprinted with permission from ACS Applied Materials and Interfaces 2017, 9, 38870–38876. Copyright © 2017, American Chemical Society, Washington D.C., WA, USA) [92].

Figure 32.
Schematic illustration of the experimental setup for microcell trapping, using cavitation effect (reprinted from Advanced Science 2019, 6, 1900557, an open-access article distributed under the terms and conditions of the Creative Commons Attribution (CC BY) license) [93].
Figure 32.
Schematic illustration of the experimental setup for microcell trapping, using cavitation effect (reprinted from Advanced Science 2019, 6, 1900557, an open-access article distributed under the terms and conditions of the Creative Commons Attribution (CC BY) license) [93].

© 2020 by the authors. Licensee MDPI, Basel, Switzerland. This article is an open access article distributed under the terms and conditions of the Creative Commons Attribution (CC BY) license (http://creativecommons.org/licenses/by/4.0/).
Share and Cite
MDPI and ACS Style
Deng, Y.; Guo, Y.; Xu, B. Recent Development of Microfluidic Technology for Cell Trapping in Single Cell Analysis: A Review. Processes 2020, 8, 1253. https://0-doi-org.brum.beds.ac.uk/10.3390/pr8101253
AMA Style
Deng Y, Guo Y, Xu B. Recent Development of Microfluidic Technology for Cell Trapping in Single Cell Analysis: A Review. Processes. 2020; 8(10):1253. https://0-doi-org.brum.beds.ac.uk/10.3390/pr8101253
Chicago/Turabian StyleDeng, Yilin, Ying Guo, and Bin Xu. 2020. "Recent Development of Microfluidic Technology for Cell Trapping in Single Cell Analysis: A Review" Processes 8, no. 10: 1253. https://0-doi-org.brum.beds.ac.uk/10.3390/pr8101253
Note that from the first issue of 2016, this journal uses article numbers instead of page numbers. See further details here.