Formulation and Stability of Cellulose-Based Delivery Systems of Raspberry Phenolics


1
Faculty of Food Technology, Josip Juraj Strosmayer University, F. Kuhača 18, 31000 Osijek, Croatia
2
Department of Food, Bioprocessing and Nutrition Sciences, North Carolina State University, Raleigh, NC 27695, USA
*
Author to whom correspondence should be addressed.
Processes 2021, 9(1), 90; https://0-doi-org.brum.beds.ac.uk/10.3390/pr9010090
Submission received: 30 November 2020
/
Revised: 22 December 2020
/
Accepted: 30 December 2020
/
Published: 4 January 2021
(This article belongs to the Special Issue Phenolic Compounds: Extraction, Optimization, Identification and Applications in Food Industry)
Abstract
:Encapsulation of bioactives is a tool to prepare their suitable delivery systems and ensure their stability. For this purpose, cellulose was selected as carrier of raspberry juice phenolics and freeze-dried cellulose/raspberry encapsulates (C/R_Es) were formulated. Influence of cellulose amount (2.5%, 5%, 7.5% and 10%) and time (15 or 60 min) on the complexation of cellulose and raspberry juice was investigated. Obtained C/R_Es were evaluated for total phenolics, anthocyanins, antioxidant activity, inhibition of α-amylase and color. Additionally, encapsulation was confirmed by FTIR. Stability of C/R_Es was examined after 12 months of storage at room temperature. Increasing the amount of cellulose during formulation of C/R_E from 2.5% to 10%, resulted in the decrease of content of total phenolics and anthocyanins. Additionally, encapsulates formulated by 15 min of complexation had a higher amount of investigated compounds. This tendency was retained after storage. The highest antioxidant activities were determined for C/R_E with 2.5% of cellulose and the lowest for those with 10% of cellulose, regardless of the methods used for its evaluation. After storage of 12 months, antioxidant activity slightly increased. Encapsulates with 2.5% of cellulose had the highest and those with 10% of cellulose the lowest capability for inhibition of α-amylase. The amount of cellulose also had an impact on color of C/R_Es. Results of this study suggest that cellulose could be a good encapsulation polymer for delivering raspberry bioactives, especially when cellulose was used in lower percentages for formulation of encapsulates.
1. Introduction
Recommendations of nutritionists are consumption of plant-based foods since this type of diet has been linked with a lowered occurrence of various types of degenerative diseases. Over the years, phenolic compounds and fibers have been highlighted as two major functional compounds responsible for prevention of different diseases [1]. Polyphenols were put forward as components that are related with antioxidant, anti-inflammatory, antimicrobial and antiproliferation activity as well as with reduction of diverse chronic diseases such as cardiovascular and neurodegenerative diseases, certain cancers, type II diabetes and osteoporosis [2,3,4]. The diverse effects of secondary plant metabolites are connected with different chemical structures of those compounds and their major categories include flavonoids, phenolic acids, lignans, coumarins, stilbenes and quinones [2]. Consumption of dietary fibers has been also related with various health benefits such as decrease of risk of development of coronary heart disease, hypertension, diabetes, obesity as well as some gastrointestinal disorders [5]. In plant cells, polyphenols are primarily located in the vacuoles but throughout harvesting, processing and consumption, they can interact with components of plant cell walls (PCWs). Cellulose, hemicellulose and pectin are dominant components of PCWs, with cellulose portion of approximately 35% on a dry weight basis [6,7].
The aim of this study was the preparation of encapsulates based on raspberry phenolics and cellulose to obtain functional food ingredients combining two components with potential health benefits. As a phenolic source we selected raspberries since they are grown worldwide, and are known for their pleasant and favorable flavors as well as for bioactive compounds with potential health benefits [4,8,9]. As far as we know, most of the studies related to phenolics/PCWs were designed to explore release of phenolics bounded on PCWs in gastrointestinal tract under different conditions and examination of influence of type of bonding between phenolics and PCWs. Binding of phenolics to PCWs can significantly affect release of these compounds from the food matrix for potential absorption in the gastrointestinal tract. Studying the effects of the interaction of phenolics and PCWs is challenging due to the complexity of both type of components and those interactions are playing an important role in the bioaccessibility and bioavailability of phenolics [10,11]. Through studies, non-covalent interactions like hydrogen bonds and hydrophobic interactions were emphasized as main mechanisms of complex interaction between phenolics and plant PCWs [12,13,14,15,16,17]. It was observed that these interactions depended on the chemical characteristics (such as molecular structure and molecular weight) as well as on the physical properties and initial concentration of both, phenolic compounds and PCWs [18,19]. Additionally, for these interactions environmental factors like pH, ionic strength, and temperature should not be neglected [20,21]. The aim of our study was to use this knowledge for the preparation of functional food ingredients i.e., to explore the possibility of application of cellulose as a tool for the preparation of functional food additives. Obtained functional food ingredients could be used for enrichment of bakery products, dairy products, fruit products with fibers and phenolics, as well as increase of antioxidant activity and color modification. Nsor–Atindana et al. [22] in their review demonstrated that cellulose has been extensively explored as a functional ingredient in food industry from meat products, emulsions, beverages, dairy products, bakery to confectionary and different types of fillings. They emphasized that this polymer has many promising applications in functional and nutraceutical food industries and can contribute to positive effects on gastrointestinal physiology, and hypolipidemic effects, influencing the expression of enzymes involved in lipid metabolism [22]. In our previous study, we emphasized the possibility of cellulose application as carrier of raspberry volatiles [23] for modification of flavor in added products as another possible application of obtained cellulose/raspberry encapsulates. Therefore, encapsulates were formulated by complexation of cellulose and raspberry juice. Different cellulose/raspberry encapsulates were formulated with constant amount of juice, while the cellulose amounts varied (2.5%, 5%, 7.5% and 10%), and the complexation of cellulose and raspberry juice was carried out for 15 and 60 min. In addition, stability of encapsulates over the time is also a very important quality factor. In order to investigate this, encapsulates were stored for 12 months at room temperature. The amounts of total phenolics content, anthocyanins, antioxidant activity, inhibition of α-amylase and color of the complexes after formulation and during storage were investigated.
2. Materials and Methods
2.1. Materials
Cellulose (microcrystalline) was obtained from Kemika (Zagreb, Croatia). Potassium chloride, sodium acetate, methanol and sodium carbonate, were purchased from Kemika (Zagreb, Croatia). 1Trolox, 12,2-diphenyl-1-picrylhydrazil (DPPH) and 2α-amylase from porcine pancreas (type VI-B, ≥5 units/mg solid) were purchased from Sigma-Aldrich (1St. Louis, MO, USA; 2Germany). Starch soluble, iron (III) chloride hexahydrate, sodium acetate, ethanol, ammonium acetate and Folin–Ciocalteu reagent were bought from Gram-mol (Zagreb, Croatia). Then, 3,5-dinitrosalicylic acid was from Alfa Aesar (Kandel, Germany). Sodium hydroxide and potassium sodium tartarate tetrahydrate were from T.T.T. (Sveta nedjelja, Croatia). Potassium dihydrogen phosphate was from BDH Prolabo (UK). 3Neocuproine, 42,4,6-tripyridyl-s-tirazine (TPTZ) and 5copper (II) chloride were bought from Acros Organics (3Geel, Belgium; 4China; 5SAD). Acetic acid (min 99.5%) was from Alkaloid (Skopje, North Macedonia) and hydrochloric acid (37%) from Carlo Erba Reagents (Val de Reuil, France).
2.2. Formulation of Cellulose/Raspberry Encapsulates
Formulation of cellulose/raspberry encapsulates was described in detail in our previous study [23]. Briefly, cellulose (2.5%, 5%, 7.5% and 10%) and raspberry juice were mixed on a magnetic stirrer for 15 or 60 min at room temperature. Obtained mixtures were centrifuged for 15 min at 4000 rpm, followed by separation of the liquid part and precipitate was freeze-dried to obtain dry powder. Freeze-drying was conducted in a laboratory freeze-dryer (Christ Freeze Dryer, Alpha 1-4, Germany) under following conditions: Freezing temperature was adjusted at −55 °C; the temperature of sublimation from −35 to 0 °C; and the vacuum level 0.220 mbar. The temperature of the isothermal desorption varied from 0 to 21 °C under the vacuum of 0.060 mbar. Obtained freeze-dried encapsulates were used immediately for determination of selected parameters. For evaluation of stability, encapsulates were packed in sealed bags and stored at room temperature for 12 months.
2.3. Preparation of Extracts
First, 0.8 g of the freeze-dried cellulose/raspberry encapsulate was extracted with 5 mL of acidified methanol (HCl:methanol ratio was 1:99) in an ultrasonic bath for 15 min, after which the mixture was allowed to stand for 15 min to separate the solid and liquid phases. The liquid extract was decanted and centrifuged for 10 min at 10,000 rpm. The resulting liquid extract was separated into a plastic tube. Solid phase was extracted two more times with an additional volume of solvent (5 mL), as described above. A new 5 mL of acidified methanol was added to the residue for the fourth time and extracted for 15 min. The whole mixture was centrifuged for 15 min at 4000 rpm. The obtained extract was used for evaluation of total phenols, anthocyanins, inhibition of α-amylase and antioxidant activity.
2.4. Determination of Total Phenolic Content
The total phenolic content was determined according to the modified colorimetric Folin−Ciocalteu method [24]. Briefly, 0.2 mL of extracted sample and 1.8 mL of deionized water were added to the test tube, followed by 10 mL of Folin–Ciocalteu reagent (1:10) and finally 8 mL of 7.5% sodium carbonate (Na2CO3). After development of color (for 120 min), absorbance was read at 765 nm using a spectrophotometer. A gallic acid calibration curve was used for expression of total phenolics and results were expressed as grams of gallic acid equivalents per kilogram of sample (g GAE/kg). Measurements were performed in triplicates.
2.5. Determination of Monomeric Anthocyanin Content
Determination of monomeric anthocyanins was performed by pH-differential method [25]. Briefly, 0.2 mL of extract was mixed with 2.8 mL of 0.025 M KCl (pH 1) and 0.4 M sodium acetate (pH 4.5), respectively. After 15 min, absorbance of mixture was read at two wavelengths (Aλvis = 515 nm and 700 nm) against a blank cell containing distilled water. The absorbance (A) of the sample was calculated according to the following formula [25]:
The monomeric anthocyanin content (AC) was calculated according to the following formula:
where, AC was expressed in mg of cyanidin-3-glucoside/kg, MW was the molecular weight of cyanidin-3-glucoside (449.2), DF was the dilution factor, ε was the molar absorptivity (26,900) and l was the cuvette length (1 cm). All measurements were done in triplicate.
2.6. Inhibition of α-amylase
The experiment was performed according to slightly modified method described by da Silva et al. [26] and Kellogg et al. [27]. Briefly, 0.2 mL of sample was mixed with 0.4 mL of α-amylase solution (1 mg/mL) and mixture was incubated for 10 min at 37 °C. Afterwards, 0.2 mL of 1% starch solution was added and the mixture was incubated for another 10 min at 37 °C. Further, 1 mL of 3,5-dinitrosallicylic acid (DNS) reagent was added and boiled for 5 min to stop the reaction. Mixture was quickly cooled in ice bath to room temperature, and 10 mL of distilled water was added to the mixture. Absorbance was read at wavelength of 540 nm. A control sample represented the uninhibited reaction, and a blank (without the enzyme present) was also measured for each sample. The percentage of inhibition was calculated according to the following formula:
where Ainh was absorbance of the inhibited reaction, Ablank absorbance of the extract with substrate (no enzyme present) and Acon absorbance of the uninhibited enzyme. All measurements were done in triplicate.
2.7. Antioxidant Activity
The antioxidant activity of the samples was determined by the radical scavenging activity method using 2,2-diphenyl-1-picrylhydrazyl radical as previously described by Brand–Williams et al. [28]. Briefly, 0.2 mL of extract was mixed with 3 mL of DPPH solution (0.5 mM). Absorbance was measured at 517 nm after mixture was incubated 15 min. Cupric reducing antioxidant capacity assay was carried out according to the method of Apak et al. [29]. Briefly, mixture of copper chloride (1 mL), neocuproine (1 mL) and ammonium acetate buffer (1 mL) was prepared, and then 0.2 mL of sample extract and 0.9 mL distilled water were added. Absorbance was measured at 450 nm after mixture was incubated for 30 min. The antioxidant capacity of samples was determined by the method of Benzie and Strain [30]. Briefly, 0.2 mL of sample was mixed with 3 mL of FRAP reagent. Absorbance was measured at 593 nm after mixture was incubated for 30 min. In all cases, measurements were done against a blank that was prepared using distilled water. As a standard for expression of antioxidant activity (DPPH, FRAP and CUPRAC), calibration curve of trolox was prepared and results were expressed as µmol of trolox equivalents per 100 g of sample (µmol TE/100 g). All measurements were done in triplicate.
2.8. Color Measurement and Color Change
Color measurements were carried out with a chromometer Minolta CR-400 (Minolta; Osaka, Japan) with recording of L*, a*, b*, C* and °h parameters. Measurements were performed in triplicates. Numerical values of L*, a* and b* were used to calculate the total color change (ΔE).
2.9. Analysis by Fourier Transform Infrared (FTIR) Spectroscopy
For recording of infra-red spectra, FTIR-ATR (Cary 630, Agilent, Santa Clara, CA, USA) was used by the attenuated total reflection method. Screening of samples through the range from 4000 cm−1 to 600 cm−1 was carried out to obtain IR spectra.
2.10. Statistical Analysis
Analysis of variance (ANOVA) and Fisher’s least significant difference (LSD) with the significance defined at p < 0.05 were applied for statistical evaluation of obtained results using software program STATISTICA 13.1 (StatSoft Inc, Tulsa, OK, USA). All results were presented as the mean values ± standard deviation.
3. Results and Discussion
In order to evaluate the possibility of preparation of freeze-dried cellulose-based encapsulates as delivery systems of raspberry phenolics, encapsulates were prepared by complexation of various amounts of cellulose with constant amount of raspberry juice. On the basis of previous studies [7,10,11] of potential absorption of phenolics onto plant cell wall material in the gastrointestinal tract it was observed that interactions occurred rapidly thus we selected shorter and prolonged time of preparation of encapsulates. Therefore, complexation was performed for 15 min and 60 min in order to investigate influence of complexation time on investigated parameters. Stability of freeze-dried encapsulates after 12 months of storage was also evaluated.
3.1. Total Phenolics Content and Anthocyanins Content
Total phenolics content of cellulose/raspberry encapsulates after formulation and 12 months storage are presented in Table 1 while results of anthocyanins content are presented in Table 2. Complexation time and the amount of used cellulose for formulation of cellulose/raspberry encapsulates (C/R_Es) had an impact on the amount of both investigated parameters, total phenolics and anthocyanins content. C/R_E formulated for 15 min of complexation with the addition of 2.5% of cellulose had the highest total phenolics (2.43 g/kg). Increasing the amount of cellulose from 2.5% to 10%, the content of total phenolics decreased. Encapsulates formulated throughout shorter time of complexation (15 min) had a higher amount of total phenolics in comparison to encapsulates formulated for 60 min. This trend was also observed for anthocyanins content. C/R_E formulated by 15 min of complexation with the addition of 2.5% of cellulose had the highest anthocyanins content (429.40 mg/kg). Encapsulates obtained with prolonged complexation had lower anthocyanins content and with the increase of cellulose amount, content of anthocyanins decreased. Study of the interaction between phenolics and cellulose showed that maximum binding capacity depended on molecular structure of these compounds and it ranged from 0.4 to 1.4 g per g of cellulose [7]. Interaction between different phenolics (catechin, ferulic acid, chlorogenic acid, gallic acid and cyanidin-3-glucoside) and cellulose occurred spontaneously, within 1 min, and rapidly increased over 30 min [7]. Up to 2 h, further slow binding occurred but after that time plateau was reached. In addition, it was determined that chlorogenic acid had different behavior then other investigated phenolics. While all other phenolics bonded similarly on a molar basis, binding of chlorogenic acid was lower [7]. Investigation of binding of anthocyanins and phenolic acids from purple carrot juice to cell wall polysaccharides occurred within 30 s and it was observed that binding was rapid within 10 min, while afterwards a relatively slow increase in binding was observed [10,11]. As authors stated [7], those results were beneficial for predication of phenolics behavior during food consumption since it is likely that phenolics would bind to fibers during mastication in the mouth or later in the stomach and small intestine. Our results also support this binding tendency i.e., with prolonged time of complexation lower amount of phenolics was determined on formulated encapsulates. Consequently, we can conclude that complexation of cellulose-based encapsulates would not be time consuming. Liu et al. [1] predicted that initial binding occurred due to adsorption of phenolics on the binding sites of cellulose surface due to presence of labile hydroxyl groups. Additional interaction occurred due to non-covalent binding i.e., hydrogen bonding and hydrophobic interactions [1]. Important factors for non-covalent binding were also phenolic rings i.e., their number and their conformational flexibility [31]. Since non-covalent binding was included in the adsorption process of phenolics onto cellulose, probably prolonged complexation time which included stirring resulted in breaking of hydrogen bonds and hydrophobic interactions therefore lower contents of phenolics on C/R_Es were detected.
During storage, the same tendency as after preparation regarding total phenolics and anthocyanins was observed. Encapsulates with the lowest amount of cellulose addition had the highest amount of phenolics and anthocyanins (respectively). Stability of the obtained encapsulates i.e., retention of components was also evaluated during storage over 12 months period. The highest retention of phenolics was on the encapsulates formulated with 5% and 7.5% of cellulose (complete retention) using 15 min of complexation, as well as in encapsulates with the same amount of cellulose formulated for 60 min of complexation (from 90 to 96%). Samples with 2.5% of cellulose formulated by 15 min and 60 min of complexation had 85% and 70 % of phenolic retention. The lowest retention was on encapsulates formulated with 10% of cellulose (76% in encapsulates formulated for 15 min and 62% on encapsulates formulated for 60 min of complexation). Retention of anthocyanins on encapsulates formulated by 15 min of complexation decreased with the increase of cellulose amounts (65%, 62%, 59% and 55% for encapsulates formulated with 2.5%, 5%, 7.5% and 10% of cellulose, respectively). On encapsulates obtained by prolonged complexation, retention of anthocyanins ranged from 57% to 60%.
3.2. Total Antioxidant Activity and Inhibition of α-amylase
Evaluation of the antioxidant activity was carried out by application of DPPH, FRAP and CUPRAC methods. DPPH method is the most common method for in vitro antioxidant activity evaluation, and it is based on free radical scavenging activity, while FRAP and CUPRAC methods are used for measurement of the ability of antioxidants to reduce ferric iron and cupric ion, respectively [32]. Obtained results of antioxidant activity of C/R_Es are presented in Table 3. Antioxidant activity of C/R_E determined by DPPH method ranged from 23.51 to 20.01 µmol TE/100 g for C/R_Es formulated by 15 min of complexation, and it was determined that with the increase of cellulose amounts, a decrease of antioxidant activity occurred. Statistically significant difference between C/R_Es formulated by 60 min of complexation was not detected. After 12 months of storage, antioxidant activity in all C/R_Es slightly increased but there was no significant difference between C/R_Es with different amounts of cellulose regardless of complexation time. Values of antioxidant activity obtained by FRAP method ranged from 2.81 to 1.79 µmol TE/100 g. C/R_E formulated with 2.5% of cellulose throughout 15 min and 60 min of complexation had the highest antioxidant activity. By increasing the amount of cellulose from 2.5% to 10%, values of antioxidant activity decreased. After storage, the same tendency was retained. Similar results as with the DPPH and FRAP methods, were also obtained by CUPRAC method. C/R_E prepared with 2.5% of cellulose had the highest antioxidant activity and with the increase of cellulose amounts, a decrease in antioxidant activity occurred. After storage, the value of antioxidant activity increased in all encapsulates. C/R_E with 2.5% of cellulose that had the highest phenolic content also had the highest antioxidant activity, while C/R_E with 10% of cellulose, with the lowest phenolic content, had the lowest antioxidant activity. After 12 months of storage, antioxidant activity in most cases was higher than in the C/R_Es after formulation, that was probably a consequence of structural changes of phenolics since formation of polymerized phenols as well as oxidized ones can occur which can exhibit higher antioxidant activity than non-polymerized and non-oxidized phenols [33,34,35].
Inhibition (%) of α-amylase by application of C/R_Es is presented in Table 4. C/R_Es formulated with lower amounts of cellulose had higher capability of inhibition of α-amylase, regardless of time of complexation. After storage, percentage of inhibition of this enzyme decreased. In contrast to the results after formulation, a difference was observed after storage between encapsulates prepared for 15 and 60 min of complexation.
3.3. Color Parameters of Encapsulates
CIE Lab color parameters L*, a*, b*, C* and °h measured for C/R_Es after formulation and after storage at room temperature for 12 months are shown in Table 5 and Table 6. L* value defines lightness of sample (0 is black and 100 is white); a* redness (redness (+) and greenness (-)) and b* yellowness (yellowness (+) and blueness (-)). C* or chroma defines the color saturation value and °h is the hue angle (from 0° for red, over 90° for yellow and 180° for green, up to 270° for blue and back to 0°)).
On C/R_Es after formulation, lightness fluctuated from 68.93 to 74.09. The highest L* value was associated to C/R_E formulated with 10% of cellulose and the lowest with 2.5% of cellulose, regardless of complexation time. In C/R_Es analyzed after storage of 12 months, L* value increased. Increasing of L* value in the C/R_Es after storage could be because of their exposure to light during the storage period. The highest a* value was observed on C/R_E formulated with 2.5% of cellulose and the lowest when 10% of cellulose was used for complexation. These results could be correlated to the anthocyanins content since those C/R_Es also had the highest anthocyanin content. After storage, decrease of a* value occurred but the tendency remained. The same trend was observed for b*, °h and C* values. Total color change was calculated after storage of C/R_Es. The highest total color change was calculated for C/R_E formulated with 7.5% of cellulose and the lowest for C/R_E with 10% of cellulose, regardless of the complexation time.
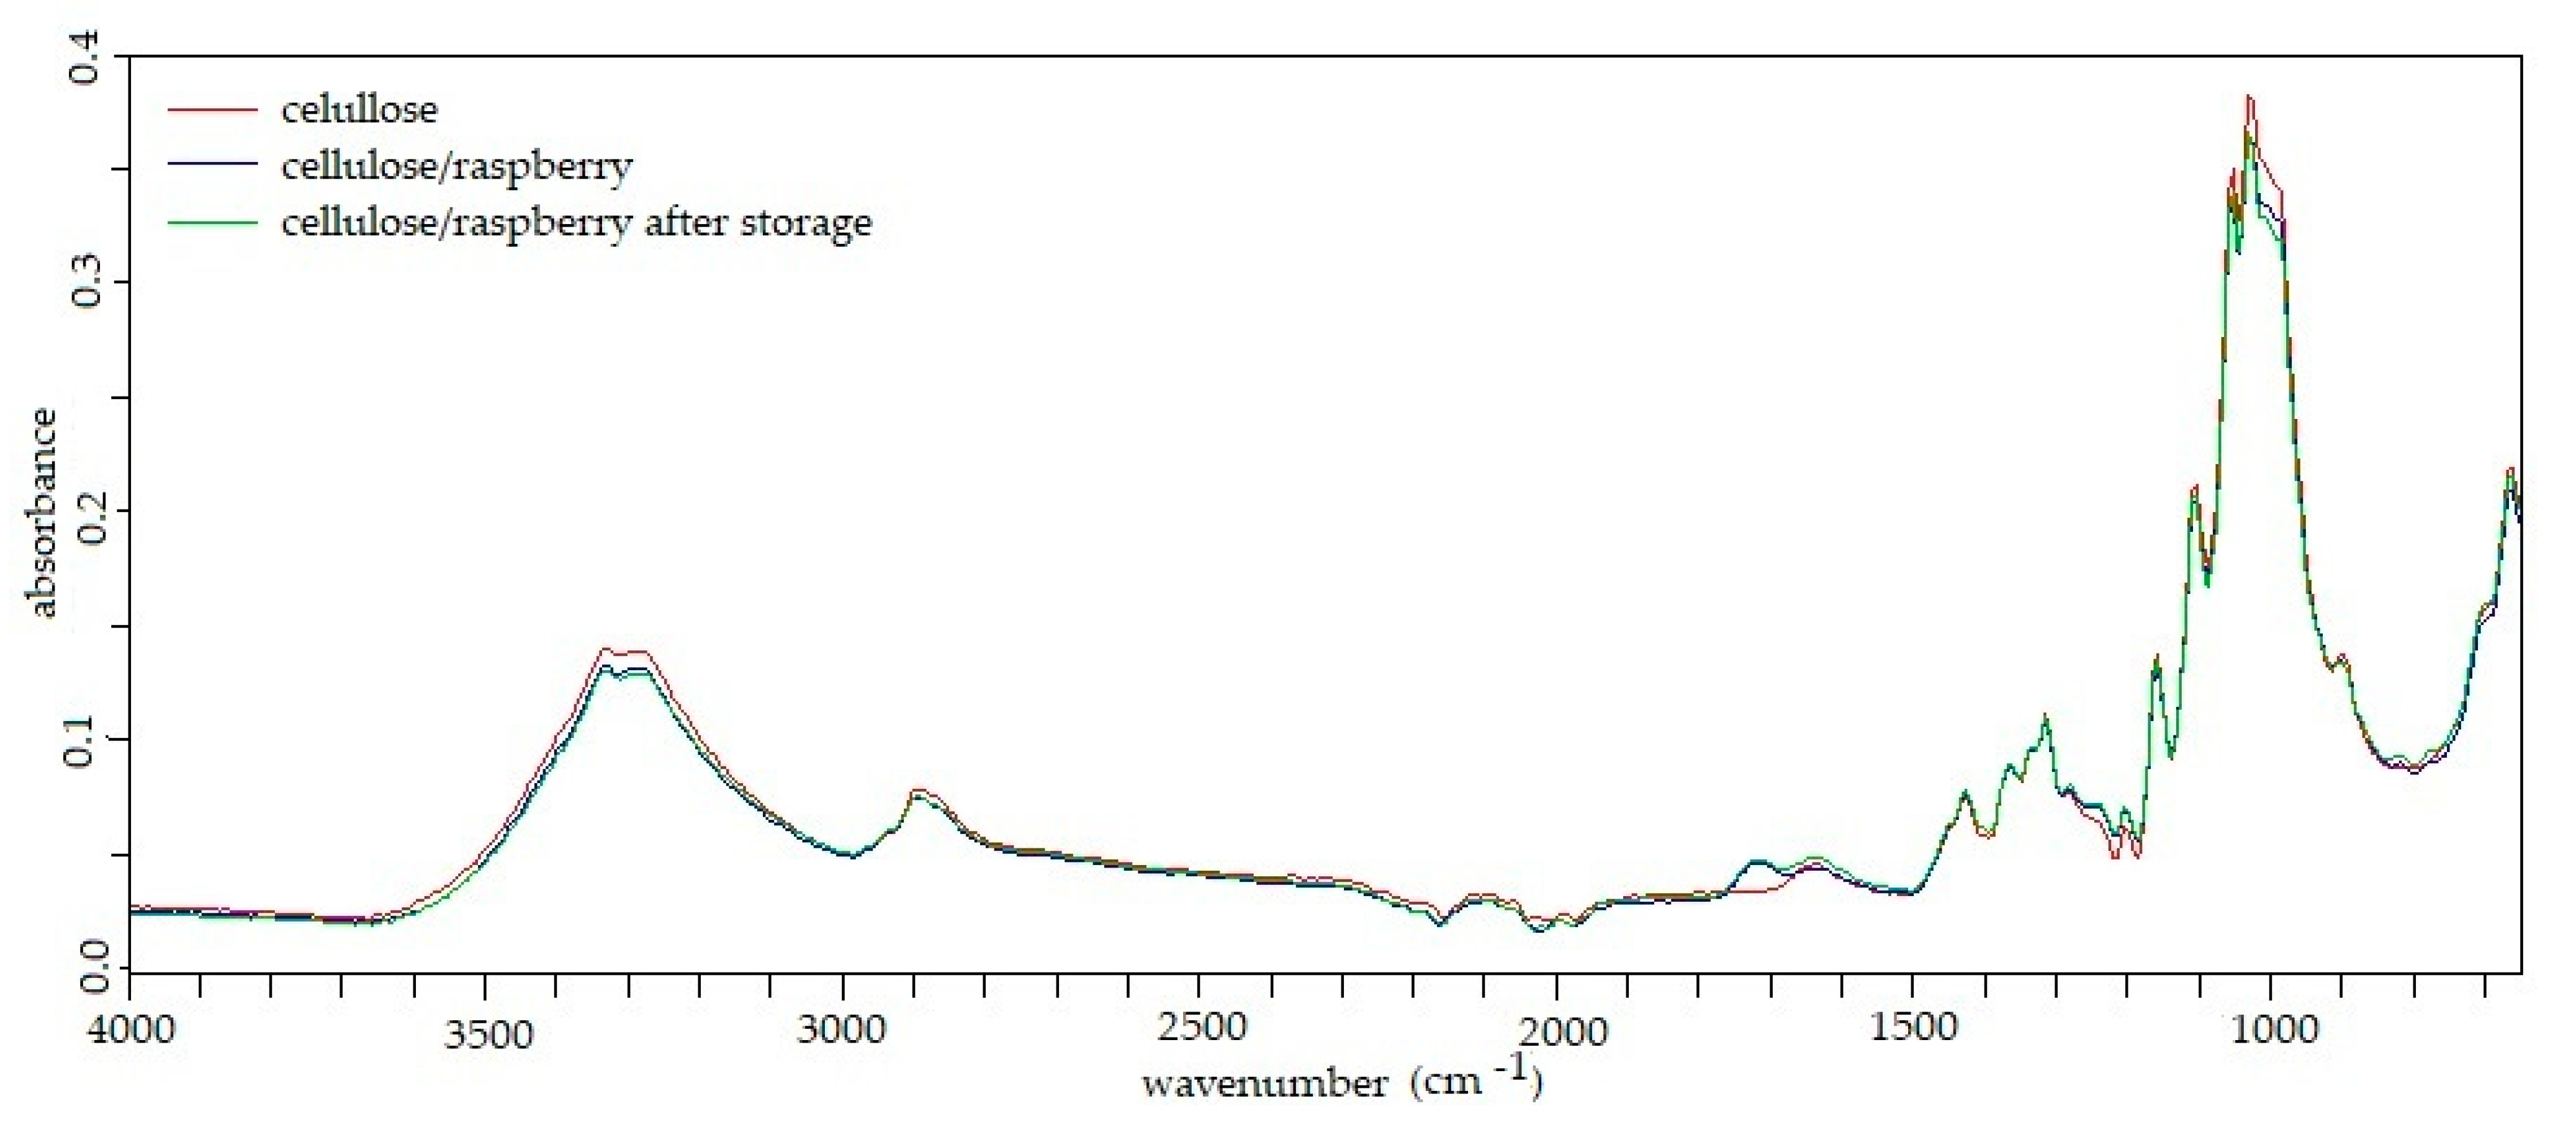
3.4. IR Spectra of Encaptulates
Comparison of IR spectra of cellulose with C/R_Es after formulation and after storage is presented by Figure 1. Since all C/R_Es had identical spectra and identical differences were observed, only one encapsulate was presented. IR spectra of cellulose and C/R_Es overlapped in region from 3400 cm−1 to 3200 cm−1 that can be assigned to stretching of O-H and in several bands. Overlapping bands were at 2900 cm−1 assigned to CH3 symmetric stretch, 1640 cm−1 that defines H-O-H deformation of water, 1431 cm−1 and 1364 cm−1 both assigned to CH2. Furthermore, overlapping was observed on bands at 1312 cm−1 which can be assigned to C-H deformation vibration, 1200 cm−1 assigned to C-O-C, C-O dominated by the ring vibrations of polysaccharides, 1150 cm−1 assigned to C-O stretching vibrations, 1103 cm−1 connected to CO, CC ring of polysaccharides, 1051 cm−1 assigned to C-O stretching and C-O bending of carbohydrates, 1028 cm−1 assigned to CH2 groups and C-O stretching vibration coupled with C-O bending of the C-OH groups of carbohydrates and 894 cm−1 assigned to C-C [36]. In comparison to cellulose, C/R_Es had additional bands at 1714 cm−1, 820 cm−1 and 780 cm−1 which are assigned to C=O stretching (associated with HC=O linked to aromatic or C=O in ketones or carboxyl group), ring CH deformation and out of plane bending vibrations. The decrease of OH stretching that can occur due to intramolecular hydrogen bonding can be interpreted by the ratio of A4000–2995/A1337. This ratio can be used as a criterion of hydrogen-bond intensity (HBI) [37]. HBI decreased in C/R_Es in comparison to cellulose, and the same trend was retained over the storage period. In the study of Abdelwahab and Amin [38] on adsorption of phenols from aqueous solutions by Luffa cylindrica fibers, it was observed that band intensities decreased on the IR spectra when phenols were adsorbed on investigated fibers. They emphasized that functional groups of the fibers surface have been occupied with phenols but also penetration into the interlayer fiber space occurred [38].
Combining results of this study and our previous study [23] it can be concluded that cellulose can be used for formulation of stable delivery systems of raspberry active ingredients i.e., phenolics, anthocyanins and volatiles. Obtained encapsulates could be used as functional additives to some products like dairy products, bakery products, fruit products, confectionary and different types of fillings. Encapsulates could be used in order to improve nutritional value of products throughout enrichment of those products with phenolic compounds and increase of their antioxidant potential. On the other hand, these functional additives can improve quality of products throughout color and flavor modification but also decrease of oxidation of labile components can be expected.
4. Conclusions
Cellulose was chosen as the delivery system for raspberry bioactive compounds in order to formulate an ingredient that could be used for development and/or improvement of novel foods. Results of our study revealed that amount of cellulose and complexation time used for formulation of encapsulates had influence on the adsorption efficiency of raspberry bioactive compounds. Encapsulates formulated with lower amount of cellulose for 15 min of complexation had better binding of phenolic components. Therefore, we can conclude that formulation of cellulose-based encapsulates would not be time consuming. On the other hand, after the prolonged storage time, the highest phenolic retention was observed in the complexes prepared with 5% and 7.5% of cellulose. Encapsulates with 2.5% of cellulose also had the highest antioxidant activity, and those encapsulates had the highest capability of inhibition of α-amylase. This research is a good platform for development of new products as well as for improvement of existing ones. Future studies should be governed to formulation of the products with the addition of cellulose-based encapsulates and investigation of real effects of encapsulates on antioxidant potential, oxidative stability, color modification and flavor modification of products in which they were added. Stability of enriched products over the time would also give valuable insight on real effect of encapsulates on product quality. Moreover, sensory analysis of newly obtained products would be beneficial to obtain possible response of consumers on this type of enriched products.
Author Contributions
Conceptualization, M.K. and J.Š.; methodology, J.V., A.P. and M.K.; formal analysis, J.V., I.B.; investigation, J.V., I.B.; data curation, J.V., I.B.; writing—original draft preparation, J.V., I.B.; writing—review and editing, M.K., A.P., J.Š.; supervision, M.K., A.P.; project administration, M.K.; funding acquisition, M.K. All authors have read and agreed to the published version of the manuscript.
Funding
The work was part of PZS-2019-02-1595 project and it has been fully supported by the “Research Cooperability” Program of the Croatian Science Foundation funded by the European Union from the European Social Fund under the Operational Programme Efficient Human Resources 2014-2020.
Institutional Review Board Statement
Not applicable.
Informed Consent Statement
Not applicable.
Data Availability Statement
Not available.
Conflicts of Interest
The authors declare no conflict of interest.
References
- Liu, D.; Martinez-Sanz, M.; Lopez-Sanchez, P.; Gilbert, E.P.; Gidley, M.J. Adsorption behavior of polyphenols on cellulose is affected by processing history. Food Hydrocoll. 2017, 63, 496–507. [Google Scholar] [CrossRef]
- Cai, Y.Z.; Sun, M.; Xing, J.; Luo, Q.; Corke, H. Structure radical scavenging activity relationships of phenolic compounds from traditional Chinese medicinal plants. Life Sci. 2006, 78, 2872–2888. [Google Scholar] [CrossRef] [PubMed]
- Velderrain-Rodríguez, G.R.; Palafox-Carlos, H.; Wall-Medrano, A.; Ayala-Zavala, J.F.; Chen, C.Y.; Robles-Sánchez, M.; Astiazaran-García, H.; Alvarez-Parrilla, E.; González-Aguilar, G.A. Phenolic compounds: Their journey after intake. Food Func. 2014, 5, 189–197. [Google Scholar] [CrossRef] [PubMed]
- Carvalho, E.; Franceschi, P.; Feller, A.; Palmieri, L.; Wehrens, R.; Martens, S. A targeted metabolomics approach to understand differences in flavonoid biosynthesis in red and yellow raspberries. Plant Physiol. Biochem. 2013, 72, 79–86. [Google Scholar] [CrossRef] [PubMed]
- Anderson, J.W.; Baird, P.; Davis, R.H., Jr.; Ferreri, S.; Knudtson, M.; Koraym, A.; Waters, V.; Williams, C.L. Health benefits of dietary fiber. Nutr. Rev. 2009, 67, 188–205. [Google Scholar] [CrossRef] [PubMed]
- Brett, C.T.; Waldron, K.W. Physiology and Biochemistry of Plant Cell Walls, 2nd ed.; Chapman & Hall, Springer: Amsterdam, The Netherlands, 1996. [Google Scholar]
- Phan, A.D.T.; Netzel, G.; Wang, D.; Flanagan, B.M.; D’Arcy, B.R.; Gidley, M.J. Binding of dietary polyphenols to cellulose: Structural and nutritional aspects. Food Chem. 2015, 171, 388–396. [Google Scholar] [CrossRef] [PubMed]
- Battino, M.; Beekwilder, J.; Denoyes-Rothan, B.; Laimer, M.; McDougall, G.J.; Mezzetti, B. Bioactive compounds in berries relevant to human health. Nutr. Rev. 2009, 67 (Suppl. 1), S145–S150. [Google Scholar] [CrossRef]
- Durgo, K.; Belscak-Cvitanovic, A.; Stancic, A.; Franekic, J.; Komes, D. The bioactive potential of red raspberry (Rubus idaeus L.) leaves in exhibiting cytotoxic and cytoprotective activity on human laryngeal carcinoma and colon adenocarcinoma. J. Med. Food 2012, 15, 258–268. [Google Scholar] [CrossRef]
- Padayachee, A.; Netzel, G.; Netzel, M.; Day, L.; Zabaras, D.; Mikkelsen, D. Binding of polyphenols to plant cell wall analogues—Part 1: Anthocyanins. Food Chem. 2012, 134, 155–161. [Google Scholar] [CrossRef]
- Padayachee, A.; Netzel, G.; Netzel, M.; Day, L.; Zabaras, D.; Mikkelsen, D. Binding of polyphenols to plant cell wall analogues—Part 2: Phenolic acids. Food Chem. 2012, 135, 2287–2292. [Google Scholar] [CrossRef]
- Phan, A.D.T.; Flanagan, B.M.; D’Arcy, B.R.; Gidley, M.J. Binding selectivity of dietary polyphenols to different plant cell wall components: Quantification and mechanism. Food Chem. 2017, 233, 216–227. [Google Scholar] [CrossRef] [PubMed]
- Pinelo, M.; Arnous, A.; Meyer, A.S. Upgrading of grape skins: Significance of plant cell-wall structural components and extraction techniques for phenol release. Trends Food Sci. Technol. 2006, 17, 579–590. [Google Scholar] [CrossRef]
- Le Bourvellec, C.; Renard, C. Interactions between polyphenols and macromolecules: Quantification methods and mechanisms. Crit. Rev. Food Sci. Nutr. 2012, 52, 213–248. [Google Scholar] [CrossRef] [PubMed]
- Le Bourvellec, C.; Guyot, S.; Renard, C. Non-covalent interaction between procyanidins and apple cell wall material: Part I. Effect of some environmental parameters. Biochim. Biophys. Acta Gen. Subj. 2004, 1672, 192–202. [Google Scholar] [CrossRef] [PubMed]
- Renard, C.M.; Baron, A.; Guyot, S.; Drilleau, J.-F. Interactions between apple cell walls and native apple polyphenols: Quantification and some consequences. Int. J. Biol. Macromol. 2001, 29, 115–125. [Google Scholar] [CrossRef]
- Tang, H.R.; Covington, A.D.; Hancock, R.A. Structure-activity relationships in the hydrophobic interactions of polyphenols with cellulose and collagen. Biopolymers 2003, 70, 403–413. [Google Scholar] [CrossRef] [PubMed]
- Le Bourvellec, C.; Renard, C. Non-covalent interaction between procyanidins and apple cell wall material. Part II: Quantification and impact of cell wall drying. Biochim. Biophys. Acta Gen. Subj. 2005, 1725, 1–9. [Google Scholar] [CrossRef]
- Le Bourvellec, C.; Bouchet, B.; Renard, C. Non-covalent interaction between procyanidins and apple cell wall material. Part III: Study on model polysaccharides. Biochim. Biophys. Acta Gen. Subj. 2005, 1725, 10–18. [Google Scholar] [CrossRef]
- Gao, R.P.; Liu, H.; Peng, Z.; Wu, Z.; Wang, Y.X.; Zhao, G.H. Adsorption of (–)-epigallocatechin-3-gallate (EGCG) onto oat beta-glucan. Food Chem. 2012, 132, 1936–1943. [Google Scholar] [CrossRef]
- Wu, Z.; Ming, J.; Gao, R.; Wang, Y.; Liang, Q.; Yu, H. Characterization and antioxidant activity of the complex of tea polyphenols and oat β-glycan. J. Agric. Food Chem. 2011, 59, 10737–10746. [Google Scholar] [CrossRef]
- Nsor-Atindana, J.; Chen, M.; Goff, H.D.; Zhong, F.; Sharif, H.R.; Li, Y. Functionality and nutritional aspects of microcrystalline cellulose in food. Carbohydr. Polym. 2017, 172, 159–174. [Google Scholar] [CrossRef] [PubMed]
- Vukoja, J.; Pichler, A.; Ivić, I.; Šimunović, J.; Kopjar, M. Cellulose as a delivery system of raspberry juice volatiles and their stability. Molecules 2020, 25, 2624. [Google Scholar] [CrossRef] [PubMed]
- Singleton, V.L.; Rossi, J.A. Colorimetry of total phenolics with phosphomolybdic-phosphotonutric acid reagents. Am. J. Enol. Vitic. 1965, 16, 144–158. [Google Scholar]
- Giusti, M.M.; Wrolstad, R.E. Characterization and Measurement of Anthocyanins by UV-Visible Spectroscopy. In Current Protocols in Food Analytical Chemistry Current Protocols; John Wiley &Sons, Inc.: Hoboken, NJ, USA, 2001; pp. F1.2.1–F1.2.13. [Google Scholar]
- da Silva, S.M.; Koehnlein, E.A.; Bracht, A.; Castoldi, R.; de Morais, G.R.; Baesso, M.L.; Peralta, R.A.; de Souza, C.G.M.; de Sá-Nakanishi, A.B.; Peralta, R.M. Inhibition of salivary and pancreatic α-amylases by a pinhão coat (Araucaria angustifolia) extract rich in condensed tannin. Food Res. Int. 2014, 56, 1–8. [Google Scholar] [CrossRef] [Green Version]
- Kellogg, J.; Grace, M.H.; Lila, M.A. Phlorotannins from Alaskan seaweed inhibit carbolytic enzyme activity. Mar. Drugs 2014, 12, 5277–5294. [Google Scholar] [CrossRef]
- Brand-Williams, W.; Cuvelier, M.E.; Berset, C. Use of a free radical method to evaluate antioxidant activity. Lebensm. Wiss. Technol. 1995, 28, 25–30. [Google Scholar] [CrossRef]
- Apak, R.; Guculu, K.G.; Ozyurek, M.; Karademir, S.E. Novel total antioxidant capacity index for dietary polyphenols and vitamins C and E, using their cupric iron reducing capability in the presence of neocuproine: CUPRAC method. J. Agric. Food Chem. 2004, 52, 7970–7981. [Google Scholar] [CrossRef]
- Benzie, I.F.; Strain, J.J. The ferric reducing ability of plasma (FRAP) as a measure of “antioxidant power”: The FRAP assay. Anal. Biochem. 1996, 239, 70–79. [Google Scholar] [CrossRef] [Green Version]
- Cartalade, D.; Vernhet, A. Polar interactions in flavan-3-ol adsorption on solid surfaces. J. Agric. Food Chem. 2006, 54, 3086–3094. [Google Scholar] [CrossRef]
- Alam, M.N.; Bristi, N.J.; Rafiquzzaman, M. Review on in vivo and in vitro methods evaluation of antioxidant activity. Saudi Pharm. J. 2013, 21, 143–152. [Google Scholar] [CrossRef] [Green Version]
- Da Porto, C.; Calligaris, S.; Celotti, E.; Nicoli, M.C. Antiradical properties of commercial cognacs assessed by the DPPH test. J. Agric. Food Chem. 2000, 48, 4241–4245. [Google Scholar] [CrossRef] [PubMed]
- Manzocco, L.; Calligaris, S.; Mastrocola, D.; Nicoli, M.C.; Lerici, C.R. Review of nonenzymatic browning and antioxidant capacity in processed foods. Trends Food Sci. Technol. 2001, 11, 340–346. [Google Scholar] [CrossRef]
- Nicoli, M.C.; Calligaris, S.; Manzocco, L. Effect of enzymatic and chemical oxidation on the antioxidant capacity of catechin model systems and apple derivatives. J. Agric. Food Chem. 2000, 48, 4576–4580. [Google Scholar] [CrossRef] [PubMed]
- Movasaghi, Z.; Rehman, S.; Rehman, I. Fourier transform infrared (FTIR) spectroscopy of biological tissues. Appl. Spectrosc. Rev. 2008, 43, 134–179. [Google Scholar] [CrossRef]
- Oh, S.Y.; Yoo, D.I.; Shinb, Y.; Seoc, G. FTIR analysis of cellulose treated with sodium hydroxide and carbon dioxide. Carbohydr. Res. 2005, 340, 417–428. [Google Scholar] [CrossRef]
- Abdelwahab, O.; Amin, N.K. Adsorption of phenol from aqueous solutions by Luffa cylindrica fibers: Kinetics, isotherm and thermodynamic studies. Egypt. J. Aquat. Res. 2013, 39, 215–223. [Google Scholar] [CrossRef] [Green Version]
Figure 1.
IR spectra of cellulose and cellulose/raspberry encapsulates after preparation and after storage.
Figure 1.
IR spectra of cellulose and cellulose/raspberry encapsulates after preparation and after storage.


Table 1.
Total phenolics content (g/kg) on cellulose/raspberry encapsulates (C/R_Es) prepared by 15 or 60 min of complexation, after formulation and after storage.
Table 1.
Total phenolics content (g/kg) on cellulose/raspberry encapsulates (C/R_Es) prepared by 15 or 60 min of complexation, after formulation and after storage.
| Complexation Time (min) | ||
|---|---|---|
| Samples | 15 | 60 |
| After preparation | ||
| C/R_E_2.5% | 2.43 ± 0.03 a | 1.96 ± 0.01 a |
| C/R_E_5% | 1.70 ± 0.25 c | 1.54 ± 0.03 b |
| C/R_E_7.5% | 1.38 ± 0.02 d | 1.23 ± 0.01 c |
| C/R_E_10% | 1.26 ± 0.27 e | 1.16 ± 0.04 c |
| After 12 months of storage | ||
| C/R_E_2.5% | 2.08 ± 0.11 b | 1.67 ± 0.15 b |
| C/R_E_5% | 1.76 ± 0.22 c | 1.50 ± 0.11 b |
| C/R_E_7.5% | 1.47 ± 0.14 d | 1.19 ± 0.29 c |
| C/R_E_10% | 0.96 ± 0.17 e | 0.72 ± 0.06 d |
Results in the same column marked with the same letters were not significantly different (p ≤ 0.05); Statistical differences between results are presented in the tables in the following increasing order: a > b > c > d > e; 2.5%, 5%, 7.5% and 10%—the amounts of used cellulose for formulation of C/R_Es.
Table 2.
Anthocyanin content (mg/kg) on C/R_Es prepared by 15 or 60 min of complexation, after formulation and after storage.
Table 2.
Anthocyanin content (mg/kg) on C/R_Es prepared by 15 or 60 min of complexation, after formulation and after storage.
| Samples | Complexation Time (min) | |
|---|---|---|
| 15 | 60 | |
| After formulation | ||
| C/R_E_2.5% | 429.40 ± 2.98 a | 411.88 ± 1.12 a |
| C/R_E_5% | 392.04 ± 5.84 b | 374.02 ± 2.37 b |
| C/R_E_7.5% | 356.83 ± 4.10 c | 337.35 ± 4.09 c |
| C/R_E_10% | 320.19 ± 2.50 d | 274.10 ± 0.00 d |
| After 12 months of storage | ||
| C/R_E_2.5% | 280.75 ± 5.58 e | 237.06 ± 5.64 e |
| C/R_E_5% | 243.01 ± 2.41 f | 221.08 ± 2.98 f |
| C/R_E_7.5% | 209.79 ± 4.85 g | 192.40 ± 0.00 g |
| C/R_E_10% | 175.43 ± 3.21 h | 166.36 ± 0.37 h |
Results in the same column marked with the same letters were not significantly different (p ≤ 0.05); Statistical differences between results are presented in the tables in the following increasing order: a > b > c > d > e > f > g > h; 2.5%, 5%, 7.5% and 10%—the amounts of used cellulose for formulation of C/R_Es.
Table 3.
Antioxidant activity (µmol TE/100 g) of C/R_Es prepared by 15 or 60 min of complexation, after formulation and after storage.
Table 3.
Antioxidant activity (µmol TE/100 g) of C/R_Es prepared by 15 or 60 min of complexation, after formulation and after storage.
| DPPH | FRAP | CUPRAC | ||||
|---|---|---|---|---|---|---|
| Samples | Complexation Time (min) | |||||
| 15 | 60 | 15 | 60 | 15 | 60 | |
| After formulation | ||||||
| C/R_E_2.5% | 23.51 ± 0.56 b | 22.86 ± 0.15 b | 2.81 ± 0.02 b | 2.56 ± 0.15 a | 103.20 ± 0.19 b | 82.94 ± 5.14 b |
| C/R_E_5% | 22.83 ± 0.31 b | 23.10 ± 0.15 b | 2.40 ± 0.05 d | 2.50 ± 0.14 a | 79.61 ± 0.43 c | 84.84 ± 2.53 b |
| C/R_E_7.5% | 22.24 ± 0.19 c | 22.79 ± 0.02 b | 2.29 ± 0.03 d | 2.09 ± 0.04 b | 69.19 ± 1.60 e | 70.19 ± 0.04 c |
| C/R_E_10% | 20.01 ± 0.78 d | 22.73 ± 0.17 b | 2.02 ± 0.02 e | 1.79 ± 0.06 c | 54.47 ± 5.91 f | 55.48 ± 2.80 e |
| After storage | ||||||
| C/R_E_2.5% | 25.68 ± 0.27 a | 25.89 ± 0.36 a | 3.08 ± 0.08 a | 2.52 ± 0.08 a | 127.30 ± 0.20 a | 97.59 ± 3.81 a |
| C/R_E_5% | 24.96 ± 1.32 a,b | 26.52 ± 0.31 a | 2.36 ± 0.05 d | 2.46 ± 0.03 a | 100.70 ± 3.30 b | 97.88 ± 2.53 a |
| C/R_E_7.5% | 26.54 ± 0.64 a | 25.15 ± 0.59 a | 2.59 ± 0.04 c | 2.01 ± 0.00 b | 92.26 ± 0.20 c | 85.02 ± 0.96 b |
| C/R_E_10% | 25.64 ± 0.16 a | 25.29 ± 0.83 a | 1.76 ± 0.00 f | 1.72 ± 0.02 c | 81.54 ± 1.50 c | 66.65 ± 1.22 d |
Results in the same column marked with the same letters were not significantly different (p ≤ 0.05); Statistical differences between results are presented in the tables in the following increasing order: a > b > c > d > e > f; 2.5%, 5%, 7.5% and 10%—the amounts of used cellulose for formulation of C/R_Es.
Table 4.
Inhibition (%) of α-amylase by application C/R_Es prepared by 15 or 60 min of complexation, after formulation and after storage.
Table 4.
Inhibition (%) of α-amylase by application C/R_Es prepared by 15 or 60 min of complexation, after formulation and after storage.
| Samples | Complexation Time (min) | |
|---|---|---|
| 15 | 60 | |
| After preparation | ||
| C/R_E_2.5% | 56.07 ± 0.18 a | 57.40 ± 0.58 a |
| C/R_E_5% | 54.84 ± 0.50 b | 57.15 ± 0.52 a |
| C/R_E_7.5% | 53.43 ± 0.21 c | 54.90 ± 0.39 b |
| C/R_E_10% | 53.69 ± 0.14 c | 52.40 ± 0.25 c |
| After 12 months of storage | ||
| C/R_E_2.5% | 45.84 ± 0.24 b | 48.40 ± 0.66 c |
| C/R_E_5% | 45.54 ± 0.41 b | 48.26 ± 0.03 c |
| C/R_E_7.5% | 45.63 ± 0.25 b | 48.87 ± 0.22 b |
| C/R_E_10% | 45.32 ± 0.41 b | 48.43 ± 0.47 a |
Results in the same column marked with the same letters were not significantly different (p ≤ 0.05); Statistical differences between results are presented in the tables in the following increasing order: a > b > c; 2.5%, 5%, 7.5% and 10%—the amounts of used cellulose for formulation of C/R_Es.
Table 5.
Color parameters of C/R_Es prepared by 15 or 60 min of complexation after formulation.
| L* | a* | b* | °h | C* | |
|---|---|---|---|---|---|
| 15 min of complexation | |||||
| C/R_E_2.5% | 68.93 ± 0.03 f | 34.42 ± 0.09 a | 2.28 ± 0.06 a | 3.79 ± 0.11 a | 34.50 ± 0.09 a |
| C/R_E_5% | 70.71 ± 0.02 d | 32.88 ± 0.06 b | 1.52 ± 0.04 b,c | 2.64 ± 0.07 c | 32.92 ± 0.05 b |
| C/R_E_7.5% | 71.14 ± 0.02 c | 32.39 ± 0.03 b,c | 1.25 ± 0.01 d | 2.21 ± 0.03 d | 32.41 ± 0.03 c |
| C/R_E_10% | 73.57 ± 0.01 b | 30.38 ± 0.03 e | 1.46 ± 0.02 c | 2.75 ± 0.04 c | 30.42 ± 0.03 e |
| 60 min of complexation | |||||
| C/R_E_2.5% | 69.25 ± 0.02 e | 34.18 ± 0.05 a | 2.29 ± 0.04 a | 3.83 ± 0.06 a | 34.26 ± 0.05 a |
| C/R_E_5% | 71.58 ± 0.02 c | 32.14 ± 0.06 c | 1.44 ± 0.04 c | 2.57 ± 0.07 c | 32.17 ± 0.06 c |
| C/R_E_7.5% | 71.60 ± 0.01 c | 31.92 ± 0.02 d | 1.78 ± 0.02 b | 3.20 ± 0.02 b | 31.97 ± 0.02 d |
| C/R_E_10% | 74.09 ± 0.02 a | 29.94 ± 0.04 f | 1.11 ± 0.04 d | 2.13 ± 0.07 d | 29.96 ± 0.04 f |
Results in the same column marked with the same letters were not significantly different (p ≤ 0.05); Statistical differences between results are presented in the tables in the following increasing order: a > b > c > d > e > f; 2.5%, 5%, 7.5% and 10%—the amounts of used cellulose for formulation of C/R_Es.
Table 6.
Color parameters of C/R_Es prepared by 15 or 60 min of complexation after storage.
| L* | a* | b* | ΔE | °h | C* | |
|---|---|---|---|---|---|---|
| 15 min of complexation | ||||||
| C/R_E_2.5% | 73.37 ± 0.05 e | 27.23 ± 0.01 a | 2.47 ± 0.04 a | 8.45 | 5.18 ± 0.08 b | 27.34 ± 0.01 a |
| C/R_E_5% | 74.17 ± 0.05 d | 26.76 ± 0.05 b | 2.13 ± 0.01 c | 7.06 | 4.55 ± 0.03 c | 26.85 ± 0.05 b |
| C/R_E_7.5% | 76.30 ± 0.02 b | 24.42 ± 0.02 c | 1.89 ± 0.01 d | 9.52 | 4.43 ± 0.02 c | 24.49 ± 0.02 c |
| C/R_E_10% | 76.60 ± 0.02 b | 24.67 ± 0.02 c | 1.57 ± 0.01 e | 6.47 | 3.63 ± 0.03 c | 24.72 ± 0.02 c |
| 60 min of complexation | ||||||
| C/R_E_2.5% | 73.62 ± 0.02 e | 27.41 ± 0.03 a | 2.03 ± 0.03 c | 8.06 | 4.24 ± 0.07 c | 27.48 ± 0.03 a |
| C/R_E_5% | 75.41 ± 0.01 c | 24.67 ± 0.02 c | 2.36 ± 0.00 b | 8.44 | 5.47 ± 0.01 a | 24.78 ± 0.02 c |
| C/R_E_7.5% | 76.39 ± 0.02 b | 24.17 ± 0.02 d | 2.07 ± 0.01 c | 9.12 | 4.89 ± 0.07 b | 24.26 ± 0.02 c |
| C/R_E_10% | 77.05 ± 0.01 a | 23.73 ± 0.01 e | 1.86 ± 0.03 d | 6.21 | 4.47 ± 0.07 c | 23.80 ± 0.01 d |
Results in the same column marked with the same letters were not significantly different (p ≤ 0.05); Statistical differences between results are presented in the tables in the following increasing order: a > b > c > d > e; 2.5%, 5%, 7.5% and 10%—the amounts of used cellulose for formulation of C/R_Es.
Publisher’s Note: MDPI stays neutral with regard to jurisdictional claims in published maps and institutional affiliations. |
© 2021 by the authors. Licensee MDPI, Basel, Switzerland. This article is an open access article distributed under the terms and conditions of the Creative Commons Attribution (CC BY) license (http://creativecommons.org/licenses/by/4.0/).
Share and Cite
MDPI and ACS Style
Vukoja, J.; Buljeta, I.; Pichler, A.; Šimunović, J.; Kopjar, M. Formulation and Stability of Cellulose-Based Delivery Systems of Raspberry Phenolics. Processes 2021, 9, 90. https://0-doi-org.brum.beds.ac.uk/10.3390/pr9010090
AMA Style
Vukoja J, Buljeta I, Pichler A, Šimunović J, Kopjar M. Formulation and Stability of Cellulose-Based Delivery Systems of Raspberry Phenolics. Processes. 2021; 9(1):90. https://0-doi-org.brum.beds.ac.uk/10.3390/pr9010090
Chicago/Turabian StyleVukoja, Josipa, Ivana Buljeta, Anita Pichler, Josip Šimunović, and Mirela Kopjar. 2021. "Formulation and Stability of Cellulose-Based Delivery Systems of Raspberry Phenolics" Processes 9, no. 1: 90. https://0-doi-org.brum.beds.ac.uk/10.3390/pr9010090
Note that from the first issue of 2016, this journal uses article numbers instead of page numbers. See further details here.