Nitrogen Removal from Agricultural Subsurface Drainage by Surface-Flow Wetlands: Variability


Independent Researcher, Natal 59064-740, Brazil
Processes 2021, 9(1), 156; https://0-doi-org.brum.beds.ac.uk/10.3390/pr9010156
Submission received: 7 December 2020
/
Revised: 8 January 2021
/
Accepted: 10 January 2021
/
Published: 15 January 2021
(This article belongs to the Special Issue Gas, Water and Solid Waste Treatment Technology)
Abstract
:Agriculture has long been considered a great source of nitrogen (N) to surface waters and a major cause of eutrophication. Thus, management practices at the farm-scale have since attempted to mitigate the N losses, although often limited in tile-drained agricultural catchments, which speed up the N transport, while minimizing natural removal in the landscape. In this context, surface-flow constructed wetlands (SFWs) have been particularly implemented as an edge-of-field strategy to intercept tile drains and reduce the N loads by re-establishing ecosystems services of previously drained water ponded areas. These systems collect the incoming water volumes in basins sufficiently large to prolong the hydraulic residence time to a degree where biogeochemical processes between the water, soil, sediments, plants, macro and microorganisms can mediate the removal of N. Despite their documented suitability, great intra and inter-variability in N treatment is still observed to date. Therefore, it is essential to thoroughly investigate the driving factors behind performance of SFWs, in order to support their successful implementation according to local catchment characteristics, and ensure compliance with N removal goals. This review contextualizes the aforementioned issue, and critically evaluates the influence of hydrochemistry, hydrology and biogeochemistry in the treatment of N by SFWs.
1. Introduction
1.1. Agriculture as Nitrogen Sources
Nitrogen (N) is an essential element for crop systems, and has been progressively used in agriculture as fertilizers, which made agricultural catchments a major source of N with detrimental effects on the quality of inland and coastal surface waters, including an increased incidence of eutrophication [1,2,3]. In this context, precipitation and mineralization of the soil organic matter are non-controllable factors which highly regulate the level of N leaching and subsequent loss [1]. Application of fertilizers in agricultural fields, on the other hand, can be regulated at the farm-scale, and anticipates the excess N content in the soil profile prone to leaching [1,4,5]. Therefore, efforts have been made to decrease or optimize the use of fertilizers by balancing N inputs with crop uptake through proper timing and rate of application in order to prevent N accumulation (residual N) and loss [1,6].
Management practices at the farm-scale, often supported by agricultural policies and measures such as the Water Framework Directive, are crucial to reduce N losses and mitigate the impact of agriculture. However, these are often insufficient to reduce N losses to desired levels and protect surface waters [5,7,8]. This normally occurs when the N surplus or storage in the soil profile is particularly high. A common challenge is to find a fine balance between N availability and crop growth through the application of fertilizers so that optimal production and minimal N leaching are achieved [4,5,6]. Furthermore, the heterogeneous distribution of N across agricultural fields complicates this challenge [6]. Therefore, application of fertilizers above the required level, thus producing N surpluses, are normally the case [4]. In spite of that, crop rotations that include perennial crops have demonstrated great capacity to reduce N leaching [5,9], although limitations can occur owing to climatic variations [6] or difficulties to make the activity profitable [7]. Moreover, controlled drainage has been used to control the loss of N by regulating the water table level at the site and the resulting outflow [10]. However, this practice can be somewhat complex (e.g., in steep terrains) and hinder crop production [6,10], besides increasing the risk of surface runoff and phosphorus loss due to the emergence of reducing conditions in the soil [11]. Cover crops, in turn, have been reported to reduce N leaching through uptake and storage of organic N in some plant species between crop seasons [6]. Short and cold periods between crop harvest and new planting, however, may limit the effectiveness of this practice. The effect of tillage, on the other hand, can be negligible [1,4] or even negative by supporting N mineralization and subsequent leaching [5,6,7]. Finally, these practices may also be limited in catchments rich in organic matter, where N mineralization is promoted [1], or in the so-called critical source areas, where N losses are markedly high.
Subsurface drainage has been largely utilized in agricultural catchments with low-permeable and fine-textured soils (e.g., loamy and clayey soils) to allow proper water infiltration and prevent waterlogging at the site so that agricultural activities can be carried out [12]. However, the drainage networks also function as a direct conduit of nutrients, speeding up the transport of N to surface waters downstream, while minimizing surface runoff and the transport of sediment particles [1,7,10]. Macro-pores in the soil profile and higher soil permeability can also enhance the leaching of N to tile drains and subsequent transport by promoting preferential flow from the soil surface [13,14]. The transport of N occurs according to precipitation events, which control the water flow, and, together with the N content of the soil, regulate the N concentration in tile drains [1,5]. The resulting amount of N lost then refers to the N load in tile drain (Equation (1)). Moreover, subsurface drainage discharge skips natural removal mechanisms for N in the landscape, often resulting in N loads or concentrations sufficiently high to compromise aquatic ecosystems [4,6].
Tile-drained agriculture can be highly diverse in space and time in relation to agricultural practices, geology, soil type, topography, hydrology and climate, which all contribute to determine the level of N loss between catchments, as well as within the same due to seasonality and annual differences [7,15]. This consequently results in variable N loads and fractions of the N forms transported in tile drains, as these depend on the local catchment characteristics. Nitrogen is transported in the dissolved forms of nitrate (NO3−) and ammonium (NH4+), i.e., the bioavailable N forms for crop systems [6], as well as particle-bound or organic N, which is usually transported in low amounts. Ammonium, however, is prone to bind to negatively charged soil particles and become less mobile than NO3−, or be nitrified, thus converting into NO3− [7,9]. Therefore, N transport consists mainly of NO3−, as it is highly mobile and may be generated in situ.
1.2. Need to Recover Ecosystem Services at the Edge-of-Field
Artificial drainage of large water ponded areas has been intensified in the last century in order to allow the expansion and development of agriculture [4,7,12]. This occurred because natural hydrology was often insufficient to lower the water table and promote optimal conditions for crop growth. This process commonly resulted in the conversion of wetlands and peatlands into agricultural fields, which not only disrupted the hydrological regime, but also gradually restricted the natural capacity of the landscape to reduce N loads from highlands to surface waters downstream [4,9,12]. Moreover, mineralization of the pre-existing organic N pool has been favored in response to both water drainage and agricultural practices (e.g., tillage and seasonal vegetation), consequently increasing the potential N content prone to leaching [6]. Thereby, N losses have been increasingly recurrent, especially in soils rich in organic matter.
The reduced capacity of the landscape to decrease N loads, in addition to the complex spatiotemporal dynamics of N losses from tile-drained agriculture and limitations of management practices at the farm-scale described in Section 1.1, have demanded the implementation of strategies at the catchment-scale capable of effectively lowering N loads in tile drains to acceptable levels. Accordingly, construction or restoration of surface-flow systems has been critical in order to re-establish ecosystem services so that significant reduction of N loads from highlands can occur again [4,12]. Therefore, these systems are normally designed to reproduce the N removal mechanisms of natural wetlands. In addition to that, flood control and enhancements in biodiversity are promoted. Surface-flow systems are located at the edge of agricultural catchments and play a fundamental role on increasing the hydraulic residence time (HRT) of the water flow at the outlet of tile drains so that removal of dissolved and any remaining fraction of particle-bound or organic N in water can occur through mechanisms deemed low-cost. The process is primarily promoted by enlarging the area or volume of the surface-flow medium, thus decelerating the water flow, which subsequently favors sedimentation of particles as well as biogeochemical cycling of N between the water, soil, sediments, plants, macro and microorganisms. At this stage, two N removal mechanisms are especially promoted, i.e., assimilation and storage of N into organic forms by the locally existing biota; and denitrification, which depends on carbon availability and anaerobic conditions. Surface-flow systems normally contain hydrophyte plants and hydric soils, which contribute to these mechanisms.
As a result of the above, edge-of-field measures deemed cost-effective are often necessary to intercept the drainage networks and mitigate the effects of N discharge into surface waters [4,6,7,8]. These measures are, therefore, commonly recommended in critical source areas [9]. It is known that HRT is a key factor regulating N removal [10,12], thus the water flow in tile drains must primarily slow down. Systems that utilize this approach include surface-flow constructed wetlands (SFWs), restored wetlands and drainage ditches, which allow the subsurface drainage discharge to be collected into a basin so that biogeochemical processes ultimately resulting in the removal of N can occur. These systems have been widely used for decades, thus with proven records to suitably reduce the N loads from tile drains.
1.3. Aim of the Review
Among the surface-flow systems mentioned in Section 1.2, SFWs have become the prevalent practice, accounting for a growing body of research in different aspects, as described in Section 2. However, despite the progress, great variability in N treatment within and between SFWs is still observed to date, which often leads to suboptimal performance and uncertain collective effect in watersheds, ultimately complicating estimates of cost-efficiency for planned systems. Therefore, a thorough understanding of this issue is fundamental to ensure that local N removal goals are achieved in the short and long-term. The successful application of SFWs may subsequently minimize interventions in agricultural activities and production. In line with the above, this review aims to (i) describe the SFWs located at the edge of tile-drained agricultural catchments and intended for N removal, (ii) discuss the driving factors behind performance, the causes of variability and related processes, (iii) highlight their strengths and limitations in relation to N treatment, and (iv) suggest plausible outcomes for specific conditions.
This review has no focus on measures that mitigate N losses at the farm-scale, nor on approaches that intensify denitrification at the edge of agricultural catchments (e.g., woodchip bioreactors and riparian buffers), but rather on the use of SFWs as a strategy to increase the HRT of tile drain discharge and promote N removal. Finally, this review avoided citing studies dealing with effluents other than agricultural subsurface or tile drainage, and bases its structure on that found in Mendes [16].
2. Variability in the Performance of Surface-Flow Constructed Wetlands
The past decades have demonstrated that implementation of SFWs at the edge of tile-drained agricultural catchments is a feasible strategy to reduce N loads, especially in critical source areas. This has led to the widespread use of this practice in large national plans—so that a cumulative effect could be achieved—intending to reduce N pollution to coastal and inland surface waters [9,17,18]. Therefore, SFWs are strategically located systems, built in areas where no natural wetland previously existed, and designed to target individual catchments, hence with great potential to cope with large watersheds when used collectively.
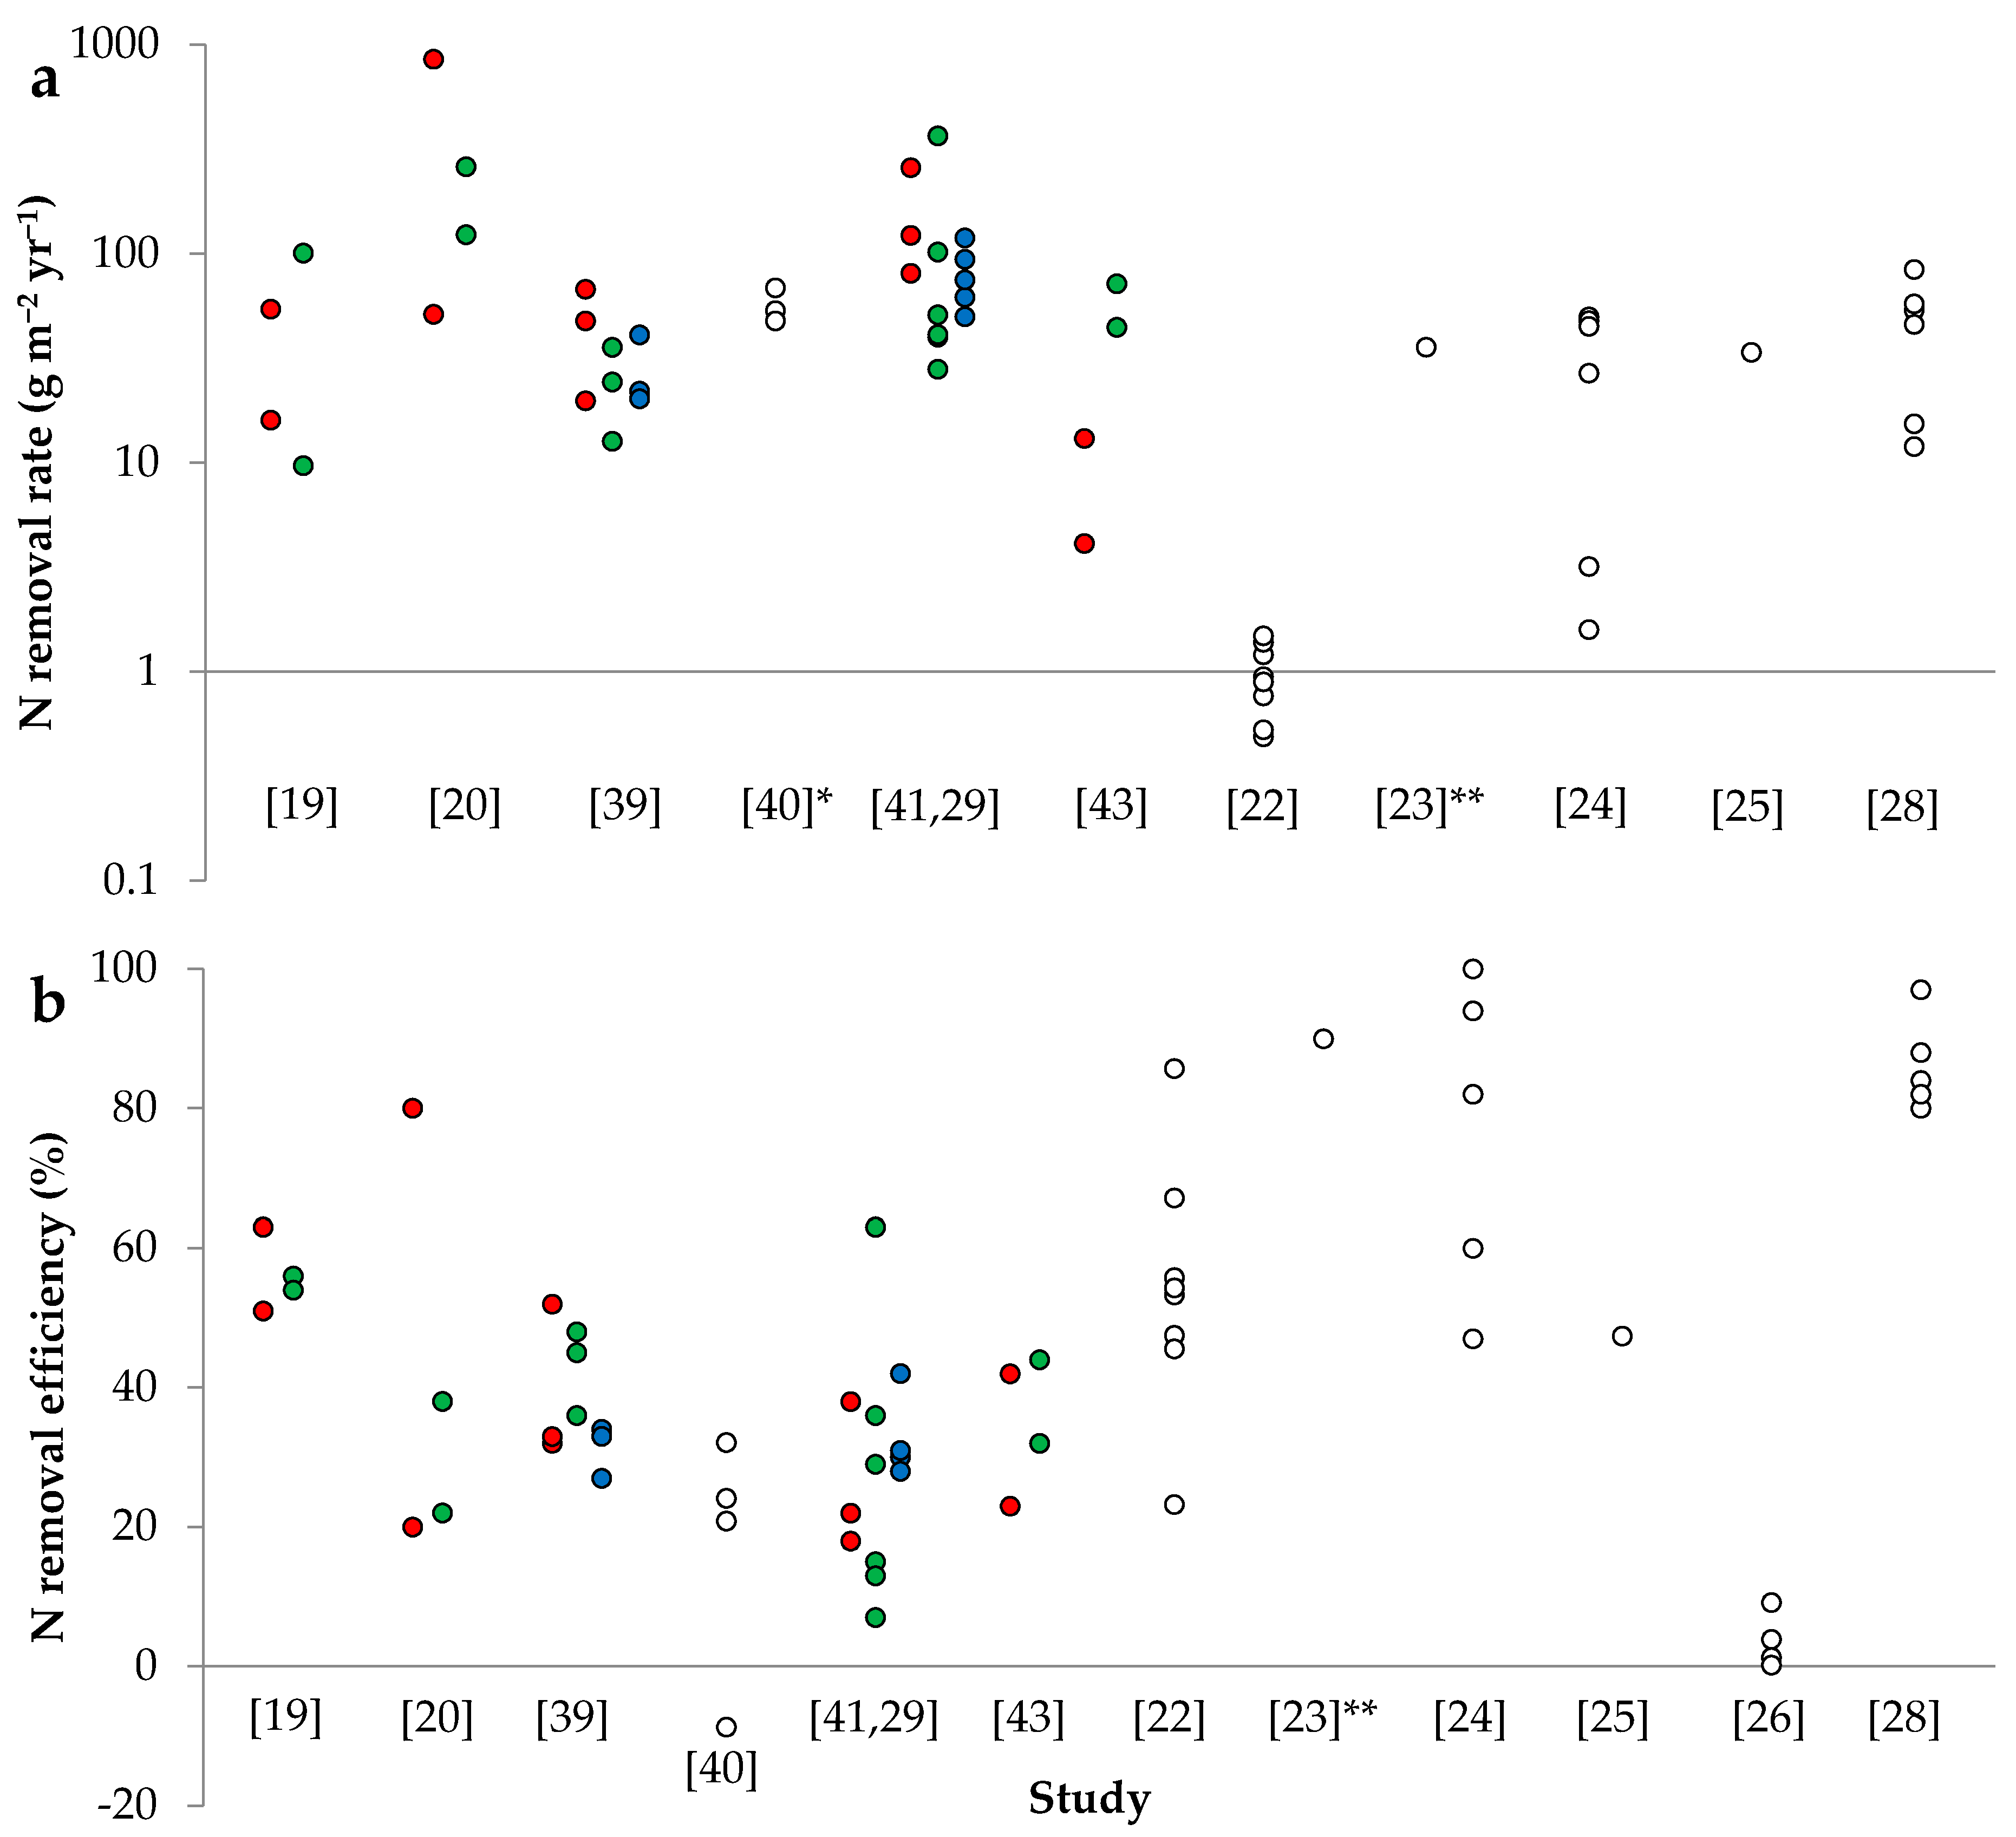
The successful implementation of SFWs for this purpose is currently described by numerous studies reporting varying levels of N removal [19,20,21,22,23,24,25,26,27,28,29,30,31,32,33,34,35,36,37,38,39,40,41,42,43,44,45]. It is generally observed that the performance of these systems largely depends on the N load in the tile drain, climate and SFW design, which all play a role on regulating the system HRT. The varying characteristics between catchments, seasonality and annual differences affect the aforementioned factors, and contribute to the large intra and inter-variability in the performance of SFWs. This consequently complicates estimations for N removal and results in wide variations in area-based N removal rate (mass area−2 time−1) and efficiency (%) within and between SFWs (Figure 1a,b). Thereby, in order to understand the performance of SFWs, it is fundamental to critically evaluate the influence of hydrochemistry, hydrology and biogeochemistry.
2.1. Nitrogen Load and Forms
2.1.1. Nitrogen Removal Rate
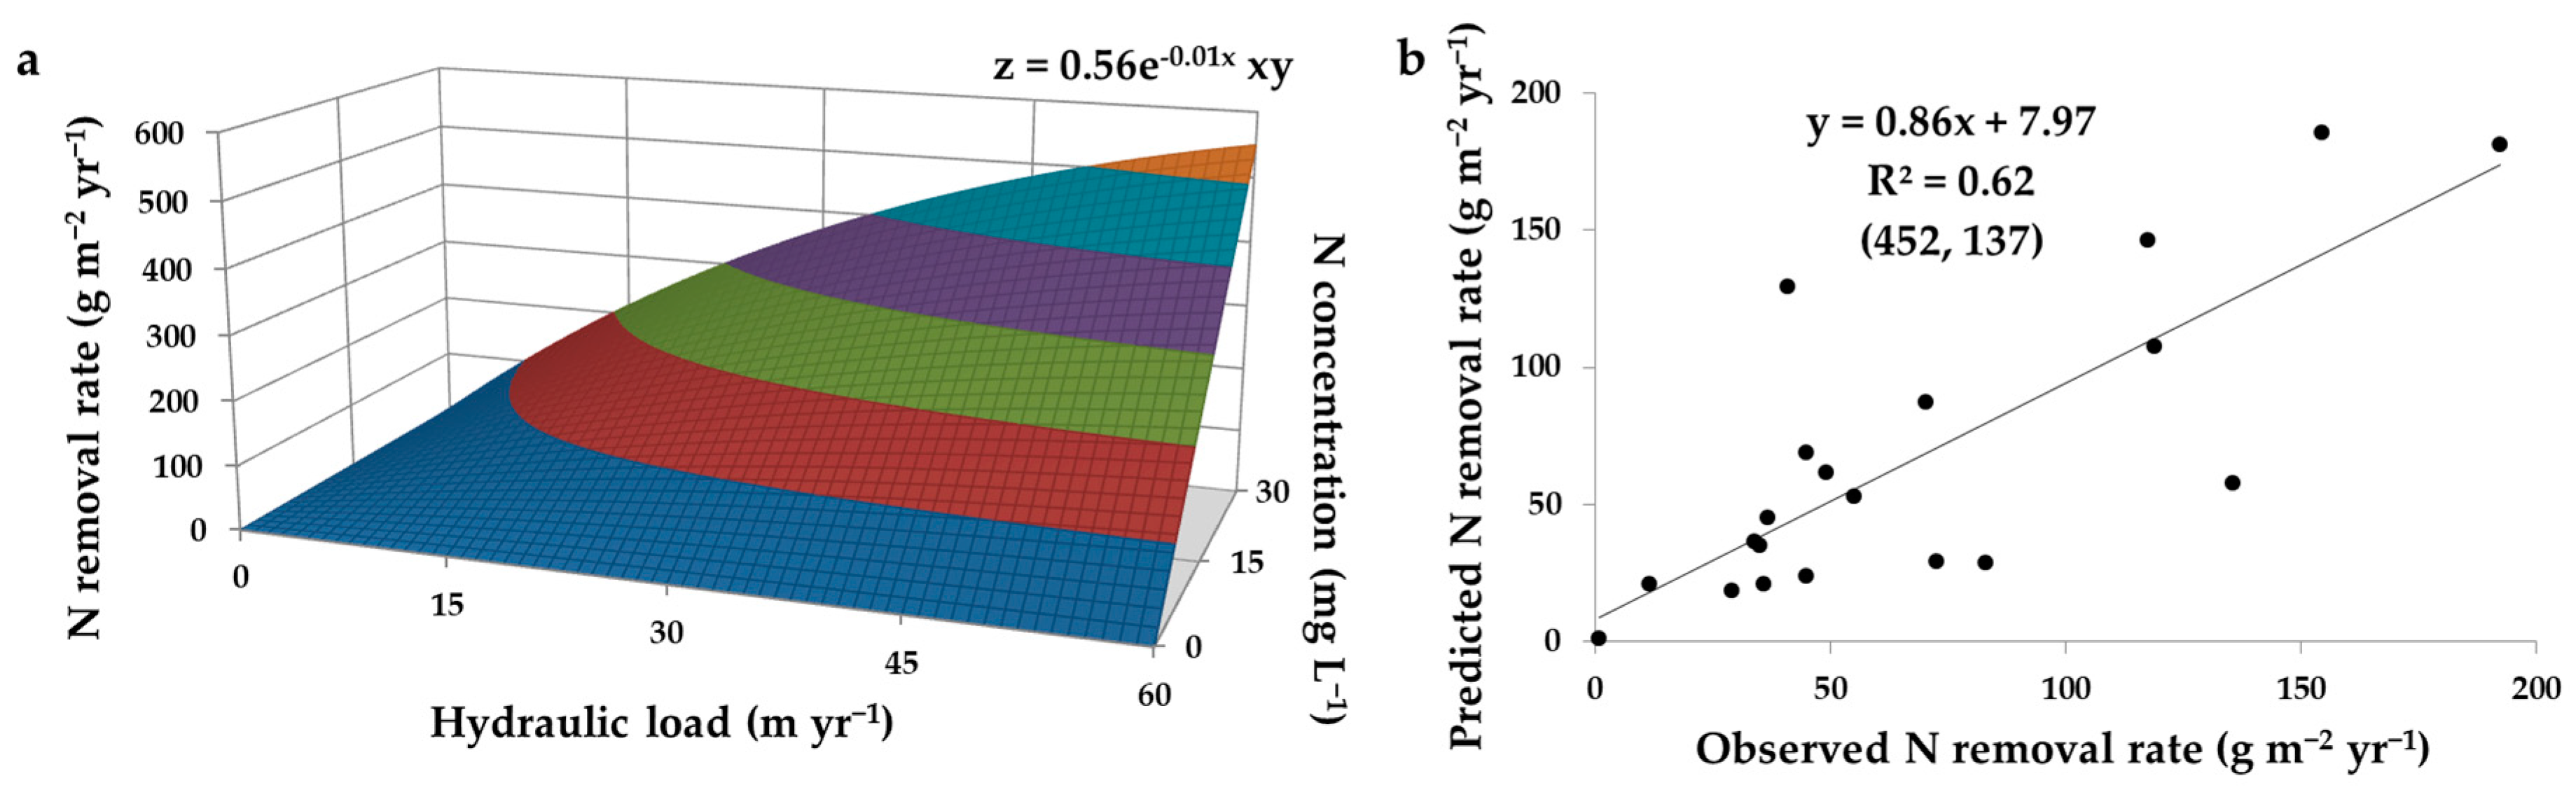
Among a multitude of factors, it is primarily important to observe how SFWs respond to the N loads in tile drains that reach them. At this point, enlargement of the surface-flow medium makes the SFW area relevant when calculating the N load (Equation (2)). Nitrogen removal rate (Equation (3)) correlates positively to N load, which is normally a major explanatory factor [17,30,33,39,42], as N removal depends on the inputs of N. Therefore, N removal rate has a direct relationship to N concentration at the SFW inlet, and decreases as N is removed and its concentration is reduced through the system [46,47]. In line with this, a relevant correlation between N removal rate and load is observed when testing the relationship from a compilation of SFWs receiving agricultural subsurface drainage (Figure 2a). Therefore, increasing loads of N tend to enhance the removal rate, and SFWs receiving higher N loads tend to outperform others in a rate basis.
Despite the strong correlation between N removal rate and load, Tolomio et al. [28] demonstrated through multiple linear regression models that N concentrations (flow-weighted) at the inlet and outlet of a SFW were still strongly correlated (direct relationship) (R2 = 0.60; regression coefficient = 0.67), especially for NO3− (R2 = 0.63; regression coefficient = 0.90). Thus, the study highlighted a relatively small contribution of the SFW to the reduction of N concentration. Similarly, Steidl et al. [26] found a strong negative correlation between N concentration at the inlet and the reduction of N concentration through the system (Kendall’s τ coefficient with p < 0.001 = −0.30). This study indicated therefore an approximation of the N concentration at the outlet to that at the inlet as the latter increased. This study also displayed contrasting results to the above, whereby N removal rate strongly correlated negatively with N concentration (Kendall’s τ coefficient with p < 0.001 = −0.13). The study found, however, a significant direct relationship between N concentration and water flow (p < 0.001; logarithmic function), thus suggesting that lower N removal rates given higher N concentrations occurred due to an associated shortening of HRT, taking into account the effect of contact time for N removal (Section 2.2.2). Thereby, these studies suggest that the effect of N load on N removal, especially on reducing the N concentration, may be weakened if accompanied by significant increments in water flow (Section 2.2.1). The inverse relationship between N load and reduction of N concentration through the system is indeed supported by the first order model presented in Kadlec [46,47]; by Tanner and Sukias [41], who demonstrated relevant positive correlations between NO3− load and concentration at the outlet (R2 = 0.40–0.58; linear functions); and by Tanner et al. [42], in which this correlation for NO3− was significant (p < 0.05; analysis of covariance). Hence, it can be expected that increasing N loads support higher N removal rates at the expense of lower reductions in N concentration through the system.
Nitrogen load varies between SFWs depending on the N load in the tile drain (i.e., the water flow and N concentration) and the SFW area. Nitrogen concentration is sometimes reported to have a direct–yet inconsistent–relationship to water flow up to a certain threshold, above which a dilution effect occurs [22,26,44]—although this effect is not always obvious [42]. When examining a compilation of SFWs receiving agricultural subsurface drainage, it is observed that these parameters vary widely (e.g., 3.4–30.0, median 10.4 mg L−1 in N concentration), thus explaining the large differences in N load (2–2338, median 181 g m−2 yr−1), which subsequently contribute to the variation in N removal rate (1–452, median 55 g m−2 yr−1) (Table 1), according to the strong correlation between N removal rate and load.

Table 1.
Characterization of surface-flow constructed wetlands (SFWs) in relation to the treatment of nitrogen (N) from tile-drained agricultural catchments (ACs). Included are the annual averages of hydraulic load, N load, nominal hydraulic residence time and N removal rate (g m−2 yr−1); as well as the average N concentration, input fractions of nitrate (NO3−), ammonium (NH4+) and organic N from total N, and N removal efficiency (%) for the total monitoring time.
| Country | Name | SFW Area | Ratio SFW:AC Area | Monitoring Time | Hydraulic Load | N Concentration | N Load | NO3−/NH4+/Org. N Fraction | Hydraulic Residence Time | N Removal | Study | |
|---|---|---|---|---|---|---|---|---|---|---|---|---|
| m2 | % | yr | m yr−1 | mg L−1 | g m−2 yr−1 | % | d | g m−2 yr−1 | % | |||
| USA | Wetland A | 6000 | 4 | 2 | 5.8 | 11.4 | 66 | >96/-/- | 56.8 | 35 | 53 | [19] |
| USA | Wetland B | 3000 | 3 | 2 | 6.4 | 15.7 | 101 | >96/-/- | 22.7 | 55 | 55 | [19] |
| New Zealand | Waikato | 260 | 1 | 2 | 25.1 | 12.7 a | 657 | 45/0/55 | 4.4 b | 452 | 69 | [20,42] |
| New Zealand | Northland | 898 | 1.6 | 2 | 47.4 | 11.1 a | 623 | 76/5/19 | - | 192 | 31 | [20] |
| USA | - | 1012 | 1 | 3 | 8.4 | - | - | - | - | - | 68 c | [31] |
| USA | Wetland A | 6000 | 4 | 3 | 8.0 | 14.0 d | 336 | 93/7/0 | 41.1 | 136 | 40 | [39] |
| USA | Wetland B | 3000 | 6 | 3 | 5.3 | 10.4 d | 166 | 99/1/0 | 27.5 | 73 | 44 | [39] |
| USA | Wetland D | 8000 | 3.2 | 3 | 6.3 | 8.7 d | 266 | 98/2/0 | 37.9 | 83 | 31 | [39] |
| Canada | Walbridge | 1215 | 0.004 e | 4 | 58.3 | 3.4 c | 263 | 100/0/0 | - | 49 | 19 | [40] |
| New Zealand | Titoki | 898 | 1.6 | 3 | 53.1 | 10.7 | 564 | 76/19/5 | - | 154 | 27 | [41] |
| New Zealand | Toenepi | 293 | 1.1 | 5 | 25.3 | 13.4 | 342 | 83/1/16 | - | 117 | 34 | [41] |
| New Zealand | Bog Burn | 112.5 | 0.66 | 4 | 40.9 | 5.8 | 224 | 73/2/25 | - | 70 | 31 | [41] |
| USA | Wetland 1 | 1600 | 0.07 | 2 | 4.0 | 9.8 d | 39 | 90/0/10 | 38.1 | 12 | 30 | [43] |
| USA | Wetland 2 | 4000 | 0.03 | 2 | 6.5 | 13.2 d | 96 | 96/0/4 | 24.8 | 37 | 38 | [43] |
| Switzerland | Boden | 720 | 0.86 | 2.5 | 30.4 | 5.5 | 167 | 47.5/5/47.5 | 11.7 | 45 | 27 | [45] |
| France | - | 4165 | 1.2 | 8 | 0.1 | 14.1 c | 2 c | - | 7240.1 | 1 c | 50 c | [22] |
| Italy | - | 3200 | 5.3 | 5 | 5.7 | 7.0 | 40 | 87/-/- | - | 36 | 90 | [23] |
| Italy | - | 3750 | 3 | 6 | 2.5 | 13.5 | 42 | - | 58.8 | 29 | 69 | [24] |
| USA | Wetland B | 3000 | 6 | 1 | 8.8 | 8.2 | 72 | 100/0/0 | 19.4 | 34 | 47 | [25] |
| Germany | - | 4632 | 0.4 | 4 | 20.1 | 9.0 a | 181 | 89/0/11 | - | - | 3 | [26] |
| Netherlands | - | 64 | 0.26 | 2 | - | 30.0 | - | 96/-/- | - | 166 | 58 | [27] |
| Italy | - | 3200 | 7.1 | 6 | 7.8 | 5.9 a | 54 | 74/-/- | - | 45 | 84 | [28] |
| New Zealand | Toenepi | 293 | 1.1 | 1 | 30.4 | 10.4 | 316 | 96/1/3 | - | 41 | 13 | [29] |
| New Zealand | Bog Burn | 112.5 | 0.66 | 1 | 38.2 | 7.4 | 284 | 78/4/18 | - | 119 | 42 | [29] |
| Sweden | Bölarp | 2800 | 0.14 | 2 | - | - | 2338 | - | - | 100 | 4 | [30] |
| Sweden | Edenberga | 2200 | 0.37 | 2 | - | - | 625 | - | - | 58 | 9 | [30] |
| Sweden | Södra Stene | 21,000 | 2.1 | 2 | - | - | 14 | - | - | 2 | 12 | [30] |
a Median; b assuming a constant water depth of 0.3 m; c nitrate; d flow-weighted concentration; e only 5% of the water flow is diverted into the SFW.
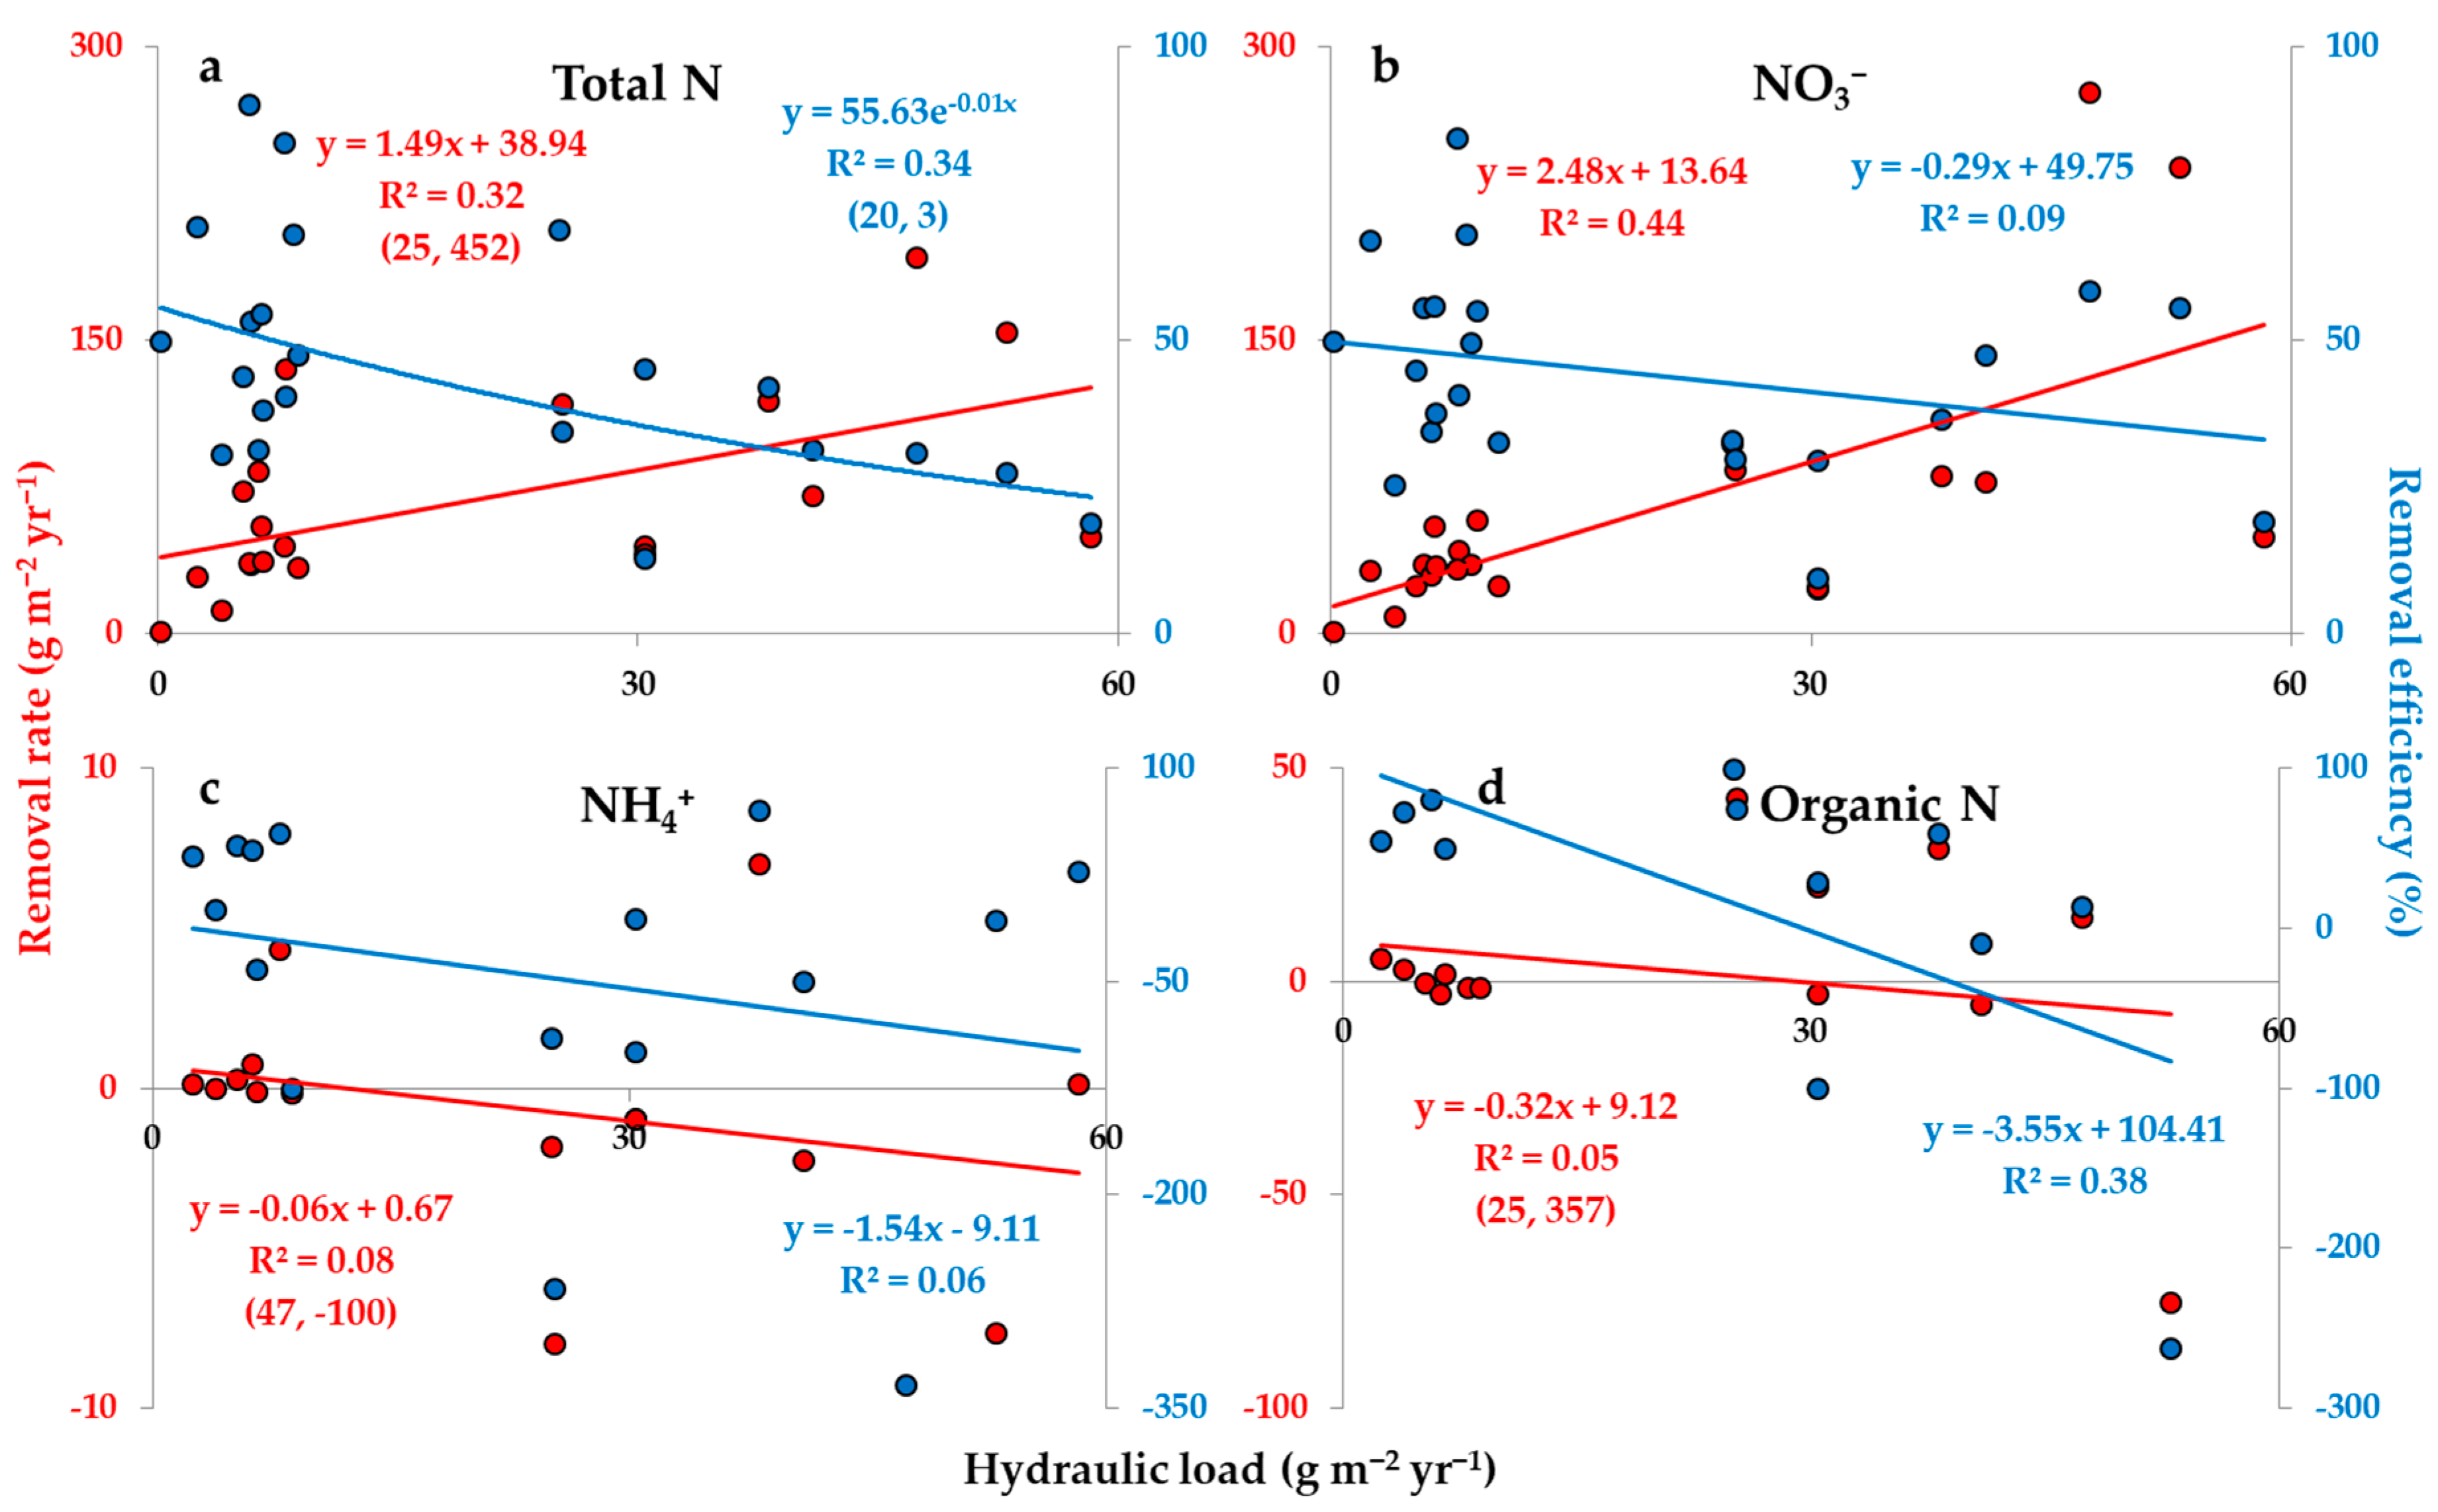
Although N load is a strong explanatory factor for N removal rate, it is still common to observe SFWs receiving comparable N loads with large differences in removal rate (Table 1), which probably results in differing correlation strengths between systems. In these cases, ascertaining the fractions of the different N forms at the SFW inlet, i.e., NO3−, NH4+ and organic N, may be relevant, as these can affect differently the overall performance [20,48], and contribute to the variability. Specifically, it can be relevant to analyze whether the removal rate of each N form responds differently to its load. When testing the correlation strength between load and removal rate for the different N forms from a compilation of SFWs receiving agricultural subsurface drainage, it is observed that NO3− removal rate clearly responds more promptly to the variation of its load (regression coefficient = 0.46) than the other N forms (regression coefficients = 0.24–0.42), whose simple linear regression models are rather weak (R2 < 0.20) (Figure 2b–d). Other studies also support and clearly state the major role of NO3− for overall performance [20,48], thus indicating that higher fractions of NO3− from total N at the SFW inlet are expected to enhance the N removal rate. Fortunately, this is generally the case for SFWs receiving agricultural subsurface drainage, i.e., NO3− fractions normally higher than 70% (Table 1), which supports the use of SFWs in this context.
In line with the above, it is clear that the loads, concentrations and removal rates of NO3− are rather superior to the other N forms in most of the cases when examining a compilation of SFWs receiving agricultural subsurface drainage (Table 2). Moreover, a wide range of NO3− loads (2–474, median 96 g m−2 yr−1) and concentrations (1.4–15.4, median 8.6 mg L−1) can be observed between systems, thus largely contributing to explain the variation not only in NO3− removal rate (1–277, median 35 g m−2 yr−1), but also in the overall performance. The latter statement is clearly supported by the stronger correlation outputs of NO3− (R2 = 0.77) compared to total N (R2 = 0.63), by which the regression coefficient of NO3− (0.46) more than doubled that of total N (0.21) (Figure 2a,b). Furthermore, that statement is supported by the generally dominant NO3− fractions (Table 1).
Table 2.
Treatment of the nitrogen (N) forms nitrate (NO3−), ammonium (NH4+) and organic N in surface-flow constructed wetlands receiving agricultural subsurface drainage. Included are the annual averages of load and removal rate (g m−2 yr−1) of the N forms, and nominal hydraulic residence time; as well as the average concentration and removal efficiency (%) of the N forms for the total monitoring time.
| Name | NO3− | NH4+ | Organic N | Hydraulic Residence Time | Study | |||||||||
|---|---|---|---|---|---|---|---|---|---|---|---|---|---|---|
| Concentration | Load | Removal | Concentration | Load | Removal | Concentration | Load | Removal | ||||||
| mg L−1 | g m−2 yr−1 | % | mg L−1 | g m−2 yr−1 | % | mg L−1 | g m−2 yr−1 | % | d | |||||
| Wetland A | 11.0 | 64 | 36 | 56 | - | - | - | - | - | - | - | - | 56.8 | [19] |
| Wetland B | 15.4 | 99 | 55 | 56 | - | - | - | - | - | - | - | - | 22.7 | [19] |
| Waikato | 10.9 a | 295 | 97 | 33 | 0.0 a | 2 | −2 | −90 | 0.7 a | 360 | 357 | 99 | 4.4 b | [20,42] |
| Northland | 8.4 a | 474 | 277 | 58 | 0.2 a | 30 | −100 | −334 | 1.6 a | 119 | 15 | 13 | - | [20] |
| - | - | - | - | 68 | - | - | - | - | - | - | - | - | - | [31] |
| Wetland A | 13 c | 104 | 42 | 41 | 1 | 8 | 4 | 54 | 0 | 0 | -1 | - | 41.1 | [39] |
| Wetland B | 10.3 c | 55 | 25 | 45 | 0.1 | 1 | 0 | 45 | 0 | 0 | -1 | - | 27.5 | [39] |
| Wetland D | 8.5 c | 87 | 30 | 34 | 0.2 | 2 | 1 | 42 | 0 | 0 | -3 | - | 37.9 | [39] |
| Walbridge | 3.4 | 263 | 49 | 19 | 0.0 | 0.41 | 0.11 | 27 | - | - | - | - | - | [40] |
| Titoki | 8.1 | 429 | 239 | 56 | 2.0 | 107 | −8 | −7 | 0.6 | 29 | −75 | −263 | - | [41] |
| Toenepi | 11.1 | 282 | 84 | 30 | 0.1 | 3 | −8 | −267 | 2.2 | 58 | 43 | 74 | - | [41] |
| Bog Burn | 4.2 | 164 | 78 | 47 | 0.1 | 5 | −2 | −50 | 1.4 | 54 | −6 | −10 | - | [41] |
| Wetland 1 | 8.6 | 34 | 9 | 25 | 0.1 | 0 | 0 | 0 | 1.1 | 4 | 3 | 73 | 38.1 | [43] |
| Wetland 2 | 12.4 | 92 | 35 | 37 | 0.1 | 0 | 0 | −42 | 0.8 | 3 | 2 | 50 | 24.8 | [43] |
| Boden | 2.6 | 79 | 23 | 29 | 0.3 | 8 | −1 | −7 | 2.6 | 79 | 22 | 28 | 11.7 | [45] |
| - | 14.1 | 2 | 1 | 50 | 0.1 | - | - | - | - | - | - | - | 7240.1 | [22] |
| - | 1.4 a | 35 | - | - | 0.0 a | - | - | - | 1.0 a | - | - | 80 | - | [23] |
| - | 12.8 | 48 | 32 | 67 | 0.1 | 0.3 | 0.1 | 38 | 2.2 | 9 | 5 | 54 | 58.8 | [24] |
| Wetland B | 8.1 | 71 | 35 | 50 | 0.0 | 0.1 | −0.2 | −125 | 0.0 | 0 | −1 | - | 19.4 | [25] |
| - | 8.0 a | 161 | - | - | 0.0 a | 0.2 | - | - | 1.0 a | 20 | - | - | - | [26] |
| - | 4.3 a | 40 | 33 | 84 | - | - | - | - | - | - | - | - | - | [28] |
| Toenepi | 10.0 | 253 | 24 | 9 | 0.1 | 1 | −1 | −100 | 0.3 | 3 | −3 | −100 | - | [29] |
| Bog Burn | 5.8 | 221 | 81 | 37 | 0.3 | 10 | 7 | 70 | 1.4 | 53 | 31 | 58 | - | [29] |
| Wetland A | 11.2 c | 106 | 58 | 55 | - | - | - | - | - | - | - | - | 35.8 | [35] |
| Wetland D | 7.1 c | 74 | 24 | 33 | - | - | - | - | - | - | - | - | 23.3 | [35] |
a Median; b assuming a constant water depth of 0.3 m; c flow-weighted concentration.
In relation to NH4+ and organic N, the latter generally reveals higher concentrations and loads at the inlet (Table 2), which leads to higher fractions of total N (Table 1). These two N forms, however, generally represent less than a quarter of the total N load (Table 1), and reveal low ranges of concentration (generally less than 0.5 and 2.0 mg L−1 for NH4+ and organic N, respectively) and load (generally up to 10 g m−2 yr−1 for NH4+) at the inlet, while organic N loads tend otherwise to highly vary between SFWs (0–360 g m−2 yr−1) (Table 2). Suggestively, some studies demonstrated that transient pulses of organic N can be associated to highly pulsed water flows when the agricultural catchment soil undergoes significant mineralization [20,42]. Despite the weak correlation between organic N load and removal rate (R2 = 0.11; Figure 2d), its removal rate was comparably variable (−75–357 g m−2 yr−1) to the load between systems (Table 2). This indicates a wide variance in the treatment performance of organic N, from little to highly effective SFWs, which is indeed verified when observing the large differences in its removal efficiency (Table 2). Removal rates of NH4+, on the other hand, are rather mild (less than 5–8 g m−2 yr−1), nearly zero or slightly negative in most of the cases (Table 2), thus normally negligible compared to those of NO3− and organic N. The low NH4+ loads and removal rates, as well as the weak correlation between these parameters (R2 = 0.19; Figure 2c), indicate therefore that NH4+ plays a smaller role in the overall performance than the other N forms.
According to the discussed above, variation in the load of NH4+ and organic N appears to have a minor effect in the overall performance from the perspective of a mass balance analysis. Therefore, dominant fractions of these N forms at the SFW inlet may be undesirable when aiming to achieve relatively high and consistent N removal rates. This is probably due to deficient removal mechanisms for these N forms compared to those for NO3−, or by the product of N transformation processes, which may generate NH4+ and organic N in situ (Section 2.3.1). The latter statement is indeed supported by the many cases, in which net removals of NH4+ and organic N are negative, commonly up to −8 g m−2 yr−1, although much larger exports may occur (Table 2). Given the above observations, the variation of N fractions at the inlet of SFWs receiving agricultural subsurface drainage (Table 1) consequently contributes to the variability in overall performance and hinders predictability. Thereby, it is important to acknowledge the incoming N fractions in order to better estimate the removal potential.
2.1.2. Nitrogen Removal Efficiency
Nitrogen removal efficiency is useful to compare the treatment performance of SFWs, as it determines the fraction of N load that is removed in the system (Equation (4)). In the same way as N removal rate, the model of N removal efficiency implies that N load must be higher than N export to achieve positive net removal, and that higher N loads and exports increase and decrease, respectively, the removal efficiency. Moreover, the model implies that N removal efficiency varies according to the fraction of the N load leaving the system, i.e., the proportion of N export in relation to N load. As N export tends to increase under higher N loads (discussion below), N removal efficiency can only increase when the increment in N export is not sufficiently high to raise or stabilize the fraction of the N load leaving the system, thus in this case reducing that fraction. Therefore, N exports promptly responding to N loads can markedly suppress the removal efficiency. As a result, N removal efficiency depends on how N export responds to N load, i.e., the degree of change of the former in relation to the variation of the latter.
Although N load accounts for the N inputs into the system, the relationship between N load and export normally weakens the effect of N load on removal efficiency—differently from that for N removal rate (Section 2.1.1). Therefore, it is common to observe SFWs, in which N load plays a minor role in explaining the variation of N removal efficiency [33,41,49]. This is indeed observed when testing the relationship between N load and removal efficiency from a compilation of SFWs receiving agricultural subsurface drainage for both total N and the different N forms (R2 < 0.10; Figure 2a–d). The weak correlations reflected in well distributed values of N removal efficiency on a scale of 0–100% with little influence of N load, as clearly observed for total N and NO3− (3–90, median 38% and 9–84, median 45%, respectively; Table 1 and Table 2) (Figure 2a,b). Ammonium and organic N, in turn, presented wider variations in removal efficiency, commonly including negative values (−334–70% and −263–99%, respectively; Table 2) (Figure 2c,d). Despite the above, N load was a major explanatory factor for N removal efficiency in a few studies, as observed in Tanner and Sukias [41] (R2 = 0.66; linear function) and Strand and Weisner [30] (R2 = 0.83; logarithmic function). Taking into account the variation in correlation strength between systems (including the regression coefficient), the relationship between N load and removal efficiency may be closely associated to the efficiency of N removal mechanisms, such as denitrification and biological uptake (Section 2.3.1).
Among the correlation tests between N load and removal efficiency described in this review, that for total N was the strongest and negative (R2 = 0.09; Figure 2a), suggesting that N removal efficiency may tend to have an inverse relationship to N load. This observation is indeed supported by many studies [30,33,37,41,49], indicating that increasing N loads tend to suppress the removal efficiency. According to the model for N removal efficiency (Equation (4)), the inverse relationship implies that higher N loads tend to raise N export above a certain threshold, which increases the fraction of the N load leaving the system and consequently makes the SFW less effective. As N removal depends on the inputs of N, the increasing fraction of the N load leaving the system as a function of higher N loads probably relates to the effect of hydrology, i.e., the load and movement of water through the system, which can promote passage of N without treatment. Therefore, in order to better understand the intra and inter-variability in N removal efficiency, factors unrelated to N inputs should be investigated.
2.2. Effect of Hydrology
2.2.1. Hydraulic Load
In the context of this review, hydraulic load quantifies the amount of agricultural subsurface drainage that is discharged into SFWs, thus accounting for the water flow from the tile drain and the area of the system (Equation (5)). Although hydraulic load does not account for the inputs of N, this parameter is critical to further understand the intra and inter-variability of N treatment by SFWs, as it regulates the water flow dynamics and subsequent level of N mixing throughout the system, thus the active hydrological area or volume of the SFW. Finally, hydraulic load regulates the contact time for N removal mechanisms (Section 2.3.1).
When integrating Equation (5) into Equation (2), it can be seen that N load is the product of hydraulic load and N concentration. As discussed in Section 2.1.1, N load plays a key role in regulating N removal rate. Therefore, it can be expected that the constituent parameters of N load, i.e., hydraulic load and N concentration, contribute to the regulation of N removal rate. Indeed, the combined effect of hydraulic load and N concentration is clearly verified when modelling the performance data of a compilation of SFWs receiving agricultural subsurface drainage (Figure 3a). The model shows that N removal rate increases when there are increments in both hydraulic load and N concentration, which can be expected due to a cumulative effect of N in the system, which subsequently promotes N removal mechanisms. Moreover, the model shows that N removal rate responds more promptly to variations in N concentration under higher hydraulic loads. This observation is indeed implied when relating N removal rate as a product of N load (Equation (6)). Nitrogen removal efficiency, on the other hand, is expected to respond less promptly to variations in N concentration than N removal rate. Thereby, the performance of SFWs subject to intense hydraulic loads may be more variable. The output of the aforementioned model fits relatively well to the observed data (Table 1), explaining 62% of the variation in N removal rate as a function of hydraulic load and N concentration (Figure 3b).
In addition to verifying the combined effect of hydraulic load and N concentration, it is fundamental to determine the individual effect of these parameters, i.e., the degree of contribution of each parameter in explaining the variation in N removal rate. Therefore, this has been tested in this review through multiple regression models by accounting for the operational data from a compilation of SFWs receiving agricultural subsurface drainage (Table 3). The model for total N was nearly significant at 95% confidence interval (p = 0.06) and found that both hydraulic load and N concentration explained about a quarter of the variation in total N removal rate (R2 = 0.26). Interestingly, the effect of total N concentration was over four times higher than that of hydraulic load (regression coefficients = 12.33 and 2.76, respectively). The model for NO3− showed that both parameters explained more than half of the variation in NO3− removal rate (R2 = 0.55). Similarly, this model demonstrated a superior effect of NO3− concentration to the hydraulic load (regression coefficients = 8.03 and 3.38, respectively). Thus, the models for total N and NO3− clearly demonstrate that N inputs play a major regulatory role in determining N removal rate due to a cumulative effect of N in the system, despite the importance of hydraulic load for N treatment, as emphasized above. Moreover, the models indicate that hydraulic load may only produce observable variations in N removal rate if accompanied by changes in N concentration. These observations highlight the importance of ascertaining the concentration of N in tile drains prior to constructing a wetland if the goal is to achieve marked N removal rates. Finally, the models for NH4+ an organic N showed a low explanatory power (R2 < 0.15) and were insignificant at 95% confidence interval (p > 0.05). This demonstrates that the concentration of these N forms and hydraulic load had a minor effect on explaining the variation in their removal rates. The low concentration ranges of NH4+ an organic N, especially NH4+, highly variable organic N removal rates (Table 2), and the apparent susceptibility of these N forms to be generated in the system, as discussed in Section 2.1.1, probably explain the lack of significant effect of their concentrations. Finally, it can be expected that the weak models for NH4+ and organic N suppressed the explanatory power of the model for total N, which is lower than that for NO3−.
Following the approach described above, this review also tested the individual effect of hydraulic load and N concentration in the variation of N removal efficiency through multiple regression models (Table 3). Similar to the results above for total N, the model for total N removal efficiency was nearly significant at 95% confidence interval (p = 0.06), and explained a quarter of the variation in total N removal efficiency (R2 = 0.25). In this case, however, the effect of total N concentration was not even close to being significant at 95% confidence interval (p = 0.49), thus being negligible. The effect of hydraulic load, on the other hand, was significant (p < 0.05) and slightly negative (regression coefficient = −0.65), thus demonstrating potential to decrease the efficiency of SFWs under higher hydraulic loads. These observations support the assumption made at the end of Section 2.1.2, which relates lower N removal efficiencies to increasing N loads due to the effect of hydrology.
Surprisingly, the models not only for NH4+ but also for NO3− removal efficiency were rather weak (R2 < 0.15) and insignificant at 95% confidence interval (p > 0.05). Thereby, hydraulic load and the concentration of these N forms did not show an observable effect in the variation of their removal efficiencies (Table 3). For NH4+, the same assumptions made above for the model of its removal rate may explain the lack of significant effect here. The variation in NO3− removal efficiency, in turn, seems to be unaffected by the inputs of NO3− and hydrology, as observed here and by the negligible correlation between NO3− removal efficiency and load (R2 = 0.03) (Figure 2b). Hence, these observations strengthen the assumption that NO3− removal efficiency highly depends on factors that regulate the functioning of its removal mechanisms. Considering that NO3− generally constitutes the largest fraction of total N at the inlet (>70%) (Table 1), the lack of significant effect of its concentration helps explain the lack of significant effect of total N concentration for the model of total N removal efficiency.
Finally, the model for organic N removal efficiency interestingly explained about half of the variation in its removal efficiency (R2 = 0.51) (Table 3). Moreover, only hydraulic load showed a significant effect at 95% confidence interval (p < 0.05). Similar to the model for total N, the effect of hydraulic load was negative, although much stronger (regression coefficient = −3.37). These results suggest that removal efficiency of organic N is the most susceptible to vary as a function of hydraulic load among the N forms. Moreover, the results indicate that the negative effect of hydraulic load on total N removal efficiency is caused by significant increases in organic N export under higher hydraulic loads, according to the implications of the model for N removal efficiency (Section 2.1.2). Fortunately, the normally low fractions of organic N at the inlet (≤25%) (Table 1) are expected to minimize this undesirable effect. This can indeed be indicated by the much weaker regression coefficient of hydraulic load for the model of total N removal efficiency (−0.65) compared to that for the model of organic N removal efficiency (−3.37). The prompt response of organic N export to variations in hydraulic load may be associated to the apparent susceptibility of this N form to be generated in the system, as discussed in Section 2.1.1, and the loss of suspended organic particles at the SFW outlet, such as plankton and duckweed [45].
As discussed above, hydraulic load can affect the removal rate and efficiency of N and its forms in varying ways. Simple regression models testing the operational data from a compilation of SFWs receiving agricultural subsurface drainage indeed supported the aforementioned findings (Figure 4a–d). Hydraulic load played a relevant role in the removal rate models of total N and especially NO3− (R2 = 0.32 and 0.44, respectively), both of which with direct relationships (Figure 4a,b). The removal rate models of NH4+ and organic N, on the other hand, indicated a negligible role of hydraulic load (R2 < 0.10) (Figure 4c,d). Removal efficiency, in turn, was only affected by hydraulic load to a relevant degree in the models of total and organic N (R2 = 0.34 and 0.38, respectively), both of which with inverse relationships (Figure 4a,d), while the models of NO3− and NH4+ showed a low explanatory power for this relationship (R2 < 0.10) (Figure 4b,c).
Although hydraulic load has shown a relevant effect on the removal rate and/or efficiency of total N and its forms, this effect was small, explaining less than 45% of the variation in N removal rate and efficiency (Figure 4a–d). Regarding N removal rate, N load and concentration are still attributed as key factors in this review, indicating again that the cumulative effect of N in SFWs is crucial to regulate N treatment in a rate basis, despite the importance of water flow dynamics and contact time. In contrast, Groh et al. [19] reported hydraulic load as a major factor controlling NO3− removal rate (R2 = 0.82; linear function with direct relationship). Khan [50], in turn, supported the relevance of hydraulic load to NO3− removal rate through significant positive relationships (p < 0.05; t-test and Mann-Whitney U test), although no significant effect was found for total N. Despite the results above, the lack of significant effect of hydraulic load on NO3− removal rate (p > 0.05; analysis of variance) [51], or even inverse relationships between hydraulic load and NO3− and total N removal rates (Kendall’s τ coefficients with p < 0.001 = −0.27 and −0.10, respectively) [26], have been reported. Amid these different effects of hydraulic load, the aforementioned strong correlation reported in Groh et al. [19] could be explained by a concomitant variation between N load and water flow. Thereby, N loads greatly regulated by hydraulic load—and less by N concentration—may increase the explanatory power of hydraulic load in the variation of N removal rate. This relationship is probably stronger under high and steady N concentrations at the inlet (Figure 3a). This observation may help explaining to some degree the different effects of hydraulic load on N removal rate, and may indicate the conditions by which hydraulic load becomes a strong explanatory factor.
The effect of hydraulic load on N removal efficiency was stronger than that of N load (Figure 2a–d and Figure 4a–d) and concentration (Table 3). Moreover, the significant effect of hydraulic load on N removal efficiency indicated that organic N export particularly varies according to hydraulic load. Thereby, higher loads or concentrations of organic N at the inlet–possibly increasing its fraction—or its generation in the system may enhance the effect of hydraulic load on the efficiency of the system. Taking into account the wide variation in hydraulic load between SFWs receiving agricultural subsurface drainage (0.1–58.3, median 8.4 m yr−1) (Table 1), an increased availability of organic nitrogen in the system could cause mild to severe impacts on the efficiency.
Other studies also described a clear inverse relationship between hydraulic load and N removal efficiency [26,28,37,50], albeit not only for total N, as verified in this review, but also for NO3−. Nevertheless, those studies found that total N removal efficiency responded slightly more promptly to variations in hydraulic load than NO3− removal efficiency (Kendall’s τ coefficients with p < 0.001 = −0.38 and −0.34, respectively [26]; and regression coefficients = −8.22 (R2 = 0.47) and −7.80 (R2 = 0.46), respectively, in a multiple linear regression model [28]). According to the results of this review, these studies may indicate that the availability of organic N contributed to further decrease the efficiency of the SFWs given higher hydraulic loads, although to a lesser extent than reported here. Moreover, these studies indicate that NO3− export is also prone to vary according to hydraulic load, thus with potential effects on the efficiency of the system. Taking into account that NO3− fractions at the inlet are normally dominant (Table 1), hydraulic load may play a major role in controlling N removal efficiency in certain cases, as observed in Tolomio et al. [28], although the analyses of this review did not report that. It is important to note, however, that the analyses performed herein accounted for the inter-variability in NO3− removal efficiency as a function of hydraulic load, i.e., between SFWs, whereas those studies investigated the intra-variability, i.e., within SFWs. Thus, the latter approach probably explained better the relationship between hydraulic load and NO3− removal efficiency, as it was tested within a set of common experimental conditions.
In addition to hydraulic load, the performance of SFWs is also commonly tested by the direct relationship between N concentration at the outlet and water flow, thus implicitly indicating that outlet N concentrations tend to rise under higher water flows. However, the different N forms may respond differently to the variation in water flow. Tanner et al. [42] and Steidl et al. [26], for example, demonstrated that outlet concentrations of total N and NO3− strongly correlated to water flow (p < 0.005; analysis of covariance [42]; and Kendall’s τ coefficient with p < 0.001 = 0.6 [26]), whose relationships were best fit by logarithmic functions. Tanner et al. [42], however, did not find a significant correlation between outlet NH4+ and organic N concentrations and water flow, whereas Steidl et al. [26] reported an inverse relationship for NH4+ (Kendall’s τ coefficient with p < 0.05 = −0.2). Other studies also observed increasing outlet total N and NO3− concentrations given higher water flows [22,44]–yet sometimes inconsistent [44]–including Tanner et al. [42], who reported the relationship through a logarithmic function. Thereby, these results not only indicate that NO3− export is prone to vary according to variations in hydraulic load, as discussed above, but also show that outlet NO3− concentration tends to respond more promptly to variations in water flow in its lower range. The latter statement likely relates to limitations of the denitrification process under high water flows, which result in short HRTs, potentially insufficient to allow adequate processing rates (Section 2.3.2). Finally, the results above indicate that N concentrations at the outlet tend to approximate those at the inlet given higher water flows, i.e., more untreated N crossing the system. In contrast, Tanner et al. [44] occasionally found very high outlet N concentrations under low water flows, and suggested that water stagnation in the system may cause the release of N to the water column, e.g., by ammonification (Section 2.3.5), thus increasing N concentration at the outlet. Khan [50] reported higher standard deviations for outlet total N and NO3− concentrations in a lower range of water flow, which suggests that N release under this condition may indeed occur.
2.2.2. Hydraulic Residence Time
As mentioned in Section 2.2.1, hydraulic load regulates the active hydrological area or volume of the SFW and the contact time for N treatment. Therefore, it has an intrinsic relationship to the actual HRT, which accounts not only for the water flow from the tile drain to a SFW, but also the volume of the SFW with active water flow subject to N treatment (Equation (7)). Measurement of the latter parameter, however, demands complicated methods related to the analysis of water flow dynamics in the system. Therefore, HRT is generally determined as nominal HRT–referred in this review solely as HRT–which simply replaces the SFW volume with active water flow by the SFW volume (Equation (8)). Because of that, nominal HRT does not determine the actual time that a parcel of water takes to cross the system from the inlet to the outlet, considering that plug-flow is not achieved in practice [52]. Moreover, nominal HRT reflects in an inverse and simpler relationship to hydraulic load compared to actual HRT (Equations (5), (7) and (8)).
Hydraulic residence time is a critical parameter in the treatment of N in SFWs, as the N removal mechanisms depend on a contact time to process N. Therefore, hydraulic loads exceeding a certain threshold can compromise the performance of SFWs by severely shortening the HRT. It is worth mentioning, however, that long HRTs as a product of large SFW areas are likely to contribute more to the efficiency of the system than as a product of deep waters. This is due to the need for water to be in contact with the soil, sediments, plants, macro and microorganisms, which implicitly require SFW area (e.g., for hyporheic exchange), so that N biogeochemical processes and removal can occur (Section 2.3.1). In this context, Song et al. [53] and Guo et al. [54,55] investigated the effect of water depth on N removal in experimental SFWs. The former two studies and the latter study found higher N removal in deeper and shallower systems, respectively. The latter study, however, reported a steady decline in N removal efficiency as the water flow increased. These observations indicate that deeper SFWs may particularly benefit N treatment when the SFW has a small area and is subject to high water flows in order to prolong the HRT.
As observed in Section 2.2.1, the effect of hydraulic load is greater on N removal efficiency than on N removal rate. Thus, it can be expected that variations in HRT would affect the SFW efficiency to a greater degree than the removal of N in a rate basis. Lavrnić et al. [24], for example, found that SFW efficiency generally increased due to longer HRTs rather than increasing N loads. Moreover, simple regression models testing the operational data from a compilation of SFWs receiving agricultural subsurface drainage demonstrated that the effect of HRT on total N and NO3− removal rates was negligible (graphical representations not shown; data from Table 1 and Table 2). The effect of HRT, however, explained 29% of the variation in NO3− removal efficiency (linear function with direct relationship), thus clearly stronger than the relationship with hydraulic load (Figure 4b). This finding supports not only the assumption made in Section 2.2.1 that NO3− removal efficiency highly depends on factors that regulate the functioning of its removal mechanisms, but also that longer HRTs promote these mechanisms. Interestingly, longer HRTs also showed a relevant positive effect in the removal efficiency of NH4+ (R2 = 0.46; linear function), as well as in its removal rate (R2 = 0.39; logarithmic function), despite the low concentrations and loads of NH4+ at the inlet (Table 2). This finding indicates that NH4+ removal mechanisms are also affected by the water contact time in the SFW. In relation to organic N, the number of observations was too small (5–7) to attempt any interpretation.
Although the observations above are in line with what would be expected from the effect of HRT, it is worth mentioning that analyses accounting the annual averages of HRT may contain a high degree of uncertainty due to marked variations of HRT throughout the year (Section 2.2.3). In this context, Kadlec [47] proposed a first order model (Equation (9), in which N is a hydraulic efficiency parameter) to account for seasonal variations in hydrology, as well as in NO3− concentration at the SFW inlet. Therefore, the model allows comparative evaluations for NO3− removal within and between SFWs through a first order uptake rate constant (k).
The first order model described above implies not only that HRT relates directly to NO3− removal efficiency, but also that NO3− removal rate and HRT have an inverse relationship, i.e., lower hydraulic loads decrease the NO3− removal rate (Section 2.2.1). Khan [50] supports the implications of the model by showing that longer HRTs significantly decreased outlet total N and NO3− concentrations in experimental SFWs (p < 0.05; t-test and Mann–Whitney U test). Drake et al. [37], in turn, reported lower outlet NO3− concentrations during periods of longer HRT, which resulted in an increase in SFW efficiency. Finally, Steidl et al. [26] found a significant positive effect of HRT on the reductions of total N and NO3− concentrations in a SFW (Kendall’s τ coefficients with p < 0.001 = 0.38 and 0.34, respectively). This study, however, surprisingly reported that longer HRTs also contributed to increase the total N and NO3− removal rates (Kendall’s τ coefficients with p < 0.001 = 0.10 and 0.27, respectively), although to a lesser degree compared to the reduction of their concentrations. Thereby, these results highlight the potential of longer HRTs to improve the overall performance of SFWs. Steidl et al. [26] further demonstrated the positive effect of HRT in reducing total N and NO3− concentrations (outlet minus inlet) through highly significant (p < 0.001) negative logarithmic functions (R2 = 0.19 and 0.11, respectively). Thus, these results indicated that the reduction in total N and NO3− concentrations were minimal above a HRT threshold (20 days), whereas large variations in the concentration reductions occurred in a lower range of HRT (in which the relationships were weaker). These findings indicate that HRT is not a limiting factor for the SFW efficiency if there is sufficient contact time for the N removal mechanisms. Under this condition, it can be expected that other factors are more important in controlling N removal, probably related to N biogeochemical processes (Section 2.3.1).
2.2.3. Seasonality
Surface-flow constructed wetlands receiving agricultural subsurface drainage are largely located in the temperate zone, thus subject to the temperate climate. As a result, water flow from tile drains to SFWs can greatly vary throughout the year, especially in non-irrigated agricultural catchments [20,41,44]. This occurs due to large differences in precipitation patterns (sometimes coupled with snowmelt) over the seasons. Thereby, peak or pulse flow events and steady base or no water flow are normally observed during winter and summer, respectively [22,24,26,35,39,42,43,56], except when the water flow stops due to freezing in winter [31]. Therefore, the water depth of SFWs varies seasonally, in which SFWs occasionally dry out during summer owing to the lack of water flow and intense evapotranspiration, sometimes combined with seepage [19,34,35,43]. This seasonal variation in water flow regulates the hydraulic load and HRT of SFWs (Equations (5), (7) and (8)). This results in hydrological regimes generally characterized by peaks of hydraulic load and short HRTs during winter and the opposite during summer, as well as intermediate values during spring and autumn [20,22,23,25,26,32,38,40,41,42,45]. The variations in hydrology affect the performance of SFWs by influencing the N load over the seasons, and the subsequent removal of N [23,25,26,35,37,38,39,41,42,43,45,56]. Thus, N loads typically peak during winter and are mild during summer.
As hydraulic load has a direct relationship to N load–sometimes clearly reported [22]—N removal rate normally increases during periods of intense discharge (e.g., during winter), and declines when hydraulic load is lower (e.g., during summer), according to the relationship between N load and removal rate (Section 2.1.1). Periods of intense discharge, on the other hand, shorten the HRT, thus normally decreasing the efficiency of the system due to significant increments in N export. Periods of low discharge, on the other hand, contribute to raise the SFW efficiency by prolonging the HRT. Thereby, an ideal period would have hydraulic loads sufficiently high to achieve a significant N removal rate without shortening the HRT to a degree that would make the SFW less effective. In reality, however, seasonal variations in N load and removal can greatly differ between years and SFWs, thus contributing to the intra and inter-variability in performance, especially in relation to N removal efficiency. This occurs not only because of the variations in hydrological regime, but also due to temperature fluctuations and the associated effects on N removal mechanisms, such as denitrification and biological uptake (Section 2.3.6). Therefore, poor overall performance during winter can also occur, as clearly demonstrated by Steidl et al. [26], who reported lower reductions in N concentration and N removal rates in that season as a response to high hydraulic loads and cold temperatures.
Tanner and Kadlec [57] stressed the above through a simple first-order dynamic model whereby hydrological regime is a key factor regulating NO3− removal. The model clearly suggests that NO3− removal rate and efficiency decrease under more variable water flows. Therefore, SFWs with steadier hydrological regimes, i.e., receiving more stable and consistent water flows from tile drains, seem to improve the treatment of N. This could be verified in Drake et al. [37], who reported in a three-year study that the highest NO3− removal rate and efficiency occurred in the year with moderate HRT and the least variation in hydraulic load.
Despite the low efficiency of SFWs normally observed during periods of intense discharge, it is important to note that N loads in these periods are often the highest on an annual basis, which results in the highest cumulative removal of N [26,28,35,37,38,39,41]. Therefore, effective removal of N during periods with long or appropriate HRTs does not necessarily result in an effective SFW on an annual basis. These observations indicate that periods of intense discharge, such as winter, which commonly supplies SFWs with the highest hydraulic and N loads, are critical for the performance of these systems. Periods of low to moderate discharge, on the other hand, have less significance for annual N removal, as these periods supply lower N loads to SFWs, thus resulting in low cumulative removal of N, despite the systems show high N removal efficiencies.
2.2.4. Area Ratio of Surface-Flow Constructed Wetland for the Agricultural Catchment
In addition to seasonality (Section 2.2.3), the water flow in tile drains is also affected by the area of the agricultural catchment, in which larger areas drain more water and result in higher water flows. Therefore, it is critical to ascertain that the SFW area or volume is large enough to accommodate the cumulative volume of the incoming water flows, and therefore ensure sufficient HRT for N removal mechanisms. As observed in Section 2.2.1 and Section 2.2.2, SFW sizing affects the hydraulic load and HRT (Equations (5), (7) and (8)). It is verifiable that the area-based N removal rate referred in this review (Equation (3)) would decline if the SFW area increased. Thus, smaller SFWs are more likely to achieve higher N removal rates due to an increase in the cumulative effect of N in the system. However, smaller SFWs may decrease their efficiency as a result of shorter HRTs. Oversized SFWs, on the other hand, may enhance the seasonal variations in hydrological regime, thus compromising the treatment of N and becoming more prone to drying out during periods of low discharge (Section 2.2.3). Thereby, it is fundamental to dimension SFWs according to their agricultural catchments, thus determining the area ratio of the former in relation to the latter, in order to ensure effective N removal. This is because the area ratio of SFW for its catchment influences the hydrology and thus the treatment of N, especially in relation to N removal efficiency, which responds more clearly to variations in HRT (Section 2.2.2). Specifically, it is crucial to determine the area ratio according to periods of intense discharge in order to ensure that HRT is not significantly shortened when the N loads are the highest (Section 2.2.3).
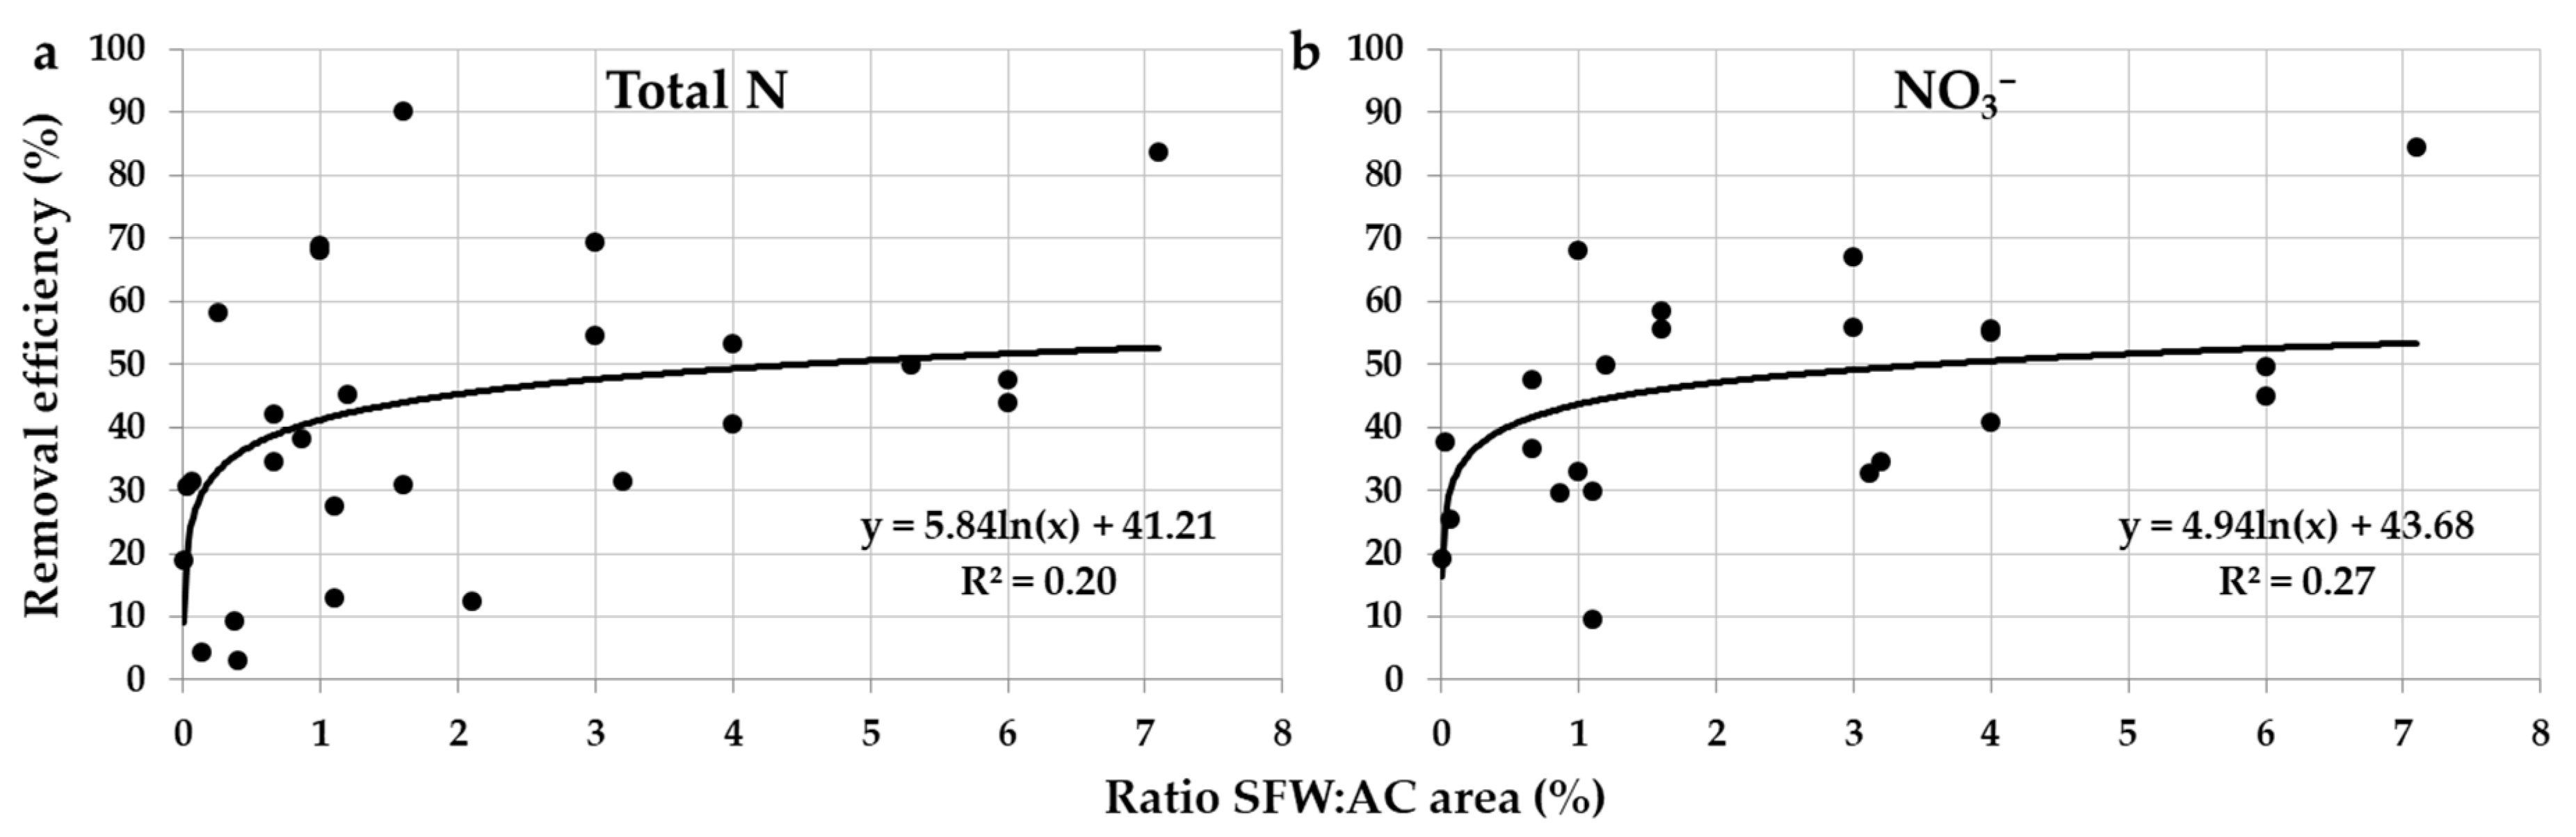
Some studies indeed found that SFWs with larger areas in relation to their agricultural catchments achieved higher N removal efficiencies [39], especially Baker et al. [7], who clearly tested the relationship. This study found that SFWs with smaller areas in relation to their agricultural catchments received higher NO3− loads, which resulted in more NO3− passing through the system without treatment, i.e., higher NO3− export. When analyzing the data from a compilation of SFWs receiving agricultural subsurface drainage, it is also observed that higher area ratios of SFW for the agricultural catchment do contribute to increase the SFW efficiency (Figure 5a,b). The logarithmic functions produced in this analysis indicate, however, that only minor increments in N removal efficiency are achieved above an area ratio of 1%. The models indicate that 40–45% N removal may be achieved with an area ratio of 1%, while 4% area ratio may result in the removal of half the N load (50%).
Vymazal [33] found a similar relationship between area ratio of SFW for the agricultural catchment and N removal efficiency to that described herein (R2 = 0.12; logarithmic function). The model in this study indicated that approximately 40% total N removal may be achieved with an area ratio of 1%. Tanner et al. [58], however, reported that a larger area ratio (2.5%) is required to achieve 40% NO3− removal. Moreover, this study showed that only 22% NO3− removal may be achieved with an area ratio of 1%. The studies above also found that no substantial increase in N removal efficiency is achieved above the aforementioned area ratio thresholds. Tournebize et al. [32], in turn, reported a curve of comparable shape to the relationship described herein (Figure 5a,b) when using the simple first-order dynamic model described in Tanner and Kadlec [57], and recommended a smaller area ratio of 1% to achieve 50% NO3− removal, provided the conditions for denitrification are optimal. Finally, Tanner and Kadlec [57] explored the outputs of the simple first-order dynamic model, and these have been found here to relate to the observations above, including a marked decline in NO3− removal rate in SFWs with larger areas in relation to their catchments. Moreover, the model predicted that up to 55% NO3− removal on average may be achieved with an area ratio of 5%, which is close to the prediction found herein (Figure 5b). Thereby, as discussed in Section 2.2.2, other factors seem to become more important in controlling N removal mechanisms–and thus the SFW efficiency–in case the SFW has an appropriate area for the catchment. In this case, it can be expected that the SFW has sufficient HRT, and therefore factors related to N biogeochemical processes probably regulate the efficiency of the system (Section 2.3.1).
2.2.5. Water Flow Dynamics
So far, attention has been given solely to the effect of incoming water volumes from tile drains in the treatment of N by SFWs. It is important to note, however, that the degree of water distribution through the SFW, i.e., the proximity of water flow dynamics to plug-flow, is also critical for N treatment. This is due to the common incidence of areas or volumes in the SFW with preferential and moderate flows, and stagnant water, which regulate the level of N mixing or homogenization between water parcels, and the contact time of N with the SFW components involved in N removal, i.e., the soil, sediments, plants, macro and microorganisms. As described at the beginning of Section 2.2.1, hydraulic load regulates the active hydrological area or volume of the SFW. Increasing hydraulic loads favor the incidence of preferential flow and stagnant water, both of which restrict N removal; the former by shortening the contact time of N with the aforementioned SFW components, and the latter by reducing the treatment space of the SFW [46]. Taking into account that plug-flow is only theoretical [52], an ideal hydraulic load would allow water to be distributed throughout the SFW with relatively similar contact times between water parcels. This would increase the active hydrological area or volume of the SFW, and consequently improve N treatment.
In the context described above, hydraulic efficiency is an important parameter that estimates the degree of water distribution through the SFW by determining the proximity of the time that a tracer takes to cross a SFW from inlet to outlet in relation to the SFW nominal HRT (Equation (10)) [59]. Similarly, the volumetric efficiency determines the proximity of the actual HRT to the nominal HRT, thus estimating the degree of space utilization of the SFW by the water flow (Equation (11)) [60]. Therefore, these hydraulic parameters are dimensionless and can vary from zero to one, in which values closer to zero indicate more preferential flows and stagnant waters, whereas values approximating one indicate that water flow dynamics is nearing plug-flow. In other words, these hydraulic parameters estimate how much of the SFW space contains active water flow, and is thus being used for N treatment. Thereby, SFWs with high hydraulic parameters tend to better distribute N through the SFW components and equalize the contact time of water parcels, ultimately contributing to improve N treatment. Systems with low hydraulic parameters, on the other hand, normally have preferential flows, stagnant waters, and/or areas or volumes with limited water mobility, where the incoming N loads have little access. As a result, this condition compromises the overall performance of SFWs.
Despite the importance of the issue described above, studies on water flow dynamics in SFWs receiving agricultural subsurface drainage are scarce. Nevertheless, Lavrnić et al. [61] found a clear difference between the actual and nominal HRT of a 17 year old SFW (6.7 and 8.1 days, respectively). This reflected in hydraulic and volumetric efficiencies of 0.79 and 0.71, respectively, thus indicating that about a quarter of the SFW space was not contributing to N treatment. Further studies, however, are necessary to estimate the potential for increased use of the treatment space of SFWs.
2.2.6. Design Aspects
In addition to hydraulic load (Section 2.2.1), SFW design is critical in controlling hydraulic parameters (Section 2.2.5), and therefore N treatment. Primary design aspects of SFWs that affect hydrology include shape, dimensioning or aspect ratio length to width, position of the inlet and outlet, presence of obstructions to the water flow, bathymetry, and vegetation type and distribution [47,48]. Su et al. [62], for example, reported that aspect ratio length to width can highly affect hydraulic parameters, whereby an aspect ratio higher than five can approximate water flow dynamics to plug-flow (hydraulic parameters ≥ 0.9). This study recommended a minimum aspect ratio of 1.88, in case of site limitations, so that hydraulic parameters are greater than 0.7. Moreover, the study found that a series of parallel inlets can even out the water flow towards a common outlet, and thus optimize hydraulic parameters (reported values = 0.88–0.89). Finally, this study suggested the use of a few slender obstructions in order to improve hydraulic parameters when necessary. Pugliese et al. [63], in turn, reported the relevance of shallow zones between deep areas in a SFW, and the effect of winds opposite the direction of the water flow to enhance water mixing, vertical circulation and hydraulic efficiency. The effect of vegetation type, in turn, was tested by Bodin et al. [64] in experimental SFWs. This study found that emergent vegetation occupied a larger volume in the SFWs, thus significantly reducing the volumetric efficiency compared to SFWs with submerged and free-growing vegetation (p < 0.05 and 0.001; method of moments and a modified Gauss model, respectively). Lastly, Guo et al. [54,55] tested the effect of design aspects in experimental SFWs, and support some of the findings described above. These include a higher volumetric efficiency when a number of inlets are evenly distributed and the water flows towards a common outlet, and when the SFW has specific water depths. Moreover, those studies found that volumetric efficiency was significantly affected by aspect ratio length to width (p < 0.05; analysis of variance) [55], and that this can increase in SFWs with less scattered vegetation [54].
Despite the relevance of design aspects, few studies investigated the relationship of these to the treatment of N. Guo et al. [54,55] reported that water depth can affect N removal, as discussed in Section 2.2.2. Moreover, N removal rate was found to increase when the inlet and outlet are positioned on opposite sides and in the center of experimental SFWs with rectangular shape [55]. Nitrogen removal efficiency, in turn, was found to increase in SFWs with less scattered vegetation, in which water flow slows down [54], and denitrification and biological uptake are intensified (Section 2.3.2 and Section 2.3.3). Regarding the effect of water flow dynamics, none of these studies found a significant correlation between volumetric efficiency and N removal (p > 0.01; bivariate analysis). More studies, however, are needed to elucidate these relationships.
2.2.7. Final Remarks
It has been observed that N treatment, especially N removal efficiency, is probably controlled by factors that regulate N removal mechanisms, such as HRT. Therefore, hydrology is still limited in explaining the variability in performance within and between SFWs, as it does not account for N biogeochemical processes, which ultimately lead to N removal. Thus, investigation of the factors that regulate N transformations in SFWs, by which mass balance analyses are unable to cover, is necessary to further understand the variability in N removal. Specifically, by exploring N removal mechanisms and associated factors, differences in the treatment of the various N forms and the effects of seasonality can be further clarified.
2.3. Nitrogen Removal Mechanisms and Biogeochemical Factors
2.3.1. Overview
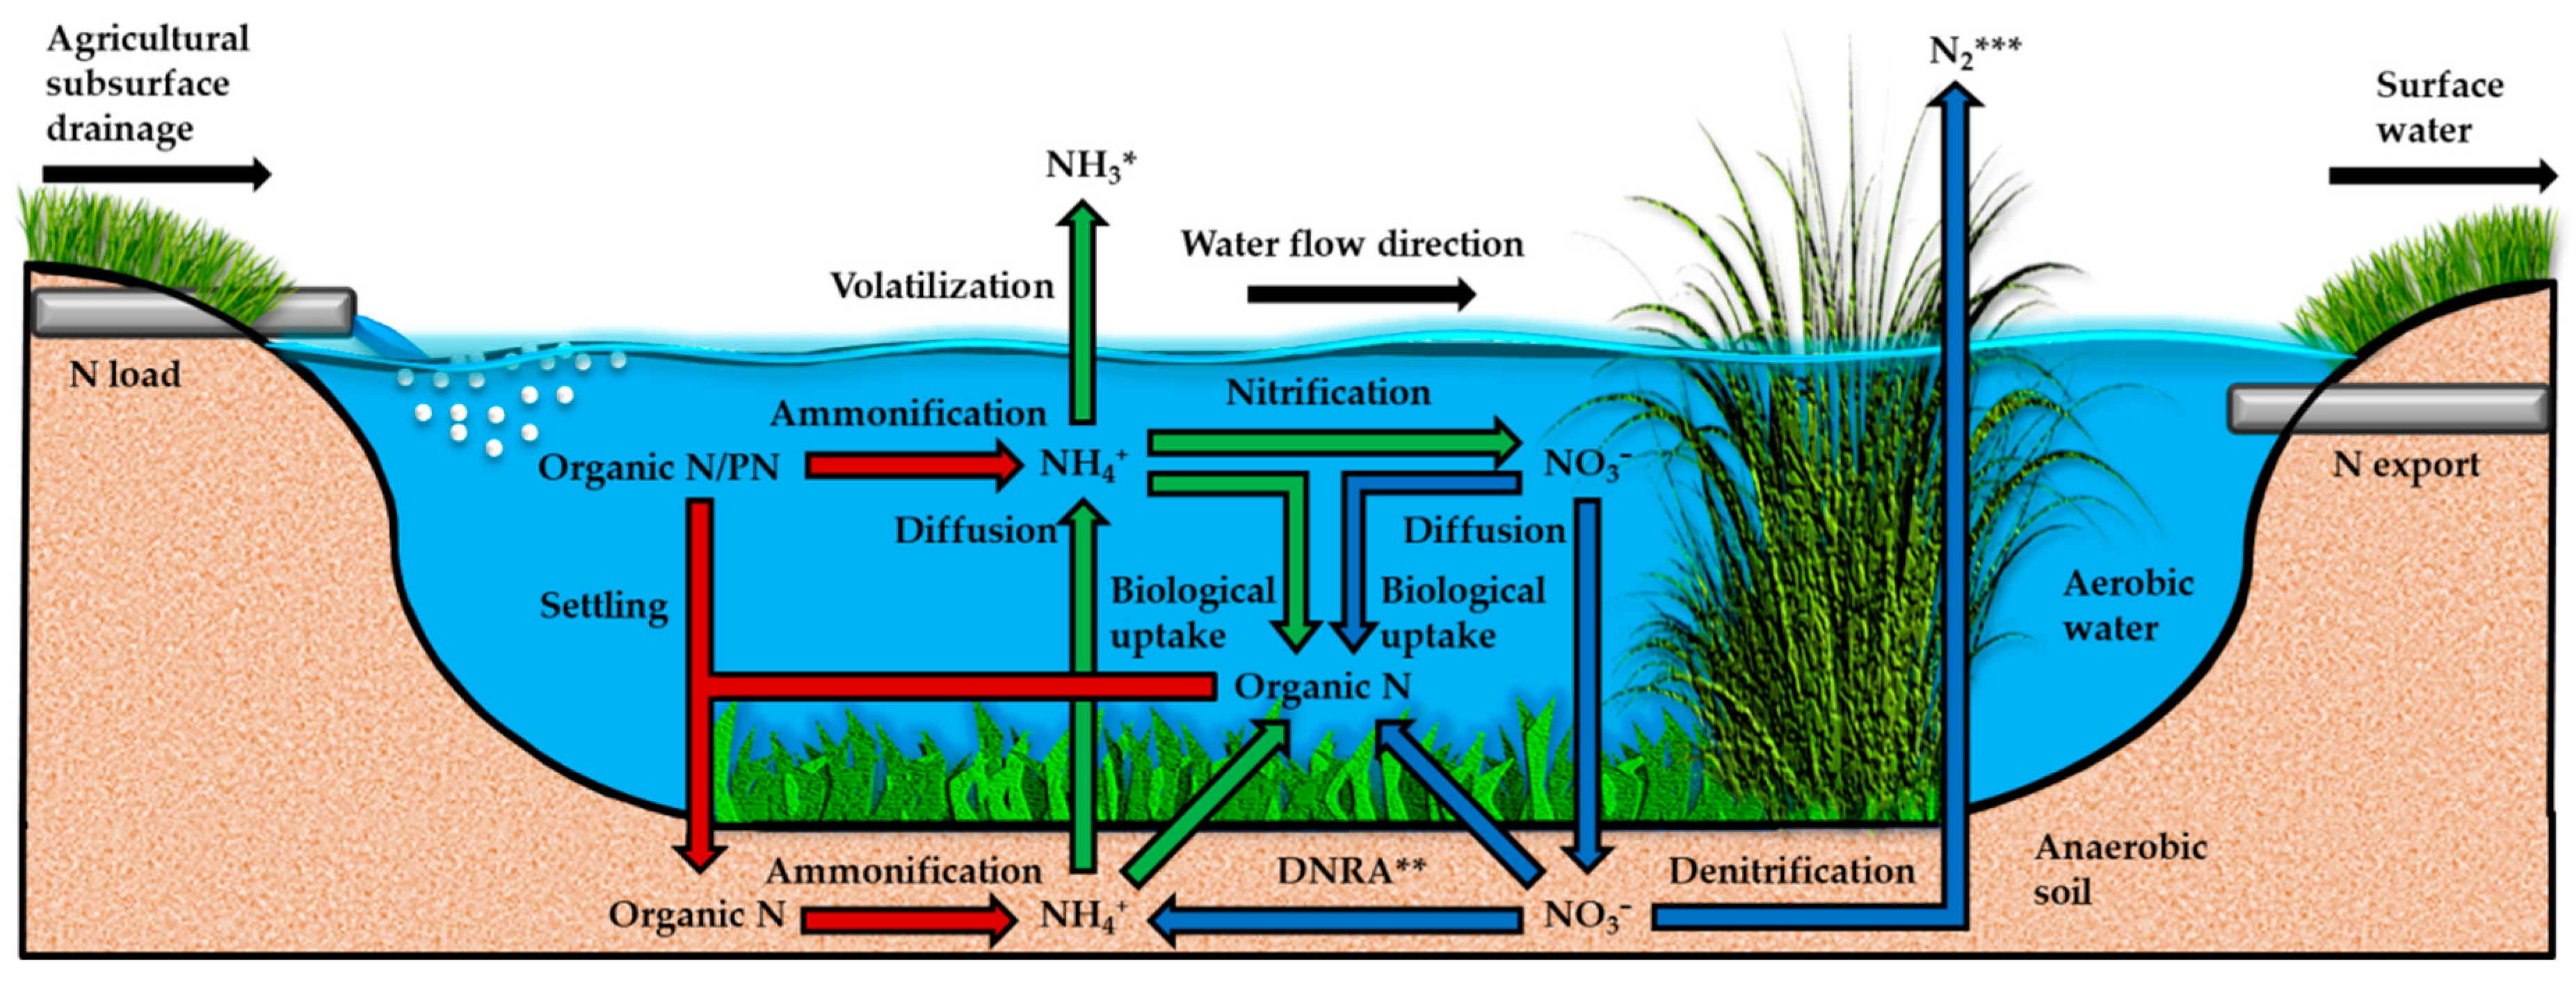
Nitrogen from agricultural subsurface drainage, once discharged into a SFW, can either pass through the system unprocessed, as promoted by shorter HRTs (Section 2.2.2), or enter the N cycle (Figure 6). At this stage, different N removal mechanisms, i.e., the processes that reduce the concentration of N forms in water, take place. Some of these mechanisms solely transform a N form into another with no direct contribution to the overall N removal, such as ammonification, nitrification and dissimilatory NO3− reduction to NH4+ (DNRA) (stoichiometric Equations (12)–(14), respectively). This is because the end products generated, i.e., NH4+ and NO3−, are still mobile and prone to be present in the water column and be exported. Other mechanisms, however, promote short or long-term storage of N in the system, and include settling of particle-bound and organic N onto the topsoil, and biological uptake or assimilation of NH4+ and NO3− by the locally existing plants and microorganisms, thus turning these into organic N forms. Finally, volatilization and denitrification are exit mechanisms for N, whereby NH4+ and NO3− are converted into ammonia and dinitrogen gases (stoichiometric Equations (15) and (16), respectively), which eventually cross the water-air interface into the atmosphere. Given the above observations, the N storage and exit mechanisms are particularly important for the overall N removal, as these result in short, long-term or permanent removal of N from water, thus directly contributing to decrease N export and subsequently increase the system efficiency.
Among the aforementioned N removal mechanisms, some may process faster than others, thus directly or indirectly contributing to the overall N removal in different degrees. In fact, denitrification is commonly referred to as the main N removal mechanism, therefore responsible for most of the N removal [9,33,48,49,65]. A comparative evaluation of the processing rates of the different N removal mechanisms from a compilation of SFWs receiving agricultural subsurface drainage, however, cannot be properly made to date due to lack of data and/or large differences in study methods (Table 4). Nevertheless, an attempt to make a comparison with the available data indeed suggests that denitrification generally contributes more to the removal of N (0.3–11.8, median/average 3.6/4.7 mg m−2 h−1), followed by settling (0.0–4.3, median/average 2.0/2.1 mg m−2 h−1) and then biological uptake (0.0–2.5, median/average 0.6/1.0 mg m−2 h−1). Moreover, a few studies quantified the recovery (%) of the initial NO3− concentration in water by denitrification and biological uptake, and found that the former processed about four to eleven times more available NO3− than the latter (Table 4).
The potential of the different N removal mechanisms, however, is better evaluated in individual studies due to common experimental conditions. Reinhardt et al. [45], for example, attested the superiority of denitrification (94% of the N removed) over biological uptake and settling (6% of the N removed). Similarly, Matheson and Sukias [68] reported that denitrification accounted for 77% of the transformed NO3−, while biological uptake accounted for a smaller fraction (20%). Besides that, this study found that DNRA contributed with only 2% of the transformed NO3−. Xue et al. [67], in turn, implied that 85–91% of the NO3− removed had been denitrified, while biological uptake accounted for only 9–15%. Finally, Tournebize et al. [22] described N removal by algae uptake as minimal (0.7–1.5%). Nevertheless, denitrification can sometimes contribute minimally to the overall N removal, as observed by Borin and Tocchetto [23], whose process contributed with around 7% of the N removed, while plant uptake was the main N removal mechanism (61%) followed by settling (31%). This study, however, suggested that the contribution of these processes to the overall N removal will likely change as the SFW matures, which may be a general trend in newly established SFWs when carbon availability for denitrification is still low and vegetation is developing (Section 2.3.2 and Section 2.3.3).
Despite the lack of data and comparable study methods for general conclusions (Table 4), it is clear that denitrification has been the most studied process and often appointed as the main N removal mechanism according to individual studies, followed by biological uptake and settling. The processes that transform N into the mobile forms of NH4+ and NO3−, on the other hand, have been little investigated, as well as the N exit mechanism by volatilization. The available data, however, suggest that DNRA rate and recovery of the initial NO3− concentration in water may be normally low (Table 4), probably due to competition with denitrification and biological uptake for the available NO3− in the normally anaerobic soils of SFWs (Figure 6). Moreover, the requirement of DNRA for an acidic medium may limit the process (stoichiometric Equation (14)). Nitrification rate, on the other hand, has even been reported to exceed denitrification rate (Table 4), and is promoted by aerobic conditions (stoichiometric Equation (13)). Finally, ammonification rate may be relatively low in certain cases (Table 4), but can vary according to redox conditions and temperature (Section 2.3.5). The lack of studies on volatilization, in turn, presumably suggests that it contributes little to the overall N removal and may therefore play a negligible role [47], probably due to its requirement for basic water (stoichiometric Equation (15)) and the low fractions, concentrations and loads of NH4+ at the inlet (Table 1 and Table 2). Steidl et al. [26], for example, reported that ammonia was only 3% on average in relation to NH4+ at the SFW outlet, indicating that the system pH was not sufficiently high to promote volatilization.
It is recognized that studies on N biogeochemistry in SFWs involve complicated methods in relation to the mass balance approach, by which the relationship between system performance and the incoming water volumes and N inputs can be assessed. However, it is essential to investigate the effect of biogeochemical processes in the context described herein, considering that agricultural subsurface drainage is particularly characterized by high fractions, concentrations and loads of NO3− (Table 1 and Table 2), while providing little carbon to the system [46,66,69]—with some exceptions [38]—whose availability is required to prompt denitrification (stoichiometric Equation (16)). Moreover, SFWs typically take many years to fully develop their vegetation—i.e., long maturation periods [23,48,70,71]—which is crucial to ensure not only a sufficient source of carbon for effective denitrification, but also a well-established biota for effective biological uptake. Finally, systems located in the temperate zone experience seasonal variations in temperature, which directly affect denitrification and biological uptake rates (Section 2.3.6). Therefore, the performance of SFWs is commonly limited to some degree by suboptimal conditions at the biogeochemical level, which inhibit N removal mechanisms. This observation is supported by the often observed N removal efficiencies below 50% by SFWs receiving agricultural subsurface drainage, despite the varying N inputs and hydrology (Table 1). Thereby, studies accounting for the relationship between biogeochemical factors and the processing rates and/or recoveries of the available N by the different N removal mechanisms are highly encouraged in order to better understand the intra and inter-variability in performance of SFWs. It is especially recommended that these studies take place under field conditions and over several years, as these are rather limited to date (Table 4). The more often conducted laboratory and mesocosm studies (Table 4), on the other hand, are important to investigate the response of N removal mechanisms to certain conditions, but are not able to account for the spatiotemporal complexity at the field-scale, thus producing results that cannot be used to predict the functioning of N removal mechanisms in SFWs [47].
2.3.2. Denitrification
As indicated in Section 2.3.1, denitrification is normally regarded as the main N removal mechanism. Thereby, successful application of SFWs largely depends on the effectiveness of this process. This mechanism is primarily mediated by heterotrophic facultative bacteria that use NO3− as the terminal electron acceptor in the absence of oxygen to oxidize organic matter for energy. Therefore, the process requires the presence of NO3−, anaerobic conditions, suitable temperatures and a source of organic carbon as electron donor–all conditions normally found in the topsoil of SFWs–so that NO3− can be reduced (Figure 6). This consumption of NO3− in the anaerobic topsoil creates a concentration gradient [22], by which NO3− from the aerobic water diffuses downwards, and typically generates gaseous nitrous oxide (in minor proportions [19,22,49,67]) and dinitrogen as end products, which subsequently leave the system to the atmosphere (Figure 6). Hence, the process ensures permanent removal of N. In line with the above, denitrification rates benefit the higher the NO3− concentration in the water column—as attested by Reinhardt et al. [45] (R2 = 0.96), Grebliunas and Perry [66] (p < 0.05; analysis of variance) and Xue et al. [67], who reported a sudden increase in denitrification rate after a pulse input of NO3−—which largely explains the strong and direct relationship of NO3− load and concentration to its removal rate (Section 2.1.1 and Section 2.2.1). As a result, denitrification studies in SFWs commonly measure NO3− concentration, temperature and carbon availability as part of the methods to estimate the processing rate and recovery of the initial NO3− concentration (Table 4).
Among the aforementioned factors, the effect of temperature has been particularly investigated. Overall, temperature has a direct relationship to denitrification rate, as the process is mediated by enzymatic activity [48,49]. Tolomio et al. [28], for example, reported that warmer air temperatures contributed to decrease the concentration of total N at the outlet of a SFW through a multiple linear regression model (R2 = 0.60; regression coefficient = −0.11). Likewise, Drake et al. [37] found that months with higher water temperatures in a SFW contributed to increase the NO3− removal efficiency. Finally, Steidl et al. [26] found greater N concentration reductions and removal rates under warmer water temperatures (p < 0.001; Kendall’s τ coefficients = 0.40 and 0.24 for total N, and 0.40 and 0.26 for NO3−, respectively). Moreover, this study described the effect of higher temperatures on increasing the concentration reductions (outlet minus inlet) of total N and NO3− through highly significant (p < 0.001) negative linear functions (R2 = 0.20 and 0.15, respectively). As noted in this study, the effect of temperature was more pronounced on removal efficiency than on removal rate of N. Although the studies above did not investigate the underlying biogeochemical processes, it can be assumed that denitrification probably intensified under warmer temperatures and contributed to greater N removal. Xue et al. [67], on the other hand, attested the positive effect of temperature specifically on denitrification rate (R2 = 0.71).
Given the varying temperatures in a seasonal basis within and between SFWs (Section 2.3.6), Kadlec [47] proposed a modified Arrhenius temperature relation (Equation (17), in which θ is a temperature factor) in connection with the also proposed first order model (Equation (9)) to calibrate the temperature effect by standardizing the k value at a common temperature of 20 °C (k20), and therefore allow comparative evaluations for NO3− removal presumably through denitrification.
In addition to the aforementioned factors, HRT, whose role was described as fundamental in the efficiency of SFWs, has been suggested as a regulator of N removal mechanisms, such as denitrification (Section 2.2.2), and determines in this case the contact time of NO3− with denitrifying bacteria. Grebliunas and Perry [66] indeed reported a significant direct relationship between denitrification rate and contact time (p < 0.05; analysis of variance). Finally, as denitrification takes place in the anaerobic topsoil, the process benefits the larger the bottom area of the SFW for hyporheic exchange.
Vegetation density plays a key role in controlling denitrification by supplying organic matter to the topsoil through plant litter and root exudates, and serving as a substrate for denitrifying bacteria, which stimulate or maintain denitrifying activity [32,48]. The addition of organic matter increases the biochemical oxygen demand, thus contributing to anaerobic conditions, which also promote denitrification. Thereby, SFWs with dense vegetation stands tend to enhance denitrification in relation to others with sparse or without vegetation [46,47]. The studies of Guo et al. [54,55] in experimental SFWs and David et al. [69] support this statement by reporting higher total N and NO3− removal efficiencies in SFWs or treatments with the densest vegetation, although the underlying biogeochemical processes were not investigated. The supply of organic matter by vegetation is particularly important in SFWs receiving agricultural subsurface drainage due to the normally low carbon inputs [46,66,69]. Moreover, N and carbon inputs at the SFW inlet may not be significantly correlated in these cases (p > 0.01) [38]. These observations thus highlight the need for SFWs to produce their own carbon sources, as insufficient carbon availability can limit denitrification, especially in systems subject to high inputs of NO3− [46,66]. Grebliunas and Perry [66], and Xue et al. [67] indeed demonstrated a direct relationship between carbon availability and denitrification rate (p < 0.05; analysis of variance and R2 = 0.50, respectively). Furthermore, David et al. [69] reported higher NO3− removal after adding carbon to treatments containing plants. As a result, newly constructed wetlands normally reveal low denitrification rates compared to mature systems owing to limited supply of organic matter by plants for denitrification [47]. Consequently, SFWs can take many years to accumulate carbon to a level that supports the maximum denitrification potential [47]. In this context, Nilsson et al. [71] reported a clear increase in N removal during the maturation (time span around 12 years) of experimental SFWs without initial planting, thus allowing free growth of vegetation, and in experimental SFWs initially planted with submerged vegetation. Interestingly, however, the maturation process did not influence the N removal in experimental SFWs initially planted with emergent vegetation. Likewise, Sukias and Tanner [29] could not observe an increase in total N removal over 8–9 years after construction of the investigated SFWs, whereas Tanner et al. [42] reported a significant increase (p < 0.01; t-test) of about 1.5 times in denitrification rate from 6 to 18 months since the construction of the wetland. Finally, water depth affects the development of vegetation by controlling the penetration of light through the water [48]. Therefore, SFWs with wide deep areas can restrict denitrification by hindering the expansion of vegetation.
Vegetation type, whether submerged or emergent, is expected to vary across SFWs, but may otherwise have little effect on carbon availability, and thus on denitrification [46,47]. In line with this, Guo et al. [54,55] found that different species of emergent plants played a negligible role in the removal efficiency of total N in experimental SFWs. Denitrification rates, however, can increase in the presence of plant litter that readily decomposes, i.e., labile carbon, or decrease in case woody plants are the dominant carbon source [48]. Bastviken et al. [51] tested the effect of vegetation type on NO3− removal in experimental SFWs, and found significantly higher NO3− removal rates, k and k20 values (Equations (9) and (17), respectively) in SFWs with emergent vegetation compared to those with submerged and free-growing vegetation (p < 0.01; analysis of variance). Thus, the study indicated that SFWs dominated by emergent vegetation promoted NO3− removal mechanisms such as denitrification. Moreover, this study reported an increase in NO3− removal as the SFWs matured and the vegetation became denser, therefore in line with the discussion above. Nilsson et al. [71] confirmed these results in the same experimental SFWs by demonstrating that those SFWs initially planted with emergent vegetation indeed enhanced N removal in relation to the other treatments. Surprisingly, however, the effect of vegetation type disappeared once the systems reached a more mature state around eight years after construction, i.e., N removal was no longer significantly different between treatments (p > 0.10; analysis of variance). This finding indicated that it is not the vegetation type, but rather the maturation process itself that affects N removal—and likely the denitrification rate—in mature SFWs. Therefore, vegetation type seems to affect denitrification—and possibly biological uptake as well—only at the beginning of the system lifetime.
In addition to carbon, phosphorus may be transported in limited amounts in relation to N in tile drains, although it is required for the growth and maintenance of the population of denitrifying bacteria [38,66]. Song et al. [53] attested the relevance of phosphorus for N removal in experimental SFWs by clearly demonstrating that higher phosphorus availability significantly increased the removal rates and k20 values (Equation (17)) of NO3− and total N (p ≤ 0.001; analysis of variance). Hence, the study concluded that low phosphorus inputs may limit the performance of SFWs. Grebliunas and Perry [66], on the other hand, reported no significant effect of phosphorus addition on denitrification rate (p > 0.05; analysis of variance), irrespective of the NO3− and carbon concentrations in the medium. Therefore, it is possible that phosphorus availability may only affect denitrification when NO3− and carbon concentrations exceed a threshold, by which phosphorus becomes a limiting factor.
Given the susceptibility of denitrification to vary according to the many aforementioned controlling factors, it can be expected that this process varies widely within and between SFWs. Indeed, denitrification rates can be about two to three times more variable (standard deviation 3.5 mg m−2 h−1; data from Table 4) than biological uptake and settling rates (standard deviations 1.0 and 1.9 mg m−2 h−1, respectively; data from Table 4). This highlights the variability or lack of consistency of SFWs in the treatment of NO3−-rich effluents, such as agricultural subsurface drainage, and emphasizes the importance of biogeochemical factors, especially those related to denitrification, for the performance of these systems.
2.3.3. Biological Uptake
As described in Section 2.3.1, biological uptake and settling are also important N removal mechanisms, as these directly contribute to the overall N removal. These mechanisms are especially promoted in large SFWs whereby significant amounts of organic N can be stored, and when N is stored for long periods [48,49]. Biological uptake mainly occurs during the vegetation growing season in spring-summer through assimilation of NH4+ (the preferred N form [46]) and NO3− by the root system of plants and by microorganisms, which refer to plant uptake and immobilization, respectively. These N forms are then converted to organic N and become part of the biomass (Figure 6). Thus, studies investigating biological uptake normally measure the N concentration in the biomass of above and below-ground plant, and topsoil (Table 4). The results of Xue et al. [67] suggest that immobilization rapidly removes NO3− compared to plant uptake. In line with this, Matheson and Sukias [68] reported immobilization of the transformed NO3− (11%) as slightly higher than plant uptake (9%). However, Xue et al. [67] found that plant uptake was able to store much larger amounts of N (in above-ground plant biomass) than immobilization. Besides that, immobilization is expected to store N in the short-term. Thereby, plant biomass is normally regarded as the main N storage location due to greater storage for longer periods compared to microbial biomass.
Given the above observations, vegetation composition and density are major controlling factors for biological uptake rate, as these determine the capacity of the SFW to store N in plant biomass. Moreover, vegetation serves as a substrate for microorganisms, therefore promoting immobilization as well. The maturation process and appropriate water depth, as discussed in Section 2.3.2, are essential for the development of vegetation so as to allow the SFW to reach its maximum biological uptake potential. The superior NO3− and total N removals in mature SFWs or in those containing dense emergent vegetation (e.g., Typha latifolia and Phragmites australis), as described in Bastviken et al. [51], Guo et al. [54,55], David et al. [69] and Nilsson et al. [71] (Section 2.3.2), may support these statements, although the underlying biogeochemical processes were not investigated. Other plant types can also greatly support biological uptake, as attested by Matheson and Sukias [68], who found a markedly higher NO3− uptake rate for duckweed (221 mg kg−1 d−1) compared to the emergent plant Typha orientalis (10 mg kg−1 d−1). Assimilation in the latter plant, however, accounted for a greater fraction of the transformed NO3− (6%) in relation to duckweed (3%), and is expected to ensure N storage for longer periods, e.g., in below-ground plant biomass.
Other factors may otherwise inhibit biological uptake. Denitrification, for example, competes with biological uptake for the available NO3− in the anaerobic topsoil (Figure 6), and can therefore markedly suppress the biological uptake rates there [46]. Moreover, significant biological uptake rates are restricted to the vegetation growing season—prior to the senescence period [25,26]—and can thus only contribute to the overall N removal in a seasonal basis (Section 2.3.6). This seasonal effect results in the variation of N concentration in plant tissues and subsequent storage of N in plant biomass throughout the year as well as between years [24,25]. Finally, SFWs with N-rich soils may largely support plant growth, thereby decreasing the uptake of N from water by plants and the contribution of this process to the overall N removal [25].
2.3.4. Settling
Besides biological uptake (Section 2.3.3), settling not only stores, but also accumulates N in the SFW in the long run [23,24,26,45], which occurs in the topsoil through sedimentation of N bound to organic and inorganic particles (Figure 6). Therefore, the process is partly controlled by the inputs of particle-bound N and benefits the longer the HRT. Under adequate HRTs, sedimentation of particle-bound N occurs mainly near the SFW inlet due to deceleration of the incoming water. The dominant NO3− fractions at the SFW inlet (Table 1), however, limit settling rates. In spite of that, plant senescence and plankton death especially contribute to promote settling by adding plant litter, organic particles and associated organic N onto the topsoil after the vegetation growing season [24,45]. In this case, however, the process only transfers the organic N stored in biota through biological uptake to the topsoil with no further contribution to the overall N removal (Figure 6). Nevertheless, these events support denitrification by supplying organic matter and substrate for denitrifying bacteria [23,24,26], and contribute to reaching the maximum denitrification potential of the SFW, as it matures (Section 2.3.2).
2.3.5. Nitrogen Transformation Processes
The storage of N by settling discussed in Section 2.3.4 can be offset by resuspension, in case the hydraulic load is sufficiently high, or by ammonification, which converts organic N to NH4+ by ammonifying bacteria (Figure 6). Ammonification is primarily controlled by the availability of organic N and redox conditions, whereby anaerobic conditions slow it down. Thus, ammonification occurs more quickly in the presence of oxygen. This process tends to accumulate NH4+ in the anaerobic soil, which may be biologically assimilated or slowly diffuse upwards into the aerobic water or sediment-water interface due to a concentration gradient. At this point, nitrification or the oxidation of NH4+ to NO3− by nitrifying bacteria can occur (Figure 6). Therefore, ammonification releases N previously assimilated as NH4+ or NO3− back into the system, thus offsetting biological uptake to some degree, and mainly occurs during the senescence period. A part of the settled organic N, however, is recalcitrant and can be stored in the SFW in the long-term.
As described above, nitrification may follow ammonification and is regulated by the concentration of NH4+ and oxygen, which functions as the terminal electron acceptor of the reaction (stoichiometric Equation (13)). Plants can therefore assist nitrification by transporting oxygen to the anaerobic soil through the aerenchyma, albeit restricted to the rhizosphere [48]. The NO3− generated by nitrification may diffuse into the anaerobic soil and be used as the terminal electron acceptor by DNRA bacteria when oxidizing organic matter to obtain energy through DNRA. This process, in turn, generates NH4+ as the end product and occurs when the pH of the medium is acidic (stoichiometric Equation (14)) and the available NO3− is not denitrified or biologically assimilated (Figure 6).
As observed above, ammonification and nitrification are relevant not only to reduce the concentrations of organic N and NH4+, but also to generate NO3− as the end product, which can be permanently removed from the system by denitrification (Figure 6). In general, the N transformation processes are limited by the diffusion of NH4+ in the anaerobic soil, which is considerably slower than that of NO3− [4,48]. Reinhardt et al. [45] reported that redox conditions of the water overlying anaerobic soils control nitrification rates and subsequent denitrification. The study found that aerobic water—supported by photosynthesis—promoted nitrification at the sediment-water interface, whereas anaerobic water caused the release of NH4+ from the topsoil, which stimulated assimilation by duckweed. This event consequently inhibited generation of NO3− by nitrification and subsequent denitrification. Finally, as the N transformation processes are all mediated by enzymatic activity, temperature is also a controlling factor.
2.3.6. Seasonality
As discussed in Section 2.2.3, SFWs under the temperate climate are subject to large variations in water flow, and thus in HRT. In addition to that, these SFWs experience seasonal variations in temperature, which also affect the overall N removal, especially in relation to N removal efficiency [26,27,28,37,38,45,51,69]. This is because important N removal mechanisms, such as denitrification and biological uptake, are mediated by enzymatic activity. As SFWs receiving agricultural subsurface drainage largely depend on denitrification and partly on biological uptake to reduce N loads, seasonality benefits N removal in the so-called vegetation growing season, characterized by warmer temperatures, and suppresses it during winter [26,38,45,48,49,51,67,71]. Xue et al. [67], for example, estimated the denitrification capacities of three SFWs (based on results from mesocosms) around six times higher in summer (25 °C) than in winter (4 °C). The seasonal variations of temperature and HRT produce even stronger effects on the removal of N throughout the year, by which denitrification and biological uptake rates typically reach their peaks during summer, as a result of warmer temperatures and longer HRTs, whereas cold and short HRTs during winter markedly suppress these processes [22,45,48]. This combined effect could be observed in Ulén et al. [38], who demonstrated a significant direct relationship between the product of soil temperature and HRT, and NO3− removal efficiency in a SFW (p < 0.01; linear function). This study found that the NO3− removal efficiency values in the linear function corresponding to summer were indeed markedly higher than those corresponding to the other seasons.
According to the above, Kadlec [47] proposed that a fixed NO3− removal efficiency could be achieved if the temperature variations were compensated by the HRT, i.e., cold and warm temperatures could produce similar NO3− removal efficiencies provided the HRT is longer and shorter, respectively. Steidl et al. [26], for example, reported effective N removal in a SFW when the HRT and water temperature were over 20 days and 8 °C, which occurred only from spring to autumn. However, SFWs commonly receive the highest N loads during winter, as discussed in Section 2.2.3, which complicates management plans to optimize performance. Therefore, a proper SFW sizing is not only necessary to ensure sufficient HRT for the N removal mechanisms, but also to compensate for seasonal temperature variations so that the system can achieve an annual N removal goal. Surface-flow constructed wetlands that do not take this into account may risk becoming sources of N during cold periods with short HRTs [26].
2.3.7. Final Remarks
At this point, only intra and inter-variability in N treatment by SFWs receiving agricultural subsurface drainage, and the associated processes have been covered. However, successful application of SFWs for the treatment of N must also take into account other aspects, such as (i) the system lifetime, including maturation and post-maturation effects, and the effectiveness of different maintenance operations; (ii) the collective effect of SFWs in watersheds, including siting and design; (iii) the intrinsic limitations of SFWs, including their common need for large areas, great dependence on the climate for optimal performance, and emission of nitrous oxide (a potent greenhouse gas); and finally (iv) the cost-efficiency of the system. Thereby, further analyses and evaluations are necessary to ensure that SFWs are a viable solution to reduce excess N loads under different agricultural catchment conditions. Lastly, these efforts are essential to help preserve the quality of surface waters with minimal impact on agricultural activities and production.
3. Summary, Conclusions and Final Remarks
Surface-flow constructed wetlands are a prevalent practice in reducing excess N loads at the edge of tile-drained agricultural catchments to surface waters. This is achieved through a combination of increased HRT with N biogeochemical processes. Despite the increasing use of SFWs and growing body of research attesting their capacity, this review clearly observed a large intra and inter-variability in performance, which are the result of system design and local catchment characteristics, including N load and climate.
3.1. Nitrogen Inputs and Incoming Loads
Nitrogen load largely varied between SFWs and proved to be normally a major controlling factor for N removal rate due to a cumulative effect of N in the system, therefore greatly explaining the inter-variability in N removal rate. Thus, increasing hydraulic loads and particularly N concentrations tend to markedly raise the removal rate, and SFWs receiving higher N loads tend to outperform others in a rate basis. Reductions in N concentration at the outlet, however, proved to decrease given higher inputs of N, which suggested more untreated N crossing the system. The review found that this effect is associated with an increase in water flow, which often correlates positively to N concentration and shortens the HRT for effective removal. Therefore, significant reductions in N concentration or lower concentrations at the outlet may only be observed if water flow does not increase concomitantly to N inputs. As a result, increasing N loads are expected to benefit the performance of SFWs in a rate basis, while decreasing the reduction of N concentration at the outlet or efficiency of the system.
Among the different N forms, the review found that NO3− clearly contributes most to the relationship between N load and removal rate—as denitrification rate promptly responds to NO3− inputs—thus indicating that higher NO3− fractions from total N at the inlet enhance the removal rate. Fortunately, the review found that this is often the case, i.e., dominant NO3− fractions at the inlet, which reflected in comparable variations of NO3− and total N loads. Thereby, NO3− largely contributed to the variability in performance. Ammonium and organic N loads, on the other hand, were found to contribute little to the relationship between N load and removal rate. Besides that, NH4+ loads are normally low, while organic N loads can be highly variable, albeit weakly correlated to their removal rates, which caused great variance in the removal efficiency of organic N between SFWs. Thus, these N forms contribute less to the overall performance, besides being more prone to be generated in situ and exported. As a result, the performance of SFWs benefits from N loads consisting mainly of NO3−.
In relation to N removal efficiency, the effect of N load tends to be negative and minor, thus generally explaining little of its variability. In this case, not even N concentration showed a significant effect. The review found, however, that system efficiency is closely related to hydrological and biogeochemical factors that regulate the functioning of N removal mechanisms, such as denitrification, biological uptake and settling. Increasing hydraulic loads—probably leading to higher N loads—contribute, therefore, to decrease the efficiency of the system or reduction of N concentration at the outlet by significantly raising N export as a result of insufficient HRT to allow proper N processing rates. Thereby, unstable efficiency can be expected in SFWs subject to varying hydrological regimes. Specifically, the review found that exports of NO3− and organic N respond to variations in hydraulic load, where the effect on organic N was more prominent. Thus, increasing fractions of organic N from total N at the inlet or the generation of organic N in situ may accentuate the negative effect of hydraulic or N load in the efficiency of SFWs. Finally, the review indicated that N removal efficiency tends to respond more promptly to hydraulic load in a lower range, whereby HRT is a limiting factor for N removal mechanisms.
The review found that hydraulic load regulates the HRT and the active hydrological area or volume of the SFW, therefore the contact time of N with the removal components of the system, and the level of N distribution and treatment. Hence, significantly high hydraulic loads tend to restrict N removal efficiency not only by shortening the HRT, but also by promoting preferential flow and stagnant water, which reduce that contact time and underutilize the treatment space of the system. Despite the importance, the review recognized this issue as little investigated. Therefore, further studies are recommended, mainly regarding the relationship between water flow dynamics and N treatment.
3.2. Design
Design parameters have been evaluated as fundamental to control HRT and water flow dynamics, and thus ensure effective SFWs. Large SFWs allow long HRTs and wide areas for N biogeochemical processes and removal, while deep waters can be particularly relevant for small systems subject to intense hydraulic loads in order to prolong the HRT. In this context, the area ratio of the SFW for the agricultural catchment has been found as critical, as effective systems must be large enough to accommodate and treat the incoming N loads with sufficient HRT, mainly during periods of intense discharge. The review estimated that 40–50% N removal can be generally achieved with an area ratio of 1–4%, with minor increments in N removal above this threshold, as HRT is no longer a limiting factor. Smaller systems may otherwise be advantageous if high N removal rates are the goal. Furthermore, it has been found that aspect ratio length to width, position and configuration of the inlet and outlet, presence of obstructions to the water flow, bathymetry, and vegetation type and distribution, have all proved to influence water flow dynamics in different degrees, therefore with potential implications for N treatment, as indeed reported to some extent. In general, however, the review observed that design parameters have been little investigated in relation to N treatment, and recommends particular attention in future studies. These efforts can potentially contribute to enhance N removal by improving the hydrology of SFWs.
3.3. Removal Processes and Factors
Denitrification has been described as the main N removal mechanism due to normally higher processing rates and recoveries of the available N compared to biological uptake and settling, besides ensuring permanent removal of N from the system. The latter two mechanisms, in turn, can only store N—mainly as organic N—in biomass or onto the topsoil for a certain period, thus with a limited contribution to the overall N removal. Ammonification, nitrification and DNRA, on the other hand, do not contribute directly to the overall N removal, but regulate the availability of NH4+ and NO3− prone to biological uptake or denitrification, according to local conditions. Finally, although volatilization also removes N permanently from the system, its contribution is generally considered negligible. Investigation of the potential of this process is otherwise recommended in SFWs experiencing anaerobic and basic water.
The review found that maturation process is crucial to ensure effective N removal in SFWs, and mainly involves the development of vegetation, which supports denitrification by supplying organic matter and substrate for denitrifying bacteria. Moreover, this process promotes biological uptake by plants and microorganisms, and settling. Maturation of SFWs, however, typically takes many years to complete, and so the full potential of the system to remove N. Therefore, suboptimal performance is normally observed during initial operation. In line with this, denser vegetation contributes to increasing the system efficiency, where emergent vegetation, in particular, can promote N removal at an early stage. Thereby, wide deep areas should be avoided in SFWs in order to allow vegetation development, and initial planting with emergent vegetation can potentially enhance performance during initial operation. In addition to the above, the review found that denitrification is promoted by warmer temperatures, whereas low inputs of phosphorus may limit this process given sufficient concentrations of NO3− and carbon. Finally, the review highlighted the susceptibility of denitrification to vary due to the many controlling factors, which ultimately contribute to the intra and inter-variability in performance of SFWs. In relation to biological uptake, the review observed that N storage takes place mainly in plant biomass during the vegetation growing season, thus contributing to the overall N removal in a seasonal basis. Lastly, settling has demonstrated particular contribution to the overall N removal by accumulating and storing N for long periods in the topsoil, as promoted mainly by senescence events, although ammonification may offset its contribution to some extent by releasing NH4+ into the system.
Despite the findings of this review, N biogeochemical processes in SFWs receiving agricultural subsurface drainage have been little investigated, mainly in relation to long-term tests at the field-scale. Therefore, the review strongly recommends further studies, given the susceptibility of the performance to be affected or suppressed at the biogeochemical level in the context described herein, i.e., NO3−-rich effluents with low carbon inputs, long maturation periods and seasonal variations in temperature. These efforts are essential to support effective SFWs and reduce the intra and inter-variability in performance.
3.4. Climate
Climate has been identified as a major challenge for the successful application of SFWs due to seasonal and annual variations in hydrological regime and temperature, which highly affect controlling factors for N removal, thus the N processing rates, and subsequently the overall performance. Thereby, climate greatly contributes to the intra and inter-variability in performance. The review found that warm periods with long HRTs (e.g., during summer) provide proper conditions for effective removal, although N loads are typically low to contribute significantly to the removal rate and cumulative removal of N in an annual basis. Cold periods with short HRTs (e.g., during winter), on the other hand, do not support effective removal, although N loads are high to enhance the removal rate, which often results in major cumulative removals of N in a year. Moreover, the review found that more variable hydrological regimes tend to worsen the overall performance. Thus, management operations or technological interventions capable not only to enhance the system efficiency during winter, when N loads are often the highest, but also to stabilize it throughout the year, are greatly desired. Furthermore, these efforts are critical to reduce the intra and inter-variability in performance and ensure more predictable N treatments in SFWs.
Funding
This research received no external funding.
Conflicts of Interest
The author declares no conflict of interest.
References
- Randall, G.W.; Mulla, D.J. Nitrate nitrogen in surface waters as influenced by climatic conditions and agricultural practices. J. Environ. Qual. 2001, 30, 337–344. [Google Scholar] [CrossRef] [Green Version]
- Sun, B.; Zhang, L.; Yang, L.; Zhang, F.; Norse, D.; Zhu, Z. Agricultural non-point source pollution in China: Causes and mitigation measures. Ambio 2012, 41, 370–379. [Google Scholar] [CrossRef] [Green Version]
- Guo, W.; Fu, Y.; Ruan, B.; Ge, H.; Zhao, N. Agricultural non-point source pollution in the Yongding River Basin. Ecol. Indic. 2014, 36, 254–261. [Google Scholar] [CrossRef]
- Mitsch, W.J.; Day, J.W.; Gilliam, J.W.; Groffman, P.M.; Hey, D.L.; Randall, G.W.; Wang, N. Reducing Nutrient Loads, Especially Nitrate-Nitrogen, to Surface Water, Ground Water, and the Gulf of Mexico: Topic 5 Report for the Integrated Assessment on Hypoxia in the Gulf of Mexico; Decision Analysis Series no. 19; NOAA Coastal Ocean Office: Silver Spring, MD, USA, 1999. [Google Scholar]
- Baker, J.L. Limitations of improved nitrogen management to reduce nitrate leaching and increase use efficiency. In Optimizing Nitrogen Management in Food and Energy Production and Environmental Protection: Proceedings of the 2nd International Nitrogen Conference on Science and Policy; TheScientificWorld, Hindawi: London, UK, 2001; pp. 10–16. [Google Scholar]
- Dinnes, D.L.; Karlen, D.L.; Jaynes, D.B.; Kaspar, T.C.; Hatfield, J.L.; Colvin, T.S.; Cambardella, C.A. Nitrogen management strategies to reduce nitrate leaching in tile-drained midwestern soils. Agron J. 2002, 94, 153–171. [Google Scholar] [CrossRef]
- Baker, J.L.; Melvin, S.W.; Lemke, D.W.; Lawlor, P.A.; Crumpton, W.G.; Helmers, M.J. Subsurface drainage in Iowa and the water quality benefits and problem. In Drainage VIII the Proceedings of the Eighth International Drainage Symposium; Cooke, R., Ed.; American Society of Agricultural and Biological Engineers: Sacramento, CA, USA, 2004; pp. 39–50. [Google Scholar]
- McLellan, E.; Robertson, D.; Schilling, K.; Tomer, M.; Kostel, J.; Smith, D.; King, K. Reducing nitrogen export from the corn belt to the gulf of Mexico: Agricultural strategies for remediating hypoxia. JAWRA J. Am. Water Resour. Assoc. 2014, 51, 263–289. [Google Scholar] [CrossRef]
- Mitsch, W.J.; Day, J.W.; Gilliam, J.W.; Groffman, P.M.; Hey, D.L.; Randall, G.W.; Wang, N. Reducing nitrogen loading to the gulf of Mexico from the Mississippi River Basin: Strategies to counter a persistent ecological problem. Bioscience 2001, 51, 373–388. [Google Scholar] [CrossRef]
- Strock, J.S.; Kleinman, P.J.A.; King, K.W.; Delgado, J.A. Drainage water management for water quality protection. J. Soil Water Conserv. 2010, 65, 131A–136A. [Google Scholar] [CrossRef] [Green Version]
- Valero, C.S.; Madramootoo, C.A.; Stämpfli, N. Water table management impacts on phosphorus loads in tile drainage. Agric. Water Manag. 2007, 89, 71–80. [Google Scholar] [CrossRef]
- Pierce, S.C.; Kröger, R.; Pezeshki, R. Managing artificially drained low-gradient agricultural headwaters for enhanced ecosystem functions. Biology 2012, 1, 794–856. [Google Scholar] [CrossRef]
- Frey, S.K.; Hwang, H.-T.; Park, Y.-J.; Hussain, S.I.; Gottschall, N.; Edwards, M.; Lapen, D.R. Dual permeability modeling of tile drain management influences on hydrologic and nutrient transport characteristics in macroporous soil. J. Hydrol. 2016, 535, 392–406. [Google Scholar] [CrossRef]
- Hussain, S.I.; Frey, S.K.; Blowes, D.W.; Ptacek, C.J.; Wilson, D.; Mayer, K.U.; Su, D.; Gottschall, N.; Edwards, M.; Lapen, D.R. Reactive Transport of Manure-Derived Nitrogen in the Vadose Zone: Consideration of Macropore Connectivity to Subsurface Receptors. Vadose Zone J. 2019, 18, 1–18. [Google Scholar] [CrossRef] [Green Version]
- Stålnacke, P.; Aakerøy, P.A.; Blicher-Mathiesen, G.; Iital, A.; Jansons, V.; Koskiaho, J.; Kyllmar, K.; Lagzdins, A.; Pengerud, A.; Povilaitis, A. Temporal trends in nitrogen concentrations and losses from agricultural catchments in the Nordic and Baltic countries. Agric. Ecosyst. Environ. 2014, 198, 94–103. [Google Scholar] [CrossRef]
- Mendes, L.R.D. Edge-of-Field technologies for phosphorus retention from agricultural drainage discharge. Appl. Sci. 2020, 10, 634. [Google Scholar] [CrossRef] [Green Version]
- Weisner, S.E.B.; Johannesson, K.; Thiere, G.; Svengren, H.; Ehde, P.M.; Tonderski, K.S. National large-scale wetland creation in agricultural areas—Potential versus realized effects on nutrient transports. Water 2016, 8, 544. [Google Scholar] [CrossRef]
- Hoffmann, C.C.; Zak, D.; Kronvang, B.; Kjaergaard, C.; Carstensen, M.V.; Audet, J. An overview of nutrient transport mitigation measures for improvement of water quality in Denmark. Ecol. Eng. 2020, 155, 105863. [Google Scholar] [CrossRef]
- Groh, T.A.; Gentry, L.E.; David, M.B. Nitrogen removal and greenhouse gas emissions from constructed wetlands receiving tile drainage water. J. Environ. Qual. 2015, 44, 1001–1010. [Google Scholar] [CrossRef] [Green Version]
- Tanner, C.C.; Nguyen, M.; Sukias, J. Constructed wetland attenuation of nitrogen exported in subsurface drainage from irrigated and rain-fed dairy pastures. Water Sci. Technol. 2005, 51, 55–61. [Google Scholar] [CrossRef]
- Kang, H.; Freeman, C.; Lee, D.; Mitsch, W.J. Enzyme activities in constructed wetlands: Implication for water quality amelioration. Hydrobiologia 1998, 368, 231–235. [Google Scholar] [CrossRef]
- Tournebize, J.; Chaumont, C.; Fesneau, C.; Guenne, A.; Vincent, B.; Garnier, J.; Mander, Ü. Long-term nitrate removal in a buffering pond-reservoir system receiving water from an agricultural drained catchment. Ecol. Eng. 2015, 80, 32–45. [Google Scholar] [CrossRef]
- Borin, M.; Tocchetto, D. Five year water and nitrogen balance for a constructed surface flow wetland treating agricultural drainage waters. Sci. Total. Environ. 2007, 380, 38–47. [Google Scholar] [CrossRef]
- Lavrnić, S.; Braschi, I.; Anconelli, S.; Blasioli, S.; Solimando, D.; Mannini, P.; Toscano, A. Long-term monitoring of a surface flow constructed wetland treating agricultural drainage water in northern Italy. Water 2018, 10, 644. [Google Scholar] [CrossRef] [Green Version]
- Hoagland, C.R.; Gentry, L.E.; David, M.B.; Kovacic, D.A. Plant nutrient uptake and biomass accumulation in a constructed wetland. J. Freshw. Ecol. 2001, 16, 527–540. [Google Scholar] [CrossRef]
- Steidl, J.; Kalettka, T.; Bauwe, A. Nitrogen retention efficiency of a surface-flow constructed wetland receiving tile drainage water: A case study from north-eastern Germany. Agric. Ecosyst. Environ. 2019, 283. [Google Scholar] [CrossRef]
- de Haan, J.; van der Schoot, J.R.; Verstegen, H.; Clevering, O. Removal of nitrogen leaching from vegetable crops in constructed wetlands. Acta Hortic. 2010, 852, 139–144. [Google Scholar] [CrossRef] [Green Version]
- Tolomio, M.; Ferro, N.D.; Borin, M. Multi-Year N and P removal of a 10-year-old surface flow constructed wetland treating agricultural drainage waters. Agronomy 2019, 9, 170. [Google Scholar] [CrossRef] [Green Version]
- Sukias, J.; Tanner, C.C. Surface flow constructed wetlands as a drainage management tool–long term performance. In Adding to the Knowledge Base for the Nutrient Manager; Currie, L.D., Christensen, C.L., Eds.; Fertilizer & Lime Research Centre, Occasional Report No 24. Massey University: Palmerston North, New Zealand, 2011; pp. 1–16. [Google Scholar]
- Strand, J.A.; Weisner, S.E.B. Effects of wetland construction on nitrogen transport and species richness in the agricultural landscape—Experiences from Sweden. Ecol. Eng. 2013, 56, 14–25. [Google Scholar] [CrossRef]
- Lenhart, C.; Gordon, B.; Gamble, J.; Current, D.; Ross, N.; Herring, L.; Nieber, J.; Peterson, H. Design and hydrologic performance of a tile drainage treatment wetland in Minnesota, USA. Water 2016, 8, 549. [Google Scholar] [CrossRef] [Green Version]
- Tournebize, J.; Chaumont, C.; Mander, Ü. Implications for constructed wetlands to mitigate nitrate and pesticide pollution in agricultural drained watersheds. Ecol. Eng. 2017, 103, 415–425. [Google Scholar] [CrossRef]
- Vymazal, J. The use of constructed wetlands for nitrogen removal from agricultural drainage: A review. Sci. Agric. Bohem. 2017, 48, 82–91. [Google Scholar] [CrossRef] [Green Version]
- Maxwell, E.; Peterson, E.W.; O’Reilly, C.M. Enhanced nitrate reduction within a constructed wetland system: Nitrate removal within groundwater flow. Wetlands 2017, 37, 413–422. [Google Scholar] [CrossRef]
- Larson, A.C.; Gentry, L.E.; David, M.B.; Cooke, R.A.; Kovacic, D.A. The role of seepage in constructed wetlands receiving agricultural tile drainage. Ecol. Eng. 2000, 15, 91–104. [Google Scholar] [CrossRef]
- Carstensen, M.V.; Hashemi, F.; Hoffmann, C.C.; Zak, D.; Audet, J.; Kronvang, B. Efficiency of mitigation measures targeting nutrient losses from agricultural drainage systems: A review. Ambio 2020, 49, 1820–1837. [Google Scholar] [CrossRef]
- Drake, C.; Jones, C.; Schilling, K.; Amado, A.A.; Weber, L. Estimating nitrate-nitrogen retention in a large constructed wetland using high-frequency, continuous monitoring and hydrologic modeling. Ecol. Eng. 2018, 117, 69–83. [Google Scholar] [CrossRef]
- Ulén, B.; Geranmayeh, P.; Blomberg, M.; Bieroza, M. Seasonal variation in nutrient retention in a free water surface constructed wetland monitored with flow-proportional sampling and optical sensors. Ecol. Eng. 2019, 139, 105588. [Google Scholar] [CrossRef]
- Kovacic, D.A.; David, M.B.; Gentry, L.E.; Starks, K.M.; Cooke, R.A. Effectiveness of constructed wetlands in reducing nitrogen and phosphorus export from agricultural tile drainage. J. Environ. Qual. 2000, 29, 1262–1274. [Google Scholar] [CrossRef] [Green Version]
- Kroeger, A.C.; Madramootoo, C.A.; Enright, P.; Laflamme, C. Efficiency of a small constructed wetland in southern Québec for treatment of agricultural runoff waters. In IWA Specialist Conference: Wastewater Biosolids Sustainability: Technical, Managerial, and Public Synergy; ResearchGate: Moncton, NB, Canada, 2007; pp. 1057–1062. [Google Scholar]
- Tanner, C.C.; Sukias, J.P.S. Multiyear nutrient removal performance of three constructed wetlands intercepting tile drain flows from grazed pastures. J. Environ. Qual. 2011, 40, 620–633. [Google Scholar] [CrossRef]
- Tanner, C.C.; Nguyen, M.; Sukias, J. Nutrient removal by a constructed wetland treating subsurface drainage from grazed dairy pasture. Agric. Ecosyst. Environ. 2005, 105, 145–162. [Google Scholar] [CrossRef]
- Kovacic, D.A.; Twait, R.M.; Wallace, M.P.; Bowling, J.M. Use of created wetlands to improve water quality in the Midwest—Lake Bloomington case study. Ecol. Eng. 2006, 28, 258–270. [Google Scholar] [CrossRef]
- Tanner, C.C.; Nguyen, M.L.; Sukias, J. Using constructed wetlands to treat subsurface drainage from intensively grazed dairy pastures in New Zealand. Water Sci. Technol. 2003, 48, 207–213. [Google Scholar] [CrossRef]
- Reinhardt, M.; Müller, B.; Gächter, R.; Wehrli, B. Nitrogen removal in a small constructed wetland: An isotope mass balance approach. Environ. Sci. Technol. 2006, 40, 3313–3319. [Google Scholar] [CrossRef]
- Kadlec, R.H. Constructed wetlands to remove nitrate. In Nutrient Management in Agricultural Watersheds: A Wetlands Solution; Dunne, E.J., Reddy, K.R., Carton, O.T., Eds.; Wageningen Academic Publishers: Wageningen, The Netherlands, 2005; pp. 132–143. [Google Scholar]
- Kadlec, R.H. Nitrogen farming for pollution control. J. Environ. Sci. Heal. Part A 2005, 40, 1307–1330. [Google Scholar] [CrossRef] [PubMed]
- O’Geen, A.; Budd, R.; Gan, J.; Maynard, J.; Parikh, S.; Dahlgren, R. Mitigating nonpoint source pollution in agriculture with constructed and restored wetlands. In Advances in Agronomy; Elsevier: Amsterdam, The Netherlands, 2010; pp. 1–76. [Google Scholar]
- Crumpton, W.G.; Kovacic, D.A.; Hey, D.L.; Kostel, J.A. Potential of restored and constructed wetlands to reduce nutrient export from agricultural watersheds in the corn belt. In Final Report: Gulf Hypoxia and Local Water Quality Concerns Workshop; American Society of Agricultural and Biological Engineers: St. Joseph, MI, USA, 2008; pp. 29–42. [Google Scholar]
- Khan, I. Effects of Hydraulic Load on Nitrate Removal in Surface-Flow Constructed Wetlands; Halmstad University: Halmstad, Sweden, 2011. [Google Scholar]
- Bastviken, S.K.; Weisner, S.E.B.; Thiere, G.; Svensson, J.M.; Ehde, P.M.; Tonderski, K.S. Effects of vegetation and hydraulic load on seasonal nitrate removal in treatment wetlands. Ecol. Eng. 2009, 35, 946–952. [Google Scholar] [CrossRef]
- Kadlec, R.H.; Wallace, S. Treatment Wetlands, 2nd ed.; Taylor & Francis Group: Boca Raton, FL, USA, 2009. [Google Scholar]
- Song, X.; Ehde, P.M.; Weisner, S.E.B. Effects of water depth and phosphorus availability on nitrogen removal in agricultural wetlands. Water 2019, 11, 2626. [Google Scholar] [CrossRef] [Green Version]
- Guo, C.; Cui, Y.; Dong, B.; Luo, Y.; Liu, F.; Zhao, S.; Wu, H. Test study of the optimal design for hydraulic performance and treatment performance of free water surface flow constructed wetland. Bioresour. Technol. 2017, 238, 461–471. [Google Scholar] [CrossRef] [PubMed]
- Guo, C.; Cui, Y.; Shi, Y.; Luo, Y.; Liu, F.; Wan, D.; Ma, Z. Improved test to determine design parameters for optimization of free surface flow constructed wetlands. Bioresour. Technol. 2019, 280, 199–212. [Google Scholar] [CrossRef] [PubMed]
- Haverstock, M.J. An Assessment of a Wetland-Reservoir Wastewater Treatment and Reuse System Receiving Agricultural Drainage Water in Nova Scotia; Dalhousie University: Halifax, NS, Canada, 2010. [Google Scholar]
- Tanner, C.C.; Kadlec, R.H. Influence of hydrological regime on wetland attenuation of diffuse agricultural nitrate losses. Ecol. Eng. 2013, 56, 79–88. [Google Scholar] [CrossRef]
- Tanner, C.C.; Sukias, J.P.S.; Yates, C.R. New Zealand Guidelines: Constructed Wetland Treatment of Tile Drainage; NIWA Information Series No. 75; National Institute of Water & Atmospheric Research Ltd.: Hamilton, New Zealand, 2010. [Google Scholar]
- Persson, J.; Somes, N.L.G.; Wong, T.H.F. Hydraulics efficiency of constructed wetlands and ponds. Water Sci. Technol. 1999, 40, 291–300. [Google Scholar] [CrossRef]
- Thackston, E.L.; Shields, F.D.; Schroeder, P.R. Residence time distributions of shallow basins. J. Environ. Eng. 1987, 113, 1319–1332. [Google Scholar] [CrossRef]
- Lavrnić, S.; Alagna, V.; Iovino, M.; Anconelli, S.; Solimando, D.; Toscano, A. Hydrological and hydraulic behaviour of a surface flow constructed wetland treating agricultural drainage water in northern Italy. Sci. Total. Environ. 2020, 702, 134795. [Google Scholar] [CrossRef]
- Su, T.-M.; Yang, S.-C.; Shih, S.-S.; Lee, H.-Y. Optimal design for hydraulic efficiency performance of free-water-surface constructed wetlands. Ecol. Eng. 2009, 35, 1200–1207. [Google Scholar] [CrossRef]
- Pugliese, L.; Kusk, M.; Iversen, B.V.; Kjaergaard, C. Internal hydraulics and wind effect in a surface flow constructed wetland receiving agricultural drainage water. Ecol. Eng. 2020, 144, 105661. [Google Scholar] [CrossRef]
- Bodin, H.; Mietto, A.; Ehde, P.M.; Persson, J.; Weisner, S.E.B. Tracer behaviour and analysis of hydraulics in experimental free water surface wetlands. Ecol. Eng. 2012, 49, 201–211. [Google Scholar] [CrossRef] [Green Version]
- Kalcic, M.; Crumpton, W.; Liu, X.; D’Ambrosio, J.; Ward, A.; Witter, J. Assessment of beyond-the-field nutrient management practices for agricultural crop systems with subsurface drainage. J. Soil Water Conserv. 2018, 73, 62–74. [Google Scholar] [CrossRef] [Green Version]
- Grebliunas, B.D.; Perry, W.L. The role of C:N:P stoichiometry in affecting denitrification in sediments from agricultural surface and tile-water wetlands. Springerplus 2016, 5, 359. [Google Scholar] [CrossRef] [Green Version]
- Xue, Y.; Kovacic, D.A.; David, M.B.; Gentry, L.E.; Mulvaney, R.L.; Lindau, C.W. In Situ Measurements of Denitrification in Constructed Wetlands. J. Environ. Qual. 1999, 28, 263–269. [Google Scholar] [CrossRef] [Green Version]
- Matheson, F.E.; Sukias, J.P. Nitrate removal processes in a constructed wetland treating drainage from dairy pasture. Ecol. Eng. 2010, 36, 1260–1265. [Google Scholar] [CrossRef]
- David, M.B.; Gentry, L.E.; Smith, K.M.; Kovacic, D.A. Carbon, plant, and temperature control of nitrate removal from wetland mesocosms. Trans. Ill. State Acad Sci. 1997, 90, 103–112. [Google Scholar]
- Rutherford, K.; Wheeler, D. Wetland nitrogen removal modules in OVERSEER®. In Adding to the Knowledge Base for the Nutrient Manager Occasion Report No 24; Currie, L.D., Christensen, C.L., Eds.; Fertilizer and Lime Research Centre, Massey University: Palmerston North, New Zealand, 2011; p. 12. [Google Scholar]
- Nilsson, J.E.; Liess, A.; Ehde, P.M.; Weisner, S.E. Mature wetland ecosystems remove nitrogen equally well regardless of initial planting. Sci. Total. Environ. 2020, 716, 137002. [Google Scholar] [CrossRef] [PubMed]
Figure 1.
Annual variation in nitrogen (N) removal rate (a) and efficiency (b) from agricultural subsurface drainage within and between surface-flow constructed wetlands. Reference studies are indicated in square brackets. Wetlands in the same study are distinguished by different colors. * Include a year with net N export (−38.9 g m−2). ** Average.

Figure 2.
Simple regression between nitrogen (N) load and removal rate (data in red) and efficiency (data in blue) for total N (a) (data from Table 1) and the N forms nitrate (NO3−) (b), ammonium (NH4+) (c) and organic N (d) (data from Table 2). The numbers in brackets indicate outliers (x, y) removed from the analysis. Note that the scales for total N and NO3− are equal.

Figure 3.
Modelled total nitrogen (N) removal rate as a function of hydraulic load and total N concentration (a) according to the relationship between total N removal efficiency and hydraulic load (Figure 4a), and the integration of this relationship into the model of N removal rate as a function of N removal efficiency and N load (Equation (6)); and simple regression between the predicted and observed (data from Table 1) N removal rates (b). The numbers in brackets indicate an outlier (x, y) removed from the analysis.

Figure 4.
Simple regression between hydraulic load and removal rate (data in red) and efficiency (data in blue) for total nitrogen (N) (a) (data from Table 1) and the N forms nitrate (NO3−) (b), ammonium (NH4+) (c) and organic N (d) (data from Table 2). The numbers in brackets indicate outliers (x, y) removed from the analysis. Note that the scales for total N and NO3− are equal.

Figure 5.
Simple regression between area ratio of surface-flow constructed wetland (SFW) for the agricultural catchment (AC) and removal efficiency of total nitrogen (N) (a) (data from Table 1) and nitrate (NO3−) (b) (data from Table 1 and Table 2). Note that the scales for total N and NO3− are equal.

Figure 6.
Schematic of nitrogen (N) cycle or removal mechanisms for the N forms nitrate (NO3−), ammonium (NH4+) and organic N/particle-bound N (PN), represented by blue, green and red arrows, respectively, in a surface-flow constructed wetland receiving agricultural subsurface drainage. * Ammonia. ** Dissimilatory NO3− reduction to NH4+. *** Dinitrogen.

Table 3.
Multiple regression between hydraulic load (m yr−1) and concentration (mg L−1) of the nitrogen (N) forms total N, nitrate (NO3−), ammonium (NH4+) and organic N as independent variables, and removal rate (g m−2 yr−1) and efficiency (%) of these N forms as dependent variables (data from Table 1 and Table 2).
| N form | Removal | Number of Observations | R2 | p-Value | p-Value | Coefficient | ||
|---|---|---|---|---|---|---|---|---|
| Hydraulic Load | Concentration | Hydraulic Load | Concentration | |||||
| Total N | Rate | 21 | 0.26 | 0.06 | 0.03 * | 0.07 | 2.76 | 12.33 |
| Efficiency | 22 | 0.25 | 0.06 | 0.02 * | 0.49 | −0.65 | −1.00 | |
| NO3− | Rate | 22 | 0.55 | 0.00 * | 0.00 * | 0.04 * | 3.38 | 8.03 |
| Efficiency | 22 | 0.07 | 0.48 | 0.31 | 0.95 | −0.26 | −0.09 | |
| NH4+ | Rate | 16 | 0.14 | 0.38 | 0.17 | 0.68 | −0.51 | 5.51 |
| Efficiency | 16 | 0.14 | 0.36 | 0.23 | 0.29 | −2.07 | 65.38 | |
| Organic N | Rate | 15 | 0.00 | 0.98 | 0.93 | 0.86 | −0.15 | 5.79 |
| Efficiency | 12 | 0.51 | 0.04 * | 0.03 * | 0.16 | −3.37 | 51.07 | |
* Significant at 95% confidence interval.
Table 4.
Average processing rates of nitrogen removal mechanisms in surface-flow constructed wetlands receiving agricultural subsurface drainage, recovery (%) of the initial nitrate (NO3−) concentration in water (in brackets), and experimental conditions. Note that the remaining fraction of the total recovery refers to NO3− not removed. * Dissimilatory NO3− reduction to ammonium.
| Name (Scale) | Denitrification | Biological Uptake | Settling | Ammonification | Nitrification | DNRA * | NO3− Concentration | Temperature | Carbon in Sediments | Period | Study |
|---|---|---|---|---|---|---|---|---|---|---|---|
| mg m−2 h−1 (%) | mg L−1 | °C | g m−2 | d | |||||||
| Gully (Laboratory) a | 38 b | - | - | - | - | - | 2 [10 c] | 25 | - | 20 | [66] |
| Gully (Laboratory) a | 103 b | - | - | - | - | - | 2 [40 c] | 25 | - | 20 | [66] |
| Gully (Laboratory) a | 24 b | - | - | - | - | - | 20 [10 c] | 25 | - | 20 | [66] |
| Gully (Laboratory) a | 221 b | - | - | - | - | - | 20 [40 c] | 25 | - | 20 | [66] |
| Moga, Durbin and Gully (Laboratory) a | 64 b | - | - | - | - | - | 10 [20 c] | 25 | - | 20 | [66] |
| Moga, Durbin and Gully (Laboratory) a | 78 b | - | - | - | - | - | 10 [40 c] | 25 | - | 20 | [66] |
| - (Mesocosm 1) | ≤9.3 (58) | 0.3 (5.5) d+e | - | - | - | - | 15 | - | - | 33 | [67] |
| - (Mesocosm 2) | 0.5 (9.9) d+e | - | - | - | - | [67] | |||||
| Wetland 1 (Mesocosm) | 2.1 | - | - | - | - | - | 9–20 | 24 f | - | 0.7 | [67] |
| Wetland 1 (Mesocosm) | 6.2 | - | - | - | - | - | 9–20 | 18 f | 9.1 e | 0.1 | [67] |
| Wetland 1 (Mesocosm) | 11.8 | - | - | - | - | - | 9–20 | 25 f | 9.5 e | 0.1 | [67] |
| Wetland 2 (Mesocosm) | 2.7 | - | - | - | - | - | 9–20 | 25 f | - | 0.7 | [67] |
| Wetland 2 (Mesocosm) | 2.0 | - | - | - | - | - | 9–20 | 4 f | 2.1 e | 0.1 | [67] |
| Wetland 2 (Mesocosm) | 3.9 | - | - | - | - | - | 9–20 | 17 f | 5.0 e | 0.1 | [67] |
| Wetland 2 (Mesocosm) | 9.0 | - | - | - | - | - | 9–20 | 20 f | 9.3 e | 0.1 | [67] |
| Toenepi (Mesocosm) | 7.2 (39.3) | 1.9 (10.2) d+e+g+h+i | - | - | - | 0.2 (1.0) e | 10.4 | 14 j | - | 6 | [68] |
| Toenepi (Field) | 6.2 b | - | - | - | - | - | 10.8 | - | 61 k | 365 | [42] |
| Boden (Field) | 2.9 | 0.7 i | 4.3 | 1.1 | 3.8 | - | 1.9–3.0 | 10 | - | 210 | [45] |
| Boden (Laboratory) a | ≤28.8 | - | - | - | - | - | 1.9–15.6 | 9 | - | 4.8 | [45] |
| - (Laboratory) a | 3.6 | - | - | - | - | - | 50 | 20 | 9.7 k | <5 | [22] |
| - (Field) | 0.3 (6.3 l) | 2.5 (53.9 l) d+h | 1.3 (27.7 l) m | - | - | - | 1.4 | −1.5–27.2 | - | 1825 | [23] |
| - (Field) | - | 0.0 b, d+h | 0.01 b, n | - | - | - | 11.8 l | 2.7–24.3 | - | 1825 | [24] |
| Wetland B (Field) | - | 0.005 d+h | 0.0 | - | - | - | 7.5 | - | - | 153 | [25] |
| - (Field) | - | - | 2.7 | - | - | - | 7.5 | 9 | 144.2 | 577 | [26] |
a Media kept in the dark and anaerobic; b value in mg kg−1 h−1; c carbon concentration; d above-ground plant; e topsoil (5 cm); f sediment-water interface; g duckweed; h below-ground plant; i overlying water; j air; k value in g kg−1; l total nitrogen; m topsoil (30 cm); n topsoil (15 cm).
Publisher’s Note: MDPI stays neutral with regard to jurisdictional claims in published maps and institutional affiliations. |
© 2021 by the author. Licensee MDPI, Basel, Switzerland. This article is an open access article distributed under the terms and conditions of the Creative Commons Attribution (CC BY) license (http://creativecommons.org/licenses/by/4.0/).
Share and Cite
MDPI and ACS Style
Mendes, L.R.D. Nitrogen Removal from Agricultural Subsurface Drainage by Surface-Flow Wetlands: Variability. Processes 2021, 9, 156. https://0-doi-org.brum.beds.ac.uk/10.3390/pr9010156
AMA Style
Mendes LRD. Nitrogen Removal from Agricultural Subsurface Drainage by Surface-Flow Wetlands: Variability. Processes. 2021; 9(1):156. https://0-doi-org.brum.beds.ac.uk/10.3390/pr9010156
Chicago/Turabian StyleMendes, Lipe Renato Dantas. 2021. "Nitrogen Removal from Agricultural Subsurface Drainage by Surface-Flow Wetlands: Variability" Processes 9, no. 1: 156. https://0-doi-org.brum.beds.ac.uk/10.3390/pr9010156
Note that from the first issue of 2016, this journal uses article numbers instead of page numbers. See further details here.