Article

Assessment of Heavy Metals in the Sediments of Chalan Beel Wetland Area in Bangladesh

by
Mohammad Abdus Salam
1,*,
Mohammad Ashraful Alam
2,
Sulav Indra Paul
3,
Fatama Islam
1,
Dinesh Chandra Shaha
4,
Mohammad Mizanur Rahman
2,
Mohammad Arifur Rahman Khan
5,
Mohammad Mahbubur Rahman
3,
Abul Kalam Mohammad Aminul Islam
6,
Tofayel Ahamed
7,
Golum Kibria Muhammad Mustafizur Rahman
2,
Mohammad Giashuddin Miah
7,
Abdul Mannan Akanda
8 and
Tofazzal Islam
3
1
Department of Genetics & Fish Breeding, Bangabandhu Sheikh Mujibur Rahman Agricultural University, Gazipur 1706, Bangladesh
2
Department of Soil Science, Bangabandhu Sheikh Mujibur Rahman Agricultural University, Gazipur 1706, Bangladesh
3
Institute of Biotechnology and Genetic Engineering, Bangabandhu Sheikh Mujibur Rahman Agricultural University, Gazipur 1706, Bangladesh
4
Department of Fisheries Management, Bangabandhu Sheikh Mujibur Rahman Agricultural University, Gazipur 1706, Bangladesh
5
Department of Agronomy, Bangabandhu Sheikh Mujibur Rahman Agricultural University, Gazipur 1706, Bangladesh
6
Department of Genetics and Plant Breeding, Bangabandhu Sheikh Mujibur Rahman Agricultural University, Gazipur 1706, Bangladesh
7
Department of Agroforestry and Environment, Bangabandhu Sheikh Mujibur Rahman Agricultural University, Gazipur 1706, Bangladesh
8
Department of Plant Pathology, Bangabandhu Sheikh Mujibur Rahman Agricultural University, Gazipur 1706, Bangladesh
*
Author to whom correspondence should be addressed.
Submission received: 28 January 2021 / Revised: 9 February 2021 / Accepted: 19 February 2021 / Published: 25 February 2021

Abstract

:
This study aimed to determine the levels and possible sources of heavy metals (HMs) in the sediments of Chalan beel (a large lake-like aquatic ecosystem) area located in the northwestern part of Bangladesh. The mean concentrations (mg kg−1) of two HMs, Cd (6.22) and Pb (51.39) exceeded the world normal averages (WNA), whereas the mean concentrations (mg kg−1) of Ni (60.46), Zn (10.75), Mn (8.64) and Cu (4.71) were below the WNA. The sediments showed significant enrichment with Cd, Pb and Ni in the studied area. The geo-accumulation index values of Cd (3.72) and Pb (0.76) were significantly higher in the sediments. The contamination factor and potential ecological risk index values of Cd and Pb revealed that Chalan beel was extremely and moderately contaminated by these heavy metals, respectively. Analysis of dye complexes used in handlooms around the Chalan beel areas revealed that mean concentrations of Cd and Pb exceeded the WNA. Furthermore, analyses of principal component, cluster and correlation matrix indicated that the presence of the higher levels of Cd and Pb in the sediments might be linked to various anthropogenic activities like discharged dyes into the beel water from the nearby handloom dyeing factories.

1. Introduction

Sediments of any waterbody could be contaminated by different heavy metals accumulated from agro-chemicals and industrial effluents; such materials consequently contaminate fish, vegetables and other crops grown in a waterbody. Accumulation of heavy metals in the wetland soil is a major issue for their toxicity to plants, animals, and human beings [1]. Heavy metals have been persistent in nature for a long time and have the potential to disintegrate the natural ecological balance [2]. In fact, heavy metals pollution and their management is a global concern for the environmentalists due to their non-biodegradable and hazardous nature [3]. The aquatic environments are polluted by metals through various sources for instances, industrial effluents, domestic and municipal wastewater effluents and diffused sources including runoff, erosion and atmospheric deposition [3,4]. Disposal of untreated effluents and synthetic dyes from the industries directly to the open fields and waterbodies seriously degrades the environment that collapses the ecosystem functions nationally and internationally [5]. Mordants used in the textile and wool industries are made of heavy metal complexes [6]. The effluents discharged by industries are highly colored as well as contain toxic metals. Nowadays, these metal complex dyes are a serious concern across the world. Heavy metals that are introduced into the aquatic environment are ultimately deposited to the sediments [7]. That is why sediments are one of the most vulnerable parts in aquatic systems which need regular monitoring to assess the quality of the ecosystems [8].
Sediment serves as the reservoir of metals for any aquatic systems [7], and more than 90% heavy metals are known to be found in suspended matter as well as in sediments [9]. Dissolved metals adsorb in fine particles and move towards sediments at the bottom where metals accumulate and remain for long time [10]. Various physico-chemical reactions, mineralogical attributes and anthropogenic factors influence the abundance and distribution of heavy metals in wetland ecosystems [10,11]. Sediments play a major role in organizing a trophic level in aquatic bodies [7,10] and render a pivotal site for biogeochemical process and food web [12]. Thus, sediments maintain an interconnection between chemical and biological systems as a major component for sustainable aquatic environment as well as act as a sink of various pollutants. Therefore, sediments have been studied widely as an important source of nutrients for aquatic life and is still a researchable issue to assess the anthropogenic impacts on any aquatic ecosystems [13].
Scientists have assessed the abundance and status of heavy metals and various pollution indices in sediments of different waterbodies including rivers and estuaries across the globe such as the Karnaphuli River estuary [14], the Feni River estuary [15], the Sangu River estuary [16], and the Bakkhali River estuary in Bangladesh [17]. Similarly, metal contamination in the sediments of the Yantagze River estuary [18] and the Luanhe River estuary [19] in China, and the Tapti river estuary [20] and the River Gomti [10] in India have been reported.
The term beel is derived from Bengali word which denotes a comparatively large surface and lentic waterbody that stores surface run-off water via internal channels [21]. The Chalan beel is a large depression wetland in the northwest region of Bangladesh, which has a huge ecological and social importance [16]. Chalan beel is consisted of a series of depressions interconnected by many channels to form one continuous area of waterbodies during rainy season (July–November), and it shields an area of about 375 km2 [22]. The water area decreases to 52–78 km2 and looks like a cluster of beels (lake-like waterbodies) of varying sizes in the summer and winter season [22,23] rendering an alluvial crop land during post monsoon season. This beel is one of the most important sites for fishing, agriculture, aquaculture, livestock farming, integrated farming, and a site of recreation for the tourist [22]. Nationally, this beel plays an important role in producing a huge number of different fish species and it supplies fishes to local and national markets and provides a livelihood of around 0.1 million to fishermen [22]. In addition, many handloom dyeing factories are available in the districts of Pabna, Sirajganj and Natore at Chalan beel area in Bangladesh and minority of people lead their livelihood depending on these dyeing factories [24,25]. Although this beel has many significant contributions in national economy in Bangladesh through production of fishes, crops and vegetables, there is no report on the safety of sediments of this beel. However, no study has so far been carried out on the concentration of heavy metal in the sediments of Chalan beel wetland area. Therefore, this study was carried out (i) to determine the concentrations of heavy metals in the sediments and the dye complexes of Chalan beel area; (ii) to assess the pollution indices in the sediments; (iii) to assess the sediment quality guidelines of the sediments of Chalan beel area and (iv) to identify the probable sources of heavy metals in the sediments of Chalan beel area.

2. Materials and Methods

2.1. Study Area

The study area is located at 24.35° to 24.70° N latitude and 89.10° to 89.35° E longitudes comprising low lying areas of Sirajganj, Pabna and Natore districts of Bangladesh (Figure 1). The study sites belong to the agro-ecological zone of Lower Atrai Basin situated in the northwest part of the country. The soil is non-calcareous, dark grey, heavy, and strongly to slightly acidic in nature and has been classified as inceptisols in United States Department of Agriculture (USDA) class and lower Atrai Basin soil in Bangladesh classification [26], that is characterized by silty clay loam within 50 cm from the surface area as well as being alkaline in nature. The climatic condition of Chalan beel wetland area is humid, wet, and sub-tropical. In the month of June-July, heavy rainfall (269 to 370 mm) occurs, while during November-February scanty rainfall (0 to 55 mm) occurs. This wetland is one of the most important sites for agriculture, aquaculture, livestock farming, and integrated farming. Besides, many handloom dyeing factories are available in the adjacent of Chalan beel wetland area in Bangladesh. Thus, there might be a chance of environmental hazards; that is why the present study was carried out to assess the heavy metal concentration and pollution indices.

2.2. Design of the Study

The Chalan beel is a large area which includes many other local beels in Pabna, Sirajganj and Natore districts and ten such beels were selected for sediment sampling. The selected ten beels were Pankora beel (CB 1), Kanar beel (CB 2) and Western beel (CB 3) in Pabna district, Kawchar beel (CB 4), Khanpara beel (CB 5), Hamkuria beel (CB 6), Moesh Rohali beel (CB 7) and Barohash beel (CB 8) in Sirajganj district, Khuligari beel (CB 9) and Udvaria beel (CB 10) in Natore district, while six top sediment (0–15 cm) samples were collected randomly from each beel. Selected sites were recognized using Global Positioning System (GPS). These selected sites were considered as treatments and each treatment contained six replicates. Data were analyzed following randomized complete block design.

2.3. Sediments Sampling

Fresh and debris-free samples were collected in winter season (January, 2018). Collected sediments samples were air dried first at room temperature and then dried at 50 °C until a constant weight [27] and grounded finely using agate mortar. For precision chemical analysis fractions smaller 63 μm sized sediments were used as there is strong bonding between metals and sediments [28]. Sediment samples were analyzed for Pb, Cd, Ni, Zn, Cu and Mn in the Laboratory of Department of Soil Science, Bangabandhu Sheikh Mujibur Rahman Agricultural University, Gazipur 1706, Bangladesh using standard protocols [29].

2.4. Dye Complexes Sampling

A total of 20 different dye complex samples from handloom dyeing factories were collected from the experimental sites of the Chalan beel area in winter season (January, 2018). The samples were kept in the zip-lock bag and brought to the Laboratory of Soil Science, Bangabandhu Sheikh Mujibur Rahman Agricultural University (BSMRAU), Gazipur 1706, Bangladesh using standard protocols [29].

2.5. Determination of Metals from Sediments and Dye Complexes

Heavy metals from sediments and dye complexes were measured according to Shah et al. [20]. In brief, sediment and dye complex samples were dried in laboratory using an air circulating oven at 120 °C. Air dried samples were made uniform passing through a 2 mm nylon sieve. The sediment fractions (size < 2 mm) were ground in agate mortar and passed through 63 µm sieve to obtain silt-like samples. The pH levels of sediment and dye complex suspension were determined using a calibrated glass electrode pH meter (Model: EZODO, pH 5011) and their values ranged from 7.9 to 8.50 for all samples. Laboratory glassware and equipment were carefully sterilized with diluted HCl to minimize metal contamination. In order to determine the concentration of heavy metals, sediment and dye samples of 0.5g were digested in polytetrafluoroethylene (PTFE) vessel with 10 mL of ultrapure HNO3 acid, 3 mL of HCl, 3 mL of HF (40% W/V), and 2 mL of H2O2 (30% W/V) in a microwave digestion chamber (WX-6000, Preekem, Shanghai, China) for 15 min in distorted time periods USEPA-3052 (1996). Then, digested samples were filtered and diluted. Total metal concentrations of Pb, Cd, Ni, Zn, Cu and Mn were determined in samples using Atomic Absorption Spectrometer (170-30, serial 6268-001, Hitachi, Ibaraki, Japan) at Soil Science Laboratory, BSMRAU, Gazipur, Bangladesh. Super quality and analytical grade reagents were used in all cases. Ultra-pure water (Ultra Clear TM TWF UV UF Type IP23, EVOQUA Water Technologies, Barsbüttel, Germany) were used in case of all solution preparation. For precision analysis, all acid proof plastic and Teflon apparatus were soaked in 10% HNO3 solution for 24 h and rinsed several times with ultrapure water. Analytical blanks and standard reference materials were run simultaneously following similar procedures as samples. Standard solution for determining metal concentrations was prepared in the same acid matrix. Mareck KGaA supplied certified reference material (CRM 320) that was used (n = 6) to validate the data and ensuring the precision of the analytical procedure. A good agreement between the reference and the analytical values of the reference materials were indicated by the analytical results of the selected heavy metals. Recovery percentages were between 96 and 99% for all analyzed metals. The relative standard deviations (RSD) for all replications (six) were ≤9% and results also revealed that there was no contamination during analysis process. The limit of detection (LOD) of the heavy metals varied in the studied metals (Pb = Cd = Ni = Mn = 0.001, Cu = 0.003 and Zn = 0.005).

2.6. Assessment of Sediment Pollution Indices

2.6.1. Enrichment Factor (EF)

Enrichment factor was assessed to differentiate metal source originating from anthropogenic and natural means [13,30] which involves normalization of the sediments with respect to reference elements such as Al and Fe [31,32], Mn, Ti and Sc [30] and Li and Cs [33]. Normalized EF of metals in Chalan beel sediments from each site was calculated as described by Loska et al. [34]. Background values were used from world average concentration of metals shale value by Turekian and Wedepohl [35].
EF   = ( Cn / CMn )   sample ( Cn / CMn )   shale
where (Cn/CMn) is the ratio of elements of concern (Cn) to that of Mn (CMn) in the sediment sample (mg kg−1) and (Cn/CMn) is the similar ratio in response to unpolluted reference samples.

2.6.2. Contamination Factor (CF)

Contamination Factor (CF) is used to determine the level of contamination of sediment by heavy metal using the Hakanson [36] equation.
Contamination factor (CF) calculated as:
CF   =   Cn ( sample ) Bn ( shale )
where Cn is the concentration of metal the studied sample and Bn is the geochemical background value of that metal in the shale [35].

2.6.3. Geo-Accumulation Index (Igeo)

To determine the degree of metal pollution, Muller [37] proposed the Geo-accumulation index (Igeo).
I g e o   =   log   2 ( Cn 1.5 Bn )
where Cn denotes the concentration of the studied metal in sediments and Bn is the background value of that metal in the shale [35] and 1.5 is the factor for variation in the geochemical background values.

2.6.4. Potential Ecological Risk Index (PERI)

For assessment of potential ecological risk of heavy metals in sediments, Hakanson [36] introduced the following equation.
E i r =   T i r   × CF
Equation (2) was used to assess the risk index (RI) of sampling site by following the equation as below.
RI = Ʃ i n   E i r
where E i r is the potential ecological risk factor and Tir is the toxic response factor of studied metals. Tir was determined for Cu = Pb = Ni = 5, Zn = Mn = 1 and Cd = 30 [38]. E i r is used for single metal and RI is the comprehensive potential ecological risk index of the metals.

2.7. Statistical Analysis

All data (heavy metal concentrations, EF, PERI and Igeo) collected from the study area were statistically analyzed using one-way analysis of variance (ANOVA) to test the significant results (p < 0.05) between means. Standard deviation (±SD) was calculated to identify the range of means. Statistical analyses were done by using computer-based Statistical Analysis System (SAS), software developed by SAS Institute, US. The correlation, cluster analysis and principal component analyses were done to check the significant variation among the heavy metals in the soil sediment samples via statistical data analyzer, SPSS v18.0 [39].

3. Results

3.1. Metal Concentration in Sediments

The estimated heavy metals concentrations in sediments of Chalan beel wetland area are presented in Table 1. The mean concentration (mg kg−1) of heavy metals in sediments of the selected experimental area followed a descending order of Ni (60.46) > Pb (51.39) > Zn (10.75) > Mn (8.64) > Cd (6.22) > Cu (4.71) in all sampling sites. These seven heavy metals concentrations (mg kg−1) were significantly (p < 0.05) different from each other among the experiment sites (Table 1). The highest significant (p < 0.05) Cd concentration (8.94 ± 0.52 mg kg−1) was recorded in CB 10 followed by CB 7, CB 8, CB 6 and CB 9, and the lowest Cd concentration (3.30 ± 0.68 mg kg−1) was in CB1 among all the sites (Table 1). The mean concentration (6.22 ± 1.8 mg kg−1) of Cd was recorded in all the experimental sites. In contrast, the highest significant (p < 0.05) Pb concentration (57.23 ± 0.85 mg kg−1) was recorded in CB 9 followed by CB 10, CB 4, CB 6 and CB 8. The lowest significant (p < 0.05) Pb concentration (37.78 ± 1.09 mg kg−1) was recorded in CB 1 among all experimental sites while the average Pb concentration was recorded 51.39 ± 6.8 mg kg−1 (Table 1). The highest significant (p < 0.05) Ni concentration (83.44 ± 0.71 mg kg−1) was in the sediment of CB 4 followed by CB 10, CB 6 and CB 2 and significantly (p < 0.05) the lowest Ni concentration was recorded 41.28 ± 0.55 mg kg−1 in CB 3. Significantly (p < 0.05) maximum Zn concentration was found in CB 4 (21.46 ± 3.78) which was followed by CB 5 and the lowest Zn concentration was 5.31 ± 0.25 mg kg−1 in CB 10 (Table 1). The Cu concentration was highest (6.68 ± 0.79 mg kg−1) in CB 4 and the lowest in CB 7 (3.16 ± 0.17 mg kg−1). While the average concentration of Cu in all sites was 4.71 ± 1.12 mg kg−1 (Table 1). The highest concentration of Mn was found 13.60 ± 0.52 mg kg−1 soil sediment in CB 2 followed by CB 1, CB 5, CB 8 and CB 3 and the lowest concentration of Mn was recorded 3.28 ± 0.19 mg kg−1 in CB 9 (p < 0.05).

3.2. Heavy Metal Concentration in Dye Complexes

To assess the metal concentrations in dye complexes, we collected the twenty different triplicated dye complexes which were commonly used in handloom dyeing factories in the study area as presented in Table 2. The average concentration (mg kg−1) of Cd, Pb, Ni, Zn, Cu and Mn in dye complexes were 4.86 ± 0.59, 27.78 ± 1.71, 26.46 ± 1.47, 521.98 ± 13.22, 1169.55 ± 3.00 and 26.56 ± 1.7, correspondingly.

3.3. Sediment Quality Guidelines (SQGs)

Average shale value (ASV), threshold effect level (TEL), probable effect level (PEL) and severe effect level (SEL) are of common SQGs. ASV is the world average values of respective elements on the Earth’s crusts. TEL indicates the concentration below which harmful effects are expected to occur rarely and PEL indicates the concentration above which adverse effects are expected to affect frequently whereas SEL denotes the concentration above which severe harmful effects on biological life are expected. In this study, measured concentrations of heavy metals were compared with those SQGs (Table 3). Data reveal that Pb and Cd concentrations of Chalan beel were above ASV and TEL values, respectively, whereas other metals were found below the ASV and TEL. The Cd and Pb were found above PEL and TEL, respectively, whereas Ni was below ASV in the sediment of Chalan beel. For Mn there was no available SQGs except ASV. ASV, TEL, PEL and SEL were insignificant in case of Zn, Cu and Mn concentration of Chalan beel sediment (Table 3).

3.4. Assessment of Metal Pollution Indices

Enrichment Factor (EF)

Heavy metals concentration in the sediments of Chalan beel was compared to background reference values to assess the metal enrichment. The EFs of 10 experimental sites were summarized in Table 4. Among the heavy metals, maximum EF values of Cd, Pb and Ni were recorded as 7071.40 ± 737.81, 744.38 ± 53.12 and 263.68 ± 21.65, respectively, while the minimum values were 17.01 ± 2.44 and 25.38 ± 3.05 found in Zn and Cu, respectively (Table 4). The EF values were recorded in the descending order of Cd > Pb > Ni > Cu > Zn among the studied heavy metals. EF values were significantly (p < 0.05) different among 10 experimental sites. Alarmingly, Cd, Pb and Ni enrichment were found to be extremely severe in all the studied sites as EF > 50. The Zn enrichment in the sediments was found in the range of moderately to severely enriched as EF > 5. In case of Cu, CB 9 site was very severely enriched as EF > 25 and sites CB 10, CB 6, CB 4, and CB 7 were found to be severely enriched, other sites were in the range of moderate to moderately severe. It revealed that all the studied sites are enriched with all the studied heavy metals that indicates Chalan beel is enriched with heavy metals likely due to the anthropogenic activities.

3.5. Contamination Factor (CF)

CF values of studied heavy metals of Chalan beel were found to be < 1 in Ni, Zn, Cu, and Mn, whereas Cd exhibits significantly (p < 0.05) higher CF value followed by Pb (Figure 2). The CF value of Cd was recorded as 20.78 which indicates that Chalan beel is highly contaminated by Cd. A moderate contamination of Pb (2.56) in Chalan beel was also found. Total CF values of the site can be arranged in the order of CB 10 > CB 7 > CB 8 > CB 6 > CB 9 > CB 5 > CB 2 > CB 3 > CB 1. Among the 10 sites, CB 10 was severely contaminated by Cd (29.79) followed by CB 7 (26.77) and CB 8 (25.83). Considerable contamination was found in all sampling sites by Pb as CF > 2 except CB 1 (1.89), which was moderately contaminated. The rest of the studied metals were insignificant in all sampling sites considering the CF guideline.

3.6. Geo-Accumulation Index (Igeo)

Igeo values of sampling sites and measured concentration of heavy metals are shown in Table 5. Interestingly, the Igeo values of Ni, Zn, Cu and Mn in experimental sites were less than 0 (Table 5), suggesting that Chalan beel is practically uncontaminated by these heavy metals. However, the Igeo values of Cd and Pb in Chalan beel area were at an alarming level. The Cd showed significantly (p < 0.05) the highest Igeo value than other metals in almost all sampling sites and falls under different classes of Igeo. The site CB 10 (Igeo 4.30) was found under the class 5, which indicates the site is heavily to extremely contaminated by Cd. The sites CB 7, CB 8 and CB 6 are also in the similar class of 5. Other sites except CB 1 were in the class 4 as the Igeo > 3, implying the sites are heavily contaminated by Cd. The site CB 1 is moderately to heavily contaminate by Cd as Igeo was recorded as 2.94 that fall under the Igeo class 3. Moreover, Pb in Chalan beel shows uncontaminated to moderately contaminated levels as Igeo values were found in the range from 0.33 to 0.93. Significantly (p < 0.05) the highest Igeo values recorded in CB9 among all treatments. Surprisingly, the Igeo values of Pb in CB 9 (0.93), CB 10 (0.91) and CB 4 (0.90) were close to one (Table 5) that suggests these sites are vulnerable to moderate contamination by Pb. Overall trends of Igeo in all sampling site can be arranged in the decreasing order of CB 10 > CB 7 > CB 8 > CB 6> CB 9 > CB 5> CB 2 > CB 3 > CB 4 > CB 1. Finally, the results of Igeo values suggest that Chalan beel is heavily polluted by Cd and vulnerable to moderate Pb pollution.

3.7. Potential Ecological Risk Index (PERI)

Among seven studied metals, PERI of six heavy metals in the sediment of Chalan beel area are summarized in Table 6. The findings of this study show that metal pollution was governed by single element (Cd) and the intensity of pollution by all metals was in decreasing trends of Cd > Pb > Ni > Cu > Zn > Mn in all sampling sites. Compared to other elements, PERI of Cd (893.63 ± 45.96) was found to be significant and at a maximum in the site CB 10 which indicates very high pollution followed by CB 7, CB 6, CB 8 and CB 9 that were in the same category of pollution by Cd. Considerable pollution was found in the rest of the sites. Results revealed that Chalan beel area is polluted at very high and moderate levels by Cd and Pb, respectively.

3.8. Pollution Source Identification by PCA, CA and Pearson Correlation

Metal pollution sources can be marked based on correlation, cluster analysis (CA) and principal components analysis (PCA). Pearson correlation was used to assess the relationships among studied metals of Chalan beel area (Table 7). The PCA analysis shows the three groups of studied metals in all sampling sites of Chalan beel area (Figure 3). One group comprised of Pb and Cd having a concentration above the average shale value would be subjected to the anthropogenic origin. A second group comprised of Ni, Zn and Cu with below average shale value. The third group consisted of Mn, for which the concentration is below the average shale value of those elements in the Earth’s crust. Group one having the site of CB 9, CB 10, and CB 7 is highly metal contaminated and other sites were considered for low to moderate contamination.
For a better understanding of the sources of the heavy metals in the sediment courses, cluster analysis was also performed to assess the relationship between heavy metal–experimental sites and heavy metal–heavy metal in data set. The results are graphically presented in Figure 4. The CA retains three main clusters for data sets of all experimental sites and metal samples separately, with the phenon line set to a rescaled linkage distance of about 10.0. For all experimental sites, cluster 1 consists of CB 7, CB 9, and CB 6 (Figure 4). This cluster is almost similar to PCA analysis. Cluster 2 contains CB 5, CB 8, CB 4 and CB 10, and cluster 3 consists of CB 1, CB 2, and CB 3.
The inter-element relationships between metals support the results obtained from PCA as well as reveal new associations. Results showed that there was a highly significant (p < 0.01) positive correlation between Pb–Cd (0.647), Pb–Ni (0.461), Zn–Cu (0.503), Zn–Mn (0.516) and Cu–Mn (0.550). Significant positive correlation (p < 0.05) was found between Ni–Cu (0.277). Highly significant negative correlation was observed among Cd with other studied metals except Ni. The Pb was also negatively correlated with Mn. Other relationships were insignificant. The Pb and Cd mostly negatively correlated which implies that they might be of similar origin.

4. Discussion

In the present study, we found that a high level of heavy metals, Cd and Pb, was present in the sediments of Chalan beel area. Sediment quality guidelines show that concentrations of both heavy metals such as Cd and Pb exceeded the average shale value. The Cd and Pb were the probable and threshold effect levels, respectively. Analyses of various pollution indices revealed that the sediments of Chalan beel were mainly contaminated with Cd and Pb. The dye complexes used in the handloom dyeing factories surrounding the experimental sites contained a high concentration of heavy metals that were likely the main source of Cd and Pb accumulation in the sediments. Other minor sources of heavy metal contamination may also be linked to the anthropogenic activities in the Chalan beel area such as indiscriminate use of agrochemicals in crop production.

4.1. Metal Concentration in Sediments

The high concentration of Pb was found in the studied area. The concentration of Pb exceeded the average shale value and hazardous for human health through the food chain. A total of 20 different dye complexes have been used in handloom factories and dyeing houses in the Chalan beel area for a long period of time. The diluted dyes were discharged into the waterbodies of the Chalan beel area after application in the handloom factories. Surprisingly, the average concentration of Pb (mg kg−1) from the 20 different dyes was recorded as 27.78 ± 1.71, as shown in Table 2. Moreover, residues of agrochemicals such as synthetic chemical fertilizers and pesticides used in crop production might also have contributed to the existing high levels of Pb in the sediments of Chalan beel. Earlier, in Bangladesh, an alarming concentration of Pb was recorded at the sediments of the rivers of Buriganga [40] and Dhalai beel and Bangshi river [45] (Table 3). The Buriganga river, Dhalai beel and Bangshi river are located near to the capital city of Bangladesh, which is an intensively industrial region in Bangladesh. Consequently, the industrial effluents are discharged into the rivers and beels that resulted in Pb pollution. In the present study, we found that the Chalan beel has a threshold effect level almost equivalent to the Buriganga river and Dhalai beel [50]. Recently, a few studies showed that there are negligible concentrations of Pb in the soil sediments of a few rivers in Bangladesh [15,16,42], indicating that these waterbodies are safe for aquatic life and human health. On the other hand, in China and India, the concentration of Pb is high in a few rivers and lakes comparable to our studied area [41,44,46,48].
In this study, we found that a high concentration of Cd was present in the sediments of Chalan beel. It indicates that the concentration of Cd in the Chalan beel area might be hazardous for aquatic ecosystems, crops and human health. Like the concentration of Pb, dye complexes might also be the main source of Cd metal accumulation in the sediments of the Chalan area. Surprisingly, the average concentration of Cd (mg kg−1) from the 20 different dye complexes were recorded as 4.86 ± 0.59 (Table 2). This alarming concentration of Cd might also be accumulated in the sediments of Chalan beel area might be linked with the application of various phosphatic fertilizers for crop production. The Cd has been widely dispersed into the environment through the anthropogenic usage of phosphate fertilizers, presence of sewage of sludge and industrial uses [51]. In our studied area, this heavy metal in sediment may easily be taken up into the food chain through uptake by the plants which consequently affects the aquatic environment and human health [51]. Some plants such as rice, potato, grasses, and vegetables uptake Cd more rapidly than other heavy metals such as Pb and Hg [52]. Our results showed that the concentration of Cd in the Chalan beel area was higher than any other waterbodies like Buriganga river (Table 3) [40].
To better understand the degree of heavy metal pollution in Chalan beel, we compared the concentrations of heavy metals in the sediment of Chalan beel area with sediments of some other selected beels and water bodies in the world (Table 3). From a Bangladesh perspective, Pb, Cd and Ni concentrations in Chalan beel were higher than other beels and estuaries in the country (Table 3). The Pb concentration of Chalan beel was higher than most of the beels and estuaries of Bangladesh and other countries in the world such as the Feni river estuary [15], Paira river [42], Sangu river [16], and Bakkhali river [17] of Bangladesh, Ganges estuary [43] and Gomti river [46] of India, and Homa Logon [49] in Turkey. However, the Pb concentration of Chalan beel was lower than Buriganga river [40] and Dhalai beel [45] of Bangladesh and other beels and estuaries of the world. The Cd was higher from all other beels and estuaries except from BT drainage river of China. The Ni concentration of Chalan beel was also higher than most of the beels and estuaries around the world except from Buriganga river of Bangladesh and Tapti river of India. Concentrations of the rest of the heavy metals (e.g., Zn, Cu and Mn) were much below the levels of other selected beels and estuaries of Bangladesh and many other countries of the world (Table 3).

4.2. Sediment Quality Guidelines

Sediment quality guidelines (SQGs) are important for screening out the contamination of sediment by comparison with different established guidelines of sediment contaminant to assess the degree of contamination, to which aquatic organisms are subjected, that leads to adverse effects. Different types of elements discharged into the waterbody become bound to the particulate matters which in course precipitated and become part of the sediments [53]. Overall concentration of heavy metal followed the order: Ni > Pb > Zn > Mn > Cd > Cu. Among the heavy metals, Cd and Pb concentrations showed the highest level in the sediment of the experimental area which exceed the ASV. Many handloom factories and dyeing houses are located around the Chalan beel area and these factories use different sorts of dye complexes and dump them into the waterbodies of Chalan beel. Moreover, application of fertilizers, pesticides, plastics, stainless steels, insecticides batteries, etc., containing heavy metals, may be minor source of heavy metals. Sampling sites situated near to the handloom factories and dyeing houses either exceeded TEL with respect to Pb and or exceeded PEL with respect to Cd and Ni closely approached the benchmark. On the other hand, the other trace elements such as Cu, Zn and Mn are below the ASV. Pollution of sediments of freshwater aquatic environment with Cd is increasingly becoming a critical problem in developing countries worldwide. For instance, Buriganga (Bangladesh) 3.5 to 7.8 mg kg−1 and 4.1 to 9.5 mg kg−1 in summer and winter, respectively [54]; Chattanagpur river (India) 1.30 mg kg−1 [55]; Gomti river (India) 0.07 to 7.90 mg kg−1 [46]; Hindon river (India) 1.30 to 3.28 mg kg−1 [53]; Achankovil river (India) 3.67 to 11.43 mg kg−1 [56]; Lianshan and Wuli Rivers (China) 25.53 to 98.78 mg kg−1 and 8.04 to 17.75 mg kg−1, respectively [47]. Cd pollution is not only recorded in the river but also in the wetland system in Keralla (India) 0.26 to 0.73 mg kg−1 [57]. However, there is no report on the assessment of heavy metal pollution on the wetland of Bangladesh. Pb pollution is increasing day by day throughout the world due to industrial revolution. The Pb concentration of Buriganga river, Dhalai beel and Bangshi river were 69.75 and 59.99 mg kg−1, respectively, which is under TEL [40,45]. These results support the present study in the Chalan beel area where the average Pb concentration is 51.39 mg kg−1.

4.3. Assessment of Metal Pollution Indices

In the present study, we found that the severe enrichment of Cd and Pb existed in the sediments of Chalan beel area, implying that the sediments of the Chalan beel were highly polluted with two major heavy metals. This severe enrichment of Cd and Pb in the sediments of the Chalan beel is due to the use of 20 different dye complexes in the handloom dyeing house factories associated with the experimental areas (Table 2). In addition, some minor sources may also be involved with this major source. Severe enrichment with Cd and Pb may also be attributed to excessive application of agricultural fertilizers, insecticides, pesticides, dry cell batteries, and run off from agricultural lands. The severe enrichment of Cd and Pb was available in the sediment of Buriganga River, Bangladesh and a tropical river, Chottanagpur, India [40,55]. According to Zhang and Liu [58], EF values between 0.05 and 1.5 denote that the metal is solely from the Earth’s crust or natural processes, whereas an EF value more than 1.5 indicates that the sources are more likely to be anthropogenic. Bhuiyan et al. [59] reported that the severe enrichment of Pb available in the coal mine area affected agricultural soils in the northern part of Bangladesh which is consistent with the severe enrichment of Pb in the present study. A moderate amount of Ni enrichment was available in the sediments of this beel area. Ni is commonly used in the household products such as stainless steel, alloys, batteries etc. Baralkiewicz and Siepak [60] reported that the urban and factory areas enhance the amount of Ni. Other metals such Cu, Mn and Zn enrichments were very low in the sediments of the Chalan beel area. The dye complexes used in handloom factories in the experimental area may also be sources of Cu, Mn, and Zn enrichments (Table 2). Other anthropogenic sources such as fossil fuel burning, brick-field, and coal mining and natural sources may induce enrichment of Cu, Mn and Zn in the study area.
The Igeo values indicate moderate to heavy pollution of studied metal in the sediments of Chalan beel area, although some irregularity is observed depending on each metal and sampling sites. Among the environmentally hazardous metals, Cd and Pb are significantly accumulated in the sediment in the study area, as indicated by their respective average Igeo values of 3.7245 and 0.7621, respectively, suggesting that Chalan beel area is heavily polluted by Cd and moderately polluted by Pb, as supported by Ali et al. [14] who determined the Igeo values of Cd and Pb were higher than zero in the Karnaphuli river, Bangladesh. Bhuiyan et al. [59] reported that the Igeo value of Pb was also higher than zero in the northern part of Bangladesh and showed a high pollution status which is consistent with the current study. On the contrary, the mean Igeo values of Ni (−0.7812), Zn (−3.8991), Cu (−3.8880) and Mn (−7.3964) are less than zero, indicating that the Chalan beel area is not polluted by these metals. Hossain et al. [16] found that the Igeo values of Pb and Cd were lower than zero in Sangu river estuary, Chattogram, Bangladesh. These results suggest that the dye complexes used in handloom factories in the experimental area are major sources of Cd and Pb (Table 2). Notably, among ten sampling sites, the Igeo value of Cd is higher than Pb in the study area.
An integrated index system like PERI provides more valuable insights into eco-toxicological effects of element pollution in bed sediment. Interestingly, we assessed that the PERI values of Cd and Pb were the highest in the study area rather than other heavy metals. These results exhibited an alarming message for the environment of the Chalan beel area, possibly indicating eco-toxicological effects on the surrounding biosystems. Analyzed results always displayed pronounced Cd contribution in PERI of the sediments of Chalan beel because of its higher toxicity response factor as compared to other elements and excessive enrichment. Cd causing ecological risks was highly available in the soils and sediments of different geographical areas [47,55,61,62]. Enrichment of Cd and Pb in the sediment of Chalan beel area may affect the entire range of the biotic spectrum, from benthic biota to the organisms higher up the food chain, due to their persistence, bioaccumulation, and injurious properties. Generally, application of phosphate fertilizers to the agricultural fields in the Chalan beel area might be a source of Cd [51]. Actually, the major sources of Cd and Pb are the dye complex used in handloom dyeing house factories in the study area (Table 2). On the other hand, the PERI values of Ni, Zn, Cu and Mn were at a negligible level which are not a threat to the environment.
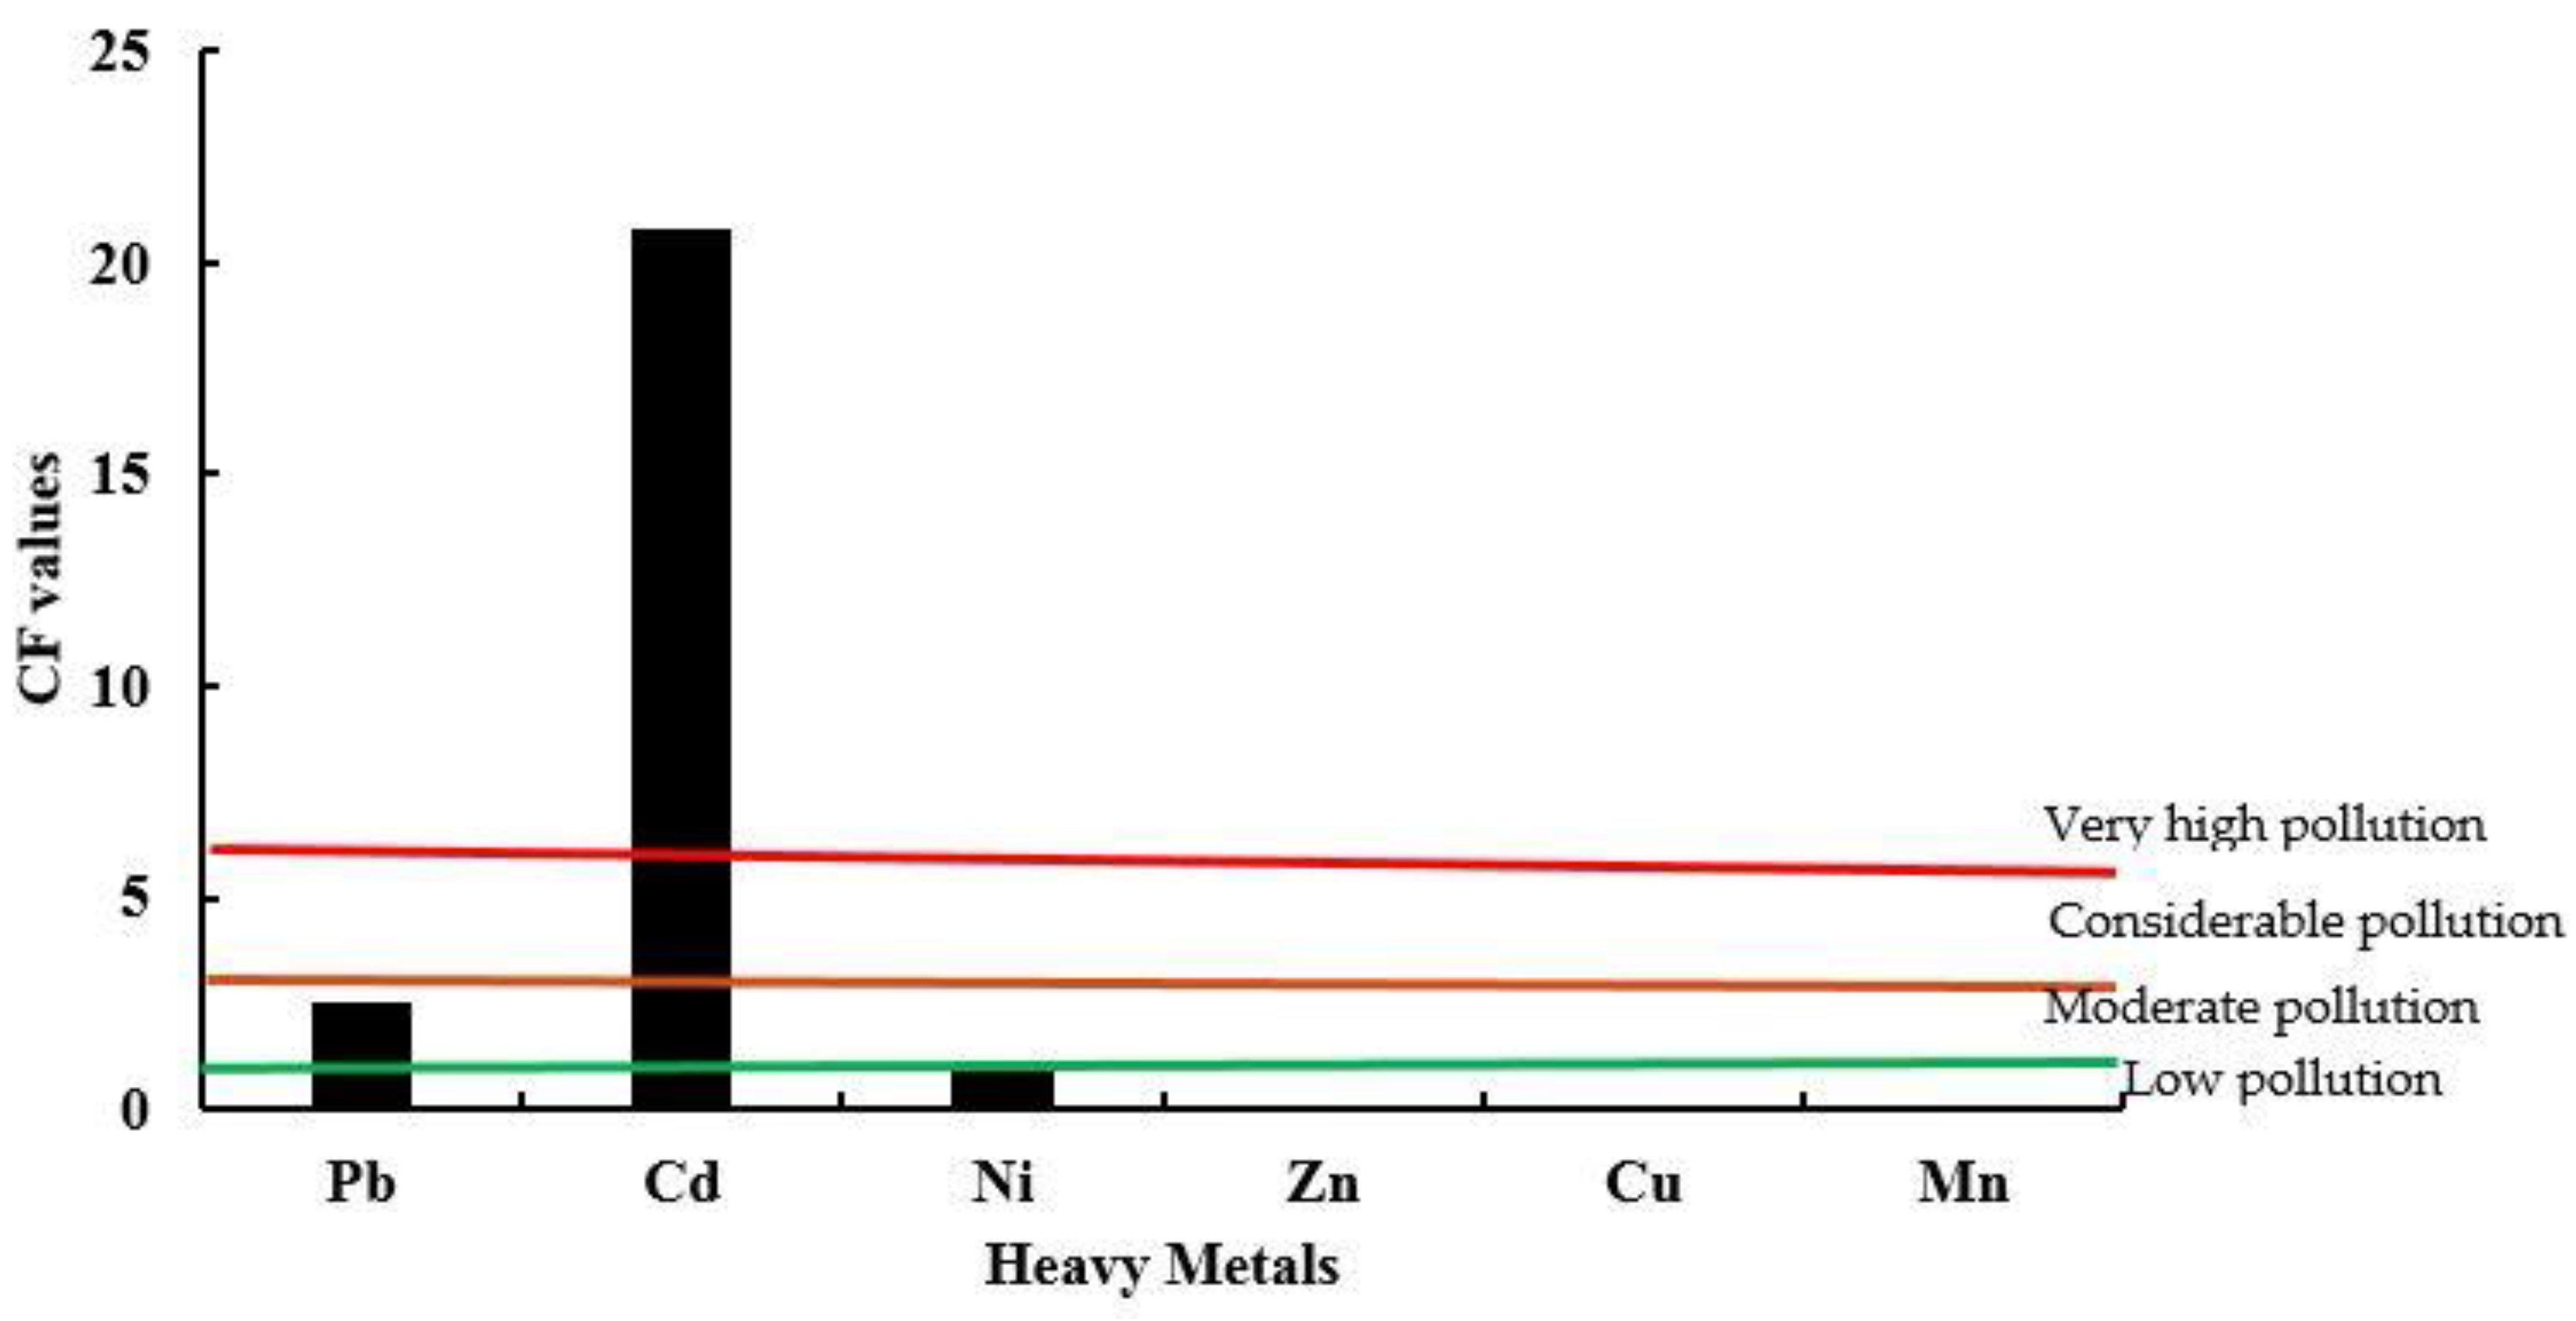
We found that the mean CF values of Cd and Pb were the highest among the studied heavy metals in the Chalan beel area, suggesting that the Chalan beel is highly polluted by Cd and moderately polluted by Pb, while the mean CF values of Ni, Cu, Zn and Mn were close to zero. Ali et al. [14] found that the Cd showed the highest contamination factor in the sediments of Karnaphuli River in Bangladesh which is consistent with the current investigation. It can also deliver the message about the pollution status of the study area to the policy makers [38].

4.4. Assessment of Pollution Sources

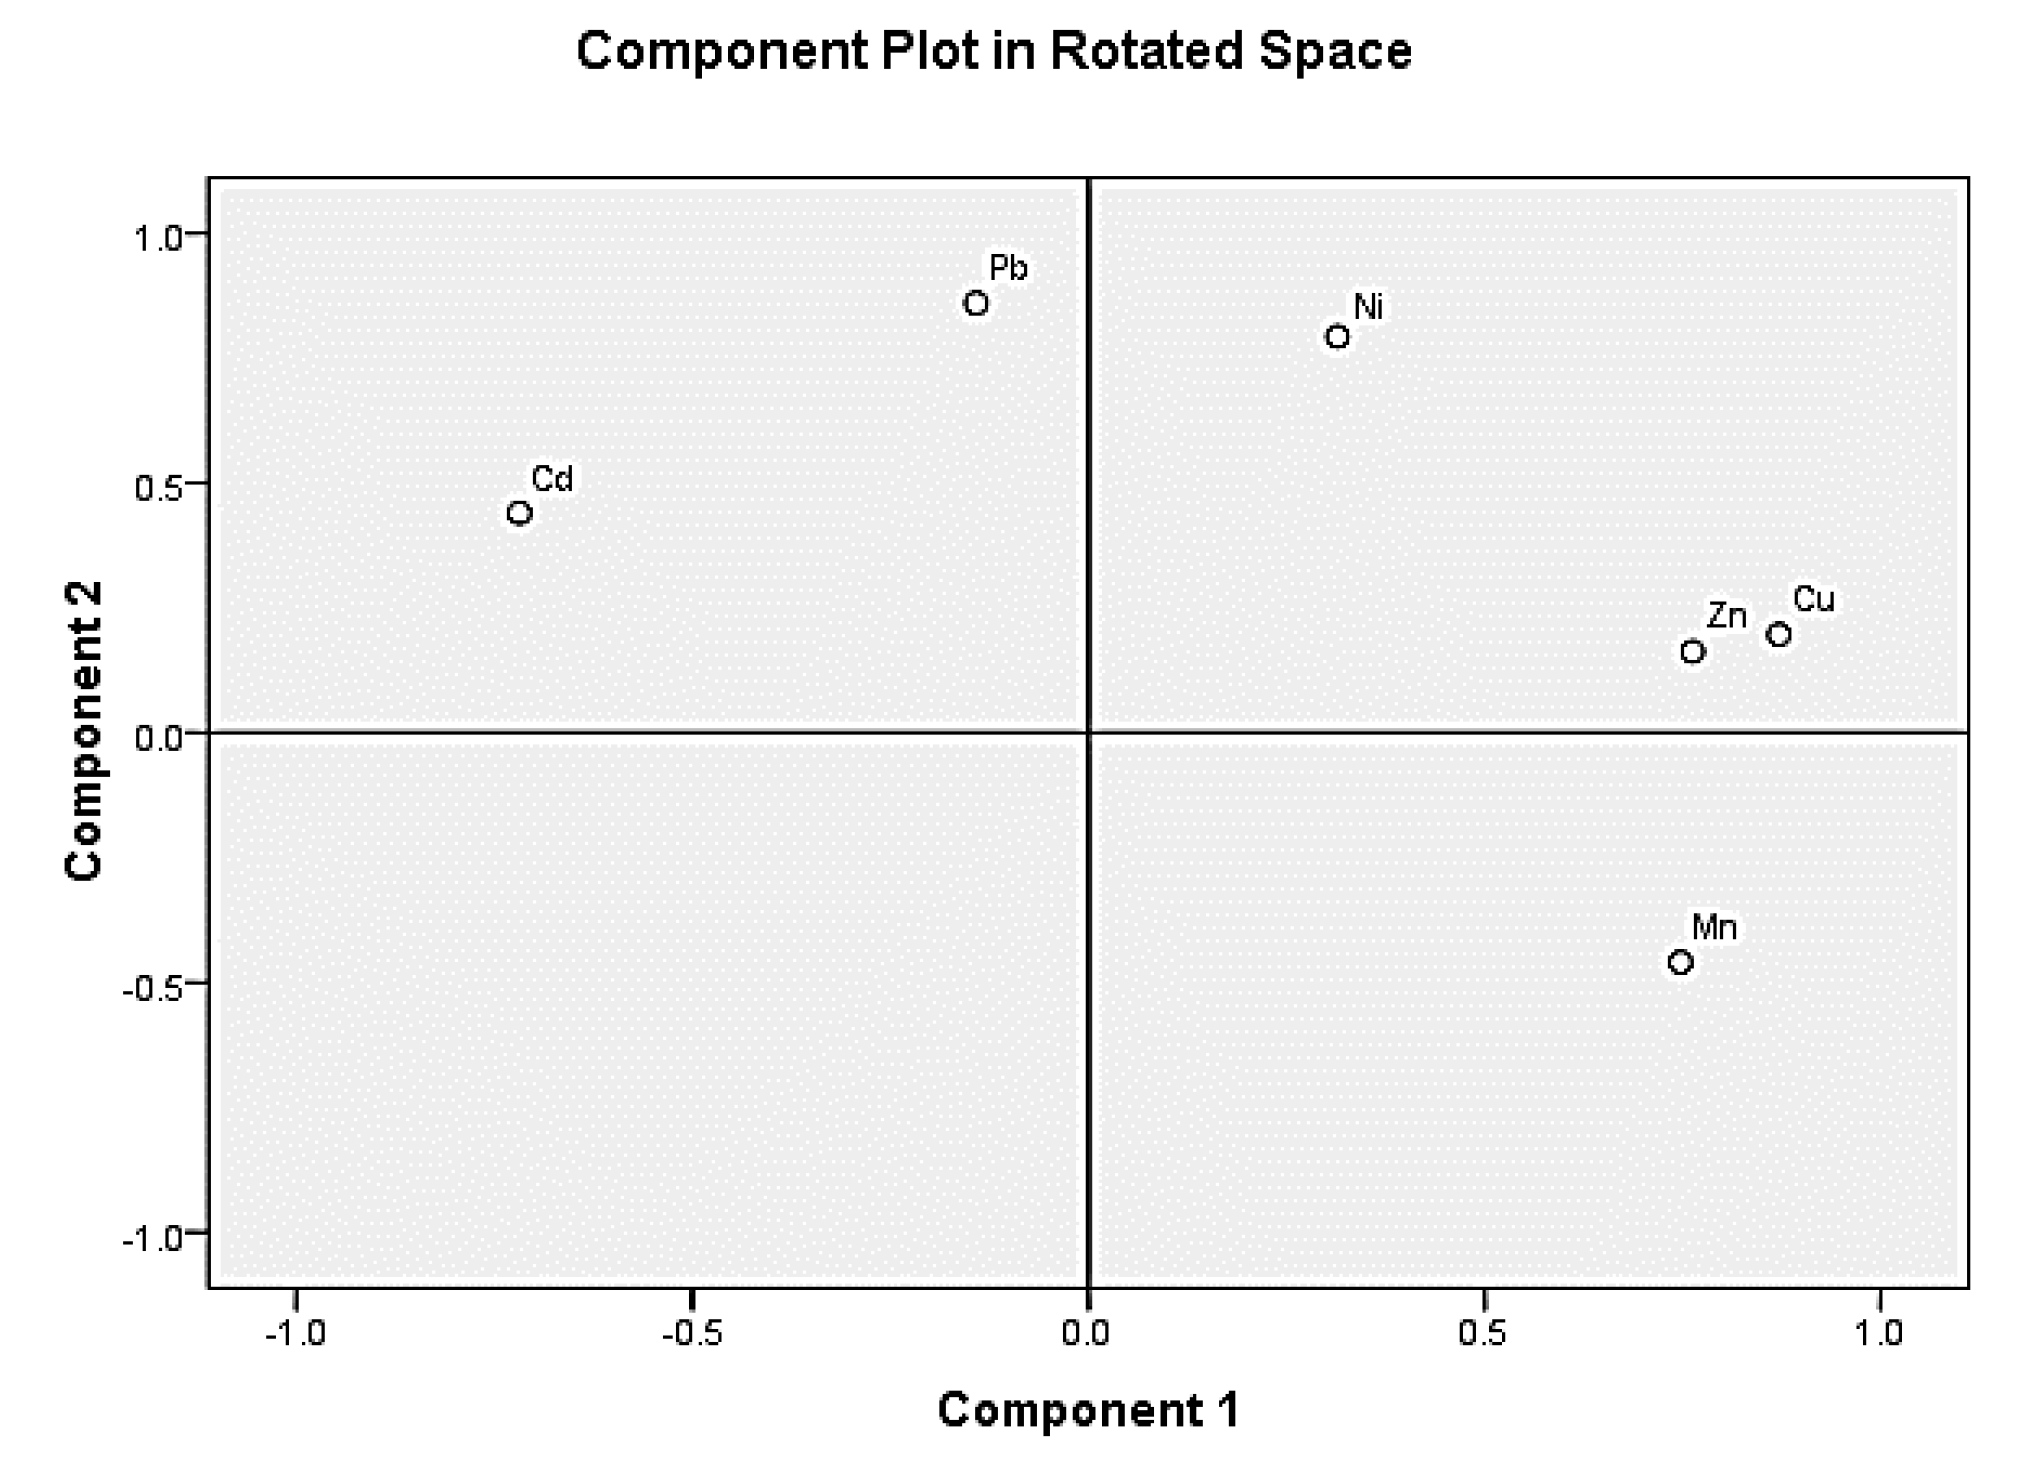
Positive and negative scores in PCA suggest that most of the soil samples were either essentially affected or unaffected by the presence of the extracted loads on a specific factor or component, respectively. In the group of PCA, the sediments of Chalan beel area were highly and moderately polluted by the heavy metals Cd and Pb, respectively. The two-metal pollution in Chalan beel area might be due to anthropogenic activities such as application of different dyes in handloom factories in the experimental area. These diluted dyes discharge into the canals and rivers in the Chalan beel area. In addition, these used dyes contain a high concentration of Cd and Pb (Table 2) and have accumulated in the sediments of the Chalan beel for a long period of time. Moreover, other potential sources may be application of phosphate and other inorganic fertilizers, pesticides, insecticides, batteries etc. The people of this area use a colossal number of batteries all year round and they throw these batteries in the waterbody after use. On the other hand, the other metals such as Mn, Zn, Cu and Ni existed in the normal range in the sediments and these metal ranges are not a threat for the environment of Chalan beel as well as for the health of human beings.
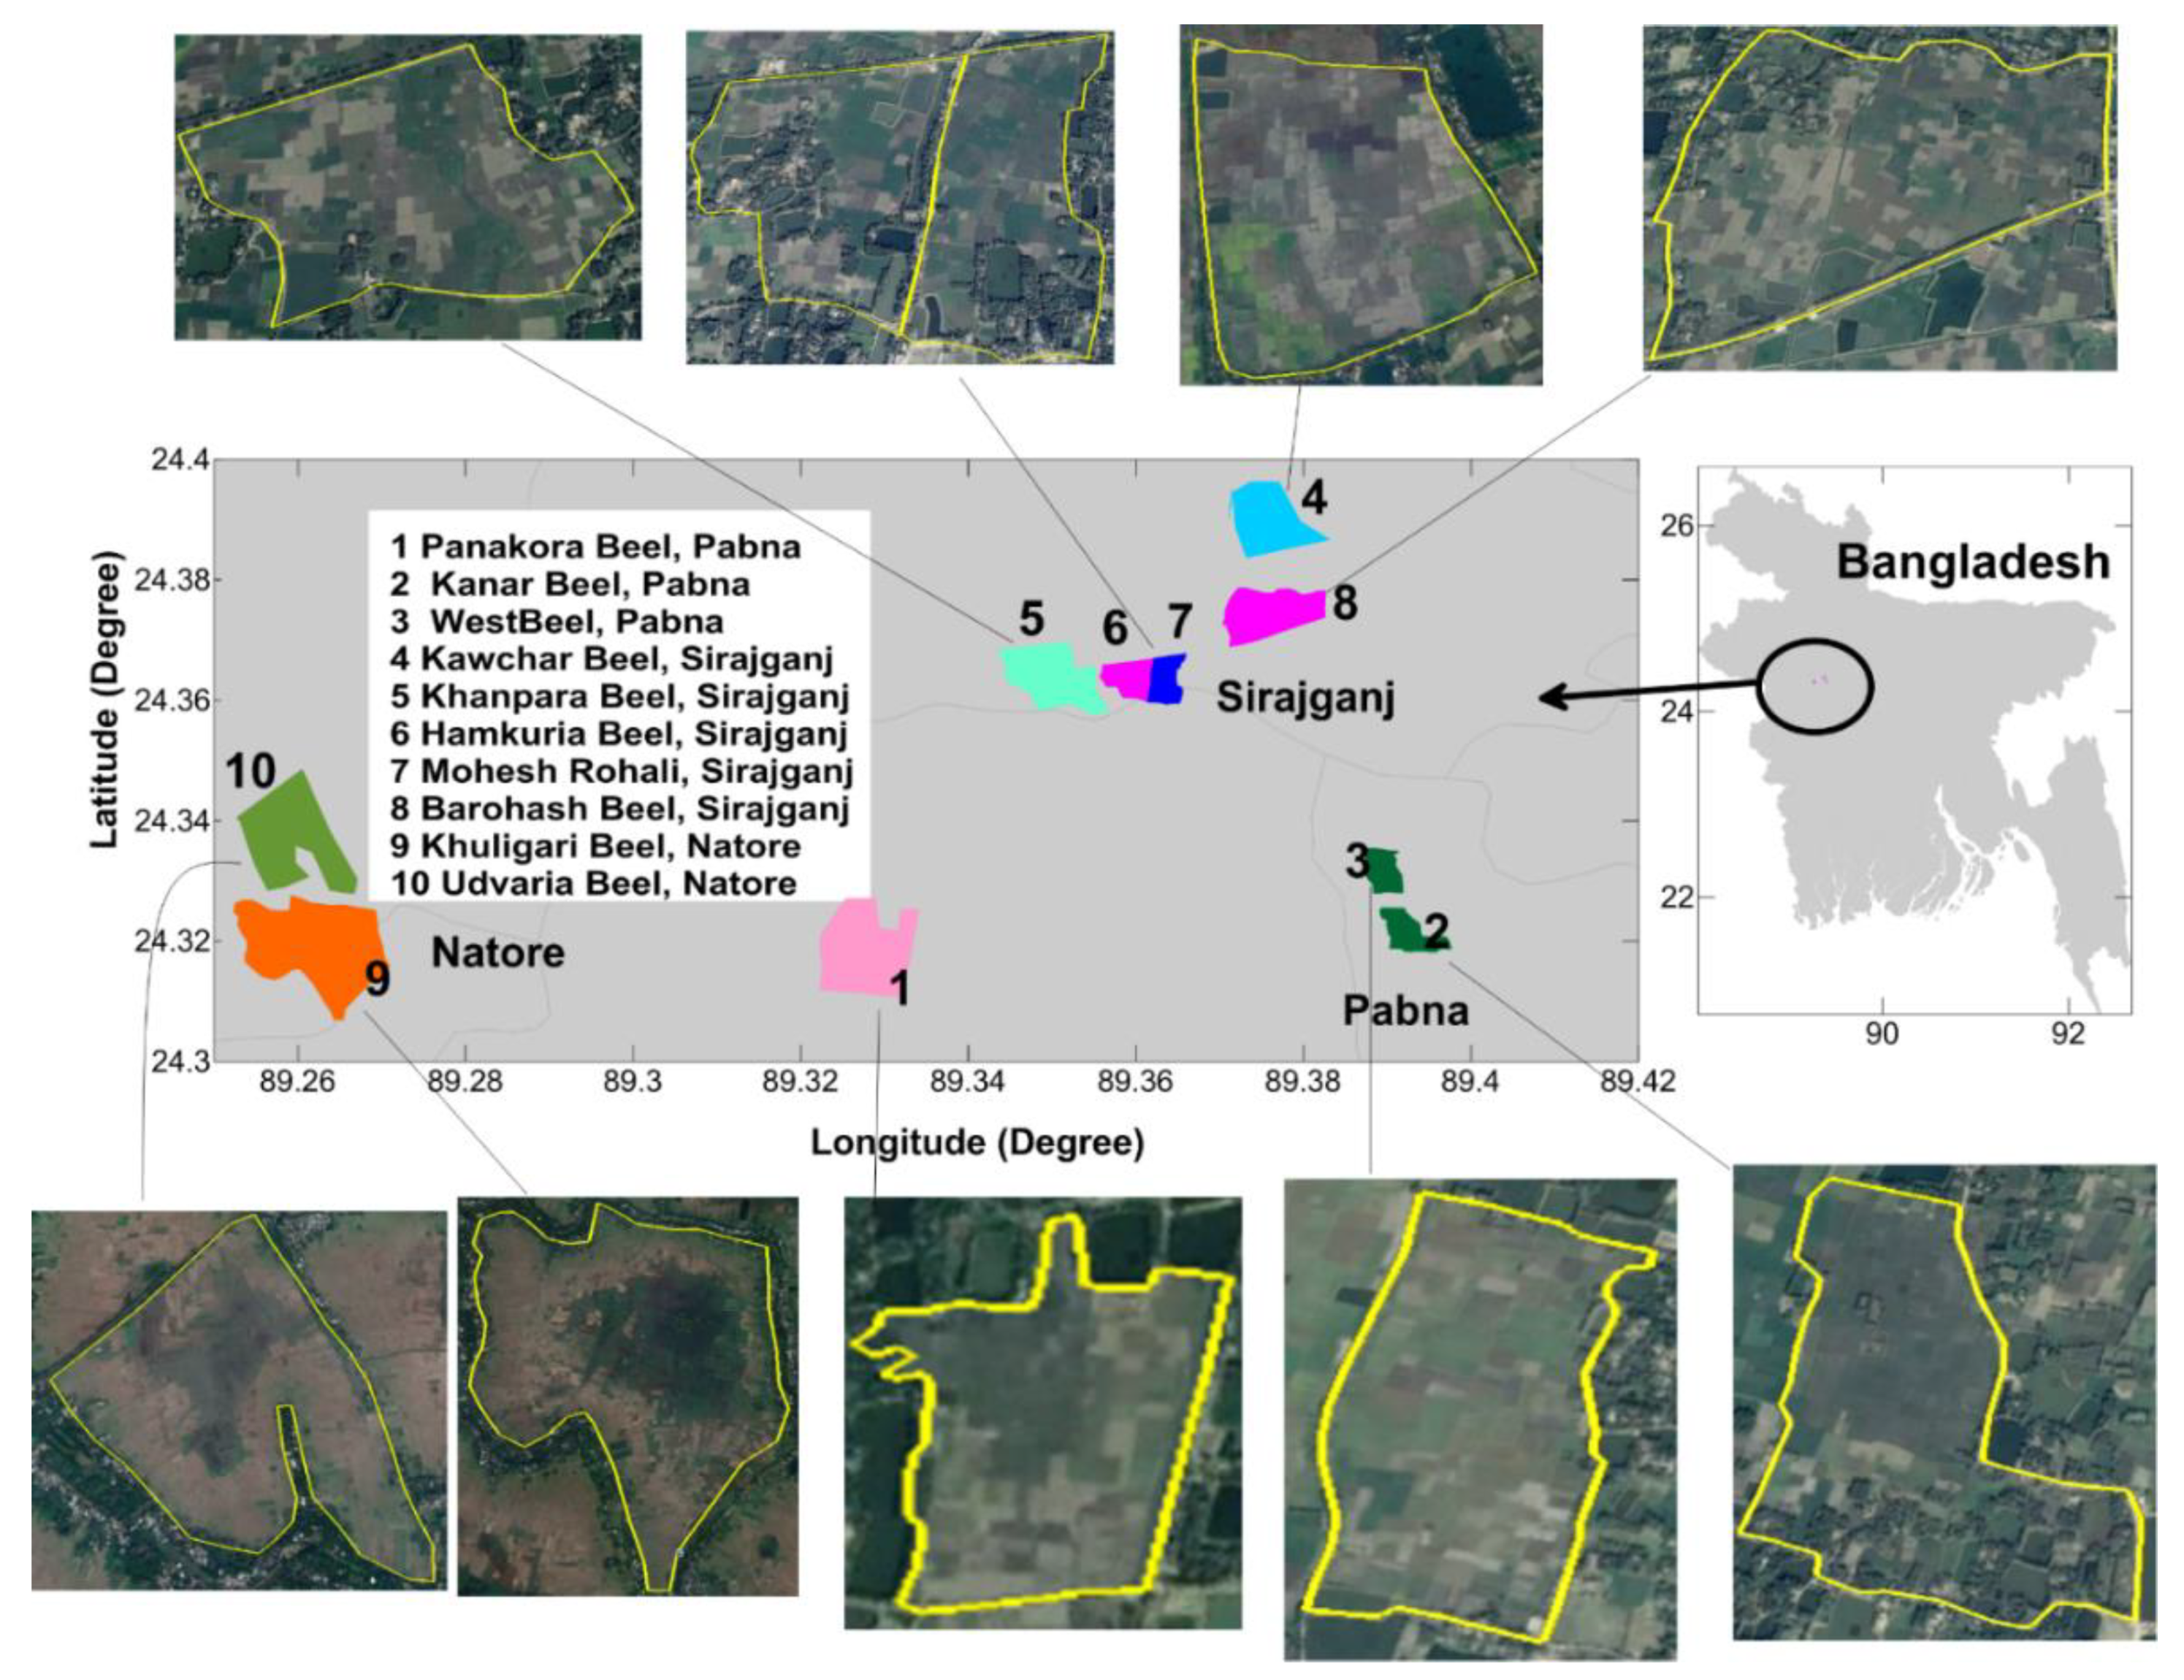
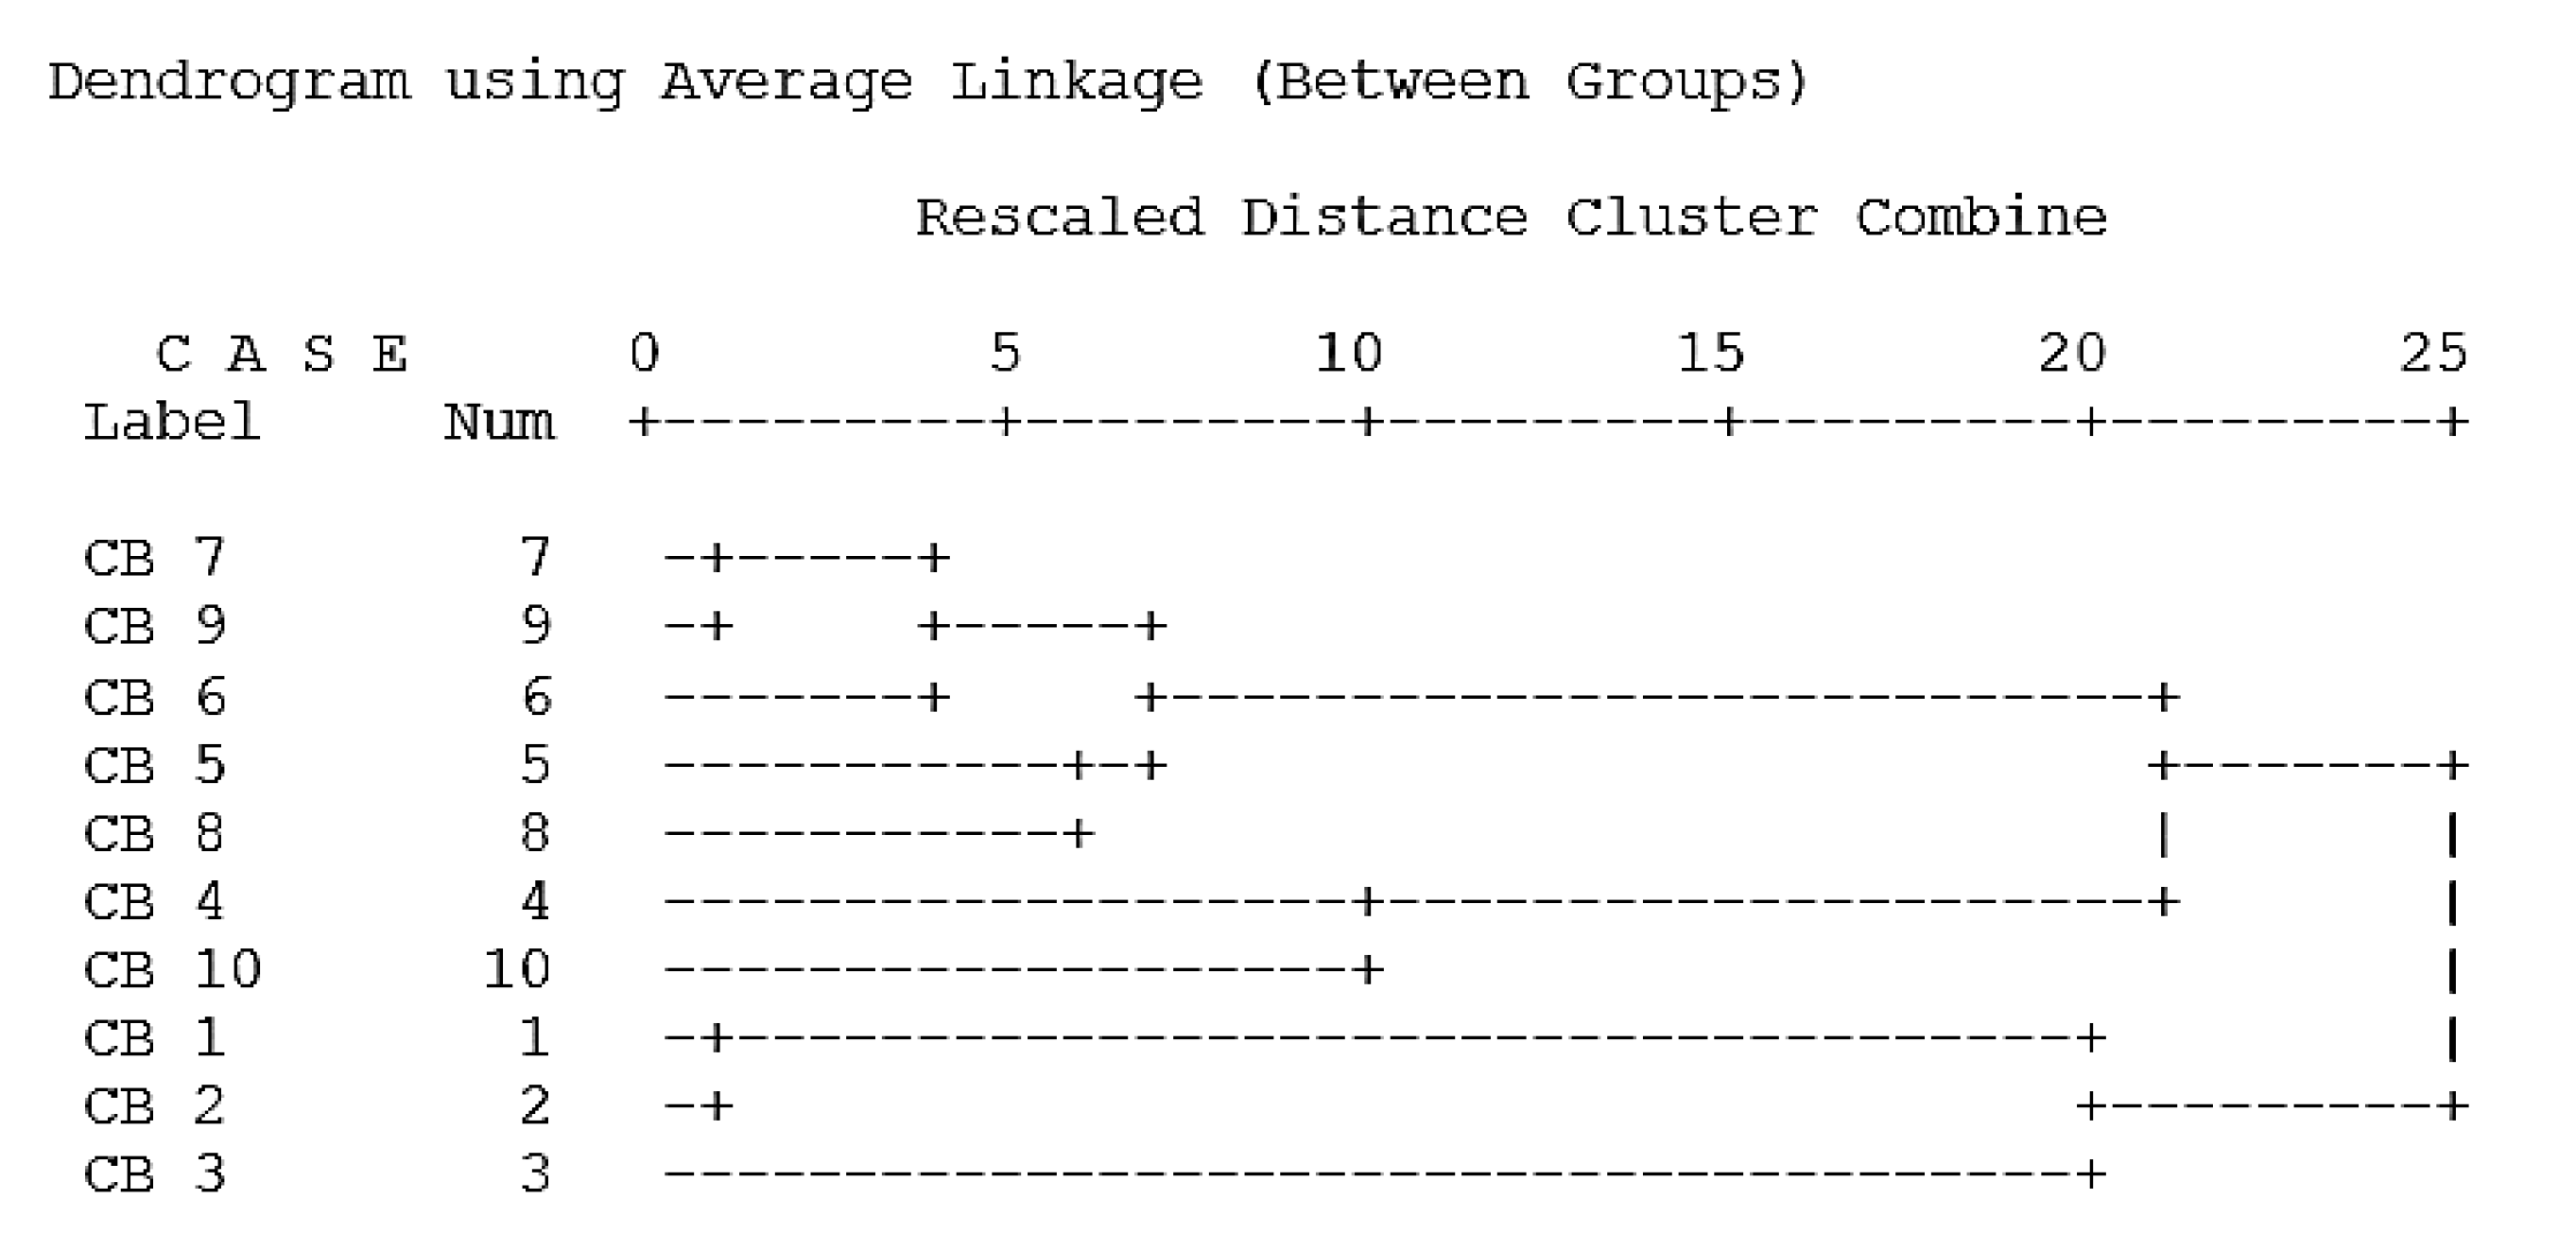
In the cluster analysis, we found that all the sampling sites were located within the Chalan beel but received inputs from the surrounding handloom dyeing factories as well as other minor sources. According to CA, the Chalan beel is highly polluted by Cd and Pb which is linked with anthropogenic activities. There are strong (p < 0.01) and significant (p < 0.05) correlations between most of the metals. These results suggest that the Chalan beel area has assimilated various contaminants from the process of handloom dyes, application of agricultural fertilizers, pesticides, insecticides, and the municipal sewage system. In the current study, we found a high level of both positive and negative correlation between Cd and Pb, suggesting that the sources of Cd and Pb are similar. We also found that high concentrations of Pb and Cd existed in the dye-complexes which are used in handloom dyeing factories in Chalan beel area (Table 2). A similar correlation agreement has been evaluated in lagoon and canal water in the tannery industrial area in Dhaka, Bangladesh by Bhuiyan et al. [63]. Tariq et al. [64] reported that source of heavy metals was the tannery industrial area in Multan, Pakistan. The metal dye-complex contained a high concentration of heavy metals which might be accumulated in sediments of the waterbody [65]. We found that the strongest significant positive correlation was observed between Pb–Cd, rather than for other strongly significant positive relationships such as Pb–Ni, Zn–Cu, Zn–Mn and Cu–Mn. The major source of the claimed heavy metals in the sediments of Chalan beel area might be the use of different metal dye-complexes that have been used in handloom dyeing factories in this area for more than 400 years. Unfortunately, the garment manufacturers have poured the diluted dye-complexes into the wetlands after use. Gradually, the heavy metals from the dye-complexes settle in the sediments of this beel area because the handloom manufacturers do not follow the guidelines for the management of dye-complexes after use. They are indiscriminately exposing the dye-complexes in the waterbodies. These results reveal that the main potential sources of Pb and Cd are dye-complexes and are linked with other anthropogenic activities.

5. Conclusions

Findings revealed that the concentration of seven heavy metals in Chalan beel wetland area was in the descending order of Ni > Pb > Zn > Mn > Cd > Cu. The concentrations of Pb and Cd in the sediments of Chalan beel were two- and twenty-fold higher compared to the world average shale values. The CF values of studied heavy metals of the study area were found < 1 in the case of Ni, Zn, Cu, and Mn. However, Cd exhibited a significantly higher CF value indicating that Chalan beel is very highly contaminated by Cd followed by moderate contamination of Pb. Igeo values of Ni, Zn, Cu, and Mn in experimental sites were less than 0 suggesting that Chalan beel is practically uncontaminated by these heavy metals. Igeo values of Cd and Pb were alarming levels and showed the highest Igeo value compared to other metals in almost all sampling sites and fall under the class 5, which indicates the site is heavily to extremely contaminated by Cd. According to PERI, metal pollution was governed by a single element (Cd) and the intensity of pollution by all metals showed decreasing trends of Cd > Pb > Ni > Cu > Zn > Mn in all sampling sites. Compared to other elements, PERI of Cd was found to be at a maximum in the site CB10 indicating the very high pollution level. Correlations, CA, and PCA analyses confirmed the anthropogenic source of Pb and Cd. The dye complexes used in handloom dyeing factories adjacent to study area might be the potential sources of Pb and Cd in the sediments. This study represents the first reference report on heavy metal status and pollution indices of a wetland in Bangladesh and the findings might be useful for further research and policy decisions for the sustainable management of the Chalan beel wetland, Bangladesh.

Author Contributions

M.A.S.: conceptualization, methodology, investigation, formal analysis, writing original draft, funding acquisition, resources. M.A.A., S.I.P., F.I.: methodology, investigation. D.C.S.: conceptualization, formal analysis. M.M.R (Mohammad Mizanur Rahman): Conceptualization, resources, formal analysis, writing—review and editing. M.A.R.K., M.M.R. (Mohammad Mahbubur Rahman), A.K.M.A.I., T.A., G.K.M.M.R., M.G.M., A.M.A.: writing—review and editing. T.I.: conceptualization, writing—review and editing. All authors have read and agreed to the published version of the manuscript.

Funding

This research was supported by the Krishi Gobeshona Foundation (KGF) referred to the Department of Genetics and Fish Breeding to Dr. Mohammad Abdus Salam, Bangladesh and the project grant no.P-18.

Institutional Review Board Statement

Not applicable.

Informed Consent Statement

Not applicable.

Data Availability Statement

Not applicable.

Acknowledgments

We would like to inform cordial gratitude to programme officers, field assistants and community people of Chalan beel area for their cordial cooperation with us.

Conflicts of Interest

The authors declare no conflict of interest.

References

  1. MacFarlane, G.R.; Burchett, M.D. Cellular distribution of copper, lead and zinc in the grey mangrove, Avicennia marina (Forsk). Vierh. Aquat. Bot. 2000, 68, 45–59. [Google Scholar] [CrossRef]
  2. Duman, F.; Aksoy, A.; Demirezen, D. Seasonal variability of heavy metals in surface sediment of Lake Sapanca, Turkey. Environ. Monit. Assess. 2007, 133, 277–283. [Google Scholar] [CrossRef]
  3. Armstrong-Altrin, J.S.; Machain-Castillo, M.L.; Rosales-Hoz, L.; Carranza-Edwards, A.; Sanchez-Cabeza, J.A.; Ruíz-Fernández, A.C. Provenance and depositional history of continental slope sediments in the Southwestern Gulf of Mexico unraveled by geochemical analysis. Cont. Shelf Res. 2015, 95, 15–26. [Google Scholar] [CrossRef]
  4. Ramos-Vázquez, M.A.; Armstrong-Altrin, J.S.; Rosales-Hoz, L.; Machain-Castillo, M.L.; Carranza-Edwards, A. Geochemistry of deep-sea sediments in two cores retrieved at the mouth of the Coatzacoalcos River delta, western Gulf of Mexico, Mexico. Arab. J. Geosci. 2017, 10, 148. [Google Scholar] [CrossRef]
  5. Wu, Q.; You, R.; Clark, M.; Yu, Y. Pb (II) removal from aqueous solution by a low-cost adsorbent dry desulfurization slag. Appl. Surf. Sci. 2014, 314, 129–137. [Google Scholar] [CrossRef]
  6. U.S. Agency for International Development. Natural Dyes for Apparel Textile Dyeing. 2014. Available online: http://www.apparelsearch.com/natural_dyes.htm (accessed on 12 September 2020).
  7. Zhang, G.; Bai, J.; Xiao, R.; Zhao, Q.; Jia, J.; Cui, B.; Liu, X. Heavy metal fractions and ecological risk assessment in sediments from urban, rural and reclamation-affected rivers of the Pearl River Estuary, China. Chemosphere 2017, 184, 278–288. [Google Scholar] [CrossRef]
  8. Baran, S.; Oleszczuk, P.; Lesiuk, A.; Baranowska, E. Trace metals and polycyclic aromatic hydrocarbons in surface sediment samples from the Narew River (Poland). Pol. J. Environ. Stud. 2002, 11, 299–306. [Google Scholar]
  9. Kucuksezgin, F.; Uluturhan, E.; Batki, H. Distribution of heavy metals in water, particulate matter and sediments of Gediz River (Eastern Aegean). Environ. Monit. Assess. 2008, 141, 213–225. [Google Scholar] [CrossRef] [PubMed]
  10. Singh, V.K.; Singh, K.P.; Mohan, D. Status of heavy metals in water and bed sediments of river Gomti–A tributary of the Ganga river, India. Environ. Monit. Assess. 2005, 105, 43–67. [Google Scholar] [CrossRef] [PubMed]
  11. Jain, C.K.; Malik, D.S.; Yadav, R. Metal fractionation study on bed sediments of Lake Nainital, Uttaranchal, India. Environ. Monit. Assess. 2007, 130, 129–139. [Google Scholar] [CrossRef]
  12. Burton, A.G., Jr.; Baudo, R.; Beltrami, M.; Rowland, C. Assessing sediment contamination using six toxicity assays. J. Limnol. 2001, 60, 263–267. [Google Scholar] [CrossRef] [Green Version]
  13. Sayadi, M.H.; Sayyed, M.R.G.; Kumar, S. Short-term accumulative signatures of heavy metals in river bed sediments in the industrial area, Tehran, Iran. Environ. Monit. Assess. 2010, 162, 465–473. [Google Scholar] [CrossRef] [PubMed]
  14. Ali, M.M.; Ali, M.L.; Islam, M.S.; Rahman, M.Z. Preliminary assessment of heavy metals in water and sediment of Karnaphuli River, Bangladesh. Environ. Nanotechnol. Monit. Manag. 2016, 5, 27–35. [Google Scholar] [CrossRef] [Green Version]
  15. Islam, M.S.; Hossain, M.B.; Matin, A.; Sarker, M.S.I. Assessment of heavy metal pollution, distribution and source apportionment in the sediment from Feni River estuary, Bangladesh. Chemosphere 2018, 202, 25–32. [Google Scholar] [CrossRef]
  16. Hossain, M.B.; Shanta, T.B.; Ahmed, A.S.; Hossain, M.K.; Semme, S.A. Baseline study of heavy metal contamination in the Sangu River estuary, Chattogram, Bangladesh. Mar. Pollut. Bull. 2019, 140, 255–261. [Google Scholar] [CrossRef]
  17. Siddique, M.A.M.; Mustafa Kamal, A.H.; Aktar, M. Trace metal concentrations in salt marsh sediments from Bakkhali River estuary, Cox’s Bazar, Bangladesh. Zool. Ecol. 2012, 22, 254–259. [Google Scholar] [CrossRef]
  18. Wang, H.; Wang, J.; Liu, R.; Yu, W.; Shen, Z. Spatial variation, environmental risk and biological hazard assessment of heavy metals in surface sediments of the Yangtze River estuary. Mar. Pollut. Bull. 2015, 93, 250–258. [Google Scholar] [CrossRef]
  19. Liu, J.; Yin, P.; Chen, B.; Gao, F.; Song, H.; Li, M. Distribution and contamination assessment of heavy metals in surface sediments of the Luanhe River Estuary, northwest of the Bohai Sea. Mar. Pollut. Bull. 2016, 109, 633–639. [Google Scholar] [CrossRef]
  20. Shah, B.A.; Shah, A.V.; Mistry, C.B.; Navik, A.J. Assessment of heavy metals in sediments near Hazira industrial zone at Tapti River estuary, Surat, India. Environ. Earth Sci. 2013, 69, 2365–2376. [Google Scholar] [CrossRef]
  21. Banglapedia. National Encyclopedia of Bangladesh, Asiatic Society of Bangladesh, 1st ed.; Dhaka, Bangladesh, 2004; Available online: www.banglapedia.org (accessed on 15 August 2020).
  22. Hossain, M.A.; Nahiduzzaman, M.; Sayeed, M.A.; Azim, M.E.; Wahab, M.A.; Olin, P.G. The Chalan beel in Bangladesh: Habitat and biodiversity degradation, and implications for future management. Lakes Reserv. Res. Manag. 2009, 14, 3–19. [Google Scholar] [CrossRef]
  23. Shahnaz, K. Drastic Fall in Chalan Beel Fish Production; Holiday-Internet Edition; Dhaka, Bangladesh, 2005; Available online: http://www.weeklyholiday.net/2005/090905/env.html (accessed on 15 August 2020).
  24. Rahman, M.M. Prospects of Handloom Industries in Pabna, Bangladesh. Global J. Manage. Busi. Res. 2013, 13, 8–17. [Google Scholar]
  25. BBS (Bangladesh Bureau of Statistics). Agricultural Statistical Yearbook of Bangladesh. Statistics Division, Bangladesh Bureau of Statistics; Ministry of Planning, Government of the People’s Republic of Bangladesh: Dhaka, Bangladesh, 2016.
  26. Brammer, H. Rice soils of Bangladesh. In Soils and Rice; IRRI Publication: Los Banos, Philippines, 1978; pp. 35–55. [Google Scholar]
  27. Hyun, S.; Lee, C.H.; Lee, T.; Choi, J.W. Anthropogenic contributions to heavy metal distributions in the surface sediments of Masan Bay Korea. Mar. Pollut. Bull. 2007, 54, 1059–1068. [Google Scholar] [CrossRef]
  28. Tam, N.F.Y.; Wong, Y.S. Spatial variation of heavy metals in surface sediments of Hong Kong mangrove swamps. Environ. Poll. 2007, 110, 195–205. [Google Scholar] [CrossRef]
  29. Lasorsa, B.; Casas, A. A comparison of sample handling and analytical methods for determination of acid volatile sulfides in sediment. Mar. Chem. 1996, 52, 211–220. [Google Scholar] [CrossRef]
  30. Salati, S.; Moore, F. Assessment of heavy metal concentration in the Khoshk River water and sediment, Shiraz, Southwest Iran. Environ. Monit. Assess. 2010, 164, 677–689. [Google Scholar] [CrossRef]
  31. Amin, B.; Ismail, A.; Arshad, A.; Yap, C.K.; Kamarudin, M.S. Anthropogenic impacts on heavy metal concentrations in the coastal sediments of Dumai, Indonesia. Environ. Monit. Assess. 2009, 148, 291–305. [Google Scholar] [CrossRef]
  32. Karbassi, A.R.; Monavari, S.M.; Bidhendi, G.R.N.; Nouri, J.; Nematpour, K. Metal pollution assessment of sediment and water in the Shur River. Environ. Monit. Assess. 2008, 147, 107. [Google Scholar] [CrossRef]
  33. Pereira, P.; Pereira, D.I.; Alves, M.I. Geomorphosite Assessment in Montesinho Natural Park (Portugal). Geogr. Helv. 2007, 62, 159–168. [Google Scholar] [CrossRef] [Green Version]
  34. Loska, K.; Cebula, J.; Pelczar, J.; Wiechuła, D.; Kwapuliński, J. Use of enrichment, and contamination factors together with geoaccumulation indexes to evaluate the content of Cd, Cu, and Ni in the Rybnik water reservoir in Poland. Water Air Soil Poll. 1997, 93, 347–365. [Google Scholar] [CrossRef]
  35. Turekian, K.K.; Wedepohl, K.H. Distribution of the elements in some major units of the earth’s crust. Geol. Soc. Am. Bull. 1961, 72, 175–192. [Google Scholar] [CrossRef]
  36. Hakanson, L. An ecological risk index for aquatic pollution control. A sedimentological approach. Water Res. 1980, 14, 975–1001. [Google Scholar] [CrossRef]
  37. Muller, G. Schwermettalle in den sedimenten des Rheins-Veranderungen seit 1971. Umsch. Wissensch Tech. 1979, 79, 778–783. [Google Scholar]
  38. Suresh, G.; Ramasamy, V.; Meenakshisundaram, V.; Venkatachalapathy, R.; Ponnusamy, V. Influence of mineralogical and heavy metal composition on natural radionuclide concentrations in the river sediments. Appl. Radiat. Isotopes. 2011, 69, 1466–1474. [Google Scholar] [CrossRef] [PubMed]
  39. Carver, R.H.; Nash, J.G. Doing Data Analysis with SPSS: Version 18.0; Cengage Learning: Boston, MA, USA, 2011. [Google Scholar]
  40. Ahmad, M.K.; Islam, S.; Rahman, M.S.; Haque, M.R.; Islam, M.M. Heavy metals in water, sediment and some fishes of Buriganga River, Bangladesh. Int. J. Environ. Res. 2010, 4, 321–332. [Google Scholar]
  41. Bai, J.; Cui, B.; Chen, B.; Zhang, K.; Deng, W.; Gao, H.; Xiao, R. Spatial distribution and ecological risk assessment of heavy metals in surface sediments from a typical plateau lake wetland, China. Ecol. Model. 2011, 222, 301–306. [Google Scholar] [CrossRef]
  42. Islam, M.S.; Ahmed, M.K.; Mamun, M.H.A.; Hoque, M.F. Preliminary assessment of heavy metal contamination in surface sediments from a river in Bangladesh. Environ. Earth Sci. 2014, 73, 1837–1848. [Google Scholar] [CrossRef]
  43. Subramanian, V.; Jha, P.K.; Van Grieken, R. Heavy metals in the Ganges estuary. Mar. Pollut. Bull. 1988, 19, 290–293. [Google Scholar] [CrossRef]
  44. Zhou, H.Y.; Peng, X.T.; Pan, J.M. Distribution, source and enrichment of some chemical elements in sediments of the Pearl River Estuary, China. Cont. Shelf Res. 2004, 24, 1857–1875. [Google Scholar] [CrossRef]
  45. Rahman, M.S.; Saha, N.; Molla, A.H. Potential ecological risk assessment of heavy metal contamination in sediment and water body around Dhaka export processing zone, Bangladesh. Environ. Earth Sci. 2014, 71, 2293–2308. [Google Scholar] [CrossRef]
  46. Singh, K.P.; Malik, A.; Sinha, S.; Singh, V.K.; Murthy, R.C. Estimation of source of heavy metal contamination in sediments of Gomti River (India) using principal component analysis. Water Air Soil Poll. 2005, 166, 321–341. [Google Scholar] [CrossRef]
  47. Li, X.; Liu, L.; Wang, Y.; Luo, G.; Chen, X.; Yang, X.; Gao, B.; He, X. Integrated assessment of heavy metal contamination in sediments from a coastal industrial basin, NE China. PLoS ONE 2012, 7, e39690. [Google Scholar] [CrossRef]
  48. Liu, C.; Xu, J.; Liu, C.; Zhang, P.; Dai, M. Heavy metals in the surface sediments in Lanzhou Reach of Yellow River, China. B. Environ. Contam. Tox. 2009, 82, 26–30. [Google Scholar] [CrossRef]
  49. Uluturhan, E.; Kontas, A.; Can, E. Sediment concentrations of heavy metals in the Homa Lagoon (Eastern Aegean Sea): Assessment of contamination and ecological risks. Mar. Pollut. Bull. 2011, 62, 1989–1997. [Google Scholar] [CrossRef]
  50. MacDonald, D.D.; Ingersoll, C.G.; Berger, T.A. Development and evaluation of consensus-based sediment quality guidelines for freshwater ecosystems. Arch. Environ. Con. Tox. 2000, 39, 20–31. [Google Scholar] [CrossRef] [PubMed]
  51. Agency for Toxic Substances and Disease Registry. Toxicological Profile for Cadmium; US Department of Human and Health Services: Washington, DC, USA, 1999.
  52. Satarug, S.; Jason, R.; Baker, J.R.; Urbenjapol, S.; Haswell-Elkins, M.; Reilly, P.E.R.; Williams, D.J.; Moore, M.R. A global perspective on cadmium pollution and toxicity in non-occupationally exposed population. Toxicol. Lett. 2003, 137, 65–83. [Google Scholar] [CrossRef]
  53. Suthar, S.; Nema, A.K.; Chabukdhara, M.; Gupta, S.K. Assessment of metals in water and sediments of Hindon River, India: Impact of industrial and urban discharges. J. Hazard. Mater. 2009, 171, 1088–1095. [Google Scholar] [CrossRef]
  54. Mohiuddin, K.M.; Ogawa, Y.Z.H.M.; Zakir, H.M.; Otomo, K.; Shikazono, N. Heavy metals contamination in water and sediments of an urban river in a developing country. Int. J. Environ. Sci. Technol. 2011, 8, 723–736. [Google Scholar] [CrossRef] [Green Version]
  55. Manoj, K.; Padhy, P. Distribution, Enrichment and Ecological Risk Assessment of Six Elements in Bed Sediments of a Tropical River, Chottanagpur Plateau: A Spatial and Temporal Appraisal. J. Environ. Prot. 2014, 5, 1419–1434. [Google Scholar] [CrossRef] [Green Version]
  56. Prasad, M.B.K.; Ramanathan, A.L.; Shrivastav, S.K.; Saxena, R. Metal Fractionation Studies in Surfacial and Core Sediments in the Achankovil River Basin in India. Environ. Monit. Assess. 2006, 121, 77–102. [Google Scholar] [CrossRef]
  57. Harikumar, P.S.; Nasir, U.P.; Rahman, M.P.M. Distribution of heavy metals in the core sediments of a tropical wetland system. Int. J. Environ. Sci. Technol. 2009, 6, 225–232. [Google Scholar] [CrossRef] [Green Version]
  58. Zhang, J.; Liu, C.L. Riverine composition and estuarine geochemistry of particulate metals in China—Weathering features, anthropogenic impact and chemical fluxes. Estuar. Coast. Shelf Sci. 2002, 54, 1051–1070. [Google Scholar] [CrossRef]
  59. Bhuiyan, M.A.; Parvez, L.; Islam, M.A.; Dampare, S.B.; Suzuki, S. Heavy metal pollution of coal mine-affected agricultural soils in the northern part of Bangladesh. J. Hazard. Mater. 2010, 173, 384–392. [Google Scholar] [CrossRef]
  60. Barałkiewicz, D.; Siepak, J. Chromium, nickel and cobalt in environmental samples and existing legal norms. Pol. J. Environ. Stud. 1999, 8, 201–208. [Google Scholar]
  61. Wei, B.; Jiang, F.; Li, X.; Mu, S. Heavy metal induced ecological risk in the city of Urumqi, NW China. Environ. Monit. Assess. 2010, 160, 1–33. [Google Scholar] [CrossRef] [PubMed]
  62. Yisa, J.; Jacob, J.O.; Onoyima, C.C. Assessment of toxic levels of some heavy metals in road deposited sediments in Suleja, Nigeria. Am. J. Chem. 2012, 2, 34–37. [Google Scholar] [CrossRef] [Green Version]
  63. Bhuiyan, M.A.H.; Suruvi, N.I.; Dampare, S.B.; Islam, M.A.; Quraishi, S.B.; Ganyaglo, S.; Suzuki, S. Investigation of the possible sources of heavy metal contamination in lagoon and canal water in the tannery industrial area in Dhaka, Bangladesh. Environ. Monit. Assess. 2011, 175, 633–649. [Google Scholar] [CrossRef] [PubMed]
  64. Tariq, S.R.; Shaheen, N.; Khalique, A.; Shah, M.H. Distribution, correlation, and source apportionment of selected metals in tannery effluents, related soils, and groundwater—A case study from Multan, Pakistan. Environ. Monit. Assess. 2010, 166, 303–312. [Google Scholar] [CrossRef]
  65. Aksu, Z.; Balibek, E. Effect of salinity on metal-complex dye biosorption by Rhizopus arrhizus. J. Environ. Manag. 2010, 91, 1546–1555. [Google Scholar] [CrossRef]
Figure 1. Location of study area and sampling sites in the Chalan beel area. Here, Panakora beel (CB 1); Kanar beel (CB 2); Western beel (CB 3); Kawchar beel (CB 4); Khanpara beel (CB 5); Hamkuria beel (CB 6); Mohesh Rohali beel (CB 7); Barohash beel (CB 8); Khuligari beel (CB 9); Udvaria beel (CB 10).
Processes 09 00410 g001
Figure 2. Contamination factors (CFs) for sediment samples in the study area. According to Turekian and Wedepohl [35] CFs were categorized as: low contamination: CF < 1; moderate contamination: 1 ≤ CF < 3; considerable contamination: 3 ≤ CF < 6 and very high contamination at CF > 6.
Processes 09 00410 g002
Figure 3. Principal Component Analysis (PCA) of studied metals of the Chalan beel area.
Processes 09 00410 g003
Figure 4. Dendrogram showing the hierarchical clusters of experimental sites of Chalan beel wetland area. Here, Panakora beel (CB 1); Kanar beel (CB 2); Western beel (CB 3); Kawchar beel (CB 4); Khanpara beel (CB 5); Hamkuria beel (CB 6); Mohesh Rohali beel (CB 7); Barohash beel (CB 8); Khuligari beel (CB 9); Udvaria beel (CB 10).
Processes 09 00410 g004
Table 1. Heavy metals concentration of 10 sampling sites of Chalan beel area.
SitesMetal Concentration (mg kg−1)
PbCdNiZnCuMn
CB 137.78 g ± 1.093.30 g ± 0.6857.31 f ± 0.458.71 d ± 0.685.61 bc ± 0.2513.27 a ± 0.71
CB 246.71 e ± 0.655.16 de ± 0.7162.95 d ± 0.898.91 d ± 0.674.60 d ± 0.4013.60 a ± 0.52
CB 340.43 f ± 1.24.79 ef ± 0.6341.28 h ± 0.5510.61 cd ± 1.23.53 e ± 0.0810.07 c ± 1.31
CB 456.26 abc ± 0.764.16 f ± 0.6383.44 a ± 0.7121.46 a ± 3.786.68 a ± 0.7910.47 bc ± 1.96
CB 554.39 d ± 1.365.65 d ± 0.1757.15 f ± 0.5816.87 b ± 2.076.13 b ± 0.2511.76 b ± 0.61
CB 655.75 bc ± 1.237.55 bc ± 6064.21 c ± 0.638.87 d ± 1.284.09 d ± 0.504.67 d ± 0.17
CB 753.83 d ± 1.048.03 b ± 0.4956.96f ± 0.559.04 d ± 1.193.16 e ± 0.174.80 d ± 0.19
CB 855.06 cd ± 0.837.75 b ± 0.3947.39 g ± 0.6211.68 c ± 1.895.27 c ± 0.3410.91 bc ± 1.89
CB 957.23 a ± 0.856.85 c ± 0.6958.34 e ± 0.716.02 e ± 0.434.44 d ± 0.573.28 e ± 0.19
CB 1056.45 ab ± 1.138.94 a ± 0.5275.61 b± 0.795.31 e ± 0.253.56 e ± 0.073.61 de ± 0.27
Mean ± SD51.39 ± 6.86.22 ± 1.860.46 ± 11.610.75 ± 4.704.71 ± 1.128.64 ± 3.90
One way ANOVA was performed for analyzing the data of ten sampling sites (n = 6) and data in columns vary significantly in Least Significant Difference (LSD) at p < 0.05. Different letters (a, b, c, d, e, f, g, h) indicate significant variations in heavy metal concentration in different experimental sites of chalan beel area at p < 0.05. Here, Panakora beel (CB 1); Kanar beel (CB 2); Western beel (CB 3); Kawchar beel (CB 4); Khanpara beel (CB 5); Hamkuria beel (CB 6); Mohesh Rohali beel (CB 7); Barohash beel (CB 8); Khuligari beel (CB 9); Udvaria beel (CB 10).
Table 2. Concentration (mg kg−1) of heavy metal in different dye complexes used in handloom dyeing factories in the Chalan beel area (n = 3); Mean ± SD.
SLPbCdNiZnCuMn
Dye-131.67 ± 1.253.08 ± 0.3120.92 ± 1.36173.33 ± 6.2422000 ± 8.1611.32 ± 0.5
Dye-220.67 ± 2.054.44 ± 0.4233.39 ± 1.24120.00 ± 4.08141.67 ± 2.362.90 ± 0.11
Dye-328.33 ± 1.704.33 ± 0.4720.28 ± 1.681616.67 ± 12.569.67 ± 2.0511.32 ± 0.5
Dye-423.33 ± 1.252.15 ± 0.6423.29 ± 2.332315.00 ± 14.790.00 ± 2.4519.97 ± 1.6
Dye-512.00 ± 1.6313.00 ± 0.8319.23 ± 0.88279.33 ± 16.3680.00 ± 1.6316.48 ± 1.2
Dye-617.00 ± 0.822.56 ± 0.4217.19 ± 2.09225.00 ± 10.8062.33 ± 2.0513.23 ± 1.7
Dye-735.67 ± 2.056.11 ± 0.8313.49 ± 1.221045.67 ± 3.6850.00 ± 4.0825.96 ± 7.8
Dye-837.33 ± 2.494.11 ± 0.6814.18 ± 1.05229.00 ± 13.37140.00 ± 4.0839.70 ± 1.3
Dye-938.67 ± 2.877.33 ± 0.4718.56 ± 2.58329.00 ± 16.3957.33 ± 2.4984.98 ± 4.0
Dye-1036.00 ± 3.275.11 ± 0.6814.15 ± 1.21222.00 ± 14.3161.00 ± 2.9416.15 ± 1.7
Dye-1129.67 ± 1.702.89 ± 0.1623.61 ± 1.23253.00 ± 9.9051.00 ± 2.9414.90 ± 0.9
Dye-1231.33 ± 1.251.47 ± 0.4111.44 ± 1.55432.00 ± 16.5740.33 ± 2.0511.99 ± 1.4
Dye-1331.67 ± 1.253.25 ± 0.5424.98 ± 1.61573.33 ± 20.5530.67 ± 2.4993.05 ± 2.5
Dye-1426.33 ± 2.874.89 ± 0.8320.92 ± 1.36219.67 ± 25.04140.33 ± 2.0510.99 ± 0.8
Dye-1521.00 ± 0.826.00 ± 0.8230.02 ± 1.63395.33 ± 29.5672.67 ± 2.0548.44 ± 1.7
Dye-1622.00 ± 1.635.44 ± 0.42146.03 ± 2.94275.33 ± 3.6820.67 ± 2.4915.15 ± 1.0
Dye-1745.00 ± 0.827.22 ± 0.8711.13 ± 0.84263.00 ± 6.6839.67 ± 2.0510.99 ± 0.8
Dye-1821.00 ± 0.829.56 ± 1.2321.59 ± 1.23875.00 ± 20.41155.00 ± 4.0827.47 ± 2.0
Dye-1926.00 ± 2.942.02 ± 0.3921.25 ± 0.44232.67 ± 7.5939.67 ± 4.5039.70 ± 1.3
Dye-2021.00 ± 0.822.22 ± 0.3123.61 ± 0.44365.33 ± 12.0449.00 ± 2.9416.48 ± 1.2
Mean ± SD27.78 ± 1.714.86 ± 0.5926.46 ± 1.47521.98 ± 13.221169.55 ± 3.0026.56 ± 1.7
Table 3. Comparisons of heavy metals concentration (mg kg−1) in sediments from Chalan beel with others selected rivers, beels and estuaries around the world.
Sample AreaPbCdNiZnCuMnCitation
Chalan beel, Bangladesh51.396.2260.4610.754.718.64Present study
Buriganga River, Bangladesh69.753.33200.45NA27.85NA[40]
Yilong Lake, China53.190.7635.9931.4086.82NA[41]
Feni River estuary, Bangladesh6.47NA33.27NANANA[15]
Paira River, Bangladesh250.7234NA30NA[42]
Ganges estuary, India12–115 8–5712–6114–53NA[43]
Tapti river estuary, India56.69NA80.92143.55148.32NA[20]
Sangu River estuary, Bangladesh19.576NA32.751261.829.235NA[16]
Bakkhali River estuary, Bangladesh27.14NANA100.8534.93NA[17]
Pearl River estuary, China59.3 41.7150.146.2NA[44]
Dhalai beel and Bangshi River, Bangladesh59.990.6125.67117.1531.01483.44[45]
Gomti River, India40.332.4215.741.675.0148.13[46]
BT drainage River, China18.93-138.821.78–9.68NA164.20–2,731.1226.71–2,006.67NA[47]
Yellow River, China26.39–77.66 NA89.80–201.8829.72–102.22773.23–1459.69[48]
Homa Lagoon, Turkey2.13–17.20.06–0.1958.1–10846.2–91.910.3–25.8410–729[49]
ASV (Average shale value)200.3689545850.00[35]
TEL (Threshold effect level)350.5961812335.7NG[50]
PEL (Probable effect level)91.33.5336315197NG
SEL (Severe effect level)2501075820110NG
NA = Not Available; NG = No Guidelines.
Table 4. Enrichment factor of heavy metals for all sediment samples of Chalan beel area.
SitesPbCdNiZnCu
CB 1121.27 g ± 4.97743.50 f ± 99.6154.14 e ± 2.845.89 d ± 0.5908.02 de ± 0.67
CB 2146.23 fg ± 7.201075.30 ef ± 149.3357.94 e ± 2.415.86 d ± 0.3996.38 e ± 0.53
CB 3173.44 ef ± 22.101378.6 e ±280.8152.04 e ± 6.149.52 c ± 1.286.72 e ± 0.87
CB 4235.51 d ± 38.331166.5 ef ± 217.12102.75 e ± 16.7514.83 ab ± 5.0212.55 c ± 3.01
CB 5197.19 de ± 11.501366.5 e ± 164.2760.93 e ± 3.1512.82 b ± 1.219.89 d ± 0.83
CB 6508.06 c ± 19.754577.5 c ± 233.63172.07 c ± 5.6817.01 a ± 2.4416.55 b ± 2.11
CB 7477.27 c ± 26.474750.4 c ± 375.68148.54 d ± 7.6116.85 a ± 2.2012.46 c ± 0.76
CB 8221.60 d ± 41.172067.5 d ± 344.7056.11 e ± 10.649.61 c ± 0.759.32 d ± 1.22
CB 9744.38 a ± 53.125931.9 b ± 570.16223.09 b ± 14.8016.48 a ± 1.5525.58 a ± 3.05
CB 10669.77 b ± 62.407071.40 a ± 737.81263.68 a ± 21.6513.23 b ± 1.1018.73 b ± 1.59
Min ± SD121.27 ± 4.97743.50 ± 99.6152.04 ± 6.145.86 ± 0.3996.38 ± 0.53
Max ± SD 744.38 ± 53.127071.40 ± 737.81263.68 ± 21.6517.01 ± 2.4425.38 ± 3.05
One way ANOVA was performed for analyzing the data of ten sampling sites (n = 6) and data in columns vary significantly in LSD at p < 0.05. Different letters (a, b, c, d, e, f, g) indicate significant variations in heavy metal concentration in different experimental sites of Chalan beel area at p < 0.05. Here, Panakora beel (CB 1); Kanar beel (CB 2); Western beel (CB 3); Kawchar beel (CB 4); Khanpara beel (CB 5); Hamkuria beel (CB 6); Mohesh Rohali beel (CB 7); Barohash beel (CB 8); Khuligari beel (CB 9); Udvaria beel (CB 10). Based on EF, there are five contamination types suggested by Birch and Olmos (2008): 2 < EF < 5 indicates deficiency to moderate enrichment, EF = 5–10 moderately severe enrichment, EF = 10–25 severe enrichment, EF = 25–50 very severe enrichment and EF > 50 extremely severe enrichment.
Table 5. Geo-accumulation index (Igeo) of heavy metals for all sediment samples of Chalan beel area.
SitesPbCdNiZnCuMn
CB 10.3322 g2.9357 g−0.8318 f−4.0371 c−3.5892 bc−6.5887 ab
CB 20.6386 e3.5046 de−0.6965 d−4.0034 c−3.8821 d−6.5518 a
CB 30.4297 f3.3983 e−1.3053 h−3.7579 bc−4.2592 f−6.9960 d
CB 40.9070 ab3.2089 f−0.2899 a−3.1475 a−3.3464 a−6.9519 d
CB 50.8579 cd3.6423 d−0.8358 f−3.0886 a−3.4612 ab−6.7630 bc
CB 60.8937 abc4.0646 bc−0.6678 c−4.0198 c−4.0573 e−8.0939 e
CB 70.8431 d4.1563 ab−0.8406 f−3.9898 c−4.4169 g−8.0534 e
CB 80.8758 bcd4.1005 b−1.1060 g−3.6303 b−3.6830 c−6.8912 cd
CB 90.9317 a3.9234 c−0.8062 c−4.5683 d−3.9379 de−8.6045 f
CB 100.9117 ab4.3098 a−0.4320 b−4.7483 d−4.2469 f−8.4698 f
Min0.33222.9357−1.3053−4.7483−4.4169−8.6045
Max0.93174.3098−0.2899−3.0886−3.3464−6.5518
Mean0.76213.7245−0.7812−3.8991−3.8880−7.3964
SD(±)0.21820.45650.29310.53080.36280.8103
CV (%)4.373.99−2.26−7.50−3.35−2.11
One way ANOVA was performed for analyzing the data of ten sampling sites (n = 6) and data in columns vary significantly in LSD at p < 0.05. Different letters (a, b, c, d, e, f, g, h) indicate significant variations in heavy metal concentration in different experimental sites of chalan beel area at p < 0.05. Here, Panakora beel (CB 1); Kanar beel (CB 2); Western beel (CB 3); Kawchar beel (CB 4); Khanpara beel (CB 5); Hamkuria beel (CB 6); Mohesh Rohali beel (CB 7); Barohash beel (CB 8); Khuligari beel (CB 9); Udvaria beel (CB 10). According to Muller (1979) Igeo has seven grades: Grade 0 (practically uncontaminated); Grade 1 (uncontaminated to moderately contaminated): 0< Igeo <1; Grade 2 (moderately contaminated): 1 < Igeo < 2; Grade 3 (moderate to heavily contaminated): 2 < Igeo < 3; Grade 4 (heavily contaminated): 3 < Igeo < 4; Grade 5 (heavy to extremely contaminated): 4 < Igeo < 5; Grade 6 (extremely contaminated): Igeo > 5.
Table 6. Potential ecological risk index (PERI) of heavy metals for all sediment samples of Chalan beel area.
SitesPbCdNiZnCuMn
CB 19.44 g ± 0.273346.46 g ± 37.674.21 f ± 0.030.091 bcd ± 0.0070.62 bc ± 0.0250.015 a ± 0.00083
CB 211.68 e ± 1.63515.61 de ± 71.014.62 d ± 0.060.093 bc ± 0.0070.51 d ± 0.0450.016 a ± 0.0006
CB 310.10 f ± 0.30478.73 ef ± 63.533.03 h ± 0.040.111 b ± 0.0120.39 e ± 0.0090.011 c ± 0.0015
CB 414.06 abc ± 0.19416.47 f ± 16.616.13 a ± 0.0520.189 a ± 0.0850.74 a ± 0.080.012 bc ± 0.0023
CB 513.59 d ± 0.34565.46 d ± 60.774.20 f ± 0.040.177 a ± 0.0200.68 b ± 0.020.013 b ± 0.00071
CB 613.93 bc ± 0.30787.24 b ± 49.464.72 c ± 0.0460.09 bcd ± 0.0100.45 d ± 0.050.0054 d ± 0.0002
CB 713.45 d ± 0.26803.38 b ± 39.054.18 f ± 0.040.095 bc ± 0.0100.35 e ± 0.0180.0056 d ± 0.00022
CB 813.76 cd ± 0.20775.17 b ± 69.103.48 g ± 0.0460.122 b ± 0.0100.58 c ± 0.030.012 bc ± 0.0022
CB 914.30 a ± 0.21684.72 c ± 52.604.28 e ± 0.0520.063 cd ± 0.0040.49 d ± 0.060.0038 e ± 0.00023
CB 1014.11 ab ± 0.28893.63 a ± 45.965.56 b ± 0.0580.055 d ± 0.000.39 e ± 0.0080.0042 de ± 0.00032
Min9.44346.464.180.0550.350.0038
Max14.30893.636.130.1770.740.016
One way ANOVA was performed for analyzing the data of ten sampling sites (n = 6) and data in columns vary significantly in LSD at p < 0.05. Different letters (a, b, c, d, e, f, g) indicate significant variations in heavy metal concentration in different experimental sites of chalan beel area at p < 0.05. Here, Panakora beel (CB 1); Kanar beel (CB 2); Western beel (CB 3); Kawchar beel (CB 4); Khanpara beel (CB 5); Hamkuria beel (CB 6); Mohesh Rohali beel (CB 7); Barohash beel (CB 8); Khuligari beel (CB 9); Udvaria beel (CB 10). According to Hakanson (1980) RI has five categories viz. Low pollution = RI < 150; Considerable pollution = RI = 150–300; High pollution = RI = 300–600; Very high pollution = RI ≥ 600.
Table 7. Pearson correlation among heavy metals in Chalan beel area.
PbCdNiZnCuMn
Pb1
Cd0.647 **1
Ni0.461 **0.0331
Zn0.077−0.348 **0.1171
Cu0.036−0.528 **0.277 *0.503 **1
Mn−0.580 **−0.706 **−0.2010.516 **0.550 **1
* p < 0.05, ** p < 0.01.
Publisher’s Note: MDPI stays neutral with regard to jurisdictional claims in published maps and institutional affiliations.

