Article

Recovery of Valuable Materials from the Waste Crystalline-Silicon Photovoltaic Cell and Ribbon

1
Department of Resources Engineering, National Cheng Kung University, No. 1, Daxue Rd., East Dist., Tainan City 701401, Taiwan
2
Department of Materials Science and Engineering, National Tsing Hua University, No. 101, Section 2, Kuang-Fu Road, Hsinchu 30013, Taiwan
*
Authors to whom correspondence should be addressed.
Submission received: 1 April 2021 / Revised: 12 April 2021 / Accepted: 14 April 2021 / Published: 17 April 2021
(This article belongs to the Special Issue Green Chemistry: From Wastes to Value-Added Products)

Abstract

:
With the dramatic increase of photovoltaic (PV) module installation in solar energy-based industries, the methods for recovering waste solar generators should be emphasized as the backup of the PV market for environmental protection. Crystalline-silicon accounts for most of the worldwide PV market and it contains valuable materials such as high purity of silicon (Si), silver (Ag), copper (Cu), tin (Sn), and lead (Pb). This study can provide an efficient recycling process for valuable materials resourced from waste crystalline-silicon PV module, including Si in the PV cell, and Ag, Cu, Pb, Sn, in PV ribbon. As tempered glass and Ethylene Vinyl Acetate (EVA) resin were removed, the module was separated into two materials, PV ribbon and PV cell. For PV cell purification, Si with purity at 99.84% was recovered by removing impurities such as aluminum (Al) and Ag by two-step leaching and dissolving the impurities. For PV ribbon recovering, purified metal or metal oxide was obtained through the processes of leaching/polishing, extraction, and chemical precipitation. In the polishing process, 99.5% of copper wire was collected. The purities of final products are 99.7% for CuO, 99.47% for PbO, 99.68% for SnO2, and 98.85% for Ag respectively.

1. Introduction

Crystalline-silicon (c-Si) solar cell has been considered as an excellent generator owing to its abundant resource, stable oxidant, insolubility from water, etc. [1]. Therefore, the installation of the c-Si Photovoltaic (PV) module always took 90% of the PV market, and the output of the PV module was 97.081 GW in 2019 [2]. However, the more production produced, the more end-of-life PV modules wasted. The waste panels will become an inevitable waste issue. According to the International Renewable Energy Agency (IRENA) report, approximately 6 million tons of PV waste will accumulate in 2050 [3]. Although the earth contained a great amount of silicon, the high purity of silicon is still expensive and taking a part in semiconductor industrials, steel mills, etc. Silver, copper, and tin are also widely used as critical materials from the technology industries. The toxic metal, lead, containing in the module will cause damage to the environment [4]. Hence, to treat and recycle the waste c-Si PV module, a separation and recovery process of silicon (Si), silver (Ag), copper (Cu), tin (Sn), and lead (Pb) from the waste commercial c-Si modules must be studied.
Silicon purification methods in PV cells have been studied. After dismantling, the PV module was separated into two parts, the PV cell and the PV ribbon. The solar cell was soaked in nitric acid or aqua reagent to leach metallic components such as silver (Ag), aluminum (Al), and filter silicon into high purity. In the purification process, PV cells undergo several layers such as p-n junction, antireflection layer, texturization, and aluminum back surface should be removed from silicon for purification. According to the period research, it can be easily divided into two types of reagent ways to purify PV silicon: That containing hydrofluoric acid [5,6,7,8,9,10,11] or not [12,13,14,15,16]. Because HF was indicated as a highly corrosive acid, this study prefers the method without HF. PV ribbons contain most of the metal in the PV module, but there is little PV ribbon recovering research. PV ribbon looks like the wire what carried the electrical energy produced by solar cells. Lee et al. [17] separated PV ribbon by melting the coating layer composed of tin and lead and separate copper layer; then used the thermal process under a low atmosphere with CH4 to purify Copper, and the purity of Cu after physical treatment was 99.5%. Kim et al. [18] oxidized the Pb-Sn alloy layer of PV Ribbon and used ball milling to separate copper and oxide layer. The other research leached Pb-free PV ribbon by HCl and HNO3 then separated it by precipitation and electrochemical. Moon et al. [19] showed a recycling process by leaching Sn by HCl and separated Cu by adding Sn powder to reductive copper ions and copper metals. After the leaching process, this research used tributyl phosphate (TBP) to extract Sn from the leach solution, and < 1% of Pb was extracted. Jung B. et al. [12] employed nitric acid and potassium hydroxide as the leaching regia to leach metallic components, then extracted copper with LIX84-I. Most of the research involves leaching all of the ribbon’s components with reagent. However, due to the structure of the PV ribbon, it is possible to polish the surface before leaching. Our research has therefore focused on silicon and raw-metal recovery. Si, Ag, CuO, PbO, and SnO2 were obtained as the final products in this research.
In this study, the waste of the c-Si PV module was immersed in toluene to inflate the Ethylene Vinyl Acetate (EVA) resin between the tempered glass and the PV cell. The inflated EVA resin can help separate the tempered glass and the back sheet from the cell. EVA resin was calcinated through furnace in my previous research [20], and the module was separated into two parts, PV ribbon and PV cell. In the silicon purification part, the PV cell was leached by nitric acid and potassium hydroxide continuously. The concentration of reagent, liquid–solid ratio, reaction times, and temperature were investigated to optimize the method. In the ribbon separation part, the ribbon was treated in both chemical and physical methods to polish the surface. After previous treatment, metallic components were leached by hydrochloride and separated through TBP and LIX984N reagent, a 1:1 volume blend of 5-nonylsalicylaldoxime and 2-hydroxy-5-nonylacetophenone oxime. Finally, the separated metallic ion liquid was precipitated and calcinated to obtained Ag, CuO, PbO, and SnO2. The ion concentration in the liquid of leaching and extraction process was investigated by inductively coupled plasma optical emission spectrometry (ICP-OES, PerkinElmer optima 2100 DV; Varian, Vista-MPX, PerkinElmer, Waltham, Massachusetts State, America) and the characteristic analyst of the final product was investigated by X-ray diffraction (XRD, Haoyuan DX-2000).

2. Materials and Methods

2.1. Materials

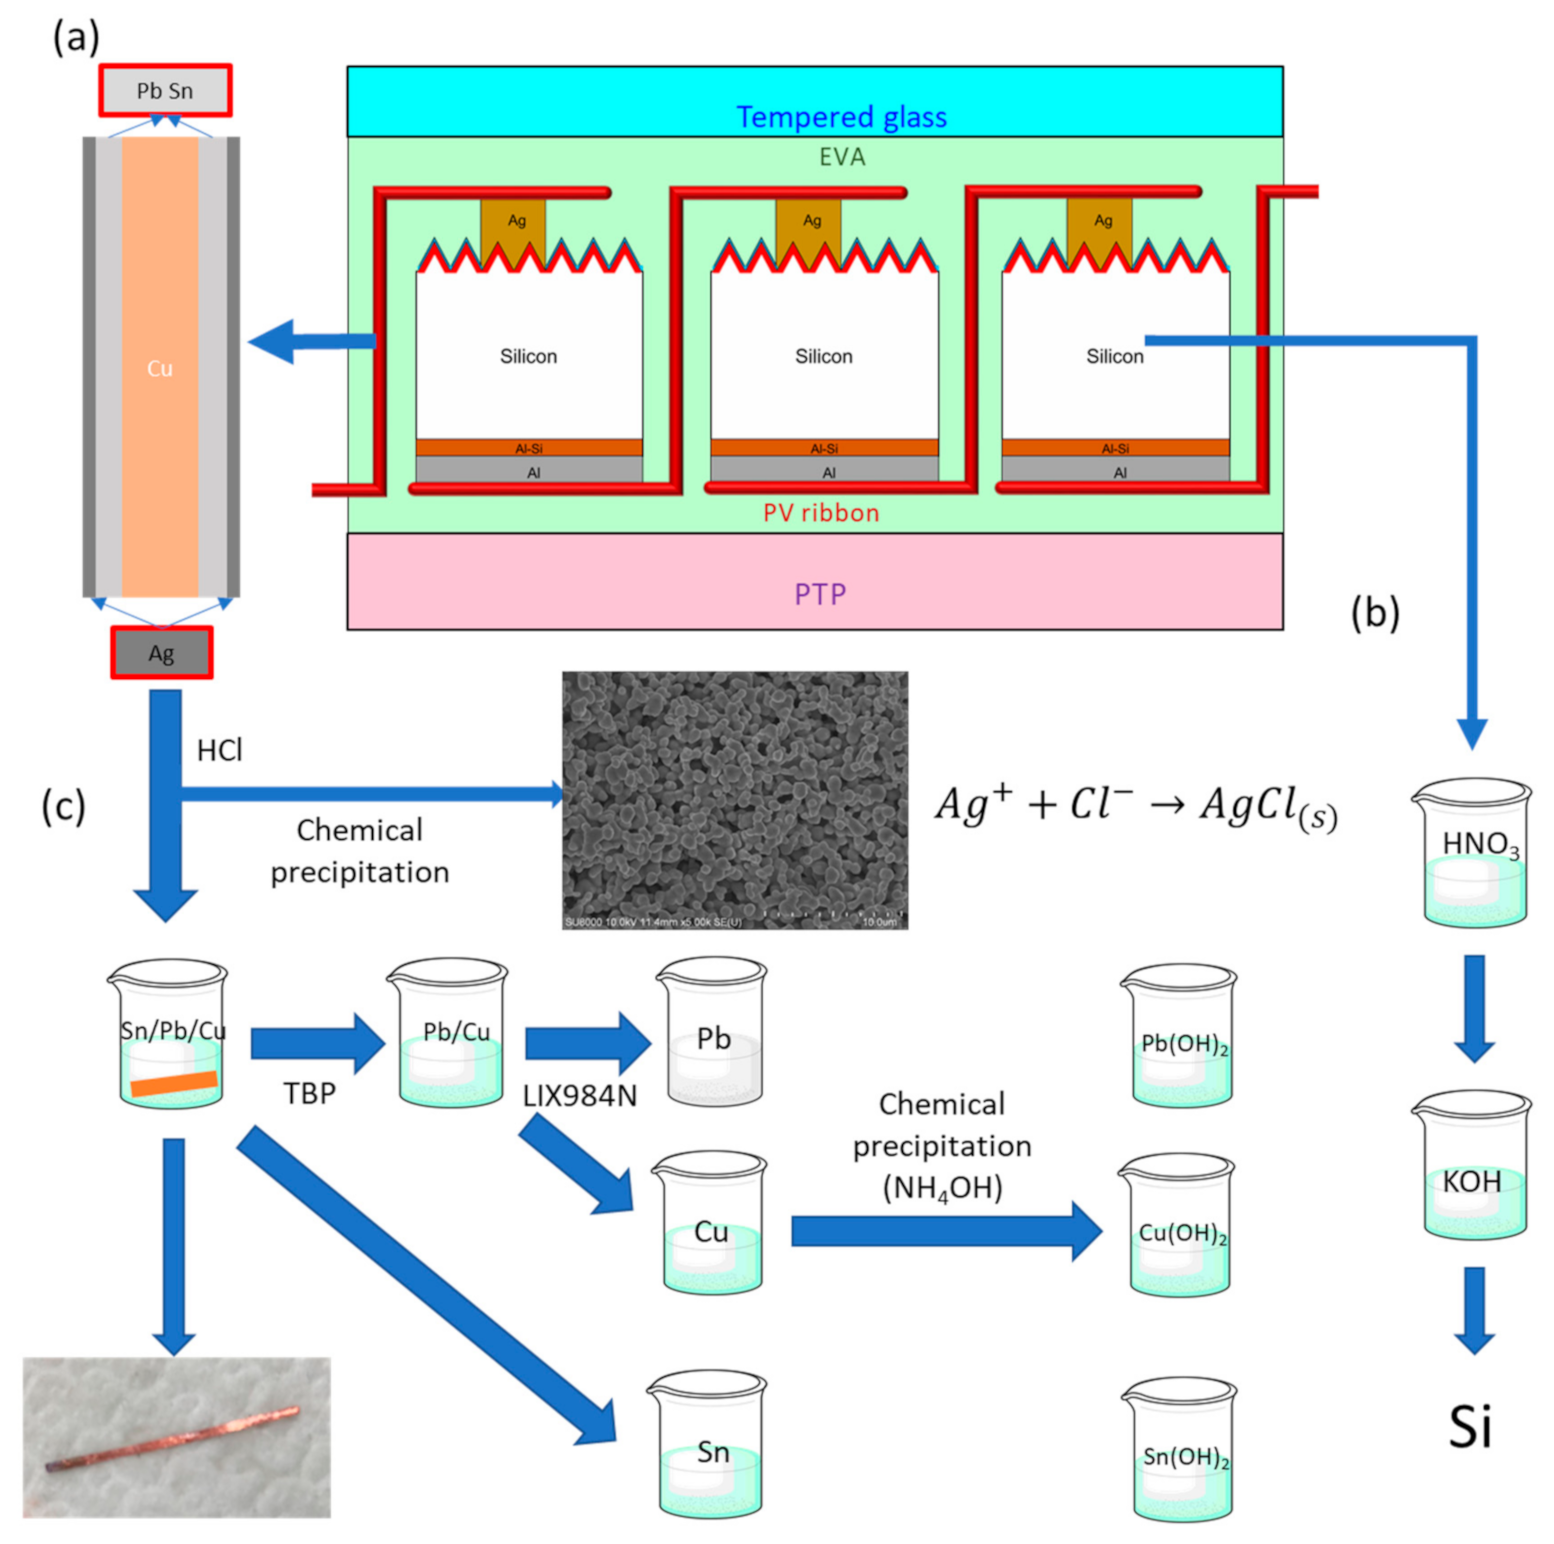
The waste c-Si PV module used in this study was sliced from the commercial waste which was scrapped in Typhoon Meranti. The sliced panel was a square shape with 10 cm× 10 cm. The module consists of aluminum frame, tempered glass, c-Si cell, and ribbon (Figure 1), and the mass fraction of the module are 14.9%, 70.8%, 3.3%, and 1.1%, respectively. Cells contained silicon wafer, silver, and aluminum screen-printed electrodes. The ribbon was coated with Pb-Sn solder to prevent oxidizing. The mass fraction of PV cells and ribbons are summarized in Table 1.

2.2. Pretreatment for Collecting Cells and Ribbons

In our previous research, 10 cm × 10 cm PV panel was dismantled to different layers through toluene and thermal treatment [20]. The tempered glass and back sheet were first collected by immersing the panel into 90 °C toluene for an hour. That swelled the EVA resin between cells and the glass, which let the glass easy to strip of the panel. The sample after removing the tempered glass was heated at 500 °C at a rate of 10 °C/min in an anoxic chamber to eliminate the EVA sheet on the wafer and the rear EVA layer between cells and the back sheet. The wafer was broken during these methods but let us collect ribbon easily. After organic and thermal processes, the tempered glass was collected. Finally, the remaining PV cells and PV ribbons were also collected separately.

2.3. Methods for Purifying Silicon from the Solar Cells

PV cells were immersed in nitric acid and potassium hydroxide continuously as shown 
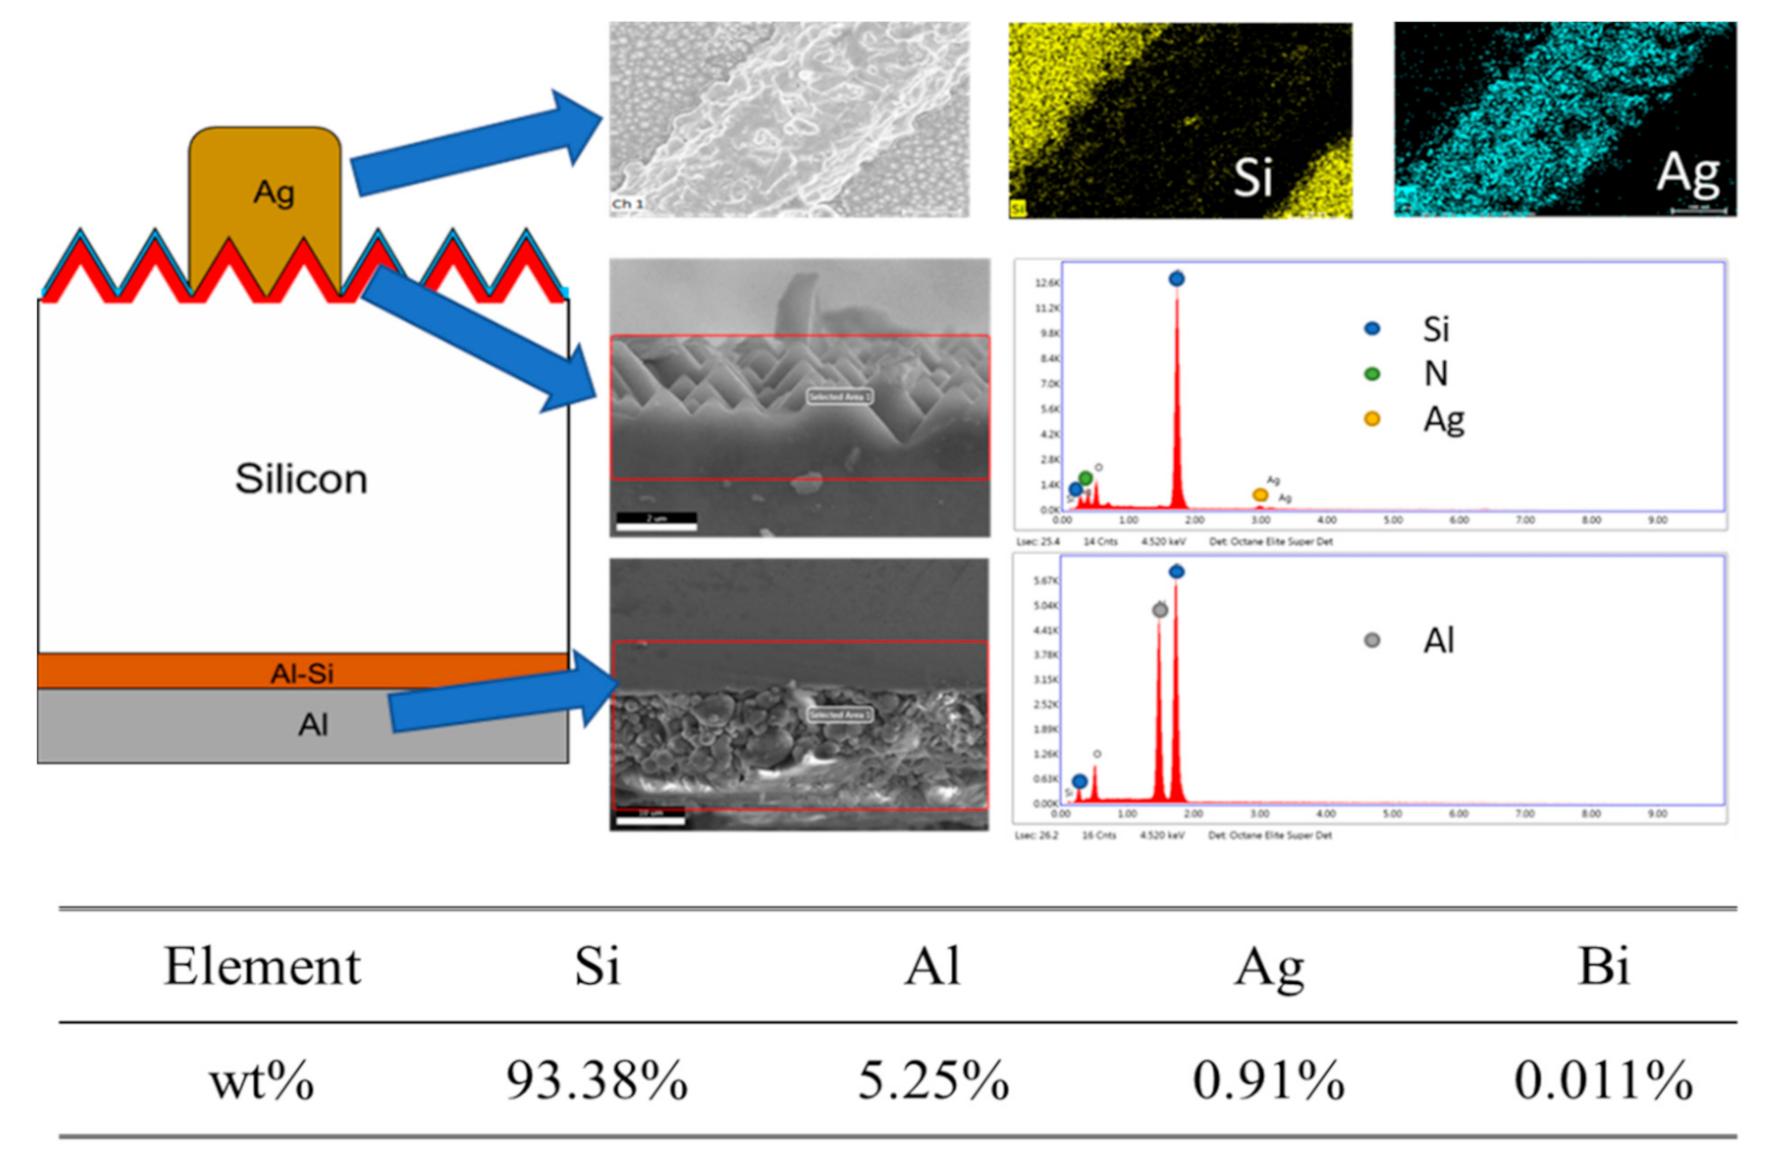
Figure 1b. Cells after this method were washed 30 min 3 times by the deionized water. Optimal parameters including the concentration of leaching reagent, liquid–solid ratio, reaction time, and reaction temperature were concerned in both reagent systems. The characteristic analysis of silicon resource after purification was also investigated by inductively coupled plasma optical emission spectrometry (ICP-OES) and high-resolution scanning electron microscope (HR-SEM, XL30, FEI Ltd., Hillsboro, OR, USA).

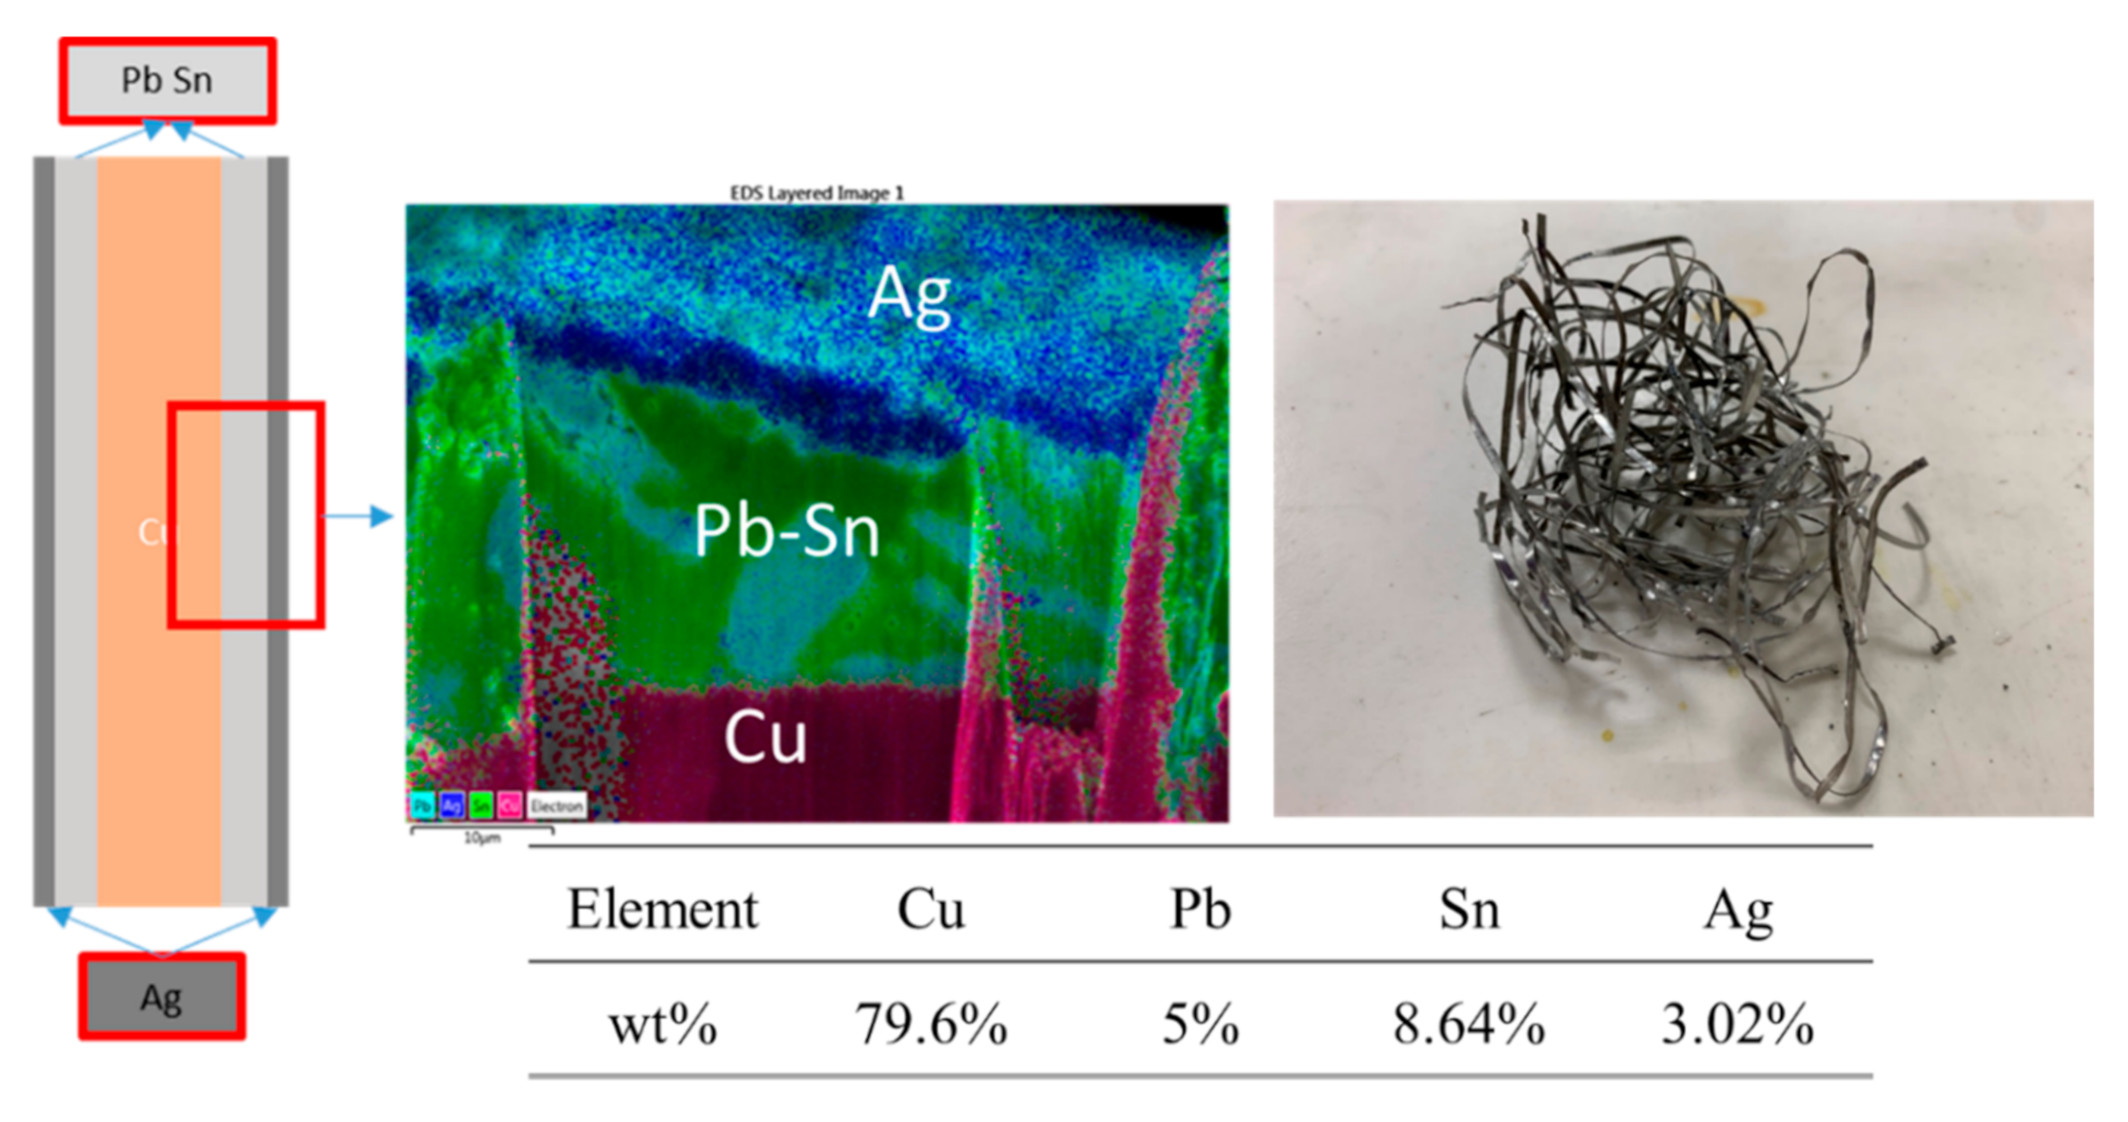
2.4. PV Ribbon Pretreatment and Metal Separation Method

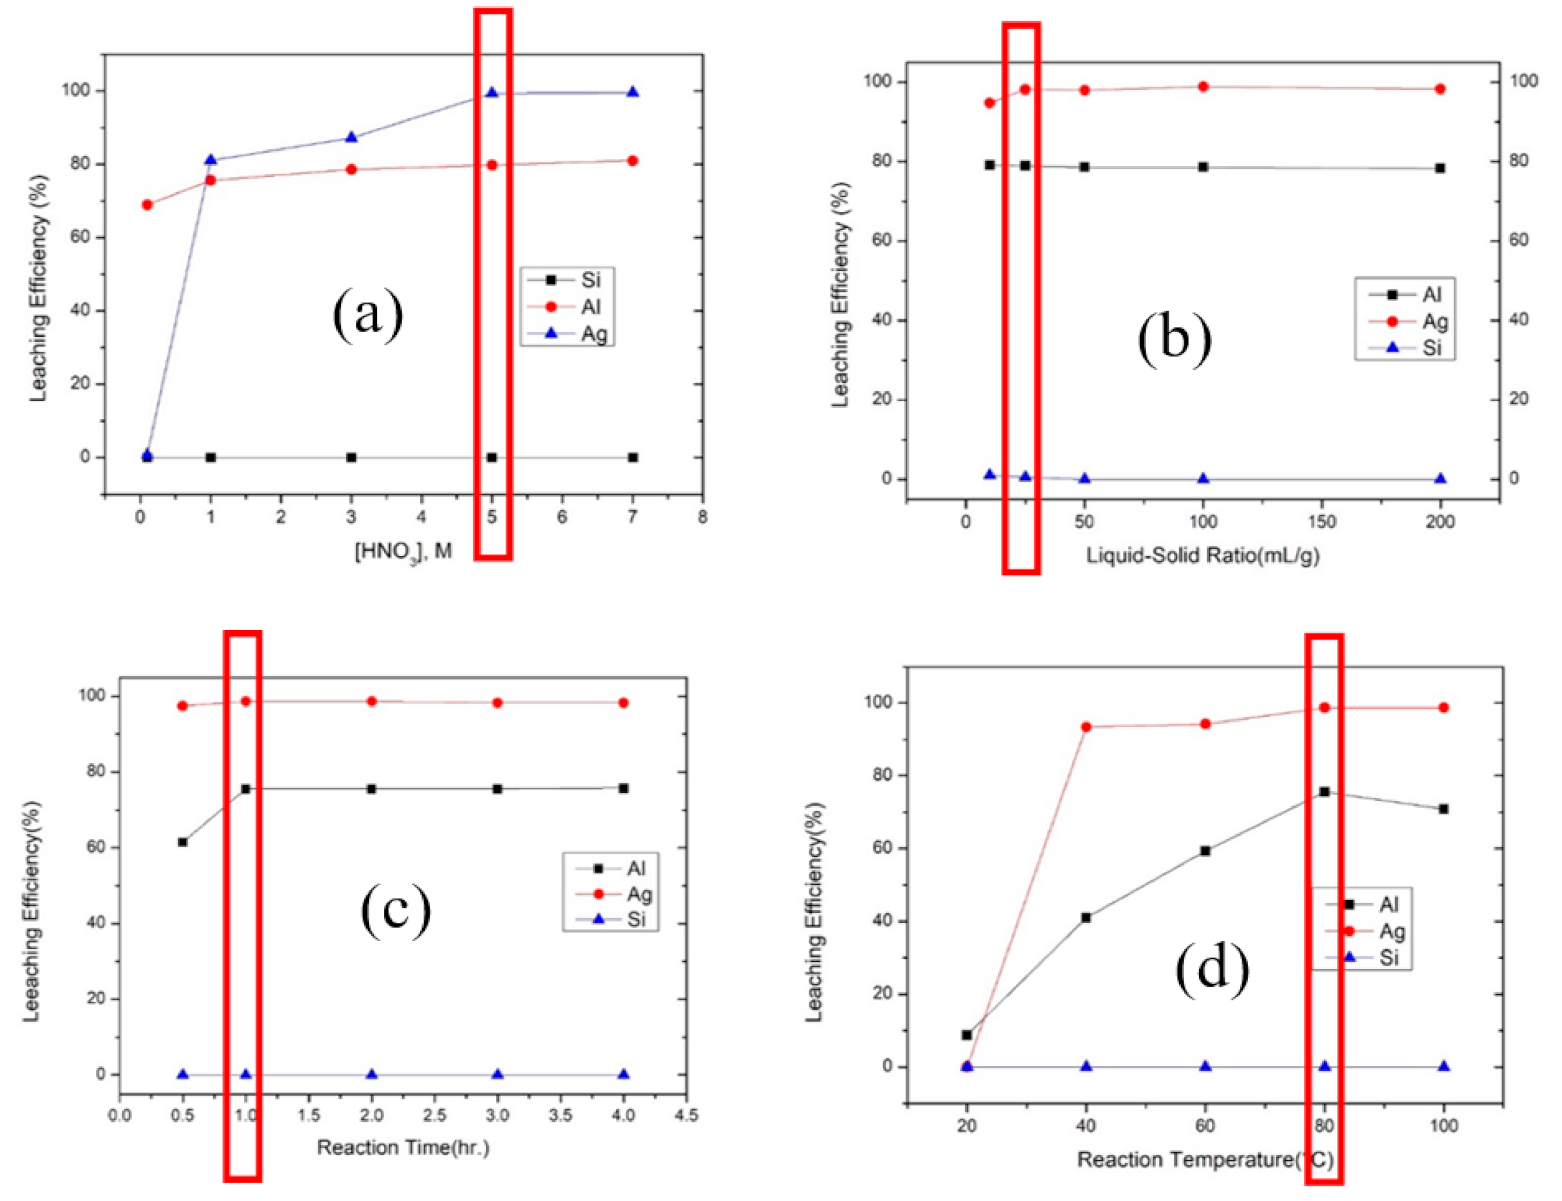
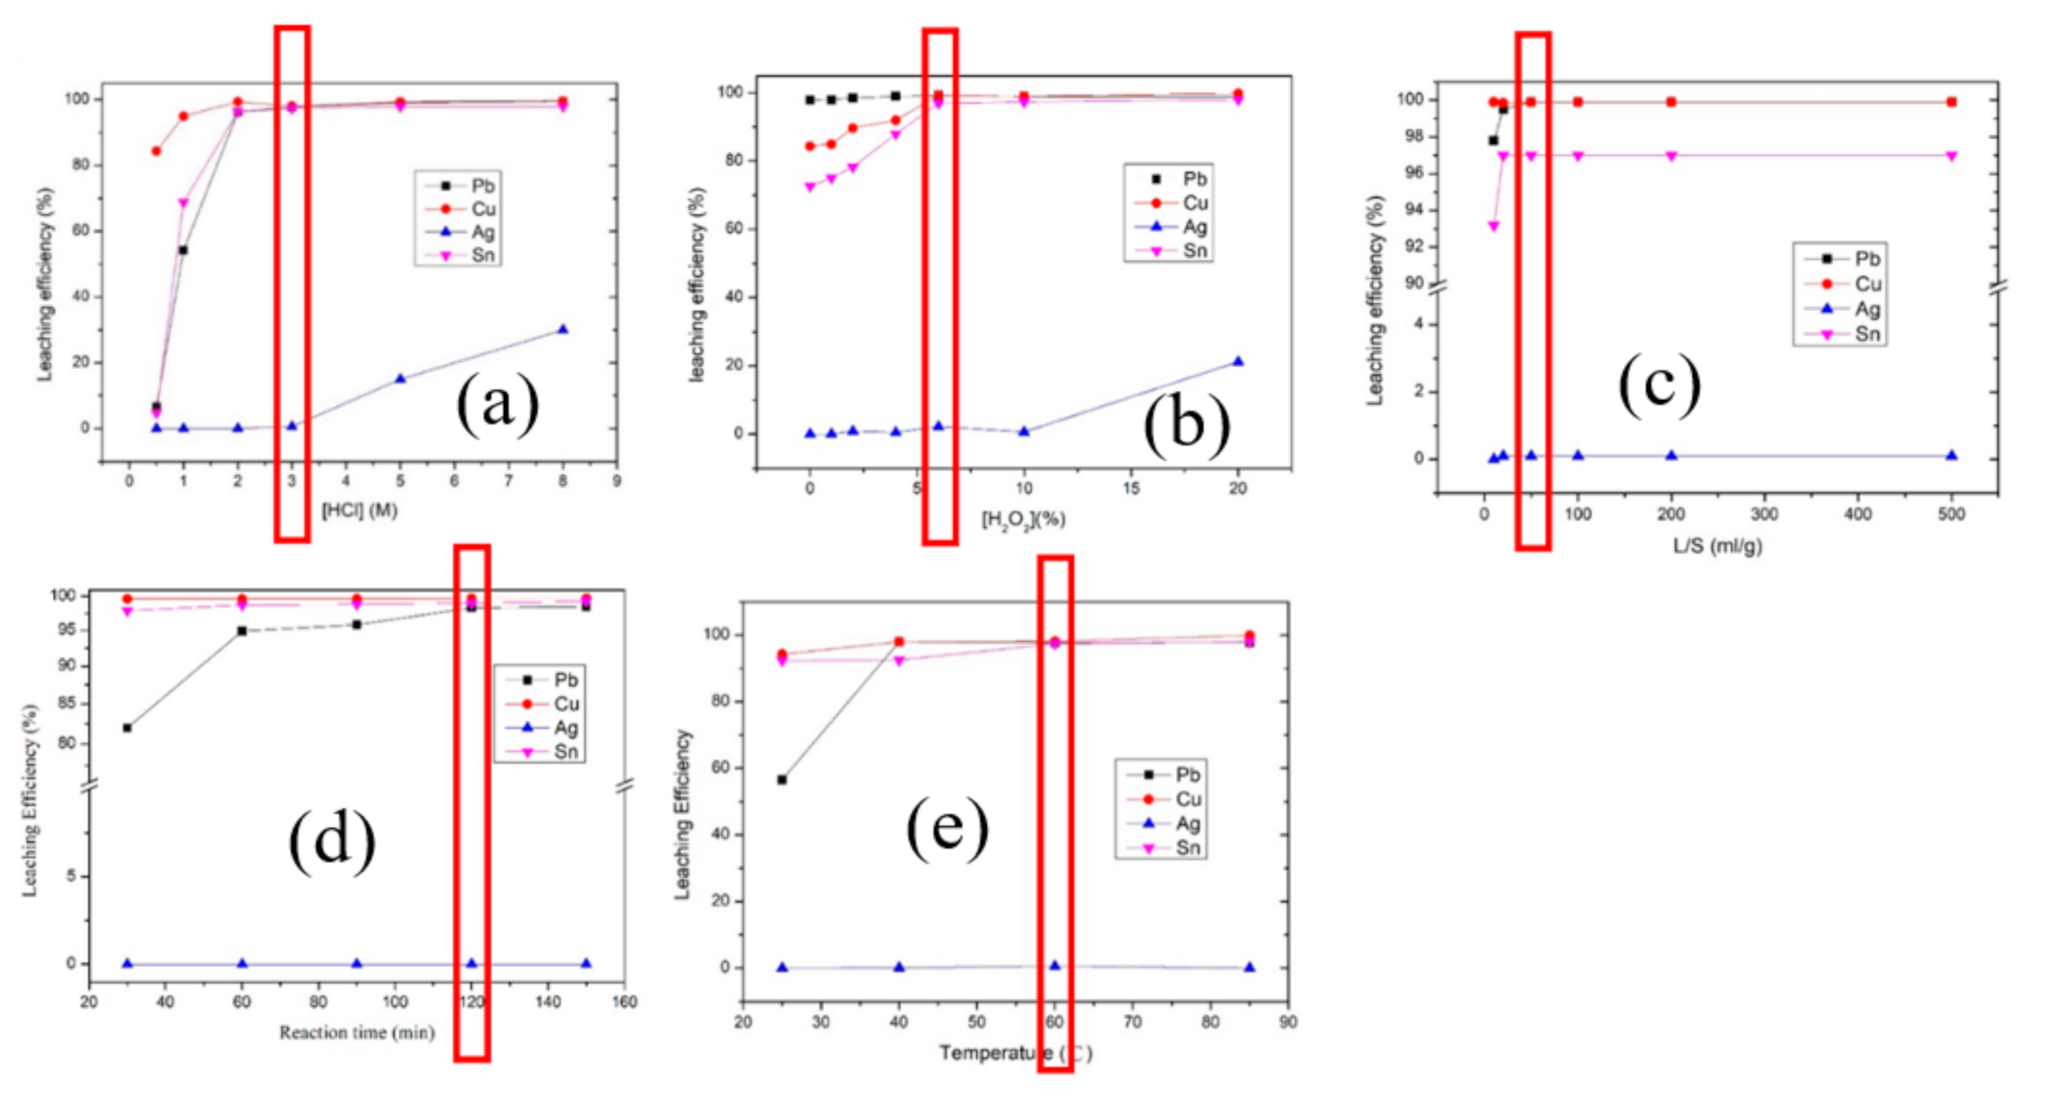
Figure 1c shows the method for recovering PV ribbons. This study provided three methods to separate the coating layer from ribbons and ionized metals for the metal separation process. Hydrochloric acid was employed to leach PV ribbon. Ag was separated from other metals by halogenating to AgCl and the AgCl was immersed by nitric acid for purifying. To optimize the experimental condition for effective leaching, this study was made carrying different process parameters viz. time (0.5–4 h), temperature (25–85 °C), liquid–solid ratio, and acid concentration (0.5–6 M).
The leaching efficiency of metal was calculated by the equation below:
X % = V c C x M W x × 100 % .
X% = leaching efficiency, M = the weight of the sample (g), Vc = the volume of the liquid(L), Wx = target metals weight fraction (wt%).
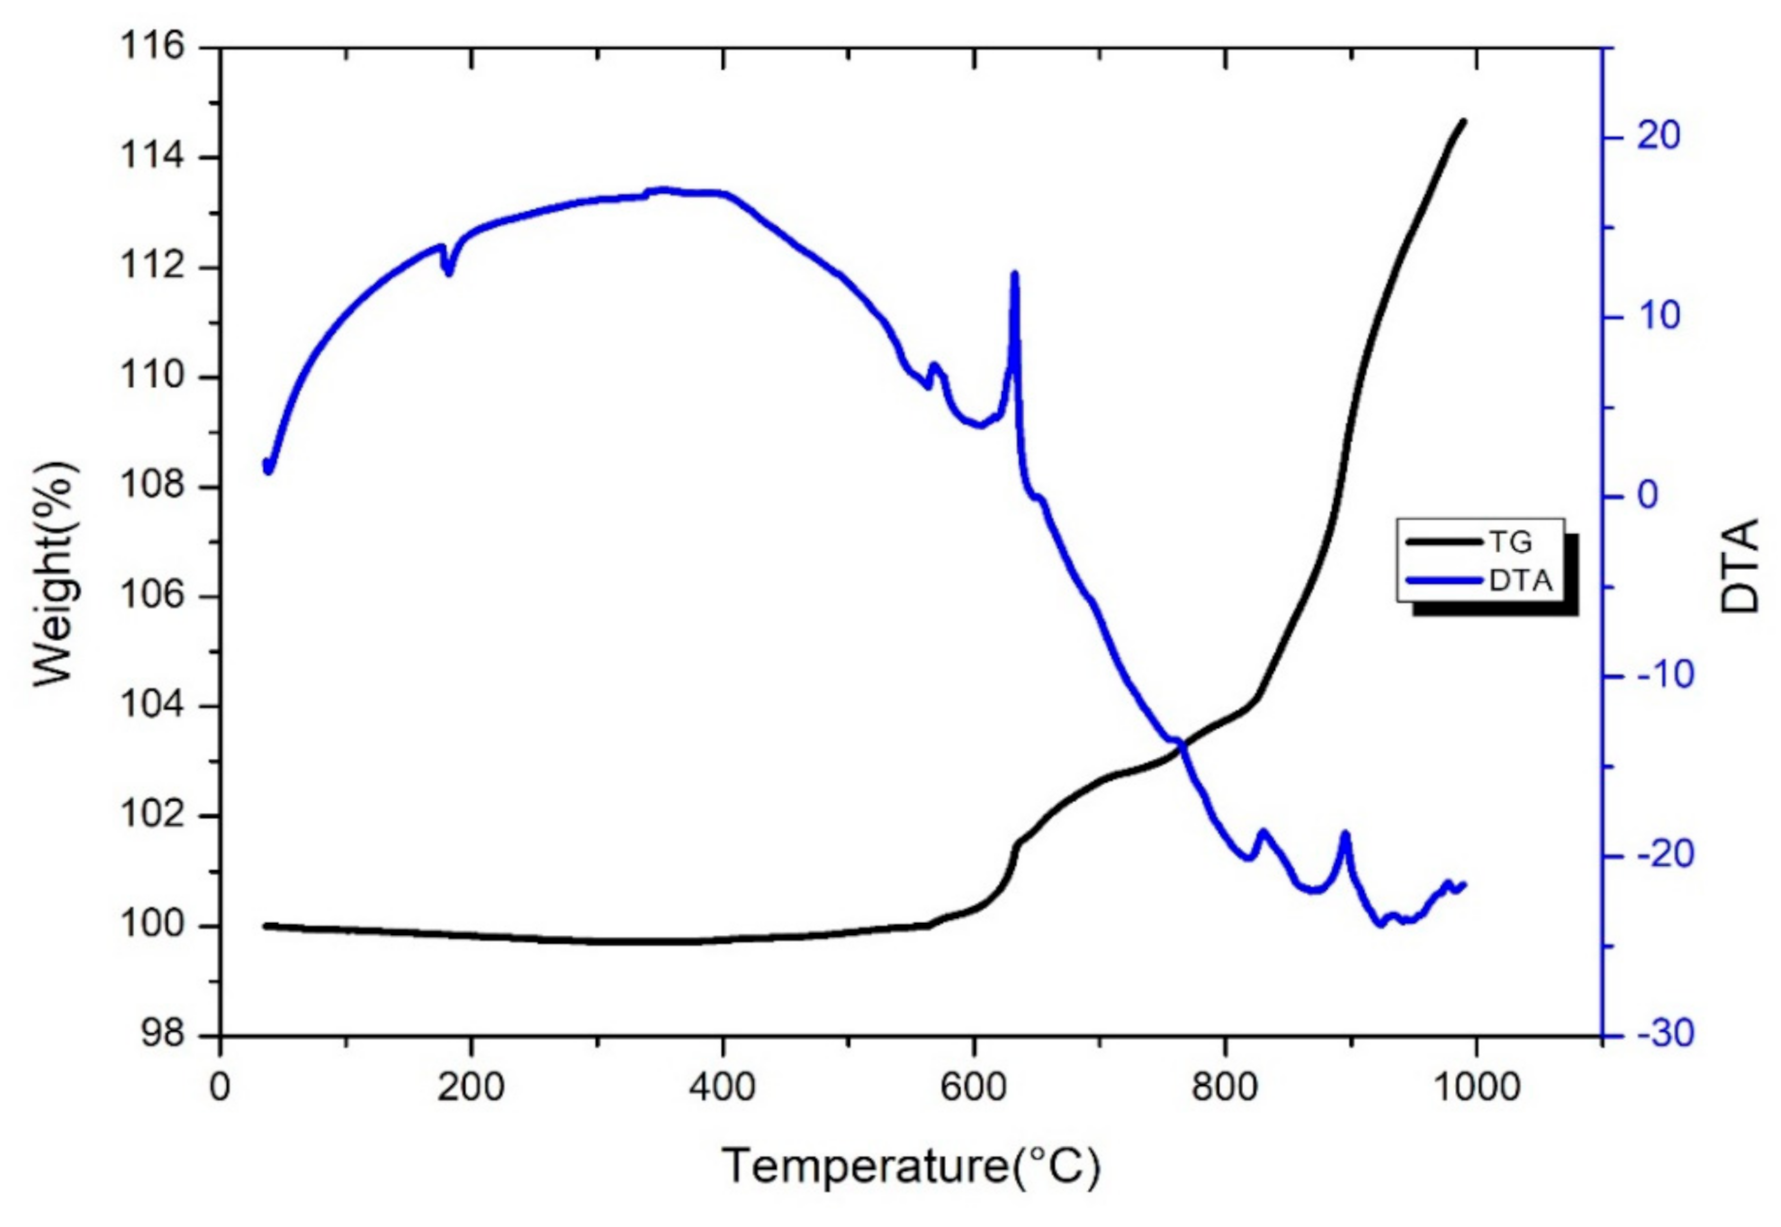
According to the structure, this section polished the coating Pb-Sn layer from copper wire in chemically and physically way individually, then compare the effect. Thermogravimetry Analysis. Differential Thermal Analysis (TG/DTA, NETZSCH-409PC, Linseis, Selb, Germany) was employed to evaluate the oxidation point of the PV ribbon to oxidize the coating layer for polishing.
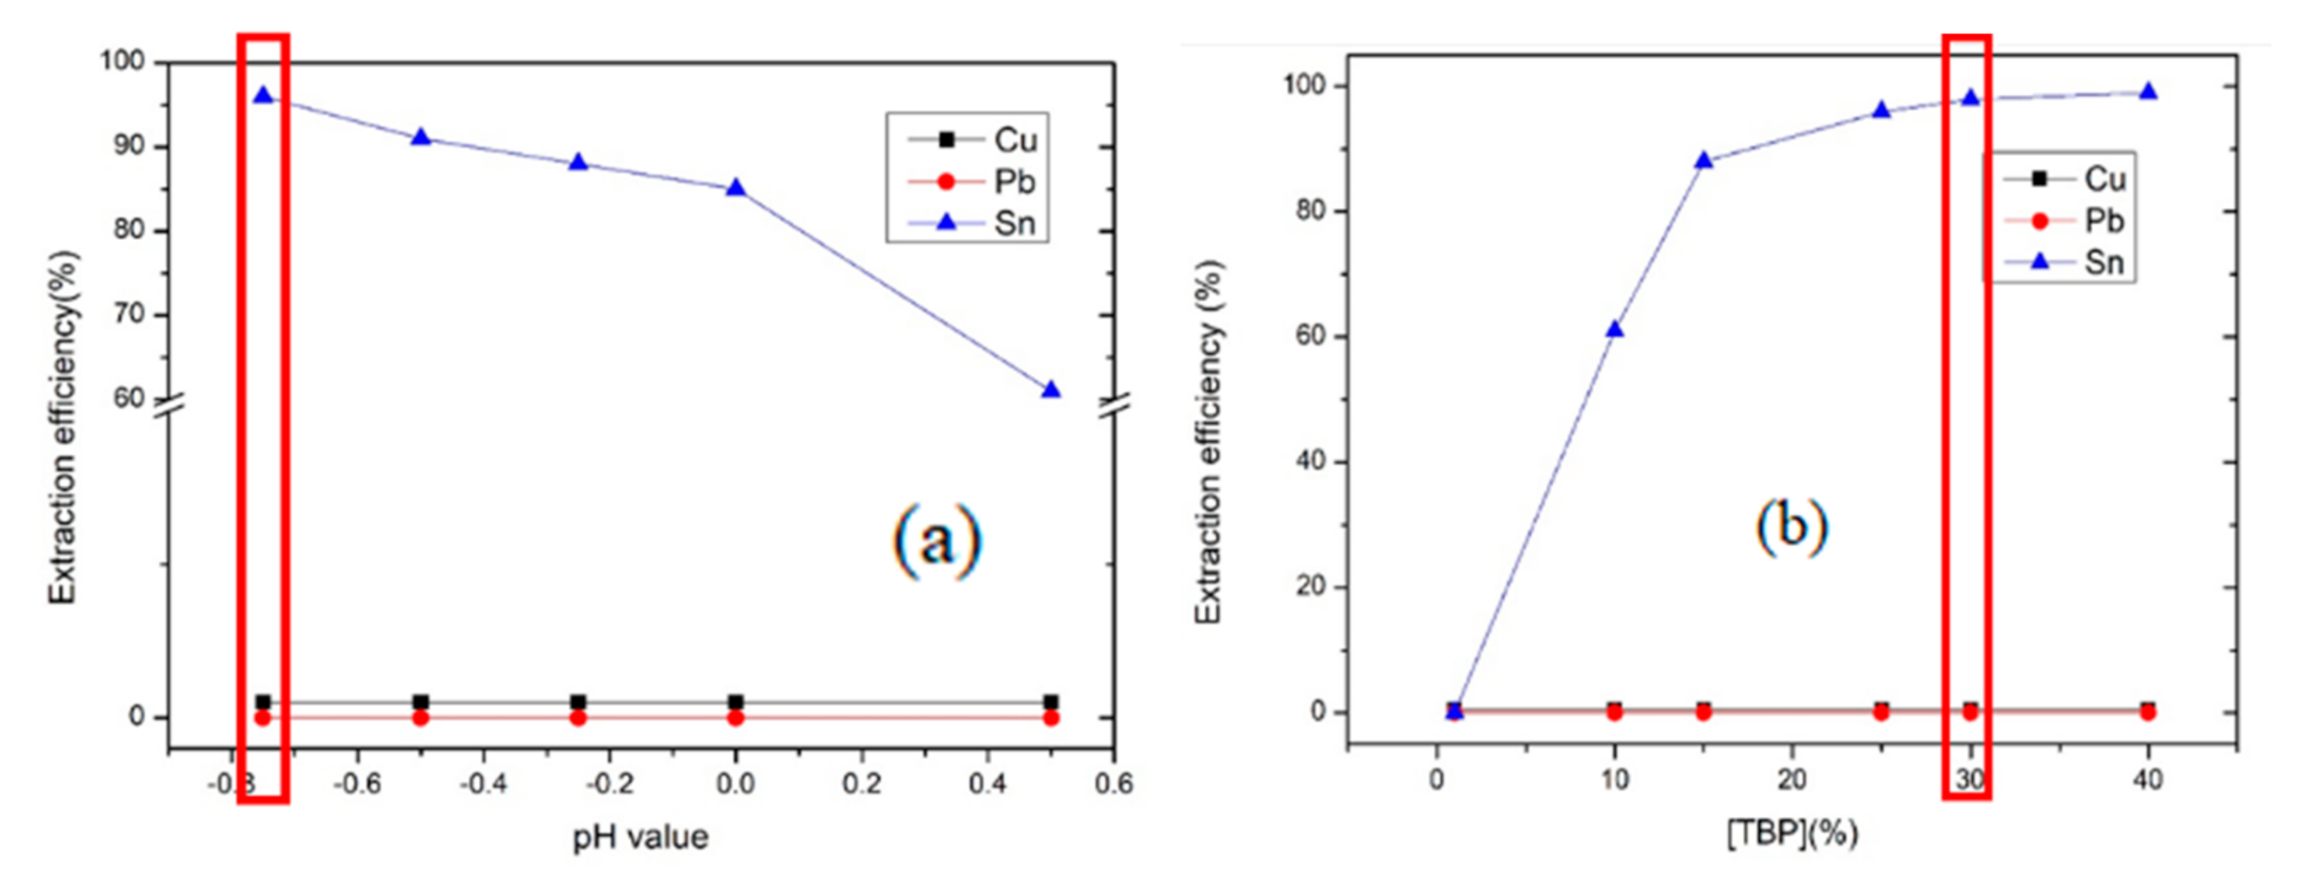
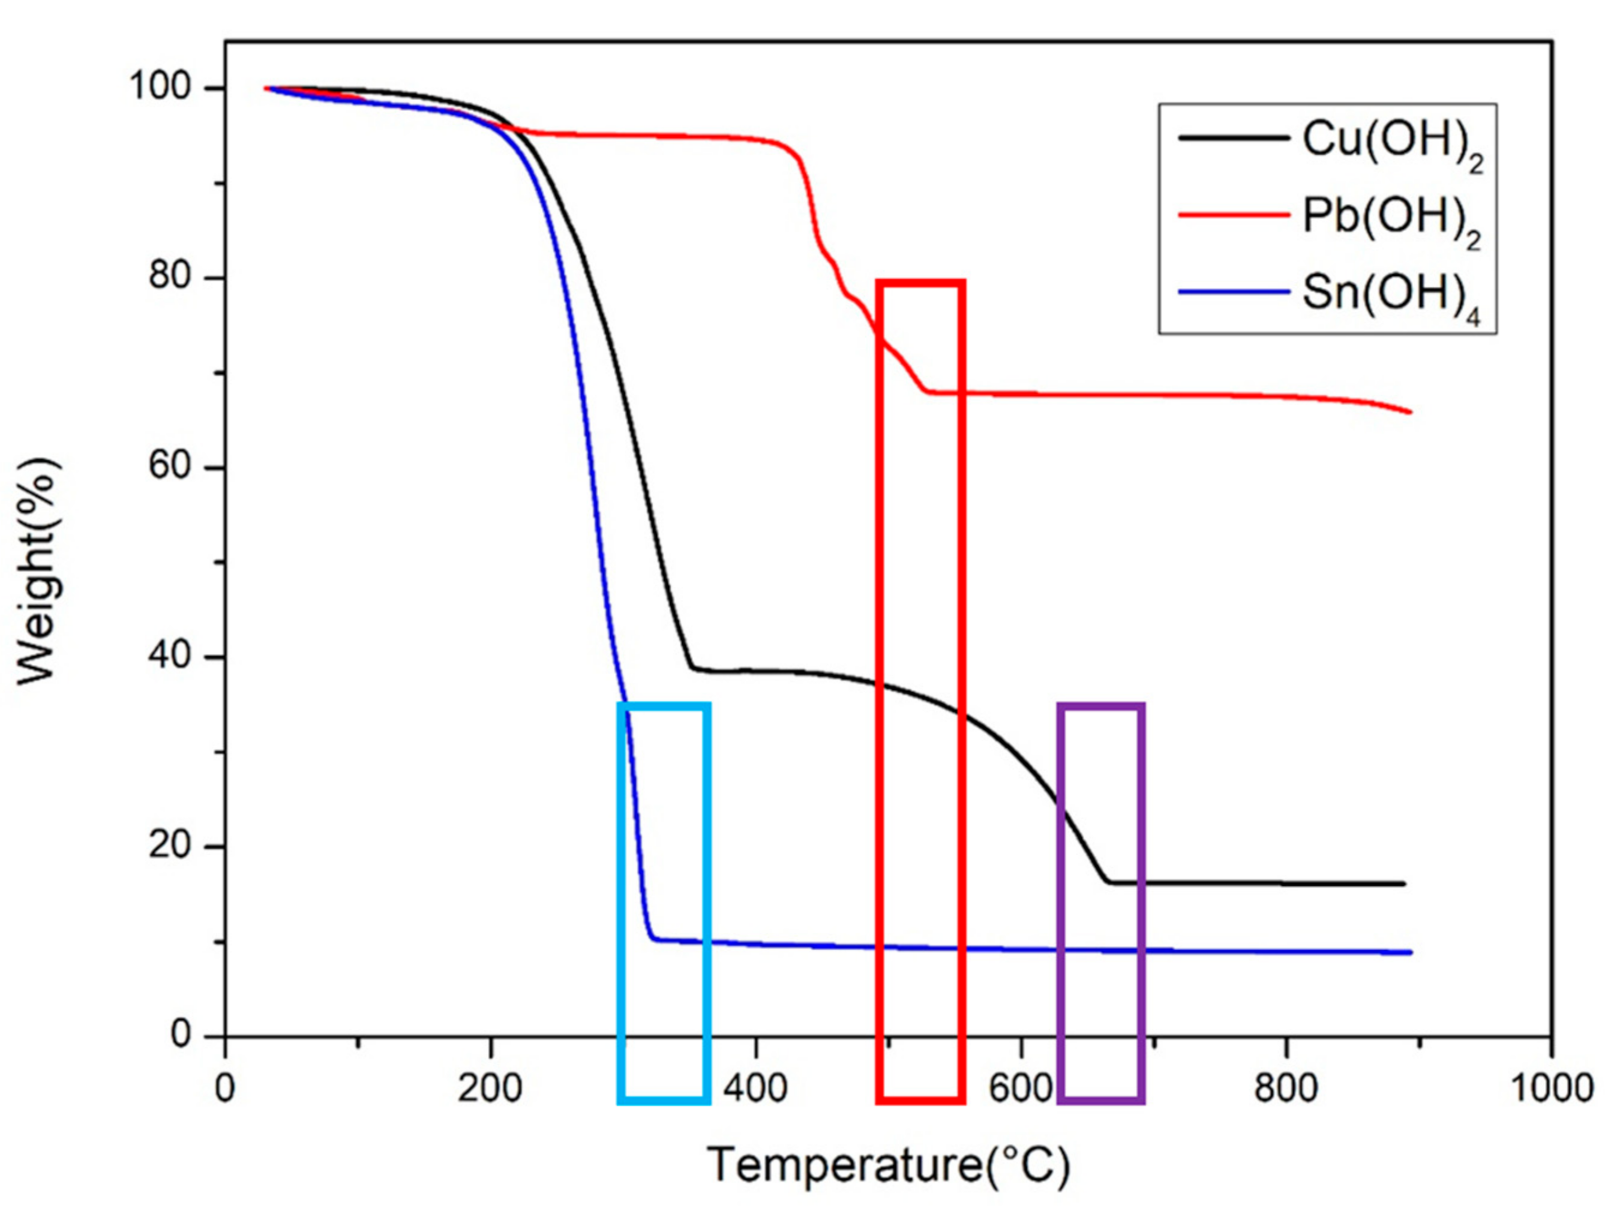
After pretreatment, metals including Cu, Pb, and Sn were ionized into liquid. In this study, both TBP and LIX984N were diluted into kerosene and used as the extractant to separate Cu, Pb, and Sn. The extraction process was divided into two steps. The first step of extraction was operated by TBP to extract Sn from liquid and strip it with nitric acid. The extraction efficiency of TBP is mainly controlled by the concentration of coordination complex of Sn and Cl ions which means that the high concentration of H+ has less effect in this extractant. Thus, this step can nearly not control the pH value of the leaching reagent to get the best efficiency because the reagent containing concentrated Cl already. The second step of extraction was operated by LIX984N to extract Cu from liquid and strip it with sulfuric acid. LIX984N is a chelated extractant. The extraction efficiency of LIX984N is mainly controlled by the affinity between Cu ion and the extractant. Thus, the chelated extractant such as LIX984N always shows good extraction efficiency on some specific ions. The optimal parameters of extraction including pH value (adjusted by hydrochloric acid and ammonia), concentration of extractant, aqueous–oil ratio, reaction time and the optimal parameters of stripping including reagent concentration, oil-aqueous ratio, reaction time were investigated. After metal separation methods, metal oxides can be received through concentration and calcination. Silver can be received through concentration and reduction. The final products were CuO, PbO, SnO2, and Ag. The purity and composition crystal phase of the product would be investigated also. Ion concentrations in this study were investigated by ICP-OES.

3. Results

Figure 2 shows the SEM-EDS figure and the component of PV cells. Most of the impurities of PV cells are on the surface. To recycled high purity of silicon from the waste solar module, the properties of the recycled wafer should be nearly identical to the new one. The metal coating was removed by two-step leaching process. Figure 3 shows the optimized parameters of first step leaching. The first step leaching employed 5 M nitric acid in liquid–solid ratio 25 mL/g, and reaction timed an hour with reaction temperature 80 °C. In the first step leaching, 99.4% of Ag and 76% of Al were removed from the cell. Al-Si compounds on the back side of cells required the second step leaching to remove.

3.1. PV Cells Purification by Removing the Metal Coating Layer

Figure 2 shows the SEM-EDS figure and the component of PV cells. Most of the impurities of PV cells are on the surface. To recycled high purity of silicon from the waste solar module, the properties of the recycled wafer should be nearly identical to the new one. The metal coating was removed by two-step leaching process. Figure 3 shows the optimized parameters of first step leaching. The first step leaching employed 5 M nitric acid in liquid–solid ratio 25 mL/g, and reaction timed an hour with reaction temperature 80 °C. In the first step leaching, 99.4% of Ag and 76% of Al were removed from the cell. Al-Si compounds on the back side of cells required the second step of leaching to remove.
Figure 4 shows the optimal parameters of second step leaching. The second step leaching employed 1 M KOH in liquid–solid ratio 50 mL, reaction times an hour, reaction temperature 80 °C. The concentration of metal impurity in silicon purification process is shown in Table 2. Figure 5 shows the SEM-EDS diagram of PV cells after the treatment. These two steps of chemical leaching could produce nearly 3N Si (99.84%), and the recovery rate of Si was 99.9%. Most of the metal components, silicon nitride, and aluminum print electrodes were removed from the cell. However, 1 M KOH infiltrated 0.03% of K in silicon, which caused the impurity issue. Comparing with other research etching by HF [10,11], this research takes more reaction time than the treatment with hydrogen fluoride (HF). However, the application of nitric acid and KOH treatment still obtained near to 99.9% of silicon which is closed to the treatment with HF.

3.2. Metal Separation and Purification of the PV Ribbon

3.2.1. Pretreatment of PV Ribbon Separation by Leaching

Figure 6 shows the SEM-EDS diagram and component of the PV ribbon. According to the structure of the ribbon, Pb-Sn alloy, and Ag coated copper wire surface, this research operated two ways including leaching the ribbon then operating metal separation or removing the coating layer then collected copper wire. Figure 7 shows the optimized parameters of leaching the PV ribbon. Three moles of hydrochloric acid with 6% of H2O2 could initially separate Ag from other metals in liquid–solid ratio 50 with reaction times 60 °C and reaction temperature 60 °C. The leaching efficiencies of leaching PV ribbons were 99.65% of Cu, 98.3% of Pb, 99% of Sn, and 0% of Ag.

3.2.2. Pretreatment of PV Ribbon Metal Separation by Removing Coating Layer

The method to collect copper wires can be classified according to the separation method including chemical and physical ways. The chemically way was an extension of the former leaching treatment. The same leaching reagent was employed to separate coating layers from the ribbon by optimizing reaction times. 90s reaction time shown in Figure 8a was chosen because of the selectivity of copper (leaching efficiency 80.8% of Pb, 99.3% of Sn, and 10% of Cu). Based on Sang Hyeon Choi’s research [21], Pb(II) ion generally relies on the precipitation of PbCl2 in diluted Cl solvent. However, concentrated Cl ion in oxidation condition can effectively increase the leaching ability of Pb. To remove more lead from the ribbon, the concentration of Cl was also optimized by adding NaCl. The result (Figure 8b) shows that adding 1.5 M of Cl ion can increase the leaching efficiency of lead from 80.2% to 99.9%. The purity of 99.56% of copper wire was obtained after the chemically treatment.
The physically way for removing coating layer was operated by using oxidation method to oxidize the coating layer and polish the layer from ribbon. The oxidation of PV ribbon has been conducted in 1 atm air at different temperatures from 20 °C to 1000 °C using thermogravimetric and differential thermal analysis (TG/DTA) to find suitable temperatures at which the coating layer totally was oxidized. There are two obviously weight change on 600 °C and 830 °C shown on TG/DTA figure of PV ribbon (Figure 9). The first peak of weight changing suggested that the coating layer started to oxidize, and the second peak referred the oxidation of copper wire started to oxidize. In this case, this study set the oxidation method parameter as 800 °C to oxidize the coating layer. After oxidation, the ribbon was polished. Twenty-seven percent of weight was polished and the purity of copper wire was 99.63% in the end. Table 3 shows the purities and the component of two coating layer removing method. The physical separation method obtained 99.63% of copper wire that was better than optimizing reaction time. Moreover, the physical treatment cost less than the chemical treatment. Comparing two ways to remove coating layer, optimizing reaction times has less purity than the physical separation because of sodium infiltrating. However, comparing with the physical separation, optimizing reaction times shows more potential to removing metallic component.

3.2.3. Extraction of Leaching Solution after PV Ribbon Pretreatment

After the pretreatment, this research ionized Cu, Sn, and Pb in the leaching solution. To separate metals individually, two steps of extraction process including TBP system and LIX984N system were employed. The extraction efficiency is described as
e x t r a c t i o n   e f f i c i e n c y = 1 c o n c e n t r a t i o n   a f t e r   e x t r a c t i o n c o n c e n t r a t i o n   b e f o r e   e x t r a c t i o n × 100 %   .
The reaction equation of both extractant is described as
S n C l 4 ( H 2 O ) 5 a q + n T B P o r g S n C l 4 ( H 2 O ) 5 n T B P n o r g + n H 2 O
C u a q 2 + + 2 H A o r g C u A 2 , o + 2 H a q + .
As the equation showing upon, the Sn extraction efficiency is controlled by the properties of the tetrachloro complex and TBP. Moreover, the leaching solution in this research contained concentrated Cl ions which is easy to produce the environment for Sn to transfer to tetrachloro complex. Figure 10a reveals the high efficiency of TBP extracting tin from liquid in concentrated acid solution. That indicated the feasibility to separate tin via the concentration of hydrochloride acid. In addition, the extraction efficiency affected by different extractant concentration, aqueous-organic ratio, and reaction time was also investigated. Figure 10b shows that 30% of TBP is appropriate to extract tin from the solution. Figure 10c shows the extraction efficiency by optimizing the aqueous–organic ratio. Aqueous–oil ratio (A / O) 0.5 shows the best extraction parameter (99.9%). However, the high separation factor of Sn/Cu (315.53) and Sn/Pb (9570.1) indicated that A/O ratio 10 can concentrate more tin but less copper and lead coextract than A/O 0.5 can. However, there was only 86.22% leaching efficiency at A/O 10. The extraction efficiencies of tin extraction were Sn 86.22%, Pb 0.6%, and Cu 2%. To increase the recovery rate of tin, this study operated a McCable–Thiele Diagram for multi-stage extraction research. Figure 10e shows that after three stages of extraction, the efficiency should be 99.9%. This research set three-stage extraction as the optimal parameter.
After TBP extraction, the leaching solution remained Pb and Cu for the following method. LIX984N was employed to extract Cu from the liquid. Although the extraction efficiency of LIX984N is mainly controlled by the affinity between Cu ion and the extractant. The hydroxyl group from the extractant release H+ to balance the voltage. As the equation shown upon, it demonstrates that the feasibility to separate copper via the H+ controlling. Figure 11a reveals the high efficiency of copper at pH = 1 but also extracted 30% of Pb simultaneously. This situation was concerned with the over addition of extractant. Figure 11b shows that if the extractant concentration declined to 5%, the problem of coextraction would be solved. Therefore, this research set 5% of extractant as the optimal parameters. The optimal parameter of A / O ratio was set as 1 because the efficiency declined after increasing the A / O to more than 2. LIX984N is an effective extractant for copper. Figure 11d shows that the reaction time of extracting copper only take 30 s to complete. This research set reaction time 30 s as the optimal parameter. Table 4 shows the optimal parameters of both extraction processes.
After the solvent extraction, the separated copper and tin in organic phase continued the stripping process for chemical precipitation in aqueous phase. Table 5 shows the optimal parameter of both extractants. One mole of nitric acid and three moles of sulfuric acid were employed to strip tin and copper from the organic phase. The stripping efficiency was determined by the metal concentration related to extraction and after stripping analyzed by ICP-OES as
s t r i p p i n g   e f f i c i e n c y = c o n c e n t r a t i o n   a f t e r   s t r i p p i n g c o n c e n t r a t i o n   b e f o r e   e x t r a c t i o n c o n c e n t r a t i o n   a f t e r   e x t r a c t i o n × 100 % .

3.3. Characteristic Analysis of the Product

3.3.1. Analysis of Silver

The Ag residue after PV ribbon pretreatment was leached by 5 M nitric acid from PV cell purification. Ag+ ion was precipitated by sodium chloride to separate with aluminum ion in AgCl state. Sodium hydroxide was employed to transfer AgCl to silver oxide (Ag2O) and silver oxide was reduced by dextrose. The purity and recovery rate of Ag are 98.85% and 99.7% respectively.

3.3.2. Characteristic Analysis of CuO, SnO2, and PbO

Cu2+, Sn4+, and Pb2+ ions after metal separation process via extraction and stripping would transfer to copper sulfate, stannic nitrate, and lead perchlorate solution. Ammonia was conducted to obtain three metal hydroxides respectively. The residues after precipitation was screened for calcination to obtain the oxide products. The metal hydroxides were analyzed by TGA when the temperature increased from 25–1000 °C. Figure 12 shows the TGA of Cu(OH)2, Sn(OH)4, and Pb(OH)2. The status reveals that the temperature after 700 °C can dehydrated these three hydroxides, and the temperature was checked at 700 °C for Cu(OH)2, 400 °C for Sn(OH)4, and 550 °C for Pb(OH)2 to transform into metal oxides. X-ray diffraction (XRD, Haoyuan DX-2000) and ICP-OES were employed to analyze characterization and purity of the final products. The XRD diagrams make sure that the products were CuO, SnO2, and PbO as shown in Figure 13. The products were dissolved in aqua regia to survey the impurities using ICP-OES. The mass fraction of impurities in the products are shown in Table 6, and the purities of copper, tin, and lead are 99.7%, 99.47%, and 99.68% respectively. Moreover, the recovery rate of copper, tin, and lead are 98.5%, 96.5%, and 88.9% respectively.

4. Conclusions

  • PV cell contains Si 93.38%, Al 5.25%, and Ag 0.91%. Five moles of nitric acid and one mole of potassium hydroxide were employed to silicon purification two-step leaching. 99.7% of silver and 98.9% of aluminum were dissolved and separated. The purity of silicon was 99.84%.
  • PV ribbon contains Cu 79.6%, Pb 5%, Sn 8.64%, and Ag 3.02%. 3 M HCl can initially separate silver from other metals. After optimizing the parameters, chemical polishing can obtain 99.57% copper wire, and physical polishing can obtain 99.63%.
  • Extraction efficiency of tin was 86.22% and concentrated 8 times of tin in TBP, and McCabe–Thiele Diagram showed that 3 step extraction can extract 99.9% of tin. Extraction efficiency of copper was 99.4% in LIX984N.
  • The purities of final products in this research are 98.85% of silver, 99.7% of CuO, 99.47% of PbO, and 99.68% of SnO2, and the recovery rates of each are 98.5%, 96.5%, and 88.9% respectively.
  • This study provides the separation and purification of Si, Ag, Cu, Sn, and Pb from waste PV cell and ribbon for supplying source manufacturers and contributes to recycling end-of-life PV modules.

Author Contributions

Conceptualization, W.-S.C., Y.-L.C., and Y.-J.C. (Yen-Jung Chen); methodology, C.-H.L., Y.-A.C., and Y.-J.C. (Yen-Jung Chen); data curation, Y.-J.C. (Yen-Jung Chen) and Y.-J.C. (Yi-Jin Cheng); investigation, Y.-C.W.; writing—original draft preparation, Y.-J.C. (Yen-Jung Chen); writing—review and editing, Y.-J.C. (Yen-Jung Chen) and. F.-W.L. All authors have read and agreed to the published version of the manuscript.

Funding

This research received no external funding.

Acknowledgments

This work was supported by Laboratory of Resource Circulation in Dept. of Resources Engineering, National Cheng-Kung University.

Conflicts of Interest

The authors declare no conflict of interest.

References

  1. Williams, R. Becquerel Photovoltaic Effect in Binary Compounds. J. Chem. Phys. 1960, 32, 1505–1514. [Google Scholar] [CrossRef]
  2. Fraunhofer Institute for Solar Energy Systems (ISE). Photovoltaic Report. Available online: https://www.ise.fraunhofer.de/content/dam/ise/de/documents/publications/studies/Photovoltaics-Report.pdf (accessed on 1 April 2021).
  3. International Renewable Energy Agency. Renewable Capacity Statistics 2020 International Renewable Energy Agency (IRENA). 2020. Available online: https://irena.org/-/media/Files/IRENA/Agency/Publication/2020/Mar/IRENA_RE_Capacity_Statistics_2020.pdf (accessed on 1 April 2021).
  4. Doi, T.; Tsuda, I.; Unagida, H.; Murata, A.; Sakuta, K.; Kurokawa, K. Experimental study on PV module recycling with or-ganic solvent method. Sol. Energy Mater. Sol. Cells 2001, 67, 397–403. [Google Scholar] [CrossRef]
  5. Klugmann-Radziemska, E.; Ostrowski, P.; Drabczyk, K.; Panek, P.; Szkodo, M. Experimental validation of crystalline silicon solar cells recycling by thermal and chemical methods. Sol. Energy Mater. Sol. Cells 2010, 94, 2275–2282. [Google Scholar] [CrossRef]
  6. Kang, S.; Yoo, S.; Lee, J.; Boo, B.; Ryu, H. Experimental investigations for recycling of silicon and glass from waste photovoltaic modules. Renew. Energy 2012, 47, 152–159. [Google Scholar] [CrossRef]
  7. Lee, J.-K.; Lee, J.-S.; Ahn, Y.-S.; Kang, G.-H.; Song, H.-E.; Kang, M.-G.; Kim, Y.-H.; Cho, C.-H. Simple pretreatment processes for successful reclamation and remanufacturing of crystalline silicon solar cells. Prog. Photovoltaics Res. Appl. 2018, 26, 179–187. [Google Scholar] [CrossRef]
  8. Chang, Y.-W.; Lee, C.-H.; Popuri, S.R.; Hung, C.-E.; Liao, C.-H.; Chang, J.-E.; Chen, W.-S. Recovery of silicon copper and aluminum from scrap silicon wafers by leaching and precip-itation. Environ. Eng. Manag J. 2018, 17, 561–568. [Google Scholar] [CrossRef]
  9. Wang, T.; Hsiao, J.; Du, C. Recycling of materials from silicon vase solar cell module. In Proceedings of the 2012 38th IEEE Photovoltaic Specialists Conference, Austin, TX, USA, 3–8 June 2012. [Google Scholar]
  10. Frisson, L.; Lieten, K.; Bruton, T.; Declercq, K.; Szlufcik, J.; De Moor, H.; Gorts, M.; Benali, A.; Aceves, O. Recent Improvements in Industrial PV Module Recycling. In Proceedings of the 16th European Photovoltaic Solar Energy Conference, Glasgow, UK, 1–5 May 2000. [Google Scholar]
  11. Park, J.; Park, N. Wet etching processes for recycling crystalline silicon solar cells from end-of-life photovoltaic modules. RSC Adv. 2014, 4, 34823–34829. [Google Scholar] [CrossRef]
  12. Jung, B.; Park, J.; Seo, D.; Park, N. Sustainable system for raw-metal recovery from crystalline silicon solar panels: From no-ble-metal extraction to lead removal. ACS Sustain. Chem. Eng. 2016, 4, 4079–4083. [Google Scholar] [CrossRef]
  13. Shin, J.; Park, J.; Park, N. A method to recycle silicon wafer from end-of-life photovoltaic module and solar panels by using recycled silicon wafers. Sol. Energy Mater. Sol. Cells 2017, 162, 1–6. [Google Scholar] [CrossRef]
  14. Bombach, E.; Röver, I.; Müller, A.; Schlenker, S.; Wambach, K.; Kopecek, R.; Wefringhaus, E. Technical experience during ther-mal and chemical recycling of a 23 year old PV generator formerly installed on pellworm island. In Proceedings of the 21st European Photovoltaic Solar Energy Conference, Dresden, Germany, 4–8 September 2006. [Google Scholar]
  15. Yousef, S.; Tatariants, M.; Denafas, J.; Makarevicius, V.; Lukošiūtė, S.; Kruopienė, J. Sustainable industrial technology for recovery of Al nanocrystals, Si micro-particles and Ag from solar cell wafer production waste. Sol. Energy Mater. Sol. Cells 2019, 191, 493–501. [Google Scholar] [CrossRef]
  16. Yi, Y.K.; Kim, H.S.; Tran, T.; Kil Hong, S.; Kim, M.J. Recovering valuable metals from recycled photovoltaic modules. J. Air Waste Manag. Assoc. 2014, 64, 797–807. [Google Scholar] [CrossRef] [PubMed]
  17. Lee, J.-S.; Ahn, Y.-S.; Kang, G.-H.; Wang, J.-P. Recovery of 4N-grade copper from photovoltaic ribbon in spent solar module. Mater. Technol. 2016, 31, 574–579. [Google Scholar] [CrossRef]
  18. Kim, S.; Lee, J.-C.; Lee, K.-S.; Yoo, K.; Alorro, R.D. Separation of Tin, Silver and Copper from Waste Pb-free Solder Using Hydrochloric Acid Leaching with Hydrogen Peroxide. Mater. Trans. 2014, 55, 1885–1889. [Google Scholar] [CrossRef] [Green Version]
  19. Moon, G.; Yoo, K. Separation of Cu, Sn, Pb from photovoltaic ribbon by hydrochloric acid leaching with stannic ion followed by solvent extraction. Hydrometallurgy 2017, 171, 123–127. [Google Scholar] [CrossRef]
  20. Chen, W.S. The application of organic solvents and thermal process for eliminating EVA resin layer from waste photovoltaic modules. In Proceedings of the IOP Conference Series: Earth and Environmental Science, Seoul, Korea, 26–29 January 2019; Volume 291. [Google Scholar]
  21. Choi, S.; Yoo, K.; Alorro, R.D. Hydrochloric acid leaching behavior of metals from non-magnetic fraction of Pb dross. Geosyst. Eng. 2019, 22, 347–354. [Google Scholar] [CrossRef]
Figure 1. Method for recovering PV cells and PV ribbons. (a) Section views of c-Si PV module and the PV ribbon. (b) Immersing cells in nitric acid and potassium hydroxide for silicon purification. (c) Pretreatment and metal separation of PV ribbon.
Processes 09 00712 g001
Figure 2. SEM-EDS figure and component of PV cells.
Processes 09 00712 g002
Figure 3. The optimized parameters of first step leaching (HNO3): (a) Concentration of nitric acid, (b) liquid–solid ratio, (c) reaction time, and (d) reaction temperature.
Processes 09 00712 g003
Figure 4. The optimized parameters of second step leaching (KOH): (a) Concentration of Hydrochloric acid, (b) liquid–solid ratio, (c) reaction time, and (d) reaction temperature.
Processes 09 00712 g004
Figure 5. The SEM-EDS diagram of PV cells after purification. (a) Upon of the cell, the structures of antireflection layer, texturization were removed. (b) Back side of the cell, the structure of Al electrode was removed.
Processes 09 00712 g005
Figure 6. The SEM diagram and component of the PV ribbon.
Processes 09 00712 g006
Figure 7. The optimized parameters of PV ribbon leaching treatment: (a) Concentration of Hydrochloric acid, (b) concentration of H2O2, (c) liquid–solid ratio. (d) Reaction time, and (e) reaction temperature.
Processes 09 00712 g007
Figure 8. The optimized parameters of removing PV ribbon’s coating layer: (a) Optimizing reaction times, (b) concentration of NaCl (M), and (c) reaction temperature.
Processes 09 00712 g008aProcesses 09 00712 g008b
Figure 9. TG/DTA of PV ribbon (25–1000 °C, 10 K/min, Air).
Processes 09 00712 g009
Figure 10. Effect of tin extraction efficiency on (a) pH value, (b) concentration of TBP, (c) A/O ratio, and (d) reaction times. (e) McCable–Thiele Diagram for stimulating the stage of extraction in AO ratio 10.
Processes 09 00712 g010aProcesses 09 00712 g010b
Figure 11. Effect of copper and lead extraction efficiency on (a) pH value, (b) LIX984N concentration, (c) A/O ratio, (d) reaction time.
Processes 09 00712 g011
Figure 12. TGA analysis of the metal hydroxides.
Processes 09 00712 g012
Figure 13. XRD diagrams of CuO, SnO2, and PbO.
Processes 09 00712 g013
Table 1. The composition of the PV cell and the ribbon.
PV CellElementSiAlAgBi
wt%93.38%5.25%0.91%0.011%
PV RibbonElementCuPbSnAg
wt%79.6%5%8.64%3.02%
Table 2. The concentration of metal impurity in silicon purification process.
ElementPV Cell (ppm)1st Leaching2nd Leaching
Al567.5189.8512.82
Ca0.79250.450.19
Zn0.907N.D.N.D.
Fe0.3440.030.07
Ag98.370.590.1
Bi1.0795N.D.N.D.
KN.D.N.D.2.97
Si(purity%)93.38%98.8%99.84%
Table 3. The component of copper wire after two coating layers removing methods.
ElementCu Wire Purity
Chemical SeparationPhysical Separation
Pb0.05%0.1%
Sn0.15%0.27%
AgN.D.N.D.
Na0.23%N.D.
Cu (purity%)99.57%99.63%
Table 4. Optimal parameters of extraction process.
pH ValueConcentration of Extractant (%)A/O RatioReaction Time (min)
Tin−0.7530%10:15
Copper15%1:10.5
Table 5. Optimal parameters of stripping process.
Concentration of Stripping LiquidO/AReaction Time (min)Efficiency
TinHNO31 M11097.3%
CopperH2SO43 M11099.4%
Table 6. Mass fraction of impurities in the products.
CompoundCuOPbOSnO2CompoundAg
CuO99.7%0.152%0.11%Cu0.95%
PbON.D.99.47%0.04%Pb0.11%
SnO2N.D.N.D99.68%SnN.D.
Ag2ON.D.0.09%N.D.Ag98.85%
Al2O30.09%0.171%0.11%Al0.05%
Na2O0.18%0.098%0.06%Na0.04%
K2ON.D.0.011%N.D.KN.D.
Publisher’s Note: MDPI stays neutral with regard to jurisdictional claims in published maps and institutional affiliations.

