
Research on the Correlation between Work Accidents and Safety Policies in China

1
School of Emergency Management and Safety Engineering, China University of Mining and Technology (Beijing), Beijing 100083, China
2
City Safety Research Center Project Supervisor, Bejing Academy of Emergency Management Science and Technology, Beijing 101101, China
3
School of Mechanical-Electronic and Vehicle Engineering, Beijing University of Civil Engineering and Architecture, Beijing 102616, China
*
Author to whom correspondence should be addressed.
Processes 2021, 9(5), 805; https://0-doi-org.brum.beds.ac.uk/10.3390/pr9050805
Submission received: 5 April 2021
/
Revised: 26 April 2021
/
Accepted: 1 May 2021
/
Published: 4 May 2021
(This article belongs to the Special Issue Application of Big Data Analysis and Advanced Analytics in Sustainable Production Process)
Abstract
:In China, safety policies interfere with the occurrence of work accidents in the form of guidance and restrictions. In this study, the impact of types of safety policies on work accident prevention is quantitatively analyzed. Based on a statistical analysis of China’s safety policies and work-related accidents from 2000 to 2020, the following four policy indexes that reflect the impact of safety policies are identified: the stringency level of the policy; the scope; its technical content; and its industrial target. A vector autoregressive model (VAR) is used, and a dynamic analysis of the model is conducted with an impulse response function. The model’s degree of fit is 92.9%, the number of deaths and the number of safety policies are linearly related, and the relative error between the fitted values and the real values is approximately 5%. The negative correlation between the death rate per 100 million yuan and the stringency level, scope, technical content, and industrial targets of safety policies is first weak, then strengthened, and then weakens again over time. This study finds that the importance of safety policy indicators is different; especially, the strict safety policy has a long-term negative impact on mortality. For developing countries such as China, where the safety policy system is not yet perfect, increasing the number and implementation of safety policies can significantly improve the situation of production safety.
1. Introduction
Until recently, scholars have used qualitative and quantitative analyses to study the effect of implementing safety policies. The qualitative analysis focuses on the process and effect of policy formulation and implementation and proposes measures and suggestions for improvements. For example, there are many such studies on the Occupational Safety and Health Act (OSHA). Regarding the implementation of OSHA, Sherer and Weil [1,2] found that OSHA significantly encourages enterprises to undertake more safety-related actions, but because the act is not fully aimed at the most important factors that affect personal safety, it has not significantly reduced casualty rates. John Mendeloff [3] used time-series data to conclude that among workers covered by the OSHA, only one injury index changed significantly. Cristina et al. evaluated long-term trends in the development of occupational health and safety management in Europe through the European Survey of Enterprises of New and Emerging Risks (ESENER) [4]. In various industries, Ando, Siegrist, Lucas, and Choi.have studied the reduction in accidents due to safety policies in coal mines, road traffic, construction machinery, and offshore fisheries [5,6,7,8]. Wu et al., who studied coordination mechanisms, clearly indicated that the implementation of safety supervision must be combined with social forces such as enterprise policies and intermediary agencies [9]. Wang et al. analyzed the relationship among the government, enterprises, and the public and found that improving the public’s ability to supervise safety conditions can reduce supervision costs and curb the hidden dangers in production caused by rent-seeking behavior [10]. These studies have played a positive role in preventing production safety accidents.
Some qualitative and quantitative analyses have been used to study the impact of safety policies on accident rates. By improving existing research methods, Viscusi and Smith [11,12] used cross-sectional data to find that there is a lag in safety policies. Some scholars [13,14] have used panel data to conclude that the impacts of safety policies are complex and need to be analyzed in their specific industrial environments. At the same time, Wayne [15] found that safety policies with penalties are more effective, and their effectiveness is more obvious for small enterprises. Denison and Wayne [16,17] confirmed the negative effect of safety policies on productivity growth. Some scholars have conducted more specific research on the effect of safety policies. Li et al. found through an evolutionary game that the efficiency of safety supervision is effectively improved under an optimal dynamic reward-and-punishment scenario [18]. Abegaz applied an interrupted time series design (ITS) that more accurately estimates the effect of interventions to research evaluating the effectiveness of road safety policies [19]. Ren [20] used the Delphi method to conduct quantitative research on safety policies. Liu [21] predicted and analyzed the number of deaths due to the frequency of major accidents. According to Ma [22], the effect of safety supervision policies on coal mines differs across types of mines. Li [23] established a linear regression model between coal production and the number of deaths due to coal mining accidents. Wang [24] inspected the process by which safety policies are formulated, implemented, evaluated, and monitored. In response to the lag in policy-influenced accidents, Shi proposed an asynchronous effect hypothesis to study the time required for policy effects to occur [25].
Meanwhile, Rae and Provan [26] put forward the concept of safety clutter, which refers to the random accumulation of safety procedures, documents, roles, and activities under the banner of safety but not conducive to the safety of work because of the opportunity cost of ineffective activities. The bureaucracy of safety is also accelerating, which has led to some drawbacks of safety work, including complicating the links between institutions, relationships, and individuals, reducing the marginal benefits of safety measures, and limiting the diversity of safety work and the creativity of personnel, hindering the innovative development of safety work [27,28]. Patriarca [29] and Hollnagel [30] respectively applied the concept of elastic engineering to safety science. In order to adapt organizations and their personnel safely to emergencies, Hollnagel [31,32] developed the concept of Safety II and Provan [33] transformed safety practices through resilience engineering. Elastic engineering refers to the latest active safety management methods and tools. Therefore, it is necessary to re-study and identify the organization of critical safety systems and how to realize the organizational elements of high-level safety management under management pressure. Elasticity in “elastic engineering” refers to a characteristic that can cover the challenges and event systems faced. The opposite of elasticity is brittleness, which means that the boundary of a system is suddenly damaged when it is under pressure. The boundary condition and the designed operation condition must be carefully studied when testing the elasticity of the system. In addition, Grote [34] believes that organizations need to focus their safety risk management plans on uncertainty and establish a more balanced judgment between stability and flexibility by promoting control and accountability.
Accordingly, the data to support an assessment of safety policies are insufficient, the research on dynamic policy effects is limited, and the statistical analysis of work-related accidents is not sufficiently deep. This paper studies the characteristics of the evolution of safety policies in China, provides statistics on and classification of safety policies, and constructs a safety policy system. Qualitative and quantitative analyses of the impact of safety policies on accidents are conducted, which can be used as references in the study of the factors that influence work-related accidents, methods for controlling such accidents, and the formulation of future safety policies.
2. Materials and Methods
2.1. Safety Policy and Accident Characteristics
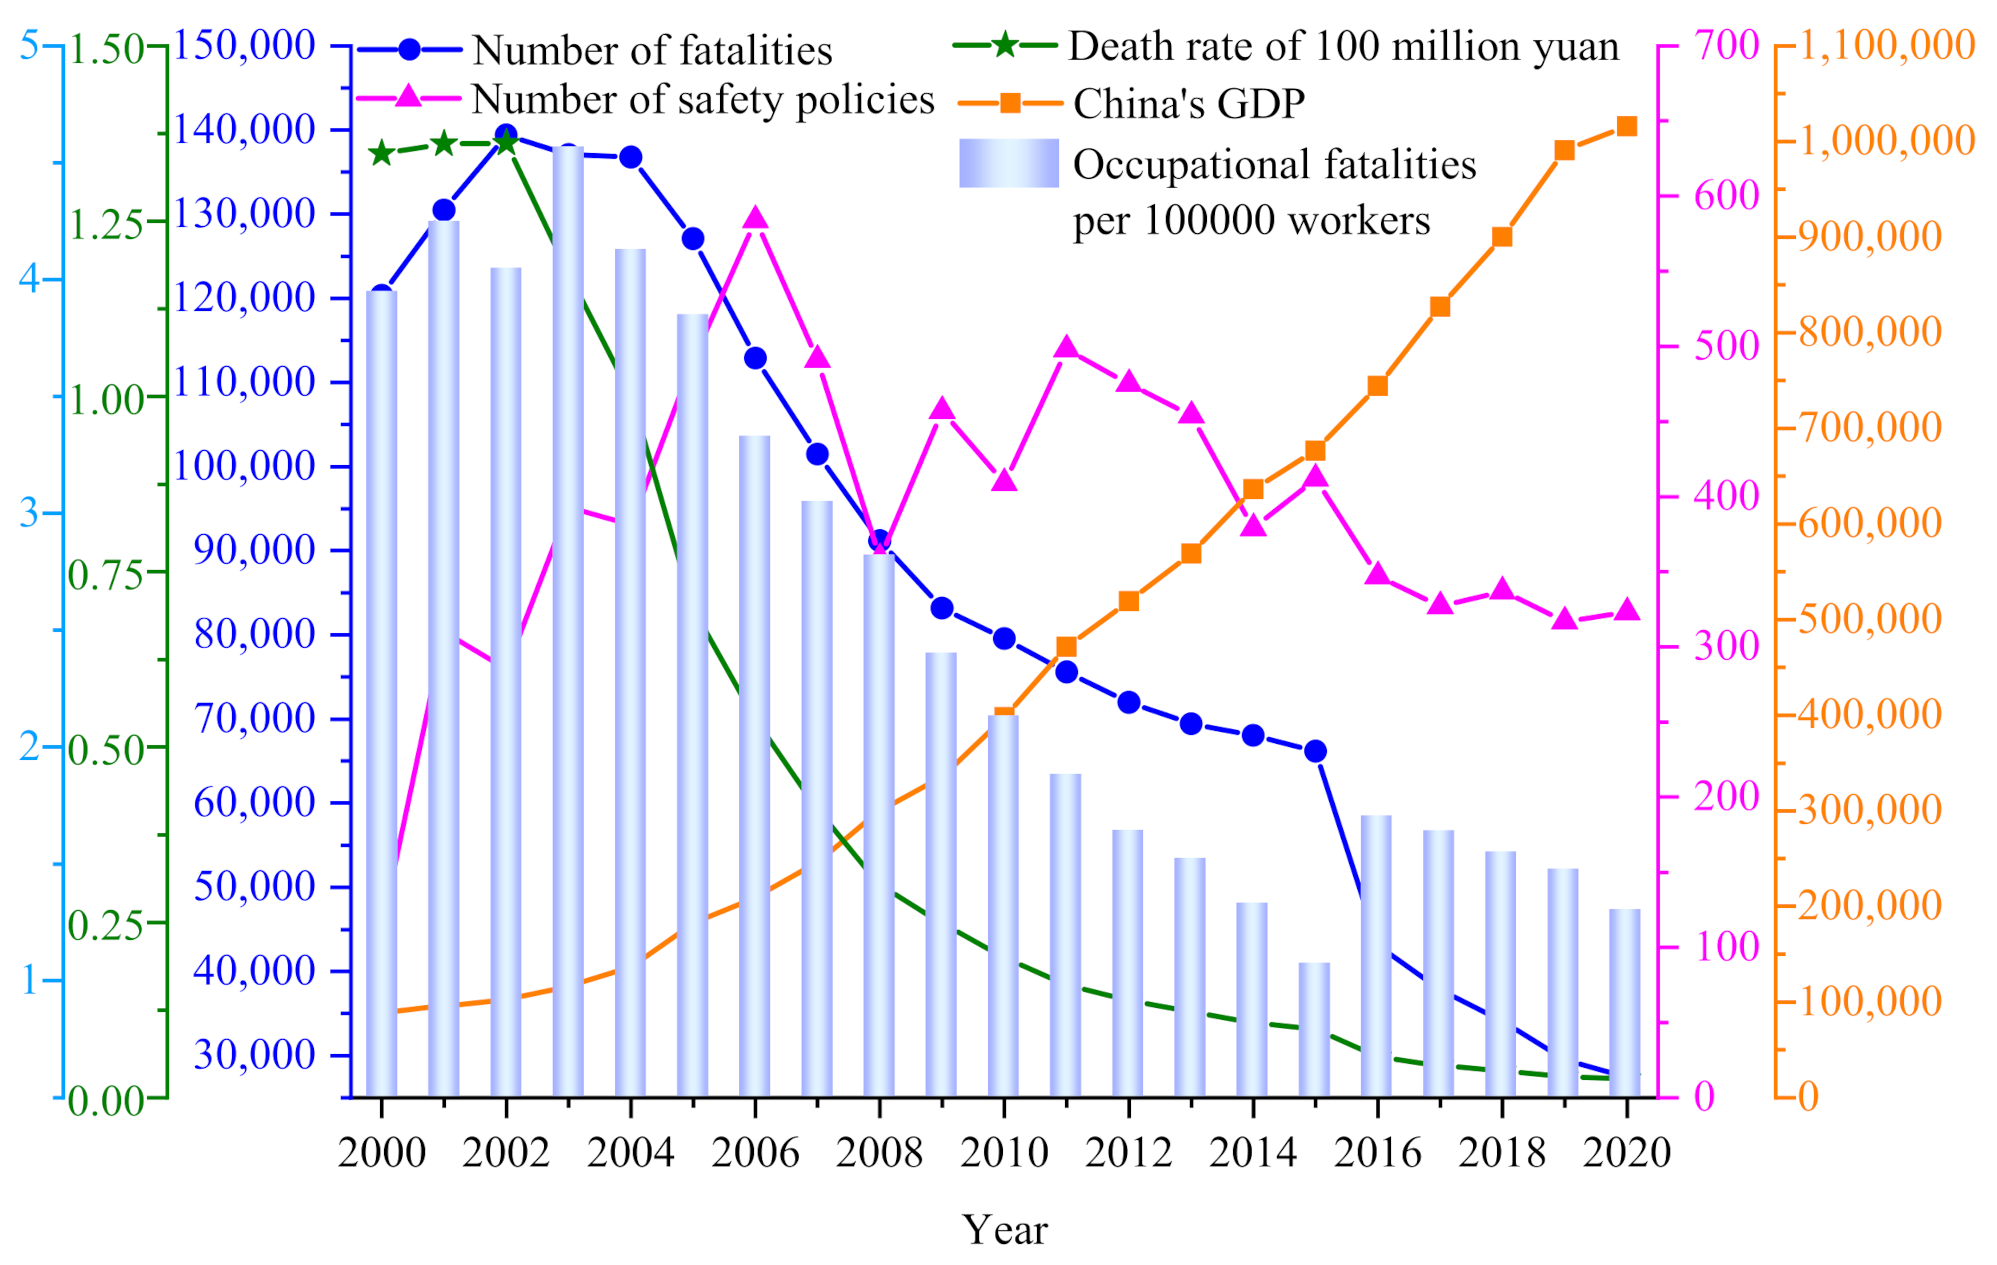
Data on 8143 safety policies, accident-related deaths, and GDP from 2000 to 2020 were collected from China’s Work Safety Yearbooks, the official website of the State Administration of Work Safety, Ministry of Emergency Management of the People’s Republic of China, China National Bureau of Statistics, and all their sub-bureaus, and plotted as time series, as shown in Figure 1. Since the production safety yearbook of China after 2017 has not yet been published, the number of safety policies after that is calculated through the official websites of the relevant government departments mentioned above, and there may be some deviation. In addition, the formulation of safety policies is a process of continuous development. Compared with the current policies, the past policies may be outdated and less applicable, but the former is often the basis and important reference of the latter. Therefore, it is not necessary to completely ignore these old policies that have played an important role in the prevention and control of accidents but to analyze them objectively. The purpose of this paper is to analyze the relationship between safety policies and accidents, so the research focuses on the number of safety policies in each year and the impact of safety policies on accidents at the same time. Deleted and outdated policies account for a very small proportion of the total policy. Even if the policy is not deleted or outdated, its best time is usually limited.
According to the figure, since 2000, China’s economy has been developing steadily and rapidly, and the number of safety policies has been on the rise. The year 2006 was a turning point for safety policies. Before 2006, the number of policies had been increased quickly. To curb the increase in accident-related deaths, China issued a large number of safety policies during this period, which rapidly expanded the number of safety policies. Afterwards, the number of policies stabilized because the early safety policies were relatively complete, and the later safety policies were complementary. The year 2002 was a turning point for accidents. Before this year, the number of deaths and the death rate per 100 million yuan increased. The reason is that China’s safety policies were relatively lacking, and its safety system was incomplete. From 2002 to 2003, China promulgated laws on work safety, road traffic safety, and occupational disease prevention and control. The implementation of these policies reduced the number of accident-related deaths. In 2003, the work safety committee of the State Council was established, and its office was set up in the Safety Supervision Bureau, which strengthened the implementation of safety policies as part of the regulation of safety systems. Through the development of these safety policies and safety system regulations, the number of accident-related deaths and death rate per 100 million yuan decreased steadily from 2003 to 2020, which reached a decrease of 35.8% relative to 2000, and the death rate per 100 million yuan decreased to 0.058, which was 4.3% of its level in 2000. The improvement in safety policies has played a significant role in reducing the number of accident-related deaths.
2.2. Construction of the Safety Policy System
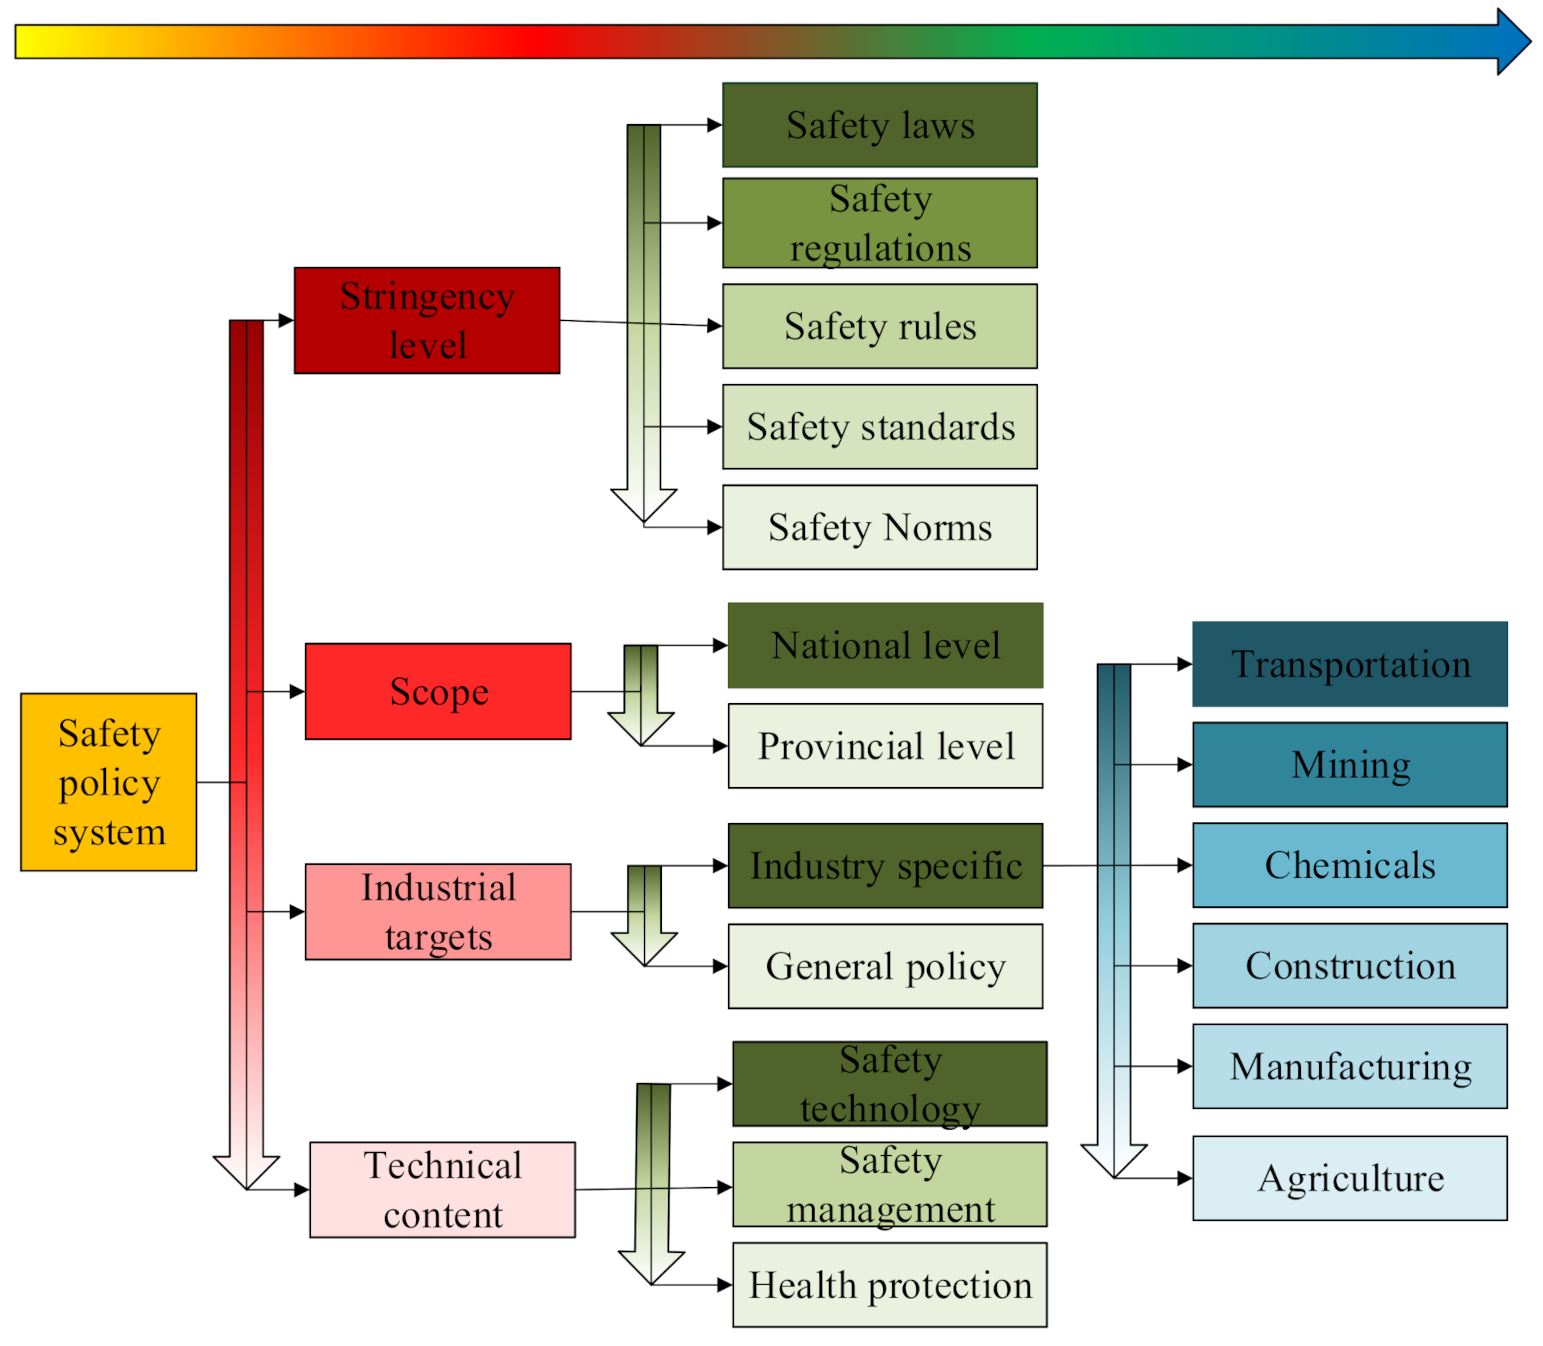
The collection of safety policies was built into a safety policy system based on safety laws and supported by safety regulations and rules, as shown in Figure 2. Safety laws are approved by the president of the state, and these laws are the core of the safety policy system, with the highest level of enforcement, which targets safety issues at their roots. Safety regulations are the second-most serious policies and are issued by the State Council. Safety rules are issued by the Ministry of Emergency Management of the People’s Republic of China, the State Administration of Work Safety, or by various other ministries and commissions. Such rules are refinements of the safety laws and regulations. Moreover, safety standards, which are provincial, industrial, and governmental documents, support the safety laws and regulations and improve the safety policy system.
2.3. Analysis of the Impact of Safety Policies on Work-Related Accidents
The number of safety policies and the number of accident-related deaths in China from 2000 to 2020 are used as variables. First, an ordinary least squares (OLS) regression model is established to conduct a quantitative analysis. Then, four policy indicator variables—stringency level, scope, technical content, and industrial targets—are developed based on the safety policy system to reflect the impact of safety policies and the effect of policy implementation on the death rate per 100 million yuan. Following the econometric theory, unit root, cointegration, and Granger tests are used to analyze the long-term relationship between the safety policy indexes and the death rate per 100 million. An impulse response function is used to analyze the model dynamically and to compare the importance of the various aspects of the policies. These results can be used in the formulation of future safety policies.
According to Figure 1, there were two obvious turning points in the trend in the number of safety policies in 2006 and 2008, and the turning point for the number of accident-related deaths occurred in 2002. If we directly segment the data used in the regression analysis, then the sample size and the accuracy will be reduced. Therefore, we create the virtual variables , , and to indicate the three turning points in 2002, 2006, and 2008.
The “turning point” in Equation (1) refers to the time when the safety policy and the trend of accident deaths suddenly change. The turning point needs to be considered in the process of mathematical modeling, which can express the difference of slope coefficient in different periods and improve the description accuracy of the phenomenon, which is a common and reasonable method in statistics.
Let be the number of accident deaths in year t and be the number of safety policies in year . Then, the initial OLS regression model is given by Equation (2).
where is the intercept, – are the regression coefficients, is the number of safety policies in 2002, namely 285, is the number of safety policies in 2006, specifically, 584, is the number of safety policies in 2008, that is, 359, and is the random error term.
Regarding the model modifications, the goodness of fit, and significance tests, Table 1 shows the significance test for the OLS regression model conducted by using Eviews10 econometric software. Table 1 shows that the regression coefficient and the modified regression coefficient are both greater than 0.9, which indicates that the model’s fit is good. The overall test is passed, which suggests that the model is well identified. Then, the model is adjusted, and the coefficients are tested for significance with tests. The associated -values for and are greater than 0.4, which are followed by the associated -values for and , which are greater than 0.1. Since is the baseline variable, the remaining three items cannot be eliminated from the model. The results are shown as model 2, and the significance is tested with and tests. The results show that the adjusted regression coefficient has increased, and the and tests have even smaller -values. The adjusted model 2 is better than model 1.
Regarding the heteroskedasticity and autocorrelation tests, the White heteroskedasticity test is conducted for modified model 2 by assuming that there is no heteroskedasticity in the random error term ut, and the results are shown in Table 2. The -value for the White heteroskedasticity test statistic is 0.351 > 0.05; therefore, we accept the null hypothesis that there is no heteroskedasticity in model 2. To test for autocorrelation in the modified model 2, the (Durbin–Watson) test is used, and the significance level is set to = 0.05. According to the DW statistical table, when the sample size = 21, the number of explanatory variables k = 4, the lower bound = 0.779, the upper bound = 1.900, and the < = 1.243 < , and whether there is autocorrelation cannot be determined. Then, the (Lagrange constant or Lagrange multiplier) test is used to select the first-order lag by assuming that the random error term ut is not first-order autocorrelated. The results are shown in Table 2. The -value of the test statistic is 0.188 > 0.05; thus, we accept the null hypothesis that model 2 does not suffer from the first-order autocorrelation. Accordingly, the model is reasonable and does not need to be revised.
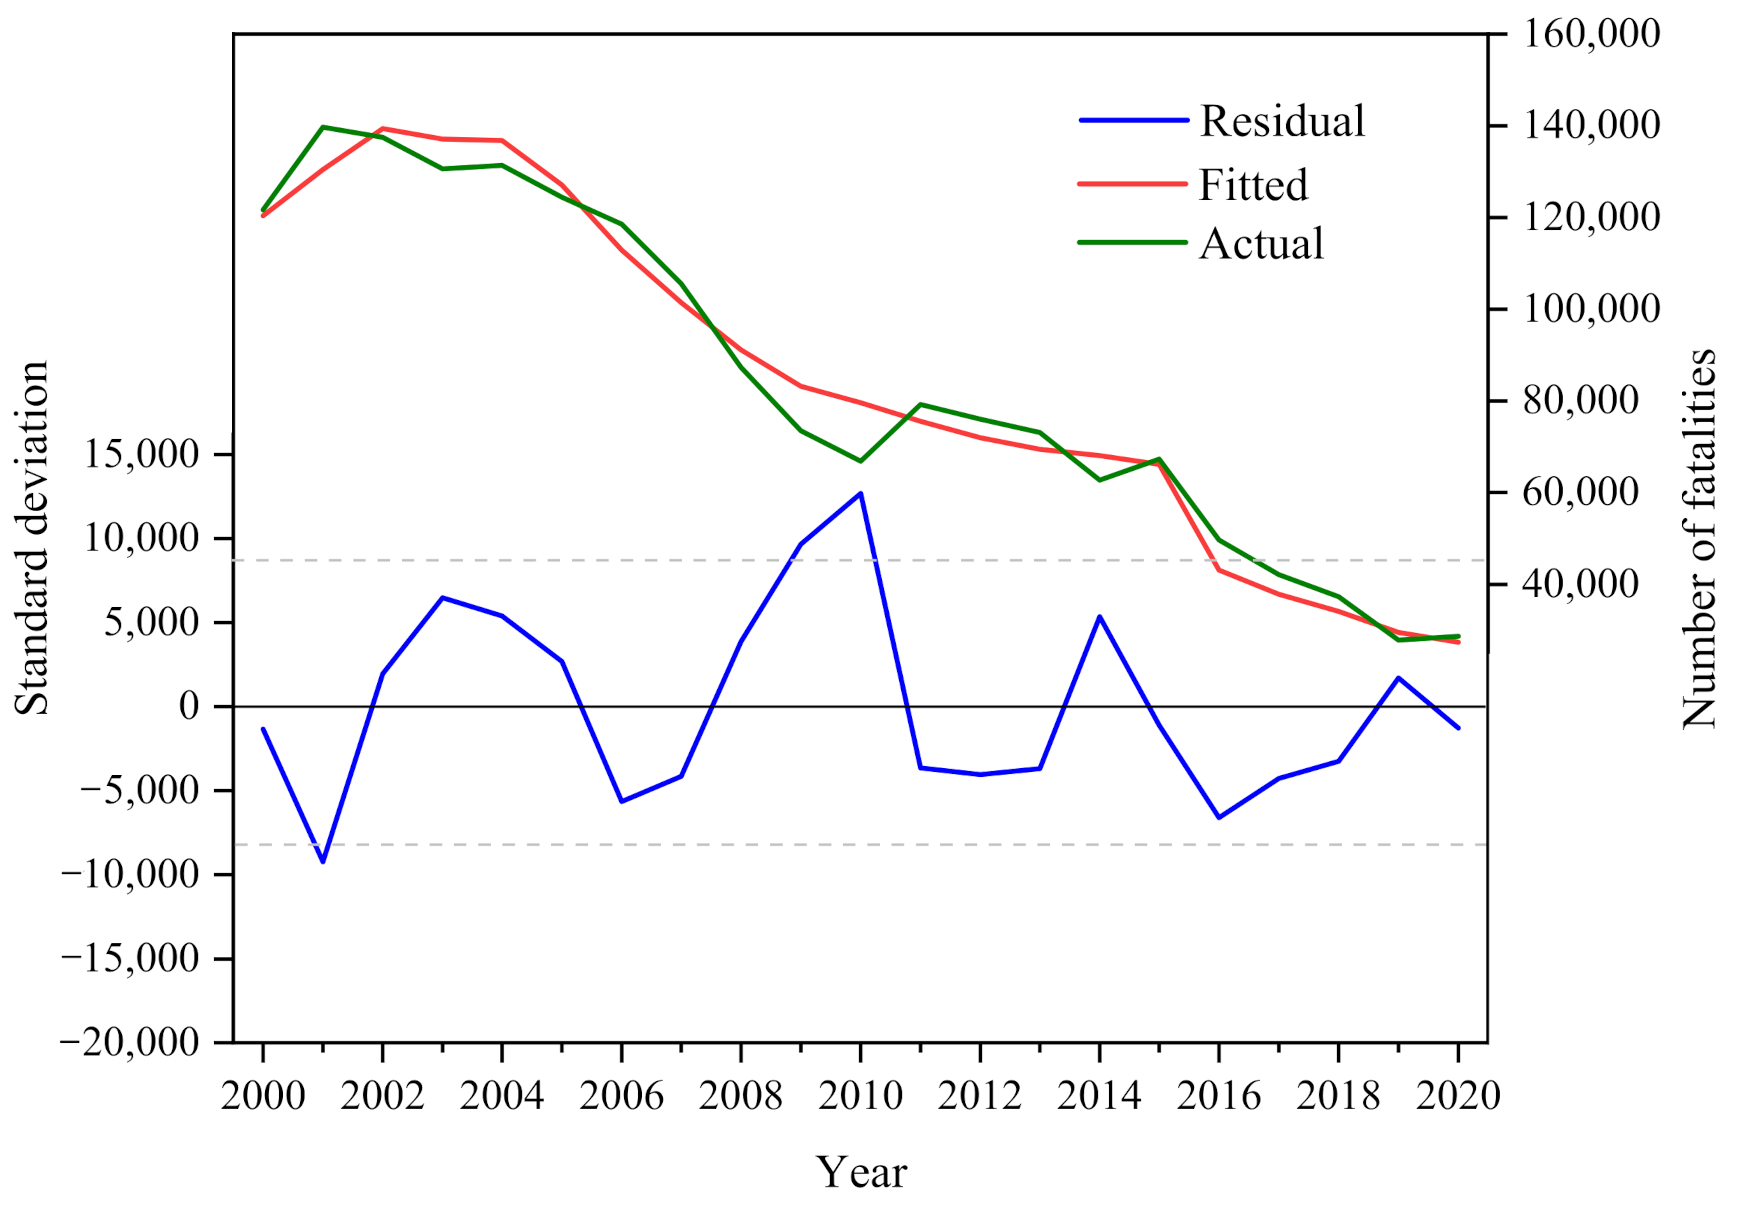
With respect to the model residuals and predictive tests, a residual analysis is conducted by using model 2, and the results are shown in Figure 3.
The residual diagram shows three curves, namely the actual, fitted, and residual values. The upper and lower dotted line confidence intervals represent the residual values of zero. It can be seen from the figure that the residual value fluctuates around zero, which indicates that the fit is good. The fitted number of accident-related deaths is compared with the real value, as shown in Table 3. The relative error is small, which signals that the model is accurate.
Concerning the model analysis, the adjusted regression coefficient of the model is 0.929; that is, 92.9% of the total deviations in the death toll can be explained by the model. The model passes the global significance test, heteroskedasticity test, and autocorrelation test, and the predicted results are reasonable. The regression results for the stages differ from one another. For 2000–2002, the coefficient that represents the impact of the number of safety policies on the number of accident-related deaths is 91.540. For 2003–2005, the coefficient for the effect of the number of safety policies on the number of accident-related deaths is −63.362. For 2006–2008, the coefficient on the number of safety policies is 138.75. For 2009–2020, the number of safety policies has a strong impact on the number of accident-related deaths under the same conditions: the number of fatalities decreases by 37236, and the safety situation improves significantly.
3. Results
Through a comprehensive analysis of the characteristics of safety policies, we can extract safety policy indexes from the safety policy system from the four dimensions of policy stringency, scope, technical content, and the policy’s industrial targets. These indexes are independent of each other. For each index, we refined different levels of safety policy. There are different weights among the policies of each level. At the same time, the grade under each index has an obvious hierarchical relationship, and the difference in the degree of importance of each grade is very significant. Therefore, based on the importance of the grade and the prevention and control effect of the accident, the weight of each index is determined directly through the expert discussion method. These dimensions reflect the effect of implementing safety policies on the death rate per 100 million yuan.
Based on the actual situation in China, we considered the formulation of safety policies from the perspective of the whole country, which will involve policies of different industries and will compare these policies together. There are indeed some differences between different industries, and they may be at different stages of development or have different characteristics in the field of work safety. However, through comparison, we can fully understand the impact of different stages of development, different safety policy formulation, and the degree of policy implementation on work safety accidents, and subsequently make the research results more perfect and reliable. In China, the Ministry of Emergency Management of the People’s Republic of China is the top leading body for safety work, and in the process of accident statistics, this department also includes different industries in the statistics. For example, the annual release of data on the number of occupational fatalities per 100,000 workers is not distinguished by different industries. Taking into account the data sources and the actual situation in China, it is reasonable to compare the safety policies of different industries together.
In addition, we have set different weights for the comparison of different industries according to the degree of risk of accidents in the industry, and this is based on the actual situation in China. In China, the number of traffic accidents and the number of deaths caused by traffic accidents far exceeds that of other accidents. Consequently, there are also more safety policies on traffic accidents and relatively fewer on agricultural accidents. However, the number of factors that influence the relationship between accidents and policy is very large, which makes it difficult to take all factors into account at the same time. Out of all these factors, the formulation of policies is always the most important. In China, the formulation of safety policies for a particular type of accident, including laws, regulations, and industry standards, is not only a guideline for good safety practice but also a reflection of the importance attached to such accidents at different levels of government. Therefore, in this article, we have studied the number of policies made by different levels of government as the most important factor, without considering the differences between industries.
(1) From the aspect of policy stringency, safety policies are divided into the five levels of safety laws, safety regulations, safety rules, safety standards, and safety norms; it is clear that the legal effect of each successive level gradually declines, and these levels are assigned scores of 5, 4, 3, 2, and 1, respectively, which are the safety policy indexes for the level of policy stringency. (2) From the dimension of the scope of the safety policy, the safety policies are divided into the two levels of the national level and provincial level. When the scope of the policy is wider, its relative impact on accidents is greater. Therefore, the two levels are given scores of 2 and 1, for the national and provincial levels, respectively, which are used as indexes for the scope of safety policies. (3) The specific content of the safety policies can be divided into the three categories of safety technology, safety management, and health protection. Health protection has little impact on the number of accident-related deaths, while policies with high technology content are more conducive to the formation of a clearer understanding of personnel safety in the production process. Therefore, the technical content of the policy is defined as a safety policy indicator, and its scores are 3, 2, and 1 for safety technology, safety management, and health protection, respectively. (4) Finally, safety policies are directed toward various industries, and the proportion of accidents varies by industry. In terms of the number of deaths from 2000 to 2020, the ranking of the various industries is transportation, mining (including coal and noncoal mines), chemicals, construction, manufacturing, and agriculture, and therefore, this indicator identifies the industrial target of the policy, whose score is 6, 5, 4, 3, 2, or 1, respectively. Table 4 presents the scoring rules for the above indexes.
The total number of annual safety policies, which are presented in Figure 1 above, are classified according to the indexes in Table 4, and statistics are calculated for the number of policies at the level of each index. The number of policies at each grade is multiplied by the corresponding score in Table 4, and the scores of the levels under each index are added together to obtain the total score for the indexes in each year. The total scores of the indexes in each year are plotted in Figure 4. The analysis shows that over time, the death rate per 100 million has significantly declined because safety policies are constantly improving. The trends in the four policy indexes are almost the same, and they reach a peak in 2006, which is due to the large number and high importance of the safety policies implemented in this year. Due to different initial values, the numerical comparison of the indexes would be meaningless, but the impact of the relative changes in the indexes on the death rate per 100 million yuan can be analyzed.
The model requires that the data are a stationary series or the data satisfy the cointegration relationship, so it is necessary to test the stationarity of each time series at first. If the time series satisfies that the mean, variance, and self-covariance are independent of time, then the time series can be considered to be stationary. The unit root test is usually used to distinguish the stationary series. Regarding the unit root test, the Augmented Dickey–Fuller (ADF) test is conducted on five time series, namely, the death rate, stringency level, scope, technical content, and industrial target. First, we test the original sequence; if it is not stable, then we test the first-order difference and continue testing the differences of successively higher orders until the n-th order is stable, but n should not be too large. See Table 5 for the test results. If the ADF test value is greater than the 5% critical value, then this means that the series is unstable; otherwise, it is stable.
The cointegration between the two sequences means that there is a long-term equilibrium relationship between them. Equilibrium indicates a kind of stability, which means that the internal equilibrium mechanism of the system urges the system factors that are disturbed to deviate from the equilibrium to return to the equilibrium state. In this way, the pseudo-regression phenomenon will not occur when establishing the regression model. When there are multiple variables, the Johansen cointegration test is generally used, which is a test of regression coefficients based on the VAR model. Concerning the cointegration test, the results of the unit root test show that the death rate exhibits zero-order single integration. Moreover, the explained variables of the stringency level, scope, technical content, and industrial target are first-order integrated and can be tested for cointegration. The Johansen cointegration test is used, and the results are shown in Table 6 and Table 7.
According to the cointegration test results, the variables are cointegrated, and the cointegration equation is given by Equation (4).
This shows that although the sequence of the four safety policy indexes is not stable, the linear combination is stable, and there is a linear relationship with the death rate per 100 million yuan.
The vector autoregression (VAR) model is such a function that every endogenous variable in the system can be expressed as the lag value of all endogenous variables. On the one hand, this model can analyze all variables as endogenous variables in the case of uncertain variables. On the other hand, it can be used to study the dynamic relationship between multi variables, predict the changing trend, and analyze the dynamic impact of random disturbance on the system. A VAR analysis is conducted in Eviews10 by using Equation (5).
where the 4-dimensional matrices ..., , and are coefficients to be estimated.
Regarding the determination of the lag period , first, the default lag period of 0 is used and is then increased sequentially. Since data are not available after a 1 lag period, the lag period is determined to be 1, as shown in Table 8.
The Granger causality test is to analyze whether the previous information of the independent variable helps to reduce the mean square error of the dependent variable prediction. Using the statistical distribution relationship to test if the result is significant, it can be considered that the dependent variable is caused by the independent variable. The Granger causality test was conducted for the VAR analysis, and the test results are shown in Table 9. Table 9 shows that within a 10% significance level, the stringency level, scope, technical content, and industrial targets are the one-way Granger causes of the death rate per 100 million yuan; that is, a change in the stringency level, scope, technical content, and industrial targets of the safety policies in the previous period leads to changes in the death rate per 100 million yuan. However, the change in the death rate per 100 million in the previous period does not lead to changes in the current policy indexes, such as the stringency level, scope, technical content, and industrial targets. This shows that the implementation of China’s safety policies has affected the death rate per 100 million yuan.
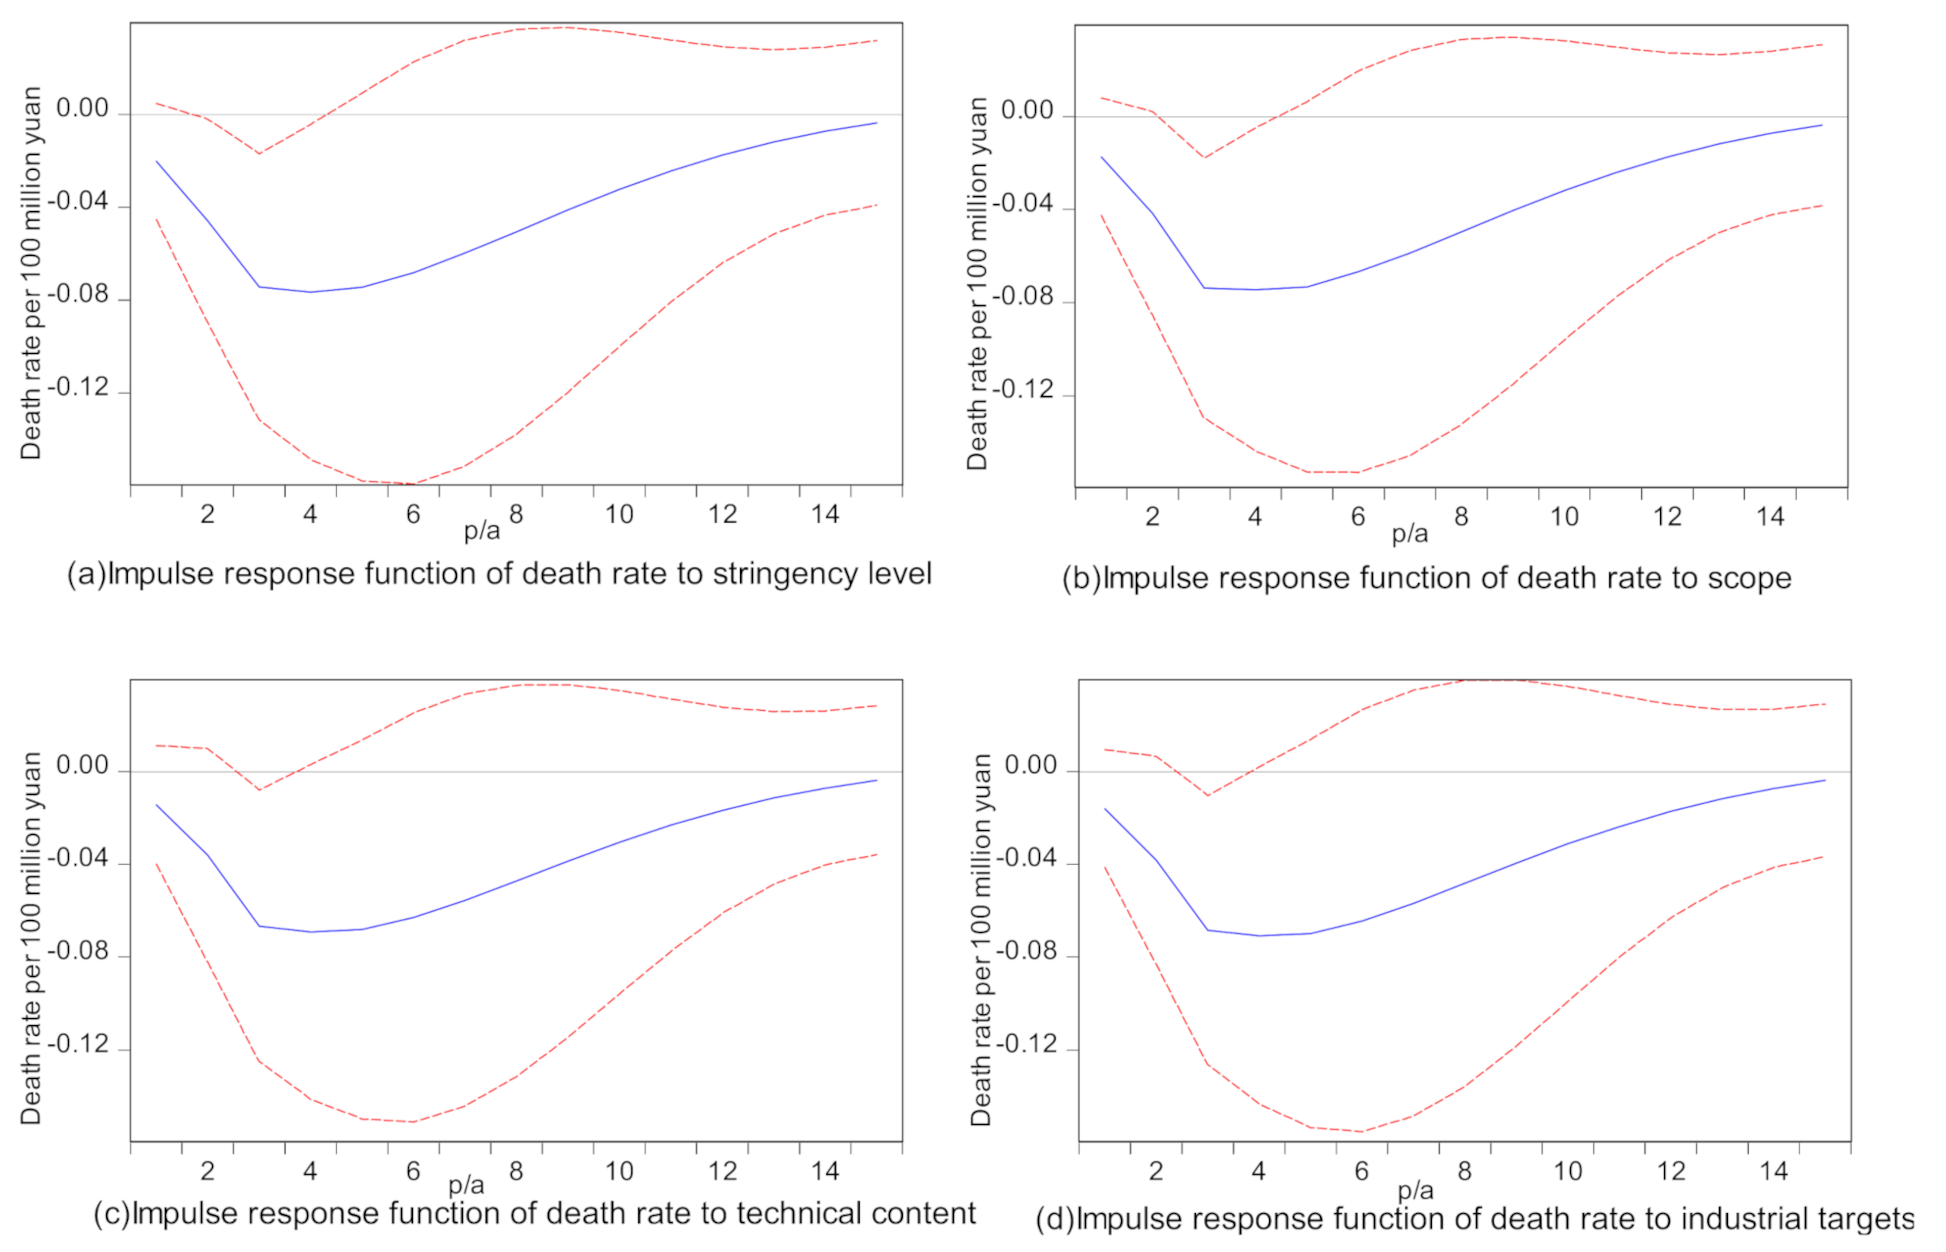
Impulse response analysis means that when a new standard deviation impact is applied to the error term of an endogenous variable, the influence of this impact on the “current and future values” of the variable itself and other endogenous variables is analyzed. Concerning the impulse response analysis, it is conducted by using the VAR analysis. In period , a unit shock in the stringency level, scope, technical content, and industrial targets is given, and there is no external disturbance. Then, the change in the death rate per 100 million in the following period is analyzed. To eliminate the influence of variable order, a generalized pulse is used here, and the progressive analytical method is used to calculate the error. The results of the impulse response function are shown in Figure 5. In the figure, the horizontal axis is the lagged period of impact. Here, 15 years is selected as the analysis period. The vertical axis is the change in the death rate per 100 million yuan. The solid line is the response of the death rate per 100 million yuan to each safety policy indicator. The dotted lines indicate the 95% confidence interval.
The figure shows that the trend in the response of the death rate per 100 million to each safety policy indicator is roughly the same. When there is a positive shock to each safety policy indicator, the death rate per 100 million shows significant negative changes in response, which indicates a significant inhibitory effect. In the first phase, the intervention effect is not very strong. In the second phase, the effect of the safety policy begins to increase rapidly. It reaches its peak in the second to fifth phases. Beginning in the sixth phase, the ability of the safety policy to affect the death rate declines continuously and approaches 0 after the eleventh phase. At this time, the effect of the safety policy almost disappears.
4. Discussion
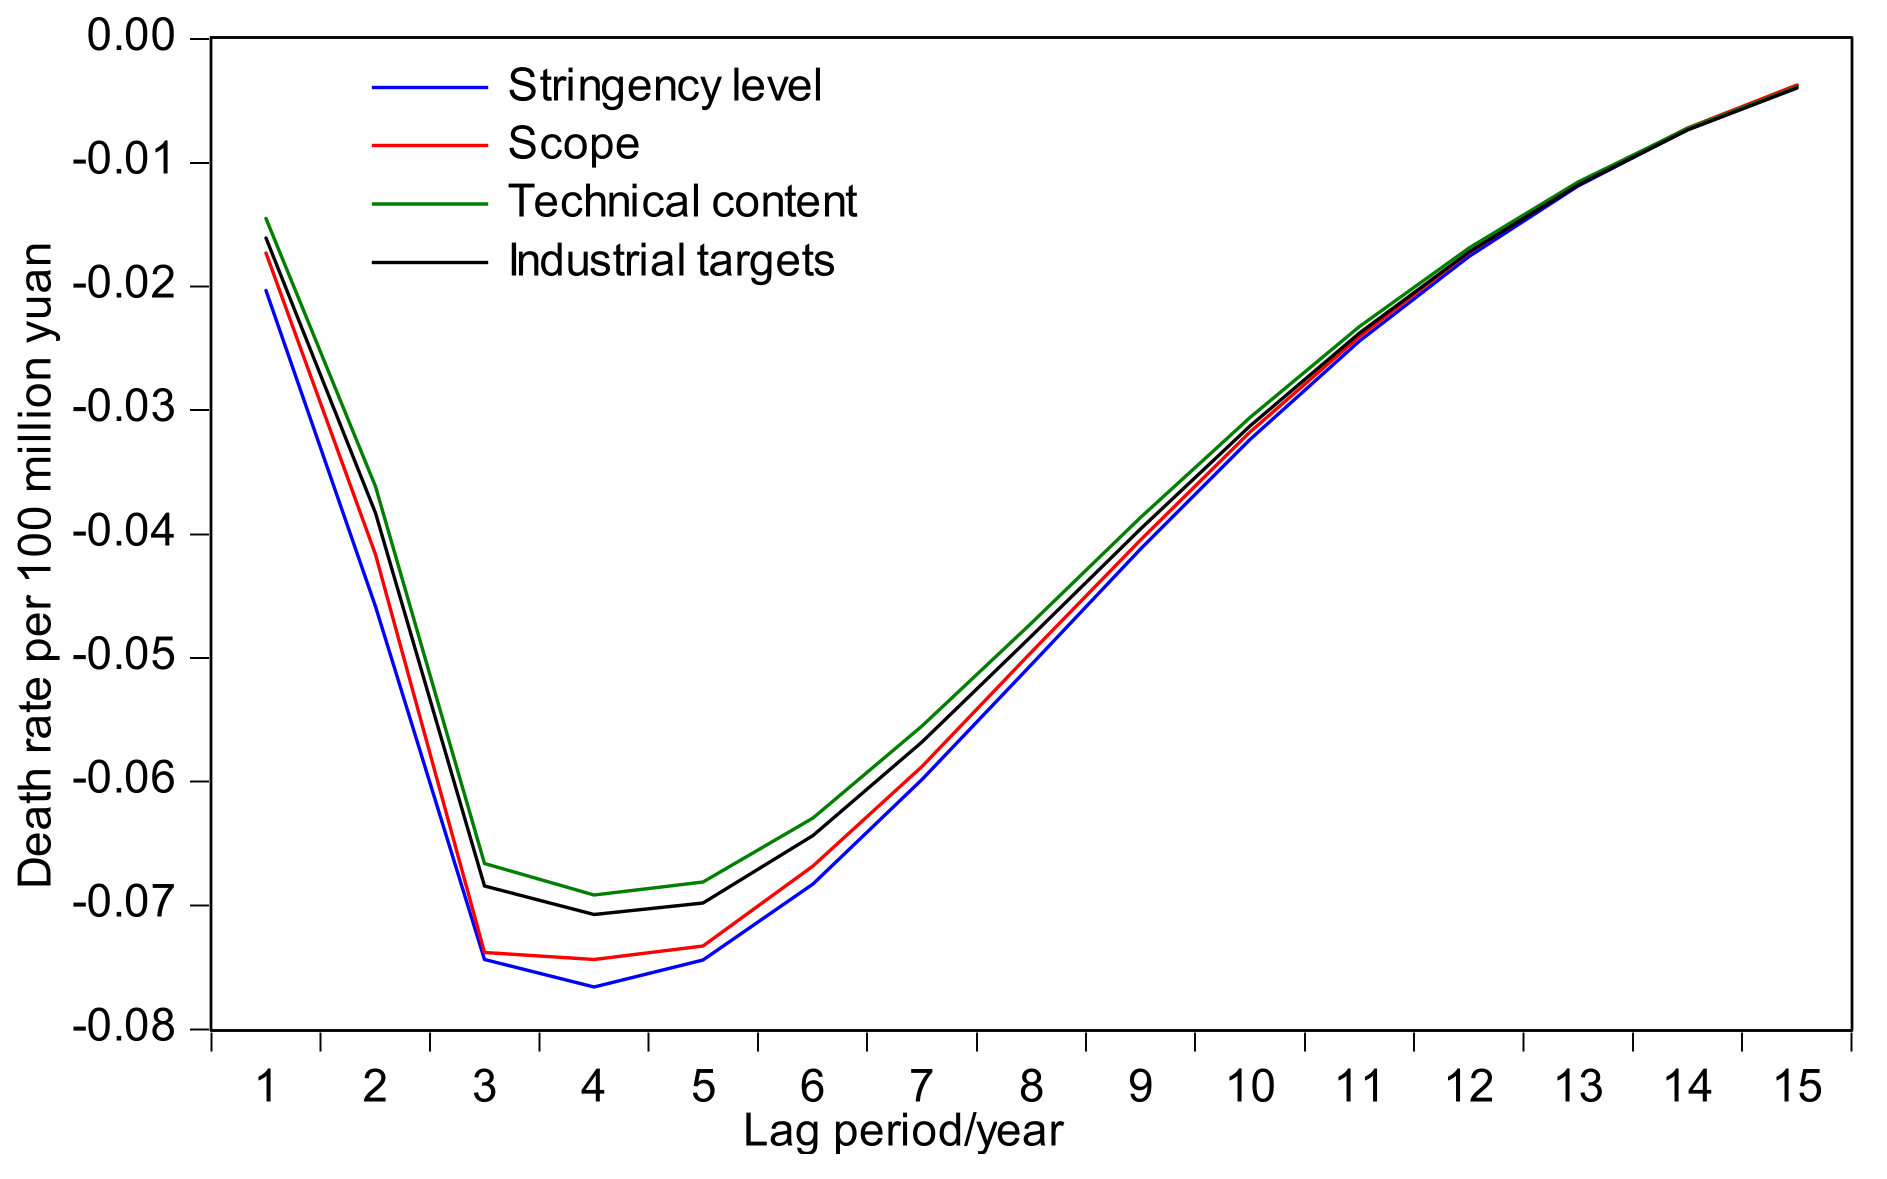
To directly compare the impact of each safety policy index on the death rate per 100 million yuan, the four indexes are combined into one figure without the standard errors, and the range of values is narrowed, as shown in Figure 6. The figure shows that the safety policies had a rapid effect in the first two years, with the death rate per 100 million decreasing by 0.06. The effect reached its peak during the second to fifth years and began to weaken during the sixth year, with the death rate per 100 million decreasing by 0.05 in the fifth year. In the eleventh year, the effect was almost lost, as it reached zero. The ranking of the influence of each safety policy index on the death rate per 100 million yuan is, from strongest to weakest, the stringency level, scope, technical content, and industrial targets. This shows that when formulating safety policies, more stringent policies should be preferred, which can quickly arouse the attention of personnel in the early stages, especially since the effect of safety policy stringency on the death rate per 100 million yuan lasts longer than the effect of the other safety policy dimensions. At present, China’s safety policies are mainly based on department rules, and the number of safety laws and regulations is still insufficient. If we increase efforts in this area, then we can effectively reduce the death rate per 100 million yuan and significantly improve safety conditions.
Second, the index that captures the policy scope indicates that national safety policies are more important when formulating policies. The Ministry of Emergency Management of the People’s Republic of China has been established to take advantage of this trend; that is, the overall implementation is more effective for national safety policies than for local policies because national policies have a wider scope of influence, which is also an important determinant of the death rate per 100 million yuan.
Although the effect of the technical content of safety policies is the weakest, it is not unimportant. The proportion of safety management in China’s current safety policy is still relatively large, while the number of normative standards is a deficiency that needs to be further improved, and the effect of technical content is not obvious due to the low level of such content in current policies. That is, the four indexes for safety policy have negative effects on the death rate per 100 million. When formulating safety policies, we should comprehensively consider these four dimensions and move toward higher levels for each dimension, which can be more effective in reducing the death rate per 100 million yuan and improving the safety situation.
Some studies have calculated the statistics on safety management documents and have found that the number of safety management documents experienced tremendous growth in China after 2010, and the importance of safety management has increased every year [35]. However, the analysis of the relationship between safety management documents and accidents is insufficient. To accurately analyze the efficiency of safety management in coal enterprises in China, Chenglin Miao used the data envelopment analysis (DEA) model to analyze the pure technical efficiency (PTE) and scale efficiency (SE) of safety management in the sample enterprises and developed a Tobit model with random effects to evaluate the impact of enterprise management and safety investments on the efficiency of safety management [36]. Although a safety management index is proposed, the importance of the relationships between the indexes has not been determined. Through the establishment of a safety management system and model [37,38], safety management has been studied, but there have been deficiencies in data collection. This paper establishes a vector autoregressive model by using complete statistical data to rank the influence of the safety policy indexes on the death rate per 100 million yuan.
In brief, the main research background of this paper is the actual situation in China and the current stage of development in China. From the changes in the data of safety policies and work accidents in China, we find that the current work safety situation in China continues to improve, which benefits from the increase and improvement of the number of safety policies. We believe that the reason for this phenomenon is that China’s overall work safety policies and standards are still in a relatively imperfect and developing stage. At this stage, the increase in the number of safety policies helps to prevent accidents and achieve good safety results. When China’s safety policy system is well developed in the future, it is necessary to formulate a new safety policy combined with elastic engineering, and appropriate deregulation may be feasible. In short, the applicable conditions of elastic engineering are limited, and the formulation of safety policies should also take into account the stage of development of different countries at that time. For developing countries whose safety policy system is still not perfect, it is necessary to increase the number of safety policies and improve the implementation and efficiency of safety policies. For the developed countries where the safety system is perfect or even the safety policy is too strict, what needs to be considered is the possibility of the safety clutter and the combination of elastic engineering, and appropriate deregulation may achieve better results in the prevention and control of work accidents. To sum up, the results of this paper can provide a reference for developing countries that are similar to China’s actual situation and whose current safety policy system is relatively imperfect.
5. Conclusions
(1) Safety policies are classified into stringency categories, namely, safety laws, safety regulations, safety rules, safety standards, and safety normative documents. The industrial categories are transportation, mining, manufacturing, chemicals, construction, and agriculture. The technical categories include safety technology, safety management, and health protection. The scope of the policies is either at the national level or provincial level. Finally, the safety policy system is established.
(2) Four indexes were extracted from the safety policy system, specifically, the stringency level, scope, technical content, and industrial targets. Unit root, cointegration, and Granger tests were conducted for the above indexes, all of which passed the various tests. By using Eviews10 to establish a VAR model and analyzing the impulse response of mortality to each safety policy index, the negative correlations between mortality and the stringency level, scope, technical content, and industrial targets were weakened in turn. The correlations began weakly, were strengthened, and then weakened again over time.
(3) Safety policy stringency can quickly attract people’s attention in the early stages of policy implementation, and mortality has a strong response to this dimension. In addition, stringency has a long-lasting effect on the death rate per 100 million yuan. At present, China’s safety policies are mainly based on departmental regulations and rules, and the number of safety laws and regulations is still insufficient. The death rate can be effectively reduced by increasing the number of stringent safety policies.
(4) At present, the current work safety situation in China continues to develop, mainly due to the increase and improvement of the number of safety policies formulated by the Ministry of Emergency Management of the People’s Republic of China. On the one hand, when the safety policy system is in a relatively imperfect stage, the center of the safety work is to increase the number of safety policies and improve the implementation and efficiency of safety policies. On the other hand, when the safety system is perfect or even if the safety policy is too strict, it should consider the possibility of the safety clutter and the combination of elastic engineering; at the same time, the implementation effect of safety work should be improved.
Author Contributions
Conceptualization, X.W.; Writing—original draft, C.W.; Writing—review & editing, Y.H.; Resources, Data curation, H.Z.; Funding acquisition, Q.W. All authors have read and agreed to the published version of the manuscript.
Funding
This research was funded by the Natural Science Foundation of China (Grant Nos. 51274206 & 51404277).
Institutional Review Board Statement
Not applicable.
Informed Consent Statement
Not applicable.
Data Availability Statement
Not applicable.
Conflicts of Interest
The authors declare no conflict of interest.
References
- Scherer, R.F.; Owen, C.L. OSHA inspections: Process and outcomes in programmed inspections versus complaint-investigated inspections. Empl. Responsib. Rights J. 1995, 8, 245–254. [Google Scholar]
- Weil, D. If OSHA is so bad, why is compliance so good? RAND J. Econ. 1996, 27, 618–640. [Google Scholar] [CrossRef] [Green Version]
- Mendeloff, J. An Evaluation of the OSHA Program’s Effect on Workplace Injury Rates; US Department of Labor: Washington, DC, USA, 1976. [Google Scholar]
- Di Tecco, C.; Jain, A.; Valenti, A.; Iavicoli, S.; Leka, S. An evaluation of the impact of a policy-level intervention to address psychosocial risks on organisational action in Italy. Saf. Sci. 2017, 100, 103–109. [Google Scholar] [CrossRef] [Green Version]
- Ando, K. Coal Mine Safety Management System and International Cooperation in Japan. In Proceedings of the 5th International Symposium on Mining Science and Technology, Xuzhou, China, 20–22 October 2004; pp. 231–234. [Google Scholar]
- Siegrist, S. Towards a method to forecast the effectiveness of national road safety programmes. Saf. Sci. 2010, 48, 1106–1110. [Google Scholar] [CrossRef]
- Lucas, D.L.; Kincl, L.D.; Bovbjerg, V.E.; Branscum, A.J.; Lincoln, J.M. Primary prevention of fishing vessel disasters: Evaluation of a United States Coast Guard policy intervention. Mar. Policy 2014, 50, 67–73. [Google Scholar] [CrossRef]
- Choi, G.H. Effectiveness of direct safety regulations on manufacturers and users of industrial machines: Its implications on industrial safety policies in Republic of Korea. Saf. Health Work 2017, 8, 59–66. [Google Scholar] [CrossRef] [Green Version]
- Wu, W.; Xu, S.; Chen, G. Study on safety supervision mechanism based on synergetics. J. Saf. Sci. Technol. 2013, 9, 150–155. [Google Scholar]
- Wang, P.J. Game analysis of the rent-seeking approaches of the small-&-medium-sized enterprises under the general public safety supervision. J. Saf. Environ. 2018, 18, 1391–1395. [Google Scholar]
- Viscusi, W.K. The impact of occupational safety and health regulation, 1973–1983. RAND J. Econ. 1986, 17, 567–580. [Google Scholar] [CrossRef] [Green Version]
- Smith, R.S. The Occupational Safety and Health Act: Its Goals and Its Achievements. Evaluative Studies Series; American Enterprise Institute for Public Policy Research: Washington, DC, USA, 1976; p. 20036. [Google Scholar]
- Curington, W.P. Safety regulation and workplace injuries. South. Econ. J. 1986, 53, 51–72. [Google Scholar]
- Lanoie, P. Safety regulation and the risk of workplace accidents in Quebec. South. Econ. J. 1992, 58, 950–965. [Google Scholar] [CrossRef]
- Gray, W.B.; Mendeloff, J.M. The declining effects of OSHA inspections on manufacturing injuries, 1979–1998. ILR Rev. 2005, 58, 571–587. [Google Scholar] [CrossRef] [Green Version]
- Denison, E.F. Accounting for Slower Economic Growth: The United States in the 1970’s; Brookings Institution Press: Washington, DC, USA, 2010. [Google Scholar]
- Gray, W.B. The Impact of OSHA and EPA Regulation on Productivity; National Bureau of Economic Research Cambridge: Cambridge, MA, USA, 1984. [Google Scholar]
- Li, K.; Zhang, Y.; Guo, J.; Ge, X.; Su, Y. System dynamics model for high-speed railway operation safety supervision system based on evolutionary game theory. Concurr. Comput. Pract. Exp. 2019, 31, e4743. [Google Scholar] [CrossRef]
- Abegaz, T.; Berhane, Y.; Worku, A.; Assrat, A. Effectiveness of an improved road safety policy in Ethiopia: An interrupted time series study. BMC Publ. Health 2014, 14, 539. [Google Scholar] [CrossRef] [PubMed] [Green Version]
- Ren, Z.; Liu, T.; Liu, G. The quantitative analysis of the relationship between the trend of industrial accidents and the intervention of the safety policy in China. J. Saf. Sci. Technol. 2008, 14, 68–72. [Google Scholar]
- Liu, T.; Ren, Z. Research on several indicators in the twelfth five-year program for work safety. J. Saf. Sci. Technol. 2011, 7, 5–9. [Google Scholar]
- Ma, Y.; Li, Z.; Han, C. Empirical analysis of the impact of policy factors on the work safety of China’s coal industry. Res. Econ. Manag. 2008, 8, 54–58. [Google Scholar]
- Li, C.; Wang, T.; Cao, J. Empirical study on influences of coal mine policies on work safety in China. China Saf. Sci. J. 2012, 22, 143–148. [Google Scholar]
- Wang, J.; Zhang, X.; Zhao, J. Brief analysis on production safety policy. Saf. Environ. Eng. 2006, 13, 92–94. [Google Scholar]
- Shi, X. Have government regulations improved workplace safety? A test of the asynchronous regulatory effects in China’s coal industry, 1995–2006. J. Saf. Res. 2009, 40, 207–213. [Google Scholar] [CrossRef]
- Rae, A.; Provan, D.; Weber, D.; Dekker, S. Safety clutter: The accumulation and persistence of ‘safety’work that does not contribute to operational safety. Pol. Pract. Health Saf. 2018, 16, 194–211. [Google Scholar] [CrossRef]
- Dekker, S.W. The bureaucratization of safety. Saf. Sci. 2014, 70, 348–357. [Google Scholar]
- Provan, D.J.; Dekker, S.W.; Rae, A.J. Bureaucracy, influence and beliefs: A literature review of the factors shaping the role of a safety professional. Saf. Sci. 2017, 98, 98–112. [Google Scholar]
- Patriarca, R.; Bergström, J.; Di Gravio, G.; Costantino, F. Resilience engineering: Current status of the research and future challenges. Saf. Sci. 2018, 102, 79–100. [Google Scholar] [CrossRef]
- Hollnagel, E.; Woods, D.D.; Leveson, N. Resilience Engineering: Concepts and Precepts; Ashgate Publishing, Ltd.: Farnham, UK, 2006. [Google Scholar]
- Hollnagel, E. Safety-II in Practice: Developing the Resilience Potentials; Taylor & Francis: Oxfordshire, UK, 2017. [Google Scholar]
- Hollnagel, E. Safety-I and Safety-II: The Past and Future of Safety Management; CRC Press: Boca Raton, FL, USA, 2018. [Google Scholar]
- Provan, D.J.; Woods, D.D.; Dekker, S.W.; Rae, A.J. Safety II professionals: How resilience engineering can transform safety practice. Reliab. Eng. Syst. Saf. 2020, 195, 106740. [Google Scholar]
- Grote, G. Promoting safety by increasing uncertainty–Implications for risk management. Saf. Sci. 2015, 71, 71–79. [Google Scholar]
- Tong, R.; Yang, X.; Zhao, H.; Parker, T.; Wang, Q. Process safety management in China: Progress and performance over the last 10 years and future development. Process Saf. Prog. 2020, 39, e12147. [Google Scholar]
- Miao, C.L.; Duan, M.M.; Sun, X.X.; Wu, X.Y. Safety management efficiency of China’s coal enterprises and its influencing factors—Based on the DEA-Tobit two-stage model. Process Saf. Environ. Prot. 2020, 140, 79–85. [Google Scholar] [CrossRef]
- Li, Y.; Guldenmund, F.W. Safety management systems: A broad overview of the literature. Saf. Sci. 2018, 103, 94–123. [Google Scholar]
- Lu, R.; Wang, X.; Yu, H.; Li, D. Multiparty evolutionary game model in coal mine safety management and its application. Complexity 2018, 2018, 9620142. [Google Scholar] [CrossRef] [Green Version]
Figure 1.
Changes in the number of safety policies in China and in work-related accidents.

Figure 2.
Structure of China’s safety policy system.

Figure 3.
Residual chart.

Figure 4.
Trend in safety policy indexes.

Figure 5.
Impulse response function of the death rate to the safety policy indexes (analytic).

Figure 6.
Impulse response function of safety policy indexes to the death rate (no standard error).


Table 1.
Comparison of the goodness of fit and significance test results before and after model adjustment.
Table 1.
Comparison of the goodness of fit and significance test results before and after model adjustment.
| Model | Goodness of Fit | Significance Test | a0 | X | D1t | |||||
|---|---|---|---|---|---|---|---|---|---|---|
| R2 | R2 | F | P | t | P | t | P | t | P | |
| Before correction | 0.959 | 0.927 | 30.037 | 0.000 | 8.247 | 0.000 | 1.346 | 0.211 | 1.409 | 0.192 |
| After correction | 0.947 | 0.929 | 53.460 | 0.000 | 8.286 | 0.000 | 1.764 | 0.103 | — | — |
| D1t | D1t | (Xt − X2002)D1t | (Xt − X2006)D1t | (Xt − X2008)D1t | ||||||
| t | P | t | P | t | P | t | P | t | P | |
| Before correction | −0.312 | 0.762 | −3.402 | 0.008 | −2.593 | 0.029 | 1.937 | 0.085 | 0.813 | 0.437 |
| After correction | — | — | −4.795 | 0.000 | −2.365 | 0.036 | 6.151 | 0.000 | — | — |
Table 2.
Heteroskedasticity and autocorrelation test results.
| Test Method | Statistics | P |
|---|---|---|
| White heteroskedasticity test | 8.898 | 0.351 |
| LM autocorrelation test | 1.734 | 0.188 |
Table 3.
Comparison of the fitted and real values for accident-related deaths.
| Year | Actual | Fitted | Relative Error |
|---|---|---|---|
| 2000 | 120,351 | 121,693.401 | −0.011154052 |
| 2001 | 130,491 | 139,726.721 | −0.070776688 |
| 2002 | 139,393 | 137,438.228 | 0.014023456 |
| 2003 | 137,070 | 130,605.759 | 0.047160145 |
| 2004 | 136,755 | 131,364.922 | 0.039414119 |
| 2005 | 127,089 | 124,405.925 | 0.021111777 |
| 2006 | 112,879 | 118,522.410 | −0.049995216 |
| 2007 | 101,480 | 105,618.752 | −0.040783914 |
| 2008 | 91,172 | 87,303.882 | 0.042426605 |
| 2009 | 83,200 | 73,533.066 | 0.11618911 |
| 2010 | 79,552 | 66,873.113 | 0.159378604 |
| 2011 | 75,572 | 79,221.776 | −0.048295343 |
| 2012 | 71,983 | 76,030.548 | −0.056229225 |
| 2013 | 69,434 | 73,116.819 | −0.053040571 |
| 2014 | 68,061 | 62,710.643 | 0.078611204 |
| 2015 | 66,182 | 67,289.360 | −0.016732047 |
| 2016 | 43,062 | 49,658.274 | −0.153180864 |
| 2017 | 37,852 | 42,116.396 | −0.112659832 |
| 2018 | 34,046 | 37,293.638 | −0.095389713 |
| 2019 | 29,519 | 27,823.432 | 0.057439871 |
| 2020 | 27,412 | 28,331.981 | −0.033561285 |
Table 4.
Safety policy indexes and scores.
| Safety Policy Indexes | Stringency Level | Scope | Industrial Target | Technical Content |
|---|---|---|---|---|
| Grading and scoring | Safety laws 5 Safety regulations 4 Safety rules 3 Safety standards 2 Safety norms 1 | National level 2 Provincial level 1 | Transportation 6 Mining 5 Chemicals 4 Construction 3 Manufacturing 2 Agriculture 1 | Safety technology 3 Safety management 2 Health protection 1 |
Table 5.
Unit root test results.
| Sequence | ADF Test | 5% Critical | Stationarity Results | |
|---|---|---|---|---|
| Death rate | Original sequence | −6.831968 | −1.968430 | stationary |
| First difference | — | — | — | |
| Mandatory level | Original sequence | −2.380801 | −3.081002 | nonstationary |
| First difference | −2.488261 | −1.968430 | stationary | |
| Scope level | Original sequence | −2.309914 | −3.081002 | nonstationary |
| First difference | −2.431744 | −1.968430 | stationary | |
| Technical level | Original sequence | −2.259790 | −3.081002 | nonstationary |
| First difference | −2.565502 | −1.968430 | stationary | |
| Industrial level | Original sequence | −0.539316 | −1.968430 | nonstationary |
| First difference | −2.588419 | −1.970978 | stationary | |
Table 6.
Cointegration test results.
| Null Hypothesis | Characteristic Root | Trace Statistics (P) | λ-max Statistics (P) |
|---|---|---|---|
| 0 cointegrated variables | 0.982731 | 153.5549 (0.0000) | 60.88238 (0.0000) |
| Up to 1 cointegrated variable | 0.939220 | 92.67255 (0.0000) | 42.00744 (0.0001) |
| Up to 2 cointegrated variable | 0.904823 | 50.66512 (0.0000) | 35.28026 (0.0001) |
| Up to 3 cointegrated variable | 0.636620 | 15.38485 (0.0149) | 15.18458 (0.0096) |
| Up to 4 cointegrated variable | 0.013263 | 0.200278 (0.7101) | 0.200278 (0.7101) |
Table 7.
Cointegration coefficient and standardization.
| Death Rate (DA) | Stringency Level (SL) | Scope (S) | Technical Content (TC) | Industrial Target (IT) |
|---|---|---|---|---|
| 1.000000 | 0.004647 | −0.005636 | 0.006008 | −0.006381 |
| — | (0.00081) | (0.00076) | (0.00088) | (0.00030) |
Table 8.
Cointegration coefficient and standardization.
| Criterion | LogL | LR | FPE | AIC | SC | HQ | |
|---|---|---|---|---|---|---|---|
| Lag Period | |||||||
| 0 | −349.2850 | NA | 1.18 × 10¹³ | 44.28562 | 44.52705 | 44.29798 | |
| 1 | −271.3930 | 97.36489 | 1.92 × 10¹⁰ | 37.67413 | 39.12273 | 37.74831 | |
Table 9.
Cointegration test results.
| Null Hypothesis | Sample Size | F Statistics | P |
|---|---|---|---|
| Stringency level does not cause changes in the death rate per 100 million | 21 | 10.9528 0.92707 | 0.0056 0.3532 |
| Death rate per 100 million does not cause changes in the stringency level | 21 | 6.17191 0.00102 | 0.0274 0.9751 |
| Policy scope does not cause changes in the death rate per 100 million | 21 | 4.93911 0.06729 | 0.0446 0.7994 |
| Death rate per 100 million does not cause changes in the policy scope | 21 | 4.41083 0.99790 | 0.0558 0.3361 |
Publisher’s Note: MDPI stays neutral with regard to jurisdictional claims in published maps and institutional affiliations. |
© 2021 by the authors. Licensee MDPI, Basel, Switzerland. This article is an open access article distributed under the terms and conditions of the Creative Commons Attribution (CC BY) license (https://creativecommons.org/licenses/by/4.0/).
Share and Cite
MDPI and ACS Style
Wang, X.; Wei, C.; He, Y.; Zhang, H.; Wang, Q. Research on the Correlation between Work Accidents and Safety Policies in China. Processes 2021, 9, 805. https://0-doi-org.brum.beds.ac.uk/10.3390/pr9050805
AMA Style
Wang X, Wei C, He Y, Zhang H, Wang Q. Research on the Correlation between Work Accidents and Safety Policies in China. Processes. 2021; 9(5):805. https://0-doi-org.brum.beds.ac.uk/10.3390/pr9050805
Chicago/Turabian StyleWang, Xiangbing, Chengmin Wei, Yonghang He, Hui Zhang, and Qifei Wang. 2021. "Research on the Correlation between Work Accidents and Safety Policies in China" Processes 9, no. 5: 805. https://0-doi-org.brum.beds.ac.uk/10.3390/pr9050805
Note that from the first issue of 2016, this journal uses article numbers instead of page numbers. See further details here.