
Influence of Orchard Cultural Practices during the Productive Process of Cherries through Life Cycle Assessment


1
Department of Electromechanical Engineering, University of Beira Interior, Rua Marquês d’Ávila e Bolama, 6201-001 Covilhã, Portugal
2
C-MAST—Center for Mechanical and Aerospace Science and Technologies, 6201-001 Covilhã, Portugal
3
UNIDEMI, Department of Mechanical and Industrial Engineering, NOVA School of Science and Technology (FCT NOVA), Universidade NOVA de Lisboa, 2829-516 Caparica, Portugal
*
Author to whom correspondence should be addressed.
Processes 2021, 9(6), 1065; https://0-doi-org.brum.beds.ac.uk/10.3390/pr9061065
Submission received: 21 May 2021
/
Revised: 8 June 2021
/
Accepted: 15 June 2021
/
Published: 18 June 2021
(This article belongs to the Special Issue Biotechnological Food-Oriented Processes)
Abstract
:This study describes the influence of orchard cultural practices during the productive process of cherries on the environmental impact in terms of energy, air, soil and water through a “farm to market” Life Cycle Assessment (LCA). The results were used to identify the orchard cultural practices that contribute significantly to the environmental impact and to find solutions to reduce those impacts, serving as best practices guide to improving the environmental performance and as benchmarks for other national and international cherry and fruit growers. Primary data for production, harvest and post-harvest periods were gathered experimentally. The openLCA 1.10.2 software and the ecoinvent 3.5 database were used for modelling. Test case scenarios are modelled to identify the influence of cultural practices in low and high cherry production campaigns depending on climatic conditions and consequently diseases and plagues. Moreover, results are compared with other studies, not only covering cherries but also other fruits. The energy consumption per hectare in the production phase is similar in test scenarios. The energy consumption of orchard cultural practices related to tractor use, fertilizers and fungicides application are the main hotspots in terms of global warming, freshwater ecotoxicity and eutrophication, and terrestrial acidification. The use of electric vehicles, change the warehouse location or redefine transportation routes can reduce this impact, along with the optimization of the cherry’s quantity transported in each trip. In addition, the use of plant protection products, fertilizers and herbicides with less environmental impact will contribute to this objective. For that, the use of agriculture and precision systems to predict the need for fertilizers (nutrients), herbicides and fungicides, the use of decision support systems to define the dates of cultural practices, as well as innovative and emerging food and by-products processing methods are suggested. Thus, this study identifies and quantifies the environmental impacts associated with the production system of cherries and their main hotspots. It provides a best-practices guide for sustainable solutions in orchard management that contributes to the competitiveness and sustainability of fruit companies.
1. Introduction
One of the most discussed topics nowadays is the environment and the impact of agricultural activities. So, in recent years, efforts have been made in several areas to develop sustainable alternatives that can replace or improve the current ones [1].
In recent years, the evolution from traditional practices to intensive agriculture in order to increase plantation productivity has led to environmental impacts, such as resource depletion, soil erosion and global warming, among others [2]. The agri-food sector has frequently been considered one of the major sectors with the highest environmental impact [3]. Over the years, intensive agriculture has been adopted with increasing frequency towards the point that it has become “a way of life” [4]. However, it also brings some consequences, including the increasing release of greenhouse gases into the environment and the levels of pathogens and chemicals in the water and the reduction of biodiversity [4].
Actually, according to the IPCC 2007 report, the direct impact of agriculture is between 10% and 12% of anthropogenic greenhouse gases (GHG) emissions [5]. Global GHG emissions from agriculture almost doubled between 1961 and 2016, more specifically increased from 2752 to 5294 Mt CO2 eq/year [6]. In 2015, GHG emissions from agriculture in Portugal represented about 10% of national emissions, totaling 6.8 Mt CO2 eq/year [7]. In 2018, the global production of fruit was approximately 865 million metric tons, where the highlights were the bananas with 115 million produced metric tons (13%) and the watermelons with 104 million produced metric tons (12%). The quantity of produced cherries in the same period was 3 million metric tons (0.35%) [8].
Therefore, it is critical to study these environmental impacts to find the main hotspots and try to develop strategies to mitigate those impacts. There are a variety of tools and methods to measure the environmental impacts. However, Life Cycle Assessment (LCA) is the most commonly used to achieve this purpose [9]. LCA is a holistic methodology standardized by ISO 14040: 2006 and ISO 14044: 2006 that aims to make the quantitative environmental assessment of a product, process or activity throughout its life cycle or useful life [10]. LCA studies allow researchers, consumers, and policy makers to compare two products and to opt for the product that displays the lowest environmental impact, as LCA considers the entire life cycle and prevents burden shifting. LCA studies applied to intensive agriculture in the literature are quite scarce.
Several studies have addressed LCA applications in agriculture in the past, especially since the current food–energy–water nexus has likely unforeseen negative outcomes, which can be avoided, through LCA, in the pursuit of sustainable development [11]. Vatsanidou et al. [12] applied LCA on the fertilizer application in a pear orchard in the context of precision agriculture. LCA was also applied in a framework of agricultural strategic development planning in the Balkan Region proposed by Tsangas et al. [13]. The results show that changes have to be made with the purpose of reducing the environmental footprint. The results of LCA and life cycle costing (LCC) obtained by Baum and Bieńkowski [14] show an integrated environmental and economic assessment of maize and rapeseed crops. A combined application of LCA and data envelopment analysis is applied in a study addressing intensive rice production in Japan was developed by Masuda [15]. Tang et al. [16] carried out a survey to unveil the current status of assessment of the impact of land use in agricultural LCA case studies that compared between distinct management practices. There are, in the literature, several articles of LCA applied to the cherry tomato, but only a few scarce and incomplete articles of LCA applied to sweet cherry. Finally, Tassielli et al. [3] performed an environmental LCA of fresh and processed sweet cherries in southern Italy. Svanes and Johnsen [17] developed this type of study for the consumption of apples, sweet cherries and plums from conventional agriculture in Norway. However, there are still many limits to the current studies related to intensive agricultural production and LCA applications. Since this type of agricultural production is more intensive, it demands more frequent treatments, propagation material, dedicated infrastructure and substrates, in order to ensure a higher production when comparing to other systems [18]. Therefore, this study aims to overcome the difficulties of assessing the environmental impacts of the production of sweet cherry fruit.
In 2017, world cherry production was 2,443,407 tons spread over 416,445 ha. Asia was responsible for 44.8% of total production, and Europe was the second continent with larger production (30.5% of world production) [19]. In Portugal, also in 2017, there was a cultivated area of 6215 ha and a production of 19,563 tons of cherry, which corresponds to the productivity of 3148 kg/ha [19].
In Portugal, the concentration of cherry trees is located in the region of Beira Interior and Trás-os-Montes [20]. The Center region of Portugal, where the cherry of Fundão, with Protected Geographical Indication (PGI), is located, represented approximately 44% of Portugal’s production, and it is the region responsible for most of the produced cherry [21]. Cherries certified as “Cereja do Fundão” PGI require that at the date of harvest, cherries from cherry trees Prunus avium L. must have the following specific characteristics: (1) a size of 24 mm or more; (2) Consistency with a Durofel index equal to or greater than 60; (3) Coloring between index 2 and 6 of the Centre technique interprofessionnel des fruits et légumes (CTIFL) color chart; (4) Soluble solids content equal to or greater than 12 °Brix. In addition, a number of harvest precautions must be taken into account; in particular, the fruits have to be harvested in a suitable and uniform maturity with stalk and without leaves and must be handled with the utmost care in order to avoid mechanical damage.
The objectives of this study are to describe the LCA of the productive system of cherry with Protected Geographical Indication in Portugal in order to assess the environmental impact in terms of energy, air, water and soil, and thus obtaining the environmental profile of their products. Thus, the novelty of this study lays in the results that are then utilized to identify areas that contribute significantly to the environmental impact and to find solutions in order to decrease those impacts by introducing the best practices to improve the environmental performance and as benchmarks for other national and international cherry and fruit growers. Additionally, it is important for identifying the environmental profile of these types of products due to the growing necessity for proper environmental certification of fruit products required by markets.
2. Materials and Methods
2.1. Goal and Scope
The primary goal of the study is to evaluate the energetic, air, soil and water impacts resulting from the productive system and post-harvest of cherry of Fundão “from farm to market.” It aims to detect the main hotspots that can be changed or manipulated to reduce their respective environmental impacts. The results will be compared with other studies, not only about cherries but also about other fruits. The cherry with PGI represents almost half of the country’s production in the center region of Portugal; thus, it is fundamental to analyze its environmental impact. In addition, life cycle assessment studies are increasingly being required to find more sustainable solutions for orchard management solutions; therefore, this study can bring a great contribution to the cherry sector.
2.2. Functional Unit
The functional unit (FU) is a measure of performance and has a reference function since it allows quantifying the results of orchard production so they can be comparable. In studies of fruit products, the definition of FU can be a complex process since this approach can be conducted in terms of quality or economy [22]. The FU for a product system, particularly in agriculture, can be mass-based or land-based, and they will provide different but interesting results. The comparison of the same production system across different FUs can lead to quite different scenarios. Fruit cultivars with a higher yield demonstrate a much better environmental performance using a mass-based FU, while fruit cultivars with lower productivity show better results with a land-based FU [22]. Some authors such as Tabatabaie and Murthy [23] and Sanderson et al. [24] opted for a mass-based FU (1 kg), and other authors such as Tricase et al. [25] and Ingrao et al. [26] chose a land-based FU (1 ha).
The FU defined for the energy consumption of cherry production was 1 hectare of an orchard. The choice fell on a land-based FU since the operations in the orchard are not production-dependent. For the rest of the environmental impact indicators, it was used 1 kg of produced cherry as a mass-based FU. This choice is aligned with the option of Gaspar et al. [27].
2.3. System Boundaries
The system boundaries define which processes and inputs are considered in the LCA study [23]. The system boundaries are defined through an iterative process where the starting point is chosen, and then, the next selected processes are added to be part of the system according to their importance and relevance for the study. This delimitation is very complex, and different authors define different boundaries. This difference in the selection of the limits and boundaries of the system for the LCA results in some problems, such as the difficulty in comparing the results of several studies since they do not cover the same processes [28].
The cherry LCA boundaries are “from farm to market,” and the limits are divided into two phases: cultivation/production period and harvest and post-harvest period. The cut-off criteria for these phases were to define and select the most relevant operations for the study taking into account environmental aspects in terms of energy, water, soil and air impact that can be simultaneously measured quantitatively and in a rigorous and objective way.
2.4. Inventory Analysis
This phase consists of collecting data and performing the necessary calculations to determine in quantitative terms all relevant inputs and outputs within the boundaries of the system [29]. It can be the most time-consuming phase due to the data collection since it is dependent on a good database and the availability of suppliers and customers to cooperate in the investigation [10].
This study requires a very strict and detailed data quality. That is why all the primary data for production, harvest and post-harvest periods were collected from a regional farm, which possesses 20 ha of cherry trees, but only 14 of those ha were considered, which were the ones in full production.
This type of localized cherry production, due to its characteristics, enjoys a strong reputation and is considered to have economic, agricultural, and gastronomic importance in the region. The production area of this cherry, in which the regional farm is inserted, provides very favorable edaphoclimatic conditions to the development. The existence of many cold hours during the winter, a mild spring, a hilly area that protects from the wind, granite soils and slope shale, coupled with the local producers’ know-how, result in the attributes of this cherry [30].
The annual cherry production of the farm was 10 tonnes/ha for each of the 14 ha in full production. The study considers the plantation area (5 m × 3 m) per tree, the number of trees per row and the number of rows where operations of the productive system occurred. The study only covers the impacts associated with one cherry production year because a complete study would require data of approximately 20 years to monitor the cherry tree lifecycle, i.e., from the plantation of the cherry tree until the tree removal. As the company was founded 9 years ago, that data was not available. To do this study, the openLCA 1.10.2 software (GreenDelta GmbH, Berlin, Germany) and the ecoinvent 3.5 database and the Life Cycle Impact Assessment (LCIA) method were also used.
However, there are some limitations to the employed tools. OpenLCA is a tool that uses methods and databases downloaded separately from other sources, and the quality of the results strongly depends on which database is used and for what purpose. Another limitation is the necessity for reference or comparison data in the used databases, which often require to be added by the user. Finally, LCIA has also some limitations, such as not every environmental area is referred to by the default method, and only some elementary flow are characterized, thus being difficult to include all their potential impacts.
This LCA study considers operations during the production and post-harvest phases. In the production phase, the operations of pruning, soil maintenance, spraying of plant protection products, irrigation, herbicide and fertilizer applications were considered. The post-harvest phase covers the operations of refrigerated storing, processing, packaging and transportation of the cherry. These limits can be observed in Figure 1.
2.4.1. Production Phase
The pruning is performed by electric pruning shears, which are connected to lithium batteries that consume 0.144 kWh. On average, a cherry tree in full production takes 5 min to go through maintenance pruning. Therefore, if 1 ha has 666 plants and 1 plant in full production is pruned in 5 min, the pruning lasts 55.5 h/ha.
The soil maintenance is conducted by two techniques: the sown cover crop between the lines and no-till soil maintenance in the lines of the orchard. To do the maintenance by the sown cover crop, a shredder/weeding machine is used, which takes, on average, 4 h/ha, and this operation is conducted two times per year. The no-till soil technique consists of the application of herbicides, specifically glyphosate. The herbicides are applied two times per year by a pulverization spraying machine, and it takes 2 h/ha per application.
The spraying of plant protection products consists on the application of fungicides and insecticides to protect the orchard against plague attacks and diseases. There are 7 applications of these products during the year, where 6 of them are applications of fungicides that occur simultaneously with 3 applications of insecticides. In addition, an application of insecticides is performed separately. Each application of fungicides and insecticides takes 1 h/ha.
The drip irrigation system is used in the analyzed farm because it is a localized system that always maintains the soil with the necessary humidity, generating good yields. The water is distributed in low intensity and high frequency directly in the root zone of the plants through the drippers. The water irrigation system consumes 2028 m3/ha during the year.
The fertilizers sprayed onto the soil are nitrogen, potassium, phosphorus, zinc, sulfur, magnesium, boron and calcium. The application lasts 1 h/ha, and it is made once a year.
2.4.2. Harvest and Post-Harvest Phase
The harvest is manually made by hand, and the harvested cherries are placed in boxes that are transported by 2 or 3 diesel fuel vans to the warehouse, where they are stored, processed and packaged. The warehouse is located between the parcels, which means that the transportation is variable. If the orchard is close to the warehouse, the trip is only a few meters away, and it is conducted by foot. On the other hand, the trip can take 5–10 min by van if the orchard is further away. These trips from the orchard to the warehouse are frequent, making it impossible to concentrate a large production in the field to avoid sun exposure and high temperatures. During the harvesting, the tractor is not used.
The cherries are stored in refrigeration chambers until they are transported to the retailer. Refrigeration plays an important role in preserving the properties of the cherry in the post-harvest phase and maintaining an adequate temperature and relative humidity. The cherry should be stored at temperatures between 0 °C and 4 °C in an atmosphere with relative humidity between 90% and 95% [31]. The company stores the cherry at temperatures between 2 °C and 3 °C, and the relative humidity is 90%. Therefore, it is possible to verify that the cooling conditions in the company are within the recommended parameters. This phase is very important to preserve the quality and the properties of the cherry.
InovEnergy (2012) includes the energy power consumptions for the cold storage of horticulture products of several companies in the Center region of Portugal. A linear relationship between the energy power consumption and the number of workers and tons of produced products was determined. Considering the company’s data close to very similar to those of specific farm that made part of this study (3 refrigeration chambers, annual production of 435 tons and 4 permanent workers), an energy power consumption of 25 521 kWh was considered for fruit storage at the company, resulting in energy consumption of 58.67 kWh/ton.
Finally, the transportation of the cherries from the warehouse to the retailer is subcontracted and is carried out by a truck that takes 2–3 h to complete the trip of 200–250 km. During the trip, the cherries are transported at temperatures between 2 °C and 5 °C, and the relative humidity of the air is between 80% and 90%, which are conditions very close to the ideal in order to preserve the quality of the product.
2.4.3. Input Flow
An in-depth investigation of the orchard system was performed to collect all the necessary data and identify the most relevant inputs inventories for cherries LCA. Therefore, energy inputs and emissions considered were from the fuel consumed in transport and in the orchard’s machinery, storage in the warehouse due to the refrigeration system, irrigation water and all plant protection products (fungicides and insecticides), herbicides and fertilizers applied in the soil.
To convert all the inputs considered into their respective energy equivalents, expressed in MJ/ha, the coefficients in Table 1 were used.
All the inputs considered in this cherries LCA are exposed in Table 2.
2.4.4. Emissions from the Inputs of the Cherries LCA
The fuel consumption for the production phase is difficult to calculate since the power of agricultural machines is very variable, as its consumption. According to IEA [34], the density of diesel fuel in Portugal is 0.837 kg/L. Therefore, the diesel fuel consumption of agricultural machinery was calculated using this value for a 60 horsepower (hp) tractor. According to Grisso et al. [35], it is possible to obtain the fuel consumption of the tractor as shown by Equation (1).
where:
- Cijk = Fuel consumption j during operation i execution using machine k (L/h);
- Pik = Power of the machine k used in operation i (hp).
Therefore, the fuel consumption of agricultural machinery during the production phase was 199.8697 L/ha.
According to Pereira et al. [36] and using values of the “EMEP/EEA Air Pollutant Emission Inventory Guidebook 2019” report, the emissions resulting from fuel burning can be calculated using three methods: Tier 1, Tier 2 and Tier 3. Tier 1 is the most basic method because it requires the least amount of information, while Tier 2 is suitable for more complex situations and in countries where specific emission factors are available. Tier 3 is the most complex method and requires access to a much larger amount of information and data. The emissions from fuel burning of agricultural machinery used during the production phase were calculated by Tier 2, as shown in Equation (2) [37].
where:
- Epollutant = Specific emissions for each pollutant (g);
- FCfuel category = Fuel consumption for each fuel category (kg);
- EFpollutant = Emission factor for each fuel category (g/kg).
The emissions from the transportation of the cherry can be divided into two different parts, one directed for the Light Commercial Vehicles, LCV < 3.5 tons and the other to the Heavy-Duty Vehicles, HDV > 3.5 tons. Emission factors were taken from the report “EMEP/EEA Air Pollutant Emission Inventory Guidebook 2019” considering the category Euro 3 for the LCV (registration of the vehicle between 2000 and 2004) and Euro 6 to HDV (registration of the vehicle after 2014) [38]. The remaining data for the transportation in the company is shown in Table 3.
The calculation of the emissions from the transportation of the cherry was made using the Tier 2 of the “EMEP/EEA Air Pollutant Emission Inventory Guidebook 2019” report, as shown by Equation (3) [38].
where:
- Epollutant = Specific emissions for each pollutant (kg or g);
- Ma,b,c = Travelled distance by the vehicle, according to the category a and technology c of the vehicle and the fuel category b (km);
- Na,b,c = Number of vehicles of the fleet, according to the category a and technology c of the vehicle and the fuel category b;
- EFa,b,c = Emission factor according to the category a and technology c of the vehicle and the fuel category b (g/kg).
The energy power consumed in the storage of the cherry is also a source of emissions for the air. According to IEA [34], for the gross production of electricity and heat for the years 2012–2014, an average emission factor of 0.322 kg CO2/kWh of energy power consumed considering its respective transmission and distribution was defined. Therefore, these emissions resulting from the storage of the cherry are calculated by Equation (4) [39].
where:
- Eenergy power = CO2 emissions to air from the energy power consumed for the storage of the cherry (kg CO2/ton of produced cherry);
- Cenergy power = Energy power consumed for the storage of the cherry (kWh/ton of produced cherry).
In addition to soil emissions, fertilizers are also a source of CO2 eq into the air. According to Hughes et al. [40], the emission factor for nitrogen fertilizers is 6.163 kg CO2 eq/kg of nitrogen fertilizer. Therefore, CO2 emissions can be calculated by Equation (5).
where:
- Enitrogen fertilizer = CO2 emissions to the air from nitrogen fertilizer applied into the soil (kg CO2 eq/ha);
- Qnitrogen fertilizer = Quantity of nitrogen fertilizer applied into the soil (kg of nitrogen fertilizer/ha).
The phosphorus fertilizer also emits CO2 into the air. According to Hughes et al. [40], the emission factor for phosphorus fertilizer is 1.859 kg CO2 eq/kg of phosphorus fertilizer. Therefore, CO2 emissions can be calculated by Equation (6).
where:
Ephosphorus fertilizer = CO2 emissions to the air from phosphorus fertilizer applied into the soil (kg CO2 eq/ha);
Qphosphorus fertilizer = Quantity of phosphorus fertilizer applied into the soil (kg of phosphorus fertilizer/ha).
The potassium fertilizer is also a source of CO2 emissions to the air. According to Hughes et al. [40], the emission factor is 1.770 kg CO2 eq/kg of potassium fertilizer. Therefore, CO2 emissions can be calculated by Equation (7).
where:
- Epotassium fertilizer = CO2 emissions to the air from potassium fertilizer applied into the soil (kg CO2 eq/ha);
- Qpotassium fertilizer = Quantity of potassium fertilizer applied into the soil (kg of potassium fertilizer/ha).
In addition to the emissions mentioned before from nitrogen fertilizers, there still are other direct and indirect emissions to the air resulting from that fertilizer. The direct emissions are due to the degradation of organic matter, releasing nitrogen fixed in the soil. These direct impacts, according to the “Portuguese National Inventory Report on Greenhouse Gases, 1990–2017”, can be calculated by Equation (8) [41]. The nitrogen fertilizer also has indirect N2O emissions to the air due to the volatilization and atmospheric deposition of the nitrogen applied into the soil. The nitrogen is volatilized in the form of NH3 and NOx, and, sometimes, a fraction of that volatilized nitrogen returns to the soil, and it is reemitted as N2O. Therefore, according to the “Portuguese National Inventory Report on Greenhouse Gases, 1990–2017”, the indirect N2O emissions resulting from the application of nitrogen fertilizers into the soil can be calculated by Equation (8) [41].
where:
- EdirectN2O = Direct emission from nitrogen fertilizer applied into the soil (kg N2O/ha);
- FAS = Quantity of nitrogen fertilizer applied into the soil (kg N/ha);
- Value of 0.010 = Emission factor for the emissions of N2O from nitrogen fertilizer applied into the soil (kg N2O-N/kg of nitrogen fertilizer applied into the soil);
- Value of 44/28 = Conversion factor from N2O–N emissions to N2O emissions.
The indirect emissions from nitrogen fertilizer applied into the soil was calculated using Equation (9).
where:
- N2O(DAT) = Indirect emissions from nitrogen fertilizer applied into the soil (kg N2O/ha);
- FAS = Quantity of nitrogen fertilizer applied into the soil (kg N/ha);
- 0.083 = Fraction of the nitrogen fertilizer that volatiles as NH3 and NOx (kg of volatilized N/kg of N applied into the soil);
- 0.010 = Emission factor for the emissions of N2O from nitrogen fertilizer applied into the soil (kg N2O–N/kg of nitrogen fertilizer applied into the soil);
- 44/28 = Conversion factor from N2O-N emissions to N2O emissions.
Fungicides applied into the soil are also a source of GHG emissions to the air. According to [40], the fungicides emission factor is 3.303 kg CO2 eq/kg of fungicides. Therefore, CO2 emissions can be calculated by Equation (10).
where:
- Efungicides = CO2 emissions to the air from fungicides applied into the soil (kg CO2 eq/ha);
- Qfungicides = Quantity of fungicides applied into the soil (kg of fungicides/ha).
Insecticides applied into the soil also emit CO2 to the air. According to [40], the insecticides emission factor is 4.744 kg CO2 eq/kg of insecticides. Therefore, CO2 emissions can be calculated by Equation (11).
where:
- Einsecticides = CO2 emissions to the air from insecticides applied into the soil (kg CO2 eq/ha);
- Qinsecticides = Quantity of insecticides applied into the soil (kg of insecticides/ha).
Herbicides applied into the soil are also a source of CO2 emissions to the air. According to [40], the herbicides emission factor is 5.076 kg CO2/kg of herbicides. Therefore, CO2 emissions can be calculated by Equation (12).
where:
- Eherbicides = CO2 emissions to the air from herbicides applied into the soil (kg CO2/ha);
- Qherbicides = Quantity of herbicides applied into the soil (kg of herbicides/ha).
2.4.5. Test Case Scenarios
The annual cherry production is very variable because it depends on the growing season and the climatic conditions, as they can be favorable or not to the development of diseases and plagues. In the agricultural region of Beira Interior (Portugal), the cherry registered substantial falls in production in some growing seasons that varied between approximately 50% (fall registered in 2007) and 60% (fall registered in 2016). These production falls were mainly due to adverse climatic conditions and plague attacks. On the other hand, there are also years, such as in 2011 and 2015, when conditions were favorable, resulting in a total production increase between 25% and 50% [42].
Therefore, two alternative scenarios were defined with the goal of making an analysis for the low and high cherry production scenarios. In scenario 1, the low production scenario, a decrease of 50% of production, from 10 tons/ha to 5 tons/ha, is considered due to adverse climatic conditions, the attack of plagues and the development of diseases in the orchard. This scenario will necessarily lead to an increase in the number of sprayings of plant protection products. In scenario 2, the high production scenario, an increase of 50% of production (from 10 tons/ha to 15 tons/ha) is considered due to favorable climatic conditions for the growth of the cherry, leading to a decrease in the number of sprayings of plant protection products.
The consumption of agricultural operations during the production phase remains the same in both scenarios because they do not depend on the produced quantity, except for the number of plant protection products sprayings. In the post-harvest phase, the same operations as in the real scenario are considered.
3. Results of Life Cycle Assessment
A few environmental impact indicators were analyzed, such as global warming, freshwater ecotoxicity, freshwater eutrophication, terrestrial acidification and terrestrial ecotoxicity for the Fundão’s cherry LCA. The global warming indicator was calculated using the CML 2001 method, while the remaining indicators were calculated using the ReCiPe 2008 Midpoint (E) method. The option for using two impact assessment methods fell on the fact that the CML 2011 method is more adequate to evaluate the global warming indicator while the ReCiPe 2008 Midpoint (E) method is more complete and suitable for the other indicators. Sanderson et al. [24] also conducted their study according to this division of methods. The results are shown in Table 4.
3.1. Energy Consumption
All the results regarding the energy consumption for the real and test scenarios are shown in Figure 2. The energy consumption for the real scenario is 29,956 MJ/ha. The spraying of plant protection products operation (including the diesel fuel consumed in this operation) is the most energy-consuming operation, being responsible for 8,241 MJ/ha (27.5%) of the total energy consumption. This component is followed by the application of herbicide (including the diesel fuel consumed in this operation) with 5,488 MJ/ha (18.3%), the application of fertilizers (including the diesel fuel consumed in this operation) with 5,292 MJ/ha (17.7%), the soil maintenance by sown cover crop with 4,502 MJ/ha (15.0%), the transportation with 3,015 MJ/ha (10.1%), the warehouse’s energy power with 2,112 MJ/ha (7.1%), the irrigation water with 1,278 MJ/ha (4.3%) and the pruning with 29 MJ/ha (0.1%). Diesel fuel accounts for 47.6% of the global energy consumption (14,270 MJ/ha). Comparing these results with other fruits, it appears that the proportion of 10.1% of transport in global energy consumption is quite close to the result obtained of 12.3% by Gaspar et al. [27] for Beira Interior’s peach. In that same study, diesel fuel also has a very significant proportion of 28.9% in total energy consumption, although it is lower than the present study of Fundão’s cherry. Tricase et al. [25] developed a study for the cherry in the Apulia region, Italy, where diesel fuel represents a considerable proportion of 59% of the total energy consumption, being in accordance with the results obtained in the present study. The value of 15.8% of the energy consumption of fertilizers is also in line with the value obtained of 12% in the study by [25].
Comparing the results of the real scenario with the test scenarios, scenarios 1 (low production scenario) and 2 (high production scenario) do not differ much in terms of the proportions for each operation. Thus, the environmental impact during the production period can be considered the base line for the environmental impact during the post-harvest period. A slight decrease of 390 MJ/ha is predicted in scenario 1 to an energy consumption of 29,566 MJ/ha. It is also predicted a decrease of 982 MJ/ha in scenario 2, thus to an energy consumption of 28,974 MJ/ha. Scenario 1 shows a slight increase in the energy consumption of the plant protection products spraying operation with a proportion of 34.5% of the global energy consumption, followed by the application of herbicides (18.6%) and the application of fertilizers (17.9%). The remaining energy consumption is distributed by the soil maintenance by sown cover crop (15.2%), transportation (5.1%), warehouse’s energy power (4.3%), irrigation water (4.3%) and pruning (0.1%). The proportion of diesel fuel consumption remains practically unchanged, standing at 47% of global energy consumption. Scenario 2 shows a slight decrease in the energy consumption of the plant protection products spraying operation to 17.7% of the global energy consumption. Therefore, the application of herbicides becomes the operation with the highest energy consumption with 18.9% of the global energy consumption, followed by the application of fertilizers (18.3%), transportation (15.6%), soil maintenance by sown cover crop (15.5%), warehouse’s energy power (9.4%), irrigation water (4.4%) and pruning (0.1%). The proportion of diesel fuel consumption remains practically unchanged, increasing only 1% to 48.6% of global energy consumption.
The main reason for the variations of the results for the test scenarios is the spraying of plant protection products, the operation with the larger energy consumption for the real scenario and scenario 1, due to the amounts of fungicides and insecticides applied into the soil and the diesel fuel consumed by the tractor during this operation. The difference in energy consumption related to the spraying of plant protection products is explained by the variation in the quantity of these products applied and the respective diesel fuel consumption of the tractor. In the real scenario, seven applications of these products were considered (six fungicides applications with three insecticides applications simultaneously and one more insecticide application separately). In scenario 1, the low production scenario requires nine applications of these products (six applications of fungicides with three applications of insecticides simultaneously, one application of fungicides and two applications of insecticides separately) because of the adverse weather conditions, the attack of plagues and the development of diseases. Scenario 1 conditions necessarily cause an increase in the spraying of plant protection products and leads to an increase in diesel fuel of the tractor as a result of the increase in tractor’s utilization by 2 h. In scenario 2, the high production scenario, four applications of these products were considered (four applications of fungicides with two applications of insecticides simultaneously) because of the favorable climatic conditions and the adverse conditions for the development of diseases and plague attacks. This condition leads to a decrease in the number of plant protection products spraying and the reduction of diesel fuel of the tractor as a result of the decrease in tractor’s utilization by 3 h.
3.2. Global Warming
According to Smith et al. [43], the main greenhouse gas (GHG) emissions resulting from agriculture are carbon dioxide (CO2), methane (CH4) and nitrous oxide (N2O). These gases are considered to be the main contributors to global warming. In this study, in addition to these gases, nitrogen oxides (NOx), sulfur dioxide (SO2), Non-methane volatile organic compounds (NMVOCs), carbon monoxide (CO) and ammonia (NH3) were also considered.
Therefore, the global warming “from farm to market” impact of Fundão’s cherry is 0.1536 kg CO2 eq/kg of produced cherry. The main contributors to global warming are the tractor’s diesel fuel, responsible for 0.0529 kg CO2 eq/kg of produced cherry (34.4%), and the fertilizers with 0.0509 kg CO2 eq/kg of produced cherry (33.1%). With less impact, the energy power for the warehouse contributes with 0.0189 kg CO2 eq/kg of produced cherry (12.3%), and the diesel fuel from transportation from the warehouse to the retailer is responsible for 0.0148 kg CO2 eq/kg of produced cherry (9.6%), as shown in Figure 3.
These results expose a considerable difference between exhaust gases system of agricultural machinery that works outside paved roads and the vehicles, such as a van or a truck, that operate on paved roads, resulting in a discrepancy between the two emissions of diesel fuel consumed by the tractor (34.4%) and emissions from the LCV (1.18%) and the HDV (9.62%). Therefore, considering the transportation from the warehouse to the retailer represents 9.62% of the total impact, it could be recommended to change the warehouse location closer to the retailer or to search for alternatives to do this transportation.
The proportion of 33.1% of the total impact due to the use of fertilizers is also quite appreciable when compared to the impact resulting from the use of herbicides (4.5%), fungicides (4.0%) and insecticides (0.8%). This difference can be explained by the high use of nitrogen as a fertilizer because it is applied in larger quantities, and it has an emission factor (6.163 kg CO2 eq/kg of nitrogen fertilizer applied into the soil) that is much higher compared to the other chemical compounds applied into the soil.
Analyzing the comparative results for the different operations for scenarios 1 and 2 shown in Figure 3, it is possible to verify that there is a drastic increase (almost double) of the environmental impact of global warming comparing the real scenario (0.1536 kg CO2 eq/kg of produced cherry) with scenario 1, which shows an emission of 0.2901 kg CO2 eq/kg of produced cherry. On the other hand, there is a slight decrease comparing the real scenario (0.1536 kg CO2 eq/kg of produced cherry) with scenario 2 (0.1046 kg CO2 eq/kg of produced cherry).
The impact of the diesel fuel consumption of the tractor increases its proportion to 40.1% of the total impact in scenario 1, and it decreases its influence by 28.7% in scenario 2. These variations are normal, considering that the tractor’s use increases in scenario 1 due to the increase in the number of plant protection products sprayings (fungicides and insecticides), and these number of these sprayings decrease in scenario 2, reducing the use of the tractor. For the same reason, the impact of fungicides and insecticides increases in scenario 1 and decreases in scenario 2.
3.3. Freshwater Ecotoxicity
All the chemical compounds applied in the orchard, such as herbicides, fungicides, insecticides or fertilizers, can have negative consequences for the environment or human health. The chemical elements that compose these products can be toxic and volatilize to the air, be drained into the surface water and infiltrate into groundwater [44]. These compounds may suffer chemical/physical modifications and circulate between different ecosystems, having the ability to be retained in the soil, water and atmosphere but also in animal and human food, threatening not only human health but also all living organisms [45].
Therefore, the freshwater ecotoxicity impact of Fundão’s cherry is 755.41 × 10⁻⁵ kg 1.4-DCB eq/kg of produced cherry. The main contributors to freshwater ecotoxicity are the fungicides with 458.53 × 10⁻⁵ kg 1.4-DCB eq/kg of produced cherry (60.7%) and the fertilizers with 281.09 × 10⁻⁵ kg 1.4-DCB eq/kg of produced cherry (37.2%). Then, in an almost residual impact, insecticides contribute with 14.59 × 10⁻⁵ kg 1.4-DCB eq/kg of produced cherry (1.9%), and the herbicides are responsible for 1.2 × 10⁻⁵ kg 1.4-DCB eq/kg of produced cherry (0.2%), as shown in Figure 4 and Table 5.
It can be verified that the fungicides and fertilizers together account for 97.9% of the total freshwater ecotoxicity impact. Fungicides represent a large proportion (60.7%) of the total impact due to the higher quantities applied into the soil compared with the insecticides and herbicides. Although fertilizers were applied in larger quantities than fungicides, they have a minor impact because the copper oxychloride, one of the fungicides applied, has a very high emission factor (3.4846 kg 1.4-DCB eq/kg of copper oxychloride applied into the soil) compared to the others.
Analyzing the comparative results for the different operations for scenarios 1 and 2 shown in Figure 4, there is a substantial increase (more than double) of the freshwater ecotoxicity impact comparing the real scenario (755.41 × 10⁻⁵ kg 1.4-DCB eq/kg of produced cherry) with scenario 1, which presents an emission of 1620.73 × 10−5 kg 1.4-DCB eq/kg of produced cherry. On the other hand, there is a considerable decrease (almost half) comparing the real scenario with scenario 2 (405.82 × 10⁻⁵ 1.4-DCB eq/kg of produced cherry).
In a more detailed analysis, the impact of the fungicides slightly increases its expression to 61.6% of the total impact in scenario 1 and decreases its influence to 52.4% in scenario 2. These variations are normal, considering that in scenario 1, there is an increase in the number of sprayings of plant protection products (fungicides and insecticides). In scenario 2, there is a decrease in those sprayings, reducing their impacts. For the same reason, the impact of insecticides increases in scenario 1 and decreases in scenario 2.
3.4. Freshwater Eutrophication
Freshwater eutrophication consists of the overgrowth of aquatic plants or the uncontrolled multiplication of algae as a result of high levels of nutrients in freshwater ecosystems. The main cause for the development of this phenomenon is the contamination by nutrients in the form of phosphorus from agricultural fertilizers, sewage effluents and leakage of urban rainwater. When the accumulation of phosphorus exceeds a certain limit, a recycling mechanism is activated, and the system remains closed in a eutrophic state even when nutrient inputs are considerably reduced [46].
Therefore, the freshwater eutrophication impact of Fundão’s cherry is 0.0025 kg Peq/kg of produced cherry. The total impact of freshwater eutrophication is due to the use of fertilizers, more specifically phosphorus. The nutrient phosphorus is responsible for the total impact on this indicator, as shown in Figure 5. The impact increases to 0.0050 kg Peq/kg of produced cherry in scenario 1 due to the increase in the amount of phosphorus applied into the soil. On the other hand, the impact decreases in scenario 2 to 0.0017 kg Peq/kg of the produced cherry because the quantity of phosphorus applied into the soil also decreases.
3.5. Terrestrial Acidification
Terrestrial acidification consists of the modification of the chemical properties of the soil as a result of the deposition of nutrients such as nitrogen and sulfur in acidifying forms. This deposition can result from the emissions of NOx, NH3 and SO2 into the air, which, in addition to acidifying the pH of the soil, causes a decline in the soil fertility that can lead to the discoloration of plant tissues, germination of new seeds and decrease in root production. This phenomenon culminates in the decrease in photosynthetic rates and, in extreme cases, in the decrease in plant biodiversity [47].
Therefore, the terrestrial acidification impact of Fundão’s cherry is 942.27 × 10⁻⁷ kg SO2 eq/kg of produced cherry. The main contributors to terrestrial acidification are the fertilizers with 664.56 × 10⁻⁷ kg SO2 eq/kg of produced cherry (70.5%) and the tractor’s diesel fuel with 266.51 × 10⁻⁷ kg SO2 eq/kg of produced cherry (28.3%). Then, in an almost residual impact, the diesel fuel consumed in the transportation from the warehouse to the retailer is responsible for 7.64 × 10⁻⁷ kg SO2 eq/kg of produced cherry (0.8%), and the diesel fuel consumed in the transportation from the orchard to warehouse accounts for 3.55 × 10⁻⁷ kg SO2 eq/kg of produced cherry (0.4%), as shown in Figure 6.
It can be verified that the fertilizers and tractor’s diesel fuel together account for 98.8% of the total terrestrial acidification impact. Fertilizers represent a large proportion (70.5%) due to the amounts of SO2 applied into the soil. The tractor’s diesel fuel also emits large amounts of SO2 due to its combustion, justifying its proportion in the total impact (28.3%). As stated before, the vehicles operating on paved roads have better exhaust gas systems, which is the reason why the diesel fuel of transport from the warehouse to the retailer and from the orchard to the warehouse causes an almost residual impact (0.8% and 0.4%, respectively).
Analyzing the comparative results for the different operations for scenarios 1 and 2 shown in Figure 6, there is a large increase (more than double) of the terrestrial acidification impact comparing the real scenario (942.27 × 10⁻⁷ kg SO2 eq/kg of produced cherry) with scenario 1, which presents an emission of 1,926.64 × 10−7 kg SO2 eq/kg of produced cherry. On the other hand, there is also a considerable decrease (almost half) comparing the real scenario with scenario 2 (605.26 × 10⁻⁷ kg SO2 eq/kg of produced cherry).
In a more detailed analysis, the impact of the tractor’s diesel fuel increases its proportion to 30.4% in scenario 1 and decreases to 25.0% in scenario 2. These variations are due to the increase in the number of sprayings of plant protection products (fungicides and insecticides) in scenario 1 that causes an increase in tractor’s use, while that impact decreases in scenario 2 because the number of those same sprayings decrease, reducing the tractor’s utilization too.
3.6. Terrestrial Ecotoxicity
Similar to freshwater ecotoxicity, terrestrial ecotoxicity consists of the impact of toxic substances on human health and biodiversity, in this case, on terrestrial ecosystems. Products applied into the soil, such as plant protection products or fertilizers, emit toxic substances that affect soil-dependent organisms and their ecosystems [48].
Therefore, the terrestrial ecotoxicity impact of Fundão’s cherry is 3894.26 × 10−5 kg 1.4-DCB eq/kg of produced cherry. The main contributors to terrestrial ecotoxicity are the fungicides with 3724.98 × 10−5 kg 1.4-DCB eq/kg of produced cherry (95.7%). The remaining impact is distributed by the fertilizers with 113.80×10⁻⁵ kg 1.4-DCB eq/kg of produced cherry (2.9%), insecticides with 54.03 × 10⁻⁵ kg 1.4-DCB eq/kg of produced cherry (1.4%) and the herbicides with 1.45 × 10⁻⁵ kg 1.4-DCB eq/kg of produced cherry (0.04%), as shown in Figure 7 and Table 6.
The fungicides are responsible for 95.7% of the total impact. This substantial proportion is due to the copper oxychloride applied onto the soil because it has a considerable emission factor (30.45 kg 1.4-DCB eq/kg of produced cherry) compared with the other chemical compounds.
Analyzing the comparative results for the different operations for scenarios 1 and 2 shown in Figure 7, there is a large increase (more than double) of the terrestrial ecotoxicity impact comparing the real scenario (3894.26 × 10−5 kg 1.4-DCB eq/kg of produced cherry) with scenario 1, which presents an emission of 8037.72 × 10−5 kg 1.4-DCB eq/kg of produced cherry. There is also a considerable decrease (more than half) comparing the real scenario with scenario 2 (1766.08 × 10−5 kg 1.4-DCB eq/kg of produced cherry). These variations are normal, considering that in scenario 1, there is an increase in the number of sprayings of plant protection products (fungicides and insecticides), causing an increase in the impact of these products. That same impact decreases in scenario 2 because of the number of those sprayings decreases.
3.7. Comparison with Results in Literature
The review of Clune et al. [49] compiles a considerable number of LCA studies of cherry and other products and defined its boundary from cradle to the regional distribution center, that is, from planting the cherry tree to the transportation of the cherry to the regional distribution center. The FU used was 1 kg of produced cherry. The transportation of the cherry to the regional distribution center in a recent study developed by Clune et al. [49] is considered equivalent to the transportation from the warehouse to retailer in the present study. These authors reached three values for the global warming indicator: 0.26, 0.29 and 0.88 kg CO2 eq/kg of minimum, average and maximum values of produced cherry, respectively. It is necessary to highlight that this review considers both cherry and sour cherry. The present study has a substantially lower comparative value (0.1536 kg CO2 eq/kg of produced cherry), even below the minimum value of that review. Some factors contribute to these results, such as the transportation distance between the warehouse and the retailer being shorter than in that study, the implementation of good environmental practices such as the use of electric pruning shears instead of pneumatic pruning shears, the use of a fully electric irrigation system and the fact that the harvesting process is conducted manually and without the use of the tractor.
The study of Sanderson et al. [24] “from cradle to market” defined the FU of 1 kg of marketable cherry; that is, only cherries deemed for sale were considered, excluding the ones that were disposed of due to low quality. This study presents the value for the global warming indicator of 0.30096 kg CO2 eq/kg of marketable cherry and did not account for 16.4% of the cherries disposed of in the packaging operation because it did not meet the requirements to be put up for sale. The study of Svanes and Johnsen [17] “from cradle to market” limit and the FU of 1 kg of cherry consumed shows a value of 0.53 kg CO2 eq/kg of cherry consumed. The present study of Fundão’s cherry is quite below the values of these two studies.
Comparing the results with other fruits, the value obtained in the present study is lower than the result of 0.23 kg CO2 eq/kg of produced apple and 0.29 kg CO2 eq/kg of produced peach in the study of Vinyes et al. [50] for apple and peach and “from cradle to retail” limit. Another study “from cradle to retail” for the apple of Keyes et al. [51] shows a value of 0.28 kg CO2 eq/kg of produced apple for the global warming indicator. Comparing the study of Svanes and Johnsen [17], which determined the value of 0.74 kg CO2 eq for the plum in a “from cradle to market” limit for the FU of 1 kg of consumed plum but did not consider the 12.7% of the low-quality disposed plum, it is also possible to verify that the present study for the cherry shows a substantially lower value. In addition to the good practices at the company previously mentioned, other possible explanations for these results are the non-inclusion of the “cradle” phase and the electricity consumed in the irrigation system in this Fundão’s cherry LCA.
Figure 8 shows the comparative values of the global warming indicator for the studies mentioned above.
Therefore, it can be concluded that, although more LCA studies are needed for the cherry in Portugal in order to solidify these results, the global warming indicator “from farm to market” of Fundão’s cherry is lower comparing with studies from other countries.
The freshwater ecotoxicity indicator of Fundão’s cherry is 755.41 × 10⁻⁵ kg 1.4-DCBeq/kg of produced cherry. This value is very similar to the result obtained in the study of [24] “from cradle to market” that shows the value for the freshwater ecotoxicity indicator of 763 × 10−5 kg 1.4-DCBeq/kg of marketable cherry.
The freshwater eutrophication indicator of Fundão’s cherry is 0.0025 kg Peq/kg of produced cherry. This value is slightly higher than the result of 0.00050 kg Peq/kg of marketable cherry obtained in the study of Sanderson et al. [24] “from cradle to market” that did not consider 16.4% of the produced cherry because it was disposed of due to its low quality. Comparing with the study of Svanes and Johnsen [17] that presents a value of 0.0045 kg PO4 eq/kg of cherry consumed for limit “from cradle to market” and an FU of 1 kg of cherry consumed, the present study shows a slightly lower value. Comparing the results of the freshwater eutrophication indicator with other fruits, it is possible to verify that the result obtained in the present study is slightly higher than the result of 0.0018 kg PO4 eq/kg of apple consumed and lower than the result of 0.0054 kg PO4 eq/kg of plum consumed in the study of Svanes and Johnsen [17] with a “from cradle to market” limit. This study did not consider 12.7% of plums disposed of and 15.3% of apples disposed of that did not meet selling requirements.
The terrestrial acidification indicator of Fundão’s cherry is 9.42 × 10⁻⁵ kg SO2 eq/kg of produced cherry. This value is substantially lower than the result of 167 × 10−5 kg SO2 eq/kg of marketable cherry obtained in the study of Sanderson et al. [24] “from cradle to market” that did not consider 16.4% of the produced cherry because of its disposal due to low quality. The Fundão’s cherry LCA also shows a much lower value than the result of 690 × 10−5 kg SO2 eq/kg of cherry consumed in the study of Svanes and Johnsen [17] with a “from cradle to market” limit. Comparing the results of the terrestrial acidification indicator with other fruits, the results obtained in the present study is also inferior to the result of 250 × 10−5 kg SO2 eq/kg of apple consumed and the result of 610 × 10−5 kg SO2 eq/kg of plum consumed in the study of Svanes and Johnsen [17] “from cradle to market” limit. As previously mentioned, this study did not consider 12.7% of plums disposed of and 15.3% of apples disposed of because of theirs low quality.
The terrestrial ecotoxicity indicator of Fundão’s cherry is 3894.26 × 10−5 kg 1.4-DCBeq/kg of produced cherry. This value is substantially higher than the result of 58 × 10−5 kg 1.4-DCBeq/kg of marketable cherry obtained in the study of Sanderson et al. [24] “from cradle to market” that did not consider 16.4% of the produced cherry because it did not meet the selling requirements.
Therefore, the majority of the indicators are lower than the results of the studies analyzed here. These results can be explained by several factors, such as the national environmental policies related to the agriculture and agribusiness sector. The legislation and financial support granted by the government, combined with new innovative techniques, allow achieving a very positive environmental performance. One of the examples of this effort in terms of environmental performance is the “Roadmap for Carbon Neutrality 2050 (RNC 2050)” whose main objective is to make Portugal a carbon-neutral country, that is, the balance between GHG emissions and carbon sequestration is neutral [7]. Portugal is even below the European average in terms of GHG emissions from agriculture, among other indicators [52]. In addition, the small size of the country and, consequently, the travelled distances also being shorter, contribute to a more adequate environmental performance.
4. Analysis and Discussion of Results
This Fundão’s cherry LCA study “from farm to market” analyses the impacts in four parameters: energetic, water, air and soil impact. Therefore, the relevant environmental aspects of the production, harvest and post-harvest phases that could have an impact on these parameters within the defined limits were considered in order to promote the improvement of the environmental performance for the entire production system of Fundão’s cherry.
The energy consumption led to the conclusion that, for the production phase, the energy consumption per hectare is the same regardless of the production, except for the spraying of plant protection products operation. The global energy consumption is 29,956 MJ/ha for the real scenario. Comparing these results, there are no significant variations in the global energy consumption between the real scenario, scenario 1 (29,566 MJ/ha) and scenario 2 (28,974 MJ/ha).
The global warming indicator is 0.1536 kg CO2 eq/kg of produced cherry, showing the tractor’s diesel fuel (34.4%) and the fertilizers (33.1%) as the main hotspots. Comparing these results, scenario 1 reveals a considerable increase (0.2901 kg CO2 eq/kg of produced cherry), and scenario 2 shows exactly the opposite, that is, a considerable decrease (0.1046 kg of CO2 eq/kg of produced cherry). In addition, the use of other plant protection products, fertilizers and herbicides with less environmental impact or reducing the number of the spraying of these compounds could also be a solution to reduce the environmental impact.
The water impact assessment was evaluated by the indicators of freshwater ecotoxicity and freshwater eutrophication. The freshwater ecotoxicity indicator is 755.41 × 10⁻⁵ kg 1.4-DCBeq/kg of produced cherry. The main contributors to freshwater ecotoxicity are the fungicides with 60.7% of the total impact and the fertilizers with 37.2%. For this indicator, scenario 1 shows a substantial increase compared to the real scenario (1620.73 × 10−5 kg 1.4-DCBeq/kg of produced cherry), and scenario 2 shows a considerable decrease (405.82 × 10⁻⁵ kg 1.4-DCBeq/kg of produced cherry). The freshwater eutrophication indicator is 0.0025 kg Peq/kg of produced cherry. The freshwater eutrophication impact is caused by the use of phosphorus fertilizers. Comparing with the real scenario, the impact increases to 0.0050 kg Peq/kg of produced cherry in scenario 1 due to the increase in the amount of phosphorus applied into the soil and, in the opposite direction, it decreases in scenario 2 to 0.0017 kg Peq/kg of produced cherry because that same amount of phosphorus applied in the soil also decreases. The replacement of phosphorus-based fertilizers with another chemical element cannot be a solution to reduce this environmental impact since phosphorus is one of the macronutrients that has a very important role in plant growth and development; therefore, it is not possible to make the replacement by another chemical element. However, phosphorus release could be controlled in a more efficient manner in order to limit phosphorus losses, and, in turn, use less fertilizer [53,54].
The soil impact assessment was evaluated by the indicators of terrestrial acidification and terrestrial ecotoxicity. The terrestrial acidification indicator is 942.27 × 10⁻⁷ kg SO2 eq/kg of produced cherry. The main contributors to terrestrial acidification are the fertilizers (70.5%) and the tractor’s diesel fuel (28.3%). For this indicator, scenario 1 shows a considerable increase compared to the real scenario (1926.64 × 10−7 kg SO2 eq/kg of produced cherry) and scenario 2 also shows a substantial decrease to 605.26 × 10⁻⁷ kg SO2 eq/kg of produced cherry). The terrestrial ecotoxicity is 3894.26 × 10−5 kg 1.4-DCBeq/kg of produced cherry. The main contributors to this impact are fungicides (95.7%). Comparing with the real scenario, the impact increases to 8037.72 × 10−5 kg 1.4-DCBeq/kg of produced cherry in scenario 1, and it decreases to 1766.08 × 10−5 kg 1.4-DCBeq/kg of produced cherry in scenario 2. The use of electric vehicles could mitigate this impact, along with the optimization of the cherry’s quantity transported in each trip. In addition, the use of other plant protection products, fertilizers and herbicides with less environmental impact or reducing the number of sprayings of these compounds could also be a solution to reduce the environmental impact.
Therefore, in general, there is an increase in the environmental impact indicators in scenario 1 and a decrease in scenario 2. These variations are mainly explained by the same reason, that is, the increase of the number of sprayings of plant protection products and tractor’s operating time in scenario 1 and the reduction of these two factors in scenario 2. So, although there is a higher consumption of transportation and storage in scenario 2 due to the higher production, the environmental impacts of this scenario are minor due to the fewer sprayings of plant protection products (reduction of the impact of fungicides, insecticides and tractor’s diesel fuel).
Additionally, the company analyzed in this study shows a very positive environmental performance for Fundão’s cherry, even greater than other cherry’s LCA studies. The company has already implemented a few positive practices to reduce energy consumption and environmental impacts, such as the use of electric pruning shears instead of pneumatic pruning shears and the use of a fully electric irrigation system instead of using a diesel fuel pump. A possible suggestion for an even better environmental performance is to change the warehouse location to one closer to the retailer or to define alternatives for the transportation from the warehouse to the retailer, such as the use of electric vehicles. In addition, it is possible to choose other hypotheses to improve environmental performance, such as the use of agriculture and precision systems to identify the effective need for fertilizers (nutrients), herbicides and fungicides, the use of decision support systems to define the dates of agricultural operations to reduce their environmental impact and the optimization of the performance of the refrigeration systems of the chambers, which can be the simple explanation of good practices to the employees.
5. Conclusions
A cherries LCA study “from farm to market” is conducted to analyse the impacts in four parameters: energetic, water, air and soil impact. Results allow identifying the orchard cultural practices that contribute significantly to the environmental impact. Low and high cherry production scenarios that depend on climatic conditions and that are influenced by diseases and plagues are modelled. Best practices are described to improving the environmental performance the energy consumption per hectare in the production phase is similar in test scenarios. The energy consumption of orchard cultural practices related to tractor use, fertilizers and fungicides application are the main hotspots in terms of global warming, freshwater ecotoxicity and eutrophication, and terrestrial acidification.
Results show that transportation is an essential factor for reducing the global warming potential effects of agriculture. The expected accelerated increase regarding agricultural land occupation gravely highlights the importance of performing LCA studies. Therefore, farming practices such as fertilizer management, fuel use, and cultivation are quite significant. Likewise, options among transport methods and supply chain strategies carry important consequences for the global warming potential. This reality highlights the importance for policy makers to promote the best farming practices and transportation in a carbon-constrained world. Policies shaped towards climate change mitigation are gradually being informed by the results of greenhouse gas LCA from different areas of economic activity.
In order to stimulate the scientific knowledge and to strengthen the results obtained in this LCA study, there are some suggestions for future work: conducting LCA studies of other cherry farms in the region of Beira Interior; conducting studies with more in-depth limits and boundaries, preferably “from cradle to grave” studies, that is, an analysis of all stages from the plantation of the cherry tree until the moment that the cherry reaches the consumer; further analysis of the cooling system and the irrigation system; inclusion of disposal waste from the production system.
LCA studies should be carried out on biological or intensive fruit productive systems, such as vineyards or small fruits (red fruits), among others, to promote the competitiveness and sustainability of agricultural companies.
Author Contributions
Conceptualization, P.D.G.; formal analysis, P.D.G. and R.B.; investigation: R.B.; methodology: R.B.; software: R.B.; project administration: P.D.G.; supervision, P.D.G.; writing—original draft, R.B.; writing—review and editing, P.D.G. and R.G. All authors have read and agreed to the published version of the manuscript.
Funding
This study is within the activities of Project “PrunusPós—Optimization of processes for the storage, cold conservation, active and/or intelligent packaging and food quality traceability in post-harvested fruit products,” project n.° PDR2020-101-031695, Partnership n.° 87, initiative n.° 175, promoted by PDR 2020 and co-funded by FEADER within Portugal 2020. The authors are thankful for the opportunity and financial support to conduct this project from Fundação para a Ciência e Tecnologia (FCT) and R&D Unit “Center for Mechanical and Aerospace Science and Technologies” (C-MAST), under project UIDB/00151/2020. Radu Godina acknowledges Fundação para a Ciência e a Tecnologia (FCT—MCTES) for its financial support via the project UIDB/00667/2020 (UNIDEMI).
Institutional Review Board Statement
Not applicable.
Informed Consent Statement
Not applicable.
Data Availability Statement
Not applicable.
Acknowledgments
We thank Frutas com Vida for supplying the production data for the life cycle assessment. We thank AppiZêzere for supplying relevant data of cherries production for the life cycle assessment.
Conflicts of Interest
The authors declare no conflict of interest.
References
- Shrestha, N.K.; Wang, J. Water Quality Management of a Cold Climate Region Watershed in Changing Climate. J. Environ. Inform. 2019, 35, 56–80. [Google Scholar] [CrossRef]
- FAO. The State of Food and Agriculture 2019. In Moving Forward on Food Loss and Waste Reduction; FAO: Rome, Italy, 2019; ISBN 9789251317891. [Google Scholar]
- Tassielli, G.; Notarnicola, B.; Renzulli, P.A.; Arcese, G. Environmental Life Cycle Assessment of Fresh and Processed Sweet Cherries in Southern Italy. J. Clean. Prod. 2018, 171, 184–197. [Google Scholar] [CrossRef]
- Kughur, P.G.; Otene, V.A.; Audu, O. Effects of Intensive Agricultural Production on the Environment in Benue State, Nigeria. IOSR J. Agric. Vet. Sci. Vet. I 2015, 8, 2319–2372. [Google Scholar] [CrossRef]
- Reay, D.; Sabine, C.; Smith, P.; Hymus, G. Intergovernmental Panel on Climate Change; Fourth Assessment Report; Inter-Governmental Panel on Climate Change: Geneva, Switzerland; Cambridge University Press: Cambridge, UK, 2007; ISBN 9291691224. [Google Scholar]
- Tubiello, F.N. Greenhouse Gas Emissions Due to Agriculture; Elsevier: Amsterdam, The Netherlands, 2019; ISBN 9780081005965. [Google Scholar]
- Portuguese Environmental Agency. Roteiro Para a Neutralidade Carbónica (RNC 2050) 2019. Available online: https://www.portugal.gov.pt/pt/gc21/comunicacao/documento?i=roteiro-para-a-neutralidade-carbonica-2050- (accessed on 5 June 2021).
- Statista. Global Fruit Production in 2018, by Selected Variety (in Million Metric Tons). Available online: https://0-www-statista-com.brum.beds.ac.uk/statistics/262266/global-production-of-fresh-fruit/ (accessed on 5 June 2021).
- Asif, Z.; Chen, Z. A Life Cycle Based Air Quality Modeling and Decision Support System (LCAQMS) for Sustainable Mining Management. J. Environ. Inform. 2019, 35, 103–117. [Google Scholar] [CrossRef]
- Roy, P.; Nei, D.; Orikasa, T.; Xu, Q.; Okadome, H.; Nakamura, N.; Shiina, T. A Review of Life Cycle Assessment (LCA) on Some Food Products. J. Food Eng. 2009, 90, 1–10. [Google Scholar] [CrossRef]
- Livingstone, D.; Smyth, B.M.; Foley, A.M.; Murray, S.T.; Lyons, G.; Johnston, C. Willow Coppice in Intensive Agricultural Applications to Reduce Strain on the Food-Energy-Water Nexus. Biomass Bioenergy 2021, 144, 105903. [Google Scholar] [CrossRef]
- Vatsanidou, A.; Fountas, S.; Liakos, V.; Nanos, G.; Katsoulas, N.; Gemtos, T. Life Cycle Assessment of Variable Rate Fertilizer Application in a Pear Orchard. Sustainability 2020, 12, 6893. [Google Scholar] [CrossRef]
- Tsangas, M.; Gavriel, I.; Doula, M.; Xeni, F.; Zorpas, A.A. Life Cycle Analysis in the Framework of Agricultural Strategic Development Planning in the Balkan Region. Sustainability 2020, 12, 1813. [Google Scholar] [CrossRef] [Green Version]
- Baum, R.; Bieńkowski, J. Eco-Efficiency in Measuring the Sustainable Production of Agricultural Crops. Sustainability 2020, 12, 1418. [Google Scholar] [CrossRef] [Green Version]
- Masuda, K. Eco-Efficiency Assessment of Intensive Rice Production in Japan: Joint Application of Life Cycle Assessment and Data Envelopment Analysis. Sustainability 2019, 11, 5368. [Google Scholar] [CrossRef] [Green Version]
- Tang, L.; Hayashi, K.; Kohyama, K.; Leon, A. Reconciling Life Cycle Environmental Impacts with Ecosystem Services: A Management Perspective on Agricultural Land Use. Sustainability 2018, 10, 630. [Google Scholar] [CrossRef] [Green Version]
- Svanes, E.; Johnsen, F.M. Environmental Life Cycle Assessment of Production, Processing, Distribution and Consumption of Apples, Sweet Cherries and Plums from Conventional Agriculture in Norway. J. Clean. Prod. 2019, 238, 117773. [Google Scholar] [CrossRef]
- Ilari, A.; Toscano, G.; Boakye-Yiadom, K.A.; Duca, D.; Foppa Pedretti, E. Life Cycle Assessment of Protected Strawberry Productions in Central Italy. Sustainability 2021, 13, 4879. [Google Scholar] [CrossRef]
- FAO. FAOSTAT Crops. Food and Agriculture Organization of the United Nations; FAO: Rome, Italy, 2021; Available online: http://www.fao.org/faostat/en/#home. (accessed on 5 June 2021).
- Ramos, A.C.; Ferreira, A.; Sousa, B.; Rodrigues, N.; Pereira, J.A. Qualidade Pós-Colheita de Cultivares de Cereja Refrigerada. In Proceedings of the 4o Simpósio Nacional de Fruticultura; Duarte, A., Oliveira, C., Eds.; Associação Portuguesa de Horticultura (APH): Lisboa, Portugal, 2020; pp. 74–80. [Google Scholar]
- INE. Estatísticas Agrícolas 2017; INE: Lisboa, Portugal, 2018. [Google Scholar]
- Cerutti, A.K.; Beccaro, G.L.; Bruun, S.; Bosco, S.; Donno, D.; Notarnicola, B.; Bounous, G. Life Cycle Assessment Application in the Fruit Sector: State of the Art and Recommendations for Environmental Declarations of Fruit Products. J. Clean. Prod. 2014, 73, 125–135. [Google Scholar] [CrossRef]
- Tabatabaie, S.M.H.; Murthy, G.S. Cradle to Farm Gate Life Cycle Assessment of Strawberry Production in the United States. J. Clean. Prod. 2016, 127, 548–554. [Google Scholar] [CrossRef] [Green Version]
- Sanderson, V.; Bamber, N.; Pelletier, D.N. Cradle-to-Market Life Cycle Assessment of Okanagan (Canada) Cherries: Helicopters, Seasonal Migrant Labour and Flying Fruit. J. Clean. Prod. 2019, 229, 1283–1293. [Google Scholar] [CrossRef]
- Tricase, C.; Rana, R.; Andriano, A.M.; Ingrao, C. An Input Flow Analysis for Improved Environmental Sustainability and Management of Cherry Orchards: A Case Study in the Apulia Region. J. Clean. Prod. 2017, 156, 766–774. [Google Scholar] [CrossRef]
- Ingrao, C.; Matarazzo, A.; Tricase, C.; Clasadonte, M.T.; Huisingh, D. Life Cycle Assessment for Highlighting Environmental Hotspots in Sicilian Peach Production Systems. J. Clean. Prod. 2015, 92, 109–120. [Google Scholar] [CrossRef]
- Gaspar, J.P.; Gaspar, P.D.; da Silva, P.D.; Simões, M.P.; Santo, C.E. Energy Life-Cycle Assessment of Fruit Products-Case Study of Beira Interior’s Peach (Portugal). Sustain. Switz. 2018, 10, 3530. [Google Scholar] [CrossRef] [Green Version]
- Li, T.; Zhang, H.; Liu, Z.; Ke, Q.; Alting, L. A System Boundary Identification Method for Life Cycle Assessment. Int. J. Life Cycle Assess. 2014, 19, 646–660. [Google Scholar] [CrossRef]
- ISO. ISO 14040:2006 Environmental Management—Life Cycle Assessment—Principles and Framework; ISO: Geneva, Switzerland, 2006. [Google Scholar]
- Gonçalves, A.C.; Bento, C.; Silva, B.M.; Silva, L.R. Sweet Cherries from Fundão Possess Antidiabetic Potential and Protect Human Erythrocytes against Oxidative Damage. Food Res. Int. 2017, 95, 91–100. [Google Scholar] [CrossRef] [PubMed] [Green Version]
- Baptista, P. Sistemas de Segurança Alimentar Na Cadeia de Transporte e Distribuição de Produtos Alimentares; Forvisão—Consultoria em Formação Integrada: Guimarães, Portugal, 2007; ISBN 9789728942038. [Google Scholar]
- Demircan, V.; Ekinci, K.; Keener, H.M.; Akbolat, D.; Ekinci, C. Energy and Economic Analysis of Sweet Cherry Production in Turkey: A Case Study from Isparta Province. Energy Convers. Manag. 2006, 47, 1761–1769. [Google Scholar] [CrossRef]
- Ozkan, B.; Akcaoz, H.; Karadeniz, F. Energy Requirement and Economic Analysis of Citrus Production in Turkey. Energy Convers. Manag. 2004, 45, 1821–1830. [Google Scholar] [CrossRef]
- IEA. Energy Prices and Taxes for OECD Countries 2019; IEA: Paris, France, 2020; pp. 1–29.
- Grisso, R.D.; Kocher, M.F.; Vaughan, D.H. Predicting Tractor Fuel Consumption. Appl. Eng. Agric. 2004, 20, 553–561. [Google Scholar] [CrossRef]
- Pereira, T.; Seabra, T.; Pina, A.; Freitas, L.; Amaro, A. Portuguese Informative Inventory Report: 1990–2013; Portuguese Environmental Agency: Amadora, Portugal, 2015. [Google Scholar]
- Winther, M.; Dore, C. EMEP/EEA Air Pollutant Emission Inventory Guidebook 2019: Combustion—Non Road Mobile Machinery; EEA: Copenhaga, Denmark, 2019. [Google Scholar]
- Ntziachristos, L.; Samaras, Z. EMEP/EEA Air Pollutant Emission Inventory Guidebook 2019: Combustion—Road Transport; EEA: Copenhaga, Denmark, 2019. [Google Scholar]
- European Investment Bank. EIB Methodologies for the Assessment of Project GHG Emissions and Emission Variations; European Investment Bank: Kirchberg, Luxembourg, 2018. [Google Scholar]
- Hughes, D.J.; West, J.S.; Atkins, S.D.; Gladders, P.; Jeger, M.J.; Fitt, B.D. Effects of Disease Control by Fungicides on Greenhouse Gas Emissions by UK Arable Crop Production. Pest Manag. Sci. 2011, 67, 1082–1092. [Google Scholar] [CrossRef]
- Pereira, T.; Amaro, A.; Borges, M.; Silva, R.; Pina, A.; Canaveira, P. Portuguese National Inventory Report on Greenhouse Gases, 1990–2017; UNFCCC: Amadora, Portugal, 2019. [Google Scholar]
- INE Produção Das Principais Culturas Agrícolas (t) Por Localização Geográfica (Região Agrária) e Espécie, Anual. Available online: https://www.ine.pt/xportal/xmain?xpid=INE&xpgid=ine_indicadores&indOcorrCod=0000021&contexto=bd&selTab=tab2 (accessed on 10 February 2020).
- Smith, P.; Martino, D.; Cai, Z.; Gwary, D.; Janzen, H.; Kumar, P.; McCarl, B.; Ogle, S.; O’Mara, F.; Rice, C.; et al. Greenhouse Gas Mitigation in Agriculture. Philos. Trans. R. Soc. B Biol. Sci. 2008, 363, 789–813. [Google Scholar] [CrossRef] [Green Version]
- Holka, M.; Bieńkowski, J. Assessment of Toxicity Impacts of Chemical Protection of Winter Wheat, Sugar Beet and Winter Rape on Aquatic Ecosystems and Humans. Zemdirbyste 2020, 107, 131–138. [Google Scholar] [CrossRef]
- Pazikowska-Sapota, G.; Galer-Tatarowicz, K.; Dembska, G.; Wojtkiewicz, M.; Duljas, E.; Pietrzak, S.; Dzierzbicka-Glowacka, L.A. The Impact of Pesticides Used at the Agricultural Land of the Puck Commune on the Environment of the Puck Bay. PeerJ 2020, 2020, 1–21. [Google Scholar] [CrossRef] [Green Version]
- Rocha, J.; Biggs, R.; Peterson, G.; Carpenter, S. Freshwater Eutrophication. Available online: https://www.regimeshifts.org/item/55-freshwater-eutrophication#. (accessed on 22 April 2020).
- Azevedo, L.B.; Roy, P.-O.; Verones, F.; van Zelm, R.; Huijbregts, M.A.J. Chapter 7—Terrestrial Acidification. In LC-impact Version 1.0; LC-IMPACT; 2016; pp. 69–82. Available online: https://lc-impact.eu/doc/LC-IMPACT_Overall_report_20201113.pdf (accessed on 5 June 2021).
- Fairbrother, A.; Hope, B. Terrestrial Ecotoxicology. In Encyclopedia of Toxicology; Wexler, P., Ed.; Elsevier Ireland Limited: Limerick, Ireland, 2005; pp. 138–142. [Google Scholar]
- Clune, S.; Crossin, E.; Verghese, K. Systematic Review of Greenhouse Gas Emissions for Different Fresh Food Categories. J. Clean. Prod. 2017, 140, 766–783. [Google Scholar] [CrossRef] [Green Version]
- Vinyes, E.; Asin, L.; Alegre, S.; Muñoz, P.; Boschmonart, J.; Gasol, C.M. Life Cycle Assessment of Apple and Peach Production, Distribution and Consumption in Mediterranean Fruit Sector. J. Clean. Prod. 2017, 149, 313–320. [Google Scholar] [CrossRef]
- Keyes, S.; Tyedmers, P.; Beazley, K. Evaluating the Environmental Impacts of Conventional and Organic Apple Production in Nova Scotia, Canada, through Life Cycle Assessment. J. Clean. Prod. 2015, 104, 40–51. [Google Scholar] [CrossRef] [Green Version]
- European Comission Climate Change & Air Quality. Available online: https://agridata.ec.europa.eu/extensions/DashboardIndicators/Climate.html (accessed on 28 April 2020).
- Eltohamy, K.M.; Liu, C.; Khan, S.; Niyungeko, C.; Jin, Y.; Hosseini, S.H.; Li, F.; Liang, X. An Internet-Based Smart Irrigation Approach for Limiting Phosphorus Release from Organic Fertilizer-Amended Paddy Soil. J. Clean. Prod. 2021, 293, 126254. [Google Scholar] [CrossRef]
- Fertahi, S.; Bertrand, I.; Ilsouk, M.; Oukarroum, A.; Amjoud, M.; Zeroual, Y.; Barakat, A. New Generation of Controlled Release Phosphorus Fertilizers Based on Biological Macromolecules: Effect of Formulation Properties on Phosphorus Release. Int. J. Biol. Macromol. 2020, 143, 153–162. [Google Scholar] [CrossRef] [PubMed]
Figure 1.
System Boundaries of cherries LCA.

Figure 2.
Specific energy consumption (MJ/ha), considering the operations of pruning, plant protection products spraying, herbicides application, warehouse, soil maintenance (sown cover crop), irrigation water, fertilizers application and transportation for the real and test scenarios.
Figure 2.
Specific energy consumption (MJ/ha), considering the operations of pruning, plant protection products spraying, herbicides application, warehouse, soil maintenance (sown cover crop), irrigation water, fertilizers application and transportation for the real and test scenarios.

Figure 3.
The global warming indicator for the FU of 1 kg of produced cherry for the real and test scenarios, considering the insecticides, transportation from the orchard to the warehouse’s diesel fuel, herbicides, transportation from the warehouse to the retailer’s diesel fuel, fertilizers and tractor’s diesel fuel environmental impacts.

Figure 4.
The freshwater ecotoxicity Indicator for the FU of 1 kg of produced cherry for the real and test scenarios, considering the herbicides, insecticides, fertilizers and fungicides environmental impacts.
Figure 4.
The freshwater ecotoxicity Indicator for the FU of 1 kg of produced cherry for the real and test scenarios, considering the herbicides, insecticides, fertilizers and fungicides environmental impacts.

Figure 5.
Freshwater eutrophication for the FU of 1 kg of produced cherry for the real and test scenarios, considering the phosphorus fertilizer environmental impact.
Figure 5.
Freshwater eutrophication for the FU of 1 kg of produced cherry for the real and test scenarios, considering the phosphorus fertilizer environmental impact.

Figure 6.
Terrestrial acidification for the FU of 1 kg of produced cherry for the real and test scenarios, considering the transportation from the orchard to the warehouse’s diesel fuel, transportation from the warehouse to the retailer’s diesel fuel, tractor’s diesel fuel and fertilizers environmental impacts.

Figure 7.
Terrestrial ecotoxicity for the FU of 1 kg of produced cherry for the real and test scenarios, considering the herbicides, insecticides, fertilizers and fungicides environmental impacts.
Figure 7.
Terrestrial ecotoxicity for the FU of 1 kg of produced cherry for the real and test scenarios, considering the herbicides, insecticides, fertilizers and fungicides environmental impacts.

Figure 8.
Comparison of the Global Warming Indicator results.


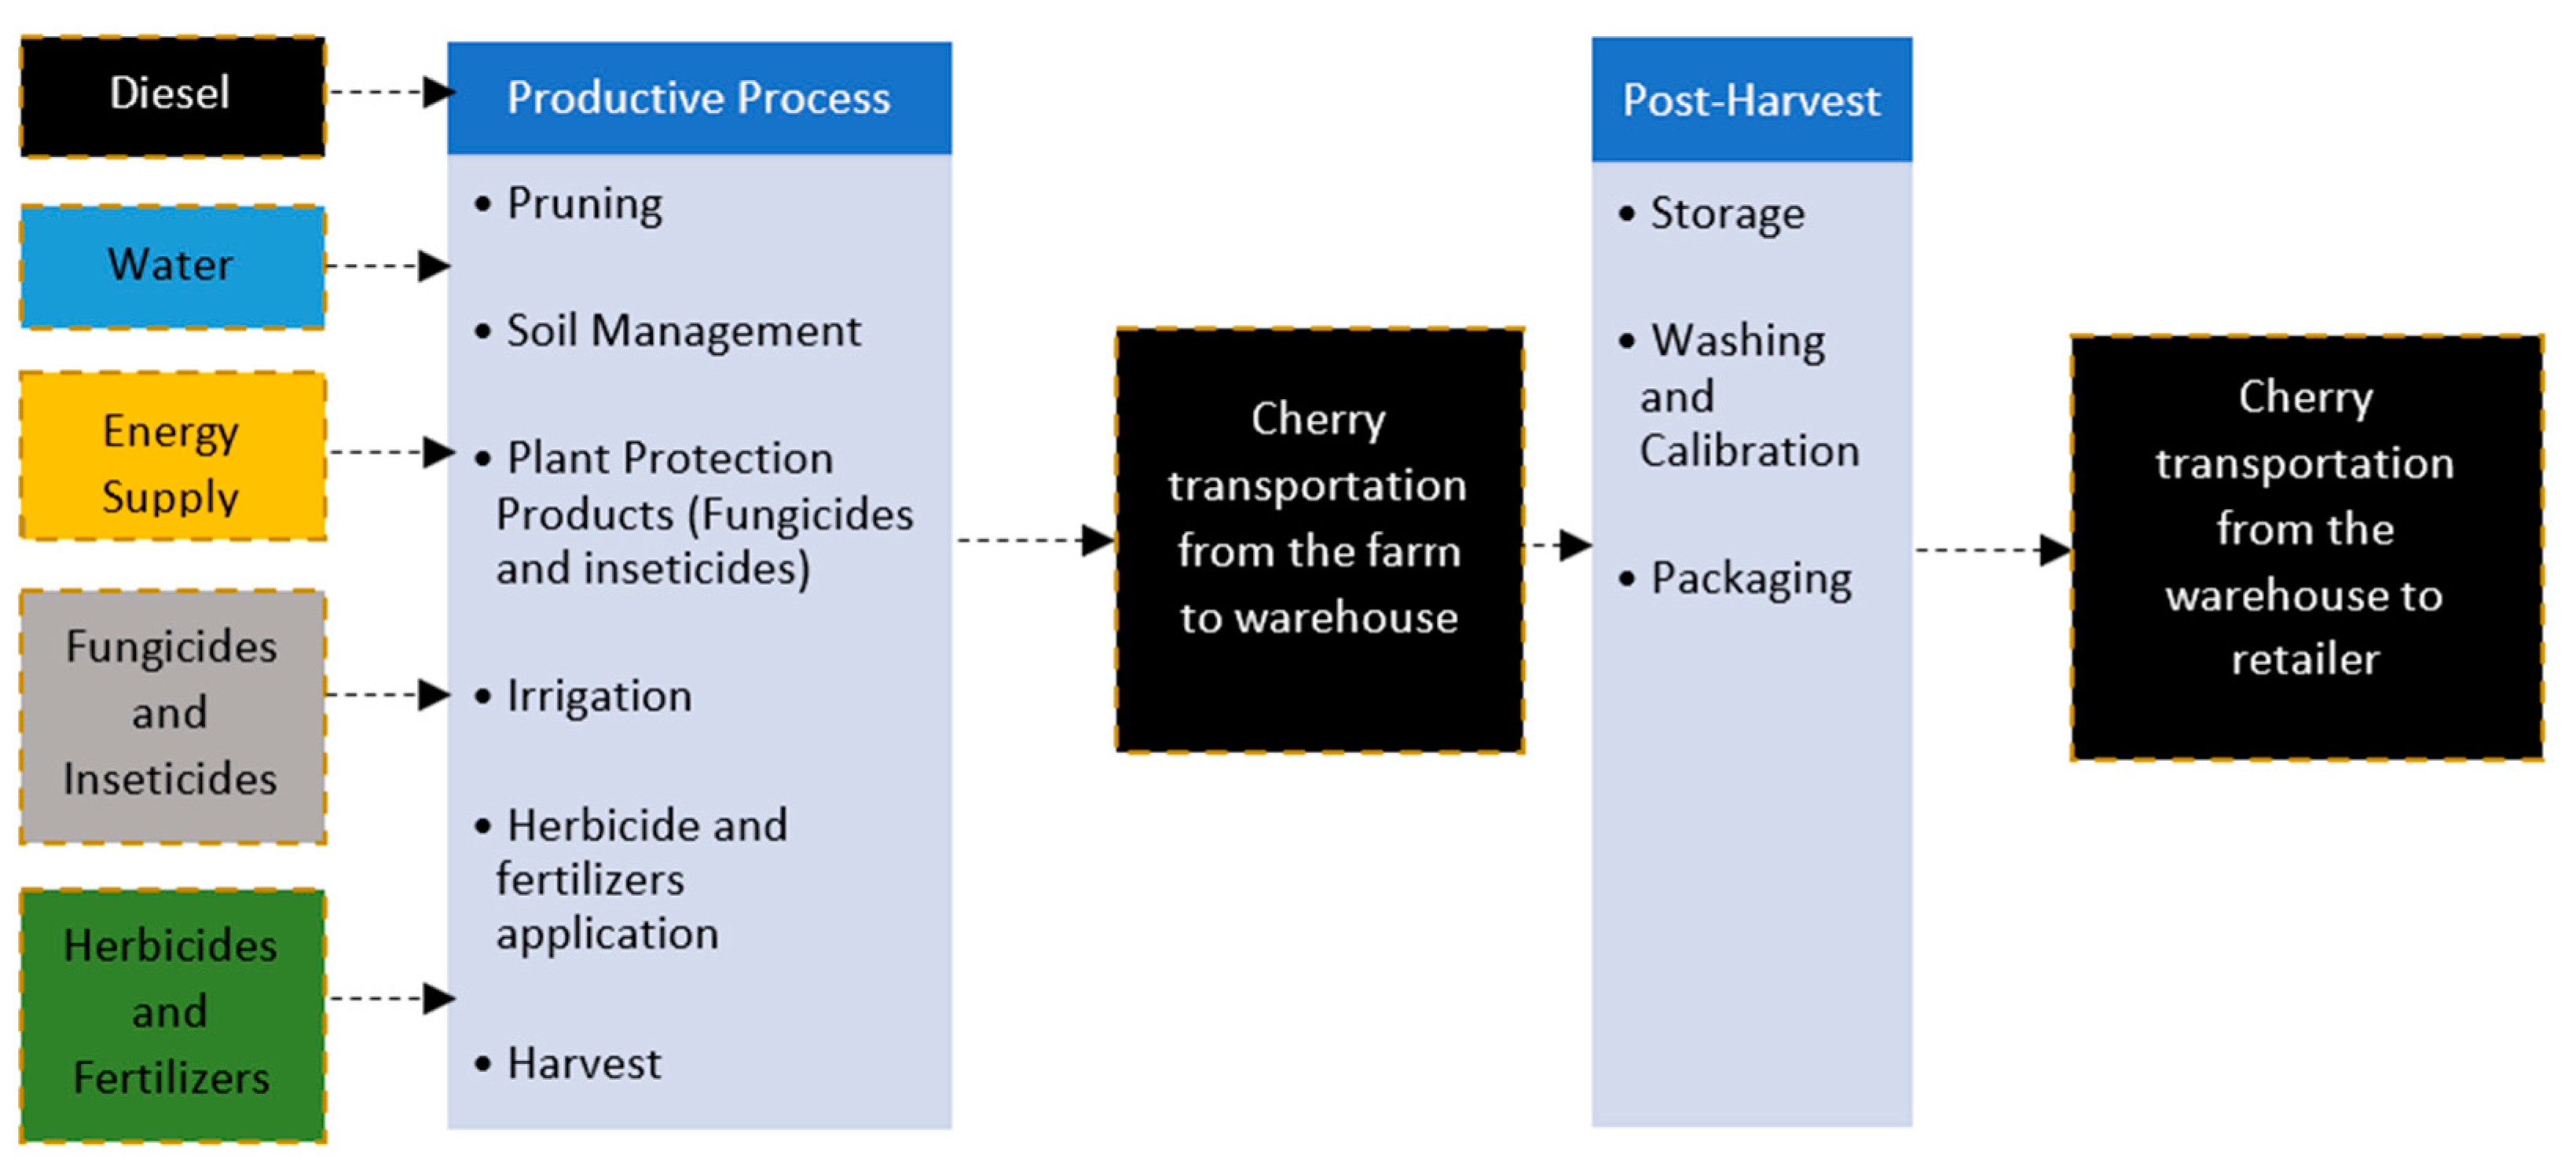
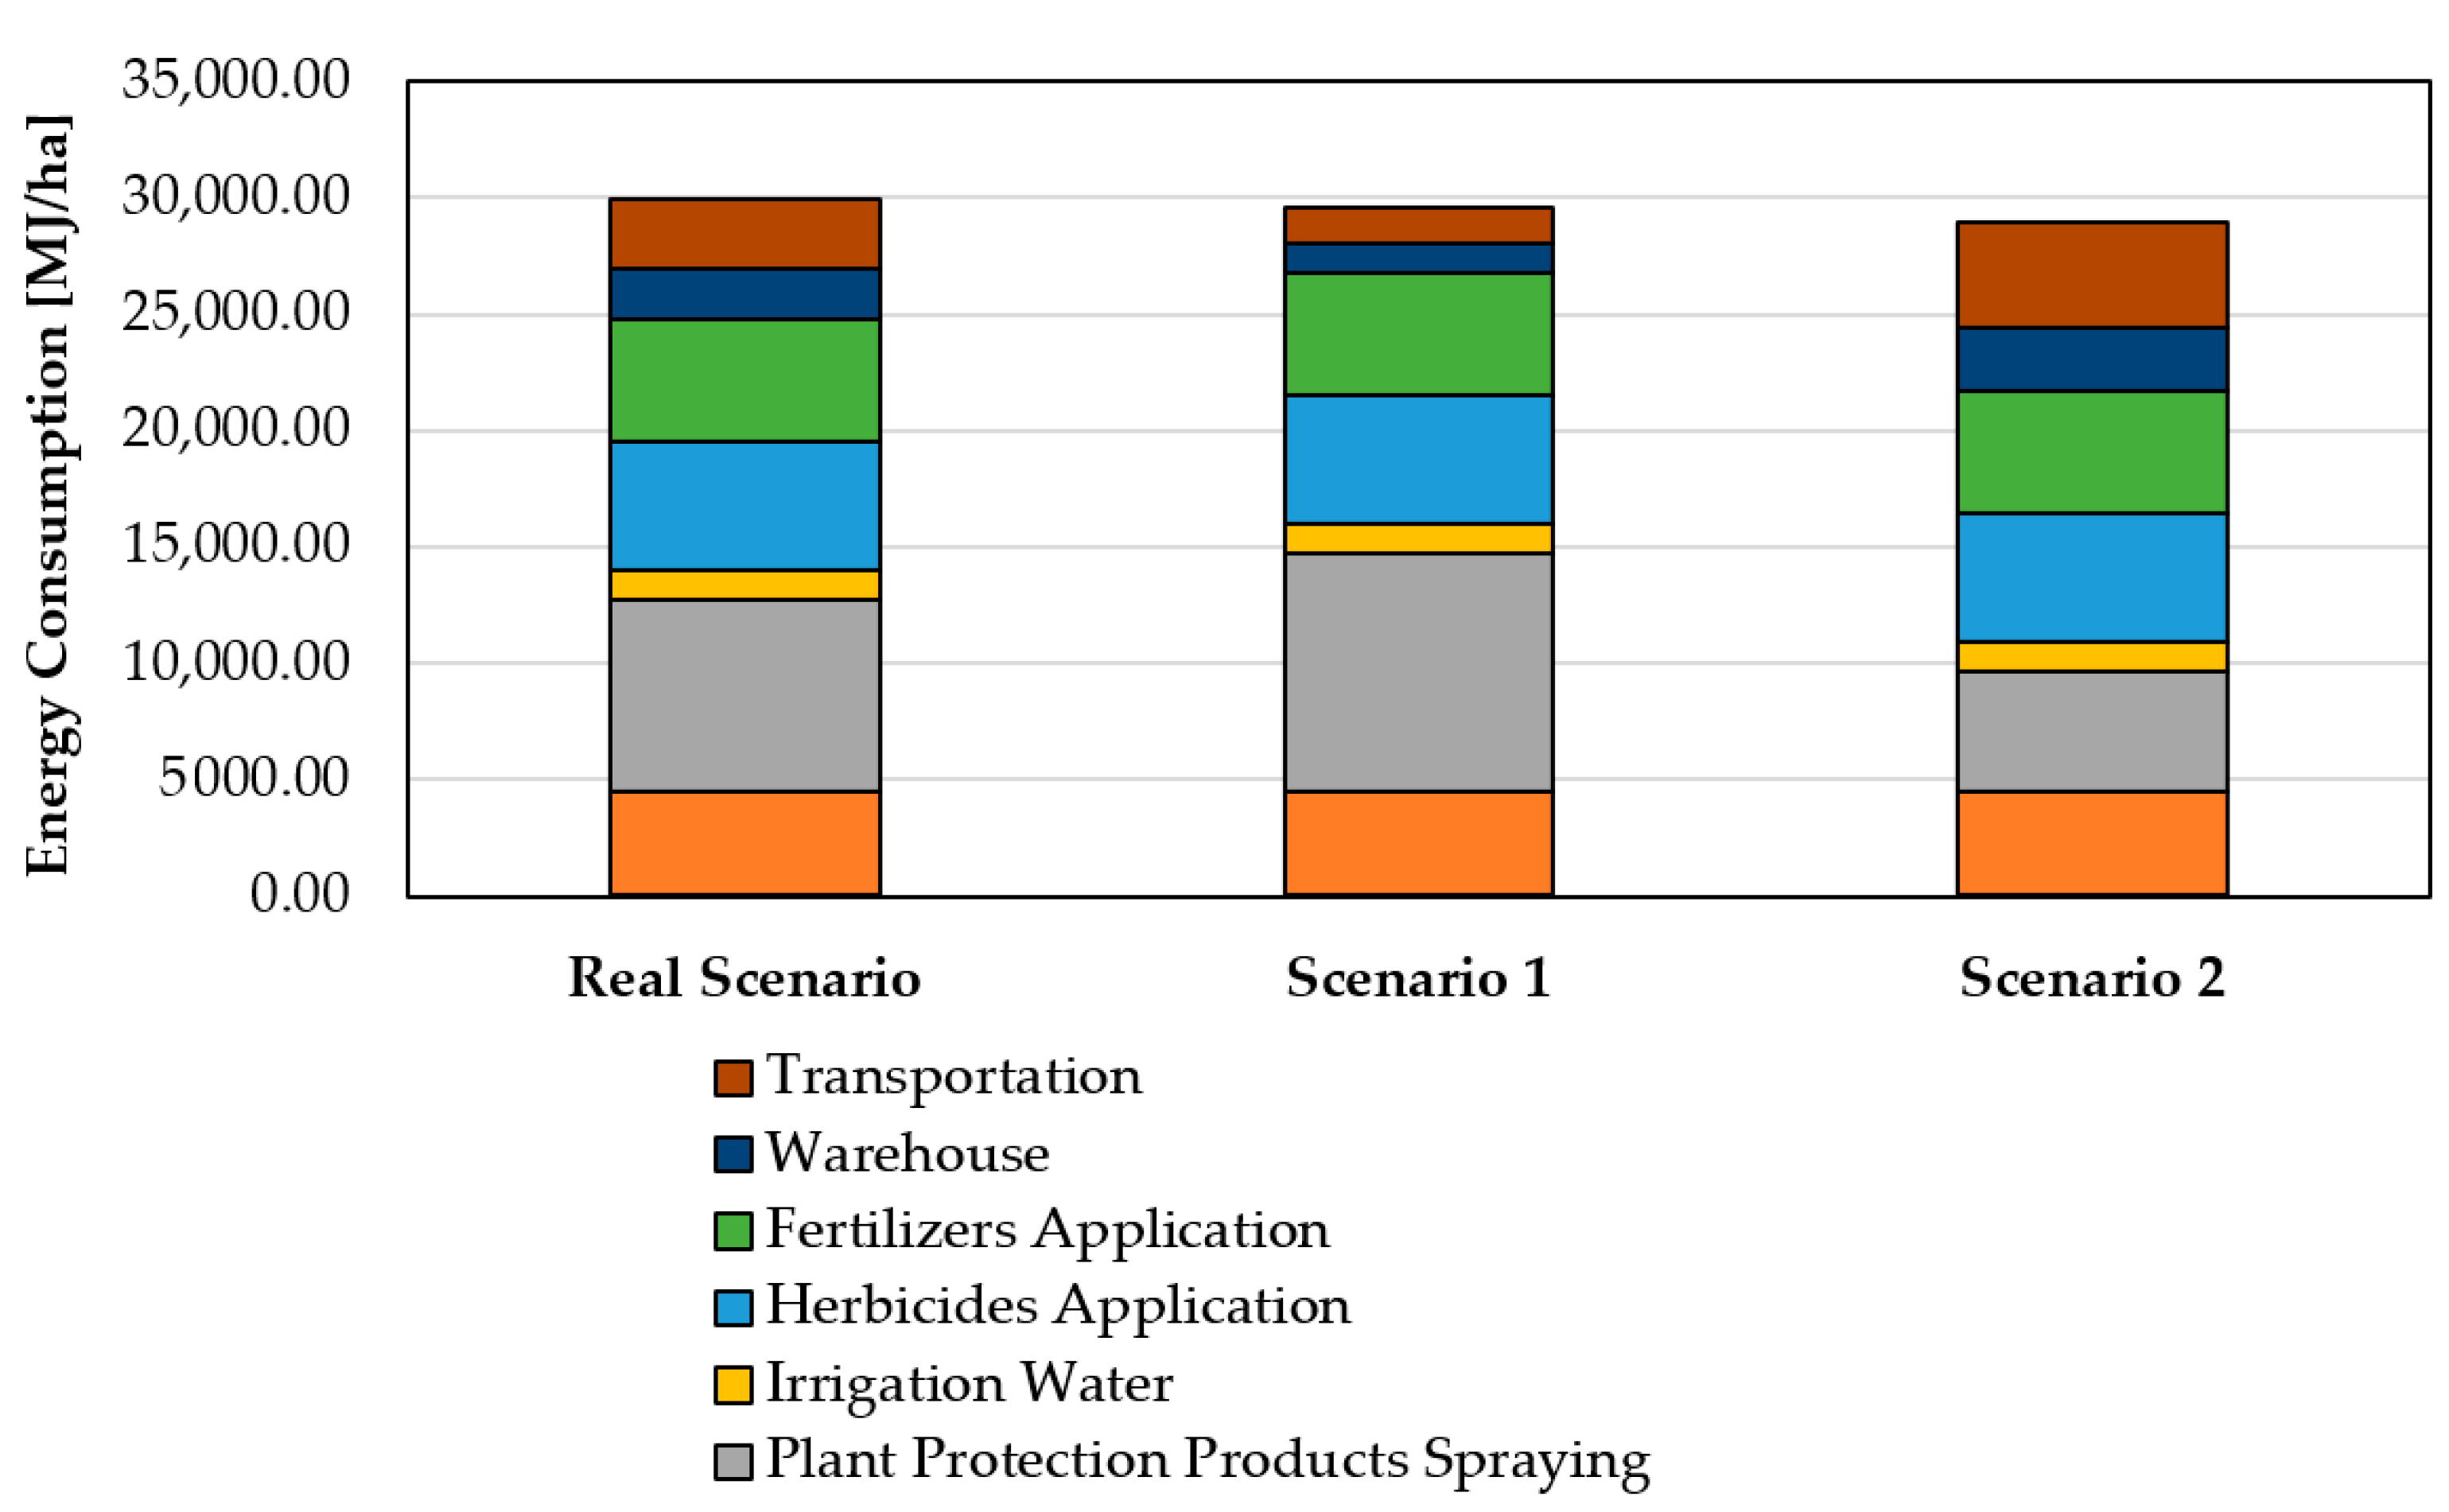
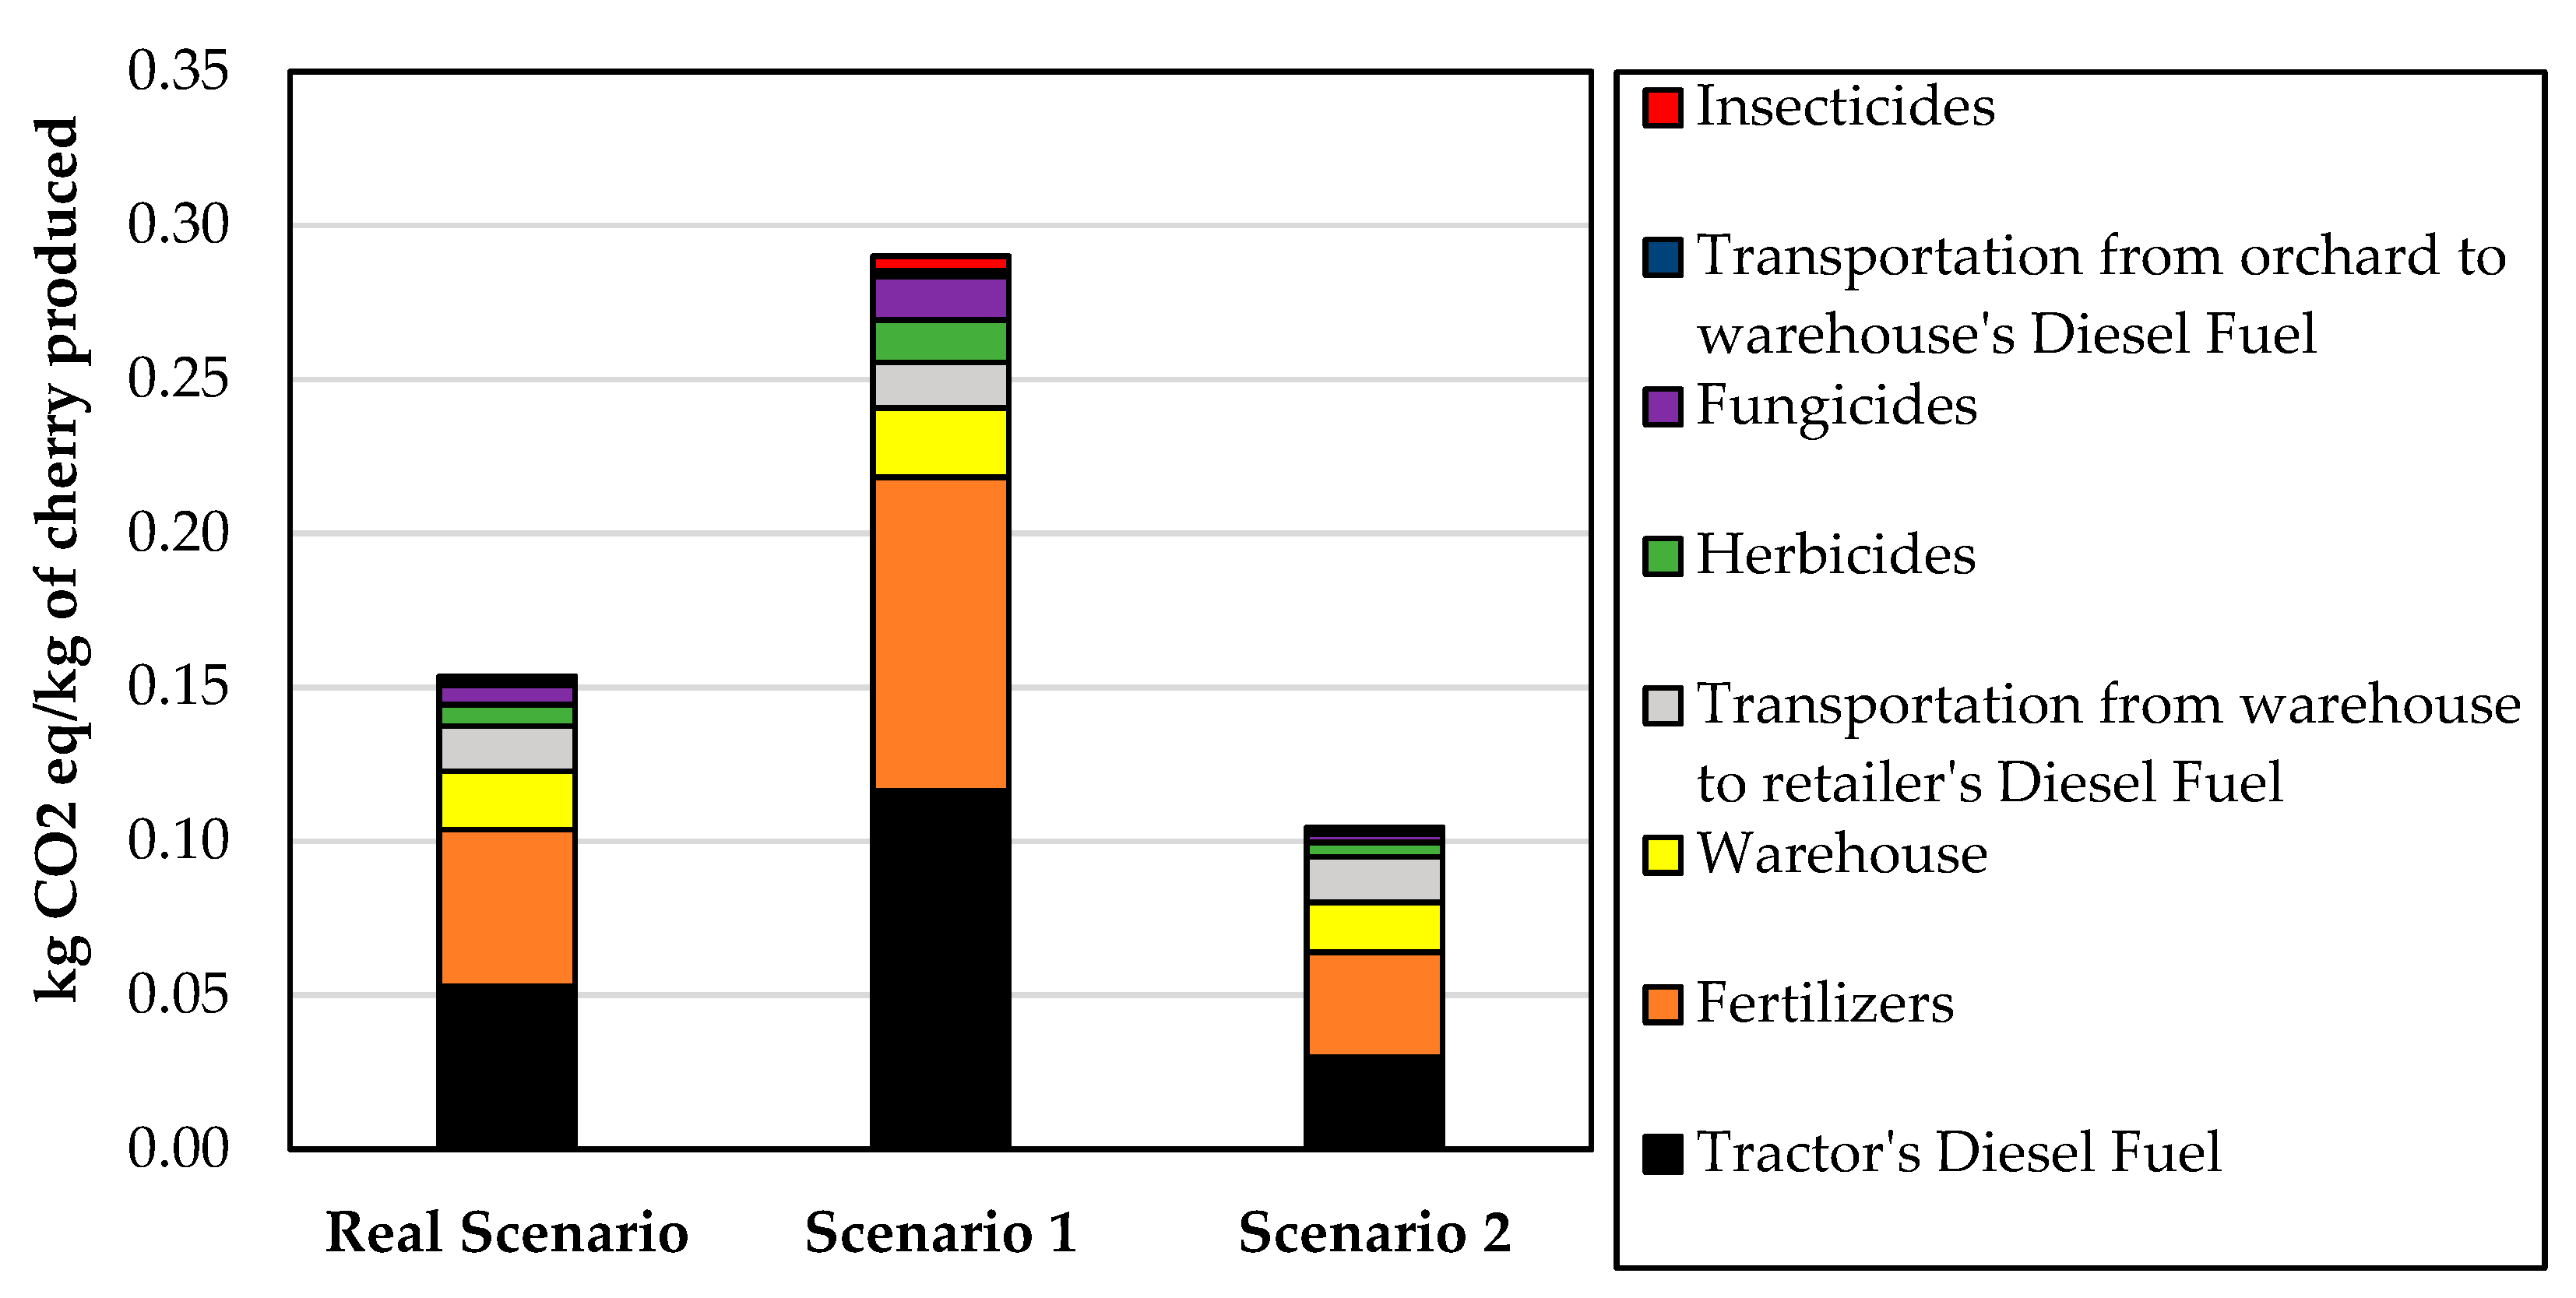
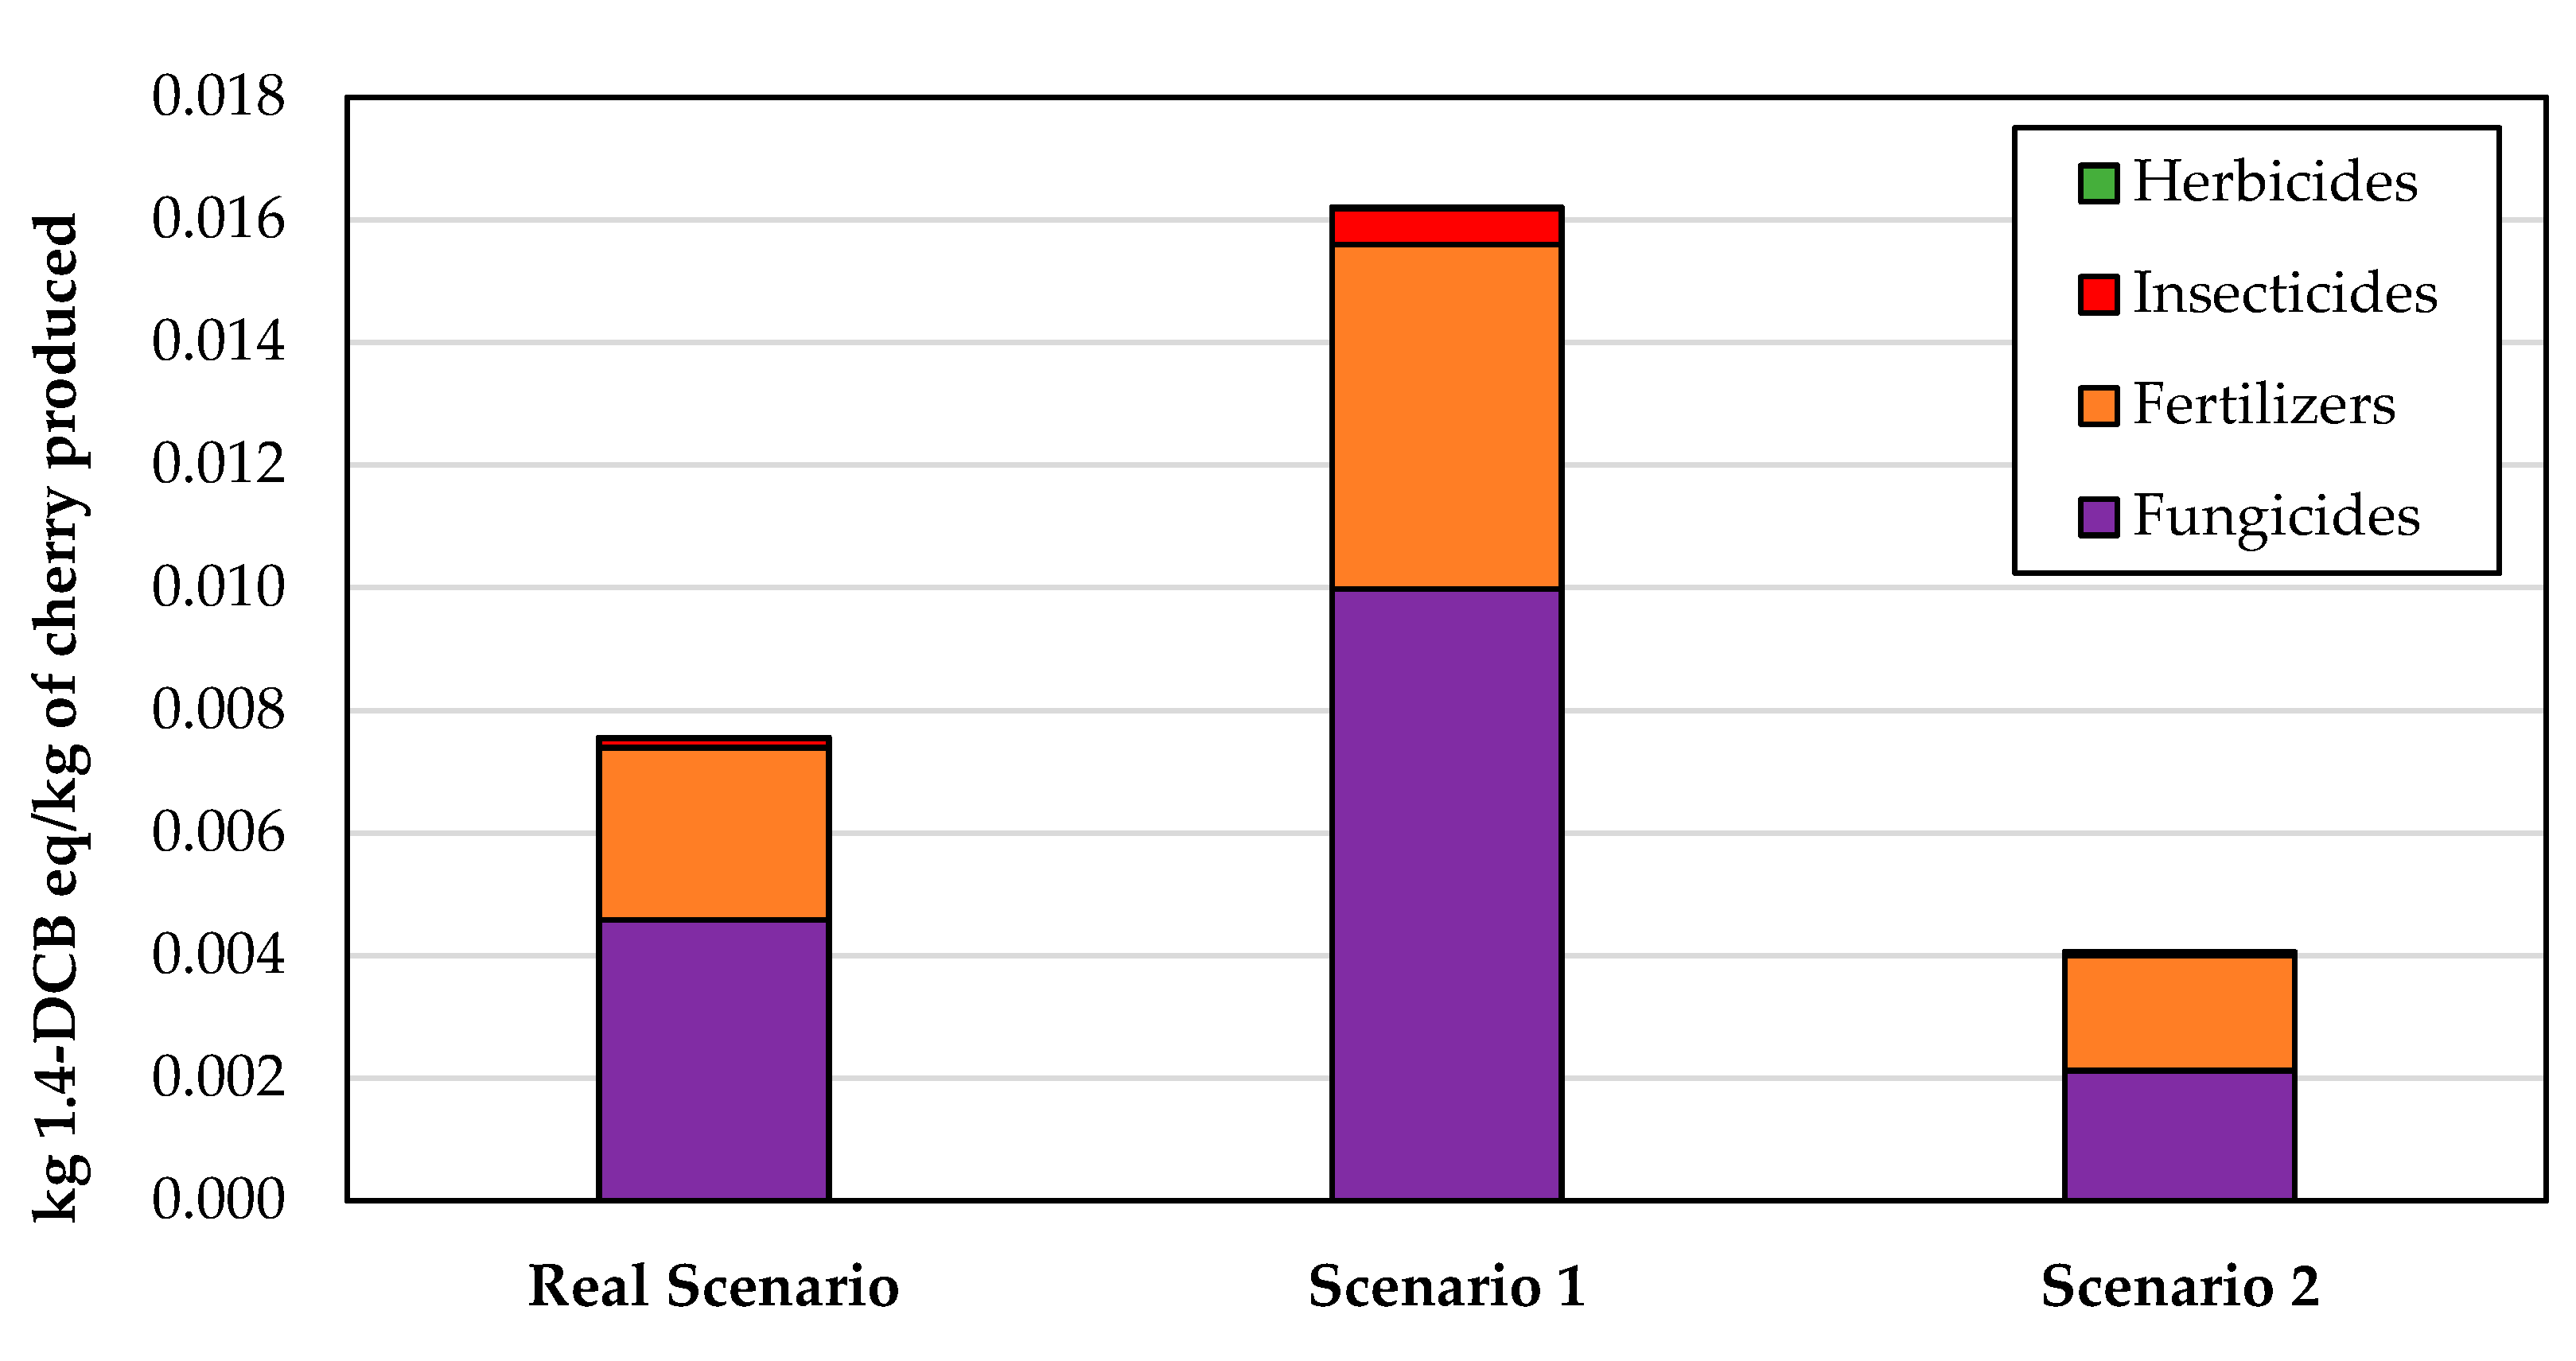
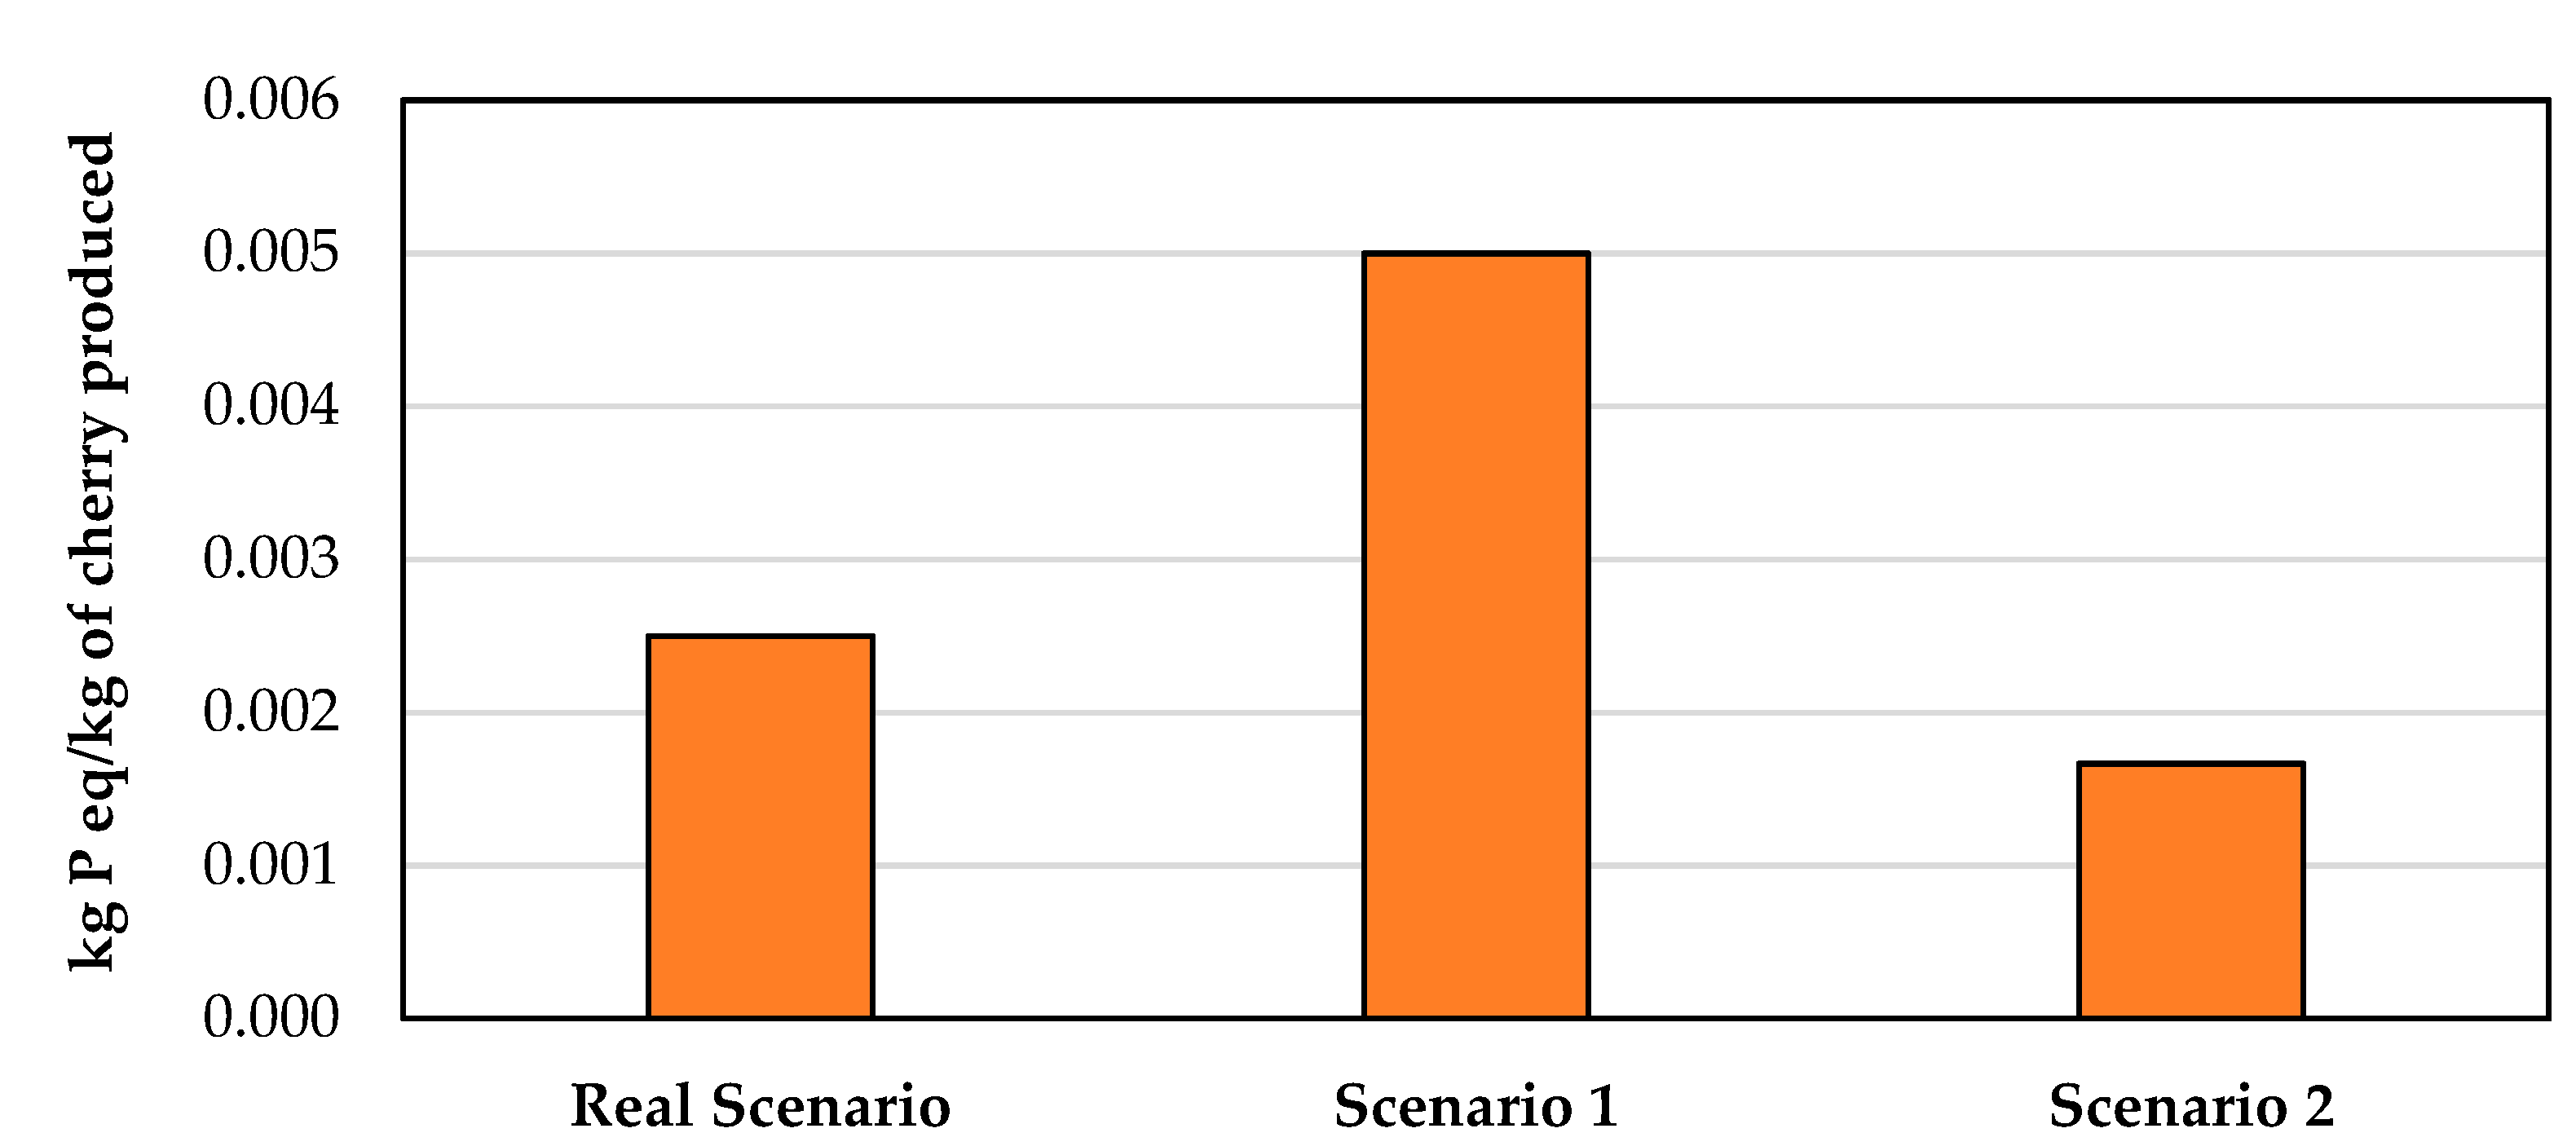
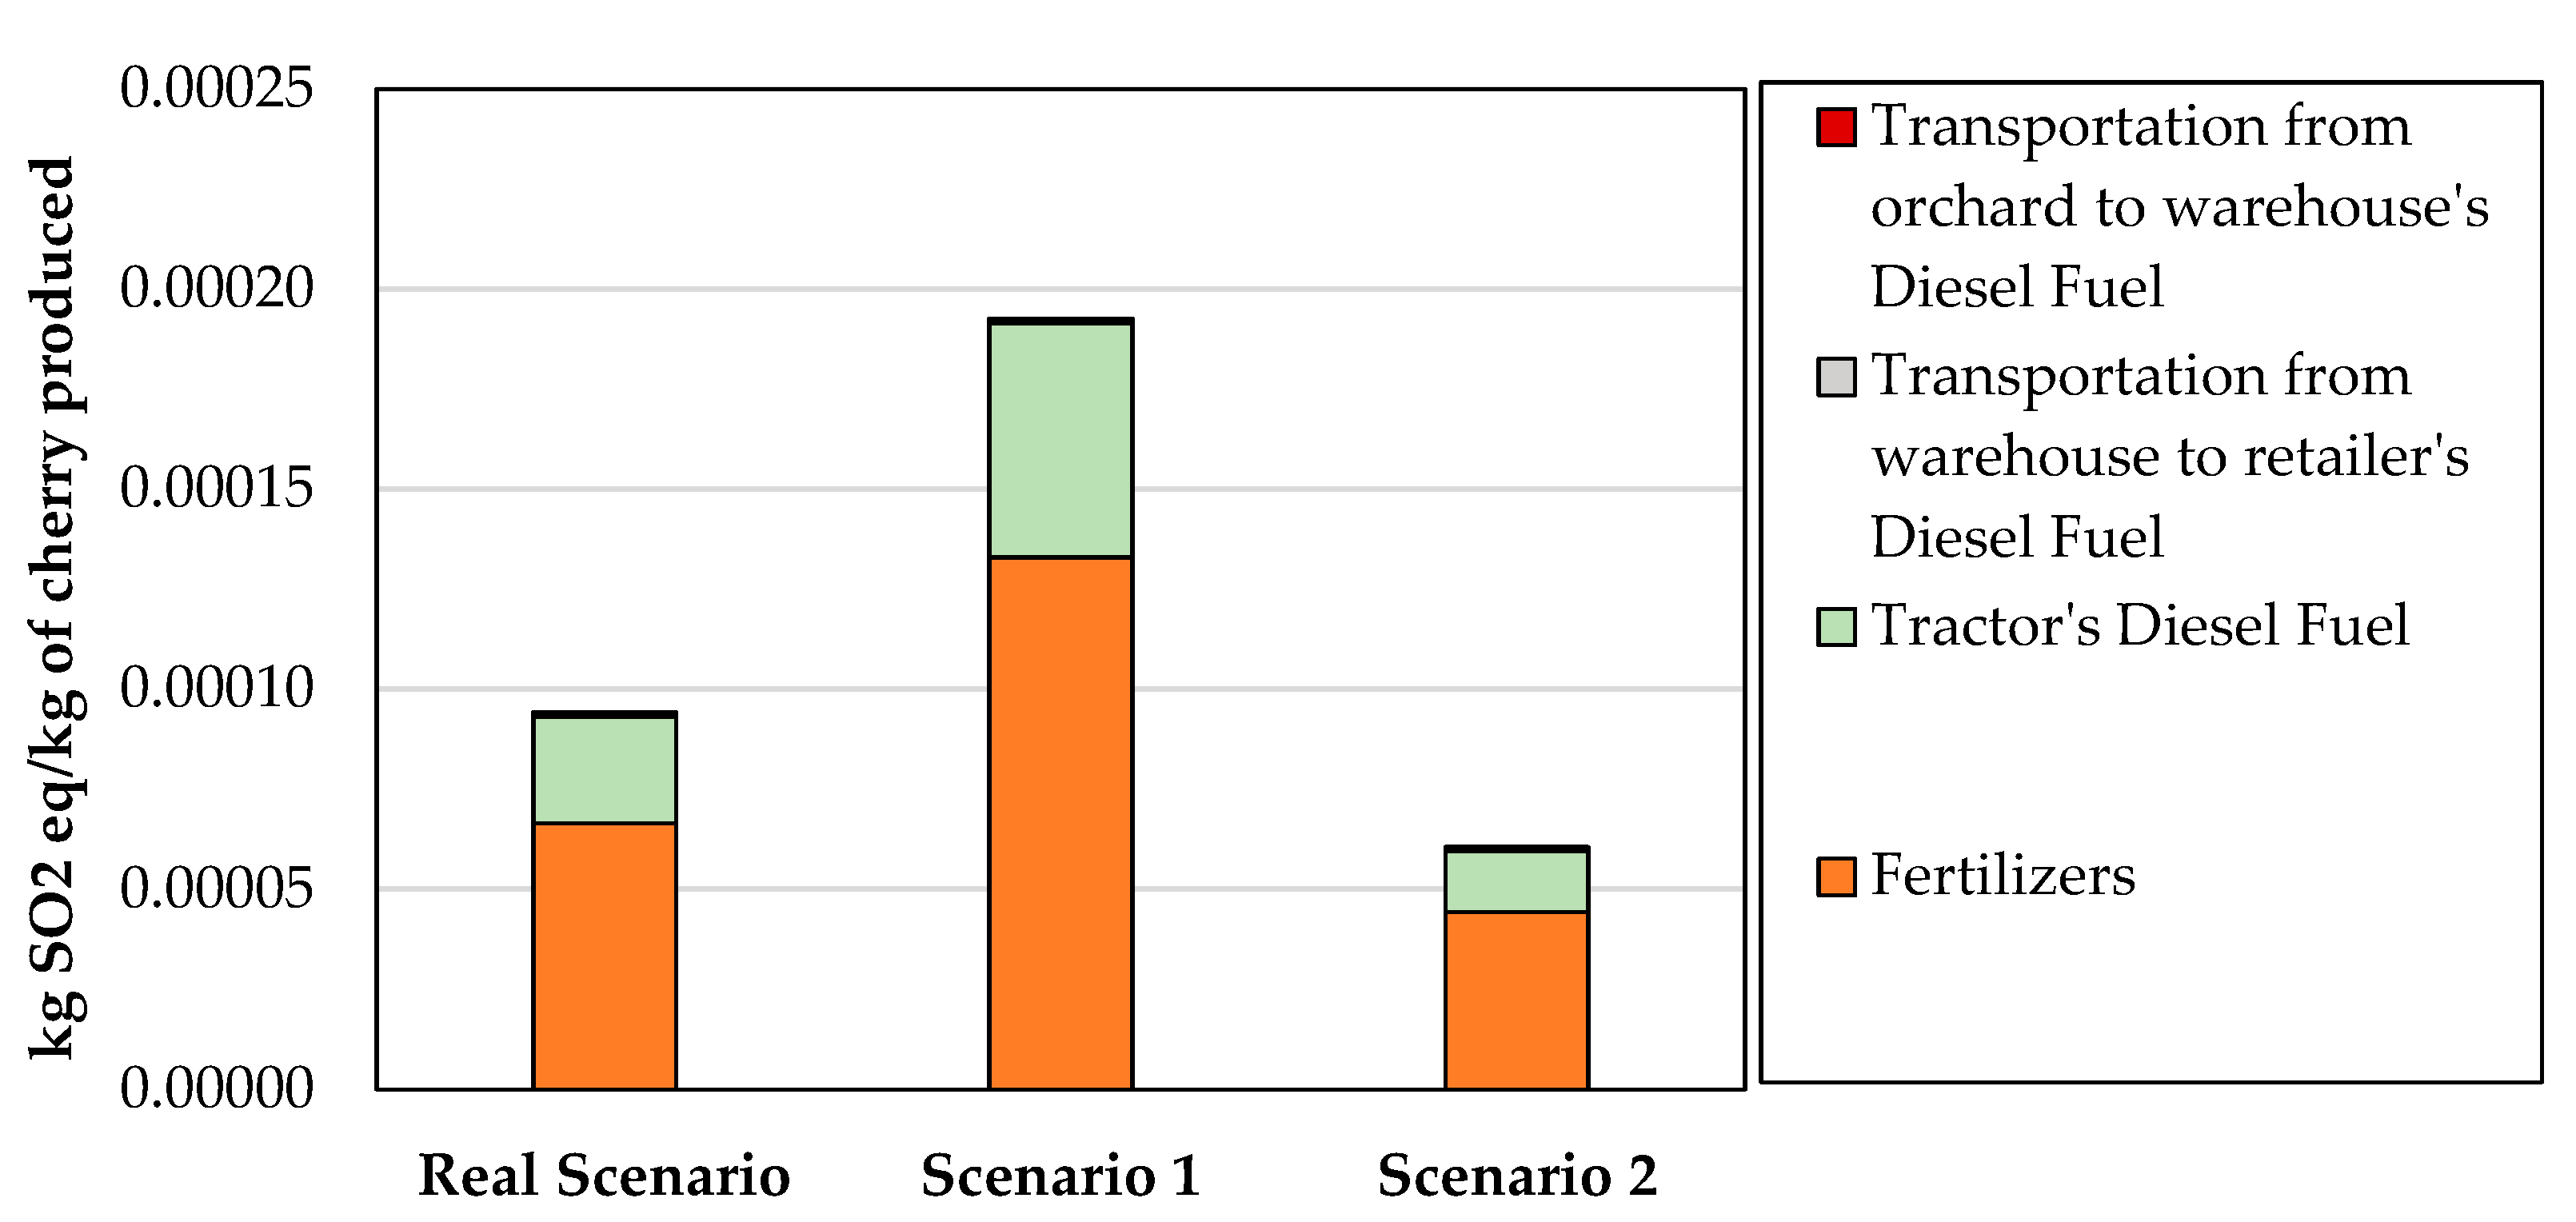
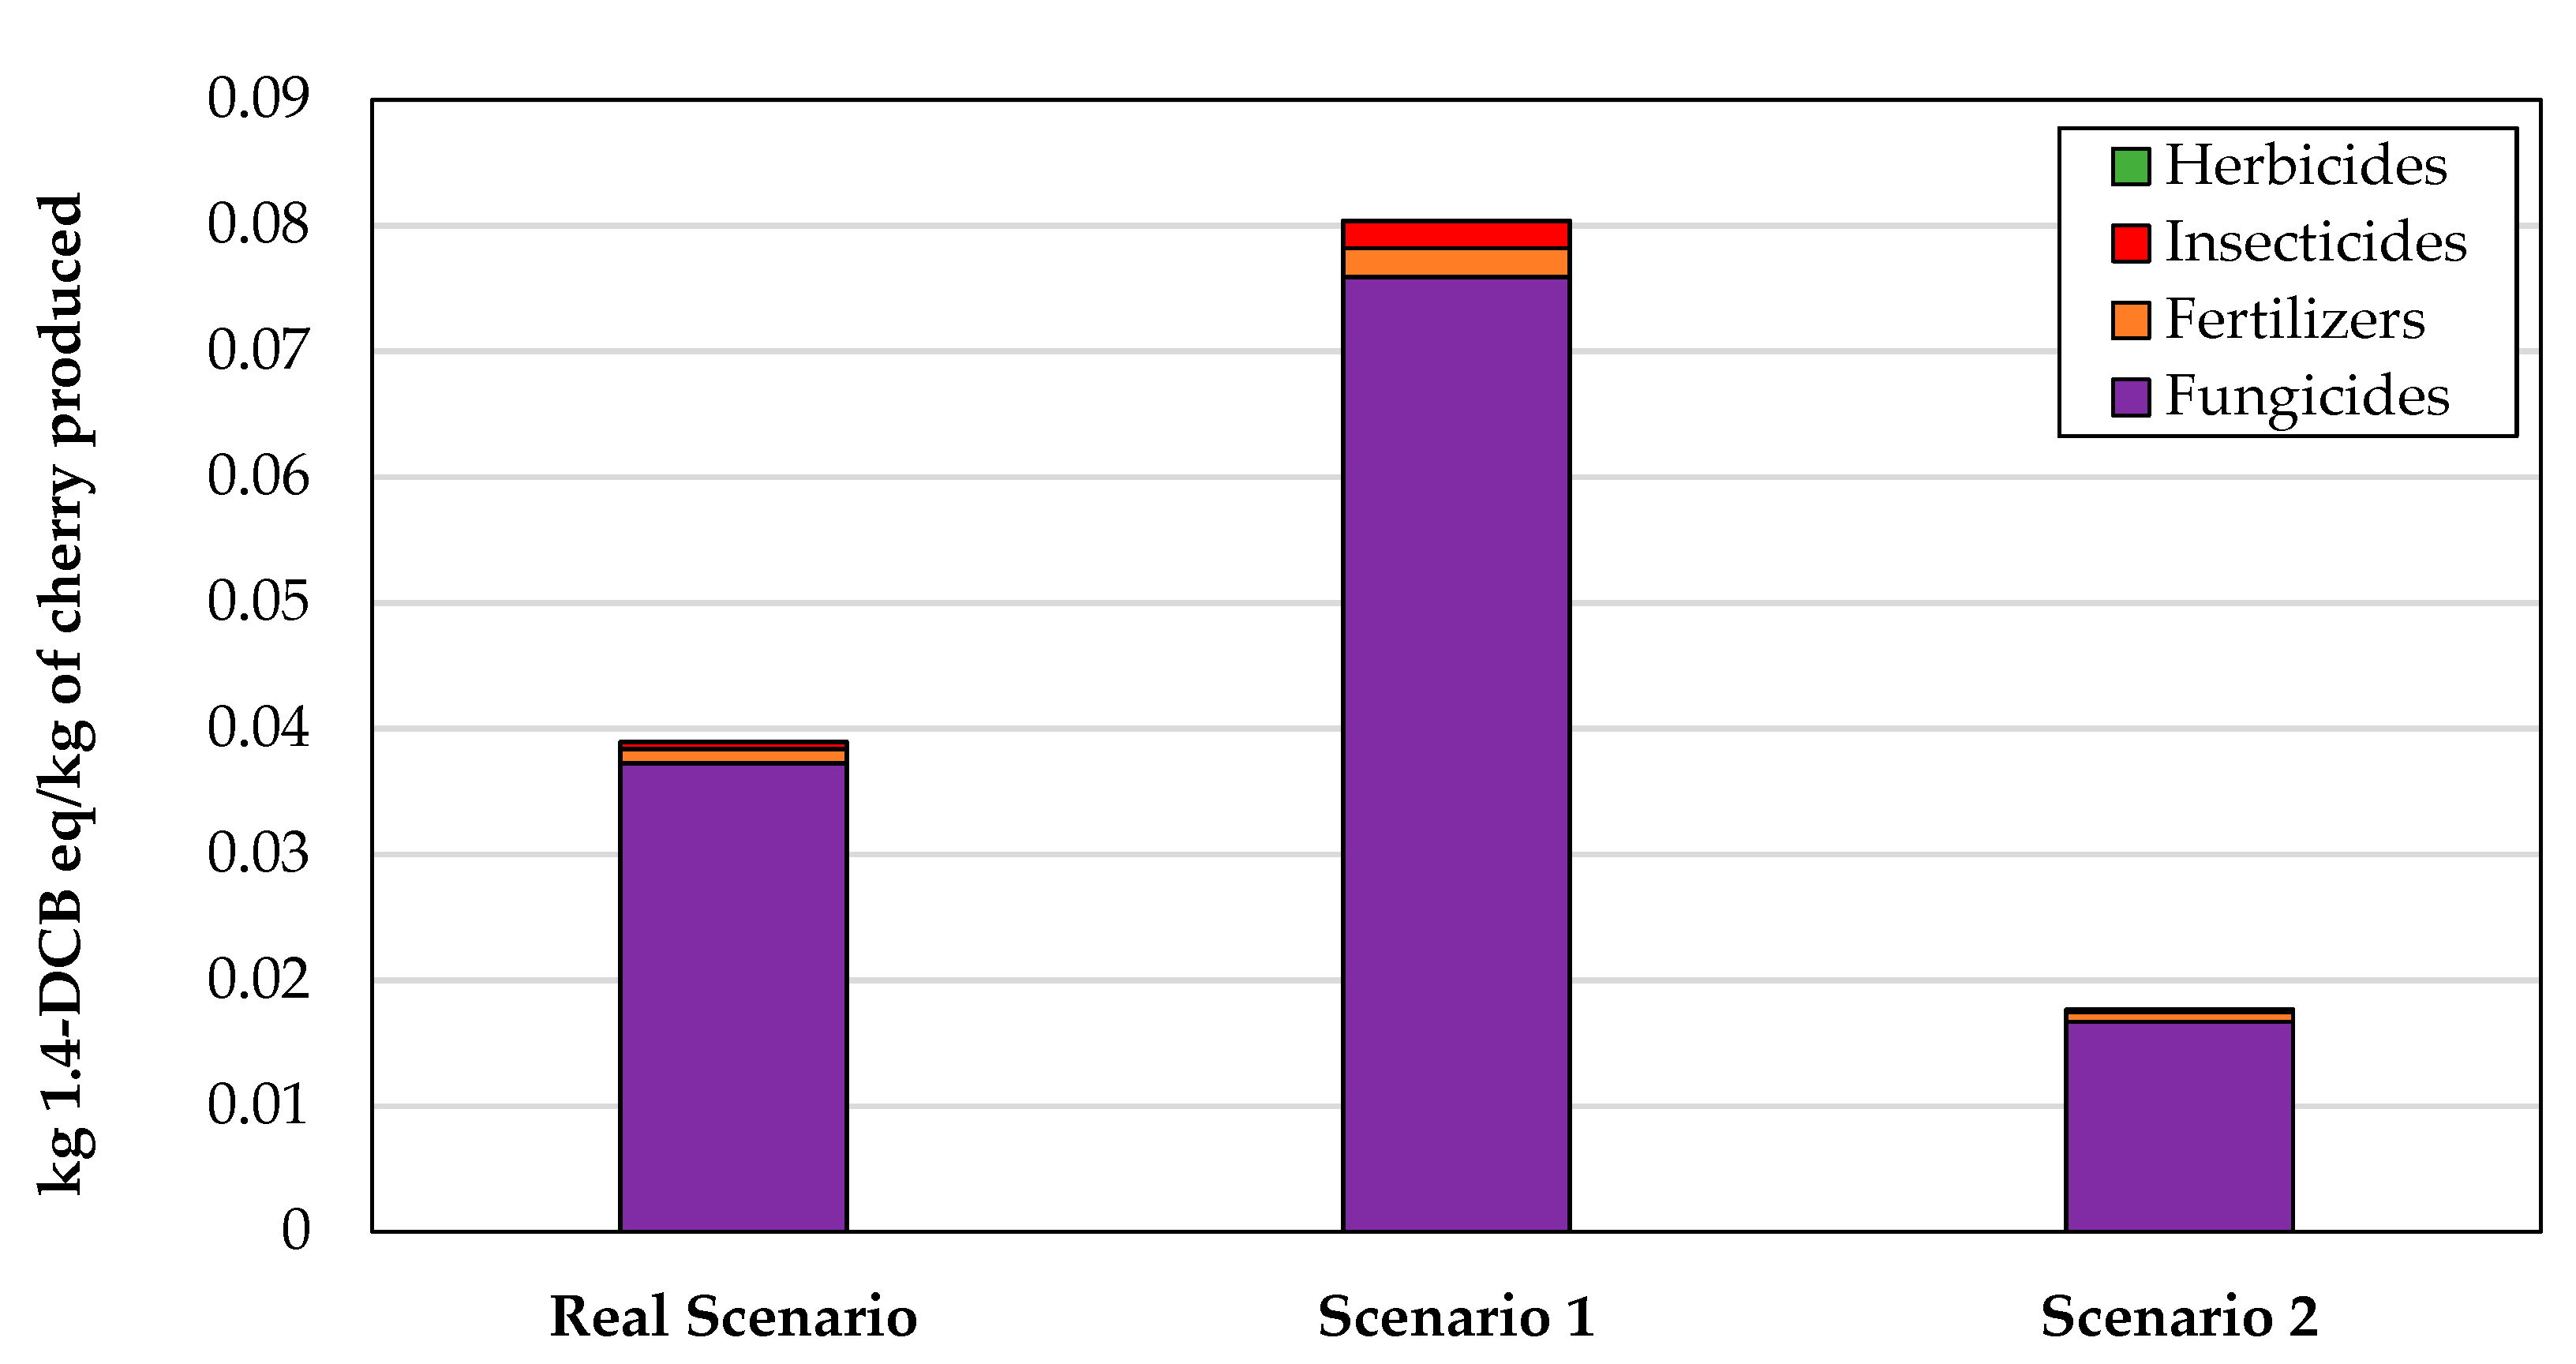
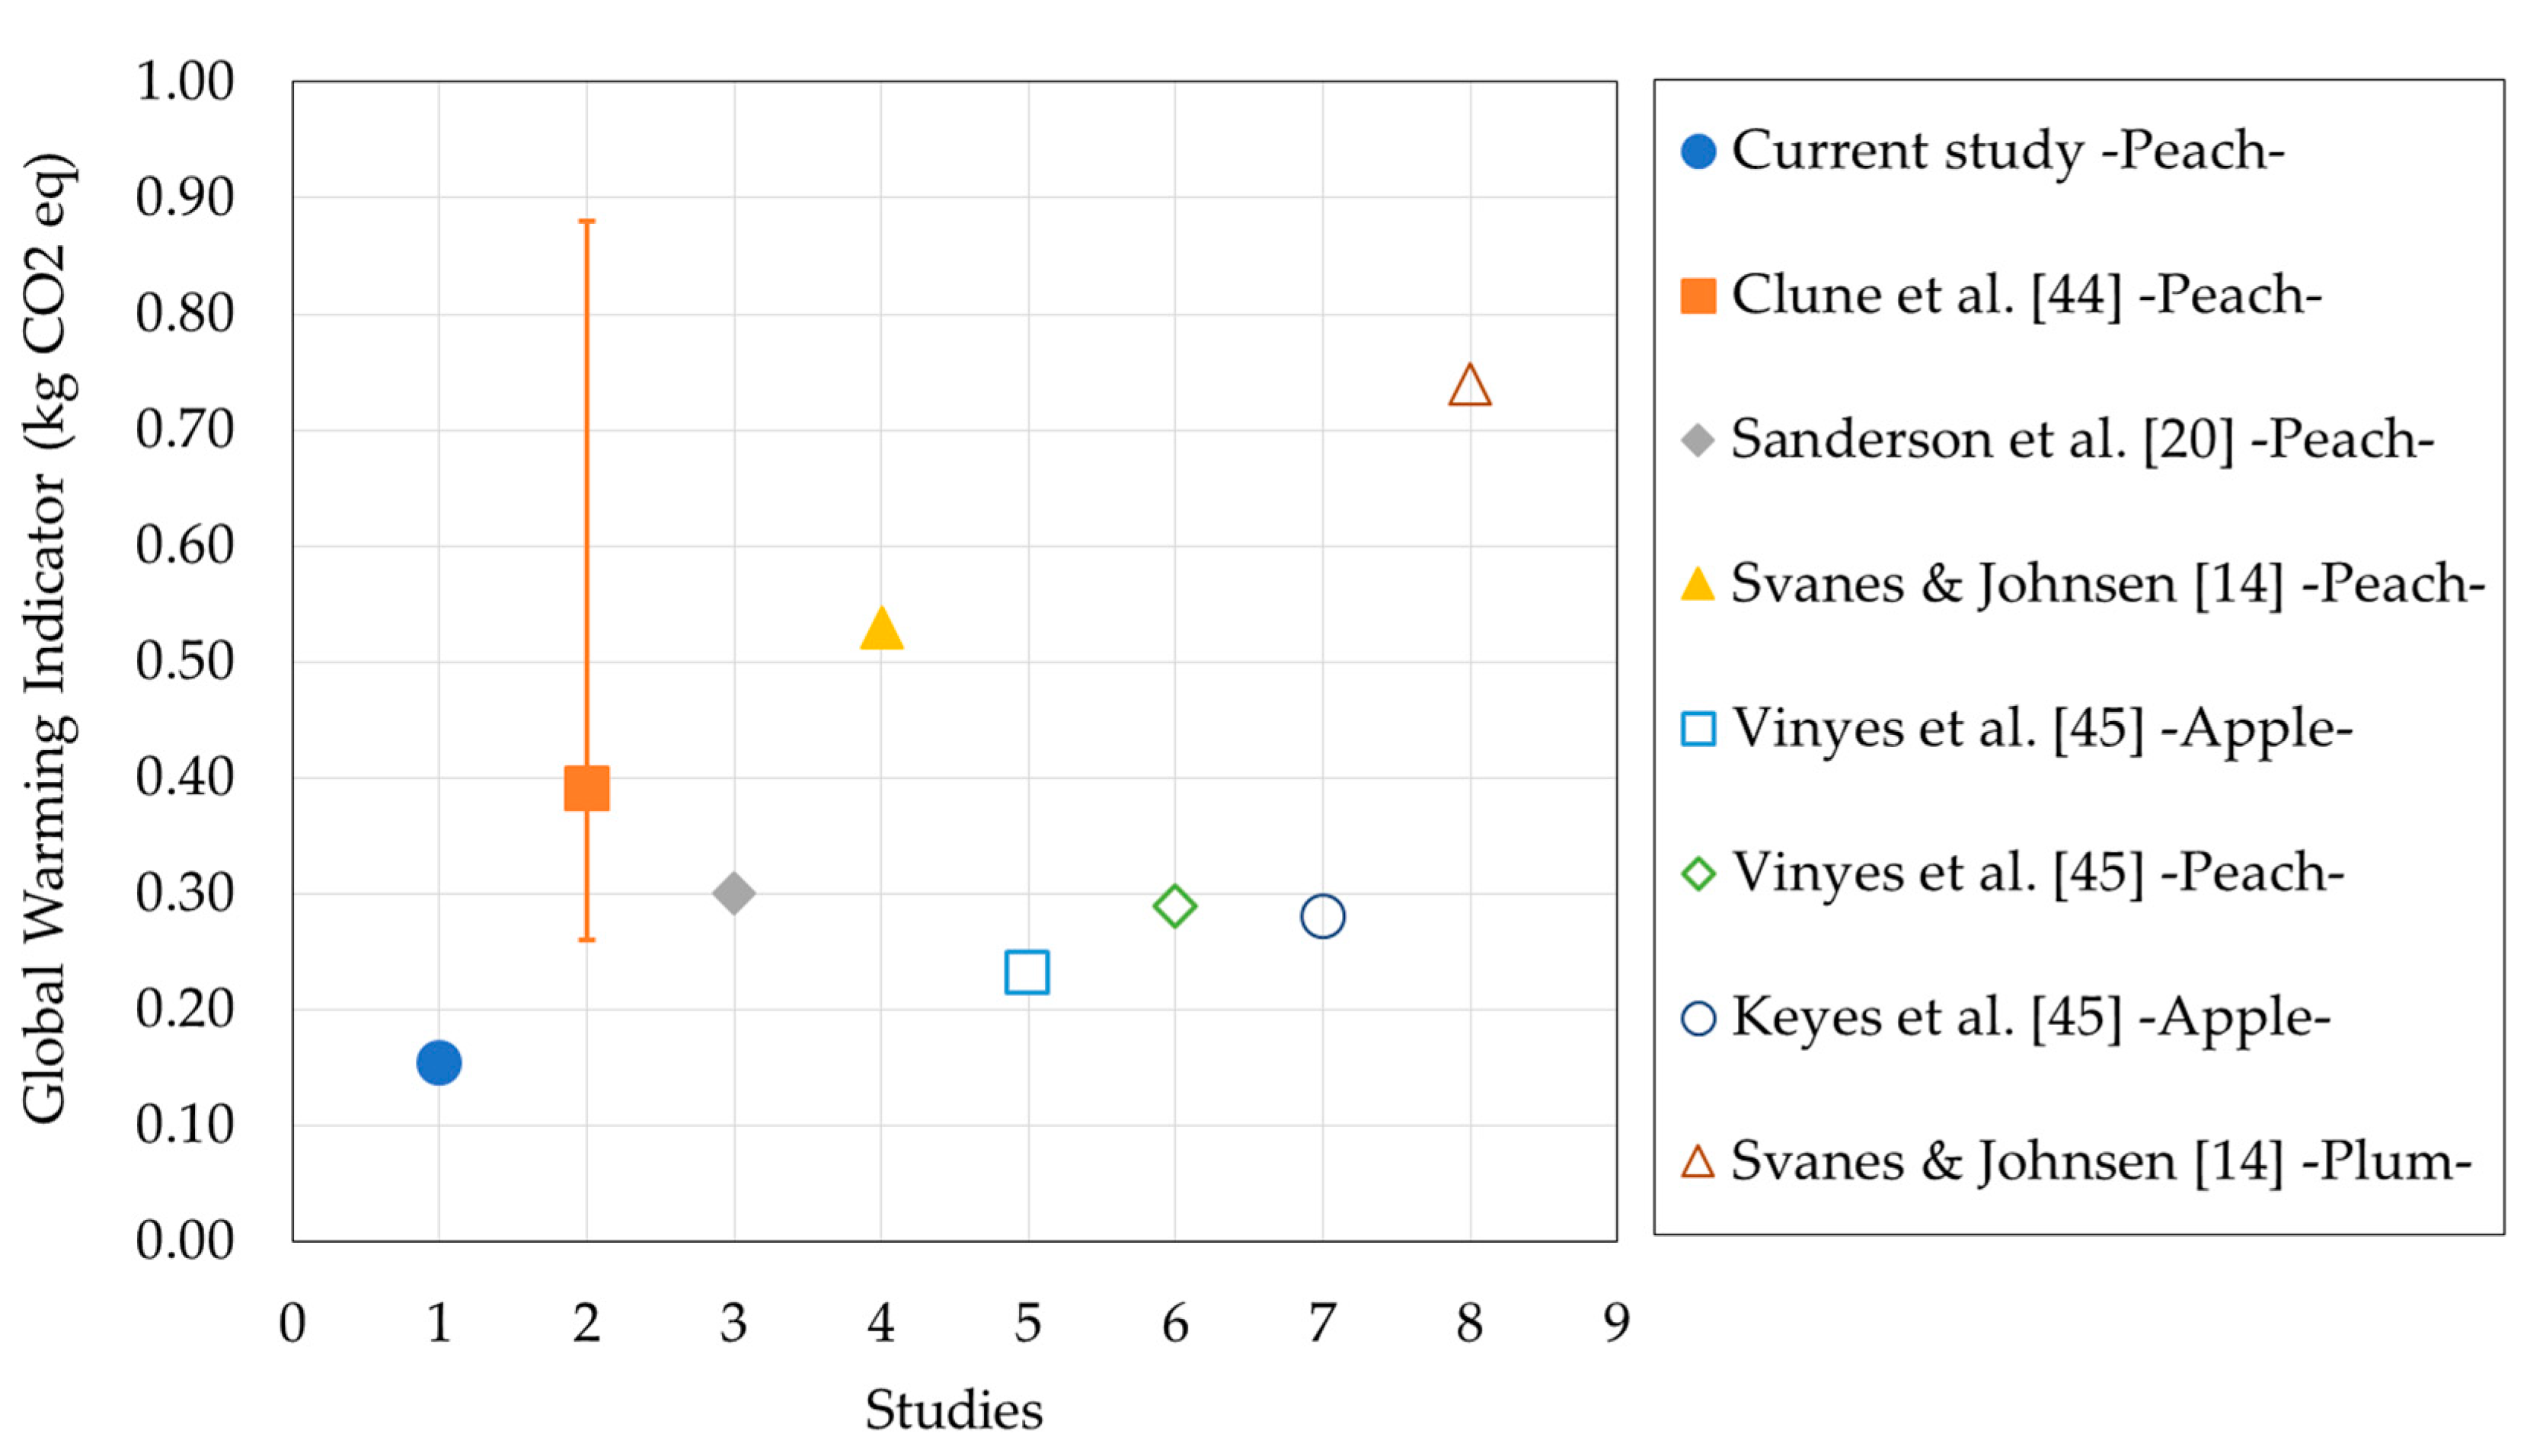
Table 1.
Energy equivalents for the different inputs (Reproduced with permission from Dermican et al., Energy Conversion and Management; published by Elsevier, 2016 [32]).
Table 1.
Energy equivalents for the different inputs (Reproduced with permission from Dermican et al., Energy Conversion and Management; published by Elsevier, 2016 [32]).
| Inputs | Units | (MJ/Units) | References |
|---|---|---|---|
| 1. Electricity | kWh | 3.6 | [25] |
| 2. Diesel fuel | l | 56.31 | [32] |
| 3. Water for irrigation | m3 | 0.63 | [32] |
| 4. Chemicals | |||
| (a) Fungicides | kg | 216 | [25] |
| (b) Insecticides | kg | 101.2 | [25] |
| (c) Herbicides | kg | 238 | [33] |
| 5. Fertilizers | |||
| (a) Nitrogen | kg | 66.14 | [25] |
| (b) Phosphorus | kg | 12.44 | [25] |
| (c) Potassium | kg | 11.15 | [25] |
Table 2.
Inputs considered in the cherries LCA.
| Inputs | Units | Input Quantity/ha |
|---|---|---|
| Production Phase | ||
| 1. Pruning | ||
| Energy Power | kWh | 7.992 |
| 2. Soil Maintenance (Sown Cover Crop) | ||
| Diesel Fuel | l | 79.9479 |
| 3. Spraying of plant protection products | ||
| Diesel fuel | l | 69.9544 |
| Fungicides | kg | 18.72 |
| Insecticides | kg | 2.549 |
| 4. Irrigation | ||
| Water | m3 | 2 028 |
| 5. Herbicides Application | ||
| Diesel fuel | l | 39.9739 |
| Herbicides | kg | 13.6 |
| 6. Fertilizers Application | ||
| Diesel fuel | l | 9.9935 |
| Fertilizers | ||
| Nitrogen | kg | 55 |
| Phosphorus | kg | 25 |
| Potassium | kg | 70 |
| Harvest and Post-Harvest Phase | ||
| 1. Transportation from the orchard to the warehouse | ||
| Diesel fuel | l | 4.3382 |
| 2. Transportation from the warehouse to the retailer | ||
| Diesel fuel | l | 49.2047 |
| 3. Warehouse | ||
| Energy | kWh | 586.7 |
Table 3.
Consumption and distance travelled for the cherry transportation.
| Parameter | LCV < 3.5 tons | HDV ≤ 7.5 tons |
|---|---|---|
| Fuel consumption [g/km] | 80 | 101 |
| Energy consumption [MJ/km] | 3.42 | 4.31 |
| Travelled distance [km] | 5 | 450 |
Table 4.
The results of the different environmental impact indicators of Fundão’s cherry for the FU of 1 kg of produced cherry.
Table 4.
The results of the different environmental impact indicators of Fundão’s cherry for the FU of 1 kg of produced cherry.
| Environmental Impact Indicator | Units | Result |
|---|---|---|
| Global Warming | kg CO2 eq | 0.153601482 |
| Freshwater Ecotoxicity | kg 1.4-DCBeq | 0.007554048 |
| Freshwater Eutrophication | kg Peq | 0.002500000 |
| Terrestrial Acidification | kg SO2 eq | 0.000094227 |
| Terrestrial Ecotoxicity | kg 1.4-DCB eq | 0.038942569 |
Table 5.
The freshwater ecotoxicity Indicator of the various environmental aspects for the FU of 1 kg of produced cherry for the real scenario.
Table 5.
The freshwater ecotoxicity Indicator of the various environmental aspects for the FU of 1 kg of produced cherry for the real scenario.
| Environmental Aspects with an Impact on Freshwater Ecotoxicity | Freshwater Ecotoxicity Indicator for Scenario 1 (kg 1.4-DCBeq/kg of Produced Cherry) | Percentage of Total Impact |
|---|---|---|
| Fungicides | 458.53 × 10⁻⁵ | 60.70% |
| Fertilizers | 281.09 × 10⁻⁵ | 37.21% |
| Insecticides | 14.59 × 10⁻⁵ | 1.93% |
| Herbicide | 1.20 × 10⁻⁵ | 0.16% |
| Total | 755.41 × 10⁻⁵ | 100% |
Table 6.
Terrestrial ecotoxicity indicator for an FU of 1 kg of produced cherry for scenarios 1 and 2.
Table 6.
Terrestrial ecotoxicity indicator for an FU of 1 kg of produced cherry for scenarios 1 and 2.
| Environmental Aspects with an Impact on Terrestrial Ecotoxicity | Terrestrial Ecotoxicity Indicator for Scenario 1 (kg 1.4-DCBeq/kg of Produced Cherry) | Percentage of Total Impact | Terrestrial Ecotoxicity Indicator for Scenario 2 (kg 1.4-DCB eq/kg of Produced Cherry) | Percentage of Total Impact |
|---|---|---|---|---|
| Fungicides | 7591.09 × 10−5 | 94.44% | 1671.23 × 10−5 | 94.63% |
| Fertilizers | 227.60 × 10⁻⁵ | 2.83% | 75.87 × 10⁻⁵ | 4.30% |
| Insecticides | 216.13 × 10⁻⁵ | 2.69% | 18.01 × 10⁻⁵ | 1.02% |
| Herbicide | 2.90 × 10⁻⁵ | 0.04% | 0.97 × 10⁻⁵ | 0.05% |
| Total | 8037.72 × 10−5 | 100% | 1766.08 × 10−5 | 100% |
Publisher’s Note: MDPI stays neutral with regard to jurisdictional claims in published maps and institutional affiliations. |
© 2021 by the authors. Licensee MDPI, Basel, Switzerland. This article is an open access article distributed under the terms and conditions of the Creative Commons Attribution (CC BY) license (https://creativecommons.org/licenses/by/4.0/).
Share and Cite
MDPI and ACS Style
Gaspar, P.D.; Godina, R.; Barrau, R. Influence of Orchard Cultural Practices during the Productive Process of Cherries through Life Cycle Assessment. Processes 2021, 9, 1065. https://0-doi-org.brum.beds.ac.uk/10.3390/pr9061065
AMA Style
Gaspar PD, Godina R, Barrau R. Influence of Orchard Cultural Practices during the Productive Process of Cherries through Life Cycle Assessment. Processes. 2021; 9(6):1065. https://0-doi-org.brum.beds.ac.uk/10.3390/pr9061065
Chicago/Turabian StyleGaspar, Pedro Dinis, Radu Godina, and Rui Barrau. 2021. "Influence of Orchard Cultural Practices during the Productive Process of Cherries through Life Cycle Assessment" Processes 9, no. 6: 1065. https://0-doi-org.brum.beds.ac.uk/10.3390/pr9061065
Note that from the first issue of 2016, this journal uses article numbers instead of page numbers. See further details here.