
A New Approach to Solar Desalination Using a Humidification–Dehumidification Process for Remote Areas


Department of Mechanical Engineering, College of Engineering, Taif University, P.O. Box 11099, Taif 21944, Saudi Arabia
Processes 2021, 9(7), 1120; https://0-doi-org.brum.beds.ac.uk/10.3390/pr9071120
Submission received: 3 June 2021
/
Revised: 23 June 2021
/
Accepted: 24 June 2021
/
Published: 28 June 2021
Abstract
:Freshwater supply in remote areas has become a critical issue. This paper aims to introduce a new approach to a solar-powered humidification–dehumidification (HDH) desalination system. The design uses a solar collector, a thermal storage tank, and an HDH unit. The HDH works continuously by feeding water to absorb solar energy during the day and then relaying the desalination units with feed water at a top brine temperature (TBT) at night. The model predicts the amount of solar energy stored for the next day, and based on this, the amount of feed water that should be raised to the TBT is calculated. The system operation is carried out in two phases. During the day, the feed water absorbs the heat of solar energy, thereby increasing its temperature to TBT. This hot feed water is then kept in storage tanks. At night, the tank switches to discharging mode and starts feeding the HDH with the hot feed water. The system is designed so that the roles of the tank are rotated at sunset. To achieve the same TBT every day in response to changes in the available solar energy, the mass of the feed water is adjusted daily. The design is simulated using a dynamic model of the energy and mass balance resulting in an average daily production of 7.6 kg of fresh water per unit area of the solar collector. The daily average of the gain output and the recovery ratios are 0.3 and 0.09 respectively.
1. Introduction
Water shortages are among the foremost challenges facing the world today. This is generally due to the deficiency and contamination of freshwater resources. Rapid industrial development, rapidly rising population around the world, and sporadic dissemination of water assets have dramatically heightened requests for new freshwater resources. The scarcity of water around the world, especially in developing countries, is due to escalating population, which necessitates the development of relatively affordable and suburbanized desalination technologies. It is estimated that by 2050, the issue of water shortage will influence more than 66 nations around the world, impacting two-thirds of the world’s population [1]. Water deficiencies in the urban populace is anticipated to extend from almost 500 million in the year 2000 to 1.9 billion by the year 2050 [2]. Recent studies indicate that the production of desalinated water to meet worldwide demand is on the rise and could increase rapidly in the coming decade [3].
Declining ground water levels and increases in the saline content are the main reasons that residents of parched lands are confronting these critical issues [4]. The growth in population has led to the contamination of water bodies. The reliance on consumption of a few water sources makes human life on these lands increasingly dependent on elective sources of clean or desalinated water. In the absence of rain or permanent freshwater reservoirs such as rivers, lakes, or canals, arid lands are facing more difficulty than previously anticipated. At least 80 countries are facing aridity and desertification. This desertification and prolonged dry seasons also contribute to economic problems [5].
Desalination by tapping into brackish and seawater reserves is becoming a major source of freshwater to meet worldwide demands. According to the WHO, Seawater generally contains 35,000–45,000 ppm of dissolved solids and minerals whereas brackish water contains 1000 and 10,000 ppm [6]. Worldwide, about 34.2% of desalinated water is generated through thermal processes [4]. Desalination of seawater is usually powered by fossil fuels, which is energy-intensive. In contrast, desalination of brackish groundwater requires less energy compared to desalination of seawater [1].
Rapidly increasing the demand for desalinated water will lead to major environmental issues. One of the most common problems is energy consumption, as it is estimated that 130 million tons of oil are consumed annually to produce of water per day [7]. The anticipated increase in desalinated water supplies, however, will lead to the wide-spread use of fossil fuels to serve the energy deficiency issue and in turn will lead to even more contamination and pollution unless plants are operated with renewable sources of energy.
Fortunately, there are various desalination systems that can be operated using renewable energy sources. There are plenty of unused saline and brackish groundwater reserves, especially in arid and semi-arid regions within countries facing critical water supply issues—many of which also enjoy the benefit of having high solar potential. Taking advantage of such potential can help overcome the energy shortages and supply the energy needed to operate desalination plants. Solar potential can be best utilized by developing solar desalination concepts and methods suitable for supplying dry areas with desalinated freshwater. Although desalination energy requirements remain an influencing factor in system costs, the integration of renewable energy systems with desalination appears to be a natural and strategic combination of technologies. Countries such as Morocco, United Arab Emirates, Saudi Arabia, and Egypt have started testing and gauging saline and briny groundwater desalination systems [1].
Thermal desalination systems are based on the evaporation and condensation principle. Thermal desalination processes are classified into two main classes, namely thermal desalination systems and membrane systems, such as solar desalination [8,9,10], humidification–dehumidification (HDH) desalination [11,12,13,14,15], multiple effect distillation (MED) [16,17,18,19], multi-stage flash distillation (MSF) [20,21,22].
One such state-of-the-art technology is the solar humidification–dehumidification system HDH, which has attracted much attention in recent years. The HDH principle is based on how air is mixed with a large amount of water vapor. When the airflow comes into contact with the brine, a measured amount of vapor is released into the air. The air then cools and condenses the vapor as the moist air comes into contact with the cooled surface of the condenser, leaving behind the distilled water. The unsophisticated technological nature of such desalination systems allows them to be constructed and operated in technologically impaired remote areas. Recent studies on the solar humidification–dehumidification system (SHDH) mainly focus on solar collectors such as evacuated tube collectors (ETC) [23,24,25,26,27,28], solar stills (SS) [29,30,31,32], and Fresnel lens collectors (FLC) [33,34,35,36].
The aim of this research is to study a new methodology for solar-powered HDH desalination in remote areas. It is based on the principle of predicting the amount of solar energy to calculate the amount of water produced for that area with a new and simple design. The unique element of the design is a dual-tank system for directly storing hot brine. Seasonal changes in available solar energy are handled by modifying the mass flows, such that the same TBT is always achieved. This novel dual-tank approach serves to isolate the HDH from daily variations in solar energy, and it allows the brine to gradually reach TBT each day.
This research is vital for the improvement of water access in remote areas as well as sustaining freshwater availability. A sufficient supply of water is vital for agriculture, industry, and human consumption. With the increase in population, droughts, and strict health-based regulations, it is a challenge to meet these demands in the coming decades. With the depletion of water resources, it is necessary to implement viable alternative energy resources for areas far away from urbanized city centers.
2. Humidification—Dehumidification System Overview
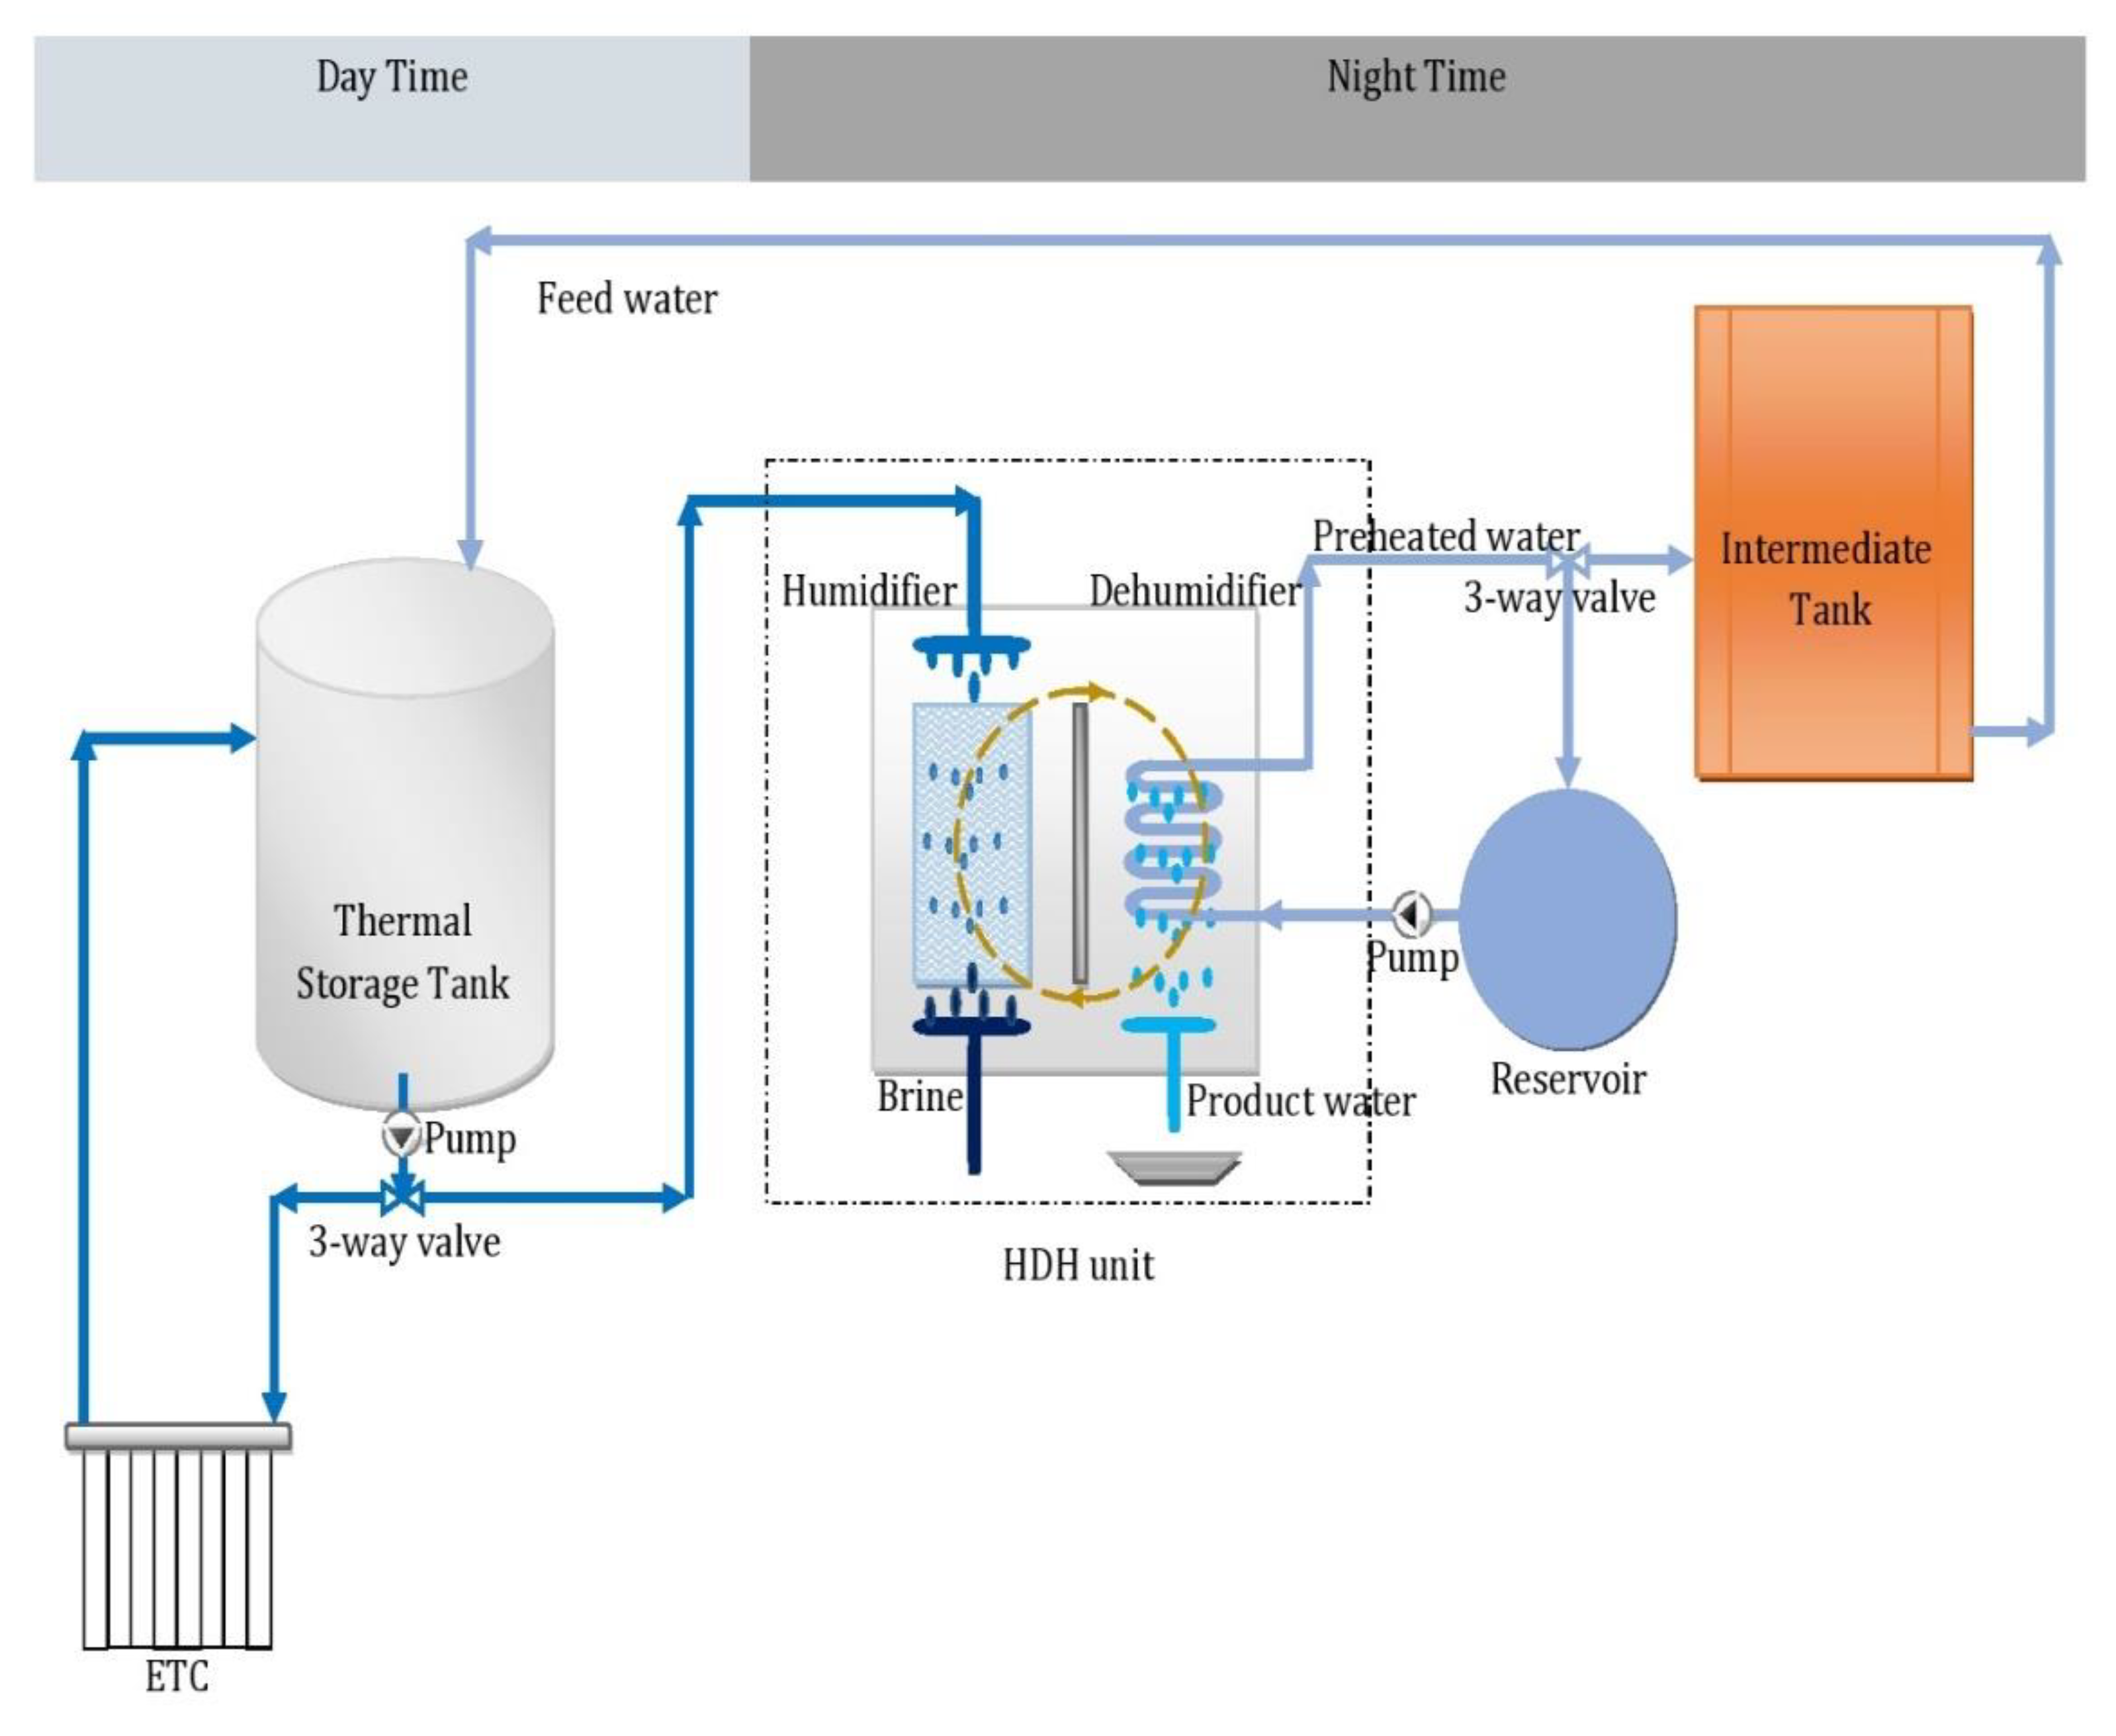
This work is based on a new approach to operating a desalination unit in arid regions. The solar water desalination system has three components: an HDH unit, a storage tank, and a solar collector. Figure 1 shows an overall schematic of the system desalination system used in this approach, which is simple and suitable for dry areas.
The main principle of this work is to predict the amount of solar energy for the next day, thus determining the amount of feed water that will be heated to the desired TBT or humidifier inlet water temperature and then to calculate the amount of desalinated water. The goal is to forecast the quantities of desalinated water that can be produced based on several factors such as the amount of expected solar energy for the day, month, or year, as well as the capacity of the tank and locations of solar collectors.
The operation cycle and its processes are implemented as follows. Before sunrise, the tank is fed with water according to the expected amount of solar energy. During the day, the feed water is heated by circulating the water of the solar collector. The tank is in the charging mode, and as a result of solar energy gain, the temperature rises gradually from the temperature of the tank to the top brine temperature. During the nighttime, the storage tank switches to discharging mode and feeds HDH with hot feed water. In the HDH unit, hot water is evaporated and condensed in the dehumidifier where the latent heat transfers to the incoming feed water, producing distilled water. After the tank is emptied and the desalination process is completed, the tank is refilled with preheated water coming from the intermediate tank. The following sub-sections provide more details about the design of the HDH, storage tank, and the flat plate solar collector, as well as the interaction of these systems.
2.1. Humidification–Dehumidification System Design
The HDH is a type of thermal desalination, which generally refers to the process of evaporating heated feed water and collecting the condensed vapor. During the natural rain cycle, pure water evaporates from the surface of the ocean leaving salt ions inside the seawater.
The HDH simply consists of a humidifier, dehumidifier, and heater. The humidifier comprises three parts: the first part is a spray nozzle to sprinkle hot seawater over the second part, which is packed-bed material to promote direct mass and heat transfer between the seawater and carrier gas, and the third part is a container that is used to accumulate and drain the brine. The dehumidifier is employed for the condensation of water vapor present in the humid air. The dehumidifier may house copper coils with fins or without fins, through which low-temperature saline water passes to condense the water vapor of humid air coming from the humidifier.
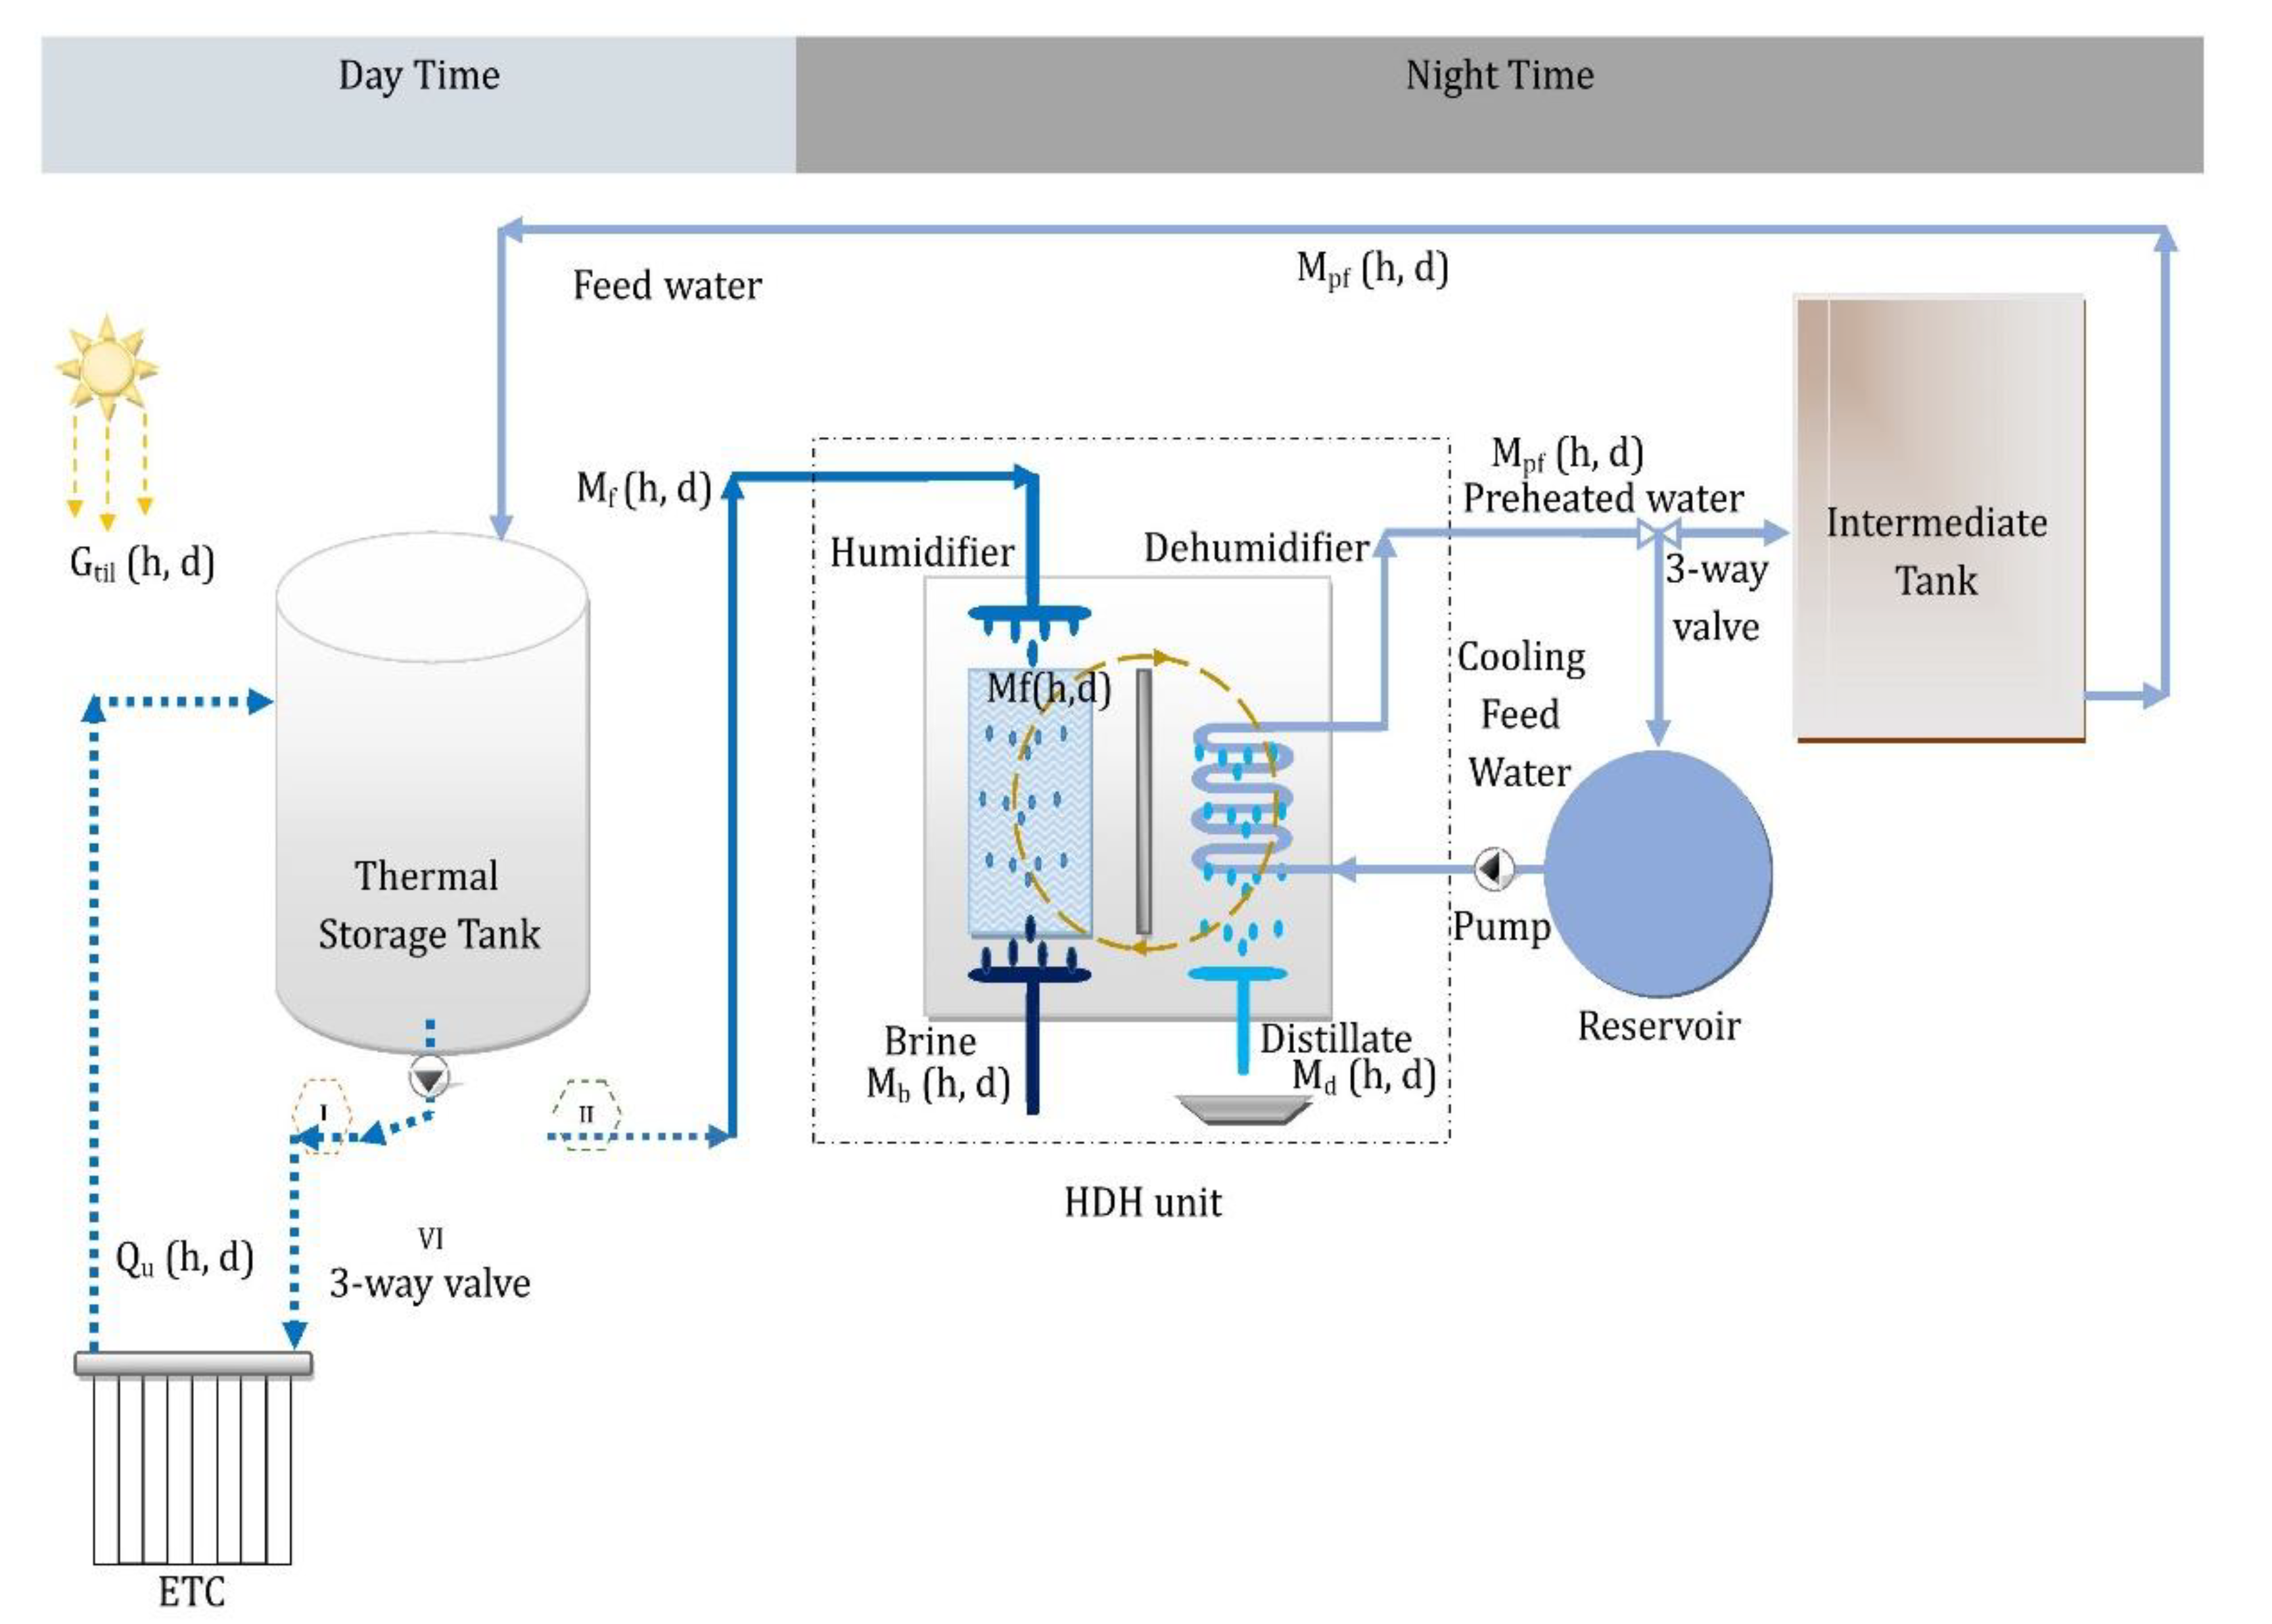
The operation cycle and flow diagram of the design is demonstrated schematically in Figure 2. The diagram contains labeled details of the configuration of the design, which consists of three loops: the air loop, the hot water loop, and the cool water loop. The five separate flows passing through the HDH are labeled as the hot feed water (label A), brine (label B), the product (label C), cooling feed water (label D), and preheated feed water (label E).
2.2. Operation Cycle
The first phase that begins with daylight begins when the hot feed water enters the humidifier (label A). Hot water is sprayed on top of the evaporation tower to develop a thin liquid film over the spherical packing, while it is also in contact with the low humidity counter-current air stream. The feedwater mass flow rate is tweaked with a controllable pump.
A portion of this flow, which does not evaporate inside the humidifier, leaves the humidifier full of concentrated brine (label B). Partial evaporation and convective heat transfer cool down the brine, leaving the evaporation unit concentrated at a lower temperature. (label B). The cooling feed water passes through a heat exchanger within the dehumidifier (label D) where water is heated with the recovery of latent heat of condensation in the exchanger. It then exits the dehumidifier as the pre-heated feed water at the point labeled E (label E). Some of the feed water returning to the reservoir is stored in the adjacent intermediate tank to fill the thermal storage tank (label F) at a later time. The solar collector (label G) further heats the feed water during the day. The mechanism is shown in the solar collector section of the diagram.
The humidified air is fed into the dehumidifier by forced convection. The subcooled water is carefully sprinkled on top of the condenser in the form of tiny droplets. Under the influence of gravity, these droplets trickle downward synchronously with the hot humidified air (label H). The liquid droplets ultimately form a liquid film on the surface of a spherical packing, where it is subjected to direct contact with the synchronized flow of air at a liquid–gaseous interface. The air behaves as a carrier medium and constantly circulates in closed-loop cycles to transfer the produced water vapor from the evaporator to the condenser. Inside the condenser, the water vapor is cooled and condensed to produce highly purified freshwater (label C). The distillate is collected as the product from the dehumidifier.
2.3. Thermal Storage Tanks
The thermal storage system consists of two tanks with sufficient capacity to supply the HDH with target feed water, a thermal storage tank, and an intermediate storage tank.
The function of the intermediate storage tank is to store a portion of the feed water exiting from the dehumidifier to feed the thermal storage tank with preheating feed water before sunrise. The function of the thermal storage tank is to store the hot feed water during the day and supply the HDH unit with hot feed water.
The left portion of Figure 2 shows the tank in charging mode, as it receives the pre-heated feed water from the dehumidifier (label F) before sunrise. During the daylight period, this preheated feed water is circulated through the solar collector for further heating.
During the night period, the tank is in discharging mode, when it supplies the HDH with its hot feed water stored at TBT (label A). The tank is heavily insulated to reduce heat losses to the environment. The thermal storage tank switches roles daily, at approximately sundown, when the charging tank has reached capacity.
This switching is controlled at the valve V1 indicated in Figure 2. As shown, the valve is in the position labeled “I”, corresponding to charging the tank during the day. Switching the valve V1 to the position labeled “II” changes the mode to discharging during the night.
At nearly sunset, the charging tank reaches capacity, and the thermal storage tank toggle switch starts to work. This switch is controlled by valve V1, as Figure 2 shows the position of the valves. The valve is in the position labeled “I”, which corresponds to charging the tank during the day. To discharge at night, valve V1 is switched to the position marked “II” to change mode.
2.4. Solar System
The solar system consists of the solar collector and photovoltaic or solar PV system. One of the most important technologies developed for solar heating is solar collectors, which work by converting solar radiation into thermal energy absorbed by fluid.
Based on the specific peak volume of the feed water and the highest solar insolation, the total solar collector area is calculated, sufficient to raise the temperature of the feed water volume to TBT. As a result of the feed water passing through the solar collector, the temperature rises from the temperature of the outlet temperature of the dehumidifier to TBT. Feed water is heated from the outlet temperature of the dehumidifier to TBT, which is around 85 °C.
According to the average predicted insolation values for the next day, the amount of feed water that can be treated by the system can be predicted and calculated.
The solar collector system is shown in Figure 2, which is connected to the tanks through LED No. 1, which is located in the “I” position. As shown, the feed water in the thermal storage tank is circulated through the collector to obtain the solar heat (label G).
A typical meteorological year (TMY) is defined as the historical data for a place from which daily solar insolation, ambient temperature, and wind speed are obtained. Using TMY data, a complete system can be designed that predicts the amount of distillate by estimating the amount of beneficial heat that can be transferred to the feed water for each day of the year. To operate components that need electricity such as fans and pumps, photovoltaic panels boosted by the auxiliary battery are used.
3. Mathematical Model for Solar Energy Prediction
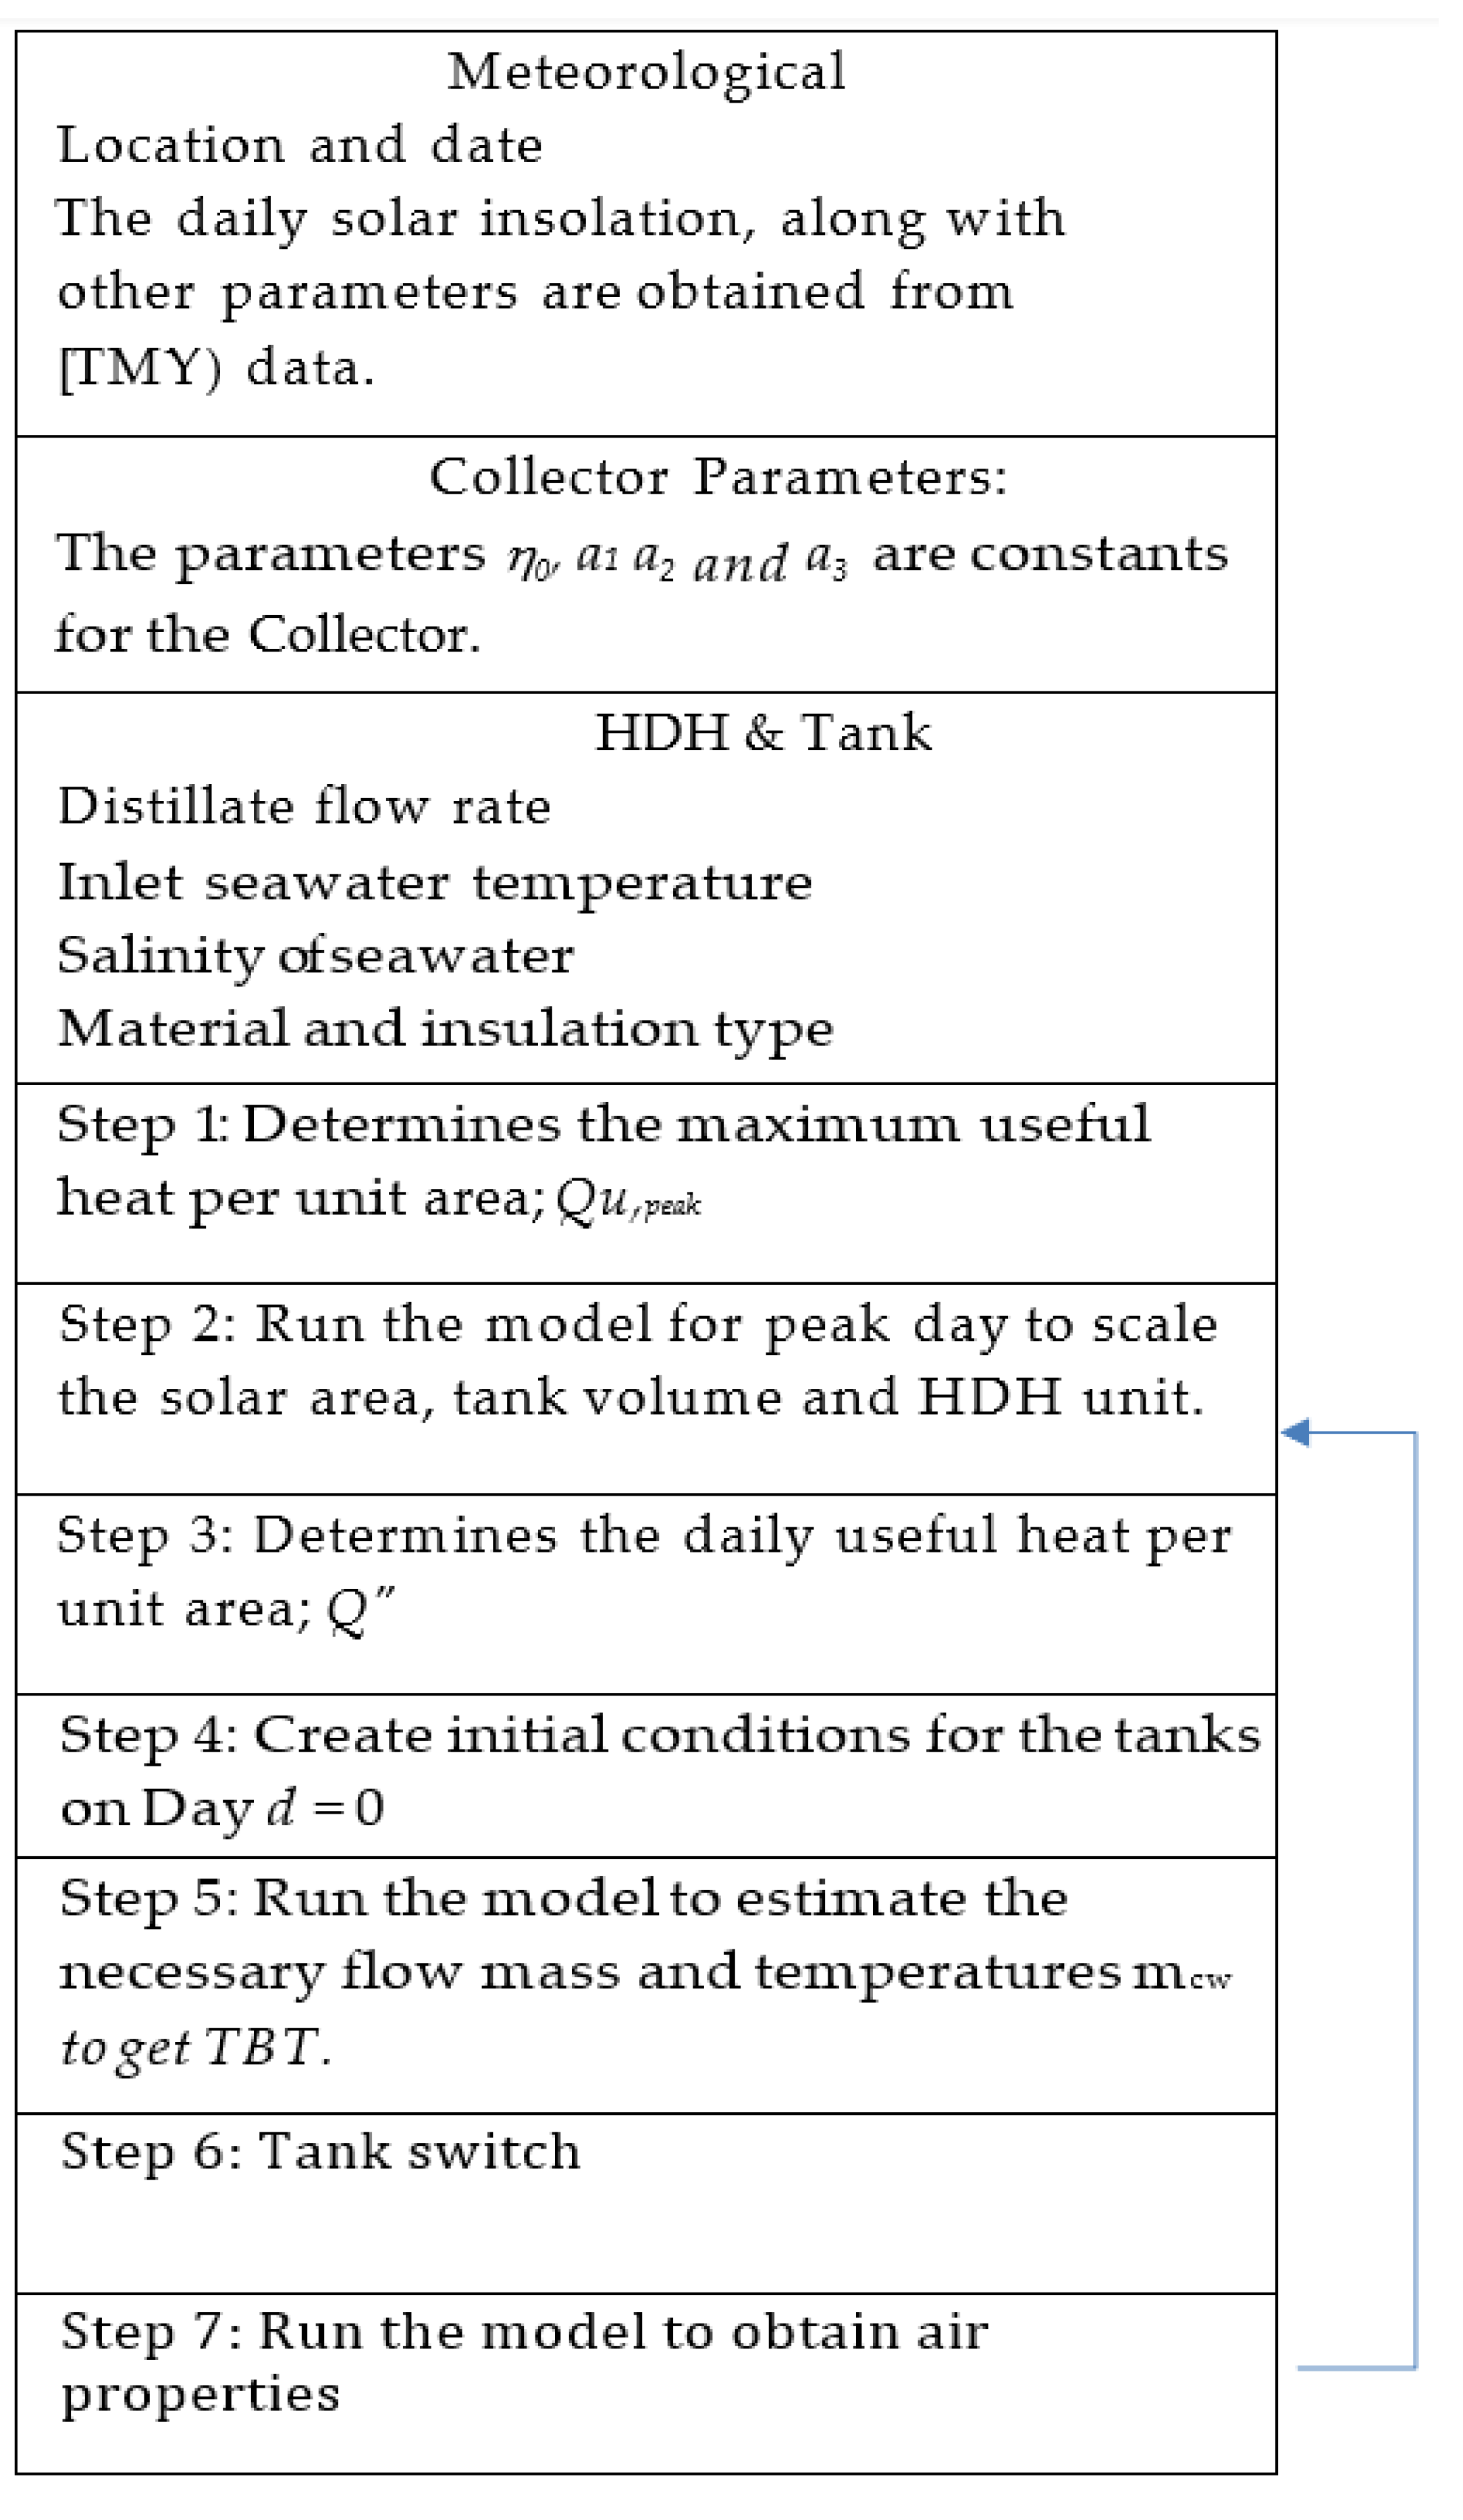
In this section, a mathematical model is formulated to describe the mass flows, feed water temperature and heat transfer for each component of the system. Figure 3 is a summary of the processes involved in calculating the dynamical changes in the mass of feedwater, the temperature of the storage tanks, and the total amount of distilled water produced. The collector area is selected so that a design peak mass Mpk can be fully processed on the day with the strongest solar intensity for a given year.
The key parameters in the construction of the system are illustrated in Figure 4 with proper nomenclature. Model variables, such as the saline water temperature , remain constant throughout the year, while variables such as the mass of incoming seawater that enters the storage tank change on a daily basis but remain constant for a particular day. Variables such as solar intensity change on an hourly as well as a daily basis.
The following sections include an overview of the dynamic model, which includes equations used to calculate the mass flows and temperatures throughout the system, thereby allowing it to make a prediction of the amount of daily feed water, solar intensity, and distillate that can be produced at a given location.
3.1. Solar Collector Model
During daylight hours, the feed water receives heat from the ETC through which it is circulating. The amount of heat transmitted by one collector every hour is determined according to Equation (1)
where is collector efficiency, is the collector aperture area, and is the global tilted irradiance incident on the area each hour. The time-of-day variable . varies from 0 to 24, and indicates the day of the year, from 1 to 365.
The collector efficiency can be expressed using the following equation [37]. A TMY3 weather file was used for solar radiation data [38]
The parameters , are constants for the collector specified by the manufacturing company. The temperature is the temperature of the outdoor air. Parameters, , and temperature vary by hour and by day, while is the main collector temperature.
The energy balance for the solar collector is given by Equation (3). The left side of this equation represents the total useful heat passed into the feed water by the solar collector over the entire day .
3.2. Storage Tank
In order for the system to run for an entire day, a water storage tank is incorporated into the design. The development of the dynamic model of the storage tank assumes that the fluid is well-mixed, thus allowing it to be characterized by a single temperature. The energy balance is used to update the tank temperatures at time based on the values at time as shown in Equation (4).
where the stored energy in the feed water at the previous hour, the useful energy from the solar collector, and the losses through the sides of the tank are written on the right side of the equation.
The energy balance is used to describe the intermediate tank temperatures as shown in Equation (6).
where the energy stored in the intermediate tank is written on the right side of the equation, and the energy gained from the dehumidifier and is written on the left side of the equation in addition to the loss of energy on the sides of the tank.
The system is designed such that the maximum amount of brine can be fully processed on the day with the strongest solar intensity throughout a year. The daily demand of feed water should be estimated using the following equation:
When designing a solar collector system for hot water, the system is generally sized to achieve an annual solar fraction of between 55% and 70%.
3.3. Mathematical Models HDH
3.3.1. Assumptions and Modeling Details
The following assumptions are taken into account in order to evaluate the performance of the design:
- The air at the outlets of the humidifier and the dehumidifier is at its saturated state (RH = 100%).
- The unit is operating under steady-state condition.
- The losses to the environment in the form of heat and mass are neglected.
- The kinetic and potential energies are neglected.
- The generated distilled water is salt-free.
- The temperature of the brine and the air leaving the humidifier are at the same temperature.
- Likewise, the temperature is the same for the distilled water and air leaving the dehumidifier.
3.3.2. Humidification–Dehumidification System
The configuration of the HDH system is a simple closed-air configuration. Each subscript number below refers to a given state as indicated in Figure 4 (the details are given in Appendix A). The mass and energy balance equations for the HDH system are given by:
Governing Equations for Humidifier
Mass balance equation
Energy balance equation
Governing Equations for Dehumidifier
Mass balance equation
Energy balance equation
3.4. Validation of Current Model with a Previous Study
The accuracy of test results should be verified. Since no prototype has been built yet, the model uses a numerical iterative procedure to solve the equations. Thereafter, the system has been validated by comparing it with the results of other studies. Table 1 shows some comparisons of the current study compared to similar studies.
Table 1 compares this study with previous studies of HDH systems. The feed-water flow rate is set according to available solar energy such that the same TBT is always achieved.
4. Results and Discussion
A mathematical model was built to simulate a solar-powered humidification–dehumidification desalination plant. To predict solar radiation data, Las Vegas TMY3 (typical meteorological year) was used as it is one of the sunniest regions in the United States.
Table 2 presents the constant design parameters used for the simulation. A transient simulation was performed using TMY3 data for all days of the year with about 2.02 square meters of the evacuated tube solar collector area. The results showed that the maximum temperatures that could be reached were 90 °C, thus determining the maximum mass of feed water. The mass of feed water, which is the peak mass of feed water, is 710 kg per day. Therefore, the size of the thermal tank is determined based on the peak of feedwater mass.
To measure the performance of the HDH system, there are three factors considered as the performance parameters. The three factors are productivity (Md), gained output ratio (GOR), and recovery ratio (RR).
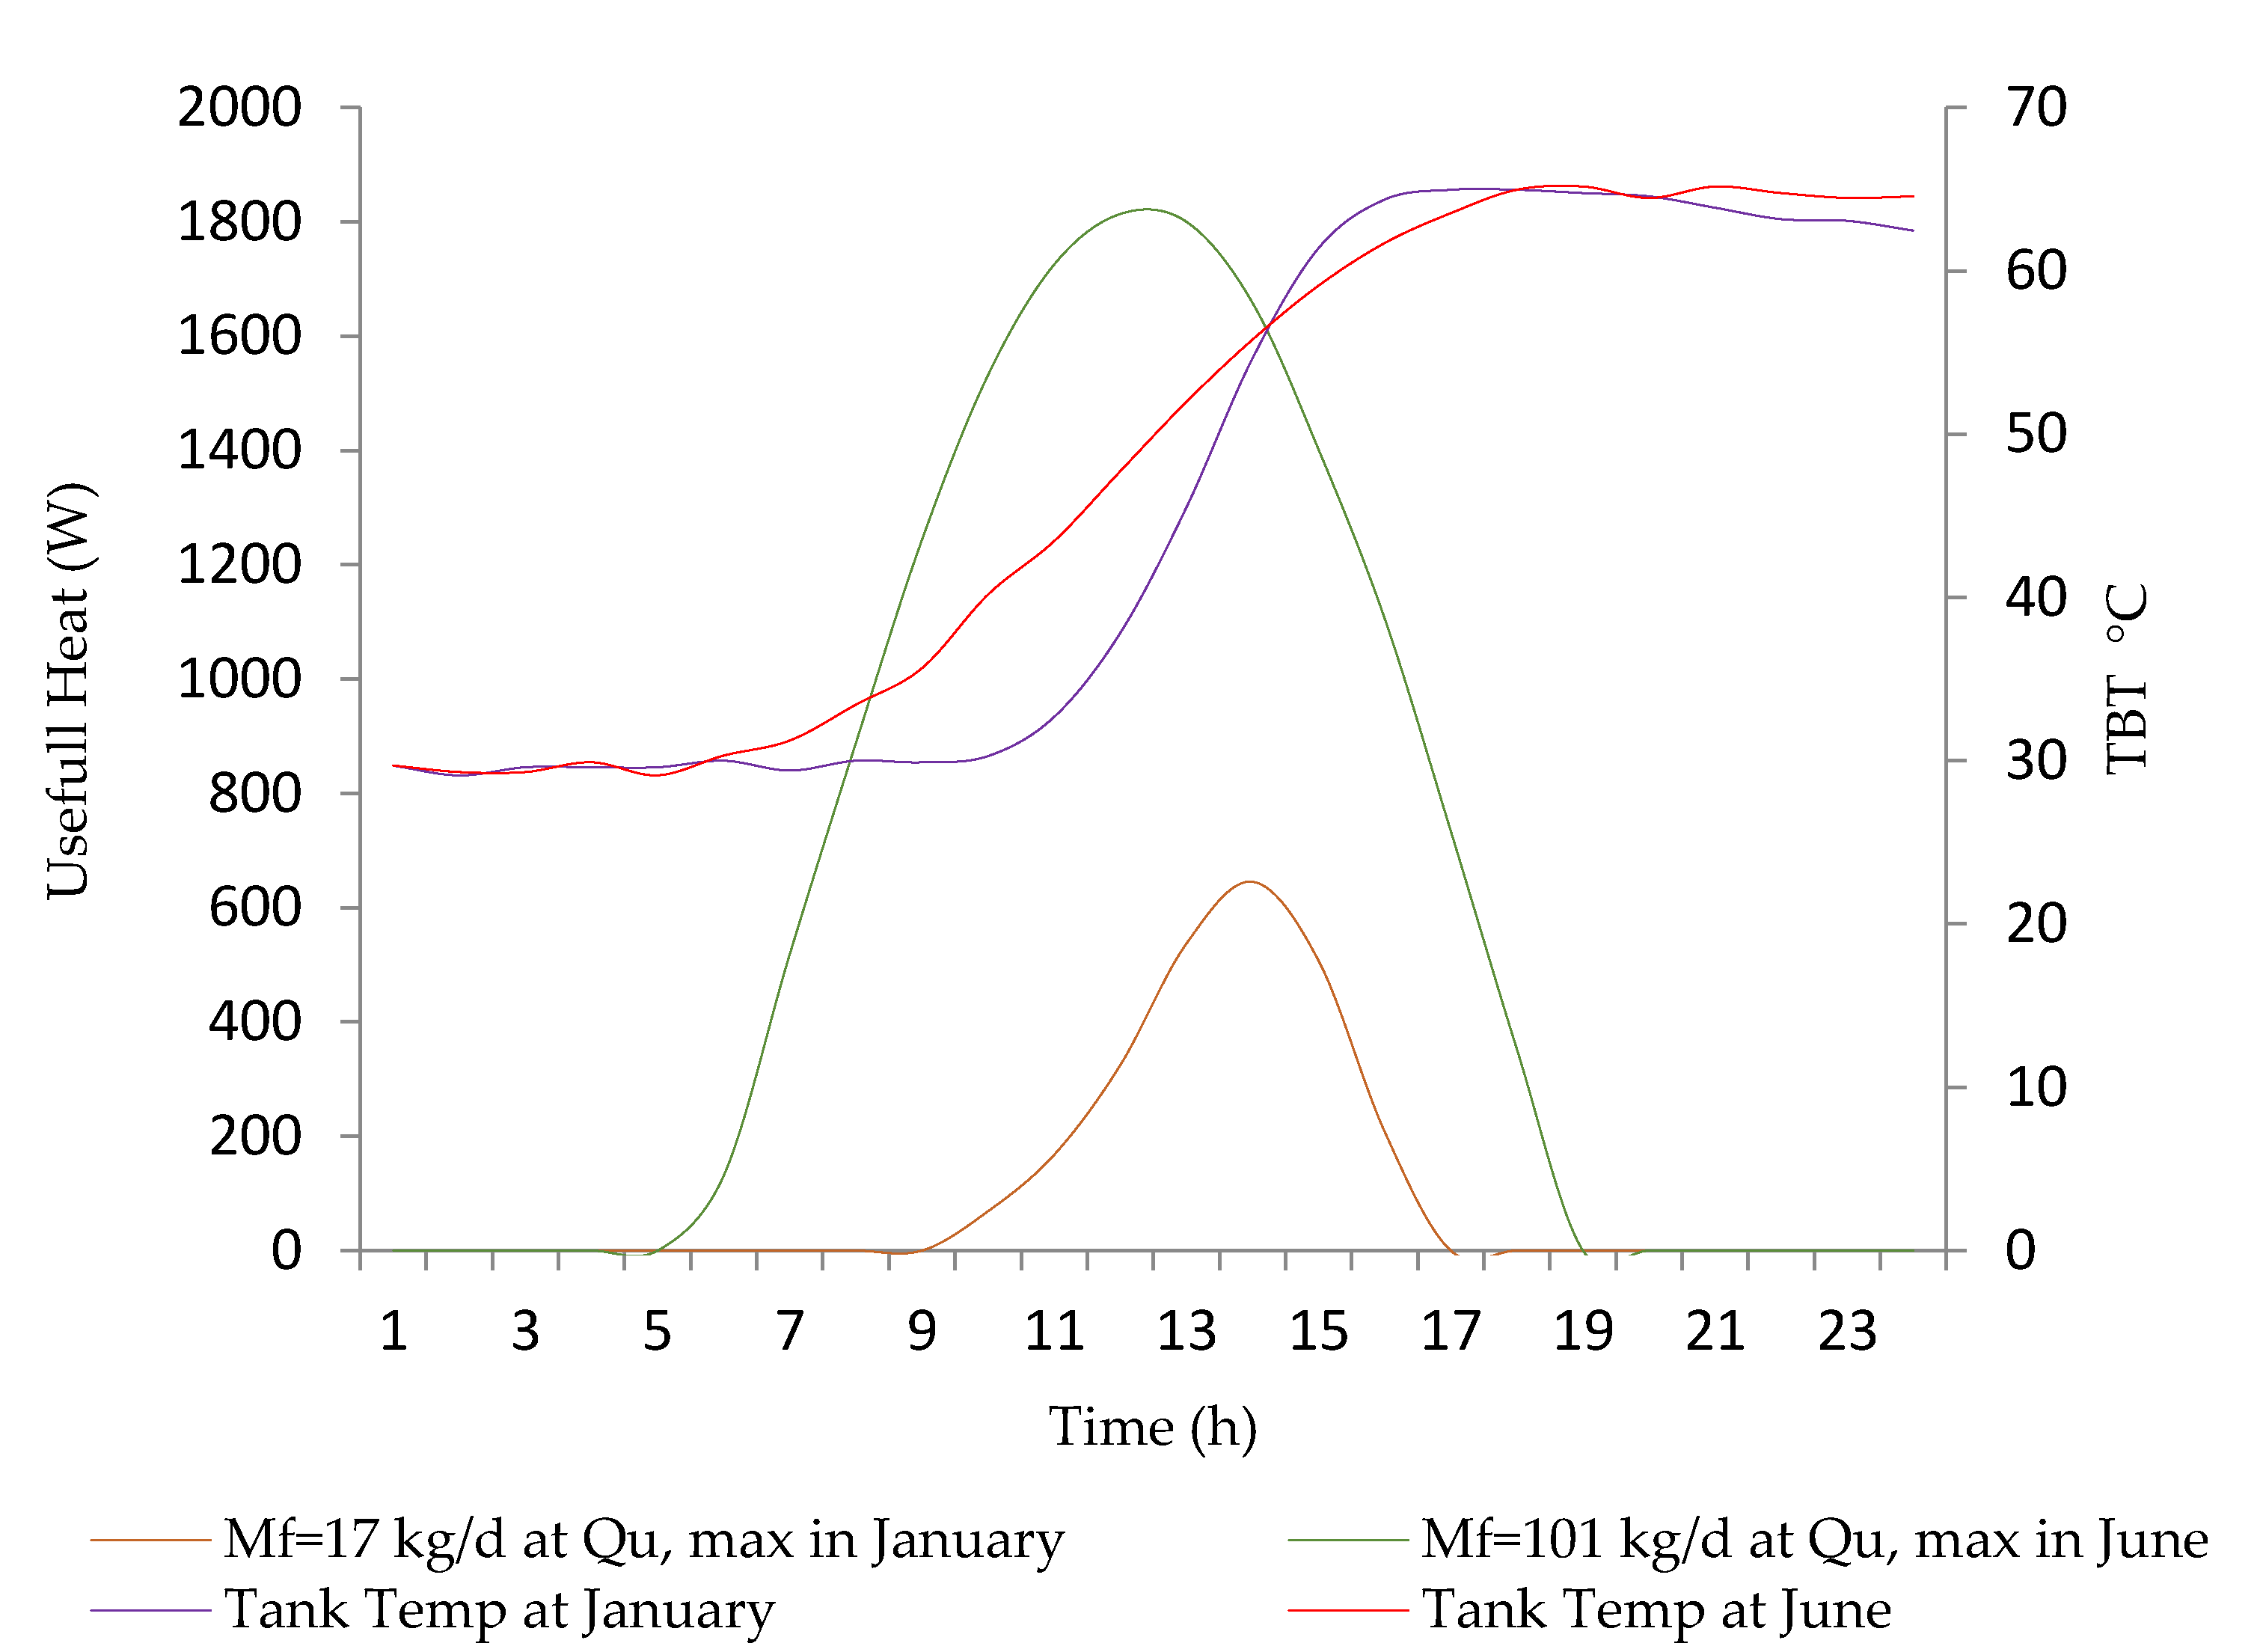
Figure 5 shows the hourly variations (changes) in the useful heat absorbed by the collector and feed water temperature in the storage tank for two different days of the year (the day with maximum useful heat and the day with minimum useful heat). The temperature rise is slight during the first hours of the day as a result of the useful heat gain. As shown in Figure 5, the temperature of the feed water in the tank increases with the increase in the useful heat gain during the day until it reaches 65 °C, as TBT is based on the calculated feed water for a day. For example, Figure 5 shows the TBT of the system, which is 65 °C on the day with the highest useful heat energy in June and on the day with the minimum useful heat energy in January, with different amounts of feed water proportional to the amount of energy.
In this work, the solar collector was simulated to operate during the day, beginning at 7:00 a.m., to absorb solar energy until reaching TBT, whereas the desalination unit was turned on after sunset and continued to operate throughout the night.
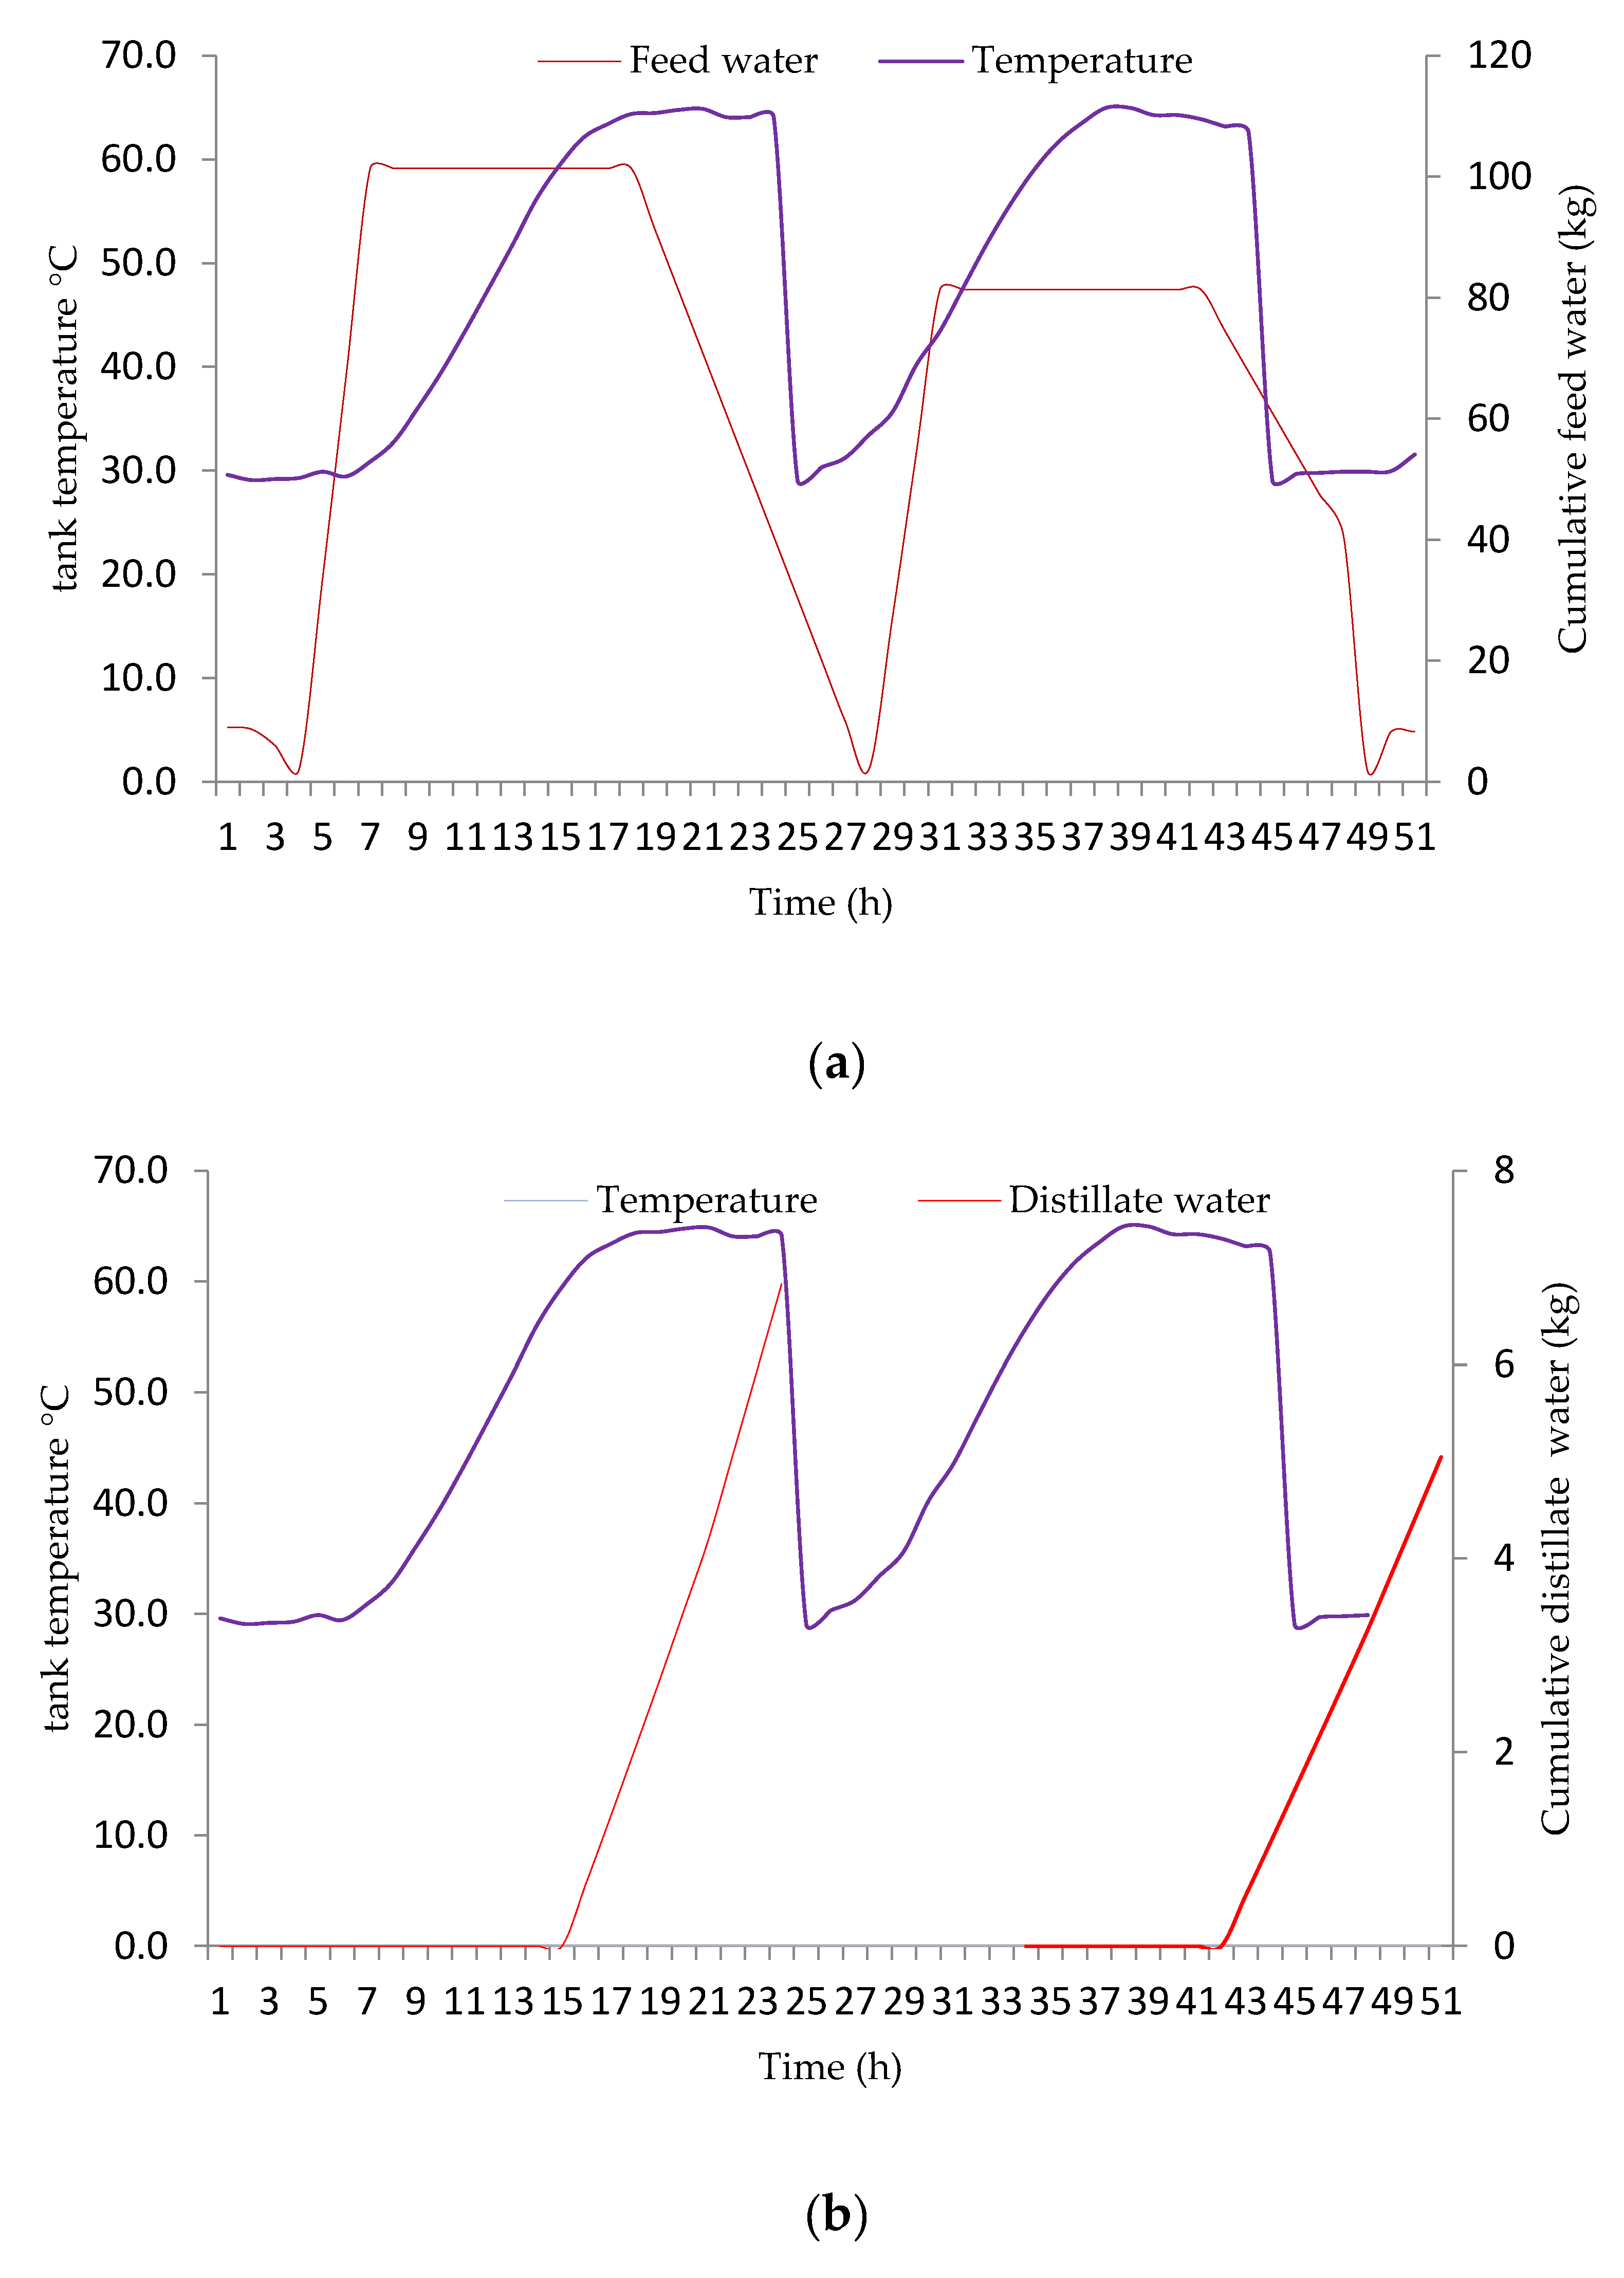
Figure 6 shows the whole-day process of filling the tank, charging it with power, and feeding the desalination unit with feed water at a constant TBT. In addition, it shows the process of increasing the temperature as a result of absorbing sunlight during the day and later during the water production process.
As a result of absorbing solar energy, the temperature of the tank gradually heats up to 65 °C. On a day with higher useful heat energy, the amount of feed water is higher, as indicated by the red curve. However, when the useful heat is at about 15 kW, the amount of feed water is about 100 kg per day, as shown in Figure 6a, and the production is about 6 kg per day as shown in Figure 6b. Likewise, on the day when useful heat energy is lower at about 14.3 kW, the amount of feed water is lower, as indicated by the red curve (about 96 kg per day).
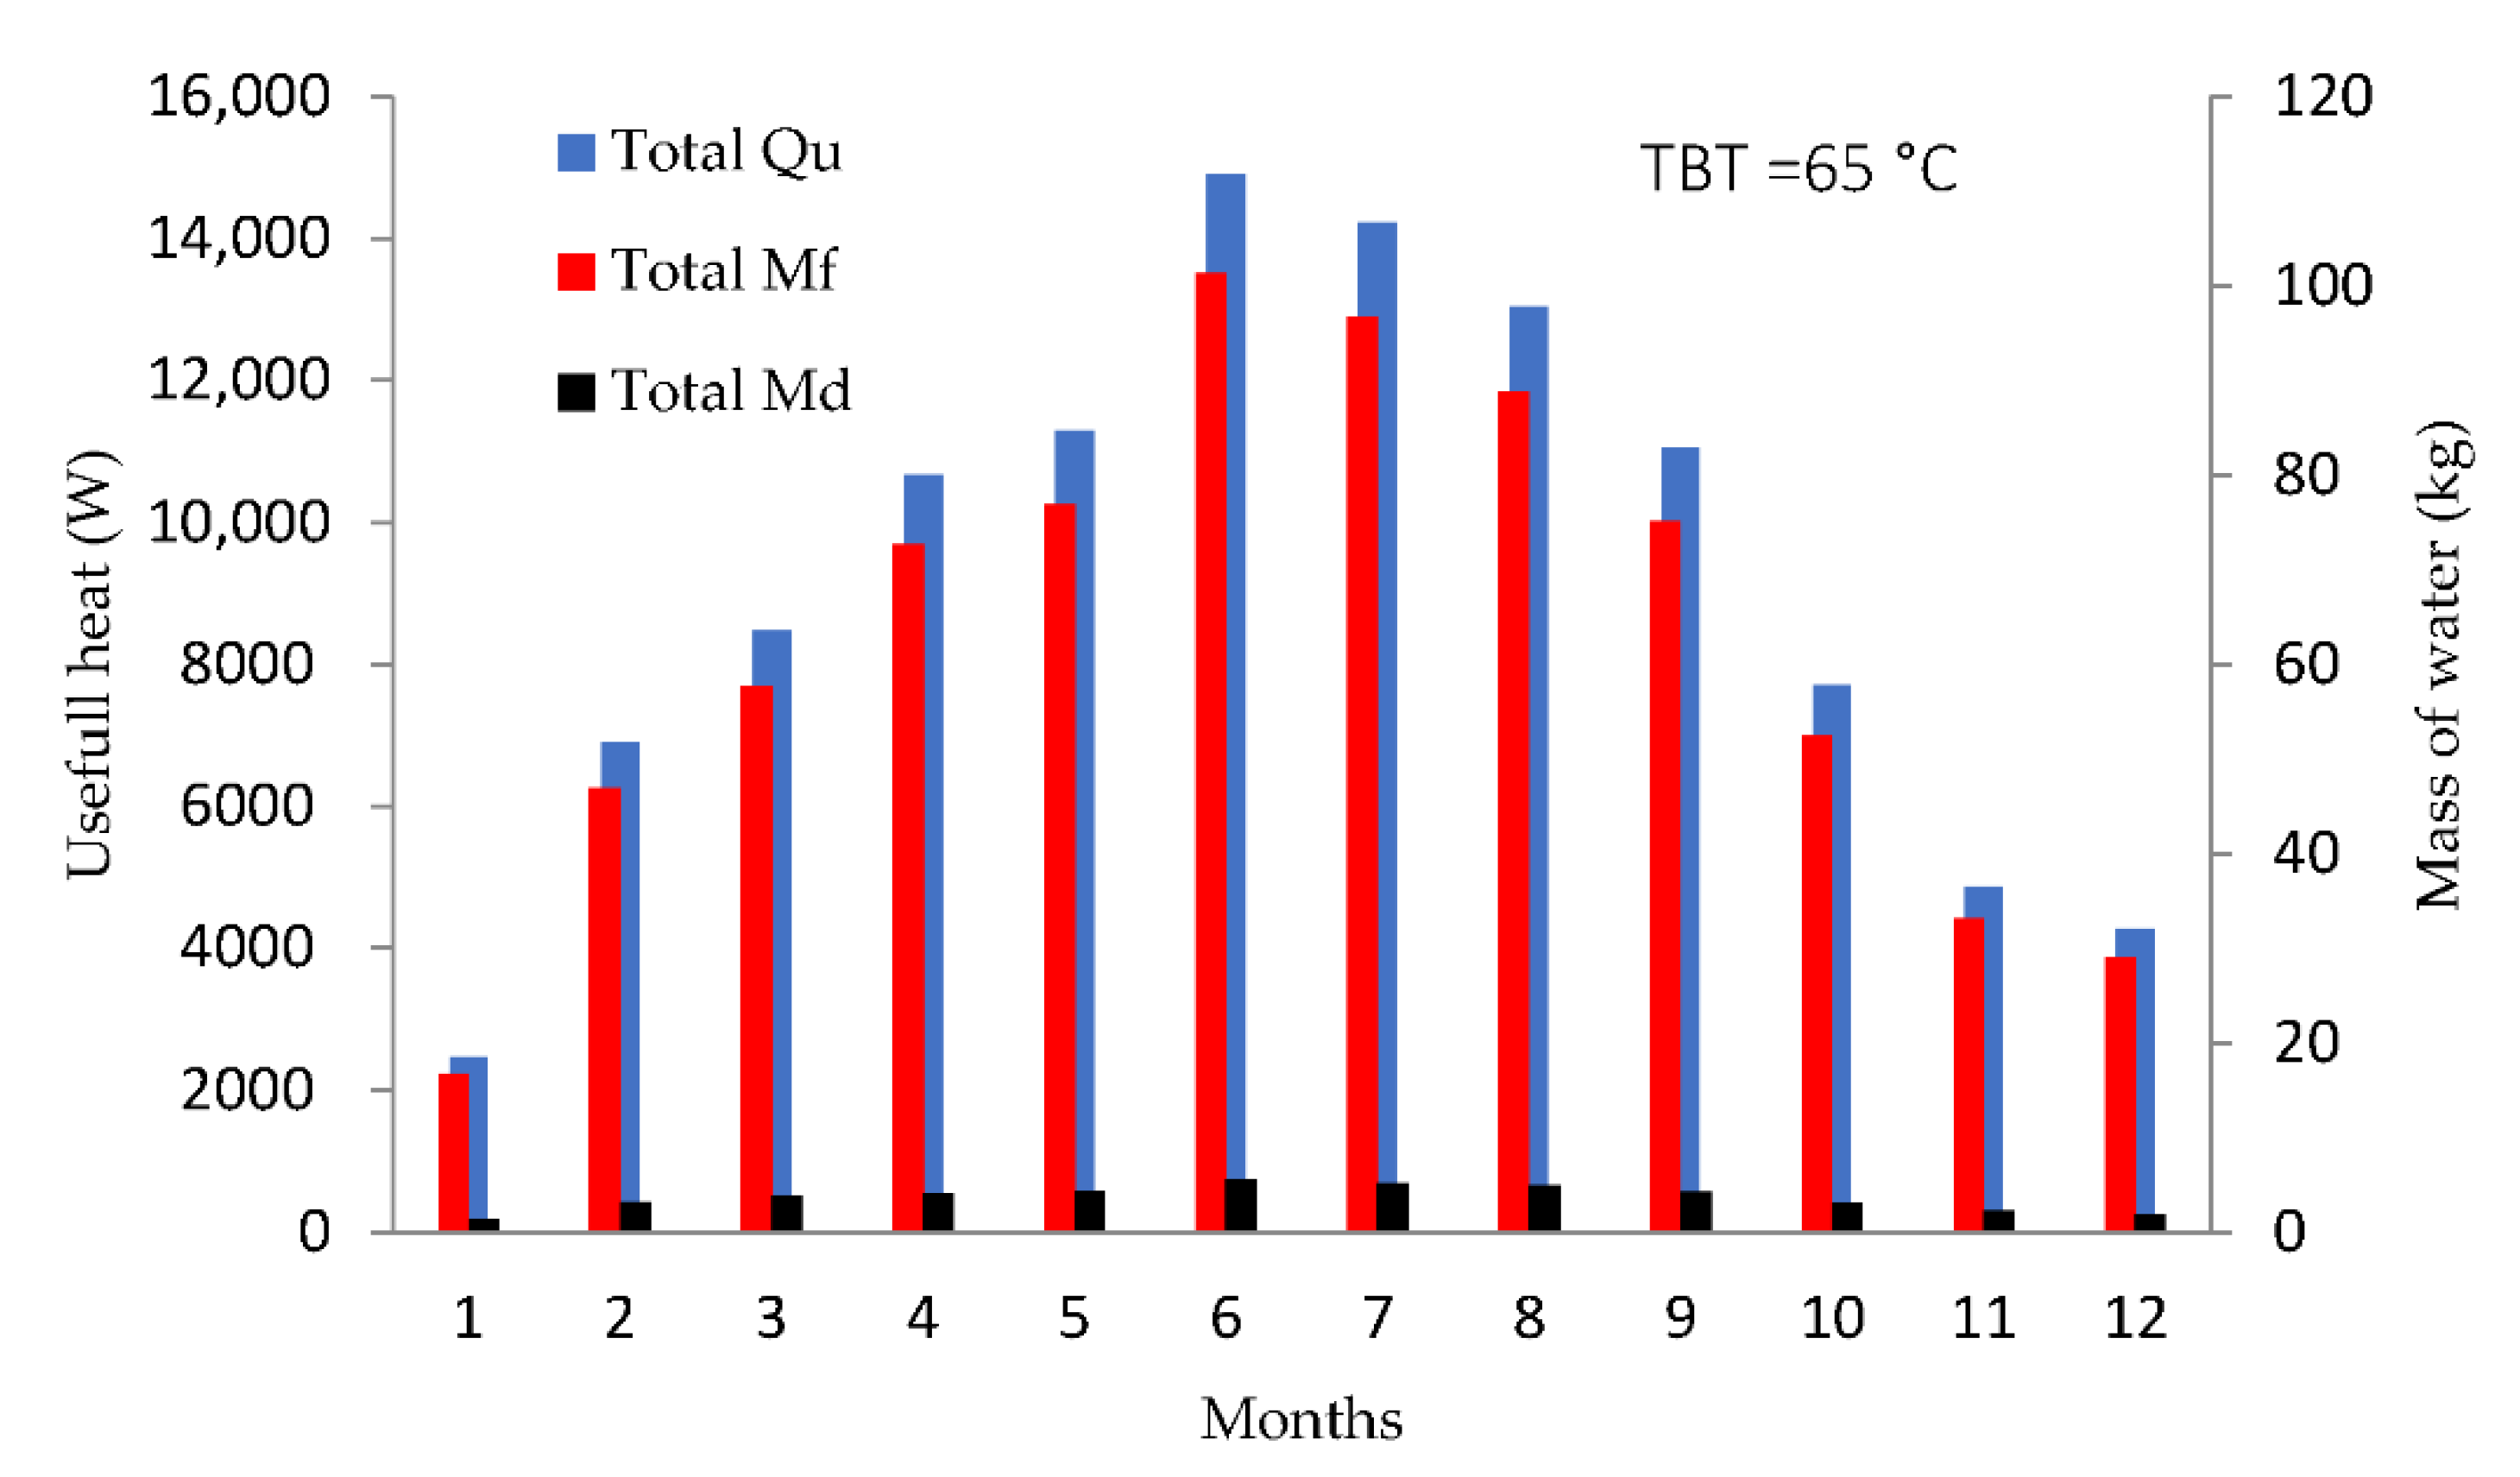
Average useful monthly heat, feed water, and production are shown in Figure 7. The variations in the masses from day to day or from month to month track the variations in available solar energy. This fluctuation explains the difference in the average daily production from one season to another, as the average daily water production in the summer, autumn, winter, and spring seasons is 5, 3, 2, and 3.5 kg per day, respectively. During summer, as shown in Figure 7, the design can produce up to 6.8 kg/day, which is the highest among other seasons. These results are based on a solar collection area of 2 m2 with the TBT set to 65 °C.
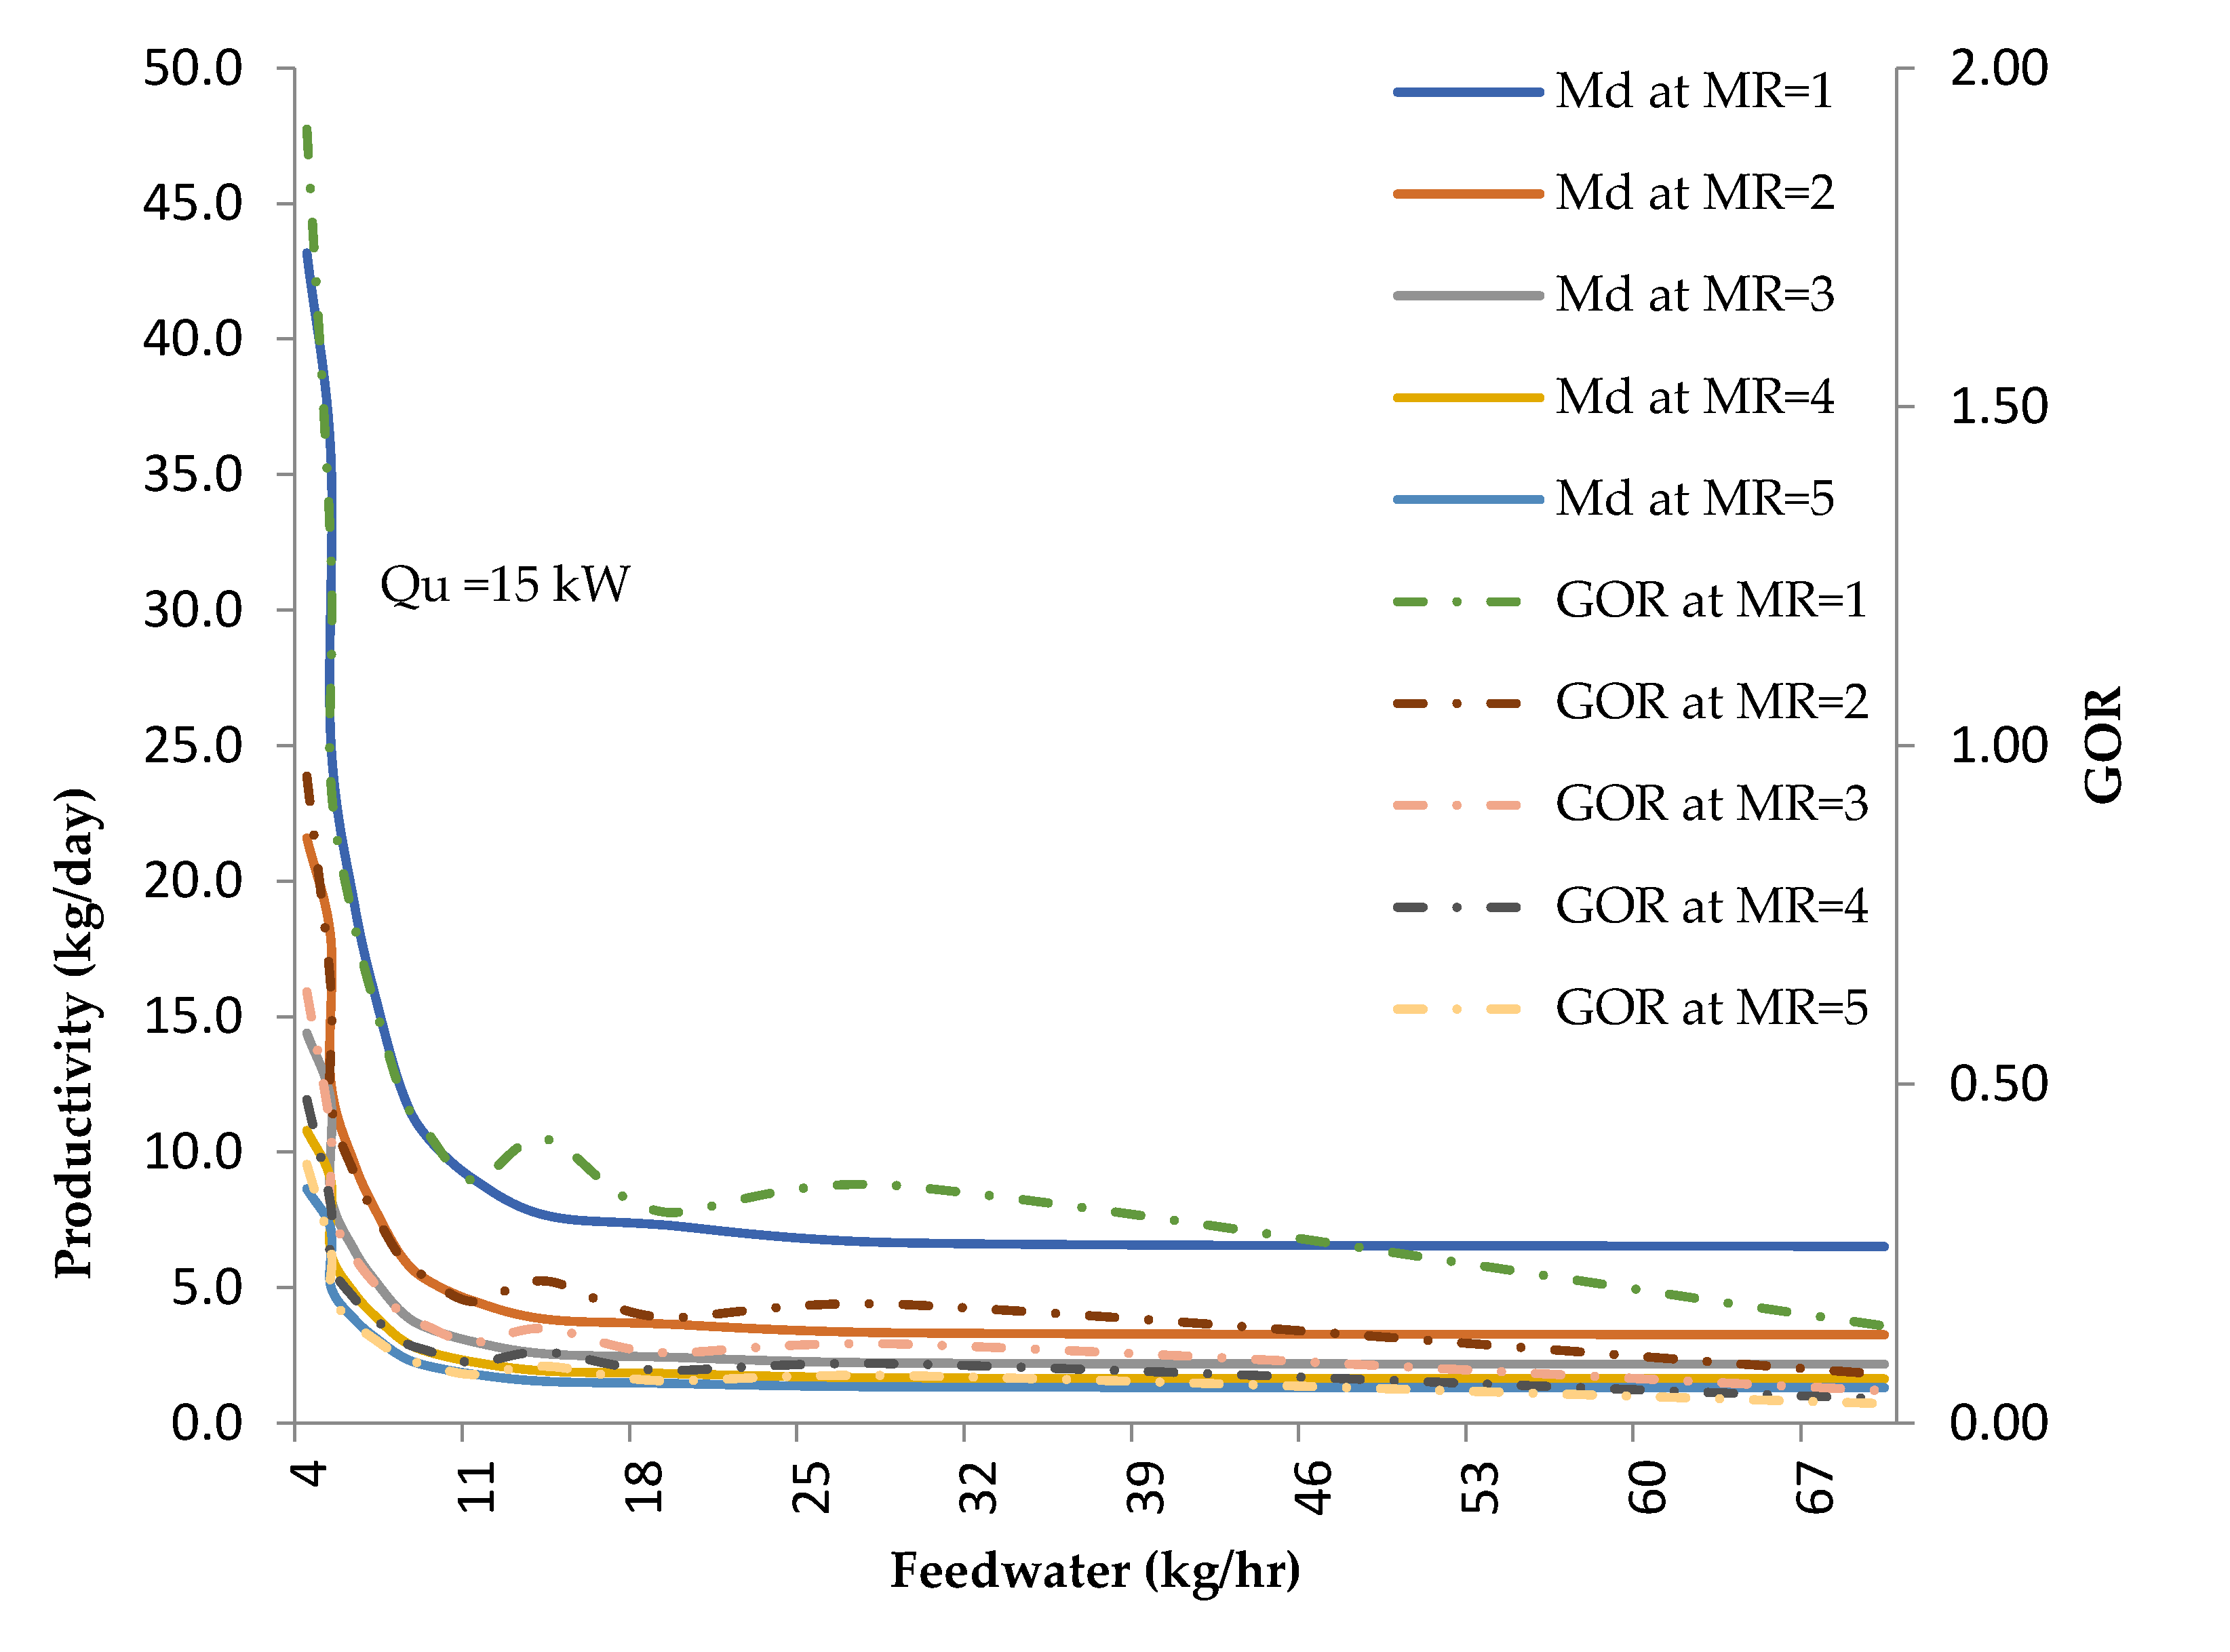
The mass flow rate ratio (MR) is defined as the ratio of inlet feed water mass flow rate to the inlet mass flow rate of dry air circulated in the HDH unit.
Figure 8 shows the effect of the feed-water flow rate on the distillate production at different values of hot seawater temperature entering the humidifier, MR and constant heat load. Increasing the feed-water flow rate could decrease the surface temperature of the condenser or limit the residence time of feed water contact with air flow. As a result, the condensation rate and the freshwater productivity are decreased.
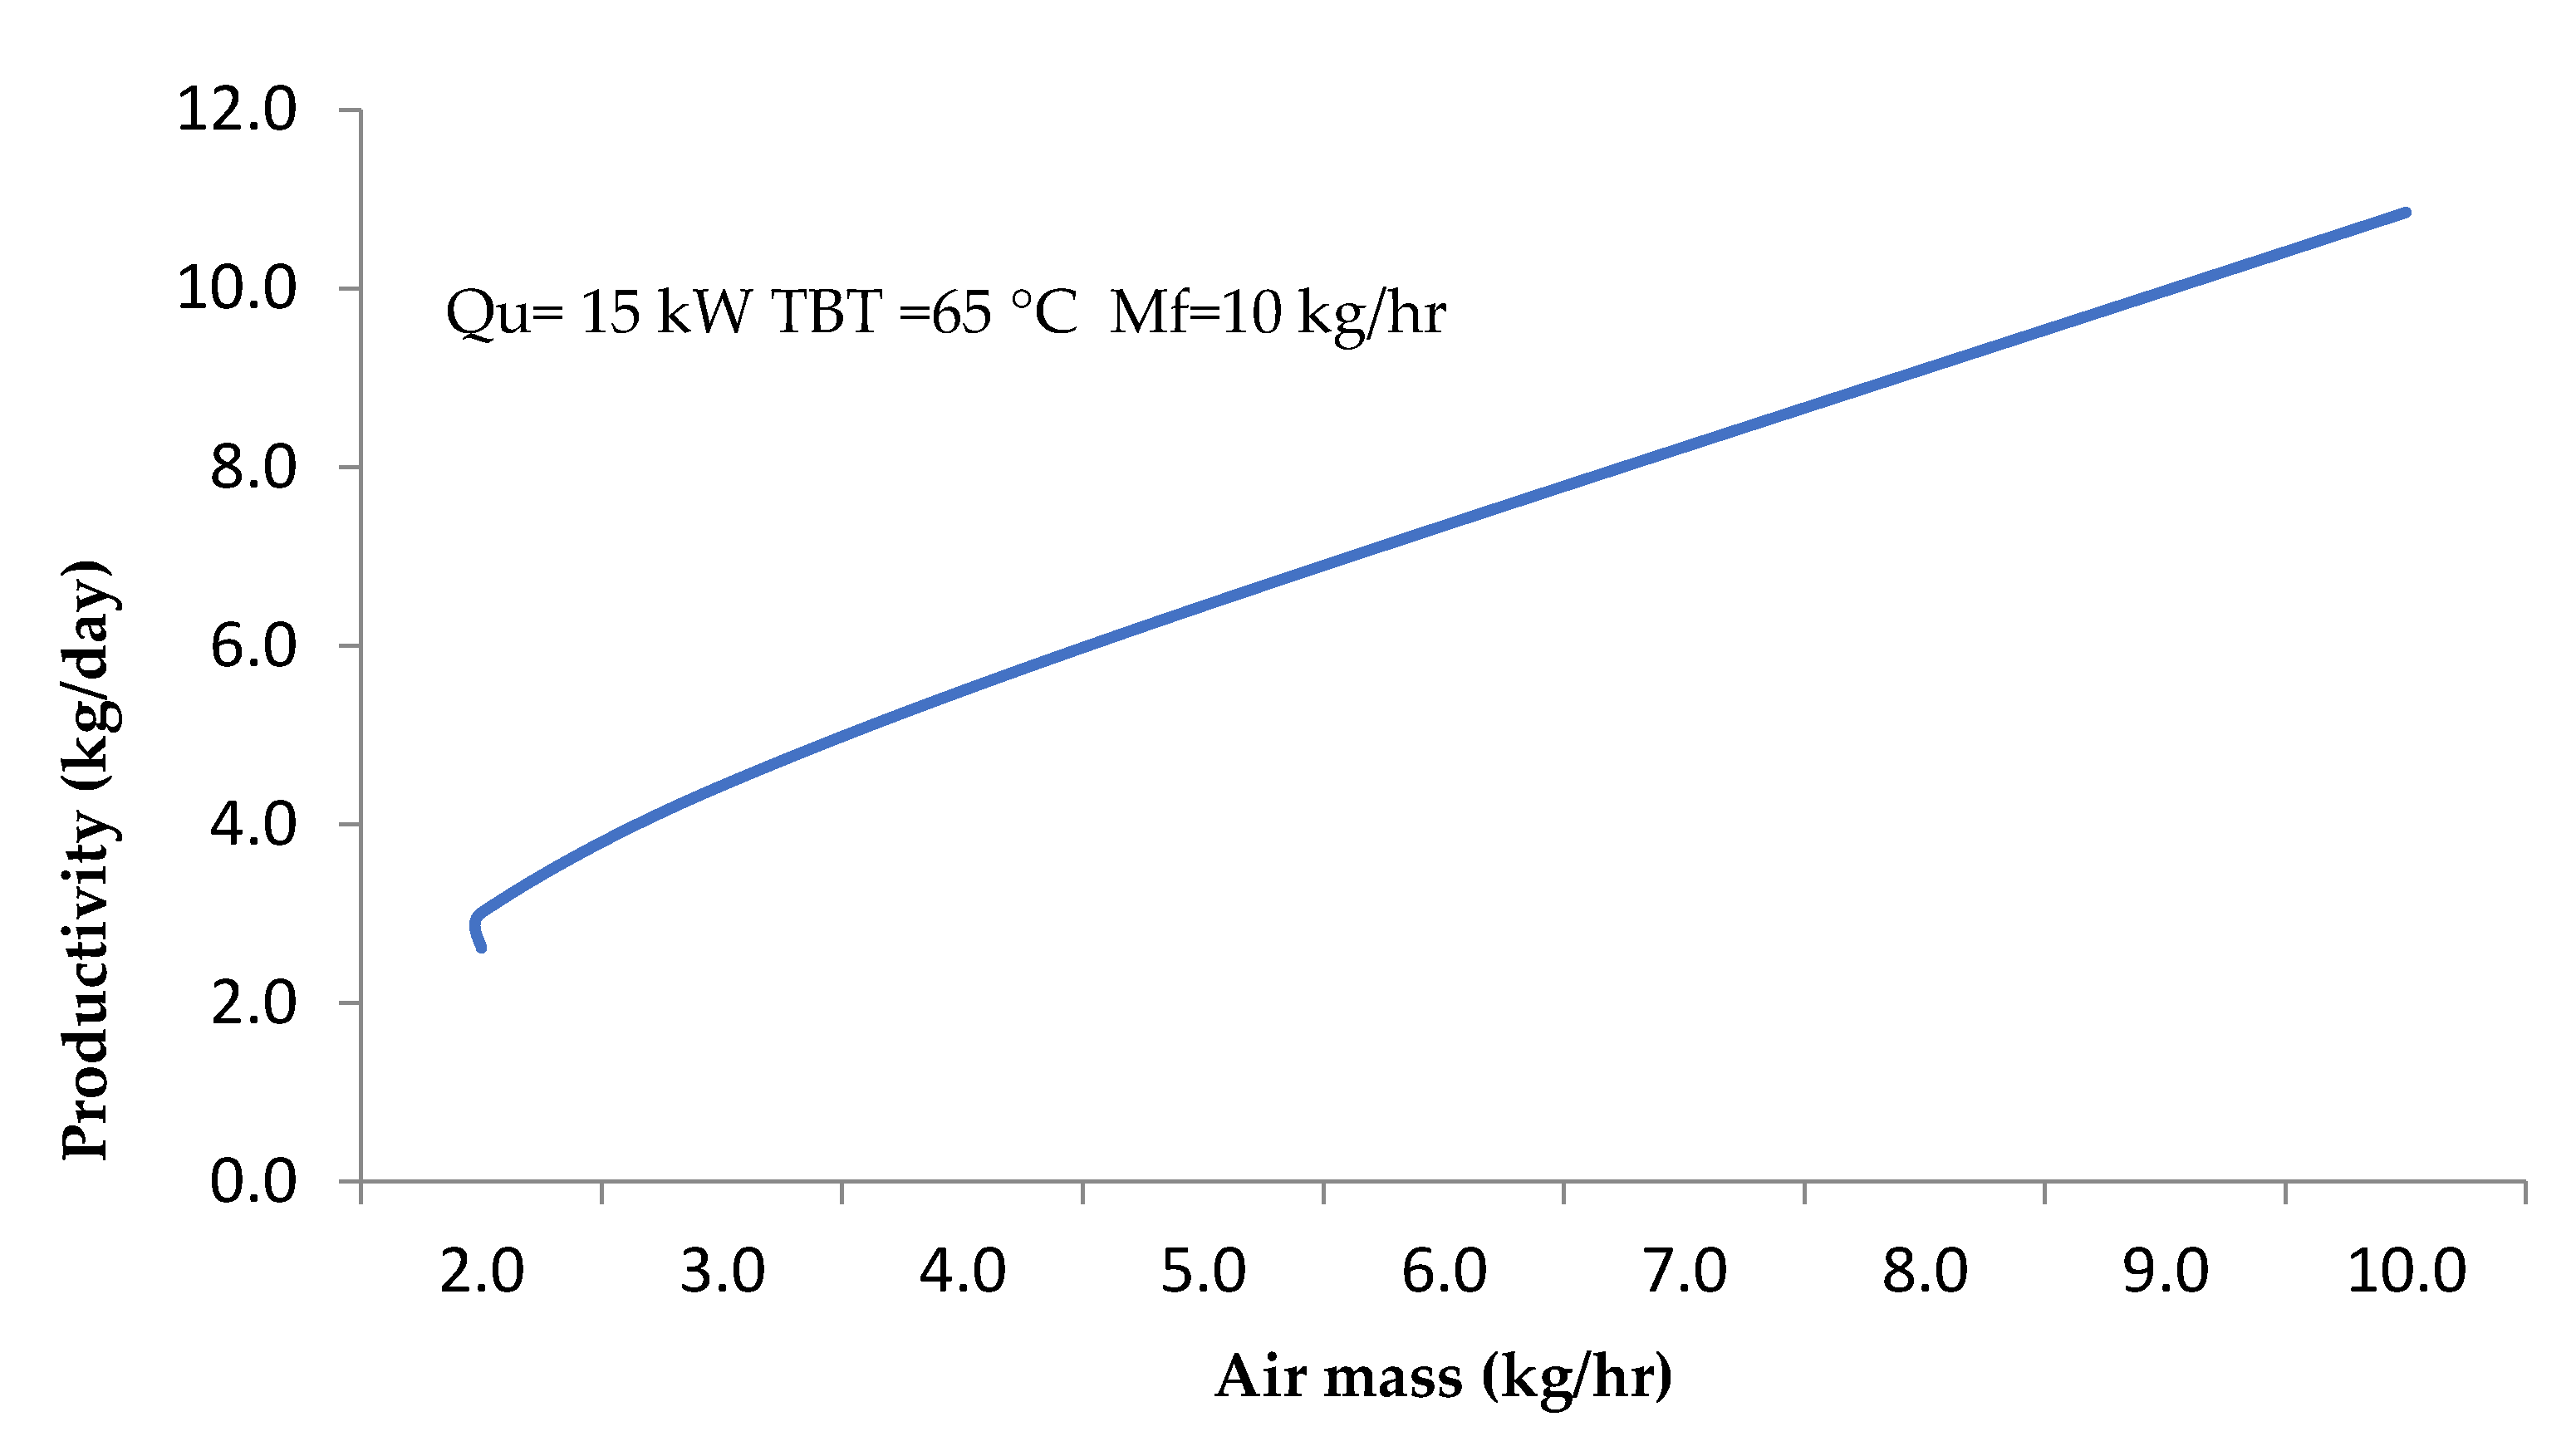
Figure 9 shows the airflow versus the productivity of the HDH at constant feed water and humidifier inlet water temp or TBT. As shown in Figure 9, the airflow has a significant effect on the freshwater productivity. It is clear that the freshwater productivity increases with increasing rate of airflow (hot and humid air).
The thermal performance of the HDH desalination system was evaluated by gain output ratio GOR. The GOR is defined as the ratio of the latent heat of evaporation of the production to the total energy input of the HDH unit as given by Equation (A8).
Figure 10 shows that the productivity and GOR are affected by the feed-water flow rate. The increase in the feed-water flow rate at constant heat leads to a decrease in the amount of evaporated water, thereby causing a decrease in the productivity rate and GOR decrease.
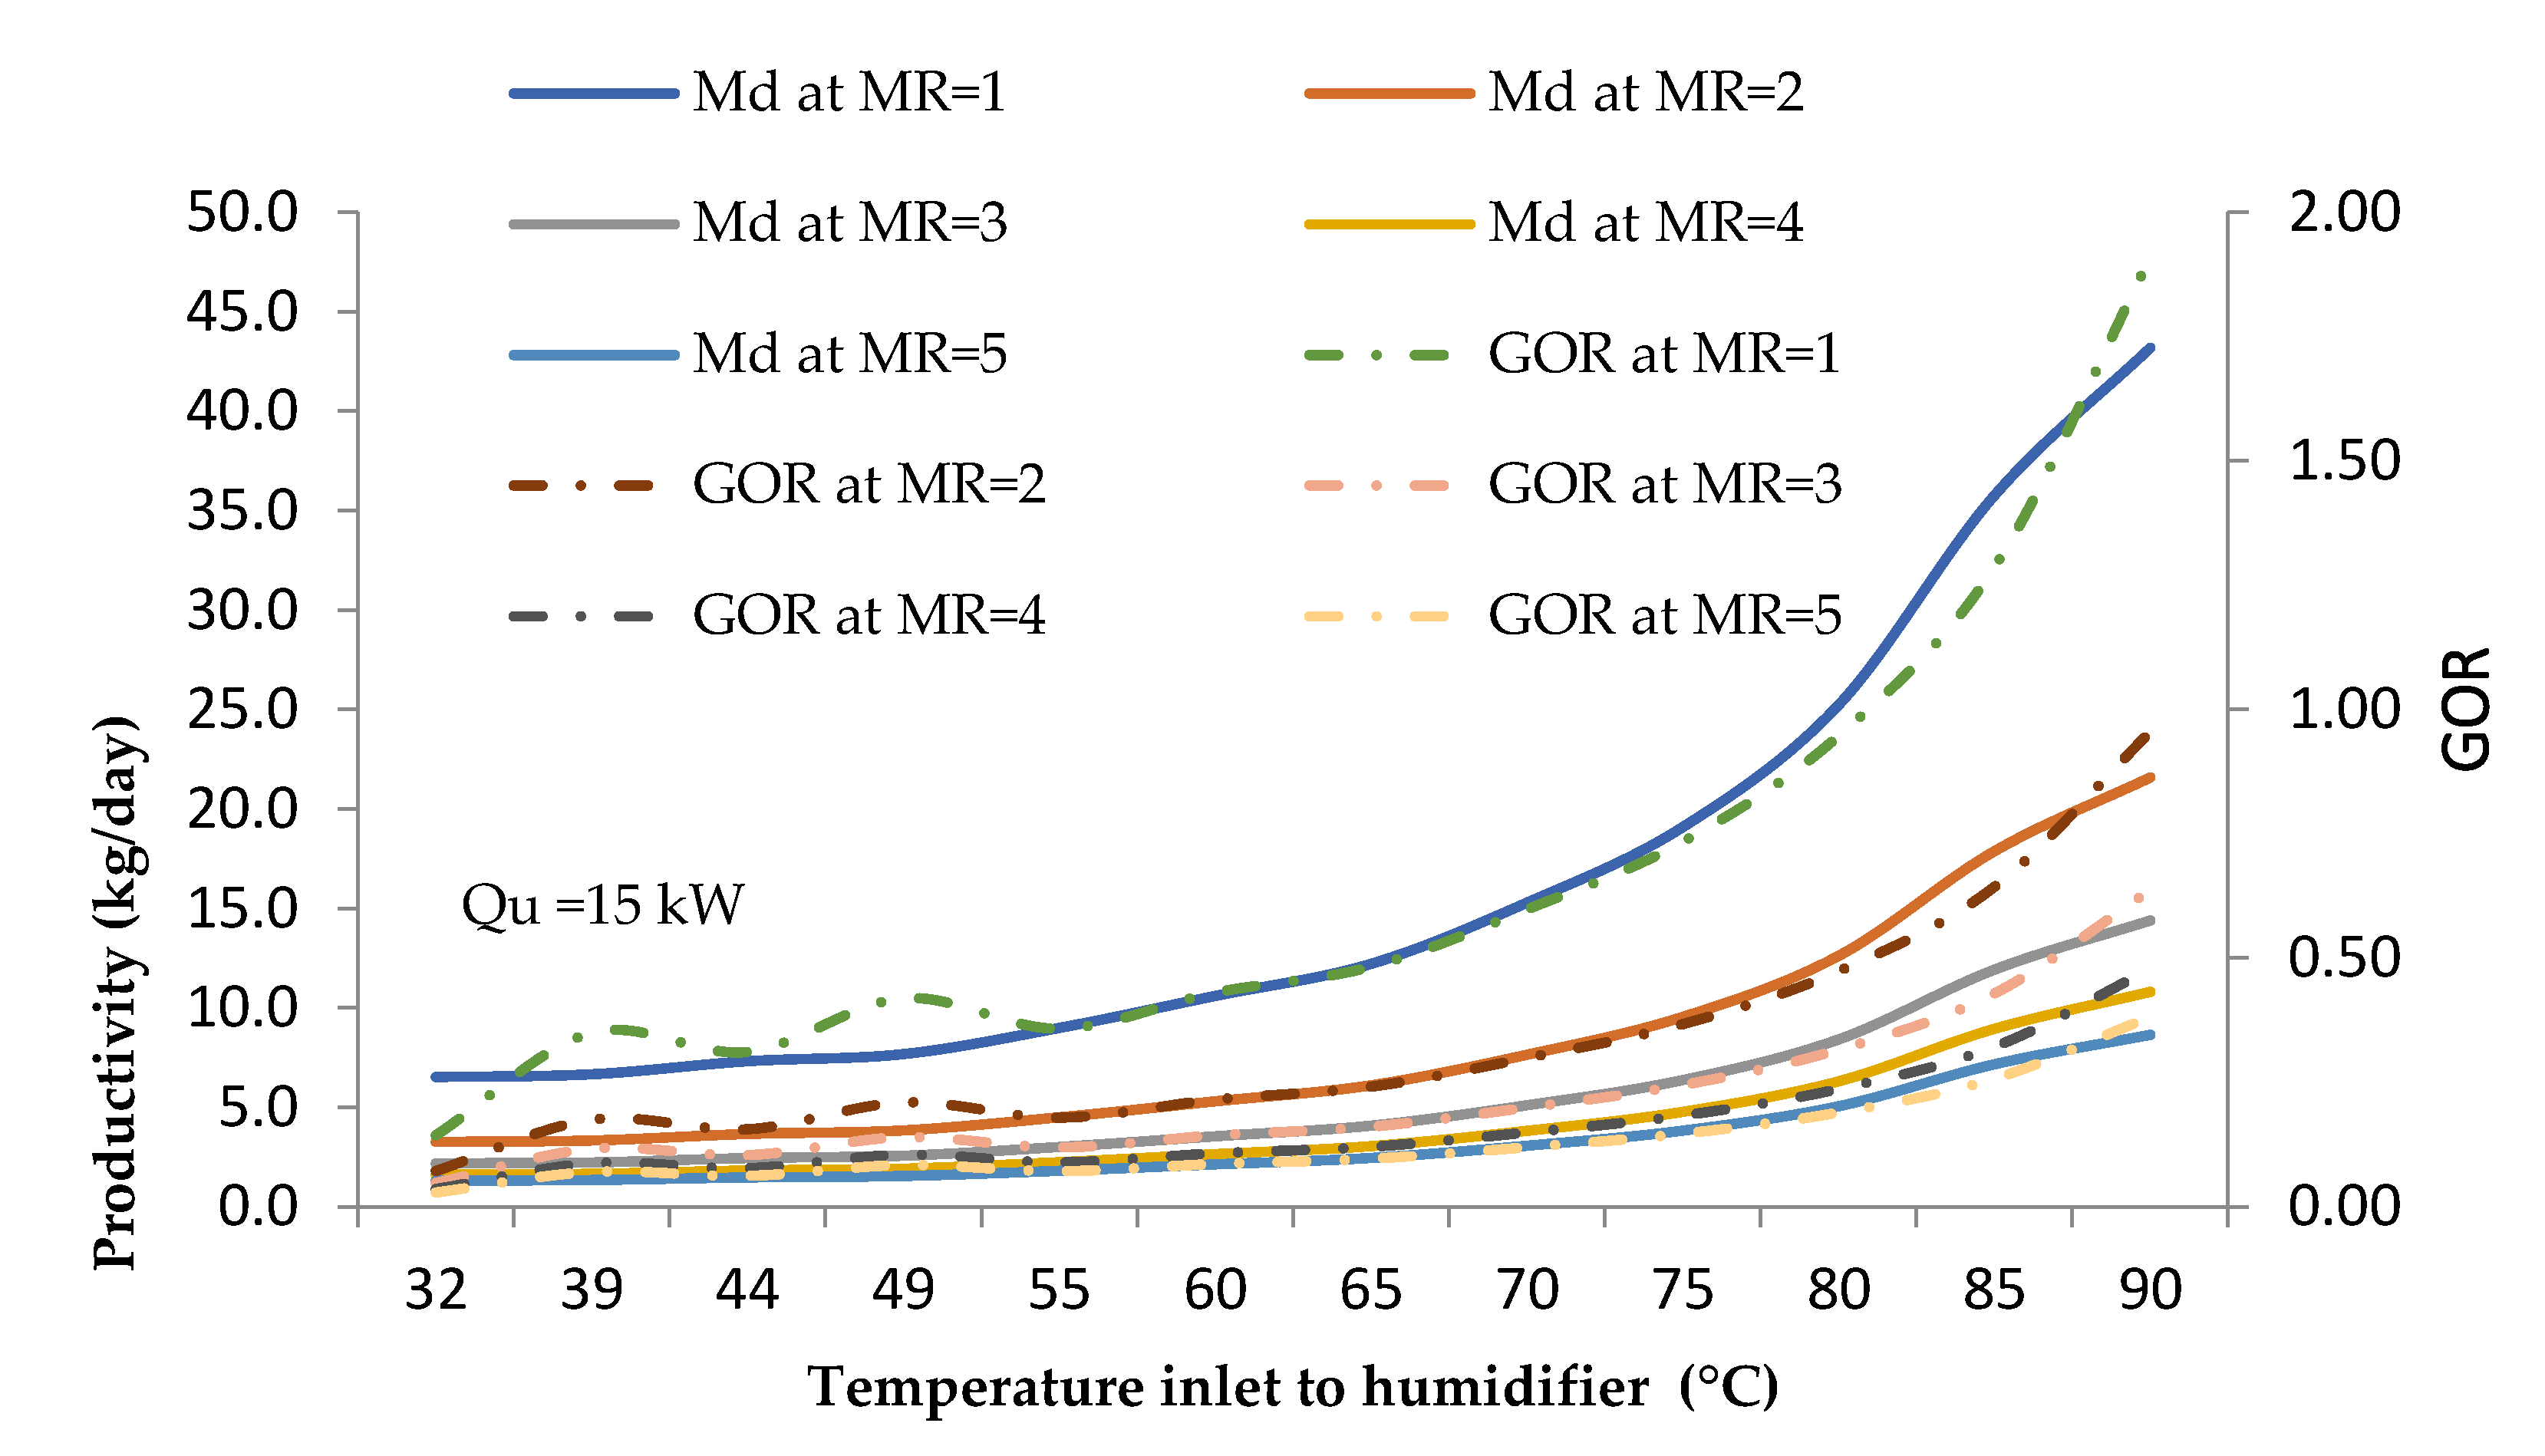
As shown in Figure 11, both productivity and GOR are affected by the temperature of the feed water entering the humidifier, as productivity and GOR increase when the input temperature of the feed water is increased due to the increasing evaporation rate.
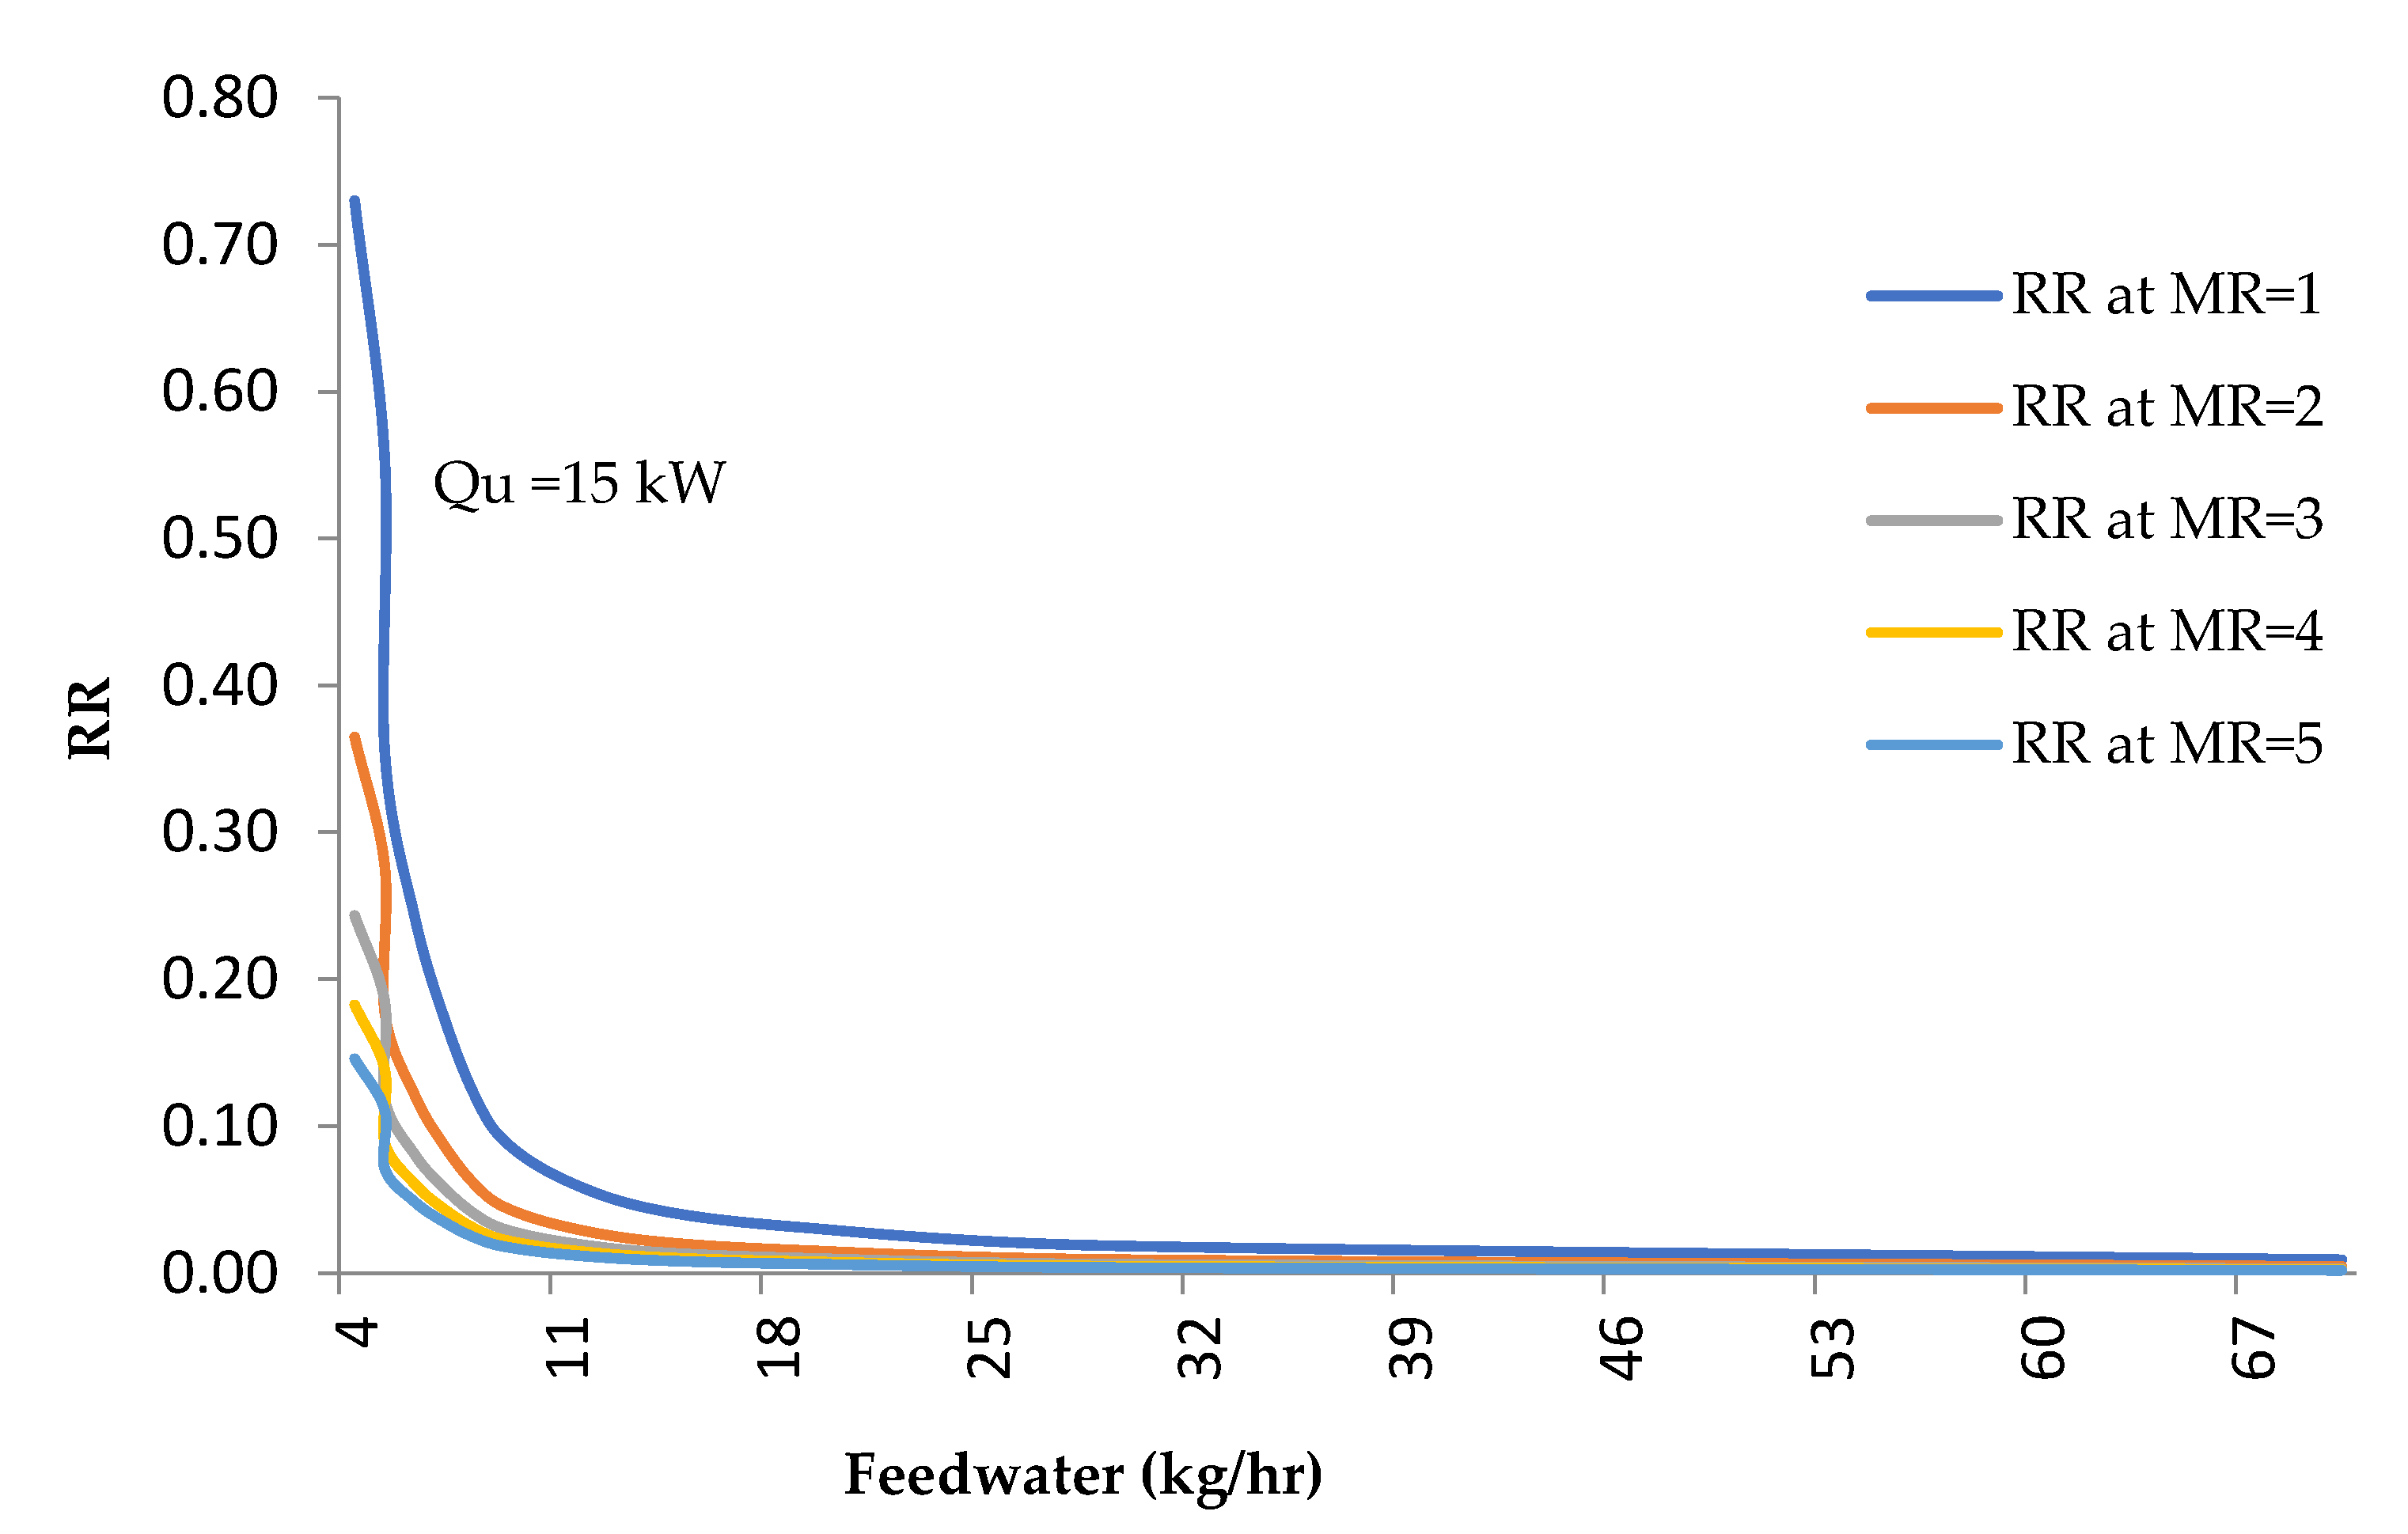
The recovery ratio (RR) is defined as the ratio of mass flow rate of product water to the mass flow rate of feed water as given by Equation (A9 in Appendix A). As shown in Figure 12, the recovery ratio decreases when the flow of feed water increases. At constant head load, increasing the flow of feed water into the system reduces the recovery ratio. This is because the ability to distill freshwater from saltwater depends on heat load. Therefore, due to the high feed flow rate, the amount of evaporated water per kilogram of input water will decrease as the recovery ratio decreases.
5. Conclusions
A design of an HDH system powered by solar energy is presented through a developed mathematical model. The design comprises three components: a solar system including a collector and PV, an HDH unit, and thermal storage tanks.
The amount of solar energy is estimated using a model for a solar collector and TMY3 weather data. The daily feed flow rate is calculated based on the solar energy available.
A two-period description is formulated for the mathematical model of solar energy and desalination through this paper. The first period observes the day cycle, during which a numerical transit simulation is executed according to the varying solar energy. The available energy was captured and used to raise the temperature of the feed water to the desired TBT temperature. The second period observes the night cycle, during which the simulation works through the mathematical model of HDH. Subsequently, the amount of water produced is calculated.
The MATLAB software is used to simulate the model. The simulation case study was carried out using the HDH model for a specific location, Las Vegas USA. The results showed the production of an average of 0.05–1.8 kg/h of distillate associated with a solar collector area of 2 m2. The GOR and RR for the simulation ranged from 0.03 to 1.9 and from 0.01 to 0.73, respectively.
This work has several limitations. First, because it is based on a theoretical model and simulation, it is unclear how a physical HDH system will perform. The model makes many assumptions about thermal losses, such as tank losses, collector losses, and HDH unit losses. Because of this, it is likely that the physical model will have a lower performance than predicted by the simulation. Second, the scope of this work was limited to a single location, Las Vegas, USA. To better understand how the HDH system will perform in various locales around the world, future work should simulate more diverse regions. Of course, there are certain regions of the world where such a system would not be very efficient. Establishing guidelines based on the environmental parameters that limit its performance could help increase its usability, enabling future users to determine whether or not such a system would function in their regions of the world. Similarly, unseasonable weather patterns will also affect the efficiency of the system and should be simulated in future work to again determine expected performance under uncertain conditions. Finally, the system presented in this work is based on fixed design parameters, such as solar collector area, tank volume, coefficients of thermal conductivity, and flowrates. To truly understand the benefit of the HDH system, a multivariable design optimization will be performed in future work. This should take all design parameters into account, consider constraints imposed by physical aspects of the system such as available tank volumes, and encode GOR as the objective function, which is to be maximized. Such an optimization would ideally simulate and average the performance of a given design over a range of randomized weather data.
Funding
This research was funded by Taif University Researchers Supporting Project number (TURSP-2020/205).
Institutional Review Board Statement
Not applicable.
Informed Consent Statement
Not applicable.
Data Availability Statement
All the results shown in the manuscript can be requested from the author.
Acknowledgments
The author would like to gratefully acknowledge the financial support by Taif University Researchers Supporting Project number (TURSP-2020/205), Taif University, Taif, Saudi Arabia.
Conflicts of Interest
The author declares no conflict of interest.
Nomenclature
| Enthalpy of dehumidified air entering the humidifier | |
| Enthalpy of humidified air at the outlet of the humidifier | |
| Enthalpy of the water entering the dehumidifier (kJ/kg) | |
| Enthalpy of water at the exit of the dehumidifier (kJ/kg) | |
| Enthalpy of freshwater leaving the dehumidifier (kJ/kg) | |
| Enthalpy of the feed water entering the humidifier [kJ/kg] | |
| Saturation pressure of water vapor present in the air (N/m2) | |
| Specific heat for the feed water | |
| daily average insolation | |
| Peak Mass | |
| Pre-heated seawater | |
| Useful Heat Gain /Heat transmitted each hour by one collector | |
| Ambient air temperature | |
| Tank temperature / Temperature of feed water entering to the humidifier | |
| Temperature of the pre-heated feedwater | |
| Heat-loss coefficients, constants for the solar array | |
| Mass flow rate of air (kg/h) / Mass flow rate of dry air (kg/min) | |
| Mass flow rate of brine [kg/s] | |
| mass flow rate of cooling water (kg/min) | |
| Mass flow rate of distillate water [kg/s] | |
| Mass flow rate of the feed water [kg/s] | |
| Zero-loss coefficient, constants for the solar array | |
| Humidity ratio of the inlet air | |
| Humidity ratio of the outlet air | |
| temperature decrease | |
| Gained Output Ratio | |
| Hour | |
| Atmospheric pressure (N/m2) | |
| Recovery Ratio | |
| Relative humidity of the inlet air | |
| Counter flow | |
| CRF | Cross flow |
| Loss coefficient for Tank | |
| Day | |
| Collector efficiency |
Appendix A
The correlations that were used in the model, such as the specific heat for air and water, the water vapor saturation pressure, and other properties are given as following [42,43]
Specific humidity
Saturated vapor pressure
Relative humidity
Enthalpy of moist air
Specific heat of sea water
The water specific heat at constant pressure is given by
The air specific heat at constant pressure is given by
Gain output ratio
Recovery ratio
References
- Dawoud, M.A. Economic Feasibility of Small Scale Solar Powered RO Desalination for Brackish/Saline Groundwater in Arid Regions. Int. J. Water Resour. Arid Environ. 2017, 6, 103–114. [Google Scholar]
- Niasse, M.; Varis, O. Quenching the thirst of rapidly growing and water-insecure cities in sub-Saharan Africa. Int. J. Water Resour. Dev. 2020, 36, 505–527. [Google Scholar] [CrossRef]
- Jones, E.; Qadir, M.; van Vliet, M.T.; Smakhtin, V.; Kang, S.-M. The state of desalination and brine production: A global outlook. Sci. Total Environ. 2019, 657, 1343–1356. [Google Scholar] [CrossRef]
- Foster, S.; Pulido-Bosch, A.; Vallejos, Á.; Molina, L.; Llop, A.; MacDonald, A.M. Impact of irrigated agriculture on groundwa-ter-recharge salinity: A major sustainability concern in semi-arid regions. Hydrogeol. J. 2018, 26, 2781–2791. [Google Scholar] [CrossRef] [Green Version]
- Bouchekima, B. A solar desalination plant for domestic water needs in arid areas of South Algeria. Desalination 2003, 153, 65–69. [Google Scholar] [CrossRef]
- Shatat, M.; Riffat, S.B. Water desalination technologies utilizing conventional and renewable energy sources. Int. J. Low-Carbon Technol. 2014, 9, 1–19. [Google Scholar] [CrossRef]
- Eltawil, M.A.; Zhengming, Z.; Yuan, L. A review of renewable energy technologies integrated with desalination systems. Renew. Sustain. Energy Rev. 2009, 13, 2245–2262. [Google Scholar] [CrossRef]
- Velmurugan, V.; Kumar, K.N.; Haq, T.N.; Srithar, K. Performance analysis in stepped solar still for effluent desalination. Energy 2009, 34, 1179–1186. [Google Scholar] [CrossRef]
- Kabeel, A.; Dawood, M.M.K.; Ramzy, K.; Nabil, T.; Elnaghi, B.; Elkassar, A. Enhancement of single solar still integrated with solar dishes: An experimental approach. Energy Convers. Manag. 2019, 196, 165–174. [Google Scholar] [CrossRef]
- Fouda, A.; Nada, S.; Elattar, H.; Rubaiee, S.; Al-Zahrani, A. Performance analysis of proposed solar HDH water desalination systems for hot and humid climate cities. Appl. Therm. Eng. 2018, 144, 81–95. [Google Scholar] [CrossRef]
- Ahmed, H.A.; Ismail, I.M.; Saleh, W.F.; Ahmed, M. Experimental investigation of humidification-dehumidification de-salination system with corrugated packing in the humidifier. Desalination 2017, 410, 19–29. [Google Scholar] [CrossRef]
- Narayan, G.P.; Sharqawy, M.H.; Lienhard, V.J.H.; Zubair, S.M. Thermodynamic analysis of humidification dehumidification de-salination cycles. Desalin. Water Treat. 2010, 16, 339–353. [Google Scholar] [CrossRef] [Green Version]
- Zubair, S.M.; Antar, M.A.; Elmutasim, S.M.; Lawal, D.U. Performance evaluation of humidification-dehumidification (HDH) de-salination systems with and without heat recovery options: An experimental and theoretical investigation. Desalination 2018, 436, 161–175. [Google Scholar] [CrossRef]
- Qasem, N.; Imteyaz, B.; Antar, M.A. Investigation of the effect of the top and the bottom temperatures on the performance of humidification dehumidification desalination systems. In Proceedings of the ASME 2016 International Mechanical Engineering Congress and Exposition, Phoenix, AZ, USA, 11–17 November 2016. [Google Scholar]
- Ahmed, M.; Qasem, N.A.; Zubair, S.M. Analytical and numerical schemes for thermodynamically balanced humidification-dehumidification desalination systems. Energy Convers. Manag. 2019, 200, 112052. [Google Scholar] [CrossRef]
- Park, I.; Park, S.; Ha, J. Design and application of thermal vapor compressor for multi-effect desalination plant. Desalination 2005, 182, 199–208. [Google Scholar] [CrossRef]
- Kazemian, M.; Behzadmehr, A.; Sarvari, S. Thermodynamic optimization of multi-effect desalination plant using the DoE method. Desalination 2010, 257, 195–205. [Google Scholar] [CrossRef]
- Datsgerdi, H.R.; Chua, H.T. Thermo-economic analysis of low-grade heat driven multi-effect distillation based desalination processes. Desalination 2018, 448, 36–48. [Google Scholar] [CrossRef]
- Zhang, F.; Xu, S.; Feng, D.; Chen, S.; Du, R.; Su, C.; Shen, B. A low-temperature multi-effect desalination system powered by the cooling water of a diesel engine. Desalination 2017, 404, 112–120. [Google Scholar] [CrossRef]
- Baig, H.; Antar, M.A.; Zubair, S.M. Performance evaluation of a once-through multi-stage flash distillation system: Impact of brine heater fouling. Energy Convers. Manag. 2011, 52, 1414–1425. [Google Scholar] [CrossRef]
- Hanshik, C.; Jeong, H.; Jeong, K.-W.; Choi, S.-H. Improved productivity of the MSF (multi-stage flashing) desalination plant by increasing the TBT (top brine temperature). Energy 2016, 107, 683–692. [Google Scholar] [CrossRef]
- Silver, R.S. An assessment of multiple effect boiling distillation in relation to multi-stage flash distillation. Desalination 1971, 9, 235–243. [Google Scholar] [CrossRef]
- Hermosillo, J.J.; Arancibia-Bulnes, C.A.; Estrada, C.A. Water desalination by air humidification: Mathematical model and ex-perimental study. Sol. Energy 2012, 86, 1070–1076. [Google Scholar] [CrossRef]
- Kabeel, A.; El-Said, E.M. A hybrid solar desalination system of air humidification, dehumidification and water flashing evaporation: Part II. Experimental investigation. Desalination 2014, 341, 50–60. [Google Scholar] [CrossRef]
- Sharshir, S.; Peng, G.; Yang, N.; El-Samadony, M.; Kabeel, A. A continuous desalination system using humidification—dehumidification and a solar still with an evacuated solar water heater. Appl. Therm. Eng. 2016, 104, 734–742. [Google Scholar] [CrossRef]
- Li, G.-P.; Zhang, L.-Z. Investigation of a solar energy driven and hollow fiber membrane-based humidification–dehumidification desalination system. Appl. Energy 2016, 177, 393–408. [Google Scholar] [CrossRef]
- Yuan, G.; Wang, Z.; Li, H.; Li, X. Experimental study of a solar desalination system based on humidification–dehumidification pro-cess. Desalination 2011, 277, 92–98. [Google Scholar] [CrossRef]
- Shatat, M.; Omer, S.; Gillott, M.; Riffat, S. Theoretical simulation of small scale psychometric solar water desalination system in semi-arid region. Appl. Therm. Eng. 2013, 59, 232–242. [Google Scholar] [CrossRef]
- Tabrizi, F.F.; Khosravi, M.; Sani, I.S. Experimental study of a cascade solar still coupled with a humidification–dehumidification system. Energy Convers. Manag. 2016, 115, 80–88. [Google Scholar] [CrossRef]
- Perret, J.S.; Sablani, S.S.; Sciences, M. Humidification-dehumidification system in a greenhouse for sustainable crop production. In Proceedings of the Ninth International Water Technology Conference, IWTC9 2005, Sharm El-Sheikh, Egypt, March 2005; pp. 849–862. Available online: https://0-scholar-google-com.brum.beds.ac.uk/scholar?hl=en&as_sdt=0%2C5&q=Humidification-dehumidification+system+in+a+greenhouse+for+sustainable+crop+production&btnG= (accessed on 12 June 2021).
- Srithar, K.; Rajaseenivasan, T. Performance analysis on a solar bubble column humidification dehumidification desalination system. Process. Saf. Environ. Prot. 2017, 105, 41–50. [Google Scholar] [CrossRef]
- Rajaseenivasan, T.; Srithar, K. An investigation into a laboratory scale bubble column humidification dehumidification desalination system powered by biomass energy. Energy Convers. Manag. 2017, 139, 232–244. [Google Scholar] [CrossRef]
- Gang, W.; Zheng, H.; Kang, H.; Yang, Y.; Cheng, P.; Chang, Z. Experimental investigation of a multi-effect isothermal heat with tandem solar desalination system based on humidification–dehumidification processes. Desalination 2016, 378, 100–107. [Google Scholar] [CrossRef]
- Moumouh, J.; Tahiri, M.; Salouhi, M.; Balli, L. Theoretical and experimental study of a solar desalination unit based on humidification–dehumidification of air. Int. J. Hydrogen Energy 2016, 41, 20818–20822. [Google Scholar] [CrossRef]
- Elminshawy, N.A.S.; Siddiqui, F.R.; Addas, M.F. Experimental and analytical study on productivity augmentation of a novel so-lar humidification-dehumidification (HDH) system. Desalination 2015, 365, 36–45. [Google Scholar] [CrossRef]
- Yamalı, C.; Solmus, I. A solar desalination system using humidification–dehumidification process: Experimental study and comparison with the theoretical results. Desalination 2008, 220, 538–551. [Google Scholar] [CrossRef]
- Mazdon hp200. Evacutaed Tube Solar Energy Collector, Technical Reference & Installation Manual Domestic Hot Water. Available online: https://www.solarthermal.com/ (accessed on 19 April 2021).
- Wilcox, S.M. National Solar Radiation Database 1991–2010 Update: User’s Manual; National Renewable Energy Lab. (NREL): Golden, CO, USA, 2012.
- Mohamed, A.; Ahmed, M.S.; Shahdy, A. Theoretical and experimental study of a seawater desalination system based on humidification-dehumidification technique. Renew. Energy 2020, 152, 823–834. [Google Scholar] [CrossRef]
- Sharqawy, M.H.; Antar, M.A.; Zubair, S.M.; Elbashir, A.M. Optimum thermal design of humidification dehumidification desalination systems. Desalination 2014, 349, 10–21. [Google Scholar] [CrossRef]
- Hamed, M.H.; Kabeel, A.; Omara, Z.; Sharshir, S. Mathematical and experimental investigation of a solar humidification–dehumidification desalination unit. Desalination 2015, 358, 9–17. [Google Scholar] [CrossRef]
- Bakthavatchalam, B.; Rajasekar, K.; Habib, K.; Saidur, R.; Basrawi, F. Numerical analysis of humidification dehumidification de-salination system. Evergreen 2019, 6, 9–17. [Google Scholar] [CrossRef]
- Al-Sahali, M.; Ettouney, H.M. Humidification dehumidification desalination process: Design and performance evaluation. Chem. Eng. J. 2008, 143, 257–264. [Google Scholar] [CrossRef]
Figure 1.
Overall schematic of the design.

Figure 2.
Overall system labelled with key modelling parameters.

Figure 3.
Process steps for the dynamic model.

Figure 4.
Overall system labeled with key modeling parameters.

Figure 5.
Calculated useful solar heat and feed water temperature in the storage tank.

Figure 6.
(a) Profiles of temperature in the storage tank and feed water for a useful heat of 15 kW. (b) Profiles of temperature in the storage tank and variation of production masses for a useful heat of 14.3 kW.
Figure 6.
(a) Profiles of temperature in the storage tank and feed water for a useful heat of 15 kW. (b) Profiles of temperature in the storage tank and variation of production masses for a useful heat of 14.3 kW.

Figure 7.
Average change of feed water, useful heat, and production.

Figure 8.
Effect of the feed water flow rate on the distillate production, Qu = 15 kW.

Figure 9.
Effect of air mass flow rate on the freshwater productivity of the system.

Figure 10.
Effect of feed water flow rate on productivity and GOR of the HDH system.

Figure 11.
Effect of feed water temperature entering to the humidifier on productivity and GOR.

Figure 12.
Effect of mass feed flow rate on recovery ratio.


Table 1.
Comparison to existing literature.
| Parameter (Unit) | [39] | [40] | [41] | [23] | This Study |
|---|---|---|---|---|---|
| Classification | OWCA | OWCA | OWCA | OWCA | |
| Type of flow | CF | CF | CRF | CRF | CRF |
| Air mass flow rate (kg/s) | 0.0135 | 0.044 | 0.016–0.02 | 0.04–0.043 | 0.003–0.02 |
| Feed water mass flow rate (kg/s) | 0.0607 | 0.089 | 0.0333 | 0.012–0.02 | 0.001–0.02 |
| Freshwater (kg/h) | 0.76–4.9 | 10 | 5.5 | 0.77–1.45 | 0.05–1.8 |
| Humidifier inlet water temp. (°C) | 40–70 | 50–70 | 43–87 | 45–69 | 32–90 |
| Gain output ratio GOR | 0.35–0.55 | 1.93 | 1.8–2.2 | 0.91 | 0.03–1.9 |
Table 2.
Model parameters used for a simulation case study for Las Vegas USA.
| Parameters | Values |
|---|---|
| Inlet sea water temperature | 30 °C |
| Solar Collector Area | 2 |
| 0.84 | |
| 2.02 | |
| 0.0046 | |
| 32–90 °C | |
| Tank Volume | 1 |
| 0.15 |
Publisher’s Note: MDPI stays neutral with regard to jurisdictional claims in published maps and institutional affiliations. |
© 2021 by the author. Licensee MDPI, Basel, Switzerland. This article is an open access article distributed under the terms and conditions of the Creative Commons Attribution (CC BY) license (https://creativecommons.org/licenses/by/4.0/).
Share and Cite
MDPI and ACS Style
Alsehli, M. A New Approach to Solar Desalination Using a Humidification–Dehumidification Process for Remote Areas. Processes 2021, 9, 1120. https://0-doi-org.brum.beds.ac.uk/10.3390/pr9071120
AMA Style
Alsehli M. A New Approach to Solar Desalination Using a Humidification–Dehumidification Process for Remote Areas. Processes. 2021; 9(7):1120. https://0-doi-org.brum.beds.ac.uk/10.3390/pr9071120
Chicago/Turabian StyleAlsehli, Mishal. 2021. "A New Approach to Solar Desalination Using a Humidification–Dehumidification Process for Remote Areas" Processes 9, no. 7: 1120. https://0-doi-org.brum.beds.ac.uk/10.3390/pr9071120
Note that from the first issue of 2016, this journal uses article numbers instead of page numbers. See further details here.