

The Effect of Clarithromycin Toxicity on the Growth of Bacterial Communities in Agricultural Soils

 and
and 
Abstract
:1. Introduction
2. Materials and Methods
2.1. Chemicals and Soil Samples Used
2.2. Experimental Design
2.3. Estimation of Bacterial Community Growth
2.4. Data Analysis
2.5. Statistics
3. Results
3.1. General Characteristics of Soils
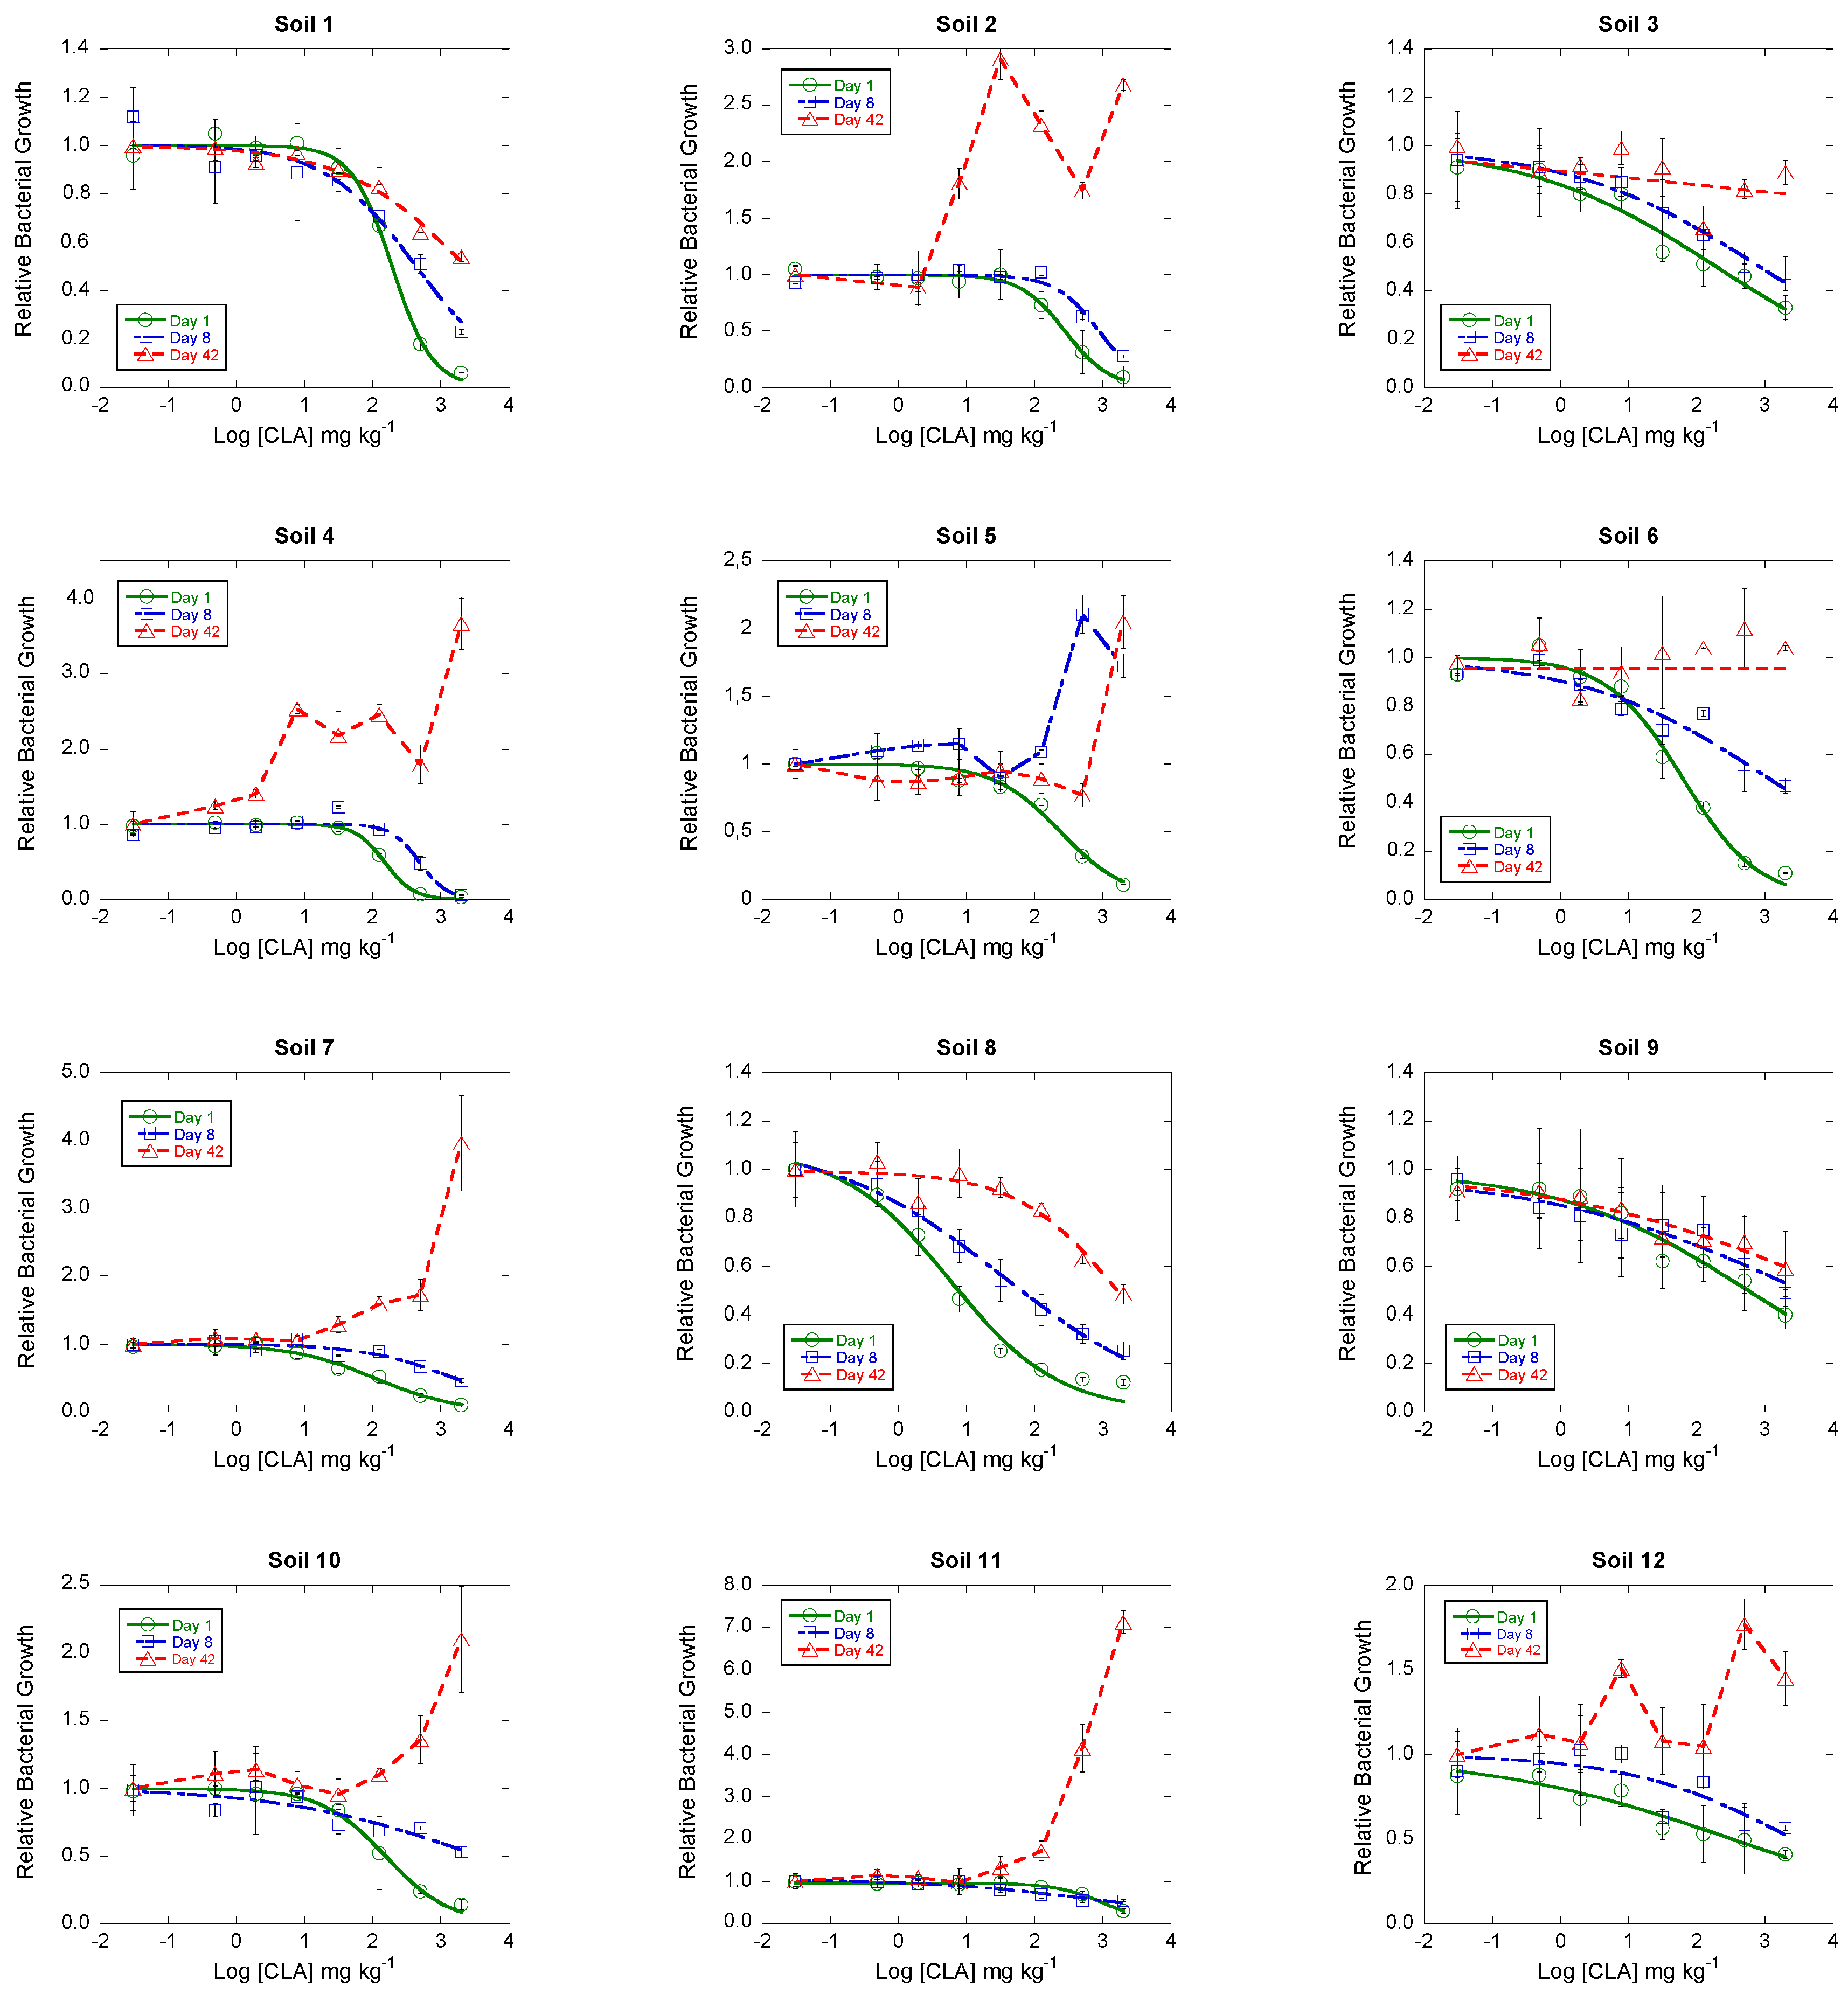
3.2. Toxicity of Clarithromycin on the Growth of Soil Bacterial Communities
3.3. Effect of Soil Characteristics on Clarithromycin Toxicity
4. Discussion
5. Conclusions
Author Contributions
Funding
Conflicts of Interest
References
- Kosjek, T.; Heath, E.; Krbavčič, A. Determination of non-steroidal anti-inflammatory drug (NSAIDs) residues in water samples. Environ. Int. 2005, 31, 679–685. [Google Scholar] [CrossRef]
- Kümmerer, K. Antibiotics in the aquatic environment—A review—Part I. Chemosphere 2009, 75, 417–434. [Google Scholar] [CrossRef]
- Hirsch, R.; Ternes, T.A.; Haberer, K.; Mehlich, A.; Ballwanz, F.; Kratz, K.L. Determination of antibiotics in different water compartments via liquid chromatography–electrospray tandem mass spectrometry. J. Chromatogr. A 1998, 815, 213–223. [Google Scholar] [CrossRef]
- Lienert, J.; Güdel, K.; Escher, B.I. Screening method for ecotoxicological hazard assessment of 42 pharmaceuticals considering human metabolism and excretory routes. Environ. Sci. Technol. 2007, 41, 4471–4478. [Google Scholar] [CrossRef] [PubMed]
- Ternes, T.A.; Meisenheimer, M.; McDowell, D.; Sacher, F.; Brauch, H.J.; Haist-Gulde, B.; Preuss, G.; Wilme, U.; Zulei-Seibert, N. Removal of pharmaceuticals during drinking water treatment. Environ. Sci. Technol. 2002, 36, 3855–3863. [Google Scholar] [CrossRef] [PubMed]
- Ternes, T.A.; Stüber, J.; Herrmann, N.; McDowell, D.; Ried, A.; Kampmann, M.; Teiser, B. Ozonation: A tool for removal of pharmaceuticals, contrast media and musk fragrances from wastewater? Water Res. 2003, 37, 1976–1982. [Google Scholar] [CrossRef]
- Petrović, M.; Gonzalez, S.; Barceló, D. Analysis and removal of emerging contaminants in wastewater and drinking water. TrAC Trends Anal. Chem. 2003, 22, 685–696. [Google Scholar] [CrossRef] [Green Version]
- Berset, J.D.; Kupper, T.; Etter, R.; Tarradellas, J. Consideration about the enantioselectivity transformation of polycyclic musks in wastewater, treated wastewater, and sewage sludge and analysis of their fate in a sequencing batch reactor plant. Chemosphere 2004, 57, 987–996. [Google Scholar] [CrossRef]
- Díaz-Cruz, M.S.; García-Galán, M.J.; Guerra, P.; Jelic, A.; Postigo, C.; Eljarrat, E.; Farré, M.; López de Alda, M.J.; Petrovic, M.; Barceló, D. Analysis of selected emerging contaminants in sewage sludge. TrAC Anal. Chem. 2009, 28, 1263–1275. [Google Scholar] [CrossRef]
- Carballa, M.; Omil, F.; Lema, J.M.; Llomapt, M.; García-Jares, C.; Rodríguez, I.; Gómez, M.; Termes, T. Behaviour of pharmaceuticals, cosmetics and hormones in a sewage treatment plant. Water Res. 2004, 38, 2918–2926. [Google Scholar] [CrossRef]
- Radjenovíc, E.; Petrovic, M.; Barceló, D. Analysis of pharmaceuticals in wastewater and removal using a membrane bioreactor. Anal. Bioanal. Chem. 2007, 387, 1365–1377. [Google Scholar] [CrossRef] [PubMed] [Green Version]
- Rizzo, L.; Manaia, C.; Merlin, C.; Schwartz, T.; Dagot, C.; Ploy, M.C.; Michael, I.; Fatta-Kassinos, D. Urban wastewater treatment plants as hotspots for antibiotic resistant bacteria and genes spread into the environment: A review. Sci. Total Environ. 2013, 447, 345–360. [Google Scholar] [CrossRef] [Green Version]
- Michael, I.; Rizzo, L.; McArdell, C.S.; Manaia, C.M.; Merlin, C.; Schwartz, T.; Dagot, C.; Fatta-Kassinos, D.J.W.R. Urban wastewater treatment plants as hotspots for the release of antibiotics in the environment: A review. Water Res. 2013, 47, 957–995. [Google Scholar] [CrossRef] [Green Version]
- O’Connor, G.A.; Elliott, H.A.; Basta, N.T.; Bastian, R.K.; Pierzynski, G.M.; Sims, R.C.; Smith, J.E. Sustainable land application: An overview. J. Environ. Qual. 2005, 34, 7–17. [Google Scholar] [CrossRef] [Green Version]
- Weber, J.; Karczewska, A.; Drozd, J.; Licznar, M.; Licznar, S.; Jamroz, E.; Kocowicz, A. Agricultural and ecological aspects of a sandy soil as affected by the application of municipal solid waste composts. Soil Biol. Biochem. 2007, 39, 1294–1302. [Google Scholar] [CrossRef]
- Lindberg, R.H.; Björklund, K.; Rendahl, P.; Johansson, M.I.; Tysklind, M.; Andersson, B.A. Environmental risk assessment of antibiotics in the Swedish environment with emphasis on sewage treatment plants. Water Res. 2007, 41, 613–619. [Google Scholar] [CrossRef]
- Clarke, B.O.; Smith, S.R. Review of ‘emerging’organic contaminants in biosolids and assessment of international research priorities for the agricultural use of biosolids. Environ. Int. 2011, 37, 226–247. [Google Scholar] [CrossRef]
- An, J.; Chen, H.; Wei, S.; Gu, J. Antibiotic contamination in animal manure, soil, and sewage sludge in Shenyang, northeast China. Environ. Earth Sci. 2015, 74, 5077–5086. [Google Scholar] [CrossRef]
- Fijalkowski, K.; Rorat, A.; Grobelak, A.; Kacprzak, M.J. The presence of contaminations in sewage sludge. The current situation. J. Environ. Manag. 2017, 203, 1126–1136. [Google Scholar] [CrossRef]
- Warman, P.R. The effect of amprolium and aureomycin on the nitrification of poultry manure-amended soil. Soil Sci. Soc. Am. J. 1980, 44, 1333–1334. [Google Scholar] [CrossRef]
- Baguer, A.J.; Jensen, J.; Krogh, P.H. Effects of the antibiotics oxytetracycline and tylosin on soil fauna. Chemosphere 2000, 40, 751–757. [Google Scholar] [CrossRef]
- Zielezny, Y.; Groeneweg, J.; Vereecken, H.; Tappe, W. Impact of sulfadiazine and chlorotetracycline on soil bacterial community structure and respiratory activity. Soil Biol. Biochem. 2006, 38, 2372–2380. [Google Scholar] [CrossRef]
- Reichel, R.; Michelini, L.; Ghisi, R.; Thiele-Bruhn, S. Soil bacterial community response to sulfadiazine in the soil–root zone. J. Plant Nutr. Soil Sci. 2015, 178, 499–506. [Google Scholar] [CrossRef]
- Cycoń, M.; Mrozik, A.; Piotrowska-Seget, Z. Antibiotics in the soil environment—degradation and their impact on microbial activity and diversity. Front. Microbiol. 2019, 10, 338. [Google Scholar] [CrossRef]
- Kotzerke, A.; Sharma, S.; Schauss, K.; Heuer, H.; Thiele-Bruhn, S.; Smalla, K.; Wilke, B.M.; Schloter, M. Alterations in soil microbial activity and N-transformation processes due to sulfadiazine loads in pig-manure. Environ. Pollut. 2008, 153, 315–322. [Google Scholar] [CrossRef]
- Brandt, K.K.; Sjøholm, O.R.; Krogh, K.A.; Halling-Sørensen, B.; Nybroe, O. Increased pollution-induced bacterial community tolerance to sulfadiazine in soil hotspots amended with artificial root exudates. Environ. Sci. Technol. 2009, 43, 2963–2968. [Google Scholar] [CrossRef]
- Liu, F.; Ying, G.G.; Tao, R.; Zhao, J.L.; Yang, J.F.; Zhao, L.F. Effects of six selected antibiotics on plant growth and soil microbial and enzymatic activities. Environ. Pollut. 2009, 157, 1636–1642. [Google Scholar] [CrossRef]
- Unger, I.M.; Goyne, K.W.; Kennedy, A.C.; Kremer, R.J.; McLain, J.E.; Williams, C.F. Antibiotic effects on microbial community characteristics in soils under conservation management practices. Soil Sci. Soc. Am. J. 2013, 77, 100–112. [Google Scholar] [CrossRef]
- Ma, J.; Lin, H.; Sun, W.; Wang, Q.; Yu, Q.; Zhao, Y.; Fu, J. Soil microbial systems respond differentially to tetracycline, sulfamonomethoxine, and ciprofloxacin entering soil under pot experimental conditions alone and in combination. Environ. Sci. Pollut. Res. 2014, 21, 7436–7448. [Google Scholar] [CrossRef] [PubMed]
- Molaei, A.; Lakzian, A.; Datta, R.; Haghnia, G.; Astaraei, A.; Rasouli-Sadaghiani, M.; Ceccherini, M.T. Impact of chlortetracycline and sulfapyridine antibiotics on soil enzyme activities. Int. Agrophys. 2017, 31, 499. [Google Scholar] [CrossRef] [Green Version]
- Santás-Miguel, V.; Arias-Estévez, M.; Díaz-Raviña, M.; Fernández-Sanjurjo, M.J.; Álvarez-Rodríguez, E.; Núñez-Delgado, A.; Fernández-Calviño, D. Interactions between soil properties and tetracycline toxicity affecting to bacterial community growth in agricultural soil. Appl. Soil Ecol. 2020, 147, 103437. [Google Scholar] [CrossRef]
- Santás-Miguel, V.; Arias-Estévez, M.; Díaz-Raviña, M.; Fernández-Sanjurjo, M.J.; Álvarez-Rodríguez, E.; Núñez-Delgado, A.; Fernández-Calviño, D. Effect of oxytetracycline and chlortetracycline on bacterial community growth in agricultural soils. Agronomy 2020, 10, 1011. [Google Scholar] [CrossRef]
- Calvet, R. Adsorption of organic chemicals in soils. Environ. Health Perspect. 1989, 83, 145–177. [Google Scholar] [CrossRef] [PubMed]
- European Centre for Disease Prevention and Control (ECDC). Surveillance Report. In Annual Epidemiological Report for 2016; Antimicrobial Consumption; ECDC: Solna Municipality, Sweden, 2018. [Google Scholar]
- World Health Organization. Critically Important Antimicrobials for Human Medicine 5th Revision 2016. In Ranking of Medically Important Antimicrobials for Risk Management of Antimicrobial Resistance due to Non-Human Use Bull; World Health Organization: Geneva, Switzerland, 2017. [Google Scholar]
- Kümmerer, K.; Henninger, A. Promoting resistance by the emission of antibiotics from hospitals and households into effluent. Clin. Microbiol. Infect. 2003, 9, 1203–1214. [Google Scholar] [CrossRef] [Green Version]
- Peters, D.H.; Clissold, S.P. Clarithromycin. Drugs 1992, 44, 117–164. [Google Scholar] [CrossRef]
- Alenzi, A.; Hunter, C.; Spencer, J.; Roberts, J.; Craft, J.; Pahl, O.; Escudero, A. Pharmaceuticals effect and removal, at environmentally relevant concentrations, from sewage sludge during anaerobic digestion. Bioresour. Technol. 2020, 319, 124102. [Google Scholar] [CrossRef] [PubMed]
- Huang, X.; Liu, X.; Chen, F.; Wang, Y.; Li, X.; Wang, D.; Tao, Z.; Xu, D.; Xue, W.; Geng, M.; et al. Clarithromycin affect methane production from anaerobic digestion of waste activated sludge. J. Clean. Prod. 2020, 255, 120321. [Google Scholar] [CrossRef]
- Tiwari, B.; Sellamuthu, B.; Piché-Choquette, S.; Drogui, P.; Tyagi, R.D.; Buelna, G.; Vaudreuil, M.A.; Sauvé, S.; Dude, R.; Surampalli, R.Y. Compositional Microbial-Community Shift of Submerged Membrane Bioreactor Treating Hospital Wastewater at Varying Temperatures. J. Environ. Eng. ASCE 2021, 147, 04020152. [Google Scholar] [CrossRef]
- Tan, K.H. Soil Sampling, Preparation, and Analysis; CRC Press: Boca Raton, FL, USA, 1996. [Google Scholar]
- Sumner, M.E.; Miller, W.P. Methods of Soil Analysis Part 3. Chemical Methods; Soil Science Society of America Inc.: Madison, WI, USA, 1996; pp. 65–94. [Google Scholar]
- Bertsch, P.M.; Bloom, P.R. Aluminum. Methods Soil Anal. Part 3 Chem. Methods 1996, 5, 517–550. [Google Scholar]
- Blakemore, L.C. Exchange Complex Dominated by Amorphous Material (ECDAM). In The Andisol Proposal; Smith, G.D., Ed.; Soil Bureau: Lower Hutt, New Zealand, 1978; Volume 21. [Google Scholar]
- Meisner, A.; Bååth, E.; Rousk, J. Microbial growth responses upon rewetting soil dried for four days or one year. Soil Biol. Biochem. 2013, 66, 188–192. [Google Scholar] [CrossRef]
- Fox, D.R.; Landis, W.G. Don’t be fooled—A no-observed-effect concentration is no substitute for a poor concentration–response experiment. Environ. Toxicol. Chem. 2016, 35, 2141–2148. [Google Scholar] [CrossRef] [Green Version]
- Rousk, J.; Demoling, L.A.; Bahr, A.; Bååth, E. Examining the fungal and bacterial niche overlap using selective inhibitors in soil. FEMS Microbiol. Ecol. 2008, 63, 350–358. [Google Scholar] [CrossRef] [Green Version]
- Rajapaksha, R.M.C.P.; Tobor-Kapłon, M.A.; Bååth, E. Metal toxicity affects fungal and bacterial activities in soil differently. Appl. Environ. Microbiol. 2004, 70, 2966–2973. [Google Scholar] [CrossRef] [Green Version]
- Bååth, E. Thymidine and leucine incorporation in soil bacteria with different cell size. Microb. Ecol. 1994, 27, 267–278. [Google Scholar] [CrossRef]
- Bååth, E.; Pettersson, M.; Söderberg, K.H. Adaptation of a rapid and economical microcentrifugation method to measure thymidine and leucine incorporation by soil bacteria. Soil Biol. Biochem. 2001, 3, 1571–1574. [Google Scholar] [CrossRef]
- Rousk, J.; Demoling, L.A.; Bååth, E. Contrasting short-term antibiotic effects on respiration and bacterial growth compromises the validity of the selective respiratory inhibition technique to distinguish fungi and bacteria. Microb. Ecol. 2009, 58, 75–85. [Google Scholar] [CrossRef]
- Santás-Miguel, V.; Rodríguez-González, L.; Núñez-Delgado, A.; Díaz-Raviña, M.; Arias-Estévez, M.; Fernández-Calviño, D. The toxicity exerted by the antibiotic sulfadiazine on the growth of soil bacterial communities may increase over time. Int. J. Environ. Res. Public Health 2020, 17, 8773. [Google Scholar] [CrossRef] [PubMed]
- Sebaugh, J.L. Guidelines for accurate EC50/IC50 estimation. Pharm. Stat. 2011, 10, 128–134. [Google Scholar] [CrossRef] [PubMed]
- Rousk, K.; Elyaagubi, F.K.; Jones, D.L.; Godbold, D.L. Bacterial salt tolerance is unrelated to soil salinity across an arid agroecosystem salinity gradient. Soil Boil. Biochem. 2011, 43, 1881–1887. [Google Scholar] [CrossRef]
- Rath, K.M.; Maheshwari, A.; Bengtson, P.; Rousk, K. Comparative Toxicities of Salts on Microbial Processes in Soil. Appl. Environ. Microbiol. 2016, 82, 2012–2020. [Google Scholar] [CrossRef] [Green Version]
- Fernández-Calviño, D.; Bååth, E. Interaction between pH and Cu toxicity on fungal and bacterial performance in soil. Soil Biol. Biochem. 2016, 96, 20–29. [Google Scholar] [CrossRef]
- Fernández-Calviño, D.; Rousk, J.; Bååth, E.; Bollmann, U.E.; Bester, K.; Brandt, K.K. Ecotoxicological assessment of propiconazole using soil bacterial and fungal growth assays. Appl. Soil Ecol. 2017, 115, 27–30. [Google Scholar] [CrossRef]
- Fernández-Calviño, D.; Rousk, J.; Bååth, E.; Bollmann, U.E.; Bester, K.; Brandt, K.K. Short-term toxicity assessment of a triazine herbicide (terbutryn) underestimates the sensitivity of soil microorganisms. Soil Biol. Biochem. 2021, 154, 108130. [Google Scholar] [CrossRef]
- Kodešová, R.; Grabic, R.; Kočárek, M.; Klement, A.; Golovko, O.; Fér, M.; Nikodem, A.; Jakšík, O. Pharmaceuticals’ sorptions relative to properties of thirteen different soils. Sci. Total Environ. 2015, 511, 435–443. [Google Scholar] [CrossRef]
- Loibner, A.; Jensen, J.; Ter Laak, T.; Celis, R.; Hartnik, T. Sorption and ageing of soil contamination. Ecol. Risk Assess. Contam. Land Decis. Support Site Specif. Investig. 2006, 2, 19–29. [Google Scholar]
- Demoling, L.A.; Bååth, E.; Greve, G.; Wouterse, M.; Schmitt, H. Effects of sulfamethoxazole on soil microbial communities after adding substrate. Soil Biol. Biochem. 2009, 41, 840–848. [Google Scholar] [CrossRef]
- Cui, H.; Wang, S.P.; Fu, J.; Zhou, Z.Q.; Zhang, N.; Guo, L. Influence of ciprofloxacin on microbial community structure and function in soils. Biol. Fertil. Soils 2014, 50, 939–947. [Google Scholar] [CrossRef]
- Kodešová, R.; Kočárek, M.; Klement, A.; Golovko, O.; Koba, O.; Fér, M.; Nikodem, A.; Vondráčková, L.; Jakšíka, O.; Grabic, R. An analysis of the dissipation of pharmaceuticals under thirteen different soil conditions. Sci. Total Environ. 2016, 544, 369–381. [Google Scholar] [CrossRef] [PubMed]
- Chenxi, W.; Spongberg, A.L.; Witter, J.D. Determination of the persistence of pharmaceuticals in biosolids using liquid-chromatography tandem mass spectrometry. Chemosphere 2008, 73, 511–518. [Google Scholar] [CrossRef]
- Rodríguez-Rodríguez, C.E.; Jelić, A.; Llorca, M.; Farré, M.; Caminal, G.; Petrović, M.; Barceló, D.; Vicent, T. Solid-phase treatment with the fungus Trametes versicolor substantially reduces pharmaceutical concentrations and toxicity from sewage sludge. Bioresour. Technol. 2011, 102, 5602–5608. [Google Scholar] [CrossRef] [PubMed]
- Buchicchio, A.; Bianco, G.; Sofo, A.; Masi, S.; Caniani, D. Biodegradation of carbamazepine and clarithromycin by Trichoderma harzianum and Pleurotus ostreatus investigated by liquid chromatography–high-resolution tandem mass spectrometry (FTICR MS-IRMPD). Sci. Total Environ. 2016, 557, 733–739. [Google Scholar] [CrossRef]
- Topp, E.; Renaud, J.; Sumarah, M.; Sabourin, L. Reduced persistence of the macrolide antibiotics erythromycin, clarithromycin and azithromycin in agricultural soil following several years of exposure in the field. Sci. Total Environ. 2016, 562, 136–144. [Google Scholar] [CrossRef]
- Blanck, H. A critical review of procedures and approaches used for assessing pollution-induced community tolerance (PICT) in biotic communities. Hum. Ecol. Risk Assess. 2002, 8, 1003–1034. [Google Scholar] [CrossRef]
- Rutgersson, C.; Ebmeyer, S.; Lassen, S.B.; Karkman, A.; Fick, J.; Kristiansson, E.; Brandt, K.K.; Flach, C.F.; Larsson, D.J. Long-term application of Swedish sewage sludge on farmland does not cause clear changes in the soil bacterial resistome. Environ. Int. 2020, 137, 105339. [Google Scholar] [CrossRef] [PubMed]
- Lau, C.H.F.; Tien, Y.C.; Stedtfeld, R.D.; Topp, E. Impacts of multi-year field exposure of agricultural soil to macrolide antibiotics on the abundance of antibiotic resistance genes and selected mobile genetic elements. Sci. Total Environ. 2020, 727, 138520. [Google Scholar] [CrossRef]
- Abd-El-Malek, Y.; Monib, M.; Hazem, A. Chloramphenicol, a simultaneous carbon and nitrogen source for a Streptomyes sp. from Egyptian soil. Nature 1961, 189, 775–776. [Google Scholar] [CrossRef] [PubMed]
- Kameda, Y.; Kimura, Y.; Toyoura, E.; Omori, T. A method for isolating bacteria capable of producing 6-aminopenicillanic acid from benzylpenicillin. Nature 1961, 191, 1122–1123. [Google Scholar] [CrossRef]
- Schofield, C.J. Antibiotics as food for bacteria. Nat. Microbiol. 2018, 3, 752–753. [Google Scholar] [CrossRef]
- Aldén, L.; Demoling, F.; Bååth, E. Rapid method of determining factors limiting bacterial growth in soil. Appl. Environ. Micribiol. 2001, 67, 1830–1838. [Google Scholar] [CrossRef] [PubMed] [Green Version]
- Reischke, S.; Rousk, J.; Bååth, E. The effects of glucose loading rates on bacterial and fungal growth in soil. Soil Biol. Biochem. 2014, 70, 88–95. [Google Scholar] [CrossRef]
- Sibley, S.D.; Pedersen, J.A. Interaction of the macrolide antimicrobial clarithromycin with dissolved humic acid. Environ. Sci. Technol. 2008, 42, 422–428. [Google Scholar] [CrossRef]
- Fernández-Calviño, D.; Bermúdez-Couso, A.; Garrido-Rodríguez, B.; Rodríguez, S.P.; Arias-Estévez, M. Copper release kinetics from a long-term contaminated acid soil using a stirred flow chamber: Effect of ionic strength and pH. J. Colloid Interface Sci. 2012, 367, 422–428. [Google Scholar] [CrossRef]
- Wegst-Uhrich, S.R.; Navarro, D.A.; Zimmerman, L.; Aga, D.S. Assessing antibiotic sorption in soil: A literature review and new case studies on sulfonamides and macrolides. Chem. Cent. J. 2014, 8, 1–12. [Google Scholar] [CrossRef] [PubMed] [Green Version]
- Christl, I.; Ruiz, M.; Schmidt, J.R.; Pedersen, J.A. Clarithromycin and tetracycline binding to soil humic acid in the absence and presence of calcium. Environ. Sci. Technol. 2016, 50, 9933–9942. [Google Scholar] [CrossRef] [PubMed] [Green Version]
- Yi, X.; Lin, C.; Ong, E.J.L.; Wang, M.; Zhou, Z. Occurrence and distribution of trace levels of antibiotics in surface waters and soils driven by non-point source pollution and anthropogenic pressure. Chemosphere. 2019, 216, 213–223. [Google Scholar] [CrossRef] [PubMed]


| Soil | pHW | pHKCl | C (%) | N (%) | eCEC (cmolc kg−1) | DOC (mg kg−1) | Sand (%) | Silt (%) | Clay (%) | Feo (g kg−1) | Alo (g kg−1) |
|---|---|---|---|---|---|---|---|---|---|---|---|
| 1 | 5.6 ± 0.0 | 4.2 ± 0.1 | 0.6 ± 0.2 | 0.1 ± 0.0 | 6.0 ± 0.2 | 120.9 ± 10 | 61 ± 5 | 25 ± 1 | 13 ± 0 | 1.3 ± 0.1 | 0.7 ± 0.0 |
| 2 | 5.6 ± 0.1 | 4.9 ± 0.1 | 3.7 ± 0.0 | 0.3 ± 0.2 | 19.5 ± 0.4 | 263.3 ± 15 | 69 ± 4 | 17 ± 1 | 14 ± 1 | 3.5 ± 0.1 | 5.8 ± 0.2 |
| 3 | 5.6 ± 0.2 | 4.8 ± 0.1 | 1.6 ± 0.1 | 0.2 ± 0.1 | 6.0 ± 0.0 | 243.1 ± 13 | 44 ± 3 | 34 ± 2 | 23 ± 1 | 2.2 ± 0.0 | 1.0 ± 0.0 |
| 4 | 6.1 ± 0.2 | 5.3 ± 0.2 | 2.8 ± 0.1 | 0.2 ± 0.1 | 37.2 ± 1.3 | 265.0 ± 19 | 61 ± 5 | 21 ± 1 | 18 ± 1 | 3.6 ± 0.2 | 4.4 ± 0.1 |
| 5 | 5.7 ± 0.0 | 4.9 ± 0.0 | 4.8 ± 0.2 | 0.4 ± 0.1 | 17.4 ± 0.9 | 332.9 ± 24 | 58 ± 4 | 20 ± 1 | 21 ± 2 | 2.8 ± 0.2 | 5.3 ± 0.3 |
| 6 | 5.5 ± 0.2 | 4.2 ± 0.2 | 6.6 ± 0.2 | 0.5 ± 0.3 | 10.5 ± 0.4 | 350.6 ± 16 | 66 ± 4 | 13 ± 1 | 21 ± 1 | 5.5 ± 0.1 | 3.1 ± 0.1 |
| 7 | 4.8 ± 0.1 | 4.4 ± 0.1 | 3.1 ± 0.0 | 0.4 ± 0.3 | 5.2 ± 0.3 | 633.9 ± 47 | 70 ± 5 | 18 ± 1 | 12 ± 0 | 1.8 ± 0.0 | 2.1 ± 0.1 |
| 8 | 4.6 ± 0.1 | 4.2 ± 0.3 | 2.4 ± 0.1 | 0.3 ± 0.1 | 3.2 ± 0.1 | 336.2 ± 28 | 77 ± 4 | 14 ± 1 | 9 ± 0 | 1.6 ± 0.0 | 2.2 ± 0.2 |
| 9 | 4.1 ± 0.1 | 3.7 ± 0.2 | 3.3 ± 0.1 | 0.3 ± 0.0 | 4.3 ± 0.2 | 599.8 ± 39 | 81 ± 7 | 10 ± 0 | 9 ± 0 | 2.3 ± 0.1 | 1.8 ± 0.0 |
| 10 | 5.2 ± 0.2 | 4.7 ± 0.1 | 3.2 ± 0.2 | 0.4 ± 0.2 | 4.1 ± 0.2 | 327.1 ± 25 | 55 ± 2 | 28 ± 2 | 17 ± 1 | 8.9 ± 0.5 | 3.1 ± 0.1 |
| 11 | 5.6 ± 0.3 | 5.1 ± 0.2 | 3.4 ± 0.1 | 0.4 ± 0.1 | 11.2 ± 0.8 | 356.4 ± 23 | 45 ± 2 | 33 ± 2 | 22 ± 1 | 8.1 ± 0.2 | 3.8 ± 0.1 |
| 12 | 5.1 ± 0.0 | 4.5 ± 0.0 | 6.8 ± 0.3 | 0.6 ± 0.3 | 5.5 ± 0.3 | 318.4 ± 21 | 34 ± 2 | 38 ± 3 | 28 ± 2 | 8.9 ± 0.3 | 8.7 ± 0.4 |
| Day 1 | Day 8 | Day 42 | |||||||
|---|---|---|---|---|---|---|---|---|---|
| Soil | Log IC50 ± Error | Log IC10 | R2 | Log IC50 ± Error | Log IC10 | R2 | Log IC50 ± Error | Log IC10 | R2 |
| 1 | 2.29 ± 0.04 | 1.63 | 0.994 | 2.64 ± 0.14 | 1.20 | 0.954 | 3.37 ± 0.10 | 1.43 | 0.976 |
| 2 | 2.45 ± 0.05 | 1.72 | 0.989 | 2.94 ± 0.07 | 2.23 | 0.962 | |||
| 3 | 2.28 ± 0.31 | −0.77 | 0.960 | 2.92 ± 0.17 | −0.17 | 0.976 | |||
| 4 | 2.17 ± 0.02 | 1.70 | 0.998 | 2.68 ± 0.10 | 2.23 | 0.917 | |||
| 5 | 2.37 ± 0.09 | 1.28 | 0.979 | ||||||
| 6 | 1.80 ± 0.10 | 0.58 | 0.984 | 3.07 ± 0.33 | 0.03 | 0.900 | |||
| 7 | 2.02 ± 0.10 | 0.70 | 0.985 | 3.19 ± 0.17 | 1.76 | 0.897 | |||
| 8 | 0.75 ± 0.18 | −0.50 | 0.983 | 1.52 ± 0.17 | −0.28 | 0.993 | 3.22 ± 0.15 | 1.60 | 0.932 |
| 9 | 2.74 ± 0.27 | −0.35 | 0.953 | 3.57 ± 0.51 | −0.89 | 0.894 | 4.12 ± 0.34 | −0.45 | 0.934 |
| 10 | 2.19 ± 0.05 | 1.14 | 0.972 | 3.53 ± 0.45 | 0.47 | 0.804 | |||
| 11 | 3.02 ± 0.04 | 2.07 | 0.989 | 3.09 ± 0.26 | 0.86 | 0.924 | |||
| 12 | 2.52 ± 0.61 | −1.48 | 0.925 | 3.42 ± 0.55 | 0.79 | 0.682 | |||
| Sand | Silt | Clay | C | N | pHW | pHKCl | TOC | CICe | |
|---|---|---|---|---|---|---|---|---|---|
| Log IC50 Day 1 (n = 12) | −0.438 | 0.452 | 0.336 | 0.070 | 0.206 | 0.172 | 0.285 | 0.044 | 0.055 |
| Log IC50 Day 8 (n = 11) | −0.308 | 0.250 | 0.356 | 0.401 | 0.474 | −0.081 | −0.026 | −0.111 | 0.368 |
| Log IC50 Day 42 (n = 3) | −0.672 | 0.600 | 0.832 | 0.059 | 0.045 | 0.286 | 0.564 | 0.524 | 0.813 |
| Log IC10 Day 1 (n = 12) | 0.137 | −0.136 | −0.154 | −0.256 | −0.275 | 0.569 * | 0.501 * | −0.232 | 0.532 * |
| Log IC10 Day 8 (n = 11) | −0.115 | 0.122 | 0.065 | −0.064 | −0.176 | 0.604 ** | 0.640 ** | −0.233 | 0.656 ** |
| Log IC10 Day 42 (n = 3) | −0.596 | 0.651 | 0.434 | −0.708 | −0.608 | 0.705 | 0.997 ** | −0.858 | 0.042 |
Publisher’s Note: MDPI stays neutral with regard to jurisdictional claims in published maps and institutional affiliations. |
© 2021 by the authors. Licensee MDPI, Basel, Switzerland. This article is an open access article distributed under the terms and conditions of the Creative Commons Attribution (CC BY) license (https://creativecommons.org/licenses/by/4.0/).
Share and Cite
Rodríguez-González, L.; Santás-Miguel, V.; Campillo-Cora, C.; Arias-Estévez, M.; Fernández-Calviño, D. The Effect of Clarithromycin Toxicity on the Growth of Bacterial Communities in Agricultural Soils. Processes 2021, 9, 1303. https://0-doi-org.brum.beds.ac.uk/10.3390/pr9081303
Rodríguez-González L, Santás-Miguel V, Campillo-Cora C, Arias-Estévez M, Fernández-Calviño D. The Effect of Clarithromycin Toxicity on the Growth of Bacterial Communities in Agricultural Soils. Processes. 2021; 9(8):1303. https://0-doi-org.brum.beds.ac.uk/10.3390/pr9081303
Chicago/Turabian StyleRodríguez-González, Laura, Vanesa Santás-Miguel, Claudia Campillo-Cora, Manuel Arias-Estévez, and David Fernández-Calviño. 2021. "The Effect of Clarithromycin Toxicity on the Growth of Bacterial Communities in Agricultural Soils" Processes 9, no. 8: 1303. https://0-doi-org.brum.beds.ac.uk/10.3390/pr9081303