Article

Long-Term Cultivation of a Native Arthrospira platensis (Spirulina) Strain in Pozo Izquierdo (Gran Canaria, Spain): Technical Evidence for a Viable Production of Food-Grade Biomass

by
Flavio Guidi
*,
Zivan Gojkovic
,
Marianna Venuleo
,
Patrícia Alexandra Clemente Janeiro Assunçao
and
Eduardo Portillo
Instituto Tecnológico de Canarias (ITC), Playa de Pozo Izquierdo, s/n, Santa Lucía de Tirajana, 35119 Gran Canaria, Spain
*
Author to whom correspondence should be addressed.
Submission received: 28 June 2021 / Revised: 23 July 2021 / Accepted: 26 July 2021 / Published: 30 July 2021
(This article belongs to the Special Issue Extraction, Exploitation and Application of Algae Biomass)

Abstract

:
Microalgae cultivation is a promising alternative to traditional agriculture in arid—semi-arid areas. The aim of this study is to assess the viability of long-term cultivation of native Arthrospira platensis in Gran Canaria. Maximum culture productivity (0.08 g/L/day) and optimal concentration range (0.6–0.9 g/L) were firstly determined in 8000 L raceway under a greenhouse. Afterwards, a stable productivity of 0.06 g/L/day (6.0 g/m2/day) was obtained by reusing the culture medium during 26 days of cultivation, with consistent biomass biochemical composition. Outdoor temperature and daily solar irradiation ranged between 17.9–30.7 °C and 79.2–274.8 W/m2, while culture pH and salinity were in the range 9.42–10.77 and 11.2–14.9 g/L, respectively. Protein (>60%), potassium (1.8 g/100 g) and C-phycocyanin (7.2%) content is in the high-range of commercial Spirulina, which makes BEA 1257B promising for food and extraction of natural pigments/antioxidants. The dried biomass complies with international standards for human consumption, because of low heavy metal content and no pathogens presence. Product quality can be improved by reducing ash (≃12%) and sodium (1.5%) content through biomass washing optimization and/or further dewatering step. Other microorganisms can be prevented by high alkaline conditions and mild chemical treatments. These results pave the way for a sustainable microalgae-based blue bioeconomy in the Canary Islands.

1. Introduction

In a global scenario where Earth’s growing population is predicted to reach nearly 10 billion people by 2050, a 60% increment in the agricultural production demand in the next 30 years is expected [1]. Achieving agricultural sustainability in the coming decades, despite the growing competition for land, clean water and energy, and the changing climate conditions that harm traditional crops and future farming systems is an urgent issue to ensure global food supply [2]. At the same time, the enhancement of extensive agriculture over the last decades has increased output productivities, but has also generated drastic impacts on the environment [3]. This indicates the need to develop new agricultural strategies which support high biomass productivities while concomitantly mitigating environmental effects or even support environmental restoration [3], according to the concept of ecological sustainability in relation to business development [4].
Extensive mass cultures of microalgae are considered as the most promising alternative strategy to traditional agriculture for the production of foods, feeds, bio-fertilizers, bio-stimulants and biofuels, among other products. Outdoor microalgal cultures can be set up in marginal non-arable land, and low-cost, large-available water sources (i.e., seawater, brackish water, wastewater from other agricultural/industrial processes) can be used for their growth. Additionally, CO2 from flue gas can be used as carbon source in the cultivation process [5,6].
Mesophilic, alkaliphilic cyanobacteria of the genus Arthrospira, commonly known as Spirulina, are by far the most cultivated photosynthetic microorganisms globally, with a worldwide production exceeding 10,000 tons of dry biomass annually [7,8,9]. The edible species Arthrospira platensis has been certified as a “Generally Recognized as Safe” (GRAS) supplement by the United States Food and Drug Administration Agency (FDA). Actually, A. platensis represents one of only two microalgae (the other being Chlorella vulgaris) approved for human consumption by the European Union in unprocessed form to date, being already consumed to a significant degree before 15 May 1997 (EU 2015/2283) [10]. A. platensis is mainly used for human food, as an ingredient of healthy and dietary products, as animal feed in aquaculture, and as a source of natural colorants (i.e., blue pigment phycocyanin) and fine chemicals [11]. Recently, Spirulina cultivated in wastewater from a municipal plant has been used as source of biofuel, with promising results both in terms of ammonia and nitrate removal, and performances of the obtained biodiesel [6]. A. platensis biomass is rich in high quality protein (50–70% in dry weight), essential amino and fatty acids, vitamins, and dietary minerals. It also contains large amounts of antioxidant compounds (e.g., phenolics, flavonoids, vitamin E) and photosynthetic pigments such as phycocianin, chlorophylls and carotenoids, with potential therapeutic effects [12,13].
The most common photobioreactor systems used for A. platensis culturing are open ponds of 10 to 1000 m3 culture volume [14,15]. Open ponds are used because of their basic characteristics: simple design and ease to build and operate, low capital investment and operational costs [16,17]. The main downsides of open pond design in microalgal cultures are the high risk of biological contamination (e.g., protozoans and other microalgae, pathogen bacteria), the high possibility of chemical contamination (e.g., dust, heavy metals, pesticides), and the large volumes for harvesting by centrifugation [16,18]. However, these issues are not so pronounced in A. platensis production due to its unique ecophysiological characteristics. In fact, high alkalinity and pH of the culture medium prevent flourishment of protozoans and other phototroph (e.g., Chlorella spp., [15,19]), and excessive growth of mesophilic bacteria on cell debris [18,19]. Additionally, the large cellular size of filamentous A. platensis is less subjected to grazing by common biological contaminants of microalgal cultures [9], and allows A. platensis to be easily harvested by the energy-saving processes of filtration [17,20]. This liquid–solid separation of the A. platensis biomass from the culture medium can be implemented through single or multiple filtration steps or through a two-phase process where the natural flotation of the biomass is first allowed before the filtration [14,17]. The possible occurrence of chemical contamination of the cultures with dust particles and pesticides, due to open ponds large surface directly exposed to the atmosphere, is largely limited by placing the raceways in a greenhouse. This also repels insects and other small animals, protects cultures from rainfall and permits the seasonal production of this tropical cyanobacterium to be extended in subtropical to temperate areas, by maintaining suitable temperatures for its growth [21,22,23]. Many small to large sized plants (up to 10 ha) cultivate high-quality, food-grade A. platensis inside greenhouses, with low production costs and substantially enhanced quality of the product in terms of stable biochemical composition and low microbial contamination [21,22,23].
Previous studies reported A. platensis productivities ranging from 10–13 t/ha/year in Inner Mongolia and China [22,24] to more than 90 t/ha/year in Australia [17], with year-round, large-scale productivities of 30–32 t/ha/year in Southern Spain [25]. Because of the importance of light availability, Arthrospira production is commonly managed at a culture depth of 0.15–0.30 m. Apart from geographical variables such as regional temperature and solar availability, other factors such as culture medium composition may also affect productivities [9,26].
Vast regions of the Canary Islands archipelago (Spain) are arid or semi-arid areas characterized by non-arable volcanic land and average annual precipitation below 100 mm [27]. The land features and the freshwater deficit strongly limit the establishment or the flourishment of traditional agriculture crops in these areas. In fact, water for human consumption, agricultural and industrial use is mainly provided by seawater desalination plants based on reverse-osmosis membrane technology, with energy consumption closer to 3.5 KWh/m3 for cubic meter of produced desalinated water in 2008 [28]. On the other hand, with average daily solar irradiations around 250 W/m2 (21.6 MJ/m2/day), microalgal productivities of nearly 200 ton/ha/year at the maximum theoretical 5% photosynthetic efficiency can be predicted in this subtropical European area [29]. Nevertheless, to the best of our knowledge, the feasibility of A. platensis cultivation for food purposes has not been previously investigated. Additionally, the environmental policies for preserving the local biodiversity in Canary Islands facilitate the cultivation activity of autochthones with respect to imported microorganisms, which require a careful bioprospection effort of new locally isolated microalgal strains and the evaluation of their biotechnological potential in pilot to semi-industrial scale systems prior to extensive production.
Our research hypothesis was that the viability and stability of open-pond, long-term cultivation of the native A. platensis strain BEA 1257B in the subtropical and semi-desertic area of Pozo Izquierdo (Gran Canaria Island, Spain) for the production of food-grade biomass is achievable. To test this hypothesis, we firstly cultivated semi-continuously A. platensis BEA 1257B for one month in a 8000 L raceway under greenhouse conditions while increasing culture concentration harvesting setpoints, in order to establish maximum culture productivity. Afterwards, we maintained the culture in the same raceway at the optimal culture concentration range determined in the previous phase for another month, while reusing the culture medium. Experiments were performed continuously from September to November 2019. To the best of our knowledge, this is the first study addressing long-term cultivation of a native A. platensis in open ponds in the Canary Islands. Moreover, this is the first native European strain of this cyanobacterium that was successfully scaled-up and produced in long-term semi-continuous culture. Our results suggest that year-round stable production of native A. platensis BEA 1257B in open ponds by recycling the culture medium is feasible, with valuable productivity (21.9 t/ha/year of dry biomass), consistent high quality and reproducibility of the biomass, and significant reduction of the water demand. The occasional appearance of the green alga Chlorella sorokiniana at a certain stage of the culture has been successfully eradicated with mild chemical treatments. While deep financial analysis, that is required to finally determine the techno-economic feasibility of the whole process chain, is beyond the goal of this study, these findings validate our research hypothesis and are expected to make a significant contribution toward the diversification and growth of microalgae production sector in the Canary Islands.

2. Materials and Methods

2.1. Strain Isolation and Maintenance

Arthrospira platensis strain BEA 1257B was isolated by the Spanish Bank of Algae (BEA, Telde, Gran Canaria, Spain) from natural water samples collected at the reservoir of Los Molinos, Dam-Betancuria Rural Park, Fuerteventura (Spain, 28°30′26″ N, 14°01′47″ W) in June 2014. The site is characterized by shallow, brackish water and is a place of rest for many varieties of migratory bird, which actually could have been the vector for the cyanobacterium diffusion from the African continent in the past [30]. Morphological analysis through optical microscopy and 16S gene sequencing (GenBank MT426015) confirmed the species identity. The strain, which naturally occurs in both linear and spiral forms of trichome, was maintained in liquid cultures using Spirulina medium [31,32] with few modifications (Table 1) under temperatures of 25 ± 1 °C, 16:8 h light:dark photoperiod and cool white light at photosynthetic photon flux density (PPFD) of 50 µmol photons m−2 s−1. At the Canarian Institute of Technology (ITC), the strain was transferred and acclimated from its replete maintenance medium to a simpler, cheapest medium internally developed named OUT medium (Table 1), which allowed for cost reduction of 46% on the chemicals per liter of culture medium. Cultures for the indoor scaling-up in the cultivation chamber were aseptically grown under temperature of 25 ± 1 °C, continuous cool white light at PPFD of 300 µmol photons m−2 s−1, and agitation with bubbled air supplemented with 1% CO2 before outdoor scaling-up.

2.2. Outdoor Cultivation and Biomass Processing

2.2.1. Description of the Cultivation Site

The trials were carried out during the end of summer/autumn 2019 (12 September to 11 November) at the ITC facilities located in Pozo Izquierdo, Gran Canaria (Spain, 27°48′52″ N, 15°25′25″ W). The semi-desertic area is characterized by a subtropical climate with year-round sunny conditions, >10 h day length, warm temperatures (range daily average temperatures: 18–25 °C) and limited rainfall (average annual precipitation: <100 mm). Dominant wind is from NNE direction, blowing at the peak intensities during the summer months (range of monthly average at 60 m height for year 2019: 6.3 ± 3.6 m/s in January and 14.5 ± 2.7 m/s in July). Moreover, the southeast wind named Calima can occasionally lead to high concentrations of dust particles in the atmosphere.
Outdoor cultivation was performed in culture systems (photobioreactors, PBRs and raceways, RWs) located inside a 1500 m2 greenhouse made with high-transparent corrugated polycarbonate (Suntuf® Plus, Palram Industries Ltd., Ramat Yohanan, Israel), where excessive heating during daytime (>35 °C ambient indoor temperature) was prevented by fan extractors.

2.2.2. Scaling-Up of the A. platensis BEA 1257B Strain

Outdoor scaling-up of the A. platensis BEA 1257B inoculum to the maximum culture volume of 8000 L at a depth of 0.10 m was performed, never exceeding 1:5 dilution ratio through the successive passes in larger volumes. This procedure was previously reported in order to prevent culture light stress and biological contaminants [15,26]. Briefly, 20 L of inoculum from the indoor cultivation chamber were transferred to a 100 L bubble-mixed column PBR shaded to 50% of the incident light intensity until the culture reached an optical density of 0.2 at wavelength 750 nm (OD750nm; HACH Lange DR3900 UV/visible spectrophotometer; Hach Company, Loveland, CO, USA), then shading was removed and the culture entirely transferred in two 250 L RWs (culture depth = 0.10 m) once it reached a OD750nm of 0.8. Afterwards, 400 L of culture were moved to a 1600 L RW, and finally all the volume was used to inoculate the final-step RW of 80 m2 surface (culture depth = 0.10 m, culture volume = 8000 L), where culture mixing was provided by an eight-blade paddle wheel (Ø 1.4 m) generating an average superficial fluid velocity of 0.46 m/s at 23 rpm. Culture depth of 0.10 m was chosen in order to maximize culture density and productivity, while reducing water demand [16,33,34]. At the moment of the inoculum, A. platensis cells were wavy shaped trichomes [35] of 351.1 ± 64.6 µm length and 7.4 ± 0.8 µm width (n = 50), and relevant changes in morphology were not microscopically observed during the experiments (Leica DMi1, magnification 40×; Leica Microsystems, Wetzlar, Germany).

2.2.3. Experimental Setup, Culture Operation and Monitoring

The main experiment consisted of two phases: in the first phase (F, cycles 1–4, days 0–29, 12 September to 11 October 2019), the raceway was operated in semi-continuous mode at increasing culture concentration harvesting setpoints for 29 days, to establish the culture concentration range providing the best outcome with respect to culture productivity, biotic contamination and harvesting efficiency. In this phase, culture was refilled with fresh medium after each harvesting event. The second phase (R, cycles 5–12, days 29–60, 11 October to 11 November 2019) consisted of a semi-continuous culture that was supplemented with recycled medium after each harvesting and managed at the optimal culture concentration range determined in the previous phase, to assess long-term production feasibility and stability.
Environmental parameters, i.e., outdoor ambient temperature and global horizontal solar irradiation, were measured constantly by Thies Clima 4.3350.10.000 (Adolf Thies GmbH & Co. KG, Göttingen, Germany) and SunTracker: KippZonen Solys2 (OTT HydroMet B.V., Delft, The Netherlands) probes and acquired by DataTaker DT-85 (Thermo Fisher Scientific Inc., Waltham, MA, USA). Culture parameters of temperature, pH, salinity, optical density at wavelength 750 nm (HACH Lange DR3900 UV/visible spectrophotometer; Hach Company, Loveland, CO, USA), and microscopic status (Leica DMi1, magnification 40×; Leica Microsystems, Wetzlar, Germany) were recorded daily at 9:00 AM approximately. During F phase, A. platensis biomass concentration in the culture over time (Cx; i.e., the algal biomass density in the culture) was determined by dry weight measurements [36], and a correlation curve of the optical density against culture dry weight in g/L was built (Cx = 0.92·OD + 0.01, r2 = 0.995), in order to estimate Cx during R phase. pH was maintained in the range 9.4–10.8 injecting pure CO2 through a porous diffuser during daytime (12 h/day). Water evaporation of the culture was compensated daily with 1 µm, UV filtered desalinated water (as used for medium preparation, Table S1: Composition of the desalinated water used for cultivation) based on the measured increase in salinity. All chemicals used in the medium preparation were of commercial grade and locally available, and were chosen based on the criteria of low metal content and high solubility. The use of commercial-grade chemicals for outdoor scaling-up and cultivation, in substitution for the laboratory-grade chemicals used for indoor scaling-up, determined a 26-fold cost reduction per liter of culture medium. Sodium bicarbonate and ammonium sulphate used for culture treatment of biological contaminants (see Section 2.3) were food grade and fertilizer grade, respectively, and were dosed in batch into the medium after dissolution in the water added to balance evaporation.

2.2.4. Biomass Harvesting and Processing

Biomass samples for analysis were collected at days 6, 13 and 20 during F phase (samples F1, F2 and F3, i.e., end of the semi-continuous cycles 1, 2 and 3, respectively) and at days 39, 46 and 54 during R phase (samples R1, R2 and R3, i.e., end of the semi-continuous cycles 7, 9 and 11, respectively; see also Figure 1 and Table 2) by harvesting between 1500 and 3500 L of culture and replacing the same volume with fresh (F phase) or recycled (R phase) culture medium. Sample t0, harvested at the beginning of the experiment, was excluded from calculations and statistical analysis. The biomass was harvested through an industrial circular vibrating screen (Filtra® FTI-0800, Ø 800 mm, filtration area 0.5 m2; Filtra Vibración, Barcelona, Spain) onto a 40 µm stainless-steel net. Briefly, culture was pumped from its surface level to the liquid–solid separator at a constant volumetric flow rate of 750 L/h with a peristaltic pump, then the collected biomass was rinsed directly onto the filter with freshwater (5 L per kg of algal fresh weight). During R phase, liquid filtrate passing the filter was transferred back into the raceway and nutrients were reintegrated proportionally to the estimated dry weight of the harvested algal biomass according to [14] with some modification (Table 1). Also, the same freshwater used for the biomass rinsing was directly used to compensate evaporation, in order to further reduce water demand. The algal slurry obtained after harvesting was frozen at −20 °C in stainless-steel vessels (biomass thickness = 0.02 m) and freeze-dried with a Lyobeta® 6PL lyophilizer (minimum condenser temperature = −80 °C, maximum condenser capacity = 30 kg; Telstar, Barcelona, Spain) with the following parameters: freezing at −40 °C for 4 h, a two-step primary drying of 15 °C for 20 h and of 20 °C for 20 h at 200 µbar chamber pressure, and a final secondary drying step of 30 °C for 5 h at 800 µbar. The grinded biomass was packed in vacuum-sealed PETMet bags and stored in a dark, dry environment at 25 ± 3 °C before analysis (see Section 2.4).

Harvesting Parameters

During F phase, harvesting parameters were determined as follows:
Filtration flux was determined as the volume of culture passing the filter area over time [37]:
CF = Culture   volume   ( m 3 ) Filtration   area   ( m 2 )   ·   Time   ( h )
Harvesting efficiency (HE), i.e., the percentage of the biomass that was retained from the filter during harvesting, was determined by comparing the A. platensis concentration in the filtrate with that in the culture [37]. Dry weight content of the algal slurry (DW) was determined by drying a known amount of sample in aluminium trays overnight at 105 °C. Using these data, the concentration factor of the filtration was determined as the ratio of the dry weight in the algal slurry and the biomass concentration of the initial culture:
CF = 10   ·   ( % DW ) C x
The concentration factor of the filtration taking into account the contribution of the biomass not retained from the filter during harvesting was also calculated:
CF loss = 10   ·   ( % DW ) C x   ·   HE 100  

2.3. Assessment and Identification of Biotic Contaminants

Culture aliquots were daily observed at the microscope (Leica DMi1, magnification 40×; Leica Microsystems, Wetzlar, Germany) to assess the presence and dynamics of microzooplankton and other photoautotrophs during the experiment. Data were recorded in terms of presence/absence in a 100 μL phytoplankton counting chamber. Identification of microzooplankton at genus level was visually conducted comparing observations and photomicrography of the retrieved specimens with those reported by [9]. Initial identification of photoautotrophs was conducted based on morphological characteristics. In addition, to support and enhance the identity, clones were isolated and small subunit ribosomal DNA and internal transcribed spacer gene sequences were amplified as follows: samples of the culture with presence of photoautotrophs different from A. platensis were initially filtered under sterile conditions onto 40 µm pore size nylon filters (Millipore, 47 mm diameter; MilliporeSigma, Burlington, MA, USA), in order to remove A. platensis trichomes. Aliquots of 50 µL of the filtrate were serially diluted in Bold’s basal medium (BBM) [38] and spread onto agar plates prepared with the same medium. After incubation at 25 ± 1 °C and continuous cool white light at PPFD of 50 µmol photons m−2 s−1, individual algal colonies were randomly picked up and spread onto new agar plates for separation and purification, and incubated in the same conditions as described above at least three times before DNA analysis.
Genomic DNA extraction was performed on five clones following the protocol of [39], based on the use of Chelex 100 resin (Bio-Rad Laboratories Inc., Hercules, CA, USA), followed by purification with Real Clean Spin Kit (Durviz SL., Valencia, Spain). 18S rRNA gene was amplified by polymerase chain reaction with the eukaryotic primers Euk1A (5’-CTGGTTGATCCTGCCAG-3′) and Euk516r (5′-ACCAGACTTGCCCTCC-3′) [40], while rRNA-ITS region was amplified with the eukaryotic primers ITS-AB28 (5′-GGGATCCGTTTCCGTAGGTGAACCTGC-3′) and ITS-TW81 (5′-GGGATCCATATGCTTAAGTTCAGCGGGT-3′) [41] following the authors’ instructions. PCR products were checked on a 1.5% agarose gel, purified with IllustraTM ExoProStarTM 1-step (GE Healthcare Life Sciences, Boston, MA, USA) and finally bidirectionally sequenced on an ABI PRISM 3730xl automatic sequencer (Applied Biosystems, Thermo Fisher Scientific Inc., Waltham, MA, USA) with the sequencing services of Macrogen (Macrogen, Seoul, Korea). A comparison of nucleotide sequences was performed using the Basic Local Alignment Search Tool (BLAST) database at the National Center for Biotechnology Information (NCBI). Sequences were submitted to Genbank with the accession numbers MZ331801 to MZ331805 for 18S rRNA gene, and MZ333645 to MZ333649 for rRNA-ITS region.

2.4. Biomass Analysis

All analyses were performed on the freeze-dried, vacuum-packed Arthrospira’s biomass. Proximate composition was determined in three replicates to estimate the protein, lipid, carbohydrate, ash and moisture content in the algal biomass by following standard procedures (AOAC, 2000; [42]). Briefly, protein content (N × 6.25) was determined using the Kjeldahl method. Crude lipid was quantified according to [43]. Moisture was determined after drying the samples in an oven at 105 °C until reaching constant weight, and ash content by combustion in a muffle furnace at 550 °C for 12 h. Total carbohydrates were quantified by difference of total algal biomass minus content of all previous components (i.e., proteins, lipids, ash, and moisture) [44]. Total energy content of the biomass was determined by multiplying the values obtained for crude protein, total carbohydrate, and crude lipid by 4, 4, and 9, respectively, and finally summing the results [45].
Analysis of pigments (hereafter also referred as phytonutrients) was performed spectrophotometrically in triplicate (Hach Lange DR3900; Hach Company, Loveland, CO, USA). C-phycocyanin was determined at 620 nm [46] after samples were extracted overnight at 4 °C in 100 mM phosphate buffer. Chlorophyll a was determined according to AOAC 1995 [47] after repeated extraction with 85% acetone (at least three times) using glass microbeads for cell disruption; the absorbance of the extract was read at 666 and 642 nm against an 85% acetone blank [48]. Total carotenoids were quantified on the same extract reading absorbance at 450 nm [49].
Mineral composition was determined through inductively coupled plasma optical emission spectrometry (ICP-OES AVIO 500, Perkin Elmer Inc., Waltham, MA, USA) after acid digestion of the dried biomass in a microwave digestion system (Ethos Easy, Milestone Srl, Bergamo, Italy).
Microbiological quality of the packaged sample was analyzed by counting of the total aerobic mesophilic flora (UNE EN ISO 4833-2 at 30 °C), yeasts and molds (ISO 21527), Enterobacteriaceae (ISO 21528-2), total coliforms (NFV 08-050 at 30 °C), Escherichia coli (ISO 16649-2), Staphylococcus spp. (ISO 6888-2 at 37 °C), Clostridium perfrigens (ISO 7937), and by detection of Salmonella spp. (ISO 6579) [50]. While total aerobic mesophilic flora was assayed in all samples, the remaining parameters were only determined in the samples F1, F3 and R2.

2.5. Statistical Analysis

All statistical analyses were performed with the software PAST 4.03 [51]. Differences in culture conditions and biomass composition between F and R experimental phases were tested by Student’s t-test, while correlation between variables was assessed through Pearson’s linear correlation. Statistical significance was set at p < 0.05 for all the analyses.

3. Results and Discussion

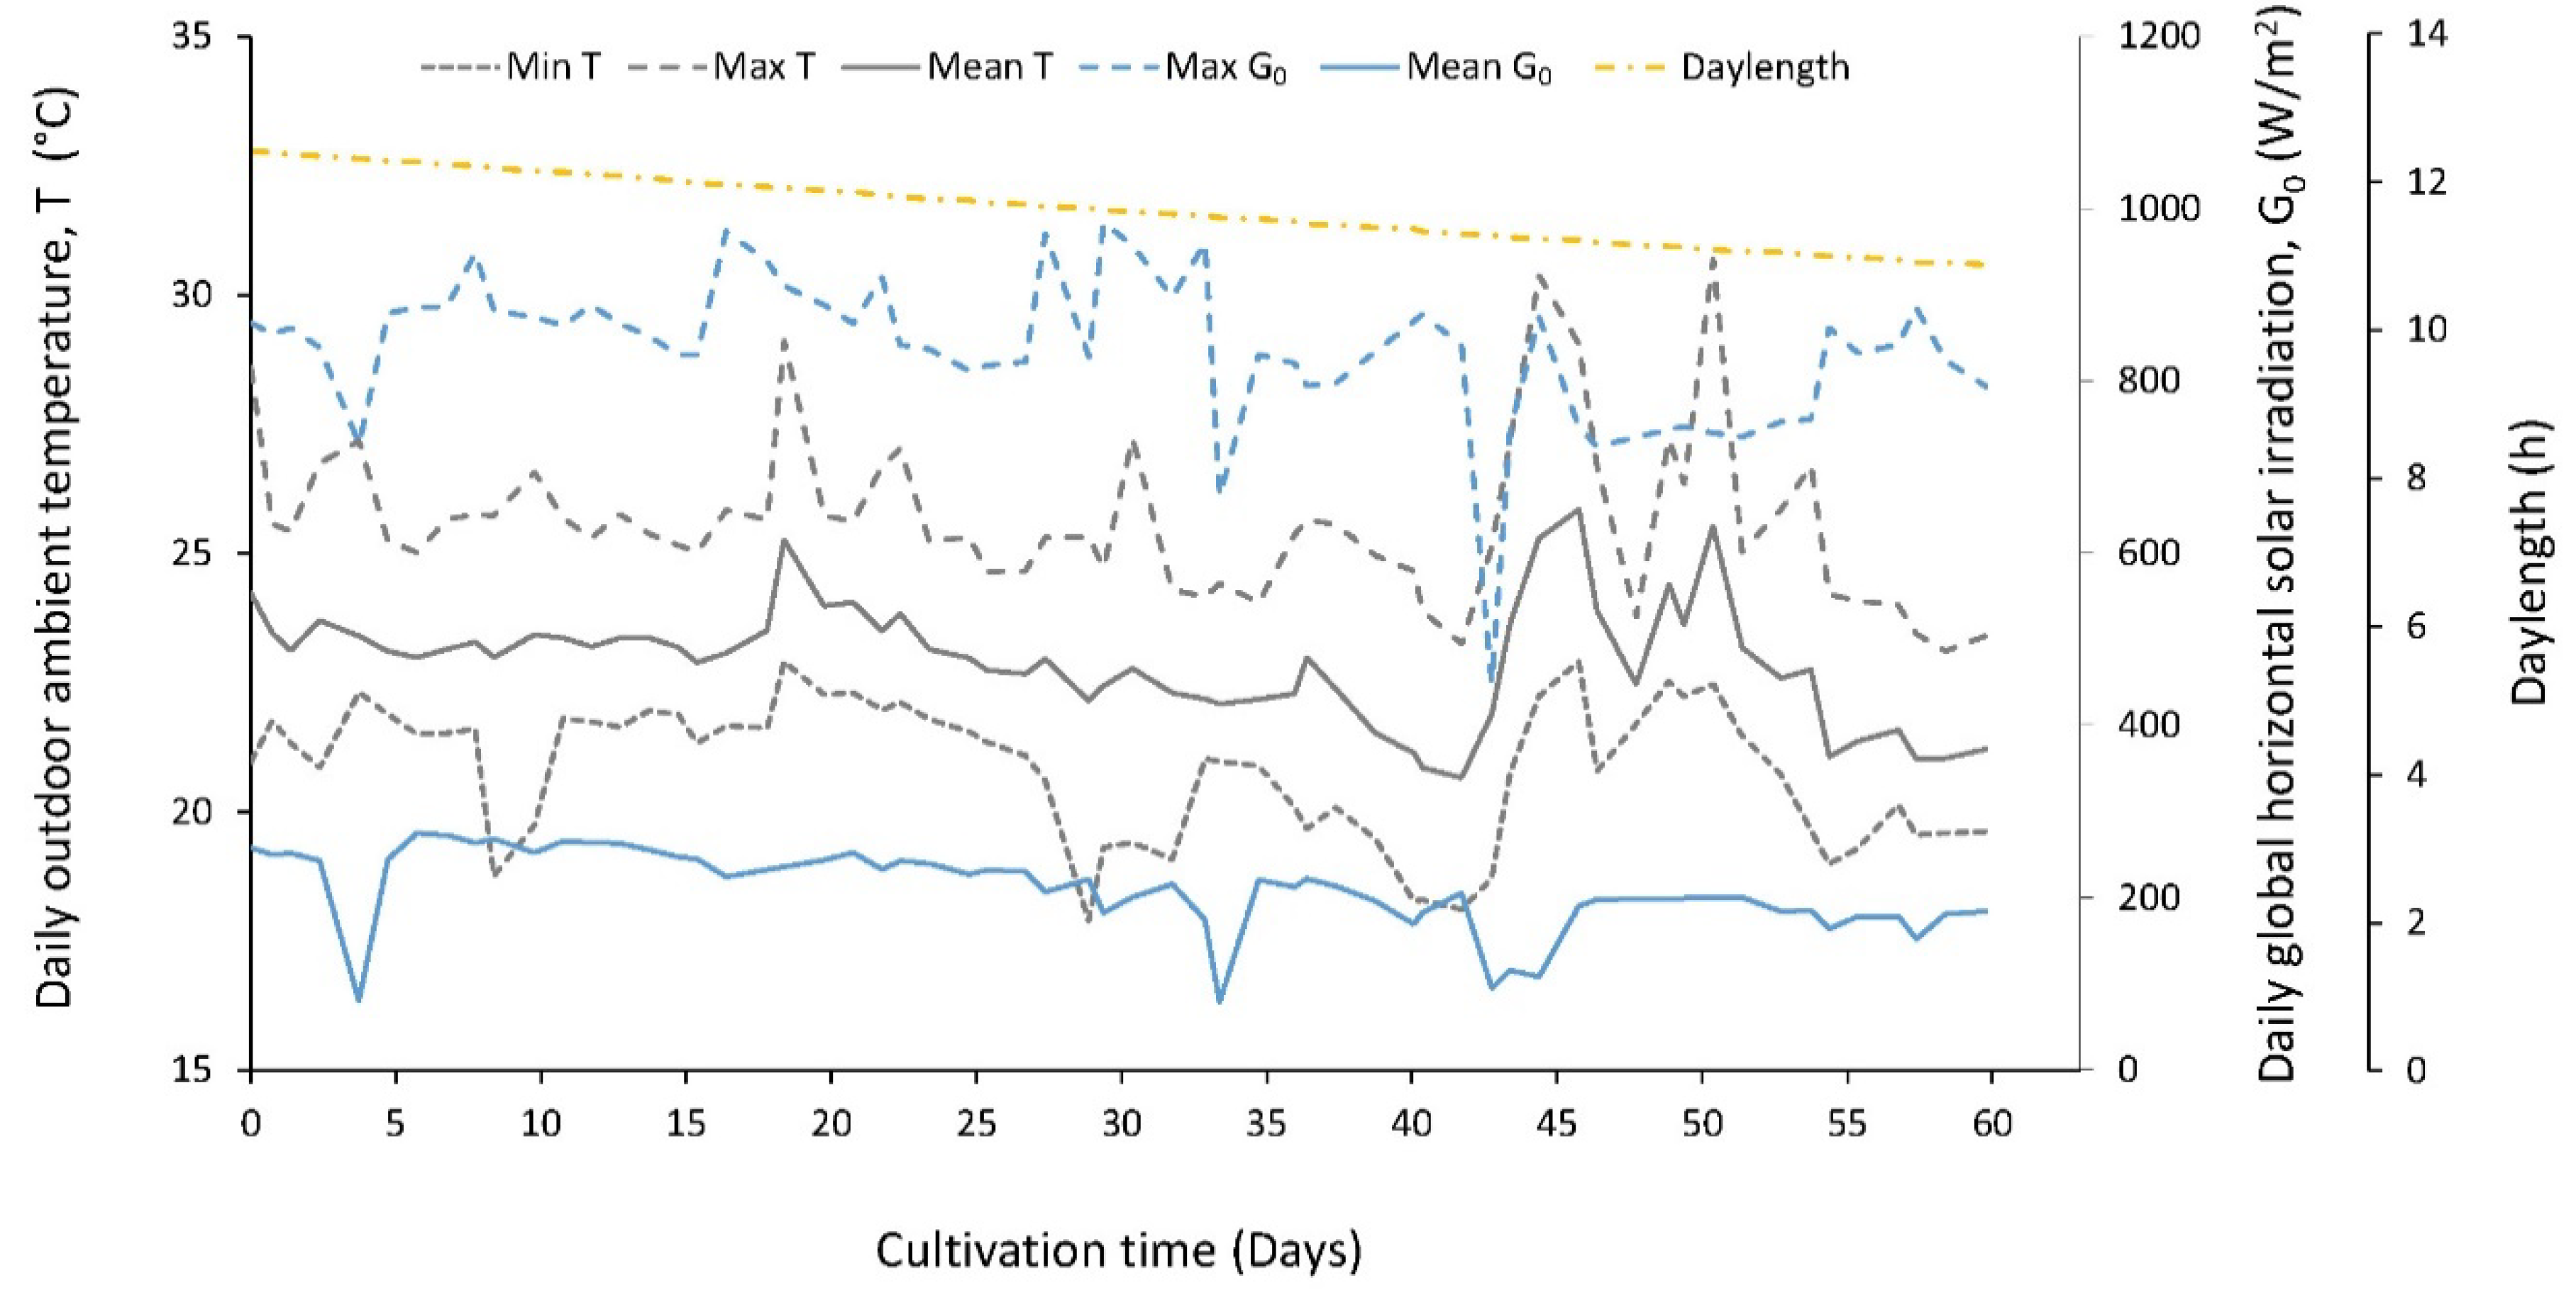
3.1. Environmental Parameters

The Canarian strain A. platensis BEA 1257B was cultivated in an 8000 L raceway under greenhouse conditions for approximately two months, in semi-continuous mode. In the first phase (F), the culture was partially harvested at increasing biomass concentration setpoints followed by supplementation with fresh OUT medium, to determine the optimal concentration range (i.e., 0.6–0.9 g/L, see forward) providing the best outcome with respect to culture productivity, biotic contamination and harvesting efficiency. In the second phase (R), this concentration range was imposed to the culture, and recycled culture medium replenished of the depleted nutrients based on the amount of collected algal biomass was supplemented after each harvesting, to assess long-term production feasibility and stability.
Environmental parameters are summarized in Table A1, Appendix A. Along the whole culture period (12 September–11 November 2019), average and maximum daily global horizontal solar irradiation (G0) ranged from 79.2 to 274.8 W/m2 and from 449.6 to 983.8 W/m2, respectively, both being significantly higher in F compared to R phase (mean value: 868.9 ± 50.8 W/m2 vs. 802.8 ± 104.2 W/m2 for maximum G0 and 241.3 ± 35.6 W/m2 vs. 179.0 ± 36.7 W/m2 for average G0; p < 0.01). A similar pattern was also observed for day length (mean value: 12.0 ± 0.2 h vs. 11.2 ± 0.2 h for F and R, respectively; p < 0.01), as expected due to season proceeding. Outside temperature ranged from 17.9 to 30.7 °C with a mean value of 22.9 ± 1.1 °C, being significantly higher in F compared to R phase (23.3 ± 0.6 °C vs. 22.5 ± 1.4 °C; p < 0.01). The trend of the environmental parameters during the study is showed in Figure A1, Appendix A.

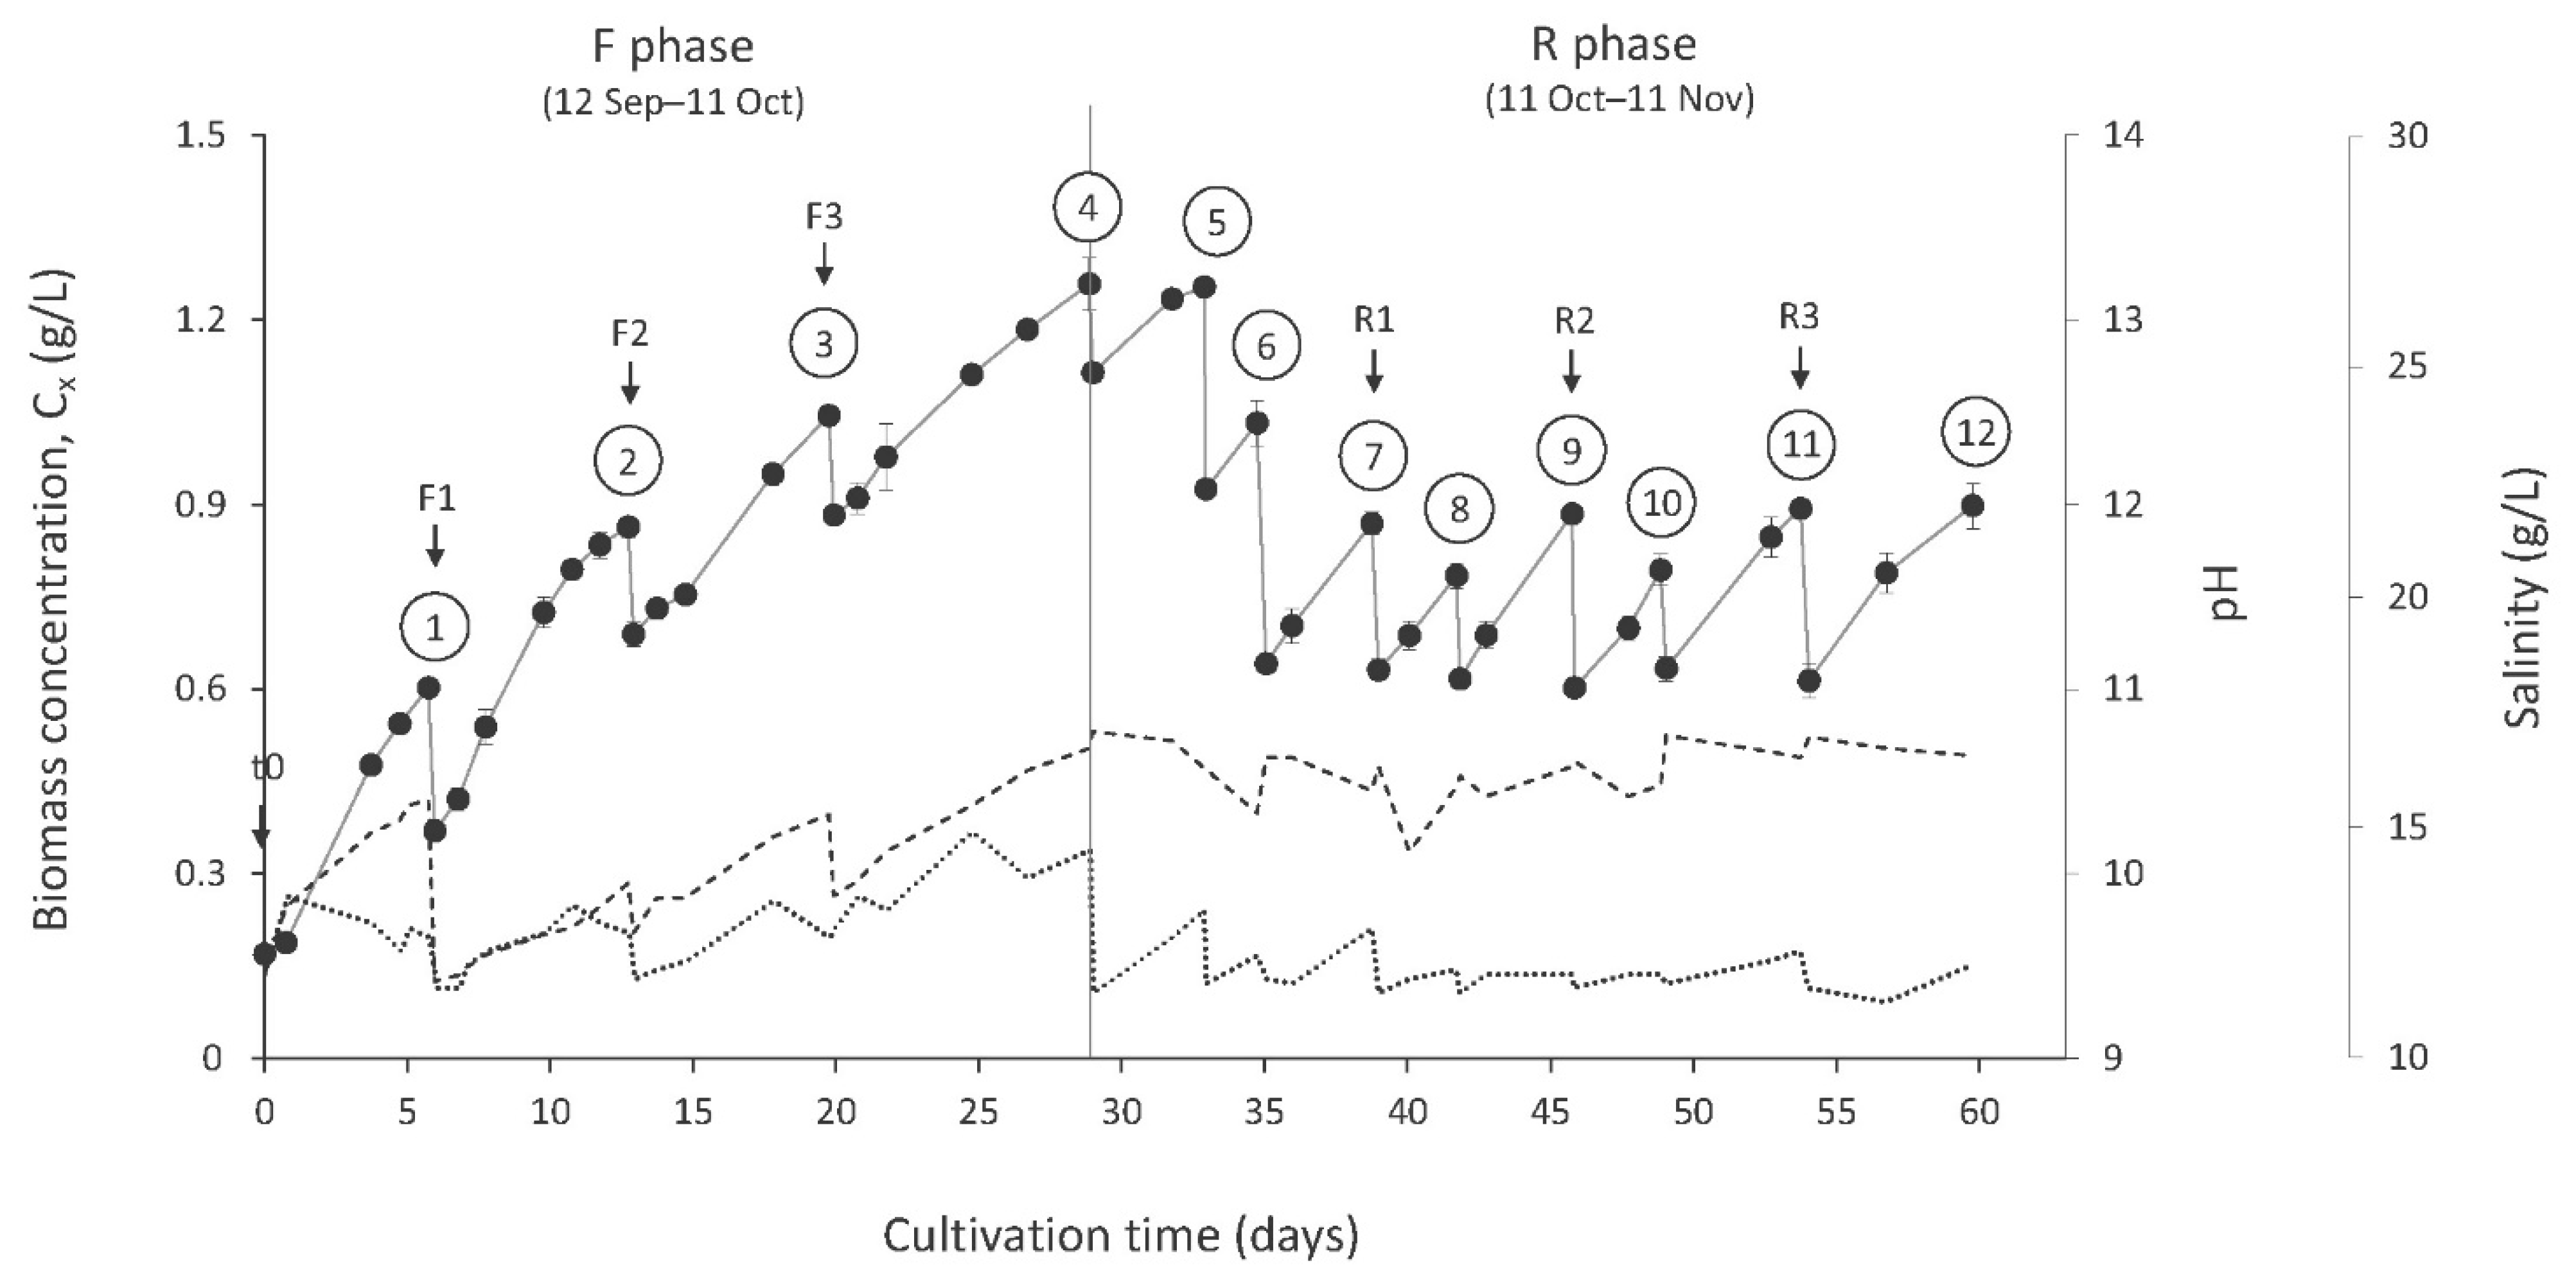
3.2. Culture Parameters

Culture concentration, pH and salinity trends are shown in Figure 1.
Initial culture concentration was 0.17 ± 0.008 g/L. Since higher threshold values have been suggested from [26] (0.25 g/L), sunlight hitting the greenhouse was cautiously attenuated of about 35% during the first two days of cultivation through shading nets, as intense photoinhibition and loss in productivity have been reported during the summer months [19,52]. Culture concentration increased progressively with no lag-phases and reached the maximum yield of 1.26 ± 0.043 g/L at the end of the F phase, with a positive growth trend (day 29). This value of culture concentration is much higher than those reported for Arthrospira strains grown in RWs of comparable size and volume in: Southern Spain (0.5–0.7 g/L; [25]) or greenhouses in Turkey (0.4 g/L; [53]). However, the culture depth in this study (0.10 m) was lower than those used in these publications (0.25–0.30 m), which in our case provided higher light availability to the cells (see also Section 3.3). Similar yields of 1.2 g/L have already been obtained during the summer in Northern Italy in 5 m2 RWs at 0.10 m culture depth operated inside a full-automated greenhouse [21].
After achieving maximum culture concentration yield, the culture was progressively harvested three times to attain a concentration of approximately 0.6 g/L (days 29–35), and then operated semi-continuously for 26 days in the concentration range of 0.6–0.9 g/L, maintaining a constant growth until the end of the R experiment (day 60; Figure 1). This culture concentration range is higher than the range of 0.4–0.6 g/L commonly used in order to maximize culture productivity while ensuring good harvest efficiency [15,26,52], because culture density in this study had to be maintained higher than the reported values in order to reduce biological contaminations [52]. Actually, the range used here for culture operation during the R phase was intentionally selected in the attempt to match the best trade-off between culture productivities, prevention of other microorganisms and optimal harvest efficiencies retrieved during the F phase (see forward).
The salinities measured in this study (mean value: 12.8 ± 0.9 g/L for F and 11.9 ± 0.5 g/L for R phase: Table 2) are in agreement with the values generally reported for Spirulina production, in accordance with the diffuse use of the standard Zarrouk’s medium and its modifications [17,54]. In fact, while Arthrospira can thrive in a wide range of salinities (8.5–200 g/L; [15]), commercial cultivation is normally performed at values lower than 20 g/L, in order to reduce the costs of the synthetic medium and the amount of residual salts in the algal biomass [52]. Actually, salinities in our study are half to six-fold higher than those measured in Arthrospira mass cultures throughout China [9]. While the higher salinity values observed in F with respect to R phase (p < 0.01) are mainly due to a higher evaporation extent, as suggested by the positive correlation between these two parameters (r = 0.58, p < 0.05; Table 2), the drop in salinity observed at day 29 may be a consequence of the precipitation of some dissolved salts in the culture medium, occurred in concomitance with high pH values (10.68; Figure 1). This phenomenon is quite frequent in cultures of Arthrospira and can lead to a diminution in alkalinity as well as to a reduction of bioavailable iron and phosphorous in the system [14,26,48]. However, abrupt decreases in salinity coupled with increase in pH in dense culture of Arthrospira have been also attributed to chemical interactions between the alkaline buffer and the high photosynthetic activities, possibly arising from an imbalance in the system due to a preferential uptake of the bicarbonate over carbonate species in the culture medium by the cyanobacterium [55].
A. platensis BEA 1257B was tested under a wide range of pH (9.42–10.77), and successfully cultivated on the high side of the values previously reported as suitable for Arthrospira growth [15] along the whole R phase (pH mean value: 10.56 ± 0.16; Table 2), indicating a strong alkaliphile nature of the Canarian strain. Even so, the pH range in this study is in line with those reported in cultures for mass production of A. platensis throughout China [9].
Daily evaporation of the A. platensis BEA 1257B culture during the course of the experiment (mean value: 3.9 ± 1.0 mm for F and 3.0 ± 1.1 mm for R phase; p < 0.01) was lower than that recorded in open ponds located in arid or semi-arid areas (≃6 mm), likely due to an increased relative humidity in the surrounding atmosphere enabled from the greenhouse barrier [8,26,34]. This water-loss limitation accounts for more than a one-third reduction in the water demand due to evaporation, this latter being estimated around the 35% of the total water demand for freshwater microalgae cultivation [56].
Culture temperature measured at 9:00 AM did not vary significantly between the two phases (mean value: 24.9 ± 0.9 °C vs. 24.2 ± 1.6 °C for F and R, respectively; Table 2), unlike outside temperature that varied significantly (Table A1, Appendix A). Moreover, culture temperature positively correlated with the outside temperatures (r = 0.66 and 0.68, respectively; p < 0.05), being approximately 4 °C higher than minimum and 1 °C lower than the maximum temperature, respectively. Cultivation inside a greenhouse, able to maintain this positive difference between the outside temperature and the culture temperature in the morning, could be helpful to ensure the feasibility of the year-round production of Arthrospira in this area, where the lowest air temperatures are around 13 °C during the winter season. In fact, while overheating during the summer season is not generally a concern for this mesophilic cyanobacterium in open raceway systems [21,22,26], diurnal culture temperatures lower than 15 °C could limit productivities during some hours of the day, while exposing the cultures to higher photoinhibition and contamination risks [17,18,25,52]. The possibility to achieve year-round production of A. platensis without additional costs for heating identifies the Canary Islands as an attractive location for this activity [57] in comparison to other regions of Europe, Asia and North America, where seasonal Arthrospira cultivation is limited to 6–10 months per year [22,26,58]. The energetic requirement for 12 months production in Northern France under ≃400 m2 greenhouse has been estimated in 106 MWh/year to maintain culture medium temperature above a 15 °C threshold [58].

3.3. Culture Productivity and Harvesting Efficiency

Culture volumetric productivity varied between 0.04 and 0.08 g/L/day (overall mean value: 0.06 ± 0.012 g/L/day; Table 1), with the highest productivities recorded at the days 0–6 for the F phase and at the days 42–46 for the R phase (0.08 ± 0.002 and 0.07 ± 000.2 g/L/day, respectively). A negative correlation between productivity rate and initial culture concentration at each semi-continuous cycle was found (r = −0.83; p < 0.05), in accordance with previous reports that underline a reciprocal shadowing effect occurring at high cell densities [8,52]. Average productivity did not differ significantly between the two phases (mean value: 0.06 ± 0.016 and 0.06 ± 0.010 g/L/day for F and R phase, respectively). When considering the long-term productivity during the R phase in the concentration range of 0.6–0.9 g/L (days 35–60), a mean value of 0.06 ± 0.007 g/L/day, corresponding to an areal productivity of 6.0 ± 0.07 g/m2/day, was obtained by recirculating the culture medium with no renewal during the entire R phase. When directly interpolating this areal productivity value to year-round operation per hectare of culture surface (365 days × 10,000 m2), estimation of the annual biomass productivity for A. platensis BEA 1257B in the tested system results in 21.9 ± 0.3 tons/ha/year, which is in line with microalgal productivities reported in open RW ponds in Southern Spain (27 tons/ha/year) [57]. However, this value is indicative, as it is known that hectare-scale annual productivity is affected by (i) seasonal variability in the environmental parameters, (ii) reduced biomass output in larger raceway systems, and (iii) the time taken for maintenance of the installation and cleaning procedures [16,26], which have not been evaluated in this study. The areal productivity of 6.0 ± 0.07 g/m2/day obtained here is in the range reported for seasonal production plants under greenhouses in Inner Mongolia [22], while being approximately half of the output rate obtained in 13,500 L open RWs located in Southern Spain [25] and in open industrial ponds located in Southern California during the same season as in our study (end of summer/autumn; [26]). However, when considering culture volumetric productivity, which takes into account the volume of culture per area, the values in this study are almost double than those achieved by these authors [25,26], as a consequence of the different culture depths (0.10 m this study, 0.30 m in [25,26]). Volumetric productivities reported here are similar to those obtained in smaller RW systems in Northern Brazil (2.5 m2, [59]), Northern Italy (5 m2; [21]) and Turkey (12 m2; [53]). This indicates the efficiency of our cultivation systems, as it is known that in smaller systems a more efficient mixing of the culture sustains higher output rates [16]. The higher culture densities and volumetric productivities reached in this work at 0.10 m culture depth, in accordance with [16,33,34], can reduce water demand, and the operational costs related to (i) medium preparation (by reducing the amount of the water and the added salts), (ii) harvesting process, and (iii) management of the cultivation effluents (i.e., either the exhausted culture medium or crushed cultures) [16,33,34,57]. Actually, culture management at 0.10 m depth rather than 0.20 m (the depth more commonly used for Arthrospira cultivation [15]) directly cuts half of the water demand and the amount of chemicals for the initial make-up medium. Additionally, the high culture densities in this study, supported by higher light availability for the cells in low culture depth (see also Section 3.2), enables the harvesting of higher amounts of algal biomass per unit of filtered culture volume during the harvesting process. This increased amount of biomass and the corresponding reduction in the energy used per kg of fresh product (1.85 kW/h in this study between the vibrating screen and the peristaltic pump) is more than 50% when comparing the harvesting setpoint of 0.9 g/L used in this study during the R phase with the commonly used 0.5–0.6 g/L [15]. This is a remarkable improvement in cost reduction, considering that biomass harvesting contributes to ≃25% of the cultivation costs in raceway ponds due to low biomass densities [57]. On the other hand, higher culture depths can generate greater areal productivity and ultimately higher biomass production per land used. A design of high-performance RWs that could operate at culture depths between 0.15–0.25 m, with the aim to assess the best balance in terms of techno-economical sustainability of the cultivation process, is currently underway in our institution. Recirculation of the culture medium is a key issue for the sustainability of A. platensis cultivation. In a base scenario relying on the results obtained in this study, where semi-continuous cultivation between the use of recycled medium after each harvesting event is compared with fresh medium in 8000 L RW for one month (assuming the same evaporation and productivity of 0.06 g/L/day, with a harvesting rate of ≃0.1 day−1 i.e., 10% of the total culture volume daily), the water demand for the semi-continuous cultivation is 300% higher (30 days × 10% daily) for the fresh medium condition, as it is also for the wastewater originated from the exhausted medium. At the same time, based on the amount reported in Table 1, the costs of the chemicals used for the preparation of 24,000 L of fresh medium (30 days × 10% daily × 8000 L) will overcome the costs for nutrient replenishment of 14.4 kg of produced dry algal biomass (30 days × 0.06 g/L/day × 8000 L) by a factor of 15.
Harvesting efficiency of A. platensis BEA 1257B at a constant flow rate of 750 L/h onto a vibrating 40 µm stainless-steel net with 0.5 m2 surface is reported in Table A2, Appendix B. Filter retention varied between 74.4 ± 4.7 and 82.1 ± 2.8% (mean value: 78.7 ± 3.3%), which is in line with the values reported for vibrating screens and for static woven nylon filters of the same mesh size operated with Arthrospira [26,37]. Conversely, the constant filtration flux applied in this study (1.5 m3/m2/h, limited by the technical characteristics of the pump) was approximately three times lower than those reported in the previous studies [26,37]. The harvesting efficiency depended on the culture densities (r = 0.99, p < 0.01), as a result of the partial clogging of the filter occurring at high cell concentration. The clogging physically reduces the pore size of the net, thus increasing cell retention while synoptically decreasing the dewatering efficiency of the vibrating screen [37]. This is supported by the lower biomass dry weight in the algal slurries obtained at harvesting at higher culture concentrations compared to the slurries obtained by filtering cultures with lower culture concentrations (cycles 3 and 4 vs. cycles 1 and 2, respectively; p < 0.01, Table A2, Appendix B). However, the dewatering efficiency was never drastically reduced under the assayed conditions, as dry matter content in the algal slurry reported here (range 9.0–10.3%, mean value: 9.7 ± 0.6%) is quite consistent with the filtration output obtained in most Arthrospira production plants [17,26]. Moreover, filtration flux declines due to severe clogging of the screen reported by [37] did not occurred under the flow rate and culture concentrations tested in this study. In Table A2 it is shown that harvesting efficiency at ≃0.9 g/L i.e., the biomass harvesting setpoint in this study, is approximately 4% higher than at 0.6 g/L, the harvesting setpoint commonly used in Arthrospira cultures [15]. This indicates that the higher culture densities reached in this work at 0.10 m culture depth can further improve the harvesting filtration process (see above) because of the higher amount of biomass retained on the filter. Future optimization of the solid–liquid separation process, through the evaluation of the harvesting efficiencies of smaller net size (e.g., 15–25 µm) under increasing input flow rates, is planned in our facilities.
Projected biomass production costs of cultivation and harvesting in open raceway ponds in the Canary Islands (expressed as the sum of CAPEX and OPEX) has been determined on 5.0 €/kg, that is already under half of those determined in The Netherlands, and slightly lower than in Southern Spain [57]. The implementation of smart manufacturing systems to handle operations along the different processes will be pivotal in order to improve the value chain of this emerging production sector. For instance, the use of Industrial Internet of Things devices interconnected under machine learning algorithms will result in faster processes optimization. This is because of the massive volume of data collected by sensors precisely monitoring the system variables (e.g., pH, light, temperature, flow), that is continuously elaborated before being transmitted to automated actuators able to perform specific actions [60,61].

3.4. Microzooplankton and Phototrophs Dynamics, and Culture Treatment

During the outdoor scaling-up of A. platensis BEA 1257B, the presence of other phototrophs in the cultures was not observed. Ciliates belonging to the genus Euplotes were detected at very low abundances (<10 cells/mL) only in one 250 L raceway where culture was initially managed at low pH (<9.4). However, they promptly disappeared as pH increased, possibly being affected by the high alkaline conditions. Euplotes sp. were observed to come into contact with the A. platensis cells but not actually to graze them, in accordance with previous observations on commercial cultures throughout China [9], and algal fragments were not retrieved inside their cell body according to microscopic observations. Schmidingerothrix sp. occasionally occurred in the cultures, however they readily disappeared either with culture dilution by addition of fresh medium or by raising pH upon 10.3. These ciliates did not graze the cyanobacterial cells, as observed in other Arthrospira cultures [9], which is in line with their bacterivorous nutrition [62,63]. Interestingly, members of Schmidingerothrix have been retrieved from hypersaline soils of Africa and Portugal [62,63]. Therefore, it is reasonable to hypothesize that cysts of Schmidingerothrix could have been carried from the African continent by the southeast wind known as Calima at the moment of scaling-up the culture, or alternatively been present as autochthonous microorganisms in the hypersaline soils nearby the cultivation site and thus carried by the local wind.
When considering the A. platensis BEA 1257B culture in the 8000 L raceway, the dynamics of microzooplankton and phototrophs, and the treatments applied to the culture, are summarized in Table A3, Appendix B. Neither phototrophs nor protozoans were detected at the time of the inoculum. Euplotes sp. were not observed along the course of the experiment, while Schmidingerothrix sp. appeared from day 8 to day 15. Moreover, starting from day 12, bright-green rounded photoautotrophs of small size (2–4 µm), successively genetically identified as Chlorella sorokiniana (99.7–100% identity, n = 5 isolates), were detected in the culture. In order to control potential proliferation of the green alga, CO2 injection was immediately withheld, sodium bicarbonate in the culture medium was increased from the initial concentration of 8 g/L to 12 g/L after culture harvesting at day 13 through batch addition of 4 g/L of the salt itself, and ammonium sulphate was dosed at 1 mM concentration the following day (day 14). Although the occasional appearance of Chlorella spp. in Arthrospira cultures has been reported since the early 1980s [52], there have been very few works addressing this issue to date. The procedure implemented in our study applies the increase of alkalinity and its maintenance at high values through carbonate-bicarbonate salt addition. This strategy proved to be the most effective to prevent the presence of Chlorella spp. in Arthrospira cultures [52,64], especially when combined with low CO2 supply and renewal of aliquots of the culture with fresh medium [52], as performed here at each harvesting time during the F experiment (see Section 2.2). Repeated batch addition of NH4+ is also a very helpful strategy in the treatment of Chlorella and other phototrophs [19,52], and also of contaminant protozoans, due to the predominance of the toxic NH3 over NH4+ at high pH values (>9.26 at 25 °C; [65,66]). In this study, removal of Schmidingerothrix was observed the day after the first treatment with ammonium sulphate (Table A3, Appendix B), indicating the sensitivity of this ciliate with respect to ammonia at the dosed amount.
During days 15–18, C. sorokiniana cells first readily aggregated in flocs with a strong tendency to bleaching and sedimentation, then cell concentration sharply declined. Besides the synergistic effect of increased alkalinity and ammonia as direct stress factors for Chlorella [15,52,67], cell aggregation may have played an indirect effect in the algal removal. In fact, cell flocculation induced by chemical interactions occurring between the increased carbonate-bicarbonate ions and the Chlorella cell wall, enhanced by the increased pH [68], induced sedimentation of C. sorokiniana cells in the deeper layer of the culture, where low light availability results in a further handicap for the chlorophyte [14,52], whose energy requirement for maintenance are higher than Arthrospira’s ones [19]. Subsequently, while treatment with ammonium sulphate was preventively repeated after biomass harvesting at day 20, C. sorokiniana mostly disappeared from the culture until the end of the experiment. Actually, starting from day 21 onwards, single cells of C. sorokiniana were only sporadically retrieved in culture samples either collected at the bottom of the culture or sedimented overnight, indicating the effectiveness of the applied treatments. The successive increasing in A. platensis cell density at values higher than 1.2 g/L (days 20–29; Figure 1 and Table 2) has further intensified the shading effect on C. sorokiniana cells, restraining the green alga at negligible concentrations [14,19]. In fact, a clear negative correlation between population densities of Arthrospira and Chlorella has been previously reported, and cyanobacterial release of compounds with antibiotic/allelopathic effects on other microalgae as chlorophytes and diatoms was suggested [26,69]. Presence of these bioactive compounds has been also reported for Arthrospira extracts used against bacteria, fungi and viruses [70,71]. Meanwhile, the increased alkalinity and pH along the R phase (pH > 10.1, mean 10.56; Figure 1 and Table 2) most likely prevented the later appearance of Chlorella and other biological contaminants [19,26,64]. A certain amount of sodium carbonate can be added to the culture medium in order to increase the initial pH and alkalinity from the beginning of the cultivation, which will be considered in future investigations [14,64]. The effective strategy developed here to control and possibly prevent biological contamination in Arthrospira cultures is one of the main findings of this study, as annual loss due to contamination and following discarding of the culture have estimated to be in the order of 15–20% of the overall biomass productivity [26].
Despite the presence of C. sorokiniana in the A. platensis culture at some stages of the semi-continuous cycles performed during the F phase, no significant contribution of the chlorophyte to the A. platensis BEA 1257B biomass composition is expected, since visual inspection of the lyophilized samples at the microscope revealed no presence of C. sorokiniana cells in the biomass. Absence of the chlorophyte in the biomass samples is most likely because of its very low presence in the culture and because of the small cell size that do not allow Chlorella retention onto the filter at the time of harvesting [14,15,19,26].

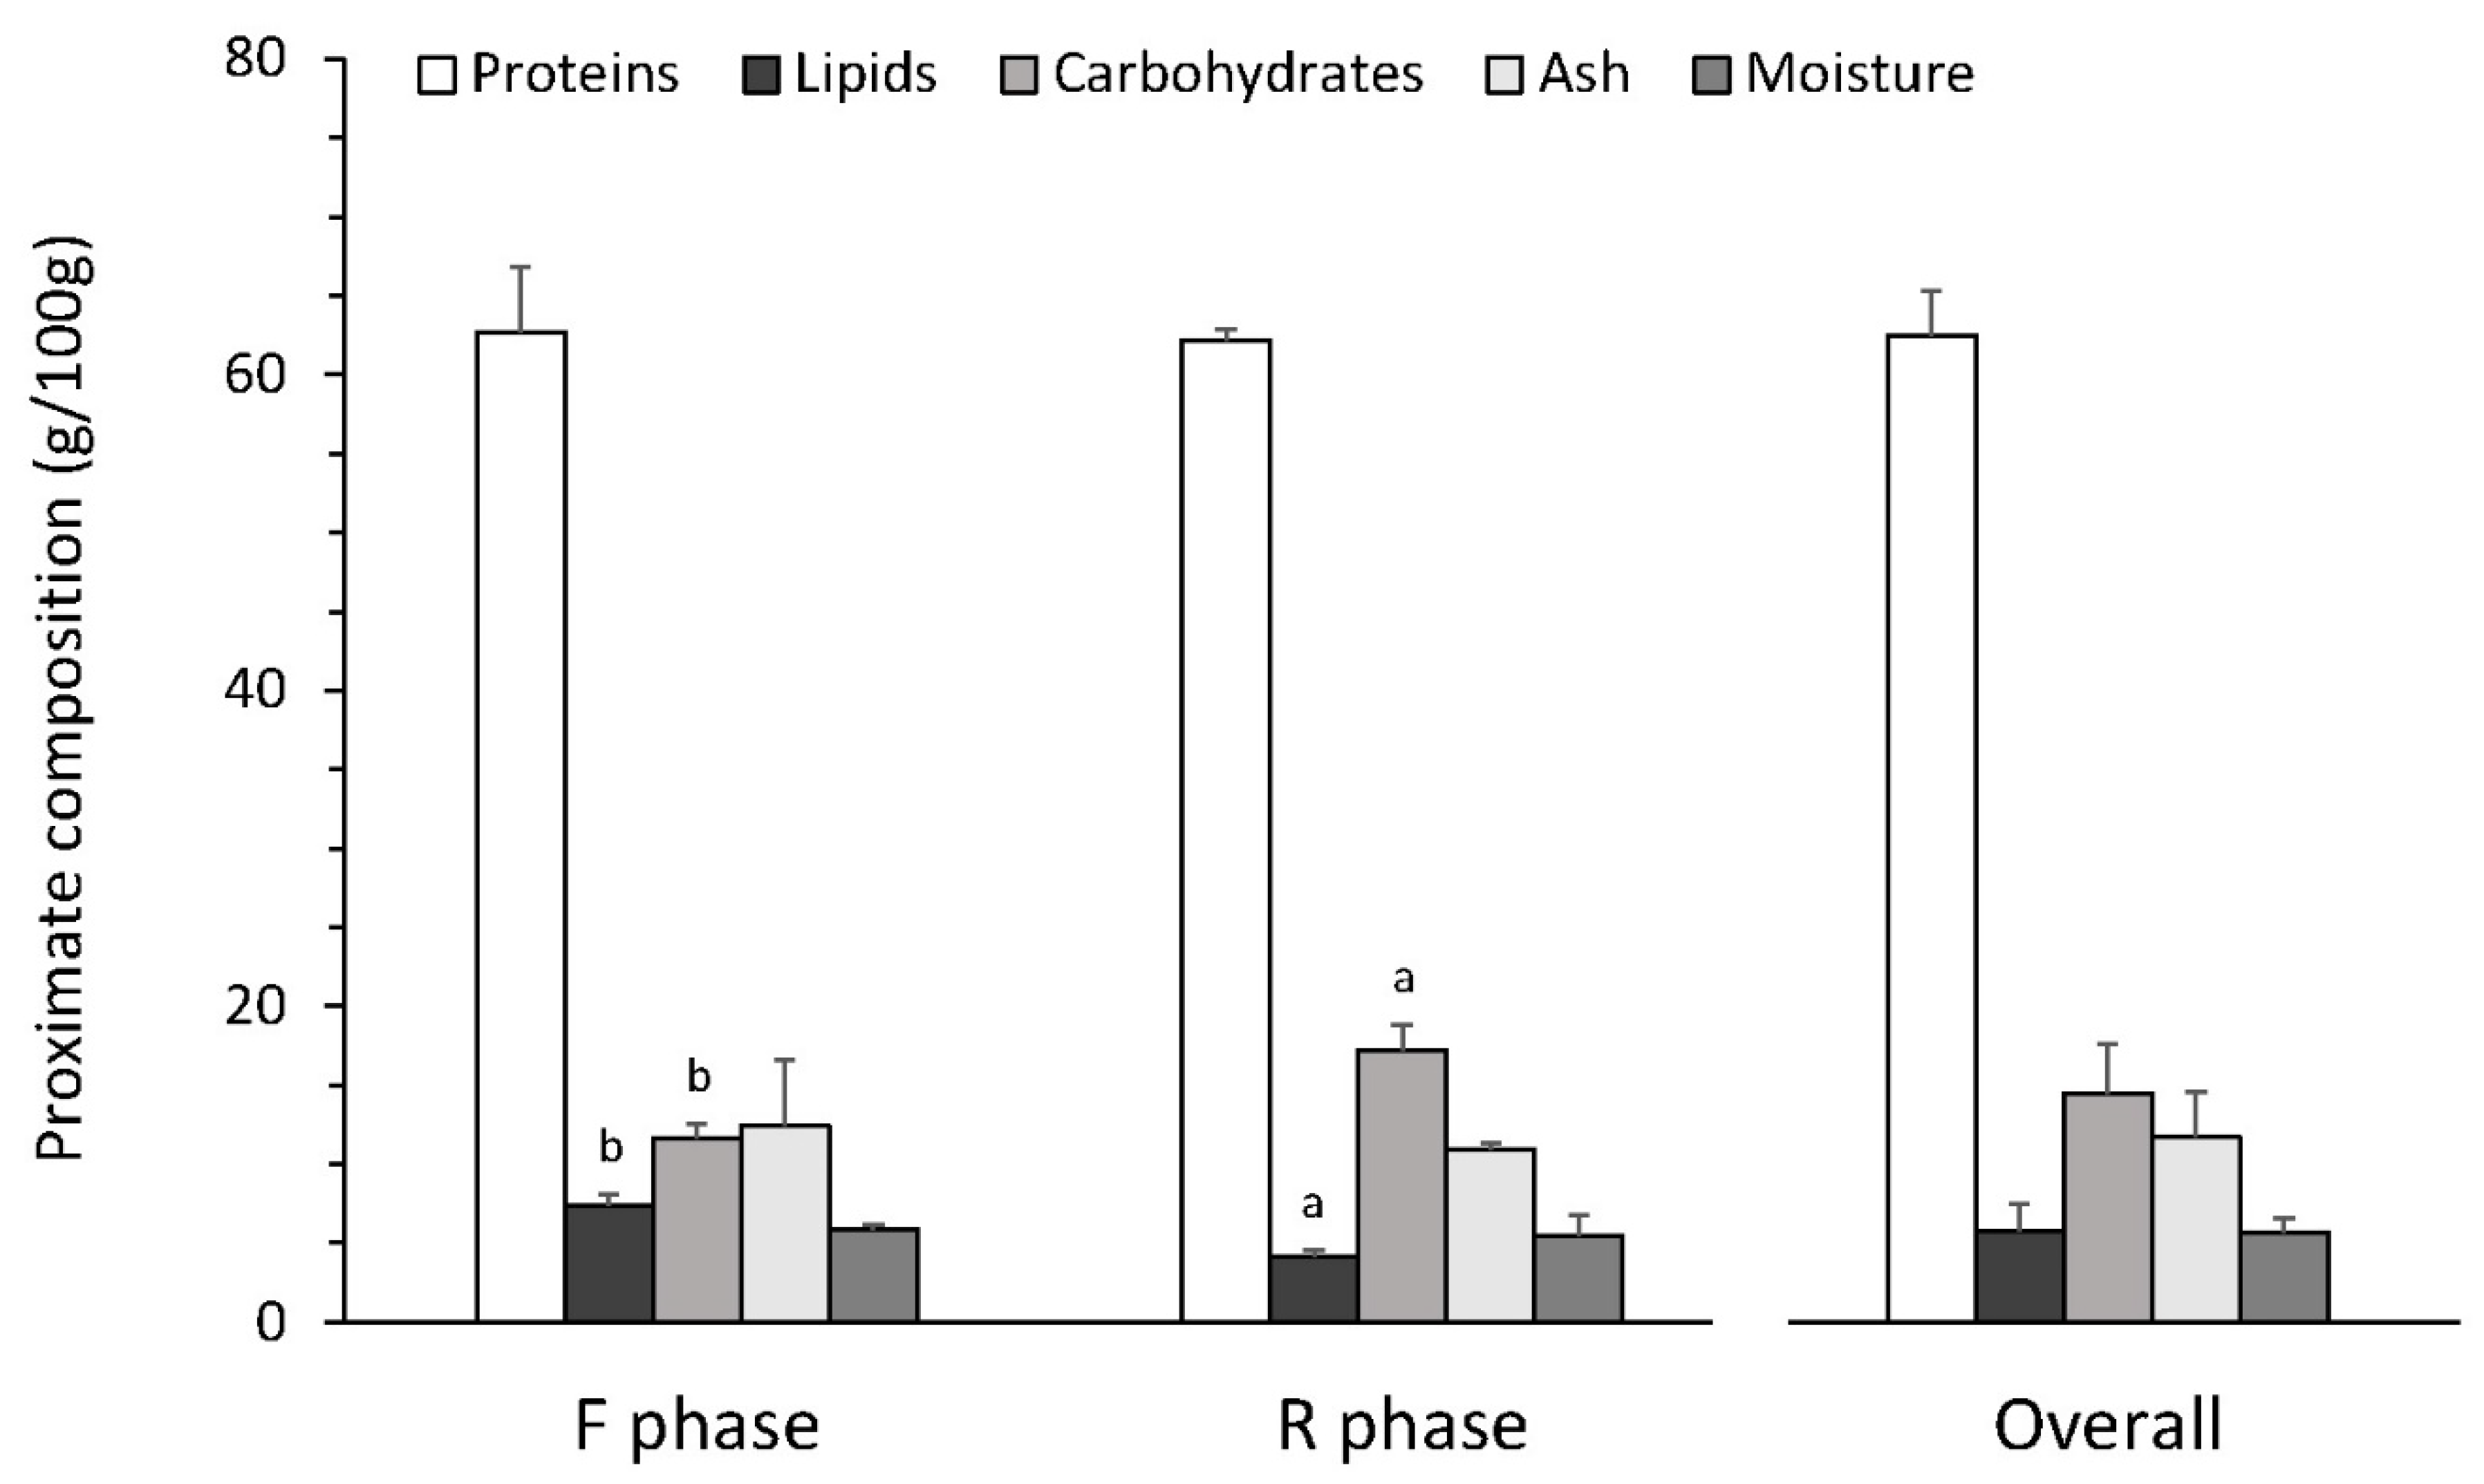
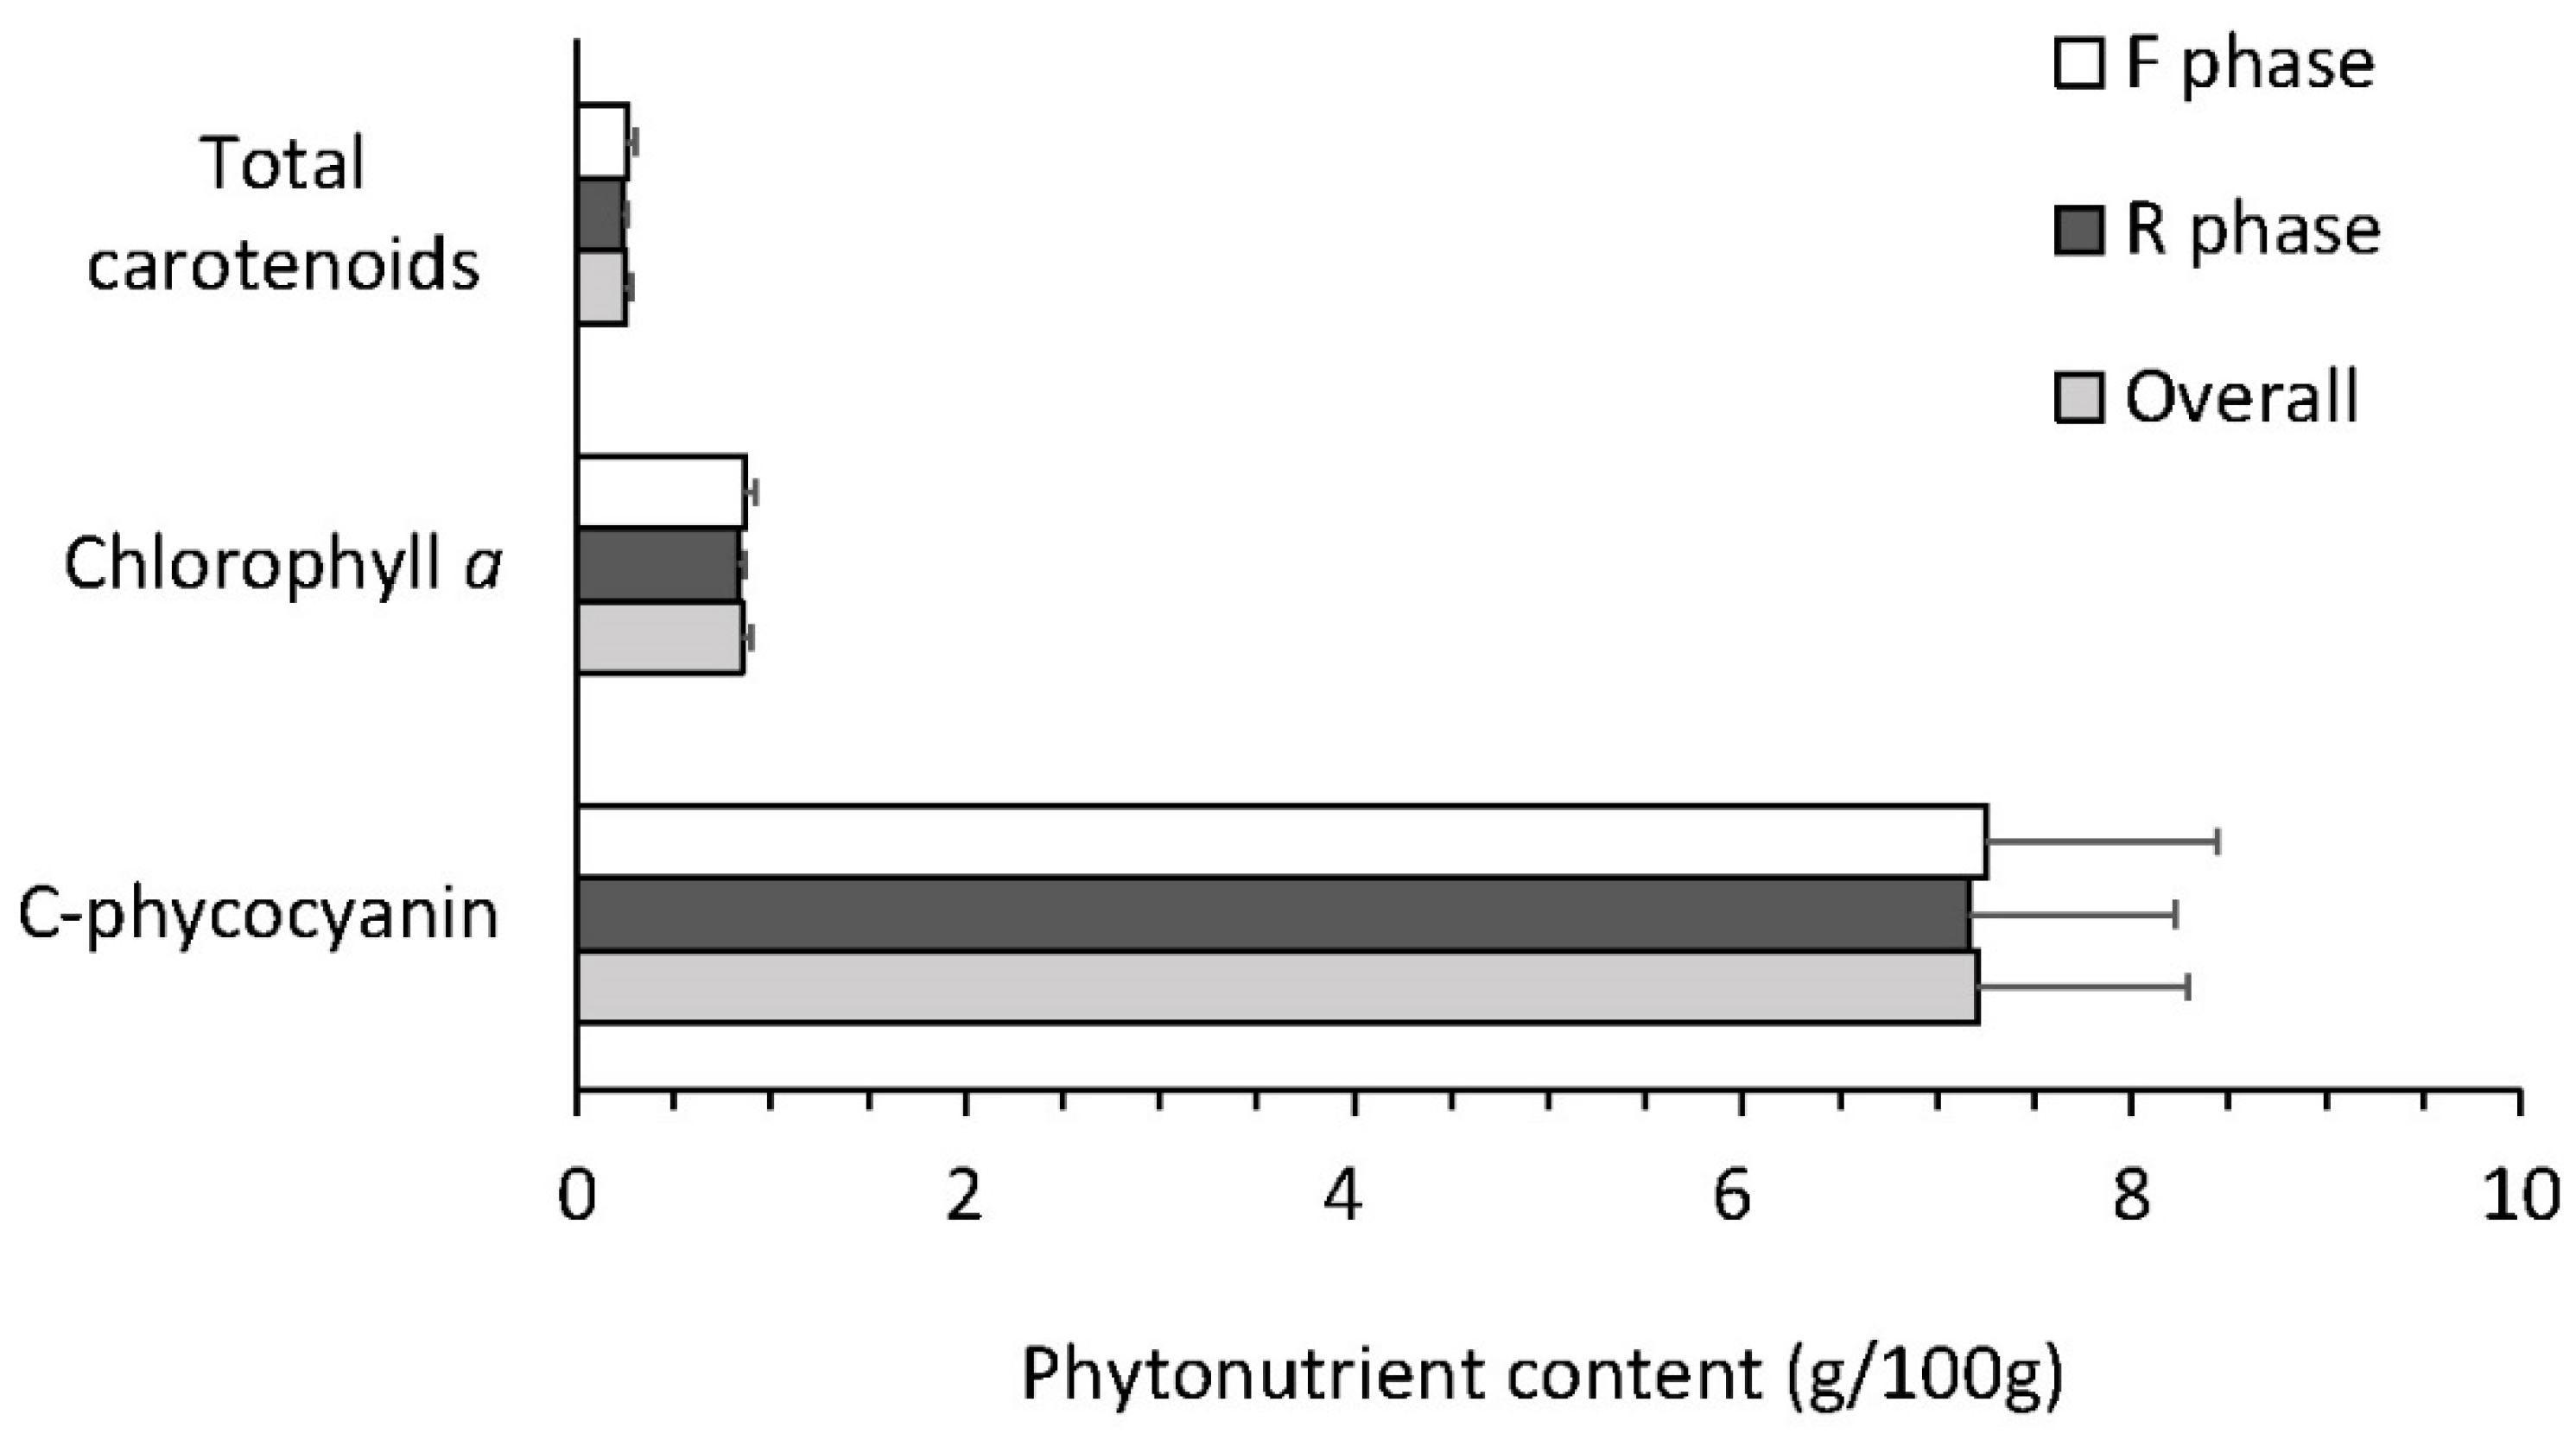
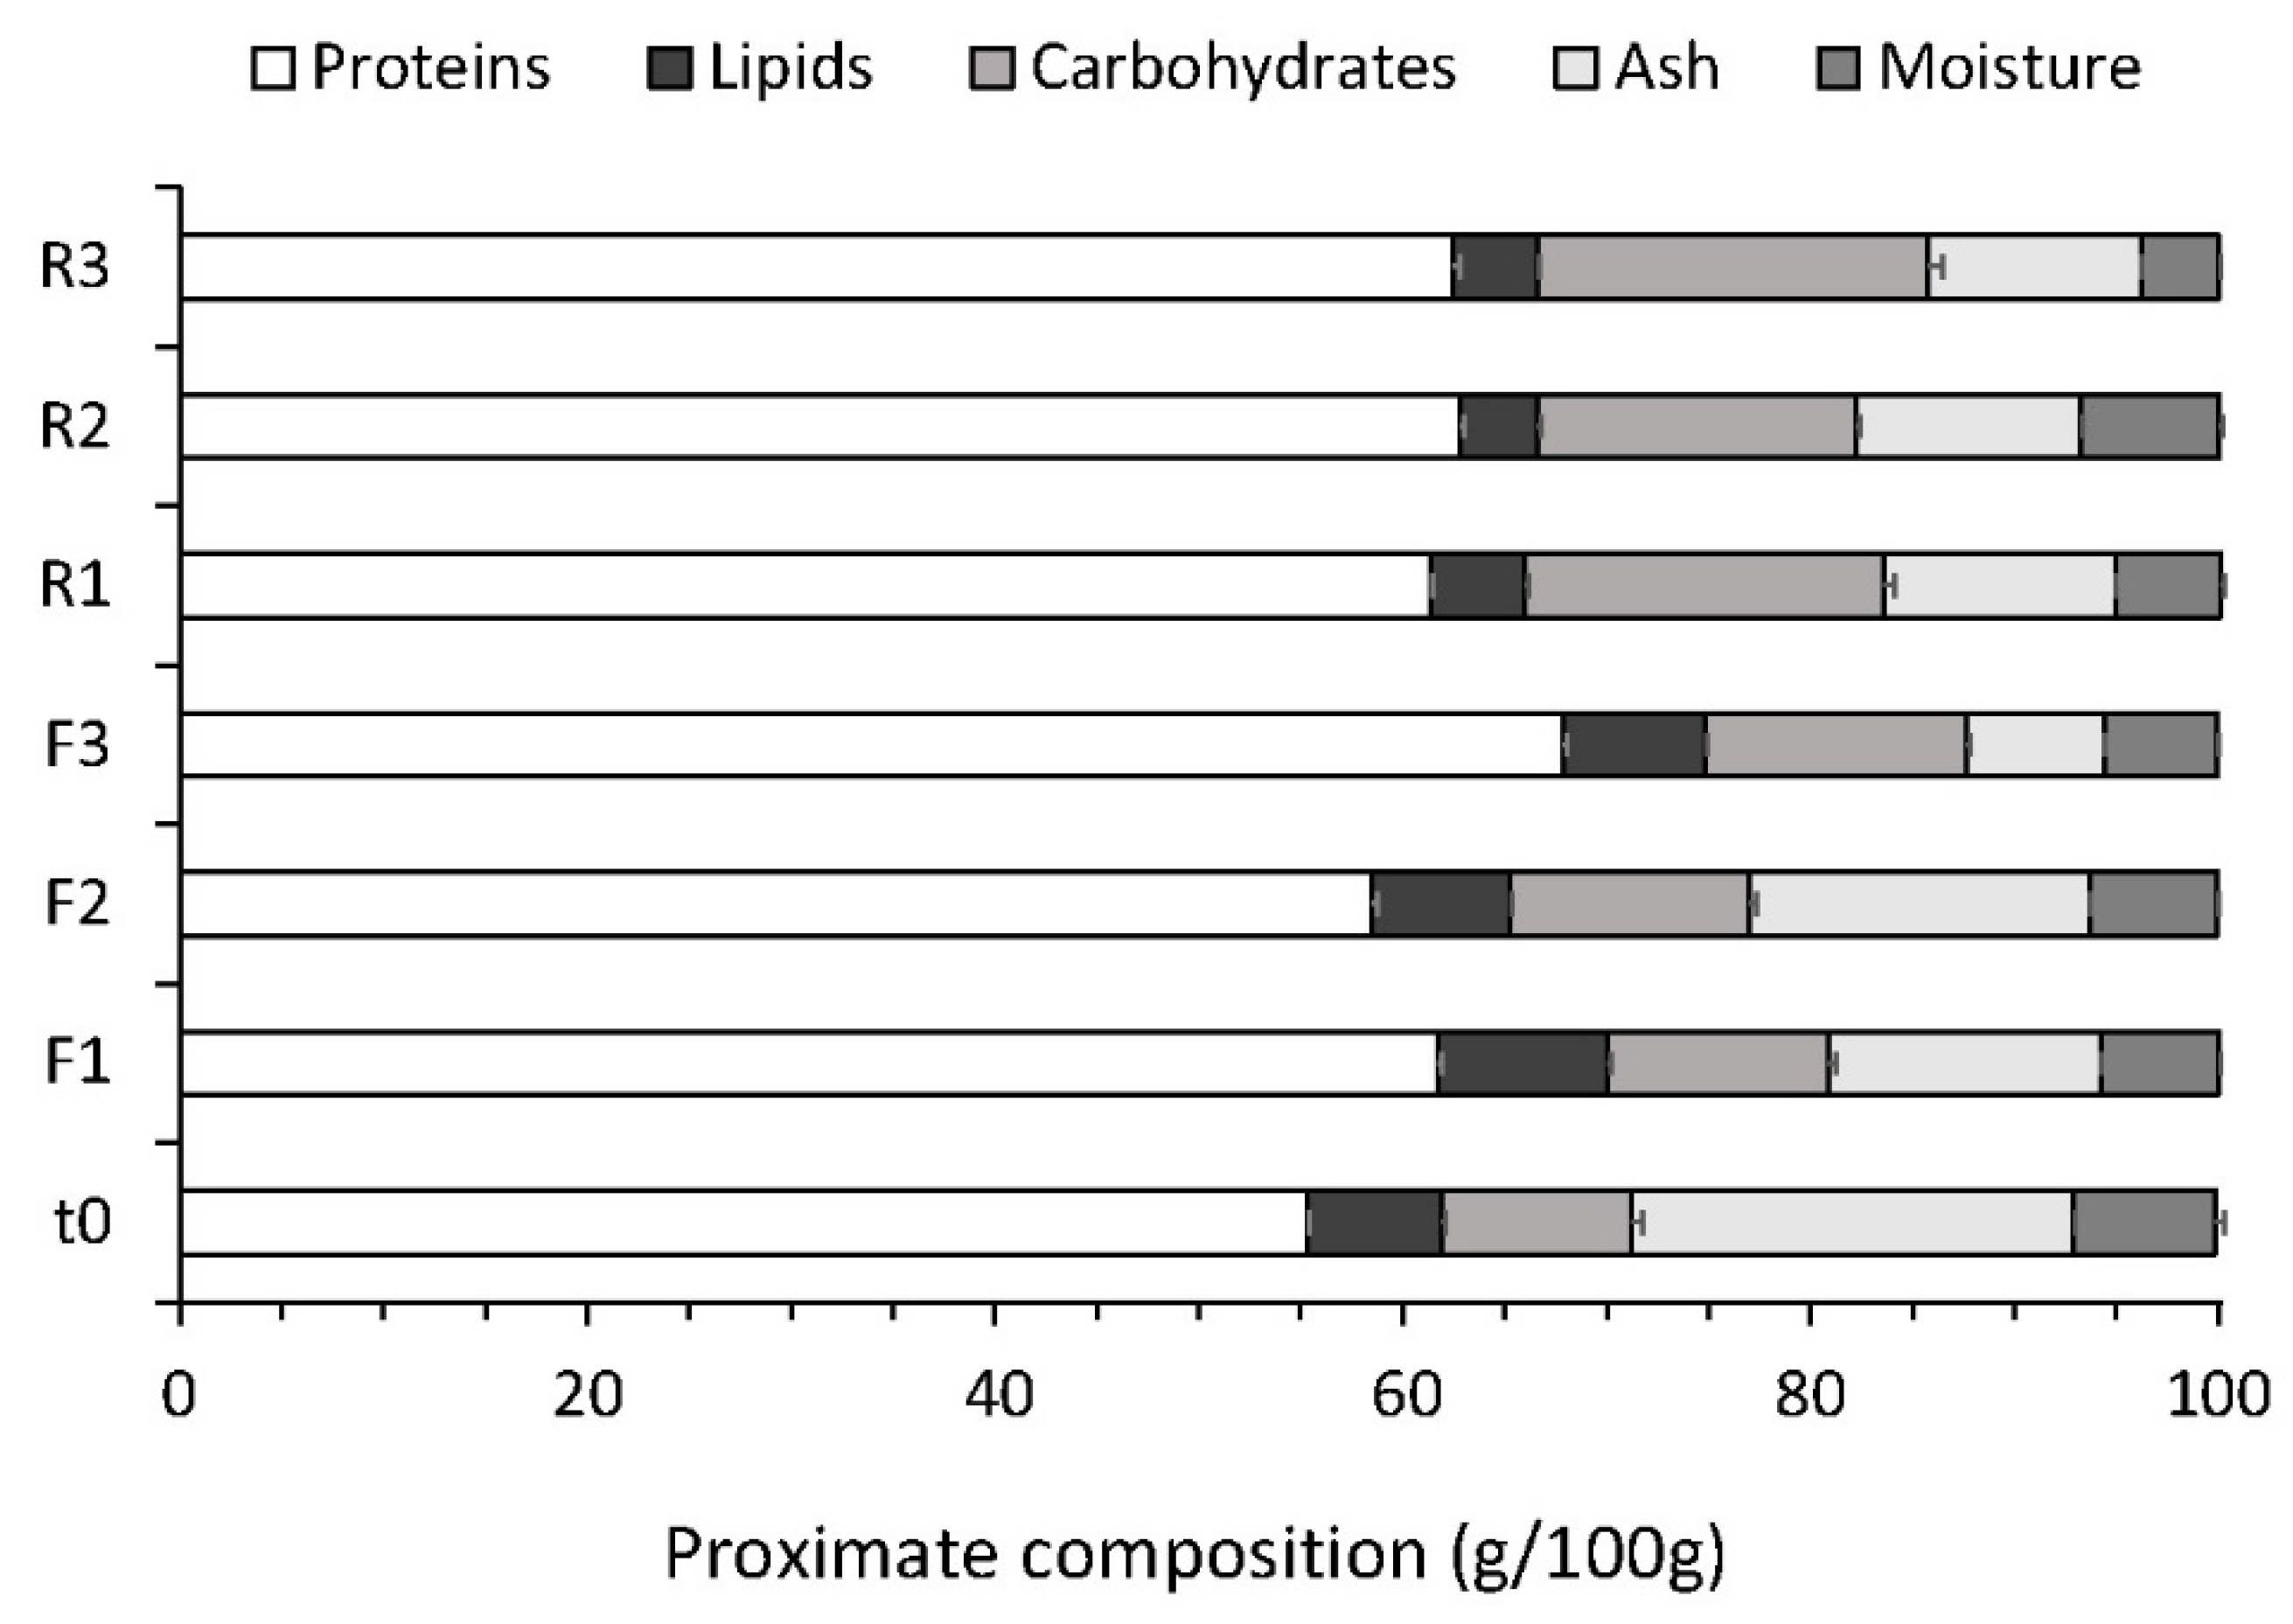
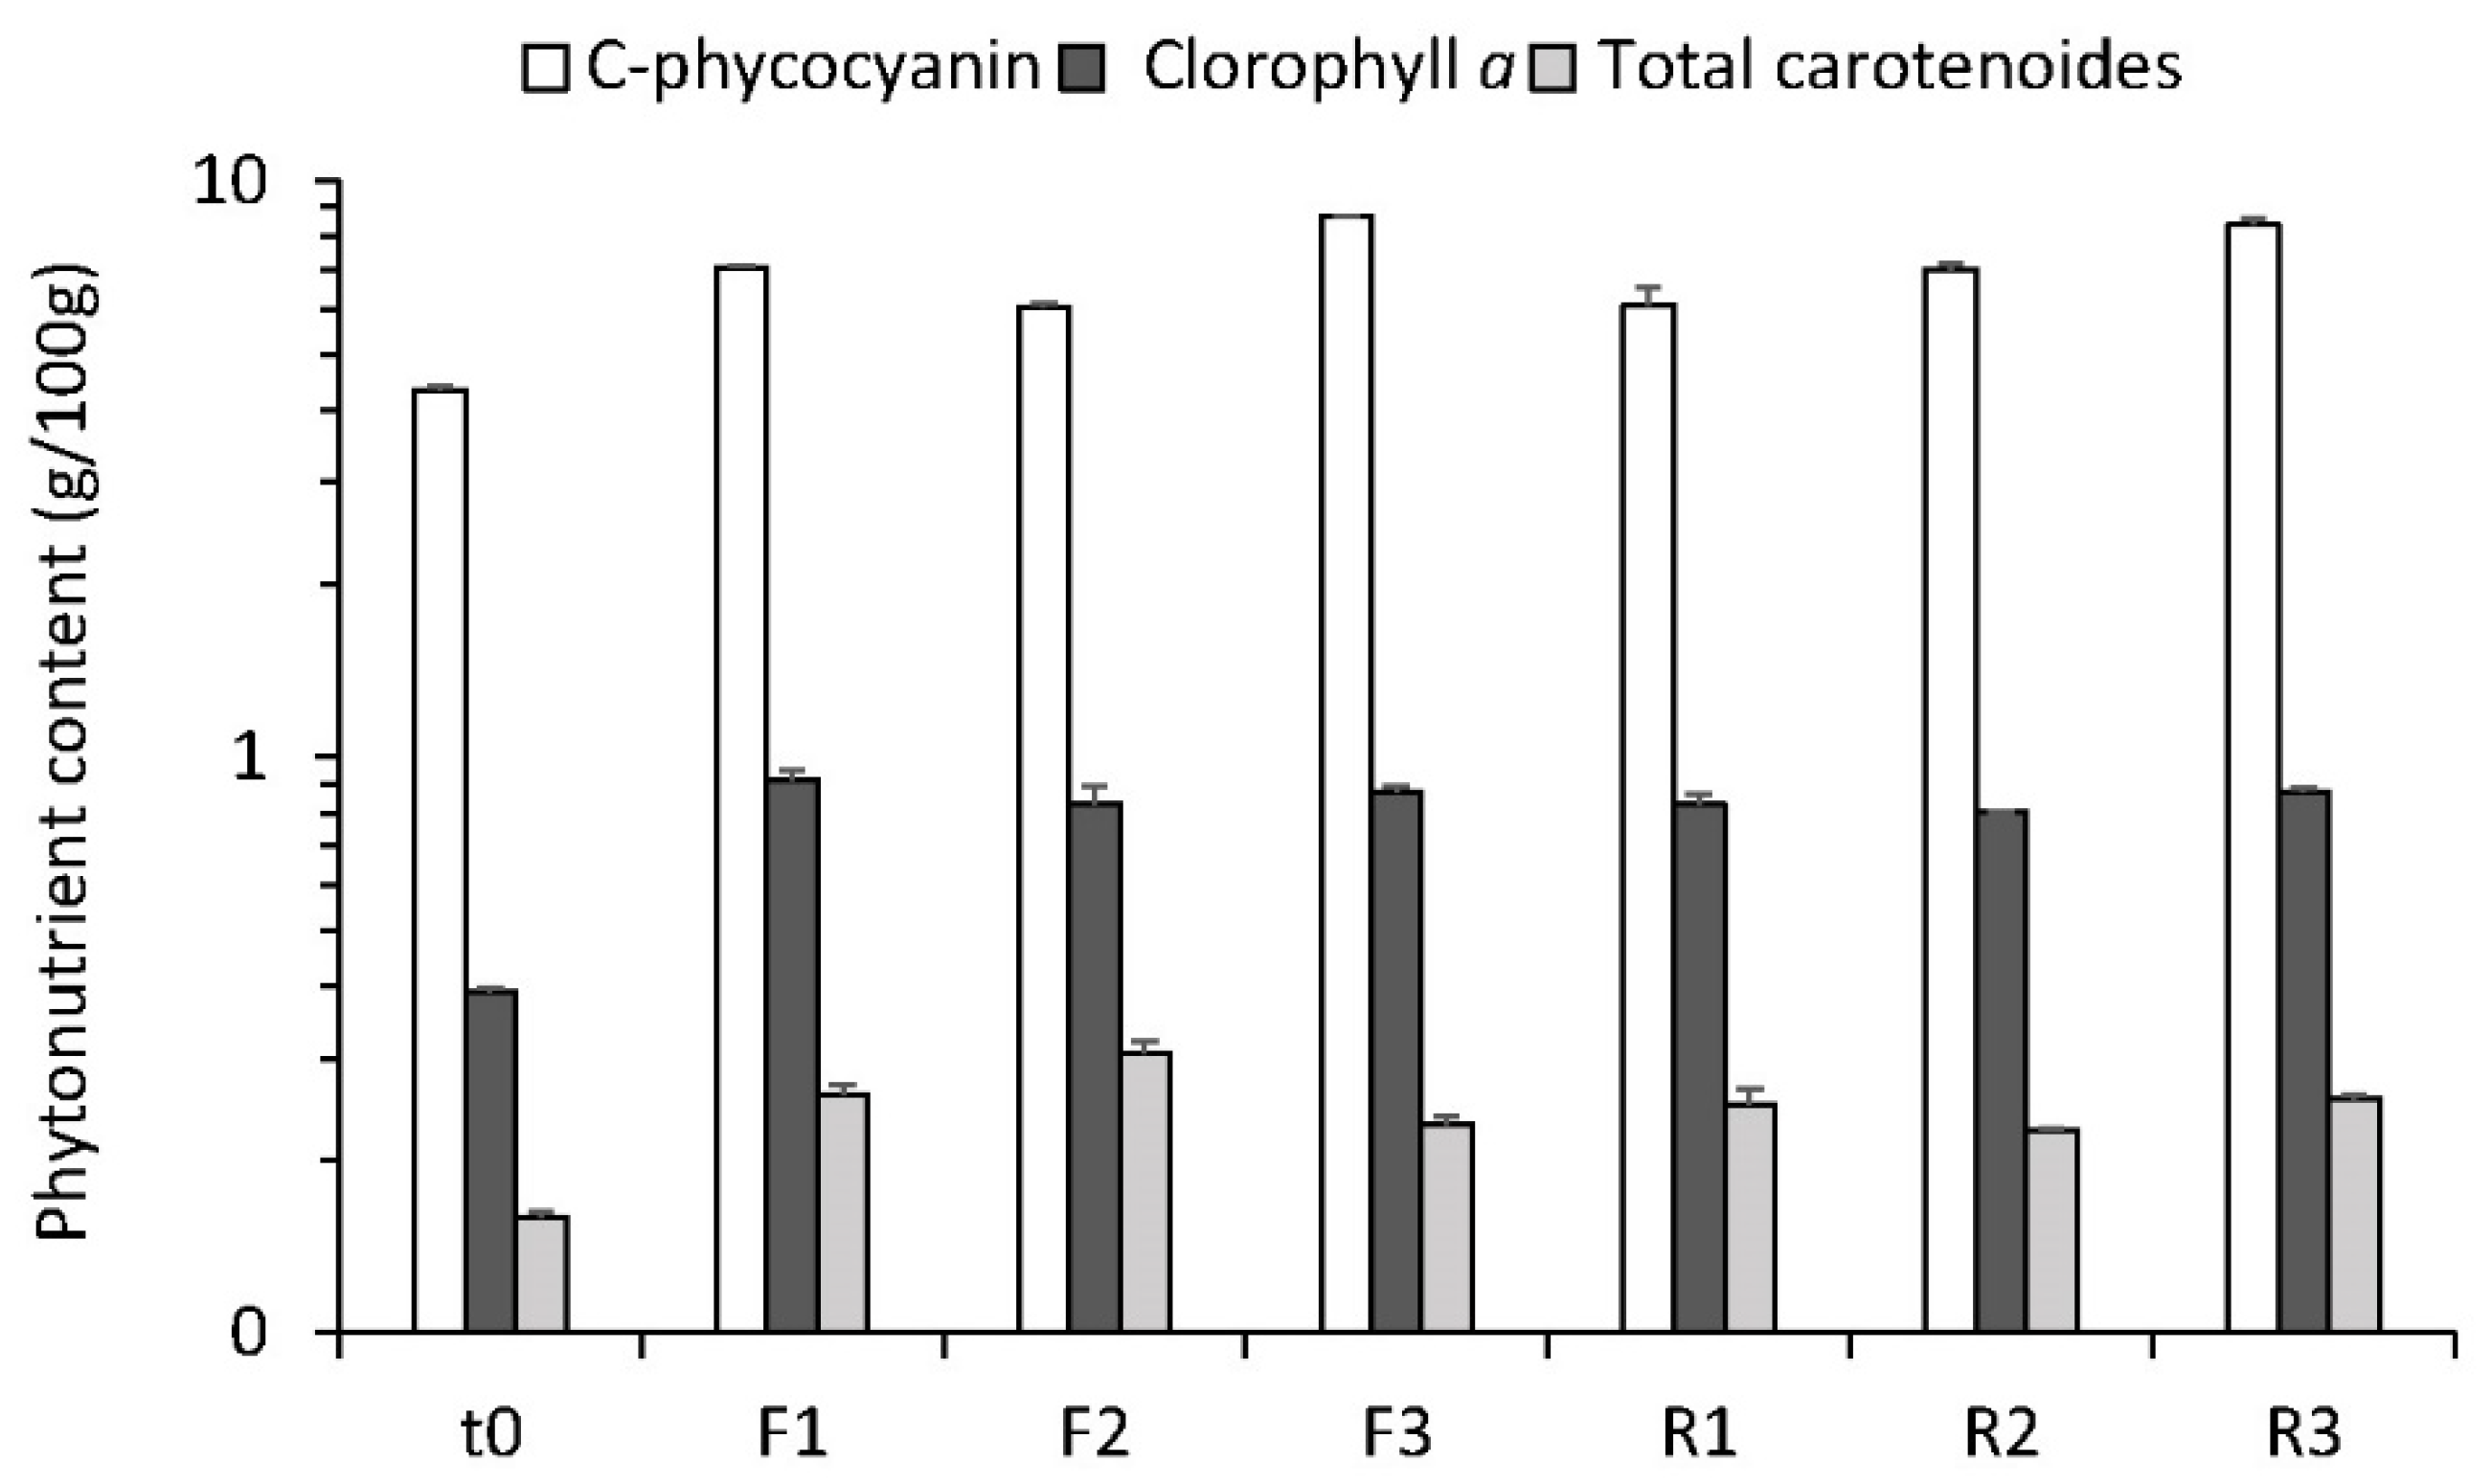
3.5. Biomass Profile and Quality

All the analyses on the freeze-dried, vacuum-packed biomass collected at the different cultivation times are reported in Table S2: Biomass composition and quality. Sample t0, harvested at the beginning of the experiment, was excluded from calculations and statistical analysis.
The Canarian strain of A. platensis BEA 1257B cultivated under the outlined culture conditions, showed a protein content ranging between 58.5% and 67.9% (overall mean value: 62.5 ± 2.9%), while crude lipids and total carbohydrates varied between 3.8% and 8.3%, and 10.9% and 19.2%, respectively (Figure 2 and Figure A2, Appendix B). The nitrogen-to-protein conversion factor of 6.25 used in this study (see Section 2.4) allows for a direct comparison of the A. platensis BEA 1257B protein content with other Arthrospira in literature, as this value has been consistently applied for protein determination in Arthrospira-based commercial products [72]. However, lower conversion factors of 4.78 and 5.95 have been proposed for marine microalgae and cyanobacteria [72], and the first one was recently used for protein quantification in Chlamydomonas reinhardtii, Chlorella and Spirulina [73]. The use of different nitrogen-to-protein conversion factors among several authors could result in different protein contents among distinct studies, even when real differences in the microalgal biomass do not necessarily subsist. The same consideration is also valid for the total carbohydrate content when determined by a difference like that in this study (see Section 2.4) and in other works [23,48,73], as the obtained value directly depends on the determined protein content. The standardization of analytical procedures, and the development of rapid, efficient and reliable methods for accurate and simultaneous quantification of analytical parameters in microalgal biomass even under high concentrations of sodium chloride [74] is a matter of urgency for both technicians and policymakers. Given this premise, protein, crude lipids and total carbohydrate contents of A. platensis BEA 1257B are consistent with the high-quality Arthrospira powders available in the market [12,17,18,75]. Moreover, taking into account the different nitrogen-to-protein conversion used in this study (6.25) with respect to [73] (4.78), protein and total carbohydrate contents of A. platensis BEA 1257B are comparable with those determined for lyophilized samples of the GRAS-certified green microalga C. reinhardtii, whereas lipid content is approximately four times lower [73]. While protein content in this study did not vary significantly between F and R phases, indicating high protein synthesis for this A. platensis strain under different culture conditions, regardless of the medium recycling and the treatments applied to control biological contamination (see Section 3.4), crude lipids and total carbohydrates (lipids mean value: 7.4 ± 0.7% for F and 4.2 ± 0.4% for R phase; carbohydrates mean value: 11.7 ± 0.9% for F and 17.2 ± 1.6% for R phase; Figure 2) showed an opposite trend in their reciprocal abundance (r = −0.90; p < 0.05), being significantly higher in F and R phase, respectively (p < 0.01). Production of lipids and carbohydrates in microalgae and cyanobacteria depends on a wide range of abiotic and biotic factors (e.g., species, nutrient regimen, salinity, light intensity, temperature, pH and interactions with other microorganisms) [19,45]. The decrease in the lipid content in this study may be related to the higher pH values maintained in the culture at the R phase, which was previously reported for Chlamydomonas sp. grown at different pH under laboratory conditions [76]. Moreover, the lower solar irradiation energy available during the R with respect to the F phase (see Section 3.1 and Table A1, Appendix A) may have driven carbon allocation toward biosynthesis of less energy demanding compounds (i.e., carbohydrates over lipids) [77], although the exact mechanisms underlying carbon partitioning in microalgae and cyanobacteria are not yet completely resolved [78]. Additionally, elevated pH and/or recirculation of the culture medium may have led to partial nutrient limitation during R phase, possibly causing precipitation of some dissolved salts in the culture medium like phosphorous (see Section 3.2), whose depletion is often correlated with changes in the algal biochemical composition such as increasing in carbohydrate content [19,45,48,79]. The lipid and carbohydrate content trends observed in this study are in line with the results of a previous study on A. platensis cultures operated semi-continuously under different phosphate concentrations in laboratory conditions, in which phosphorous starvation caused a significant increase of the carbohydrate content in the algal biomass coupled with a lower amount of lipids [80]. This is a different behaviour in comparison with other microalgae that either accumulate both carbohydrates and lipids or exclusively lipids under P starvation [81,82]. It is known that inorganic phosphorous allosterically inhibits ADP-glucose pyrophosphorylase, i.e., the main enzyme that controls carbohydrates synthesis in microalgae and cyanobacteria [80,83], and that both phosphorous depletion and decrease in light availability can lead to a reduction of the available ATP. This directly implies less available energy for the anabolism of organic compounds, which influences preferential biosynthesis of carbohydrates over lipids, as already mentioned here above [77]. In this study, solar energy was lower during the R with respect to F phase (see before), and the medium used (Table 1) only contains 16 mg/L of P (vs. 90 mg/L of the full Zarrouk medium [79]). This P concentration in the culture medium would support A. platensis densities of about 1.3 g/L, assuming an average elemental content of 1.2% P in the dry biomass and a complete algal uptake of dissolved P [84,85]. Considering the maximum culture concentration of 1.26 g/L reached right at the beginning of the R experiment, and assuming a 20% of phosphorous precipitation [26], it is possible that A. platensis also metabolically responded to an external phosphorous limitation during the R phase, although intracellular P content was only slightly (not significantly) lower at the R phase compared to the F phase (see also Table 3). Moisture content in the biomass (overall mean value: 5.6 ± 1.0%; Figure 2) indicates satisfactory setting of the lyophilisation process parameters, since all the samples were within the recommendable value for Arthrospira-based powders (<7%; [7,12]). This is mandatory to reduce water activity and inhibit microbial proliferation in the product. Similarly, ash content (overall mean value: 11.7 ± 2.9%) was in the range of commercial Arthrospira (6.4–13%, [48,73]), while being 2.5 times higher than that reported in lyophilized biomass of C. reinhardtii [73]. The strong negative correlation between ash and protein content detected in this study (r = −0.95; p < 0.01), suggests the inclusion of an additional dewatering step such as pressing before drying of the biomass. This will further improve the final quality of the product i.e., increase in protein and decrease in ash content by a more efficient removal of residual salts mostly responsible for high ash content in the algal slurry [17,25,26]. Nevertheless, the ash content in this study is lower than in dried Arthospira harvested in natural lakes or cultivated in raceway systems set outdoors or under greenhouse conditions in other arid/semi-arid areas [23,25,48]. This is possibly because of the effective rinsing of the algal slurry [25,59], or thanks to the (more efficient) greenhouse protection from dust accumulation in the culture [86].
Phytonutrient content did not vary significantly between the experimental phases F and R, and was quite constant along the cultivation period (Figure 3 and Figure A3, Appendix B), which is in line with the biochemical composition consistency of the biomass in well-managed open production systems [18]. C-phycocyanin was the most abundant pigment (range: 6.0–8.7%, overall mean value: 7.2 ± 1.1%) as commonly found in this cyanobacterium [12], showing values consistent with those of commercial Arthrospira products [84,87]. The C-phycocyanin content reported here was positively correlated with the protein content (r = 0.81, p < 0.05), as confirmed by [54] in a study relating proximate composition and the amount of photosynthetic pigment in A. platensis over a diurnal scale. This finding is based on the fact that C-phycocyanin is the major phycobiliprotein of A. platensis [88], constituting more than 15% of the total proteins [84], which suggests that the determination of C-phycocyanin in the Canarian A. platensis strain BEA 1257B is a reliable proxy for monitoring the protein content over the time-course of the cultivation. On the other hand, chlorophyll a (overall mean value: 0.85 ± 0.04%) and total carotenoids content (overall mean value: 0.25 ± 0.03%) were lower than the values reported for other Arthrospira (1.2–1.4% and 0.4–0.6% for chlorophyll a and total carotenoids, respectively; [18,21,54,75]) and for the potential food supplement species C. reinhardtii [73], which depends on differences in species/strain physiology, environmental conditions and culture media [21,54,73]. Actually, the high C-phycocyanin to chlorophyll ratio obtained in this study open the possibilities for future investigations on the use of A. platensis BEA 1257B for production of the blue natural pigment, since aqueous extracts with low chlorophyll content would largely save time and energy along the purification process [11,89].
When considering the mineral profile of A. platensis BEA 1257B (Table 3), differences between the F and R phase were not observed (p > 0.05). The essential elements K and Na were the dominant species, representing about 1.8 and 1.5 g/100 g of the dried biomass on average, respectively, which is consistent with the general pattern and values reported for other Arthrospira spp. [17,18,45,73,75]. The high content of K makes A. platensis BEA 1257B an interesting candidate for human consumption, according to the World Health Organization guidelines promoting an increase of potassium intake from food (WHO 2012) [90]. On the other hand, the Na content, that is in the high range of commercial products, could be reduced by a more efficient removal of residual salts from sodium bicarbonate and sodium chloride in the algal slurry [14,26]. This would be performed in accordance with the WHO advice of decreasing sodium intake from food (WHO Guideline 2012) [91]. Interestingly P, Mg and Ca (≃500, 155 and 45 mg/100g, respectively), were in the low range of the previously reported Arthrospira [17,18,23,45,73,75], being more similar to freeze-dried natural biomass samples from an Ethiopian soda lake [48] and to batch cultivated C. reinhardtii under laboratory conditions [73]. High Mg and Ca content in the raw water used for commercial Arthrospira production is frequently reported [14,21,26]. The lower Mg and Ca content in this study might be linked to the low concentrations of this inorganic mineral in the desalinated water used for preparation of the culture medium (Table S1: Composition of the desalinated water used for cultivation), as also detected in Lake Chitu’s water [48,55]. At the same time, the lower P content in this study may be related to the lower P concentration in the medium used in this study with respect to the standard media [17].
Among trace metals, Fe was the most abundant (overall mean value: 64.4 ± 24.9 mg/100 g), Zn and B accounted for ≃2.5 mg/100 g individually, and Mn and Cu were slightly lower than 1 mg/100g (i.e., 0.8 mg/100 g each), which is in line with other Arthrospira powders [18,23,73,75,84]. Pb, Cr y Se were present in nearly all the samples at concentrations of <0.06, <0.02, and <0.02 mg/kg, respectively. The Pb content in A. platensis BEA 1257B is quite significantly lower than the amount reported on a commercial Spirulina powder (2.97 ± 0.20 mg/kg), while being similar to the content determined in laboratory-grown C. reinhardtii (0.09 ± 0.00 mg/kg) [73]. On the other hand, the very low content of Se in A. platensis BEA 1257B is in line with the analytical results of mineral composition on microalgal biomasses reported by [73], which found lack of Se in Spirulina and Chlorella commercial powders. By contrast, 10 mg/kg of Se were detected in C. reinhardtii cultivated under laboratory conditions in the same study, which would be enough to cover the daily recommendation of 55 µg with a daily intake of 5.50 g of dry algal biomass [73]. Mo and Cd were retrieved only in two samples with concentrations <0.07 and <0.05 mg/kg, while Ni, Co, As and Hg were under the detection limit in all the samples (Table 3 and Table S2: Biomass composition and quality). The highest Cd content determined in this study (0.04 ± 0.00 mg/kg, sample F3) is lower than that determined in one Spirulina and Chlorella commercial powder (0.06 ± 0.00 and 0.19 ± 0.00 mg/kg, respectively), while being four times higher than the amount quantified in C. reinhardtii (0.01 ± 0.00) [73]. Moreover, the lack of As in A. platensis BEA 1257B lyophilized biomass (i.e., As <0.01 detection limit in all the samples) was in contrast with samples of Spirulina and Chlorella cultivated outdoor (0.89 ± 0.06 and 0.85 ± 0.03 mg/kg, respectively), while being more in line with the low amount detected in lyophilized C. reinhardtii cultivated under indoor conditions (0.02 ± 0.00 mg/kg) [73]. Based on these results, we can conclude that the dried samples collected during our experiment comply with worldwide Arthrospira food-quality standard [12,75] and with the EU regulation for heavy metals in food supplements (EC 629/2008) [92].
High microbiological quality was maintained throughout the experiment (Table 4). Total mesophilic flora was in the range of 103 colony forming unit per gram of biomass (range: 1.1–8.9 × 10³ cfu/g), while yeast and molds and the assayed bacterial pathogens (i.e., Enterobacteriaceae, total coliforms, Escherichia coli, Staphylococcus spp., Clostridium perfrigens and Salmonella spp.) were either below the detection limit of the analytical method or absent. Thus, microbiological characteristics of dried A. platensis BEA 1257B fulfill the food safety standards for microalgae production and human consumption ([12,75] and EC 2073/2005 [50]). The low heavy metal content and microbial load in the A. platensis BEA 1257B powder produced in this study indicate proper technical handling of the culture and of the algal product during all the downstreaming phases, i.e., harvesting, drying and packaging. In addition, it denotes adequate hygienic procedures and quality/selection of the raw materials [18], starting with adequate purity of the water and the inorganic salts used for culture medium preparation and replenishment. Actually, although the strong alkaline conditions suitable for thriving of Arthrospira largely limit bacterial proliferation and viability of pathogens [93], the use of water sources not properly controlled and/or treated for good microbial quality during the cultivation process represents a potential concern in terms of product safety, as alkaliphilic pathogens can survive in the cultures and ultimately contaminate the biomass [15,18,23]. In parallel, several studies under laboratory conditions have revealed the negative or even lethal impact of high concentrations of Fe, Cu, Zn, Ni and Cd added in the culture media on A. platensis growth and cellular contents, and the fast accumulation of these metals in the biomass at concentrations up to one order of magnitude higher than the control, due to the high biosorption capacity of Arthrospira cells [94,95,96]. In this study, protection of the greenhouse from external agents may have also played a beneficial role in maintaining low heavy metal content and microbial load during long-term cultivation [86], since soil and dust are potential vectors responsible for heavy metal accumulation and airborne pathogen presence in algal cultures [18,23].

4. Conclusions

Overall, the results of this study point out the technical feasibility of the long-term semi-continuous production of the Canarian Arthrospira platensis strain BEA 1257B in open raceway systems under greenhouse conditions in the subtropical and semi-desertic region of Pozo Izquierdo, Gran Canaria (Spain). High volumetric productivities and consistent biochemical and elemental composition of the biomass, which is a prerequisite for high-quality Spirulina production, were obtained by recycling the culture medium. This successful procedure allows for 300% reduction of the water demand and 15-fold cut down on the cost of the salts for medium preparation during one month of semi-continuous cultivation. Moreover, culture operation at 0.10 m culture depth contributes to curtail half of the water demand and the amount of salts for the initial make-up medium, halving in parallel biomass harvesting costs because of the higher density reached by the culture. The native Canarian strain of A. platensis is a good source of protein (>60%), potassium (1.8 g/100 g) and C-phycocyanin (7.2%), that makes it a promising strain for food purposes and also as a good source of natural pigments/antioxidants. The biochemical and mineral composition, and the microbiological characteristics of the dried product comply with European and worldwide quality and safety standards for human consumption, thanks to the low heavy metal content and absence of pathogens. This indicates, overall, a good maintenance of the culture and the proper handling of the algal product throughout the whole process, together with adequate hygienic protocols and satisfactory quality/selection of the raw materials. The final quality of the product can be further improved by reducing the ash (≃12%) and sodium content (1.5%) through optimization of the biomass washing and/or implementation of an additional dewatering step prior to drying. Biological contaminants can be completely controlled by high culture densities, high pH and high alkaline conditions, and they can be prevented by maintaining these conditions from the early stages of the culture. The occasional appearance of the green alga C. sorokiniana at a certain stage of the culture has been successfully solved with mild and cheap chemical treatments with ammonium sulfate. This procedure does not affect culture productivity and final quality of the product, and can avoid potential losses in biomass productivity up to 20% on an annual basis. Cultivation of A. platensis under greenhouse conditions in this subtropical, semi-desertic area reduce by 30% the evaporation extent, improve the final quality of the product, and maintain appreciable productivities year-round without the requirement for forced heating/cooling. Additional studies are being carried out that address economic viability and life-cycle assessment of the investigated processes. Moreover, further investigation is ongoing on more sustainable alternatives such as the use of seawater for A. platensis BEA 1257B cultivation.

Supplementary Materials

The following are available online at https://0-www-mdpi-com.brum.beds.ac.uk/article/10.3390/pr9081333/s1, Table S1: Composition of the desalinated water used for cultivation, Table S2: Biomass composition and quality,

Author Contributions

Conceptualization, investigation & original draft preparation, F.G.; Writing—review & editing, Z.G., M.V.; methodology, F.G. and Z.G.; Methodology, writing—review and editing P.A.C.J.A.; Writing—review and editing, funding acquisition, E.P. All authors have read and agreed to the published version of the manuscript.

Funding

This research was funded by the following projects: SEIDI resolution No 8/19, REBECA (Interreg MAC 2014–2020) MAC/1.1A/060.

Acknowledgments

We would like to thank Antera Martel Quintana and Carlos Almeida from Spanish Bank of Algae (BEA, Telde, Gran Canaria) for strain isolation and maintenance, and for the scientific support in the strain characterization in the framework of the Hub of Blue Biotechnology and Aquaculture: BIOASIS Gran Canaria (https://www.spegc.org/bioasis/ accessed on 29 July 2021); Special thanks goes to Sara Gonzalez, Emilio Rosario and Antonio Suarez Vega from ITC, for their hard work in the raceway maintenance and technical support in the greenhouse and in biomass processing, and to Macarena Gonzalez for laboratory assistance and clones isolation and maintenance. We also would like to thank Deullanela Díaz Hernández and Santiago Díaz Ruano from Renewable Energies Department (ITC) for the assistance in meteorological data collecting and processing.

Conflicts of Interest

The authors declare no conflict of interest.

Appendix A

Table A1. Summary of the environmental parameters of maximal and mean global horizontal solar irradiation, day length, and minimal, maximal and mean ambient temperature daily recorded outside the greenhouse. The values are presented as range and mean ± SD for each experimental phase (i.e., F phase: 12 Sep. to 11 Oct., and R phase: 11 Oct. to 11 Nov.) and for the whole cultivation period (Overall: 12 Sep.–11 Nov.).
Environmental ParametersF PhaseR PhaseOverall
RangeMean ± SDRangeMean ± SDRangeMean ± SD
Max daily G0 (W/m2)726.4–974.1868.9 ± 50.8 *449.6–983.8802.8 ± 104.2 *449.6–983.8837.0 ± 87.0
Mean daily G0 (W/m2)80.3–274.8241.3 ± 35.6 *79.2–222.2179.0 ± 36.7 *79.2–274.8209.6 ± 47.6
Daylength (h)11.7–12.412.0 ± 0.2 *10.9–11.611.2 ± 0.2 *10.9–12.411.6 ± 0.5
Min daily T (°C)17.9–22.921.4 ± 1.0 *18.1–22.920.3 ± 1.4 *17.9–22.920.8 ± 1.3
Max daily T (°C)24.6–29.125.9 ± 1.023.1–30.725.4 ± 2.023.1–30.725.6 ± 1.6
Mean daily T (°C)22.1–25.323.3 ± 0.6 *20.7–25.822.5 ± 1.4 *20.7–25.822.9 ± 1.1
* For each parameter, indicates differences at the significant level p < 0.05 (Student’s t-test) with respect to the other experimental phase.
Figure A1. Minimal, maximal and mean outdoor ambient temperature (T, °C), maximal and mean global horizontal solar irradiation (G0, W/m2), and day length in the function of the time-course of the semi continuous cultivation of A. platensis BEA 1257B in the 8000 L raceway pond inside the greenhouse (12 Sep. to 11 Oct. 2019). The environmental parameters were automatically recorded daily outside the greenhouse.
Processes 09 01333 g0a1

Appendix B

Table A2. Harvesting efficiency (HE, % of the biomass retained from the filter), dry content (slurry density, % DW), and the concentration factor (CF and CFloss) of the harvested algal slurry after single-stage 40 µm filtration (Filtra® model FTI-0800), compared to the culture concentration at the time of harvesting (Cx, g/L) for A. platensis BEA 1257B in the 8000 L raceway pond inside the greenhouse.
Experimental PhaseCycle NoHarvest (Day)Cx (g/L DW)HE (%)Slurry Density (% DW)CFCFloss
F phase160.60 ± 0.01074.4 ± 4.710.0 ± 0.15166.1 ± 2.4123.6 ± 1.8
2130.86 ± 0.01778.0 ± 3.810.3 ± 0.21120.5 ± 2.394.0 ± 1.8
3201.04 ± 0.01280.4 ± 3.89.5 ± 0.0990.9 ± 0.873.1 ± 0.6
4291.26 ± 0.04382.1 ± 2.89.0 ± 0.1271.6 ± 1.158.7 ± 0.7
Cumulative F1–4 0.94 ± 0.2878.7 ± 3.39.7 ± 0.687.4 ± 28.1112.3 ± 41.1
Table A3. Evolution in terms of presence/absence of the ciliate Schmidingerothrix sp. and the chlorophyte C. sorokiniana in the A. platensis BEA 1257B culture in the 8000 L raceway pond inside the greenhouse. Time when the mild treatments i.e., CO2 stop, batch addition of sodium bicarbonate (NaHCO3) in the amount of 4 g per liter of culture in order to rise alkalinity, and batch addition of ammonium sulphate ((NH4)2SO4) at 1 mM concentration were applied to the culture is also reported.
Schmidingerothrix sp.C. sorokiniana
TimeDay 8Day 12
First detectionT (°C)23.425.3
pH9.569.82
Salinity12.312.9
Cx (g/L)0.54 ± 0.0290.83 ± 0.021
Chemical treatmentCO2 stopDay 12
Add. NaHCO3 (4 g/L)Day 13
Add. (NH4)2SO4 (1mM)Day 14, 20
Last detectionTimeDay 15Day 20 *
T (°C)25.325.0
pH9.879.88
Salinity12.112.8
Cx (g/L)0.75 ± 0.0100.88 ± 0.007
* Starting from day 21 onwards, single cells of C. sorokiniana were only sporadically retrieved in culture samples either collected at the bottom of the culture or sedimented overnight. Abbreviation: Add.—Addition.
Figure A2. Biomass proximate composition (as % of proteins, carbohydrates, lipids, ash and moisture) for samples of A. platensis BEA 1257B collected at the time of inoculation (t0), during the first phase (F phase, 12 Sep. to 11 Oct., samples F1, F2 and F3) and during the second phase of the experiment (R phase, 11 Oct. to 11 Nov., samples R1, R2 and R3) from the 8000 L raceway pond inside greenhouse during the long-term semi-continuous cultivation, individually. Data are presented as the mean of three technical replicates, with error bars representing the corresponding standard deviation (±SD). Legend: White graph bars—Proteins; Black graph bars—Lipids; Gray graph bars—Carbohydrates; Light gray graph bars—Ash; Dark gray graph bars—Moisture.
Processes 09 01333 g0a2
Figure A3. Phytonutrient content (as % of C-phycocyanin, chlorophyll a, and total carotenoids) for samples of A. platensis BEA 1257B biomass collected at the time of inoculation (t0), during the first phase (F phase, 12 Sep. to 11 Oct., samples F1, F2 and F3) and during the second phase of the experiment (R phase, 11 Oct. to 11 Nov., samples R1, R2 and R3) from the 8000 L raceway pond inside greenhouse during the long-term semi-continuous cultivation, individually. Data are presented as the mean of three technical replicates, with error bars representing the corresponding standard deviation (±SD). Legend: White graph bars—C-phycocyanin; Black graph bars—Chlorophyll a; Gray graph bars—Total carotenoids.
Processes 09 01333 g0a3

References

  1. Alexandratos, N.; Bruinsma, J.; Alexandratos, N.; Bruinsma, J. World Agriculture towards 2030/2050: The 2012 Revision; FAO: Rome, Italy, 2012. [Google Scholar] [CrossRef]
  2. Rosenzweig, C.; Elliott, J.; Deryng, D.; Ruane, A.C.; Müller, C.; Arneth, A.; Boote, K.J.; Folberth, C.; Glotter, M.; Khabarov, N.; et al. Assessing Agricultural Risks of Climate Change in the 21st Century in a Global Gridded Crop Model Intercomparison. Proc. Natl. Acad. Sci. USA 2014, 111, 3268–3273. [Google Scholar] [CrossRef] [Green Version]
  3. Muller, A.; Schader, C.; El-Hage Scialabba, N.; Brüggemann, J.; Isensee, A.; Erb, K.-H.; Smith, P.; Klocke, P.; Leiber, F.; Stolze, M.; et al. Strategies for Feeding the World More Sustainably with Organic Agriculture. Nat. Commun. 2017, 8, 1290. [Google Scholar] [CrossRef] [Green Version]
  4. Muo, I.; Azeez, A.A. Green entrepreneurship: Literature review and agenda for future research. Int. J. Entrep. Knowl. 2019, 7, 17–29. [Google Scholar] [CrossRef]
  5. Lage, S.; Gojkovic, Z.; Funk, C.; Gentili, F. Algal Biomass from Wastewater and Flue Gases as a Source of Bioenergy. Energies 2018, 11, 664. [Google Scholar] [CrossRef] [Green Version]
  6. Maroušek, J.; Maroušková, A. Economic Considerations on Nutrient Utilization in Wastewater Management. Energies 2021, 14, 3468. [Google Scholar] [CrossRef]
  7. Belay, A. Biology and Industrial Production of Arthrospira (Spirulina). In Handbook of Microalgal Culture; Richmond, A., Hu, Q., Eds.; John Wiley & Sons, Ltd.: Hoboken, NJ, USA, 2013; pp. 339–358. ISBN 978-1-118-56716-6. [Google Scholar]
  8. Delrue, F.; Alaux, E.; Moudjaoui, L.; Gaignard, C.; Fleury, G.; Perilhou, A.; Richaud, P.; Petitjean, M.; Sassi, J.-F. Optimization of Arthrospira Platensis (Spirulina) Growth: From Laboratory Scale to Pilot Scale. Fermentation 2017, 3, 59. [Google Scholar] [CrossRef] [Green Version]
  9. Yuan, D.; Zhan, X.; Wang, M.; Wang, X.; Feng, W.; Gong, Y.; Hu, Q. Biodiversity and Distribution of Microzooplankton in Spirulina (Arthrospira) Platensis Mass Cultures throughout China. Algal Res. 2018, 30, 38–49. [Google Scholar] [CrossRef]
  10. Regulation (EU) 2015/2283 of the European Parliament and of the Council of 25 November 2015 on Novel Foods, Amending Regulation (EU) No 1169/2011 of the European Parliament and of the Council and Repealing Regulation (EC) No 258/97 of the European Parliament and of the Council and Commission Regulation (EC) No 1852/2001 (Text with EEA Relevance). Available online: https://eur-lex.europa.eu/legal-content/en/TXT/?uri=CELEX%3A32015R2283 (accessed on 29 July 2021).
  11. Marzorati, S.; Schievano, A.; Idà, A.; Verotta, L. Carotenoids, Chlorophylls and Phycocyanin from Spirulina: Supercritical CO2 and Water Extraction Methods for Added Value Products Cascade. Green Chem. 2020, 22, 187–196. [Google Scholar] [CrossRef]
  12. Becker, E.W. Microalgae for Human and Animal Nutrition. In Handbook of Microalgal Culture; Richmond, A., Hu, Q., Eds.; John Wiley & Sons, Ltd.: Hoboken, NJ, USA, 2013; pp. 461–503. ISBN 978-1-118-56716-6. [Google Scholar]
  13. De la Jara, A.; Ruano-Rodriguez, C.; Polifrone, M.; Assunçao, P.; Brito-Casillas, Y.; Wägner, A.M.; Serra-Majem, L. Impact of Dietary Arthrospira (Spirulina) Biomass Consumption on Human Health: Main Health Targets and Systematic Review. J. Appl. Phycol. 2018, 30, 2403–2423. [Google Scholar] [CrossRef]
  14. Jourdan, J.P. Manuel de Culture Artisanale de Spiruline; Edition 2 Feb 2018; Antenna Technologies: Geneva, Switzerland, 2018. [Google Scholar]
  15. Sili, C.; Torzillo, G.; Vonshak, A. Arthrospira (Spirulina). In Ecology of Cyanobacteria II; Whitton, B.A., Ed.; Springer: Dordrecht, The Netherlands, 2012; pp. 677–705. ISBN 978-94-007-3854-6. [Google Scholar]
  16. Borowitzka, M.A. Culturing Microalgae in Outdoor Ponds. In Algal Culturing Techniques; Elsevier: Amsterdam, The Netherlands, 2005; pp. 205–218. ISBN 978-0-12-088426-1. [Google Scholar]
  17. Soni, R.A.; Sudhakar, K.; Rana, R.S. Spirulina—From Growth to Nutritional Product: A Review. Trends Food Sci. Technol. 2017, 69, 157–171. [Google Scholar] [CrossRef] [Green Version]
  18. Belay, A. Spirulina (Arthrospira): Production and Quality Assurance. In Spirulina in Human Nutrition and Health; Belay, A., Gershwin, M., Eds.; CRC Press: Boca Raton, FL, USA, 2007; pp. 1–25. ISBN 978-1-4200-5256-5. [Google Scholar]
  19. Richmond, A. Biological Principles of Mass Cultivation of Photoautotrophic Microalgae. In Handbook of Microalgal Culture; Richmond, A., Hu, Q., Eds.; John Wiley & Sons, Ltd.: Hoboken, NJ, USA, 2013; pp. 169–204. ISBN 978-1-118-56716-6. [Google Scholar]
  20. Grima, E.M.; Acién Fernández, F.G.; Robles Medina, A. Downstream Processing of Cell Mass and Products. In Handbook of Microalgal Culture; Richmond, A., Hu, Q., Eds.; John Wiley & Sons, Ltd.: Hoboken, NJ, USA, 2013; pp. 267–309. ISBN 978-1-118-56716-6. [Google Scholar]
  21. Guidi, F.; Guerrini, F.; Algeri, M.; Marchiselli, S.; Pinna, A.; Mazzotti, M.; Emiliani, G.; Pistocchi, R. Year-Long Growth of High Quality Spirulina in a Pilot Plant. In Proceedings of the Riunione Annuale Gruppo Algologia, Società Botanica Italiana, Venezia, Italy, 5 November 2015. [Google Scholar]
  22. Lu, Y.-M.; Xiang, W.-Z.; Wen, Y.-H. Spirulina (Arthrospira) Industry in Inner Mongolia of China: Current Status and Prospects. J. Appl. Phycol. 2011, 23, 265–269. [Google Scholar] [CrossRef] [Green Version]
  23. Seghiri, R.; Kharbach, M.; Essamri, A. Functional Composition, Nutritional Properties, and Biological Activities of Moroccan Spirulina Microalga. J. Food Qual. 2019, 2019, 3707219. [Google Scholar] [CrossRef] [Green Version]
  24. Chen, J.; Wang, Y.; Benemann, J.R.; Zhang, X.; Hu, H.; Qin, S. Microalgal Industry in China: Challenges and Prospects. J. Appl. Phycol. 2016, 28, 715–725. [Google Scholar] [CrossRef]
  25. Jiménez, C.; Cossío, B.R.; Labella, D.; Xavier Niell, F. The Feasibility of Industrial Production of Spirulina (Arthrospira) in Southern Spain. Aquaculture 2003, 217, 179–190. [Google Scholar] [CrossRef]
  26. Belay, A. Mass Culture of Spirulina Outdoors—The Earthrise Farms Experience. In Spirulina Platensis (Arthrospira): Physiology, Cell-Biology and Biotechnology; CRC Press: Boca Raton, FL, USA, 1997; p. 252. ISBN 978-0-429-07994-8. [Google Scholar]
  27. Consejo Insular de Aguas de Gran Canaria. Cartografía temática, Precipitationes. Available online: http://www.aguasgrancanaria.com/cartografia/tematica/precipitaciones.php (accessed on 29 July 2021).
  28. Sadhwani, J.J.; Veza, J.M. Desalination and Energy Consumption in Canary Islands. Desalination 2008, 221, 143–150. [Google Scholar] [CrossRef]
  29. Tredici, M.R. Photobiology of Microalgae Mass Cultures: Understanding the Tools for the next Green Revolution. Biofuels 2010, 1, 143–162. [Google Scholar] [CrossRef]
  30. Dadheech, P.K.; Ballot, A.; Casper, P.; Kotut, K.; Novelo, E.; Lemma, B.; Pröschold, T.; Krienitz, L. Phylogenetic Relationship and Divergence among Planktonic Strains of Arthrospira (Oscillatoriales, Cyanobacteria) of African, Asian and American Origin Deduced by 16S–23S ITS and Phycocyanin Operon Sequences. Phycologia 2010, 49, 361–372. [Google Scholar] [CrossRef]
  31. Aiba, S.; Ogawa, T. Assessment of Growth Yield of a Blue-Green Alga, Spirulina Platensis, in Axenic and Continuous Culture. J. Gen. Microbiol. 1977, 102, 179–182. [Google Scholar] [CrossRef] [Green Version]
  32. Schlösser, U.G. SAG—Sammlung von Algenkulturen at the University of Göttingen Catalogue of Strains 1994. Bot. Acta 1994, 107, 113–186. [Google Scholar] [CrossRef]
  33. Richmond, A.; Grobbelaar, J.U. Factors Affecting the Output Rate of Spirulina Platensis with Reference to Mass Cultivation. Biomass 1986, 10, 253–264. [Google Scholar] [CrossRef]
  34. Béchet, Q.; Plouviez, M.; Chambonnière, P.; Guieysse, B. Environmental impacts of full-scale algae cultivation. In Microalgae-Based Biofuels and Bioproducts; Elsevier: Amsterdam, The Netherlands, 2017; pp. 505–525. ISBN 978-0-08-101023-5. [Google Scholar]
  35. Aouir, A.; Amiali, M.; Bitam, A.; Benchabane, A.; Raghavan, V.G. Comparison of the Biochemical Composition of Different Arthrospira Platensis Strains from Algeria, Chad and the USA. J. Food Meas. Charact. 2017, 11, 913–923. [Google Scholar] [CrossRef]
  36. Gojkovic, Ž.; Vílchez, C.; Torronteras, R.; Vigara, J.; Gómez-Jacinto, V.; Janzer, N.; Gómez-Ariza, J.-L.; Márová, I.; Garbayo, I. Effect of Selenate on Viability and Selenomethionine Accumulation of Chlorella Sorokiniana Grown in Batch Culture. Sci. World J. 2014, 2014, 1–13. [Google Scholar] [CrossRef] [Green Version]
  37. Cuellar-Bermudez, S.P.; Kilimtzidi, E.; Devaere, J.; Goiris, K.; Gonzalez-Fernandez, C.; Wattiez, R.; Muylaert, K. Harvesting of Arthrospira Platensis with Helicoidal and Straight Trichomes Using Filtration and Centrifugation. Sep. Sci. Technol. 2020, 55, 2381–2390. [Google Scholar] [CrossRef]
  38. Bischoff, H.W.; Bold, H.C. Phycological Studies IV. Some Soil Algae from Enchanted Rock and Related Algal Species; University of Texas Publication No. 6318; University of Texas: Austin, TX, USA, 1963; p. 95. [Google Scholar]
  39. Giraffa, G.; Rossetti, L.; Neviani, E. An Evaluation of Chelex-Based DNA Purification Protocols for the Typing of Lactic Acid Bacteria. J. Microbiol. Methods 2000, 42, 175–184. [Google Scholar] [CrossRef]
  40. Diez, B.; Pedros-Alio, C.; Marsh, T.L.; Massana, R. Application of Denaturing Gradient Gel Electrophoresis (DGGE) To Study the Diversity of Marine Picoeukaryotic Assemblages and Comparison of DGGE with Other Molecular Techniques. Appl. Environ. Microbiol. 2001, 67, 2942–2951. [Google Scholar] [CrossRef] [PubMed] [Green Version]
  41. Goff, L.J.; Moon, D.A.; Coleman, A.W. Molecular delineation of species and species relationships in the red algal Agarophytes Gracilariopsis and Gracilaria (gracilariales). J. Phycol. 1994, 30, 521–537. [Google Scholar] [CrossRef]
  42. Horwitz, W. Official Methods of Analysis of AOAC International, 17th ed.; Association of Official Analytical Chemists: Gaithersburg, MD, USA, 2000. [Google Scholar]
  43. Folch, J.; Lees, M.; Sloane Stanley, G.H. A Simple Method for the Isolation and Purification of Total Lipides from Animal Tissues. J. Biol. Chem. 1957, 226, 497–509. [Google Scholar] [CrossRef]
  44. James, C.S. Analytical Chemistry of Foods; Springer: Boston, MA, USA, 1995; ISBN 978-1-4613-5905-0. [Google Scholar]
  45. Michael, A.; Kyewalyanga, M.S.; Lugomela, C.V. Biomass and Nutritive Value of Spirulina (Arthrospira Fusiformis) Cultivated in a Cost-Effective Medium. Ann. Microbiol. 2019, 69, 1387–1395. [Google Scholar] [CrossRef]
  46. Boussiba, S.; Richmond, A.E. Isolation and Characterization of Phycocyanins from the Blue-Green Alga Spirulina Platensis. Arch. Microbiol. 1979, 120, 155–159. [Google Scholar] [CrossRef]
  47. Cunniff, P. Official Methods of Analysis of AOAC International, 16th ed.; Association of Official Analytical Chemists: Washington, DC, USA, 1995. [Google Scholar]
  48. Assaye, H.; Belay, A.; Desse, G.; Gray, D. Seasonal Variation in the Nutrient Profile of Arthrospira Fusiformis Biomass Harvested from an Ethiopian Soda Lake, Lake Chitu. J. Appl. Phycol. 2018, 30, 1597–1606. [Google Scholar] [CrossRef] [Green Version]
  49. Saleh, A.M.; Dhar, D.W.; Singh, P.K. Comparative Pigment Profiles of Different Spirulina Strains. Res. Biotechnol. 2011, 2, 8. [Google Scholar]
  50. Commission Regulation (EC) No 2073/2005 of 15 November 2005 on Microbiological Criteria for Foodstuffs (Text with EEA Relevance). Available online: https://eur-lex.europa.eu/eli/reg/2005/2073 (accessed on 29 July 2021).
  51. Hammer, O.; Harper, D.A.T.; Ryan, P.D. PAST: Paleontological Statistics Software Package for Education and Data Analysis. Palaeontol. Electron. 2001, 4, 9. [Google Scholar]
  52. Vonshak, A. (Ed.) Outdoor Mass Production of Spirulina: The Basic Concept. In Spirulina Platensis Arthrospira; CRC Press: Boca Raton, FL, USA, 1997; pp. 97–118. ISBN 978-0-429-07994-8. [Google Scholar]
  53. Göksan, T.; Zeker, A. The Growth of Spirulina Platensis in Different Culture Systems Under Greenhouse Condition. Turk. J. Biol. 2007, 31, 47–52. [Google Scholar]
  54. Hidasi, N.; Belay, A. Diurnal Variation of Various Culture and Biochemical Parameters of Arthrospira Platensis in Large-Scale Outdoor Raceway Ponds. Algal Res. 2018, 29, 121–129. [Google Scholar] [CrossRef]
  55. Ogato, T.; Kifle, D.; Fetahi, T.; Sitotaw, B. Evaluation of Growth and Biomass Production of Arthrospira (Spirulina) Fusiformis in Laboratory Cultures Using Waters from the Ethiopian Soda Lakes Chitu and Shala. J. Appl. Phycol. 2014, 26, 2273–2282. [Google Scholar] [CrossRef]
  56. Guieysse, B.; Béchet, Q.; Shilton, A. Variability and Uncertainty in Water Demand and Water Footprint Assessments of Fresh Algae Cultivation Based on Case Studies from Five Climatic Regions. Bioresour. Technol. 2013, 128, 317–323. [Google Scholar] [CrossRef]
  57. Ruiz, J.; Olivieri, G.; de Vree, J.; Bosma, R.; Willems, P.; Reith, J.H.; Eppink, M.H.M.; Kleinegris, D.M.M.; Wijffels, R.H.; Barbosa, M.J. Towards Industrial Products from Microalgae. Energy Environ. Sci. 2016, 9, 3036–3043. [Google Scholar] [CrossRef] [Green Version]
  58. Duran Quintero, C.; Ventura, A.; Lépine, O.; Pruvost, J. Eco-Design of Spirulina Solar Cultivation: Key Aspects to Reduce Environmental Impacts Using Life Cycle Assessment. J. Clean. Prod. 2021, 299, 126741. [Google Scholar] [CrossRef]
  59. De Jesus, C.S.; da Silva Uebel, L.; Costa, S.S.; Miranda, A.L.; de Morais, E.G.; de Morais, M.G.; Costa, J.A.V.; Nunes, I.L.; de Souza Ferreira, E.; Druzian, J.I. Outdoor Pilot-Scale Cultivation of Spirulina Sp. LEB-18 in Different Geographic Locations for Evaluating Its Growth and Chemical Composition. Bioresour. Technol. 2018, 256, 86–94. [Google Scholar] [CrossRef]
  60. Valaskova, K.; Ward, P.; Svabova, L. Deep Learning-Assisted Smart Process Planning, Cognitive Automation, and Industrial Big Data Analytics in Sustainable Cyber-Physical Production Systems. J. Self Gov. Manag. Econ. 2021, 9, 9. [Google Scholar] [CrossRef]
  61. Kliestik, T.; Nica, E.; Musa, H.; Poliak, M.; Mihai, E.-A. Networked, Smart, and Responsive Devices in Industry 4.0 Manufacturing Systems. Econ. Manag. Financ. Mark. 2020, 15, 23. [Google Scholar] [CrossRef]
  62. Foissner, W. Schmidingerothrix Extraordinaria Nov. Gen., Nov. Spec., a Secondarily Oligomerized Hypotrich (Ciliophora, Hypotricha, Schmidingerotrichidae Nov. Fam.) from Hypersaline Soils of Africa. Eur. J. Protistol. 2012, 48, 237–251. [Google Scholar] [CrossRef] [Green Version]
  63. Foissner, W.; Filker, S.; Stoeck, T. Schmidingerothrix Salinarum Nov. Spec. Is the Molecular Sister of the Large Oxytrichid Clade (Ciliophora, Hypotricha). J. Eukaryot. Microbiol. 2014, 61, 61–74. [Google Scholar] [CrossRef]
  64. Kim, C.-J.; Jung, Y.-H.; Ko, S.-R.; Kim, H.-I.; Park, Y.-H.; Oh, H.-M. Raceway Cultivation of Spirulina Platensis Using Underground Water. J. Microbiol. Biotechnol. 2007, 17, 853–857. [Google Scholar] [PubMed]
  65. Mendez, C.; Uribe, E. Control of Branchionus Sp. and Amoeba Sp. in Cultures of Arthrospira Sp. Lat. Am. J. Aquat. Res. 2012, 40, 553–561. [Google Scholar] [CrossRef]
  66. Salbitani, G.; Carfagna, S. Ammonium Utilization in Microalgae: A Sustainable Method for Wastewater Treatment. Sustainability 2021, 13, 956. [Google Scholar] [CrossRef]
  67. Wang, J.; Zhou, W.; Chen, H.; Zhan, J.; He, C.; Wang, Q. Ammonium Nitrogen Tolerant Chlorella Strain Screening and Its Damaging Effects on Photosynthesis. Front. Microbiol. 2019, 9, 3250. [Google Scholar] [CrossRef] [PubMed]
  68. Vandamme, D.; Foubert, I.; Fraeye, I.; Meesschaert, B.; Muylaert, K. Flocculation of Chlorella Vulgaris Induced by High PH: Role of Magnesium and Calcium and Practical Implications. Bioresour. Technol. 2012, 105, 114–119. [Google Scholar] [CrossRef] [PubMed] [Green Version]
  69. Śliwińska-Wilczewska, S.; Wiśniewska, K.; Konarzewska, Z.; Cieszyńska, A.; Barreiro Felpeto, A.; Lewandowska, A.U.; Latała, A. The Current State of Knowledge on Taxonomy, Modulating Factors, Ecological Roles, and Mode of Action of Phytoplankton Allelochemicals. Sci. Total Environ. 2021, 773, 145681. [Google Scholar] [CrossRef] [PubMed]
  70. El-Sheekh, M.M.; Daboor, S.M.; Swelim, M.A.; Mohamed, S. Production and Characterization of Antimicrobial Active Substance from Spirulina platensis. Iran. J. Microbiol. 2014, 6, 112–119. [Google Scholar]
  71. Hernandez-Corona, A.; Nieves, I.; Meckes, M.; Chamorro, G.; Barron, B. Antiviral Activity of Spirulina Maxima against Herpes Simplex Virus Type 2. Antivir. Res. 2002, 56, 279–285. [Google Scholar] [CrossRef]
  72. Templeton, D.W.; Laurens, L.M.L. Nitrogen-to-Protein Conversion Factors Revisited for Applications of Microalgal Biomass Conversion to Food, Feed and Fuel. Algal Res. 2015, 11, 359–367. [Google Scholar] [CrossRef] [Green Version]
  73. Darwish, R.; Gedi, M.A.; Akepach, P.; Assaye, H.; Zaky, A.S.; Gray, D.A. Chlamydomonas Reinhardtii Is a Potential Food Supplement with the Capacity to Outperform Chlorella and Spirulina. Appl. Sci. 2020, 10, 6736. [Google Scholar] [CrossRef]
  74. Zaky, A.S.; Pensupa, N.; Andrade-Eiroa, Á.; Tucker, G.A.; Du, C. A New HPLC Method for Simultaneously Measuring Chloride, Sugars, Organic Acids and Alcohols in Food Samples. J. Food Compos. Anal. 2017, 56, 25–33. [Google Scholar] [CrossRef]
  75. Koru, E. Earth Food Spirulina (Arthrospira): Production and Quality Standarts. In Food Additive; El-Samragy, Y., Ed.; IntechOpen: London, UK, 2012; ISBN 978-953-51-0067-6. [Google Scholar]
  76. Tatsuzawa, H.; Takizawa, E.; Wada, M.; Yamamoto, Y. Fatty Acid and Lipid Composition of the Acidophilic Green Alga Chlamydomonas Sp. J. Phycol. 1996, 32, 598–601. [Google Scholar] [CrossRef]
  77. Norici, A.; Bazzoni, A.M.; Pugnetti, A.; Raven, J.A.; Giordano, M. Impact of Irradiance on the C Allocation in the Coastal Marine Diatom Skeletonema marinoi Sarno and Zingone. Plant Cell Environ. 2011, 34, 1666–1677. [Google Scholar] [CrossRef] [PubMed]
  78. Johnson, X.; Alric, J. Central Carbon Metabolism and Electron Transport in Chlamydomonas Reinhardtii: Metabolic Constraints for Carbon Partitioning between Oil and Starch. Eukaryot. Cell 2013, 12, 776–793. [Google Scholar] [CrossRef] [Green Version]
  79. Markou, G.; Chatzipavlidis, I.; Georgakakis, D. Effects of Phosphorus Concentration and Light Intensity on the Biomass Composition of Arthrospira (Spirulina) Platensis. World J. Microbiol. Biotechnol. 2012, 28, 2661–2670. [Google Scholar] [CrossRef]
  80. Markou, G.; Chatzipavlidis, I.; Georgakakis, D. Carbohydrates Production and Bio-Flocculation Characteristics in Cultures of Arthrospira (Spirulina) Platensis: Improvements Through Phosphorus Limitation Process. BioEnergy Res. 2012, 5, 915–925. [Google Scholar] [CrossRef]
  81. Markou, G.; Angelidaki, I.; Georgakakis, D. Microalgal Carbohydrates: An Overview of the Factors Influencing Carbohydrates Production, and of Main Bioconversion Technologies for Production of Biofuels. Appl. Microbiol. Biotechnol. 2012, 96, 631–645. [Google Scholar] [CrossRef] [PubMed]
  82. Yaakob, M.A.; Mohamed, R.M.S.R.; Al-Gheethi, A.; Aswathnarayana Gokare, R.; Ambati, R.R. Influence of Nitrogen and Phosphorus on Microalgal Growth, Biomass, Lipid, and Fatty Acid Production: An Overview. Cells 2021, 10, 393. [Google Scholar] [CrossRef]
  83. Ballicora, M.A.; Iglesias, A.A.; Preiss, J. ADP-Glucose Pyrophosphorylase: A Regulatory Enzyme for Plant Starch Synthesis. Photosynth. Res. 2004, 79, 1–24. [Google Scholar] [CrossRef] [PubMed]
  84. Batista, A.P.; Gouveia, L.; Bandarra, N.M.; Franco, J.M.; Raymundo, A. Comparison of Microalgal Biomass Profiles as Novel Functional Ingredient for Food Products. Algal Res. 2013, 2, 164–173. [Google Scholar] [CrossRef] [Green Version]
  85. Ortega-Calvo, J.J.; Mazuelos, C.; Hermosin, B.; Saiz-Jimenez, C. Chemical Composition of Spirulina and Eukaryotic Algae Food Products Marketed in Spain. J. Appl. Phycol. 1993, 5, 425–435. [Google Scholar] [CrossRef]
  86. Gojkovic, Ž.; Guidi, F.; Bustamante, B.; Venuleo, M.; Assuncao, P.; Portillo, E. Scaling-up and Semi-Continuous Cultivation of Locally Isolated Marine Microalgae Tetraselmis striata in the Tropical Region of Gran Canary Island. Processes 2021, 9, 1326. [Google Scholar] [CrossRef]
  87. Campanella, L.; Crescentini, G.; Avino, P. Chemical Composition and Nutritional Evaluation of Some Natural and Commercial Food Productsbased on Spirulina. Analusis 1999, 27, 533–540. [Google Scholar] [CrossRef]
  88. Pignolet, O.; Jubeau, S.; Vaca-Garcia, C.; Michaud, P. Highly Valuable Microalgae: Biochemical and Topological Aspects. J. Ind. Microbiol. Biotechnol. 2013, 40, 781–796. [Google Scholar] [CrossRef] [Green Version]
  89. Lauceri, R.; Bresciani, M.; Lami, A.; Morabito, G. Chlorophyll a Interference in Phycocyanin and Allophycocyanin Spectrophotometric Quantification. J. Limnol. 2018, 77, 169–177. [Google Scholar] [CrossRef] [Green Version]
  90. World Health Organization. Guideline: Potassium Intake for Adults and Children; WHO: Geneva, Switzerland, 2012; ISBN 978-92-4-150482-9. [Google Scholar]
  91. World Health Organization. Guideline: Sodium Intake for Adults and Children; World Health Organization: Geneva, Switzerland, 2012; ISBN 978-92-4-150483-6. [Google Scholar]
  92. Commission Regulation (EC) No 629/2008 of 2 July 2008 Amending Regulation (EC) No 1881/2006 Setting Maximum Levels for Certain Contaminants in Foodstuffs (Text with EEA Relevance). Available online: https://eur-lex.europa.eu/legal-content/EN/ALL/?uri=CELEX%3A32008R0629 (accessed on 29 July 2021).
  93. Lopes, B.C.; Machado, E.C.; Rodrigues, H.F.; Leal, C.D.; de Araújo, J.C.; Teixeira de Matos, A. Effect of Alkaline Treatment on Pathogens, Bacterial Community and Antibiotic Resistance Genes in Different Sewage Sludges for Potential Agriculture Use. Environ. Technol. 2020, 41, 529–538. [Google Scholar] [CrossRef] [PubMed]
  94. Akbarnezhad, M.; Shamsaie Mehrgan, M.; Kamali, A.; Javaheri Baboli, M. Effects of Microelements (Fe, Cu, Zn) on Growth and Pigment Contents of Arthrospira (Spirulina) Platensis. Iran. J. Fish. Sci. 2019, 19, 653–668. [Google Scholar] [CrossRef]
  95. Balaji, S.; Kalaivani, T.; Rajasekaran, C. Biosorption of Zinc and Nickel and Its Effect on Growth of Different Spirulina Strains: Biosorption Potentials of Spirulina Strains. CLEAN Soil Air Water 2014, 42, 507–512. [Google Scholar] [CrossRef]
  96. Nalimova, A.A.; Popova, V.V.; Tsoglin, L.N.; Pronina, N.A. The Effects of Copper and Zinc on Spirulina Platensis Growth and Heavy Metal Accumulation in Its Cells. Russ. J. Plant Physiol. 2005, 52, 229–234. [Google Scholar] [CrossRef]
Figure 1. Biomass concentration (Cx, g/L; solid line), pH (dashed line) and salinity (dotted line) of the A. platensis BEA 1257B culture in function of the time-course of the semi-continuous cultivation in the 8000 L raceway pond inside greenhouse during the experimental phases F (12 Sep. to 11 Oct.) and R (11 Oct. to 11 Nov.). Vertical solid line indicates the end of the F phase and the beginning of the R phase. Each harvest (performed at the end of each semi-continuous cycle) is indicated with the number tag. There were four harvests in a 29-day period during F phase, and eight harvests in a 31-day period during R phase, i.e., 12 cumulative harvests in 60 days. Black arrows indicate times in which the biomass was collected for analysis: the three samples F1, F2 and F3 were collected during the F phase, while the three samples R1, R2 and R3 were collected during the R phase; sample t0 was collected at the beginning of the experiment and was excluded from calculations and statistical analysis.
Processes 09 01333 g001
Figure 2. Biomass average proximate composition (as % of proteins, carbohydrates, lipids, ash and moisture) for samples of A. platensis BEA 1257B collected during the first experimental phase (F phase, 12 Sep. to 11 Oct., samples F1, F2 and F3) and during the second phase of the experiment (R phase, 11 Oct. to 11 Nov., samples R1, R2 and R3) from the 8000 L raceway pond inside greenhouse during the long-term semi-continuous cultivation. The overall composition of the biomass is also reported. For each parameter, letters above bars indicate: a = significant difference with the F phase, b = significant difference with the R phase. Data are presented as the mean of three samples for F and R phases, and as the mean of six samples overall, with error bars representing the corresponding standard deviation (±SD). Legend: White graph bars—Proteins; Black graph bars—Lipids; Gray graph bars—Carbohydrates; Light gray graph bars—Ash; Dark gray graph bars—Moisture.
Processes 09 01333 g002
Figure 3. Average phytonutrient content (as % of C-phycocyanin, chlorophyll a, and total carotenoids) for samples of A. platensis BEA 1257B biomass collected at the first phase (F phase, 12 Sep. to 11 Oct., samples F1, F2 and F3) and at the second phase of the experiment (R phase, 11 Oct. to 11 Nov., samples R1, R2 and R3) from the 8000 L raceway pond inside greenhouse during the long-term semi-continuous cultivation. Overall phytonutrient content in the biomass is also reported. Data are presented as the mean of three samples for F and R phase, and as the mean of six samples for Overall, with error bars representing the corresponding standard deviation (±SD). Legend: White graph bars—F phase; Black graph bars—R phase; Gray graph bars—Overall experiment.
Processes 09 01333 g003
Table 1. Chemical composition of the culture media used for the maintenance of A. platensis BEA 1257B in growth chamber (Spirulina medium), and for the scaling-up and outdoor cultivation under greenhouse conditions (medium OUT). A fresh medium recipe was used during the experimental F phase (12-Sep. to 11-Oct.), whereas nutrient replenishment was applied during the R phase (11-Oct. to 11-Nov.).
ChemicalSpirulina Medium 1
(g/L)
Medium OUT 2 (g/L)Nutrient Replenishment 3
(g/kg of Algal DW)
NaHCO313.618-
Na2CO34.03--
NaNO32.5--
KNO3-21000
K2HPO40.5--
NH4H2PO4-0.0650
NaCl15-
K2SO41--
CaCl2·2H2O0.04--
MgSO4·7H2O0.20.1630
FeSO4·7H2O0.010.0052.5
EDTA0.084--
CO(NH2)2-0.01515
H3BO30.00286--
MnCl2·4H2O0.00181--
ZnSO4·7H2O0.0022--
Na2MoO4·2H2O0.00039--
CuSO4·5H2O0.00008--
CO(NO3)2·6H2O0.00005--
1 Medium recipe according to [31,32] with few modifications. 2 Medium recipe used in this study. 3 Nutrient replenishment recipe used in this study according to [14] with some modifications.
Table 2. Culture parameters of temperature (T), pH, salinity, evaporation rate (ER), initial culture concentration (Cx start), final culture concentration (Cx end) and volumetric productivity (Pvol) per each cycle of semi-continuous cultivation of the A. platensis BEA 1257B 8000 L raceway pond inside greenhouse. Cumulative values for F (12 Sep. to 11 Oct.) and R phase (12 Sep. to 11 Oct.) and for the overall experiment are also reported at the end of the table.
CycleTime (Days)T (°C)pHSalinity (g/L)ER (mm/Day)Cx Start (g/L DW)Cx End (g/L DW)Pvol (g/L/Day−1)
F phase10–624.9 ± 0.310.09 ± 0.3812.7 ± 0.53.5 ± 1.30.17 ± 0.0080.60 ± 0.0100.08 ± 0.002
26–1324.8 ± 0.89.61 ± 0.1912.3 ± 0.74.3 ± 0.60.37 ± 0.0020.86 ± 0.0170.07 ± 0.002
313–2025.2 ± 0.29.99 ± 0.2612.3 ± 0.73.3 ± 0.90.69 ± 0.0191.04 ± 0.0120.05 ± 0.002
420–2924.8 ± 1.510.26 ± 0.3313.8 ± 0.84.5 ± 1.00.88 ± 0.0071.26 ± 0.0430.04 ± 0.003
R phase529–3323.5 ± 1.110.75 ± 0.0412.4 ± 0.94.8 ± 0.91.11 ± 0.0111.25 ± 0.0110.04 ± 0.002
633–3523.0 ± 0.910.33 ± 0.1311.9 ± 0.44.0 ± 1.10.93 ± 0.0081.03 ± 0.0360.06 ± 0.004
735–3924.6 ± 1.610.57 ± 0.1012.0 ± 0.74.3 ± 0.70.64 ± 0.0130.87 ± 0.0180.06 ± 0.001
839–4223.1 ± 1.310.39 ± 0.2411.7 ± 0.33.1 ± 1.00.63 ± 0.0170.78 ± 0.0210.06 ± 0.002
942–4624.9 ± 2.210.51 ± 0.0811.7 ± 0.22.8 ± 0.60.62 ± 0.0090.88 ± 0.0110.07 ± 0.002
1046–4925.0 ± 2.610.50 ± 0.1011.7 ± 0.22.4 ± 1.50.60 ± 0.0160.79 ± 0.0260.06 ± 0.005
1149–5423.9 ± 0.510.68 ± 0.0612.0 ± 0.42.0 ± 1.20.63 ± 0.0200.89 ± 0.0080.06 ± 0.002
1254–6023.7 ± 0.410.69 ± 0.0511.6 ± 0.42.5 ± 0.70.61 ± 0.0280.90 ± 0.0370.05 ± 0.002
Cumul. F1–40–2924.9 ± 0.99.97 ± 0.38 *12.8 ± 0.9 *3.9 ± 1.0 *0.53 ± 0.320.94 ± 0.280.06 ± 0.016
Cumul. R5–1229–6024.2 ± 1.610.56 ± 0.16 *11.9 ± 0.5 *3.0 ± 1.1 *0.72 ± 0.190.93 ± 0.150.06 ± 0.010
Overall1–120–6024.6 ± 1.310.25 ± 0.4212.3 ± 0.83.5 ± 1.20.66 ± 0.250.93 ± 0.190.06 ± 0.012
* For each parameter, asterisk indicates differences at the significant level p < 0.05 (Student’s t-test) with respect to the other experimental phase. Abbreviation: Cumul.—Cumulative.
Table 3. Mineral composition (in mg/100 g), trace metals (in mg/100 g) and heavy metal content (in mg/kg) in A. platensis BEA 1257B biomass samples collected during the first phase (F phase, 12 Sep. to 11 Oct., samples F1, F2 and F3) and during the second phase of the experiment (R phase, 11 Oct. to 11 Nov., samples R1, R2 and R3) from the 8000 L raceway pond inside greenhouse. Overall content in the biomass is also reported. Data are presented as the mean ± SD of three samples for F and R phase, and as the mean ± SD of six samples overall.
ElementsF PhaseR PhaseOverall
Minerals (mg/100 g)K1704.4 ± 636.01839.2 ± 894.91771.8 ± 698.3
Na1580.8 ± 865.01490.7 ± 347.81535.7 ± 591.7
P542.1 ± 11.6472.3 ± 56.0507.2 ± 52.6
Mg163.0 ± 38.3146.0 ± 5.3154.5 ± 26.2
Ca43.7 ± 11.346.7 ± 11.545.2 ± 10.3
Trace elements (mg/100 g)Fe47.7 ± 8.381.0 ± 25.664.4 ± 24.9
Mn0.7 ± 0.20.8 ± 0.20.8 ± 0.2
Cu0.9 ± 0.10.8 ± 0.10.8 ± 0.1
Zn2.4 ± 0.62.3 ± 0.52.4 ± 0.5
B2.4 ± 1.62.5 ± 0.42.5 ± 1.1
Heavy metals (mg/kg)Se0.007 ± 0.0100.007 ± 0.0080.007 ± 0.008
Cr0.012 ± 0.0080.010 ± 0.0050.011 ± 0.006
Pb0.023 ± 0.0160.026 ± 0.0240.024 ± 0.018
Cd0.014 ± 0.0250.007 ± 0.0120.011 ± 0.018
Mo0.024 ± 0.032nd0.012 ± 0.027
Ni, Co, As, Hgndndnd
Table 4. Microbiological analysis of total mesophilic bacteria, yeasts and molds, and pathogenic bacteria in A. platensis BEA 1257B biomass samples collected during the time-course of the cultivation experiment from the 8000 L raceway pond inside greenhouse. Sample t0 was collected at the time of RW inoculation, while samples F1, F2 and F3 and samples R1, R2 and R3 were collected during the first phase (F phase, 12 Sep. to 11 Oct.) and the second phase of the experiment (R phase, 11 Oct. to 11 Nov.), respectively.
Microbiological Parameterst0F1F2F3R1R2R3
Total aerobic mesophilic flora (cfu/g)2.6 × 1031.1 × 1031.6 × 1037.4 × 1032.0 × 1032.3 × 1038.9 × 103
Yeasts and molds (cfu/g) <20 <20 <20
Enterobacteriaceae (cfu/g) <100 <100 <100
Total coliforms (cfu/g) <10 <10 <10
Escherichia coli (cfu/g) <10 <10 <10
Staphylococcus spp. (cfu/g) <10 <10 <10
Clostridium perfrigens (cfu/g) <10 <10 <10
Salmonella spp. (Abs/25g) nd nd nd
Publisher’s Note: MDPI stays neutral with regard to jurisdictional claims in published maps and institutional affiliations.

