
Hepatic mRNA Expression Levels of the Oncogenes Alpha-Fetoprotein and Osteopontin as Diagnostics for Liver Cancer in a Murine Model of Diet-Induced Non-Alcoholic Steatohepatitis

Abstract
:1. Introduction
2. Material and Methods
2.1. Animal Model
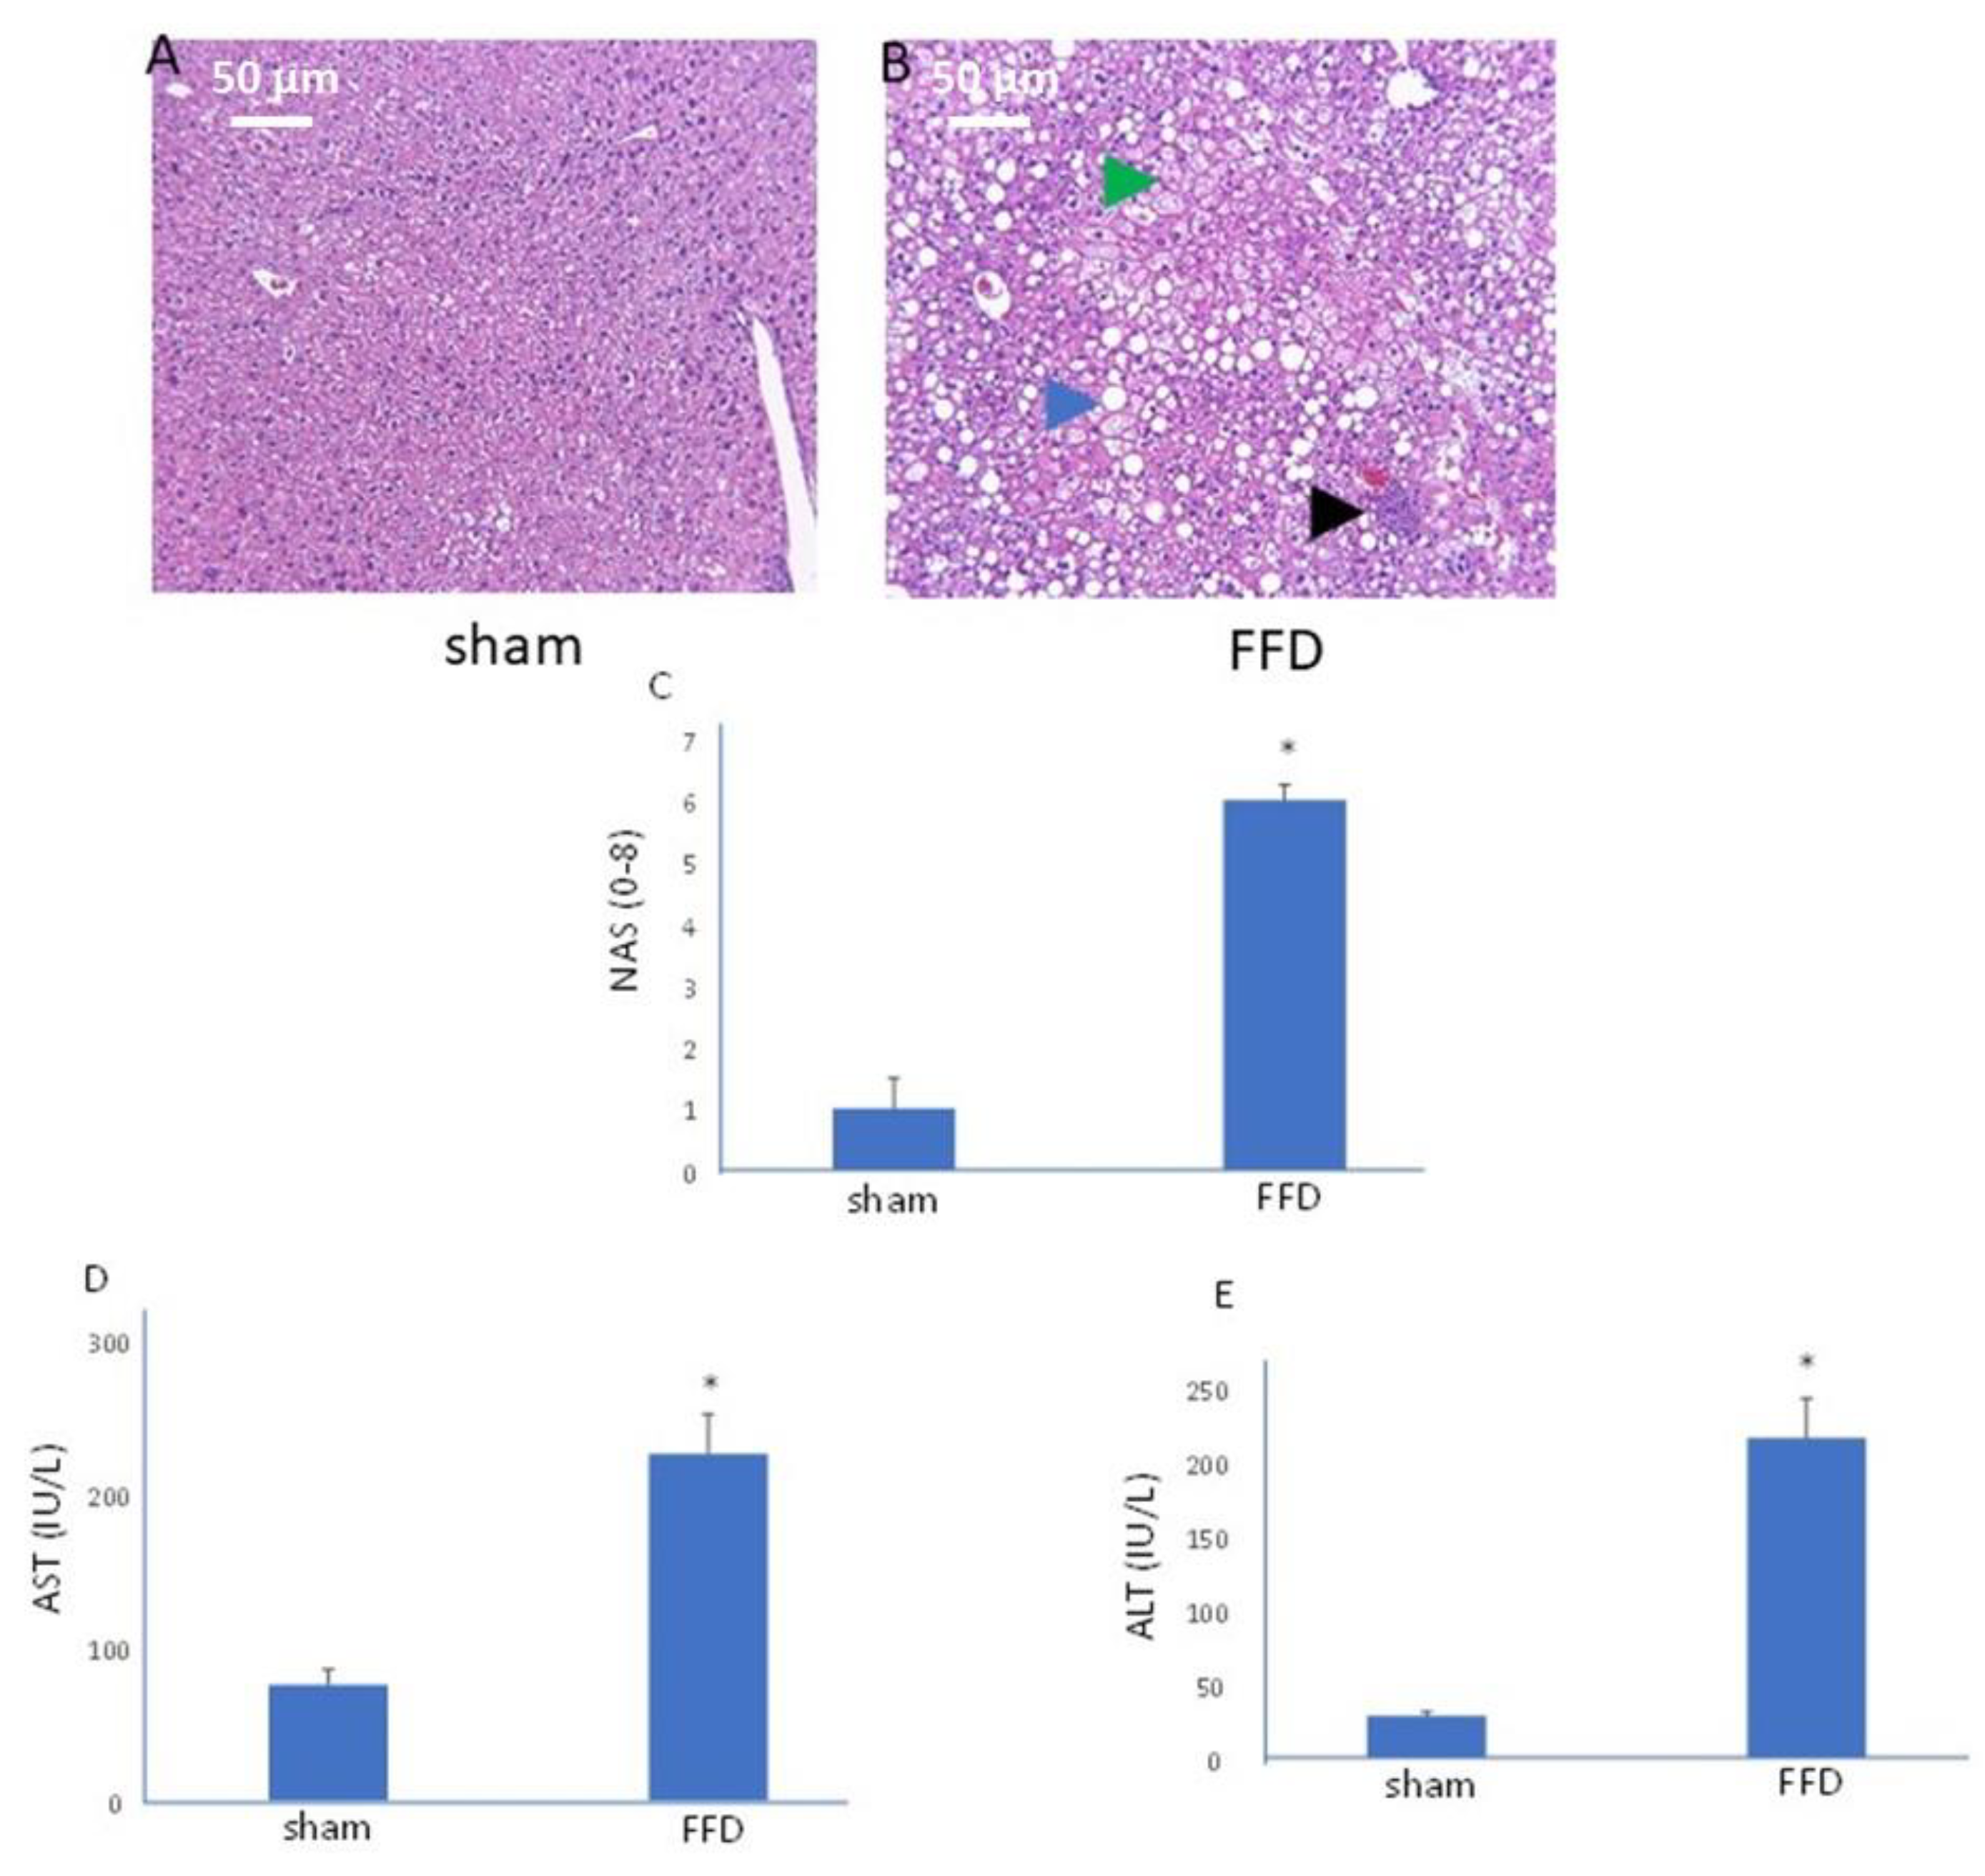
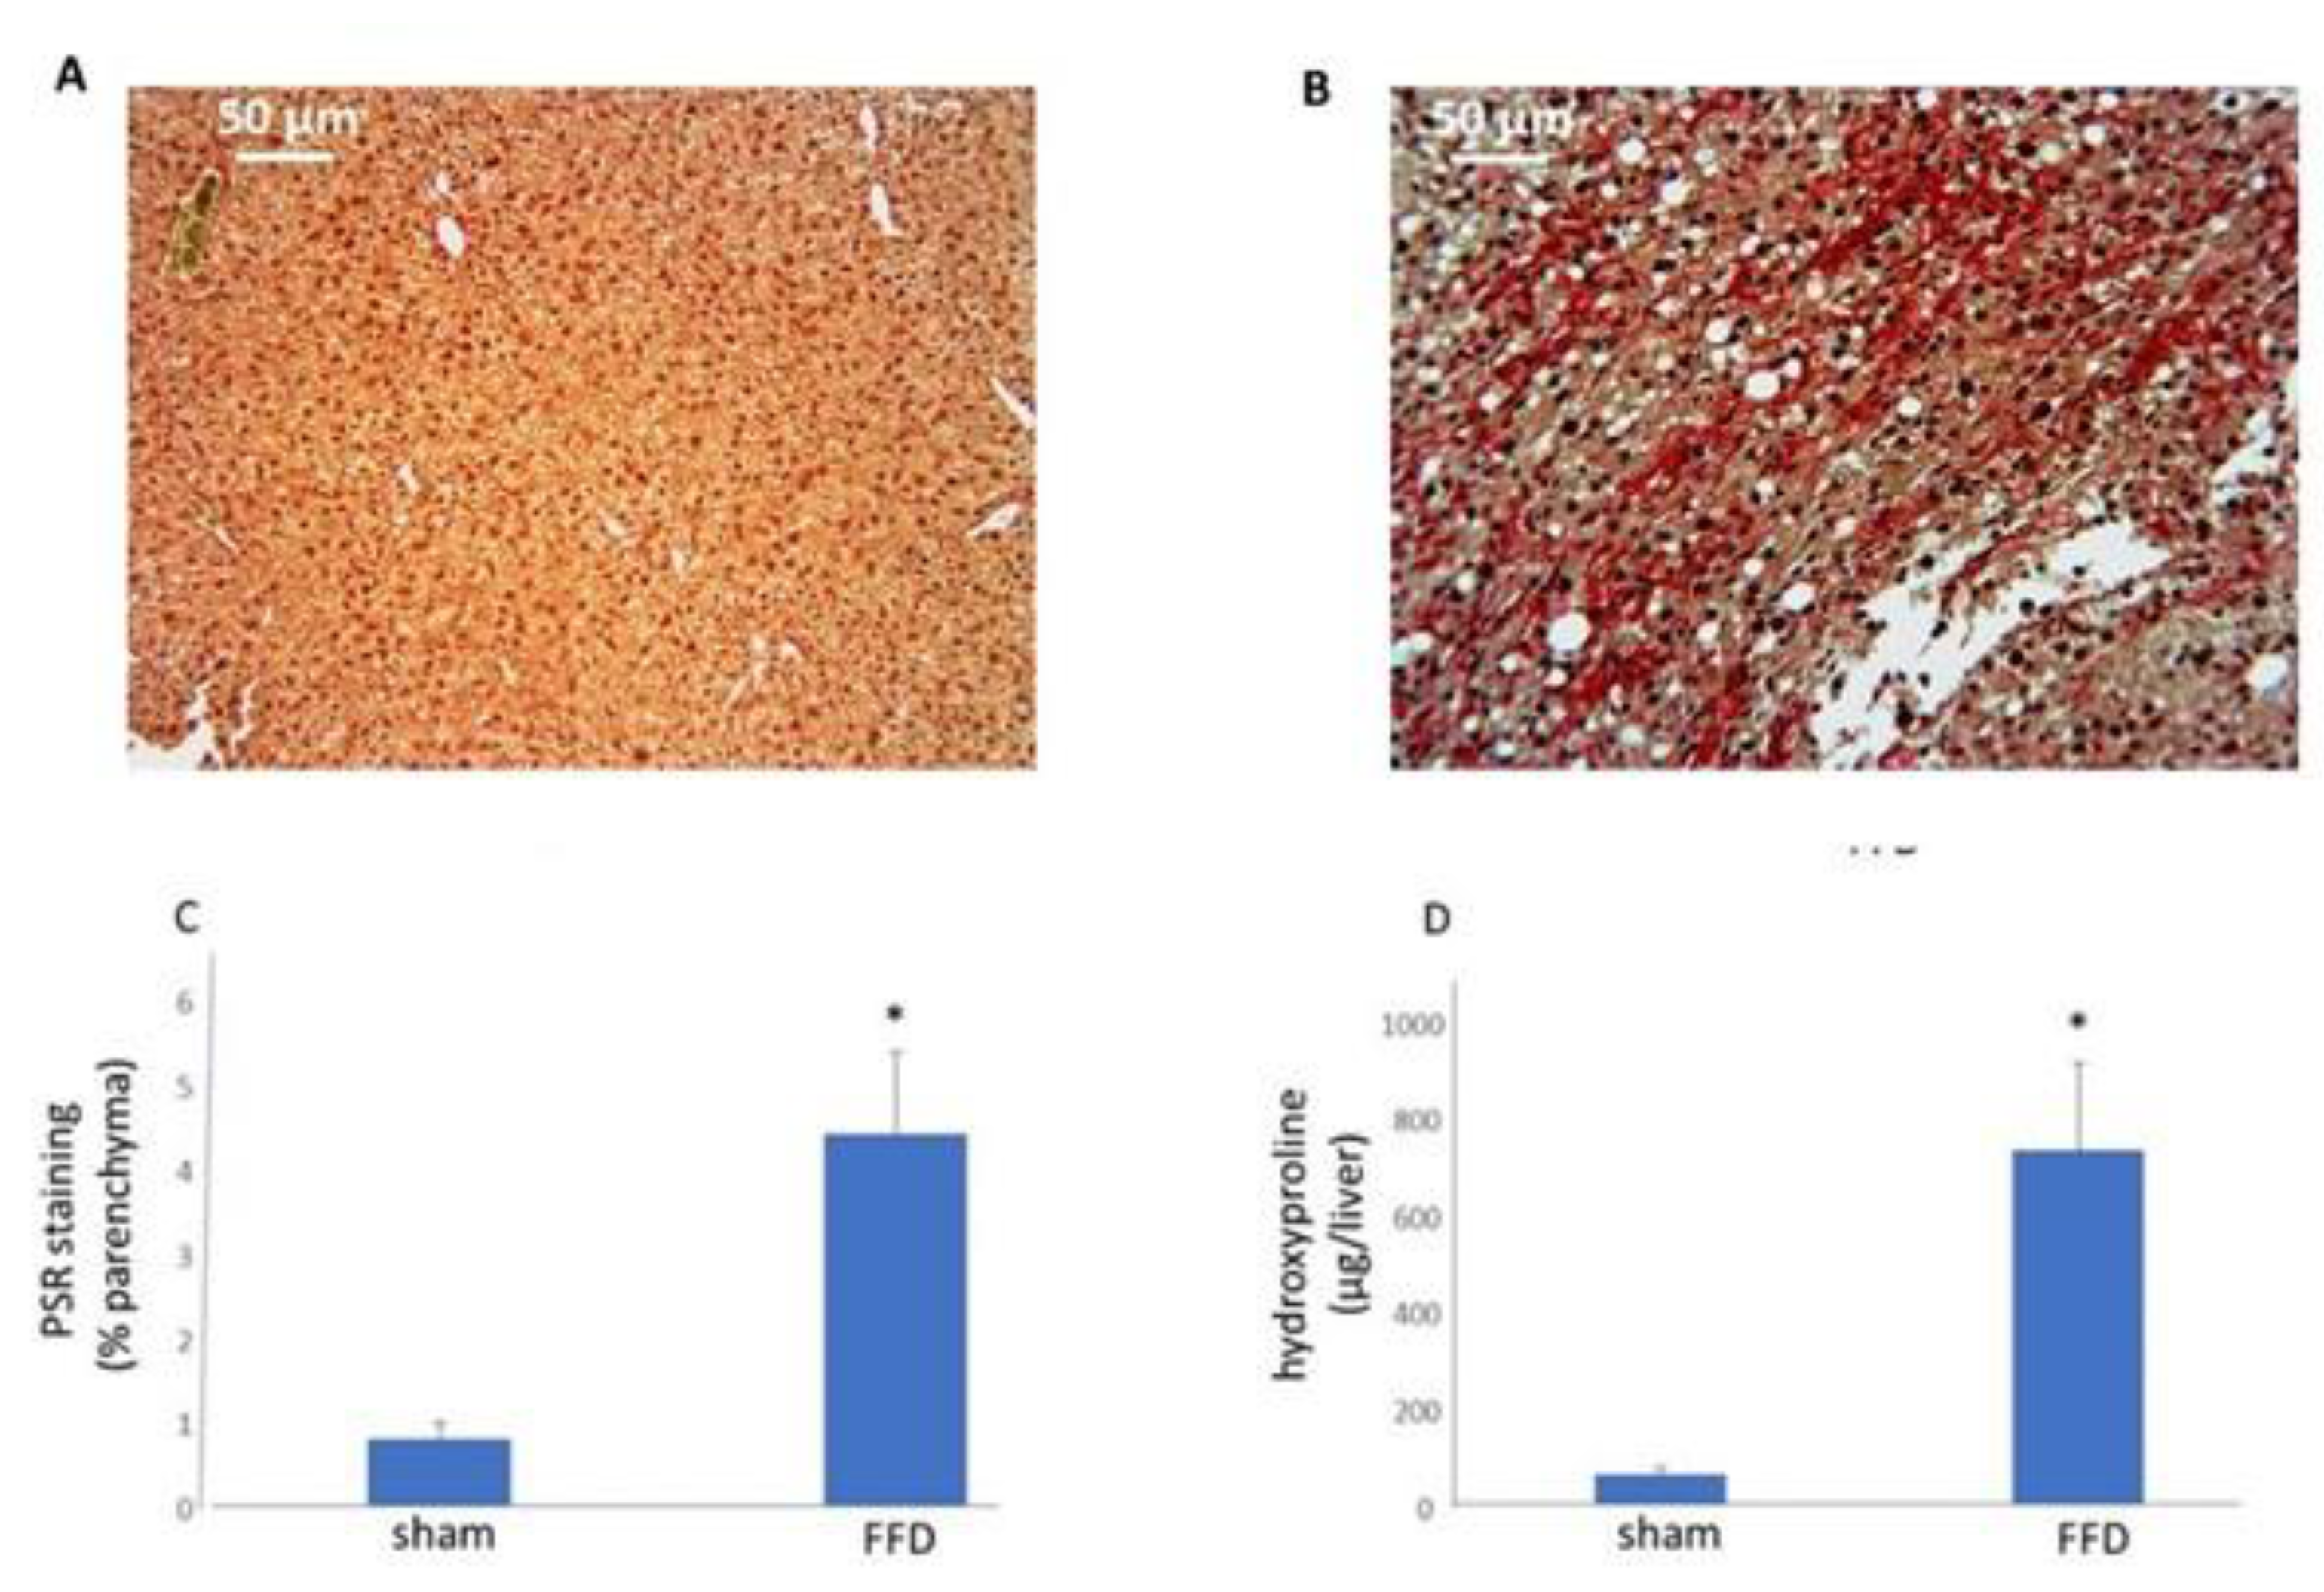
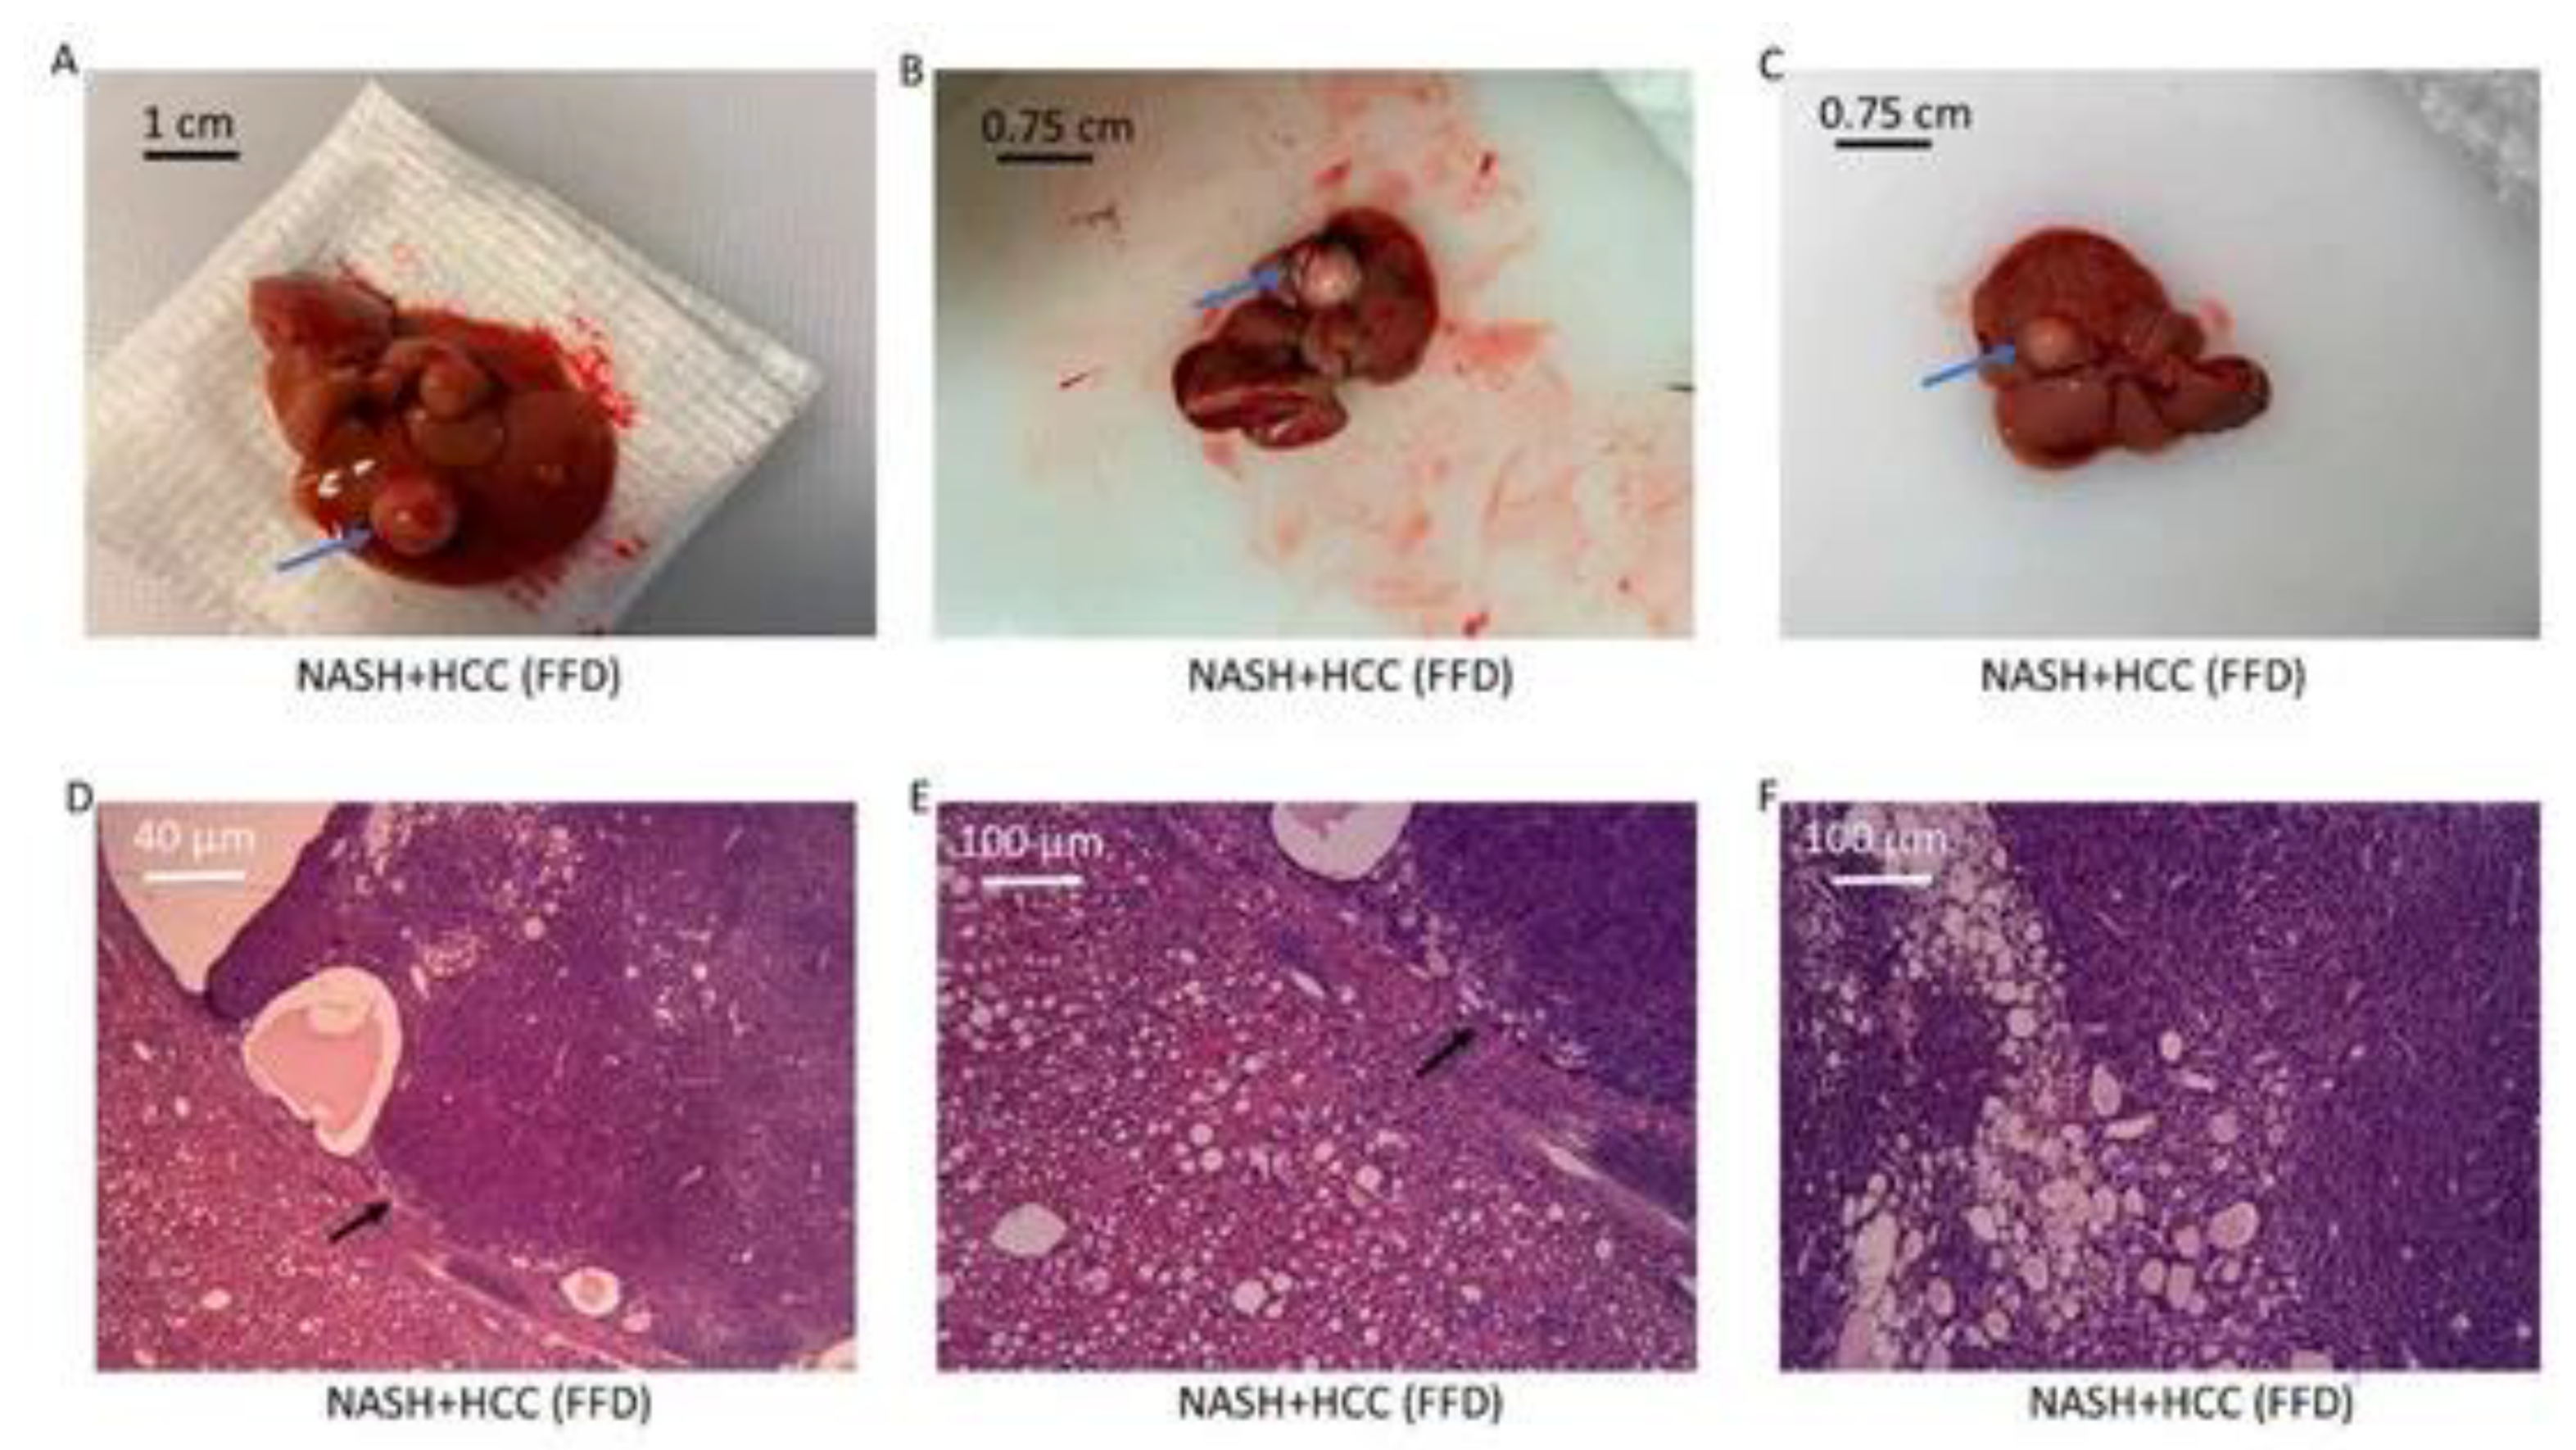
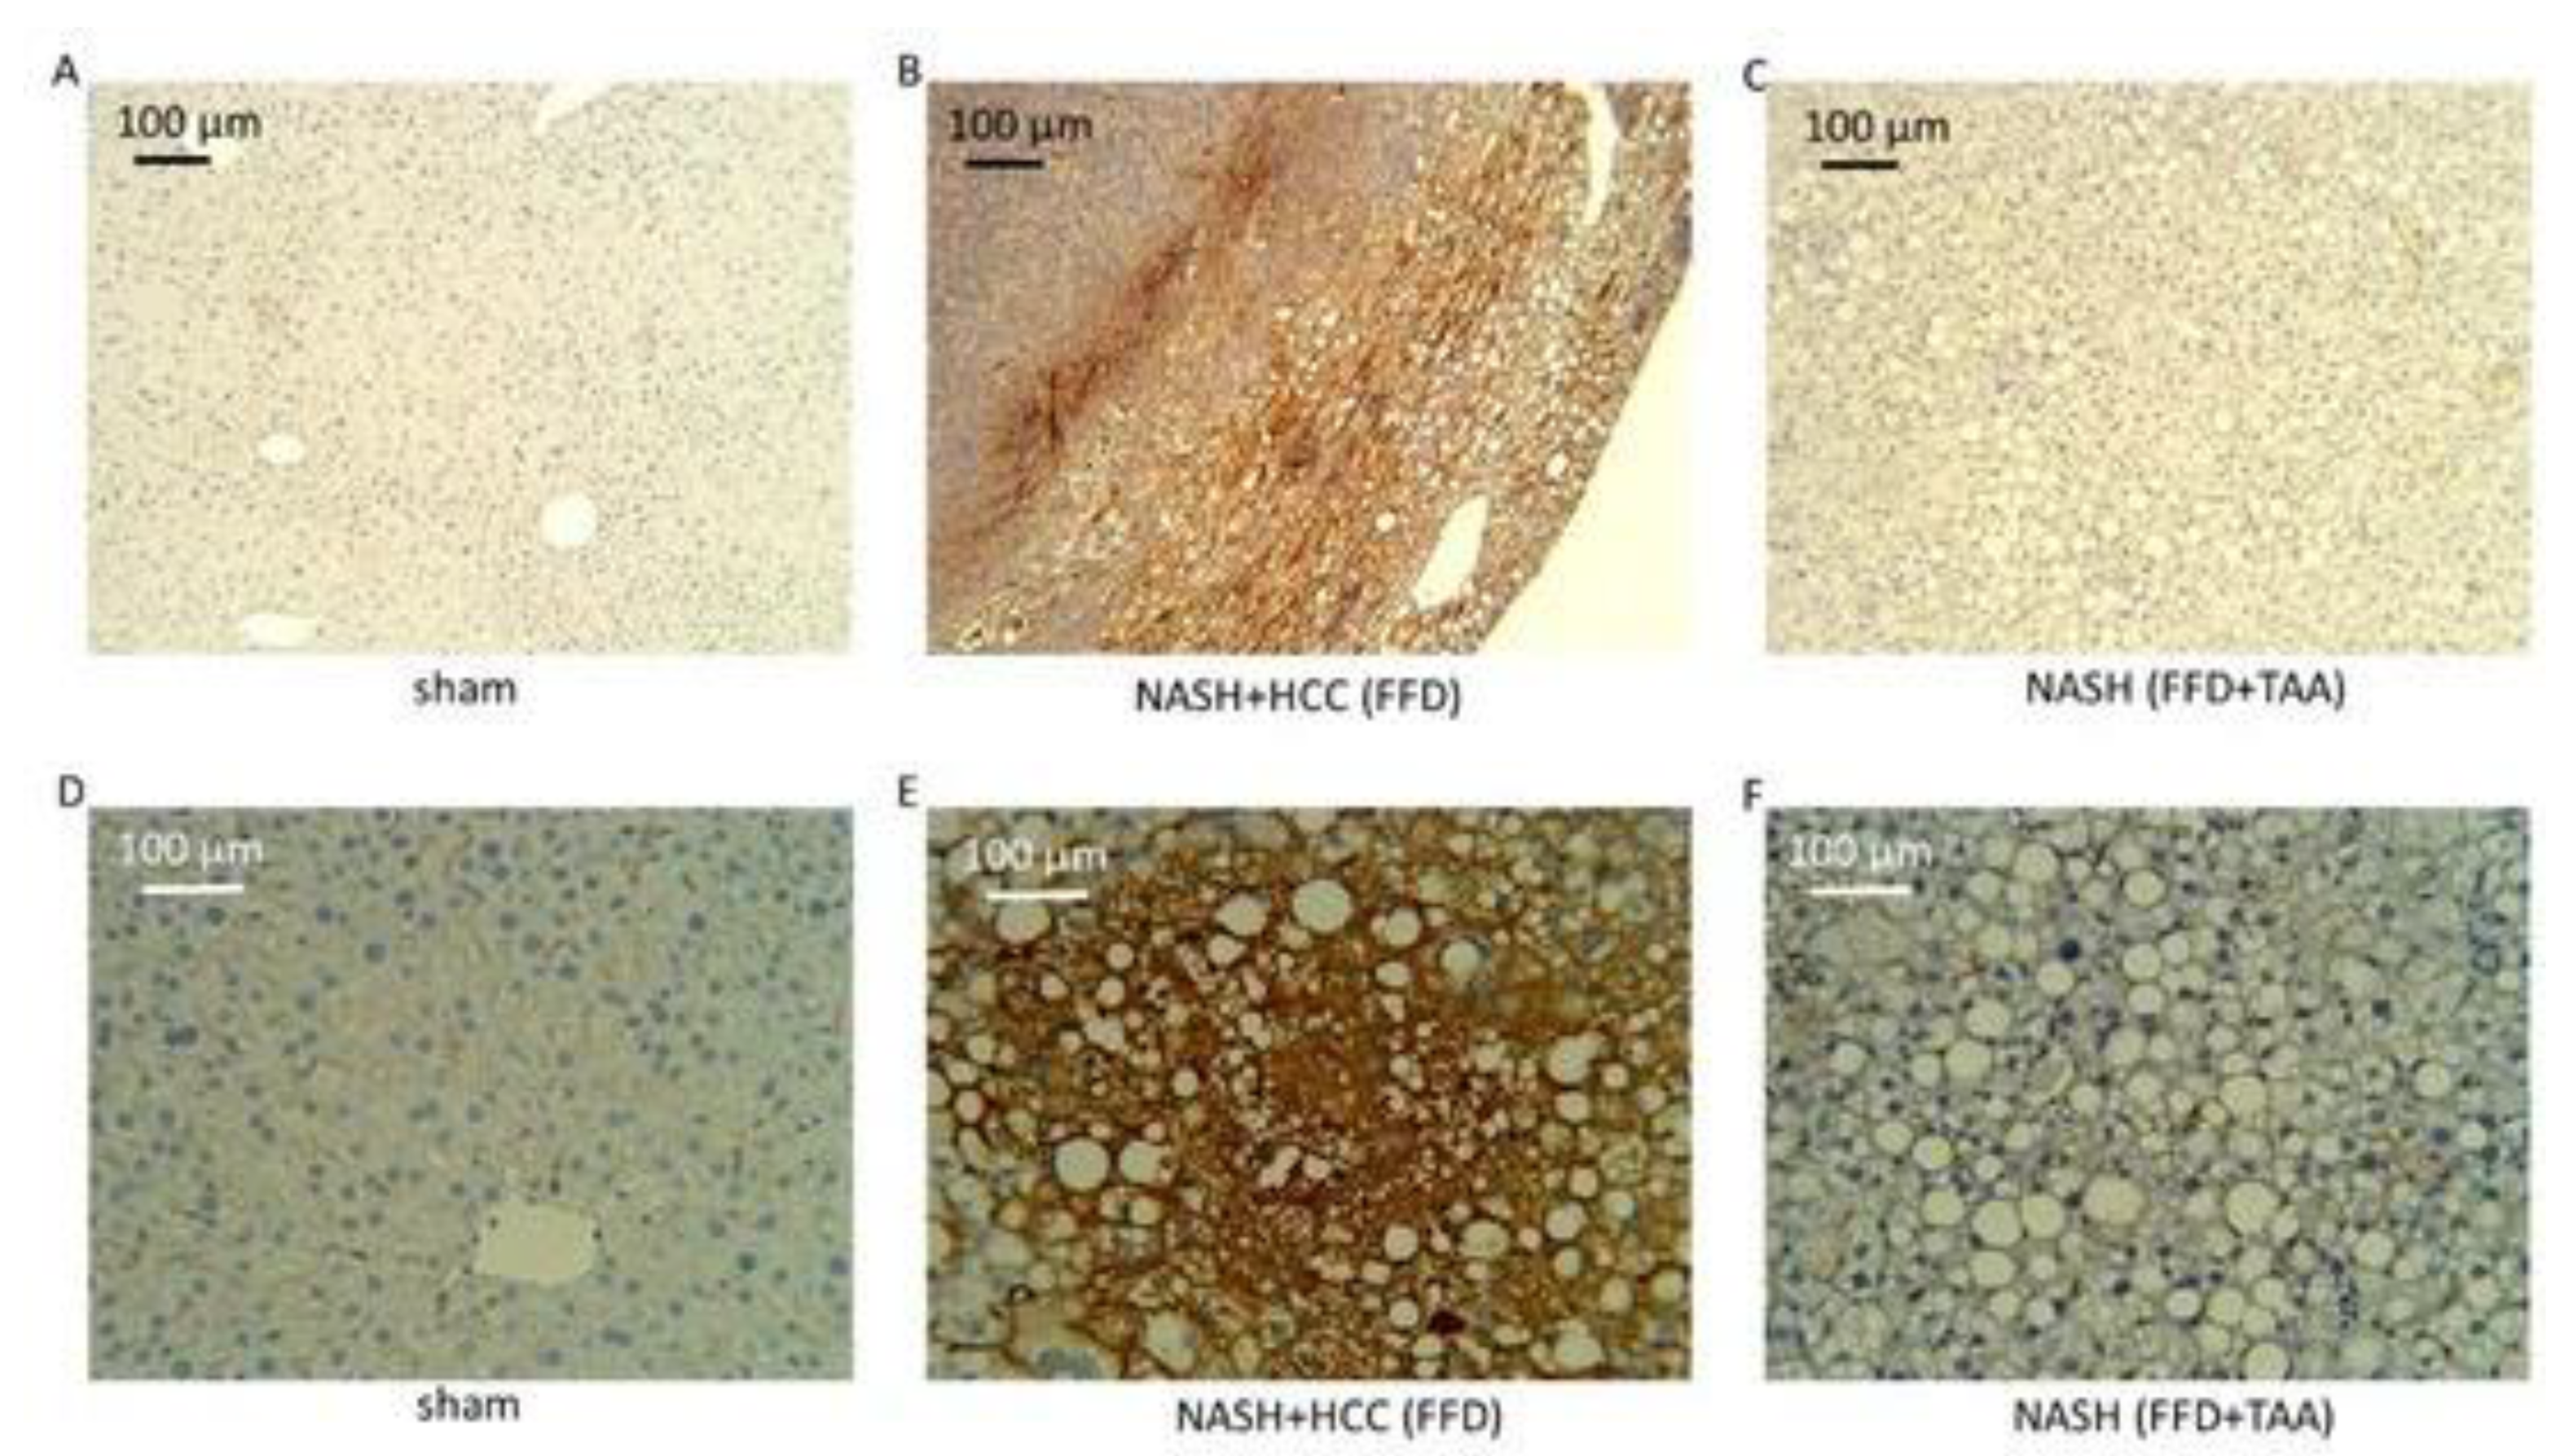
2.2. Histopathology
2.3. Liver Function Tests
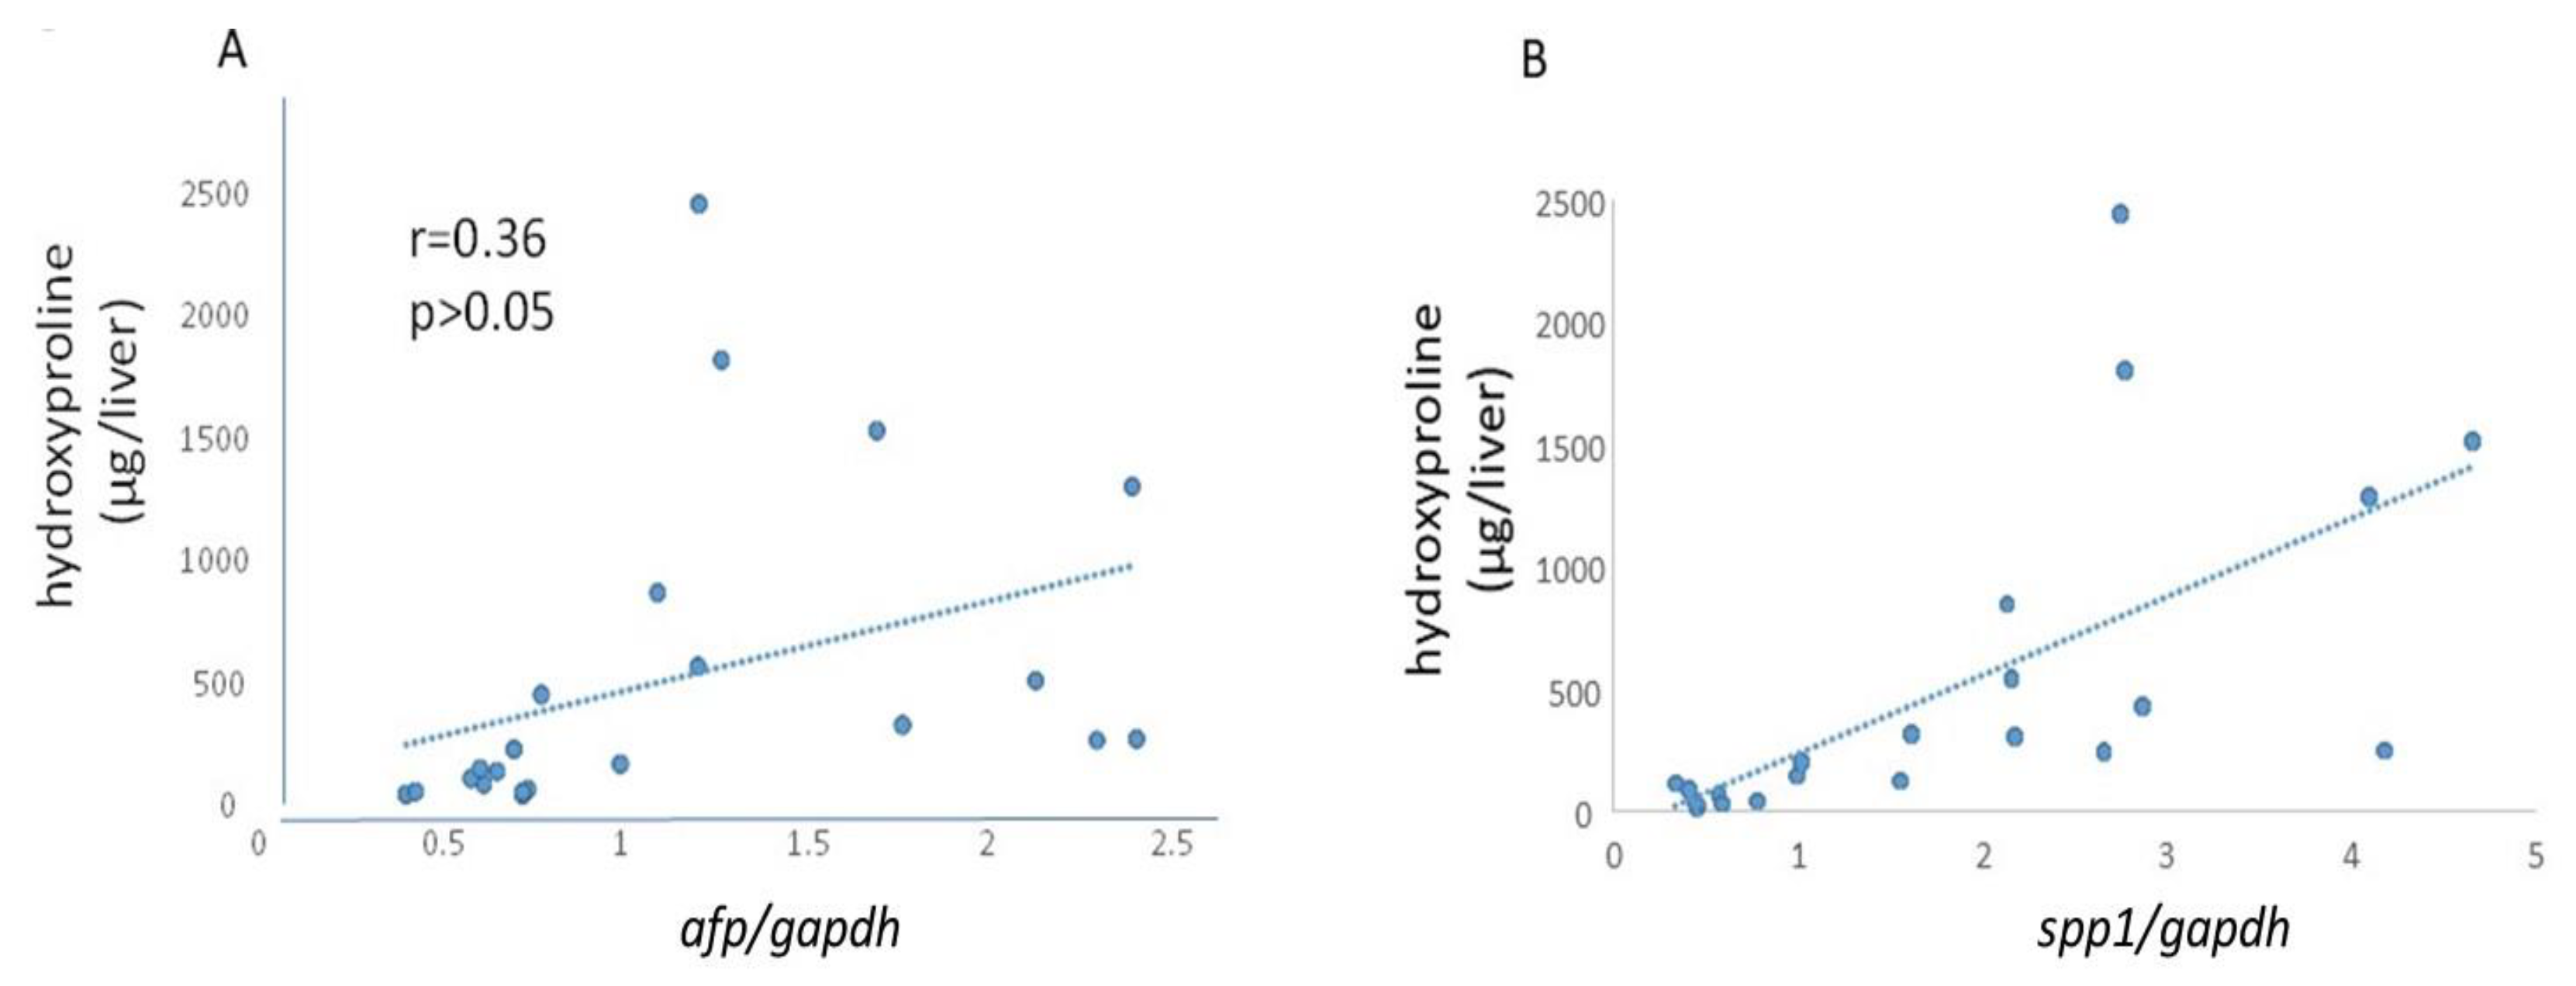
2.4. Liver Hydroxyproline
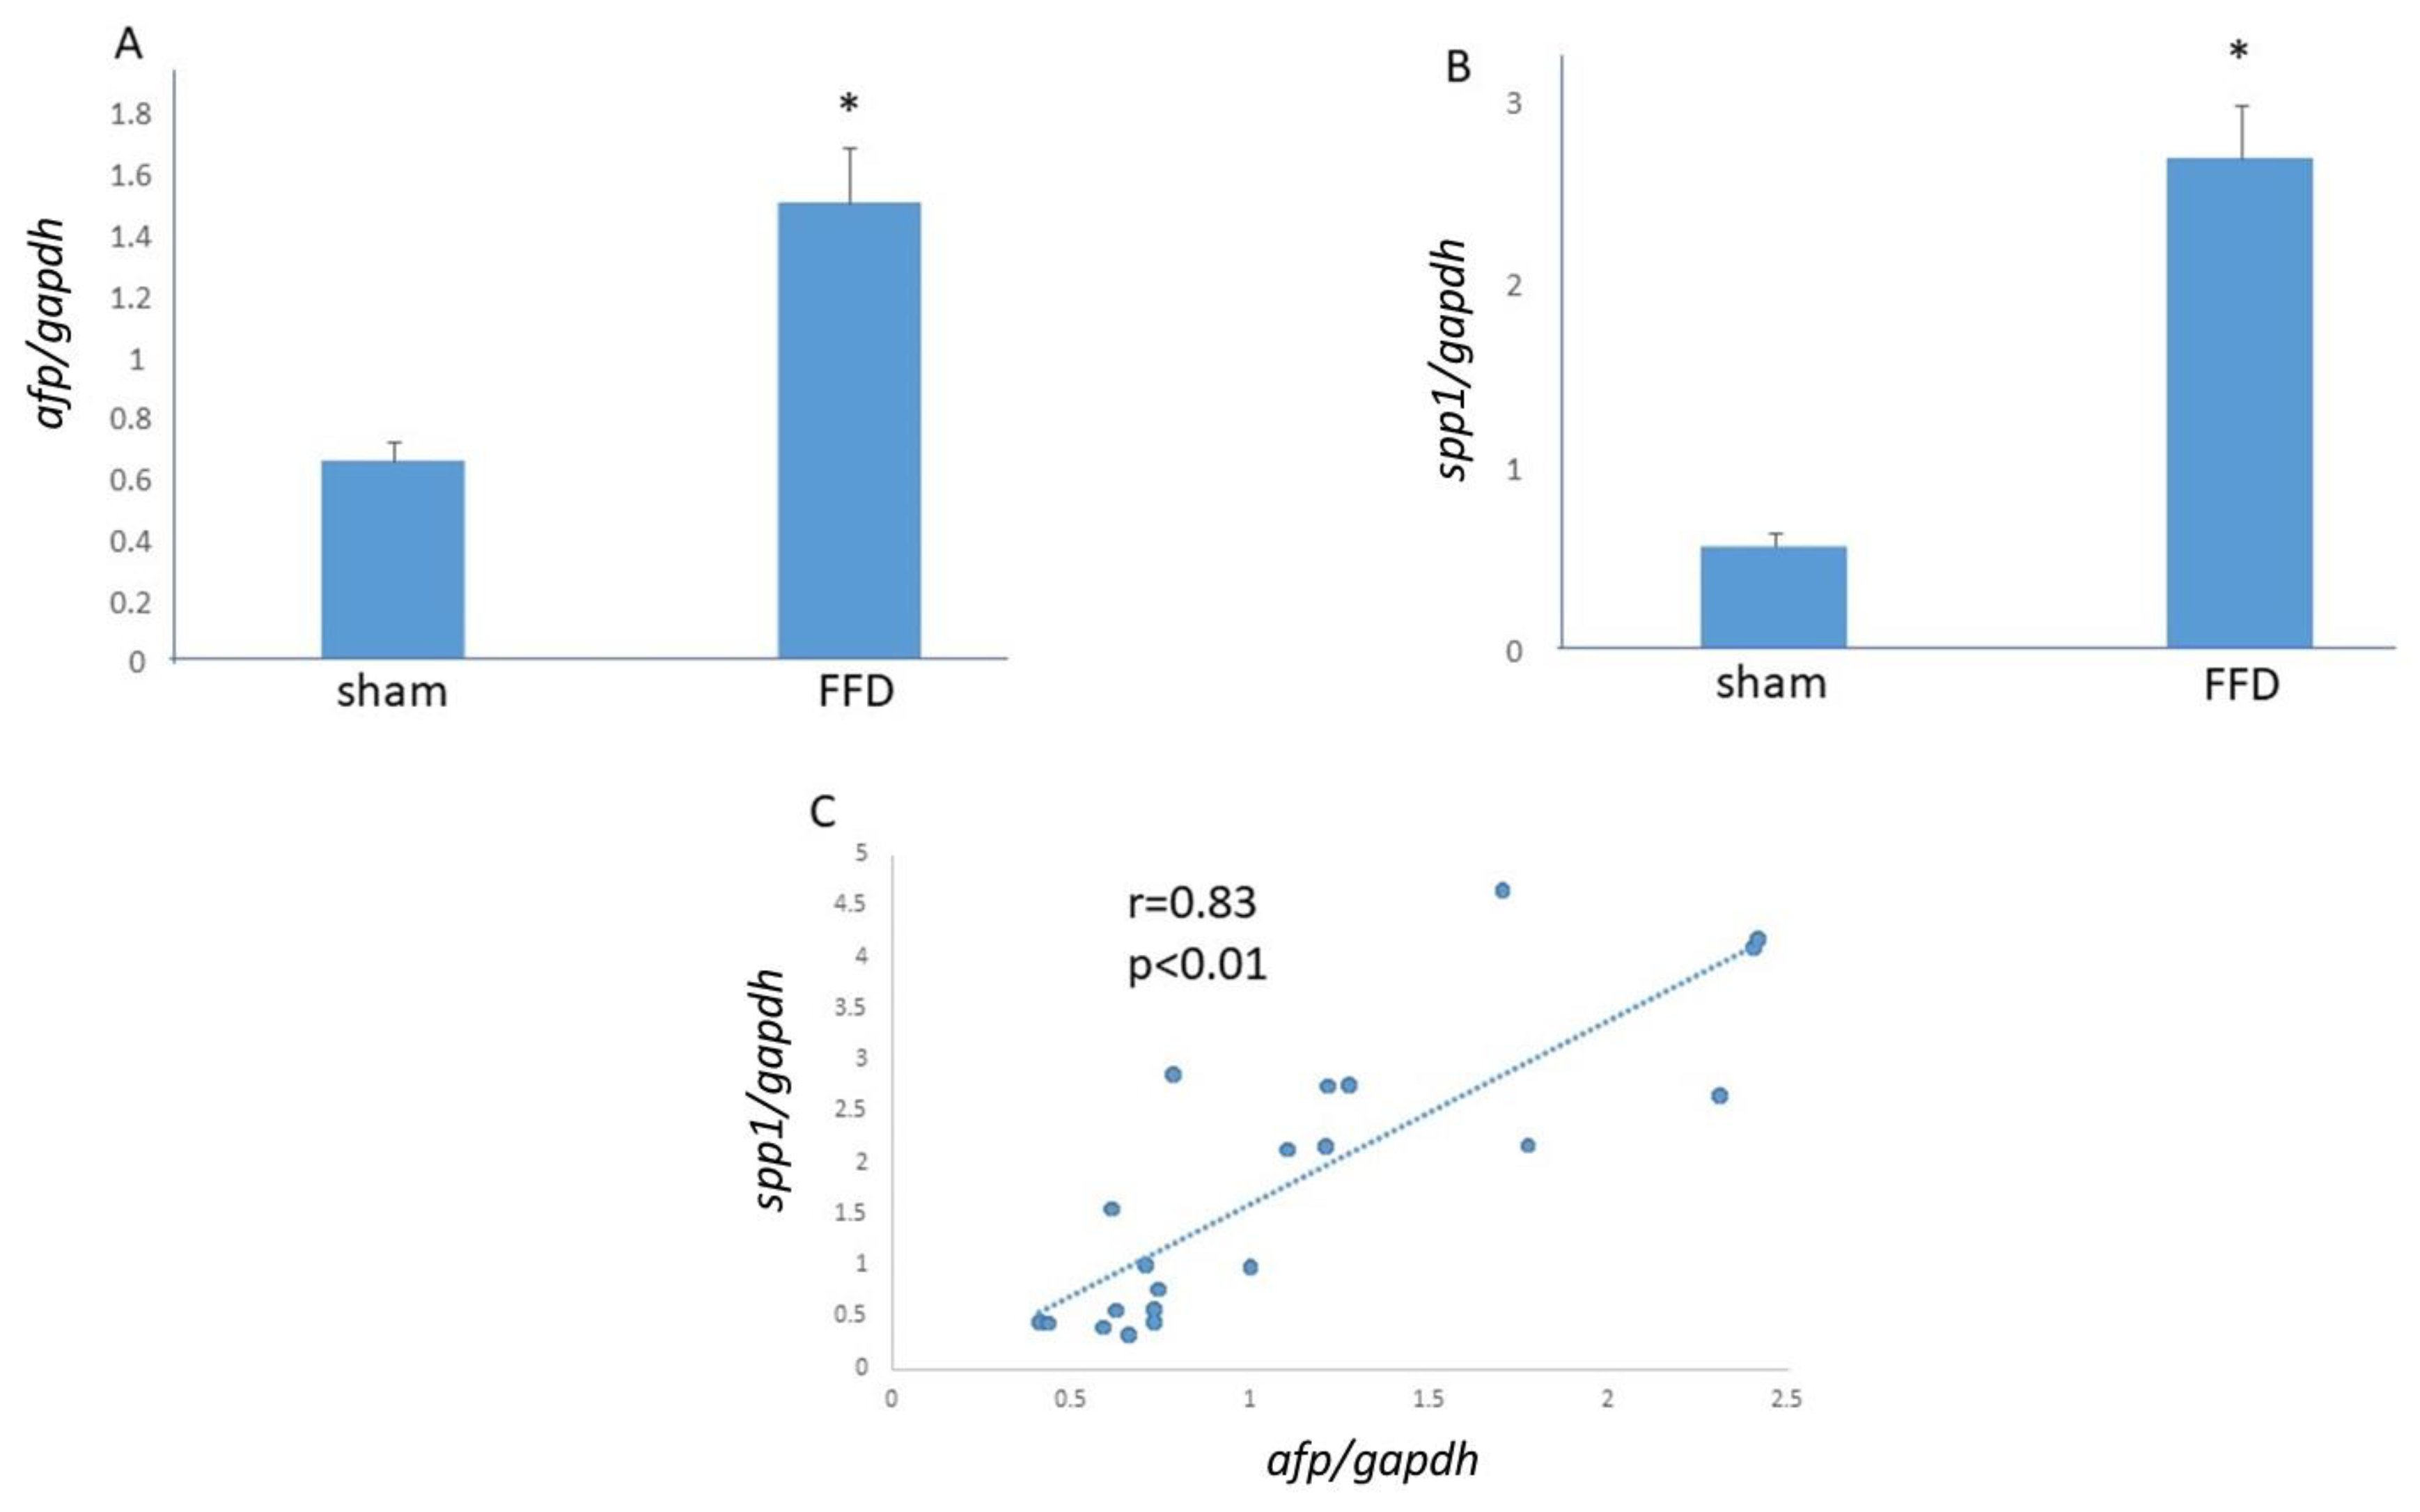
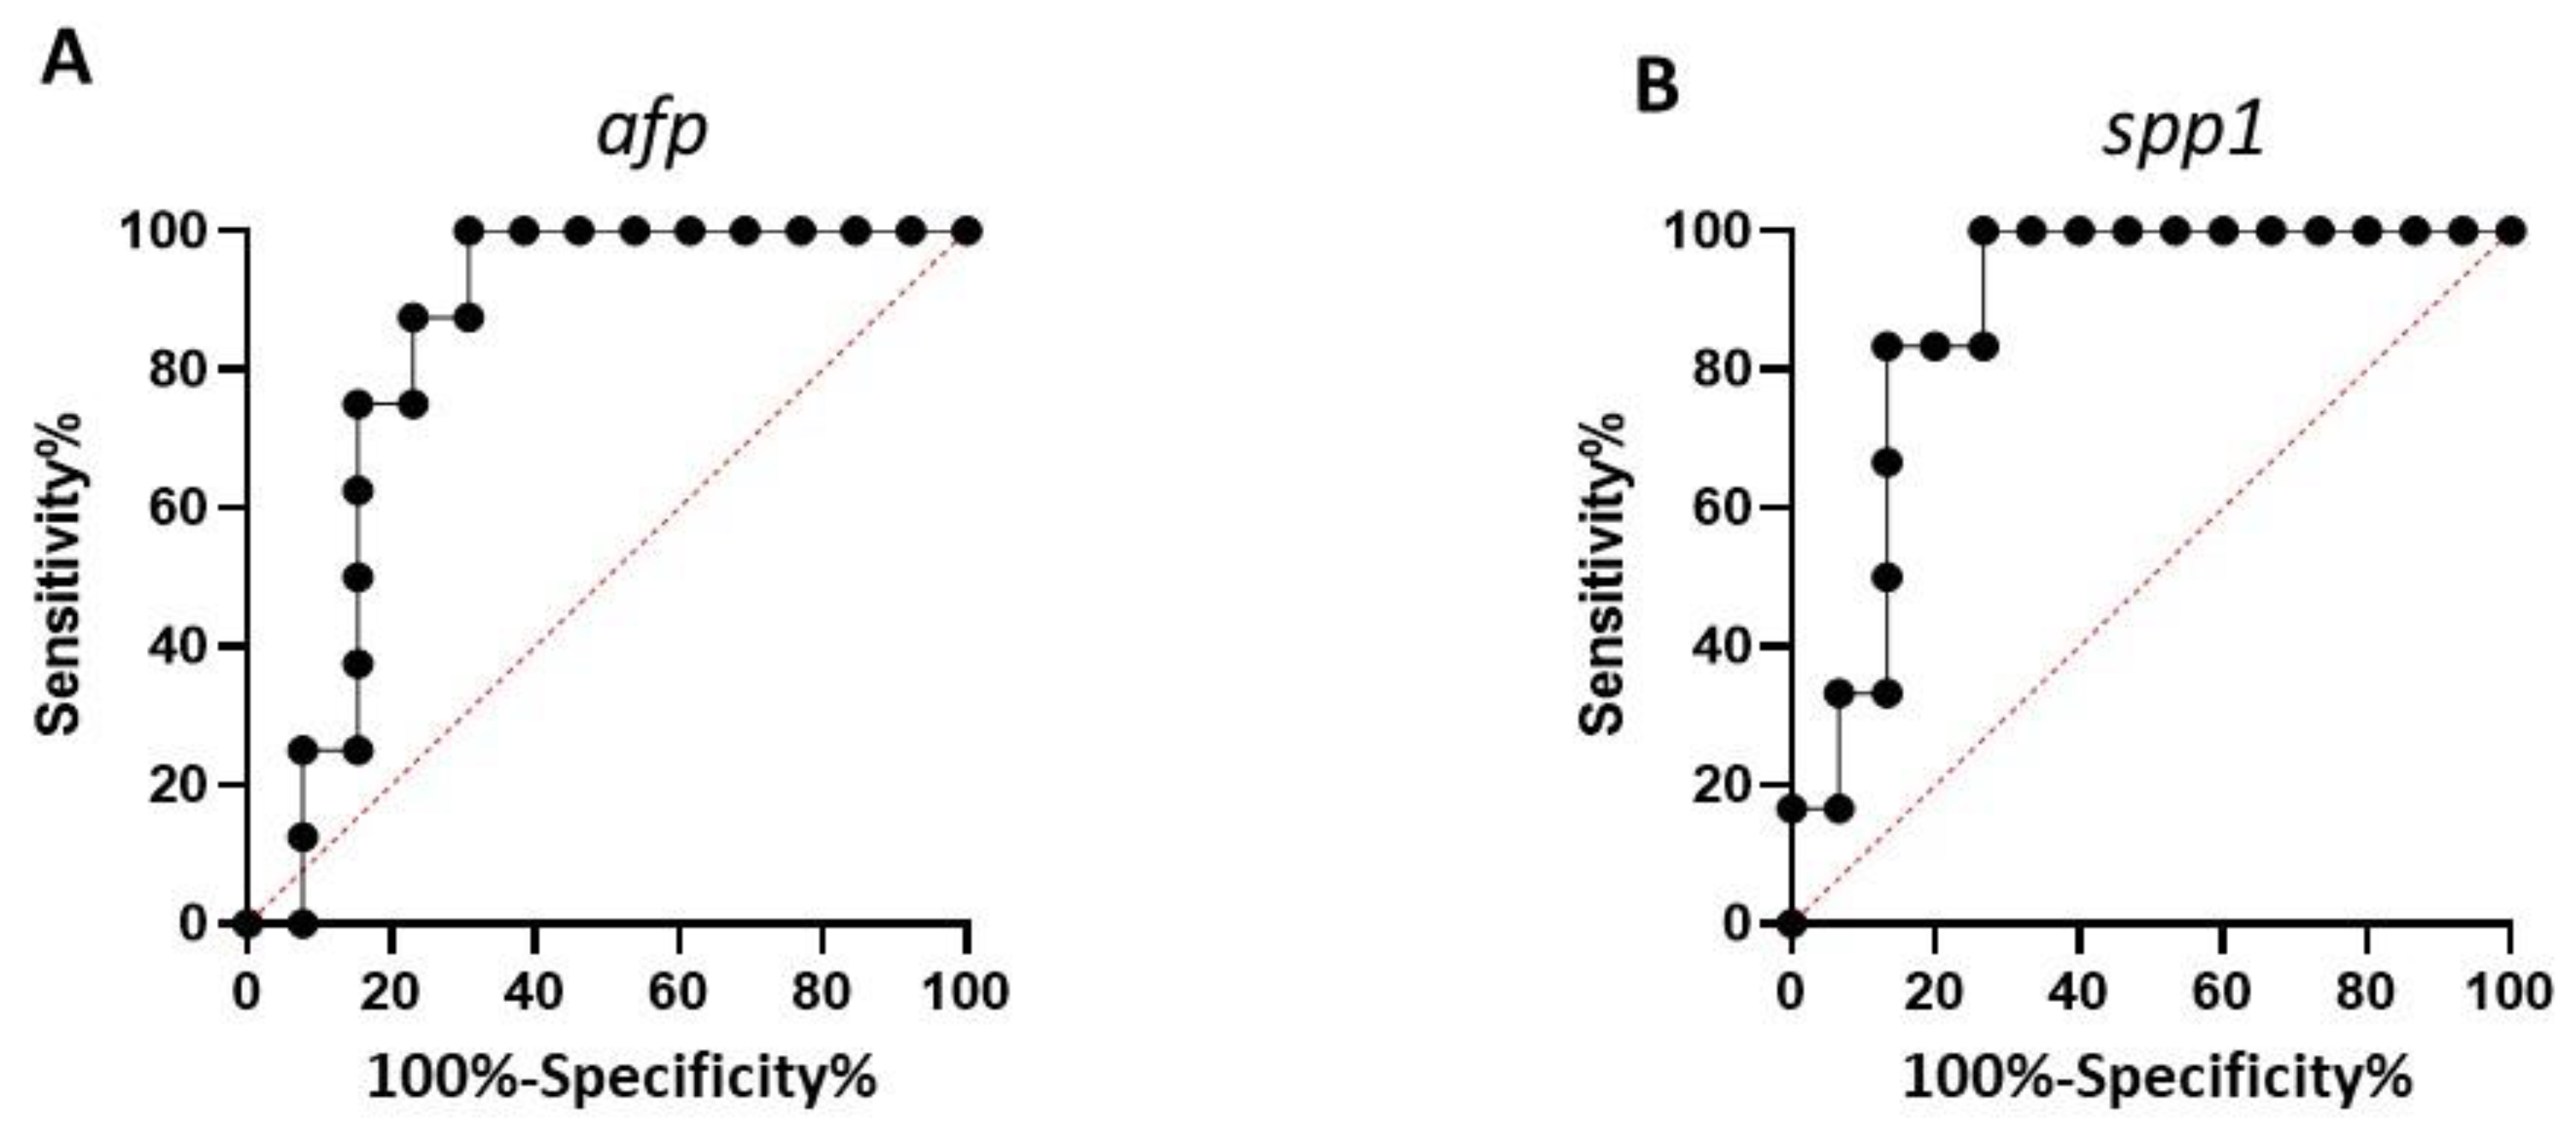
2.5. Hepatic afp and opn/spp1
2.6. Statistical Analysis
3. Results
4. Discussion
Author Contributions
Funding
Institutional Review Board Statement
Informed Consent Statement
Data Availability Statement
Conflicts of Interest
References
- Tesfay, M.; Goldkamp, W.J.; Neuschwander-Tetri, B.A. NASH: The Emerging Most Common Form of Chronic Liver Disease. Mo. Med. 2018, 115, 225–229. [Google Scholar] [PubMed]
- Sanyal, A.J.; Friedman, S.L.; McCullough, A.J.; Dimick-Santos, L. Challenges and opportunities in drug and biomarker development for nonalcoholic steatohepatitis: Findings and recommendations from an American Association for the Study of Liver Diseases-U.S. Food and Drug Administration Joint Workshop. American Association for the Study of Liver Diseases; United States Food and Drug Administration. Hepatology 2015, 61, 1392–1405. [Google Scholar] [PubMed]
- Hwang, A.; Shi, C.; Zhu, E.; Naaz, F.; Zhou, P.; Rasheed, Z.; Liu, M.; Jung, L.S.; Duan, B.; Li, J.; et al. Supervised Learning Reveals Circulating Biomarker Levels Diagnostic of Hepatocellular Carcinoma in a Clinically Relevant Model of Non-alcoholic Steatohepatitis; An OAD to NASH. PLoS ONE 2018, 13, e0198937. [Google Scholar] [CrossRef] [PubMed]
- Liao, K.; Pellicano, A.J.; Jiang, K.; Prakash, N.; Li, J.; Bhutkar, S.; Hu, Z.; Ali, Q.; Goldberg, I.D.; Narayan, P. Glycerol-3-phosphate Acyltransferase1 Is a Model-Agnostic Node in Nonalcoholic Fatty Liver Disease: Implications for Drug Development and Precision Medicine. ACS Omega 2020, 5, 18465–18471. [Google Scholar] [CrossRef] [PubMed]
- Bissoondial, T.L.; Han, Y.; Mullan, S.; Pabla, A.K.; Spahn, K.; Shi, S.; Narayan, P. Liver Biopsy Hydroxyproline Content Is a Diagnostic for Hepatocellular Carcinoma in Murine Models of Nonalcoholic Steatohepatitis. Diagnostics 2020, 10, E784. [Google Scholar] [CrossRef] [PubMed]
- Friedman, S.L. We’ve hit the Iceberg the threat of NASH-related HCC arrives. J. Hepatol. 2014, 60, 1–2. [Google Scholar] [CrossRef] [PubMed] [Green Version]
- Perumpail, R.B.; Wong, R.J.; Ahmed, A.; Harrison, S.A. Hepatocellular carcinoma in the setting of non-cirrhotic nonalcoholic fatty liver disease and the metabolic syndrome: US experience. Dig. Dis. Sci. 2015, 60, 3142–3148. [Google Scholar] [CrossRef] [PubMed]
- Ertle, J.; Dechene, A.; Sowa, J.-P.; Penndorf, V.; Herzer, K.; Kaiser, G.; Schlaak, J.F.; Gerken, G.; Syn, W.-K.; Canbay, A. Non-alcoholic fatty liver disease progresses to hepatocellular carcinoma in the absence of apparent cirrhosis. Int. J. Cancer 2011, 128, 2436–2443. [Google Scholar] [CrossRef] [PubMed]
- Kolly, P.; Dufour, J.F. Surveillance for hepatocellular carcinoma in patients with NASH. Diagnostics 2016, 6, 22. [Google Scholar] [CrossRef] [PubMed] [Green Version]
- Cholankeril, G.; Patel, R.; Khurana, S.; Satapathy, S.K. Hepatocellular carcinoma in non-alcoholic steatohepatitis: Current knowledge and implications for management. World J. Hepatol. 2017, 9, 533–543. [Google Scholar] [CrossRef] [PubMed]
- Bruix, J.; Sherman, M. Management of hepatocellular carcinoma: An update. Hepatology 2011, 53, 1020–1022. [Google Scholar] [CrossRef] [PubMed]
- Heimbach, J.K.; Kulik, L.M.; Finn, R.S.; Sirlin, C.B.; Abecassis, M.M.; Roberts, L.R.; Zhu, A.X.; Murad, M.H.; Marrero, J.A. Aasld guidelines for the treatment of hepatocellular carcinoma. Hepatology 2018, 67, 358–380. [Google Scholar] [CrossRef] [PubMed] [Green Version]
- Sanyal, A.J.; Chalasani, N.; Kowdley, K.V.; McCullough, A.; Diehl, A.M.; Bass, N.M.; Neuschwander-Tetri, B.A.; Lavine, J.E.; Tonascia, J.; Unalp, A.; et al. Pioglitazone, vitamin E, or placebo for nonalcoholic steatohepatitis. N. Engl. J. Med. 2010, 362, 1675–1685. [Google Scholar] [CrossRef] [PubMed] [Green Version]
- Xu, P.; Xu, C.-F.; Wan, X.-Y.; Yu, C.-H.; Shen, C.; Chen, P.; Xu, G.-Y.; Li, Y.-M. Association between serum alpha-fetoprotein levels and fatty liver disease: A cross-sectional study. World J. Gastroenterol. 2014, 20, 11865. [Google Scholar] [CrossRef] [PubMed]
- Farinati, F.; Marino, D.; De Giorgio, M.; Baldan, A.; Cantarini, M.; Cursaro, C.; Trevisani, F. Diagnostic and prognostic role of α-fetoprotein in hepatocellular carcinoma: Both or neither? Am. J. Gastroenterol. 2006, 101, 524. [Google Scholar] [CrossRef] [PubMed]
- Chauhan, R.; Lahiri, N. Tissue-and serum-associated biomarkers of hepatocellular carcinoma. Biomark. Cancer 2016, 8, S34413. [Google Scholar] [CrossRef] [PubMed] [Green Version]
- Gonzalez, S.A. Novel biomarkers for hepatocellular carcinoma surveillance: Has the future arrived? Hepatobiliary Surg. Nutr. 2014, 3, 410. [Google Scholar] [PubMed]
- Tsuchiya, N.; Sawada, Y.; Endo, I.; Saito, K.; Uemura, Y.; Nakatsura, T. Biomarkers for the early diagnosis of hepatocellular carcinoma. World J. Gastroenterol. 2015, 21, 10573. [Google Scholar] [CrossRef] [PubMed]
- Cissell, D.D.; Link, J.M.; Hu, J.C.; Athanasiou, K.A. A Modified Hydroxyproline Assay Based on Hydrochloric Acid in Ehrlich’s Solution Accurately Measures Tissue Collagen Content. Tissue Eng. Part C Methods 2017, 23, 243–250. [Google Scholar] [CrossRef] [PubMed]
- Social Science Statistics. Available online: https://www.socscistatistics.com/pvalues/pearsondistribution.aspx (accessed on 18 October 2020).
- Cello Health Bioconsulting. Available online: http://www.definedhealth.com/the-dash-to-treat-nash-the-next-big-global-epidemic/ (accessed on 18 October 2020).
- Glass, O.; Henao, R.; Patel, K.; Guy, C.D.; Gruss, H.J.; Syn, W.K.; Abdelmalek, M.F. Serum interleukin-8osteopontin, and monocyte chemoattractant protein 1 are associated with hep-atic fibrosis in patients with nonalcoholic fatty liver disease. Hepatol. Commun. 2018, 2, 1344–1355. [Google Scholar] [CrossRef] [PubMed]


Publisher’s Note: MDPI stays neutral with regard to jurisdictional claims in published maps and institutional affiliations. |
© 2021 by the authors. Licensee MDPI, Basel, Switzerland. This article is an open access article distributed under the terms and conditions of the Creative Commons Attribution (CC BY) license (https://creativecommons.org/licenses/by/4.0/).
Share and Cite
Pellicano, A.J.; Mullan, S.; Goldberg, I.D.; Narayan, P. Hepatic mRNA Expression Levels of the Oncogenes Alpha-Fetoprotein and Osteopontin as Diagnostics for Liver Cancer in a Murine Model of Diet-Induced Non-Alcoholic Steatohepatitis. Processes 2021, 9, 1516. https://0-doi-org.brum.beds.ac.uk/10.3390/pr9091516
Pellicano AJ, Mullan S, Goldberg ID, Narayan P. Hepatic mRNA Expression Levels of the Oncogenes Alpha-Fetoprotein and Osteopontin as Diagnostics for Liver Cancer in a Murine Model of Diet-Induced Non-Alcoholic Steatohepatitis. Processes. 2021; 9(9):1516. https://0-doi-org.brum.beds.ac.uk/10.3390/pr9091516
Chicago/Turabian StylePellicano, Anthony J., Stephanie Mullan, Itzhak D. Goldberg, and Prakash Narayan. 2021. "Hepatic mRNA Expression Levels of the Oncogenes Alpha-Fetoprotein and Osteopontin as Diagnostics for Liver Cancer in a Murine Model of Diet-Induced Non-Alcoholic Steatohepatitis" Processes 9, no. 9: 1516. https://0-doi-org.brum.beds.ac.uk/10.3390/pr9091516