
Air Pollution Analysis during the Lockdown on the City of Milan
by
 , , and
Nicoletta Lotrecchiano
1,2, 
Paolo Trucillo
3 ,
,
Diego Barletta
1,
Massimo Poletto
1 and
Daniele Sofia
1,2,*
1
DIIN—Department of Industrial Engineering, University of Salerno, Via Giovanni Paolo II 132, 84084 Fisciano, Italy
2
Research Department, Sense Square Srl, 84084 Salerno, Italy
3
Department of Chemical, Material and Industrial Production Engineering, University of Naples Federico II, Piazzale V. Tecchio 80, 80125 Napoli, Italy
*
Author to whom correspondence should be addressed.
Processes 2021, 9(10), 1692; https://0-doi-org.brum.beds.ac.uk/10.3390/pr9101692
Submission received: 20 July 2021
/
Revised: 17 September 2021
/
Accepted: 17 September 2021
/
Published: 22 September 2021
(This article belongs to the Special Issue Air Quality Monitoring for Smart Cities and Industrial Applications)
Abstract
:From February 2020, the progressive adoption of measures to contain coronavirus’s contagion has resulted in a sudden change in anthropogenic activities in Italy, especially in Lombardy. From a scientific point of view, this situation represents a unique laboratory for understanding and predicting the consequences of specific measures aimed at improving air quality. In this work, the lockdown effect on Milan’s (Italy) air quality was analyzed. The PM10 and PM2.5 values were measured by the ARPA Lombardia, and the real-time on-road (ROM) air quality monitoring network indicates the seasonality of these pollutants, which typically record the highest values in the coldest months of the year. The 10-year particulate matter concentrations analysis shows a PM10 reduction of 35% from 2010 to 2020. March 2020 data analysis shows an alternation of days with higher and lower particulate matter concentrations; values decrease in pollutants concentrations of 16%, respective to 2018. The complexity of the phenomena related to the atmospheric particulates formation, transport, and accumulation is highlighted by some circumstances, such as the Sahara dust events. The study showed that the trend of a general pollutant concentration reduction should be attributed to the decrease in emissions (specifically, from the transport sector) from the variation of meteorological and environmental conditions.
1. Introduction
As similar to many other countries in the rest of the world, starting with the identification of the first case of SARS-CoV2 on 31 January 2020, Italy was hit by the pandemic wave with the consequent lockdown of all activities [1]. During this period, which took place between February and April 2020, the world has become open-air and it was possible to verify the effects of the most polluting anthropogenic activities reduction on air quality [2].
The air quality improvements caused by the 2020 lockdown were unprecedented in many parts of the world. The restrictions imposed by the pandemic on transportation and many production sectors have not prevented the values of particulate matter (PM) from exceeding the limits set by the World Health Organization. Only 24 countries have managed to stay below the safety threshold set by the WHO, out of the 106 countries surveyed by a new report prepared by IQAir and the United Nation agency [3]. According to the NU report, the worst countries for air quality are Bangladesh, Pakistan, India, Mongolia, and Afghanistan, where the pollution surveys record average values of PM2.5 ranging from 47 to 77 μg/m3. The UN report indicates that in 2020, all Indian cities improved in air quality compared to 2018, while 63% recorded improvements compared to 2019. However, India continues to occupy a prominent place among the most polluted cities, and New Delhi is confirmed as the urban area with the worst air pollution in the world. The report highlights that in 2020, half of the European cities exceeded the WHO parameters for PM2.5, recording the highest levels in Eastern and Southern Europe, with Bosnia and Herzegovina, Macedonia, and Bulgaria. Italy suffered the lockdown effect in a diversified way in the various regions [4], remaining in the average of European cities.
Italy is characterized by a complex orography by different climatic zones, where, depending on the seasonal period, very favorable conditions for the pollutants accumulation and formation in the atmosphere can occur [5]. A striking example is the river Po basin and some areas of the central-southern region in the winter period, when the generated pollutants accumulate and coastal areas that, despite of the population, present conditions that generally favor dispersion and reduce the possibility of secondary pollutants forming.
To assess the lockdown effects, it should be considered that the period of March is usually less favorable to the accumulation of pollutants than the months of January and February, when conditions of thermal inversion at low altitude and atmospheric stability often occur with high values of the main pollutants [6]. In this perspective, the lockdown effect should be found by comparing the pollutant levels observed during the lockdown with the observations in the same late winter–spring period of the previous year. The report from the National Service for Environmental Protection (SNPA) [6] 2020 revealed that, throughout the Italian peninsula, there has been a reduction in the concentrations of nitrogen monoxide (emitted directly) and dioxide (partly emitted directly and partly formed in the atmosphere), carbon monoxide, and benzene. The nitrogen dioxide reduction was around 40% [7], ranging from a few percentage points to values over 70% in some sites. If it was easy to define the changes for nitrogen oxides, the effects on the levels of particulate matter (PM10 and PM2.5) are less easy to read. Particulate matter is a complex mixture of solid and liquid particles dispersed in the atmosphere that may have different sources, depending on the season and the geographical area. Some are of natural origin, such as the marine aerosol and the particles that originate from the long-distance transport of desert sands [8]. Particulates are generated locally and may have natural origin, such as wind-lifted terrigenous particles, or anthropic origin, such as the particles emitted from vehicles due to combustion, re-suspended emissions, and friction phenomena. They could be produced by industrial and energetic combustion processes or other primary (agriculture and mining) or secondary (civil and industrial construction) activities. Particulate matter concentrations vary, not only for changes in meteorology or changes in anthropogenic emissions but also due to the influence of natural emissions. These emissions are hard to predict, due to the high variability over the years and the complex relationship to its gas precursors emitted from different sources. Hence, the correlation between PM observed levels and emission sources during lockdown is complex. In the regions where people have been forced to stay indoors, there may have been an increase in primary PM emissions from the domestic burning of coal or wood, while traffic PM emissions have been significantly reduced. Particulate matter from agricultural emissions was probably not affected by the lockdown, while some industrial emissions (e.g., PM, NOX, and SOX) were reduced in various sites due to the temporary stop of many factories [9].
Certainly, during the lockdown period starting from the middle of March, very significant reductions in traffic flows were observed on a national basis [10,11], down to 70% for light vehicles and 38% for heavy vehicles. These levels gradually returned to previous levels in the first half of June. This traffic reduction consequently affected the particulate levels, but sometimes was compensated by emission due to domestic heating, especially for a month of March that was, on average, colder than usual. This may explain the slight increase in the particulate level observed in same areas, with respect to the season average. The contributions related to industrial and livestock activities should also be taken into account. The particulate transported by the Saharan dust should be added in some cases to the one already produced in the urban context. All these considerations may constitute a first motivation for the insignificant PM10 and PM2.5 reduction levels recorded during the lockdown period in Italy.
The lockdown resulted in a significant reduction in air pollution that has always been a peculiarity of northern Italy, due to the large concentration of industrial activities. In this perspective, the metropolitan city of Milan (Italy) appears to be particularly representative, due to the characteristics of the urban context and variety of the industrial activities. Data analysis in Milan is possible due to the public and private air quality monitoring networks installed in the area, allowing for the monitoring of the pollution levels with high space and time resolution. The need to install air quality monitoring networks arise from the need to adequately know the state of the air breathed by the population. Information on air quality is useful to public authorities, such as the government, which deals with environmental monitoring with the help of regional environmental protection agencies (ARPA). Municipalities, individuals, or companies support the government and the ARPA installing their networks for air quality monitoring [12] in the optimal points of the city context [13]. To carry out detailed analysis it is necessary to have a good quantity of measured data distributed over the territory with a high spatial resolution, otherwise the analysis is limited [14]. The monitoring networks installed in Milan have low cost but were developed according to the internet of things (IoT) standards and can provide real-time data with a high temporal resolution that is easily accessible by users. The possibility of relying on data from air quality monitoring networks is fundamental for the definition of pollution levels but also for implementing models that allow, for example, the pollution evolution forecast [15,16] and the analysis of accidental events, such as explosions or fires [17]. The data reliability in the latest generation of smart measuring devices can be ensured with the use of blockchain technology [18]. Monitoring network data is also useful to the institutions for the development of air quality improvement [19,20].
In the present study, air quality, high time–space resolution network data, and ARPA network air quality data in Milan are analyzed to assess on the lockdown on the air quality. To this end, the concentrations of the different pollutants in the pre- and post-lockdown scenario are compared and discussed.
The Case Study
The metropolitan city of Milan is one of the largest and most populous cities in northern Italy, with approximately 1,400,000 inhabitants in the municipality alone and more than 3 million inhabitants in the metropolitan area. The air quality is strongly affected by the town activities of different nature, by which it is daily interested. The many industrial poles and massive urbanization (together with an orography that is not favorable to the pollutants dispersion) determine the frequent exceedances of the PM10 levels, with respect to the law limits. In Italy, a condition is shared with other industrial conurbations such as Turin, Venice, Naples, and Cagliari. The mountains surround the valley to the north and west (Alps), as well as south (Apennines), while the east side is open to the Adriatic Sea. This topography favors air stagnation and is accompanied by frequent winter thermal inversions and diffuse fog events that lead to the accumulation of particulate (PM) pollution [21,22].
2. Materials and Methods
2.1. Data Sources
2.1.1. ARPA Lombardia
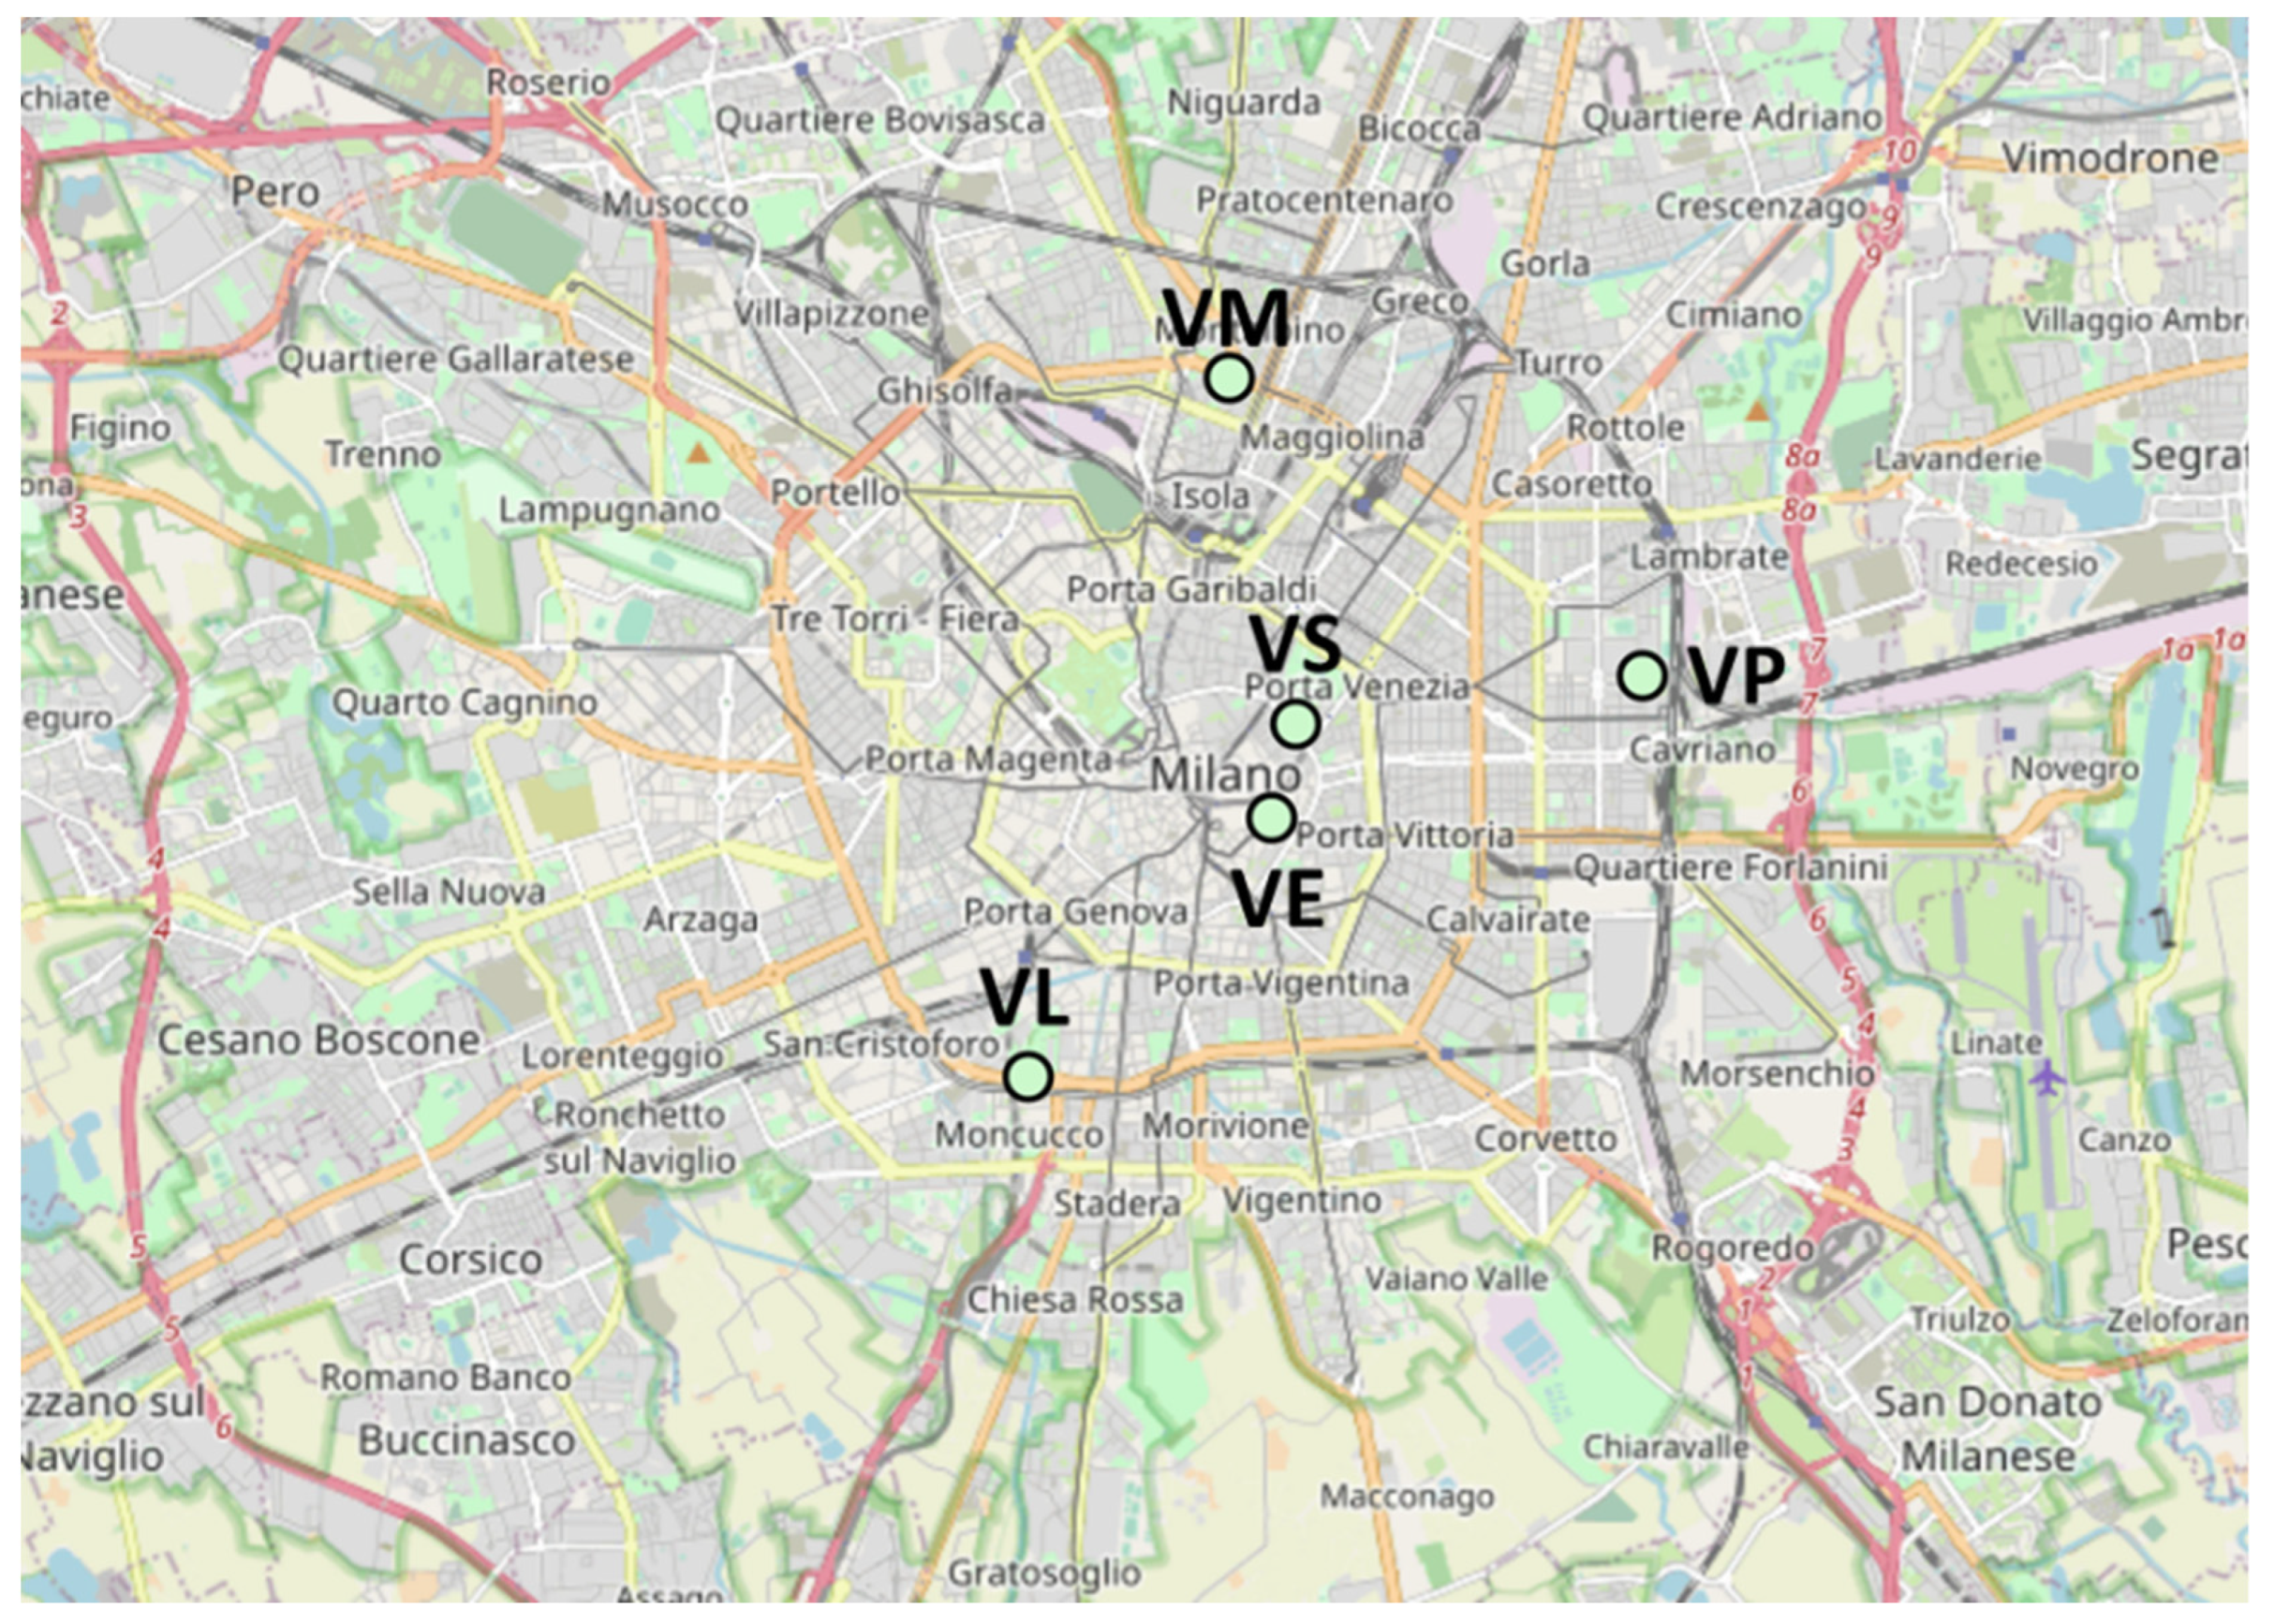
ARPA Lombardia is the regional authority for environmental protection. Its air quality monitoring network consists of 85 fixed stations, which, by means of automatic analyzers, provide continuous data at regular time intervals, generally on an hourly basis. The pollutant species monitored continuously are NOX, SO2, CO, O3, PM10, PM2.5, and benzene. Depending on the environmental context (urban, industrial, traffic, and rural), in which the monitoring is active, the list of pollutants considered relevant is different. Therefore, not all stations are equipped with the same analytical instrumentation. ARPA stations are distributed throughout the region according to the population density and the territory type, respecting the criteria defined by the national Legislative Decree 155/2010. In detail, 5 monitoring stations are active throughout the Milan urban area, as shown in Figure 1, and their characteristics are listed in Table 1.
The data used for this study includes all PM10 and PM2.5 values measured by the regional air quality network from 2010 to 2020.
2.1.2. Real-Time On-Road Mobile Monitoring Network
The real-time on-road network for air quality monitoring (ROMS) has been active in Milan since 2018. This new technology makes it possible to map pollution in real-time through measurement devices located on moving vehicles. This latest generation of monitoring system, described by Lotrecchiano et al. [23], provides data on the main airborne pollutants with a high temporal resolution, with deeper knowledge on the area covered. The considered measuring system can return the measurements of the average particulate levels of three parameters PM10, PM2.5, and PM1 (particulates with diameters less than 10 μm, 5 μm, and 1 μm, respectively). In addition, the measurement system provides data on the concentration of gaseous pollutants of air, such as NO2, SO2, O3, CO, and VOC, as well as weather parameters, such as the temperature, pressure, and relative humidity of the air. Information on wind direction and intensity is provided to the system via a network of API keys (application programming interface key, i.e., a simple encrypted string that identifies an application) provided by external sites. In this study, only the particulate matter PM10 and PM2.5 have been considered. However, since the measurement systems are linked to the vehicle on which they are located, this technology has limits, in terms of spatial coverage. Some areas are excluded from monitoring, as they are outside the predetermined routes of vehicles or because they are forbidden from vehicular traffic, such as green and pedestrian areas.
Data used in this study includes all measurements made by the ROM network between January and June 2020. To overcome the aforementioned limits of spatial coverage, a model of spatial expansion was applied to the measured data, in order to estimate the missing ones, as proposed by Lotrecchiano et al. [24].
The Milan area was divided into square cells of 1 km2 and the proposed expansion model was applied to each cell containing valid measures.
2.2. Data Aggregation
Data aggregation was carried out using an increasing degree of detail. The first data aggregation level is a macro-visualization, as the whole area to be investigated has been divided into zones corresponding to the 9 Milan municipalities (Figure 2a). By increasing the detail level, the area to be monitored was divided according to the 88 local identity nuclei (NIL) (Figure 2b). NILs are areas that can be defined as districts of Milan, in which it is possible to recognize historical and project districts, with different characteristics from each other. They are introduced by the PGT (territory governance plan) as a set of areas that are connected by infrastructures and services for mobility and greenery. They are systems of urban vitality (local commercial activities, gardens, meeting places, and services), but they are also 88 NILs to be strengthened and designed, through which small and large services can be organized (service plan). The maximum degree of detail is obtained by dividing the entire Milan area into cells with a surface area of 1 km2, whose centroids form a regular grid (Figure 2c). This degree of detail is guaranteed by the mobile sensor network. As previously described, each sensor housed on a vehicle allows for the measurement and tracking of pollutants in many areas of the city at the same time. Furthermore, since they are housed in commercial vans, they have not been subject to the lockdown, thus allowing for the measurement of pollutants.
Traffic Information
A fundamental part of air quality analysis is the analysis of the traffic influence. Information on the traffic flows recorded in the city of Milan was obtained by implementing an algorithm for data acquisition. The algorithm takes data from the server via an API (application programming interface) key, in order to collect traffic data, process them, and insert them into a database. In this work, the REST API key was used; it returns the traffic flow through the jam factor. The traffic jam factor shows the traffic condition in numerous ways. It is a value in the range [0.0, 10.0]. A large jam factor value means more traffic jams, in general. Specifically, 0.0 means free traffic and 10.0 means stationary traffic.
3. Results and Discussion
3.1. Annual Trend 2010–2020
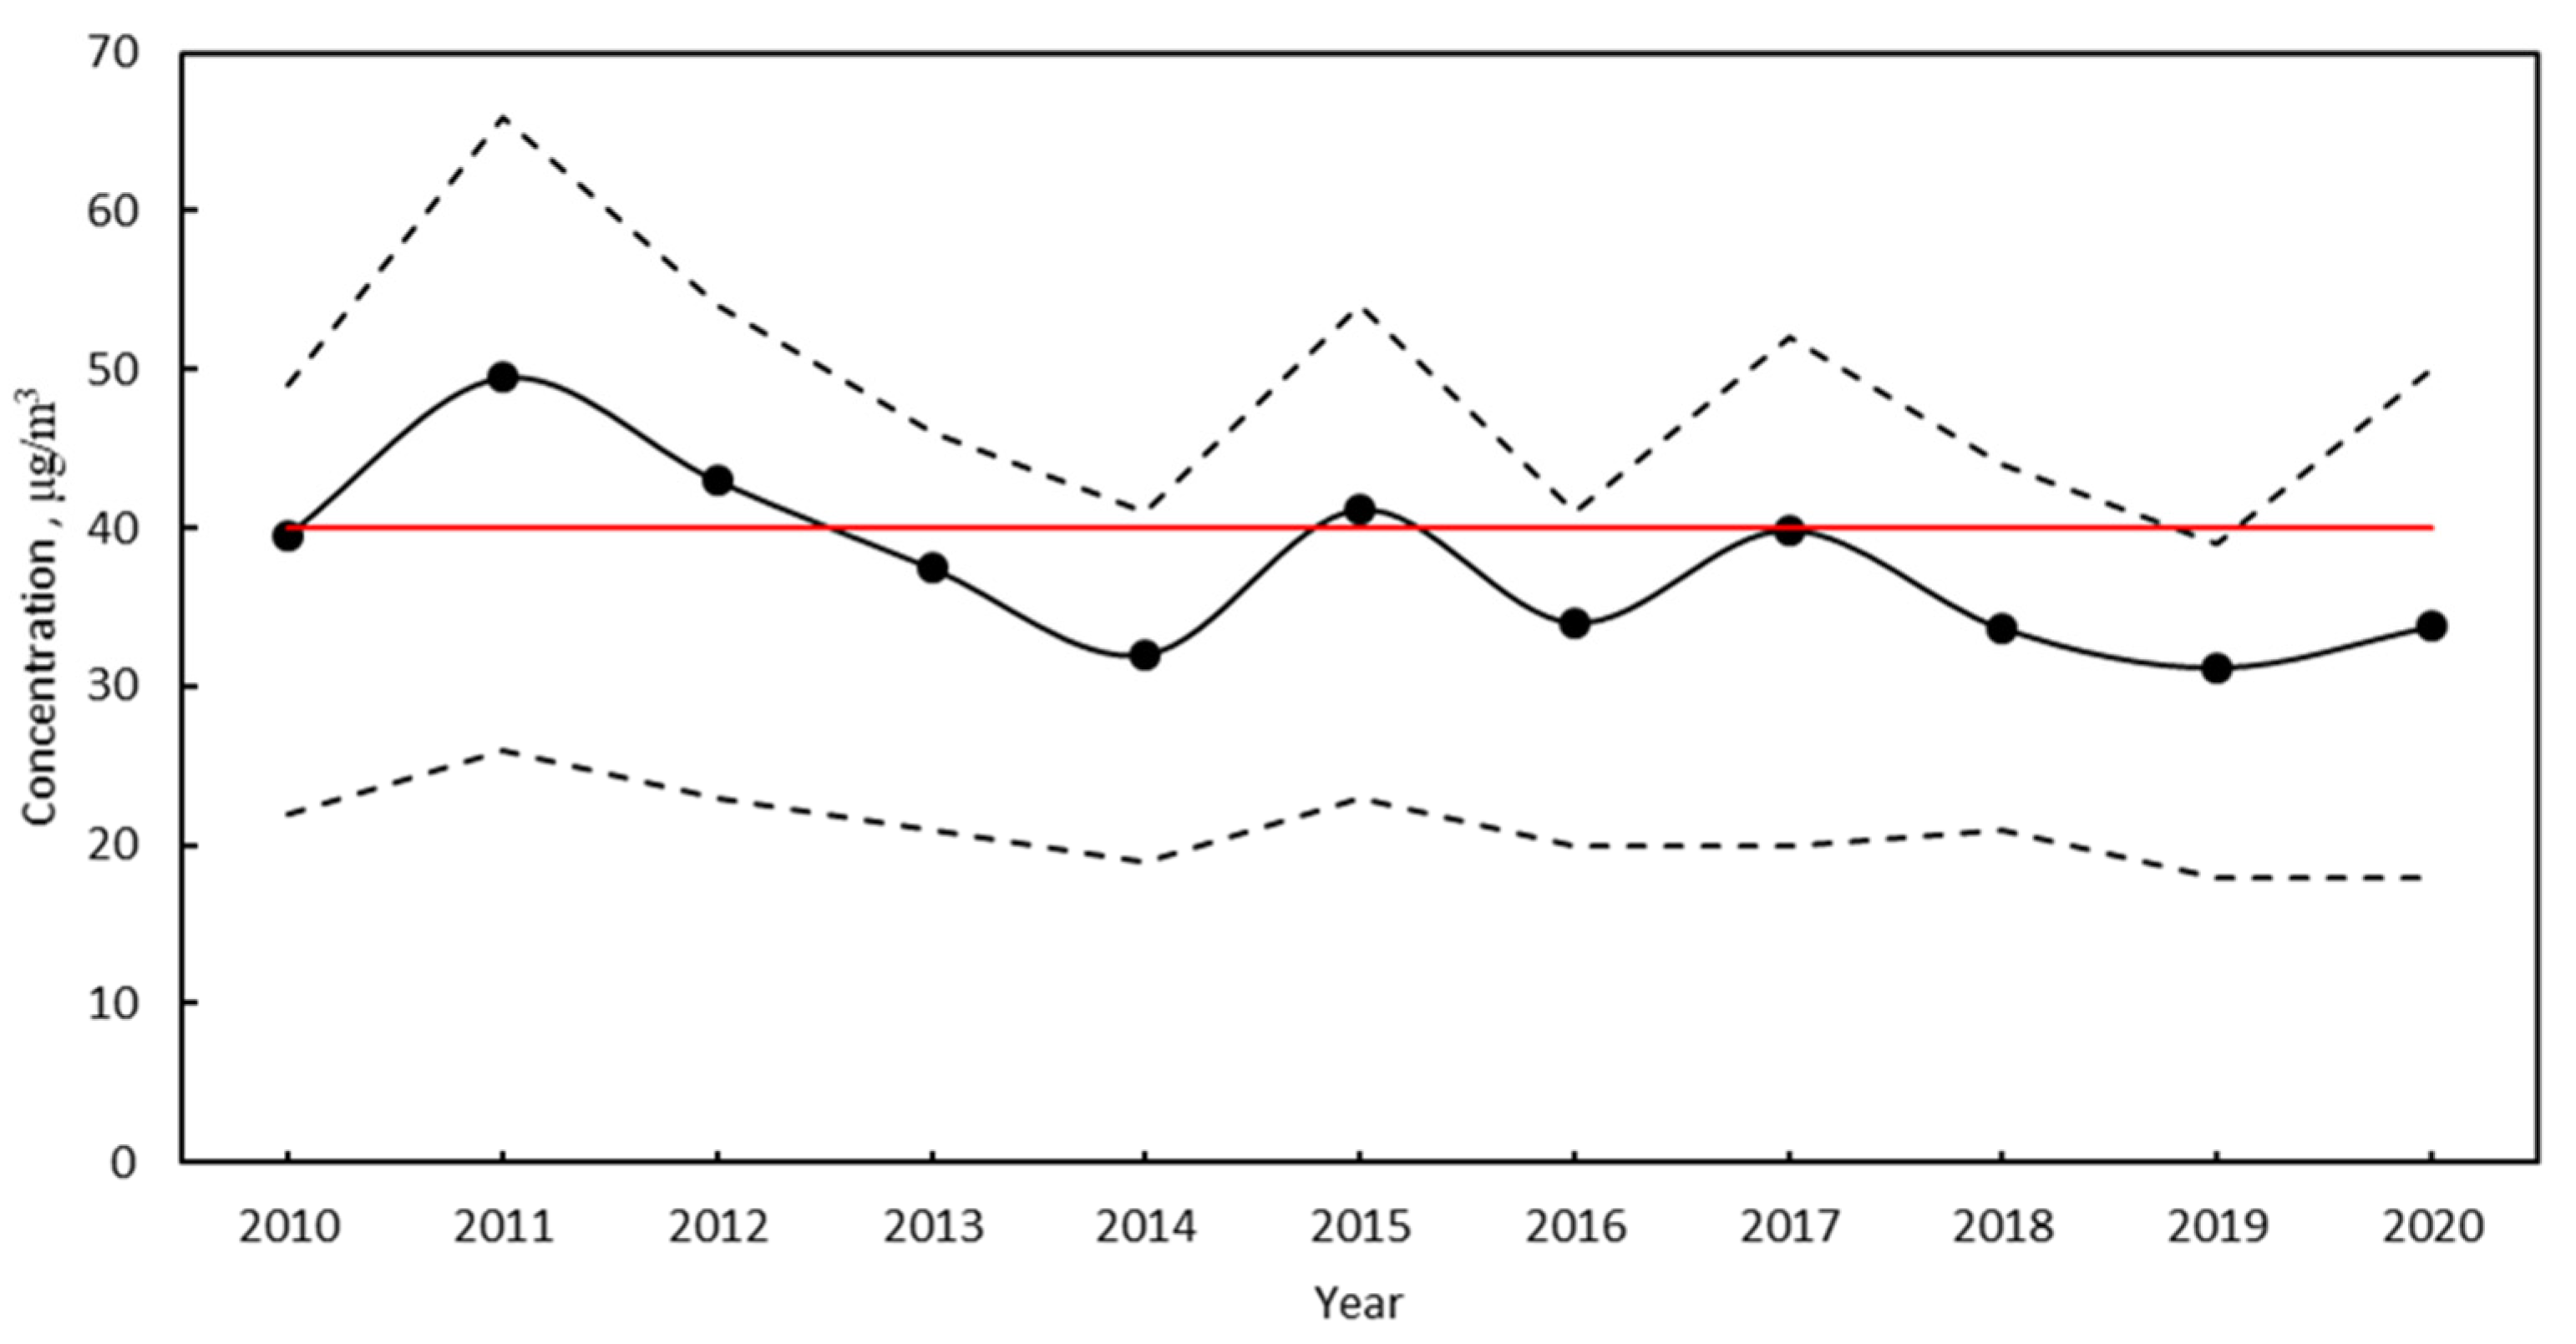
To understand the pollutant values measured during the March 2020 lockdown, it is necessary to extend the analysis to previous years to compare the pollution levels. Therefore, the first analysis was carried out using the historical data of PM10 measured in Milan by the air quality monitoring network of ARPA Lombardia. The annual PM10 concentration values were taken from the ARPA Lombardia reports for 2010–2020.
The analysis starts from the trends relating to PM10 concentrations on an annual basis. The annual average limit of 40 µg/m3 (according to Legislative Decree 155/2010) was not exceeded in the years 2010, 2013, 2014, and 2016, with a decreasing trend between 2017 and 2019. (Figure 3).
In September 2010, Legislative Decree 155/2010 was adopted in Italy, which implemented the European Directive 2008/50/CE for cleaner air in Europe. Since then, in Italy, policies to improve air quality have been implemented, leading to a decrease in the PM10 annual average values measured. This decrease has settled in recent years, reaching slightly different values between 2018 and 2020 (Figure 3).
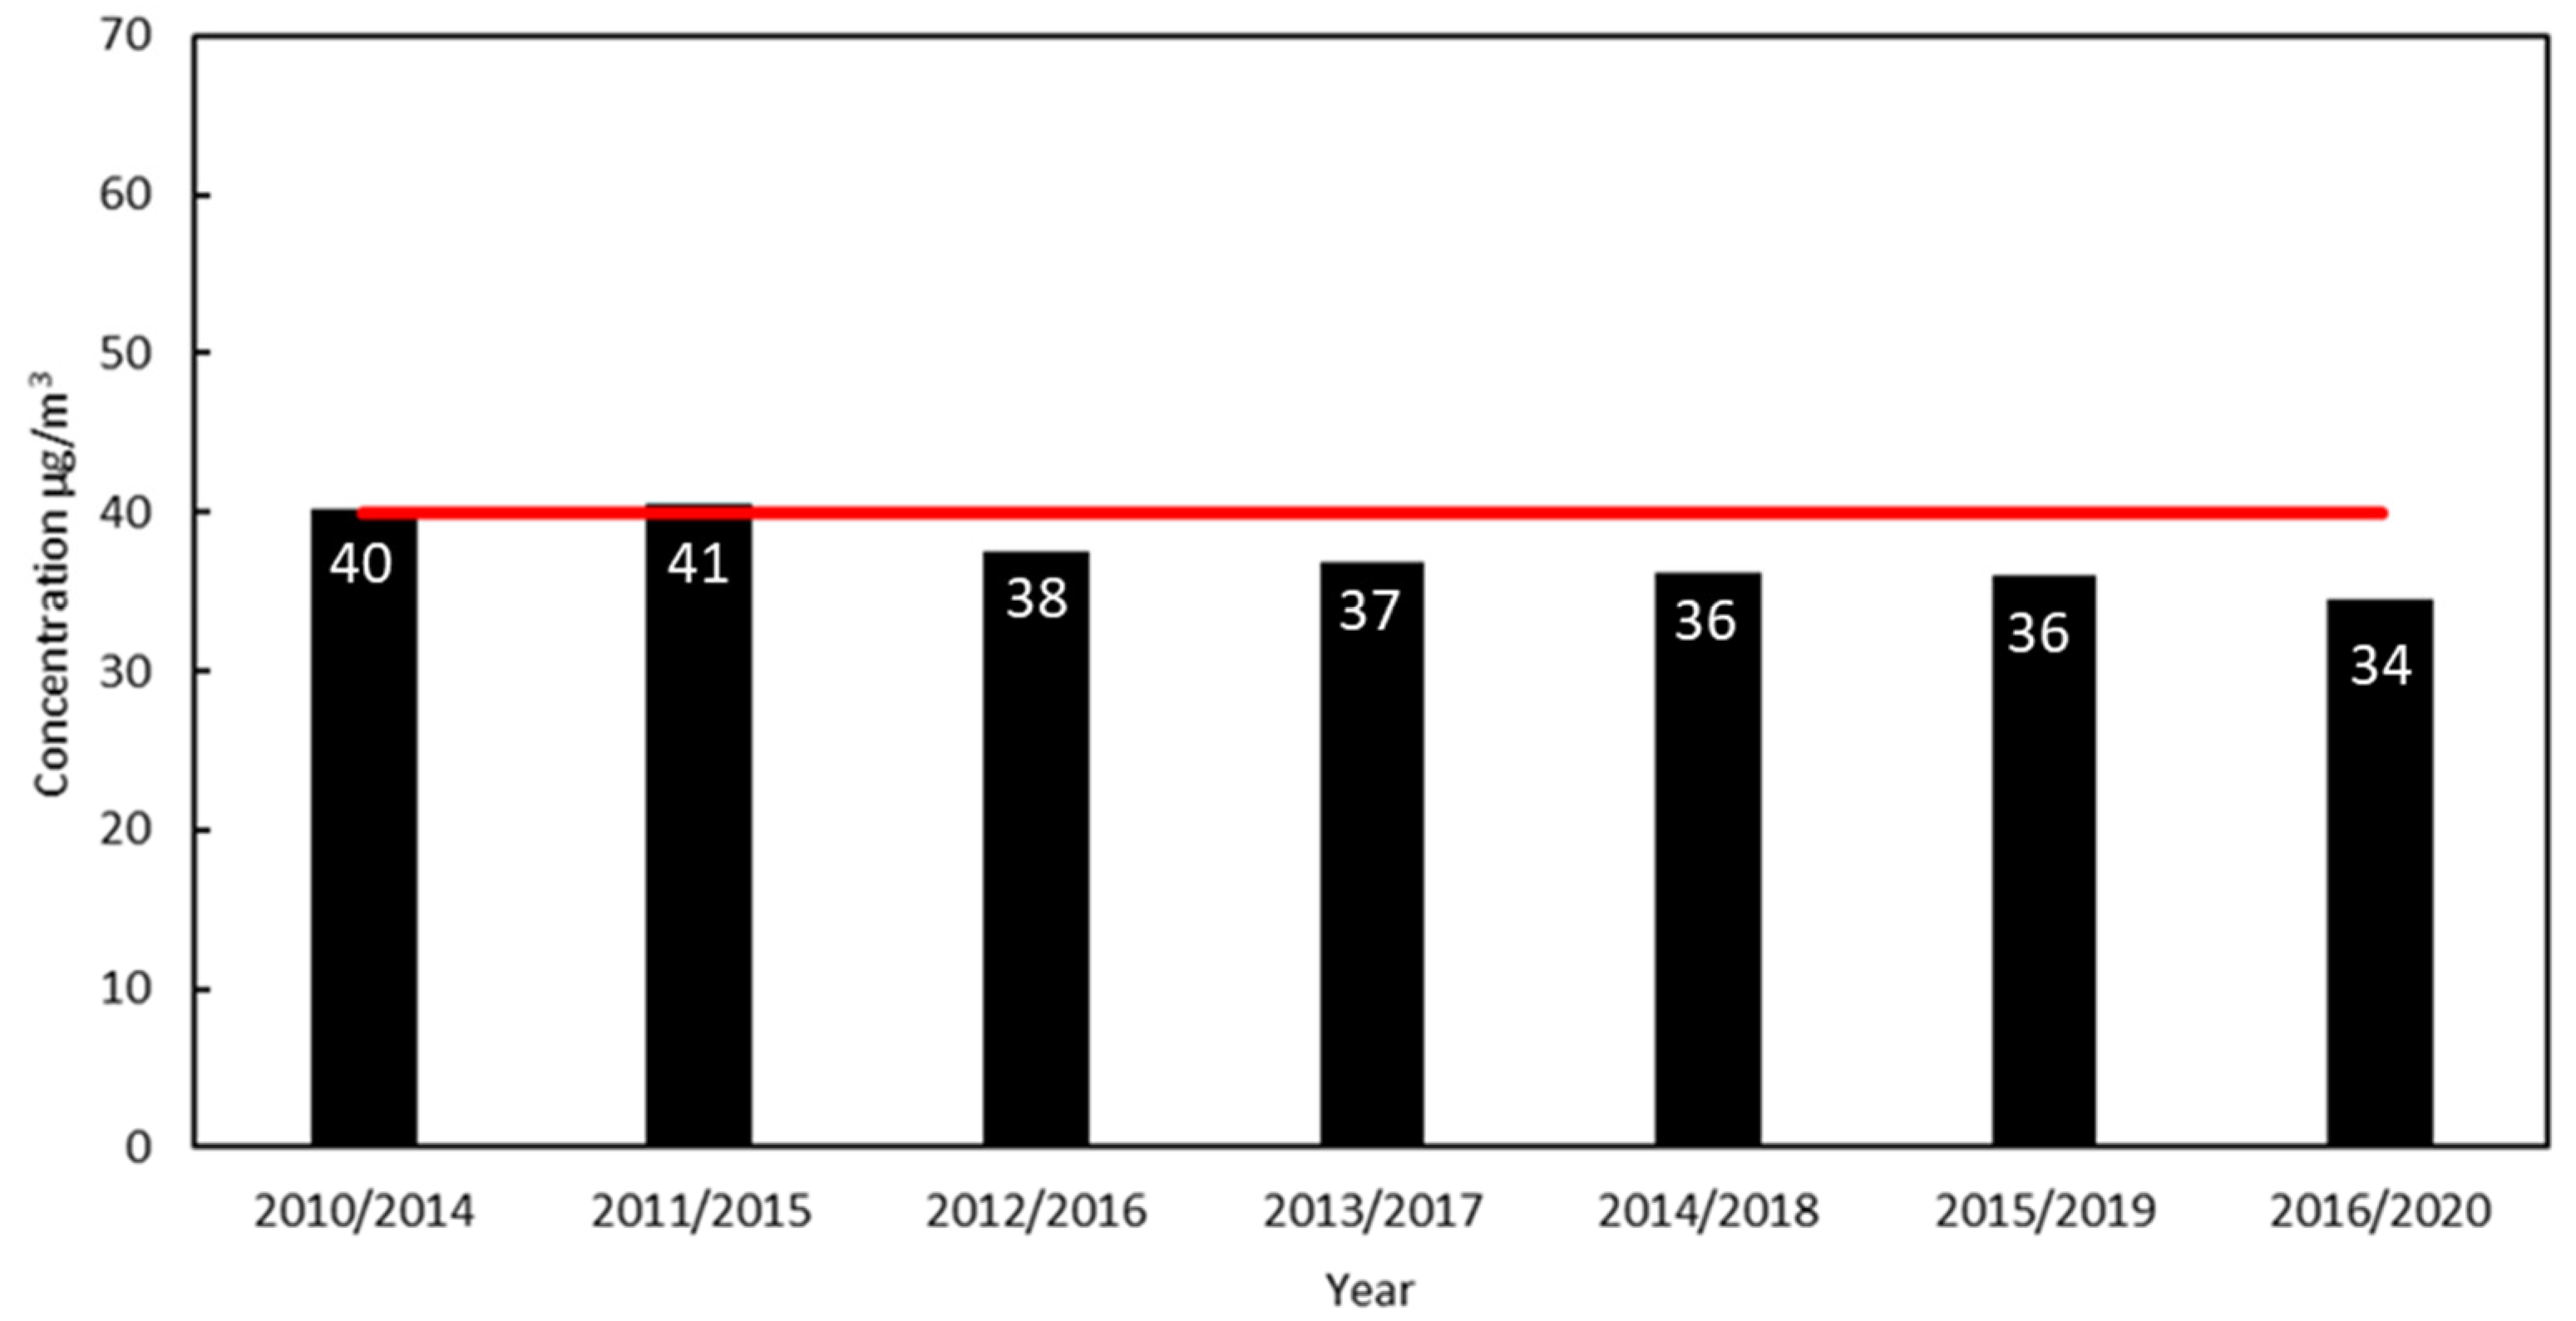
To better define the multi-year trend, eliminating the variability between contiguous years due to different meteorological conditions, the five-year moving average was calculated (Figure 4). In this way, considering that the meteorological difference over five-year periods is less evident, the trend linked to the emissions is highlighted more clearly. The Figure 4 analysis clearly shows the decreasing pollution trend over the years. If all the variables that influence the phenomenon have been excluded, it is possible to verify its actual evolution.
3.2. Trend Analysis of March 2020
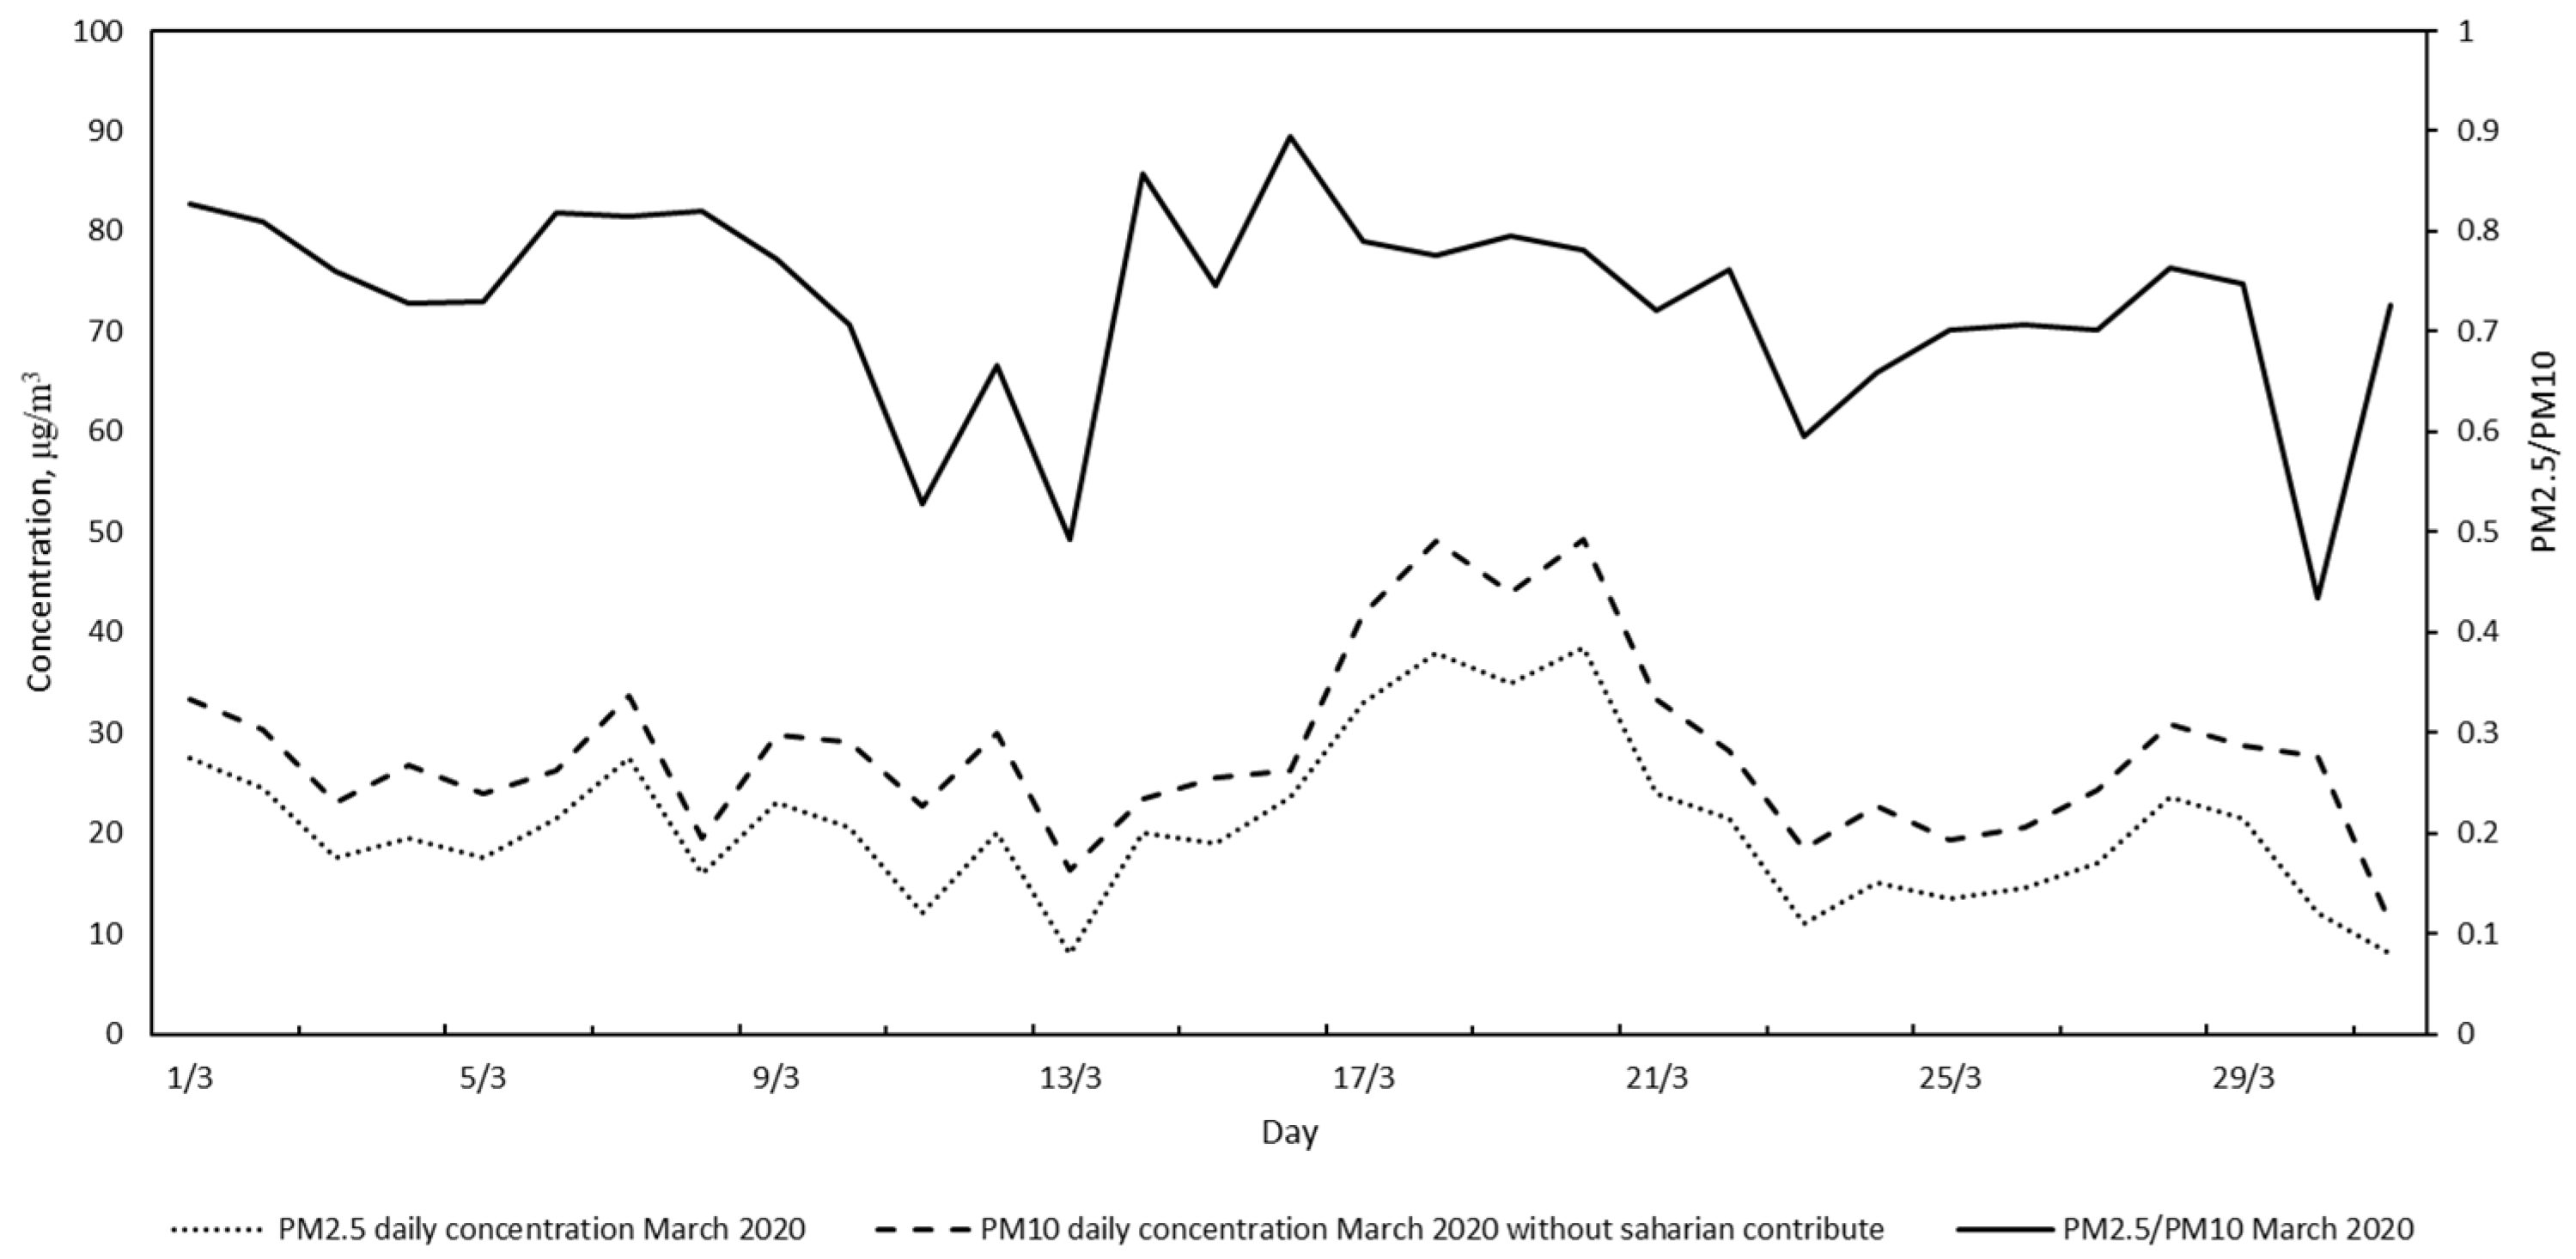
To analyze the lockdown pollution trend in Milan, it is useful to divide the time series into two periods. The first was between 23 February and 8 March, in which the restrictive measures were gradually introduced. The second was from 8 March to 4 May, in which the measures of containment were stronger, since a strict lockdown was imposed. It can be seen from Figure 5 that, up to 9 March, the particulate pollution levels were low and slightly decreasing. An increase in pollution appeared in the period between 17 and 20 March. The increased values in this period were due to an accumulation of pollutants, connected to the high atmospheric pressure and the consequent low wind intensity, both in the period records. In fact, these are the typical atmospheric phenomena which favor air stagnation and pollutants accumulation Moving forward in the month, a very high peak is found in the period between 28 and 29 March. In order to understand the origin of this peak, we can refer to the ratio between the concentrations of PM2.5 and PM10 (black solid line in Figure 5), the low value of the ratio for this period suggests the external origin of these particulates. In fact, according to the global aerosol “Copernicus Atmosphere Monitoring Service” forecast, those days when a mass of dust from Central Asia hit Europe determined a raise of the measured values of the larger particulates (map showing the mineral aerosol covering Italy is available in the Supplementary Materials). The transported particulate was of desert and sandy origin, mainly composed of siliceous materials. This represents a further difference from PM10 of urban origin, mostly characterized by the presence of carbon- and metal-based particles.
From a climatic point of view, the Mediterranean atmosphere (MED) is characterized by rainy winter seasons and hot and dry summer seasons that affect the continental areas. It is characterized by the particulate of anthropogenic origin (coming from the large industrialized European regions), the natural particulate of crustal origin (coming from the extensive arid and semi-arid areas of Africa and the Middle East), and of the aerosols of marine origin (generated by the MED), that of volcanic dust, emitted by the main volcanoes of the basin, such as Etna and Stromboli [25].
Some methodologies to estimate the contribution of Saharan dust on urban pollution were reported in the literature, such as the analysis by Bonasoni et al. [26], which confirms that the mineral aerosol contributions to the urban PM10 values can be very critical, favoring overcoming critical thresholds. The PM2.5/PM10 ratio curve, reported in Figure 5, shows a minimum during 28 and 29 March that clearly defines the Saharan dust event. During these days, the PM10 and PM2.5 are not proportional so, an external PM10 contribution should be added to the urban particulate. To evaluate the urban PM10 value, the one measured during the Saharan event should be cut by the mineral aerosol contribution. In the proposed case study, to estimate the contribution of Saharan dust to urban PM10, the average ratio between PM2.5 and PM10 was calculated over March 2020, excluding the Saharan dust events days. The average PM2.5/PM10 value obtained was used to estimate the urban value of PM10 on 28 and 29, with respect to the PM2.5 values measured. The estimated PM10 values for 28 and 29 are reported in Figure 6. In Figure 6, it is possible to see how the peak between 28 and 29 March smooths down, with a consequent increase in the value of the PM25/PM10. This estimated PM10 value will be used for all PM10 analysis in March 2020. The contribution of the Saharan dust to urban pollution is a phenomenon to be taken into account, in order to define the actual pollution levels. Saharan dust being of natural origin is beyond human control and independent from anthropogenic activity [27].
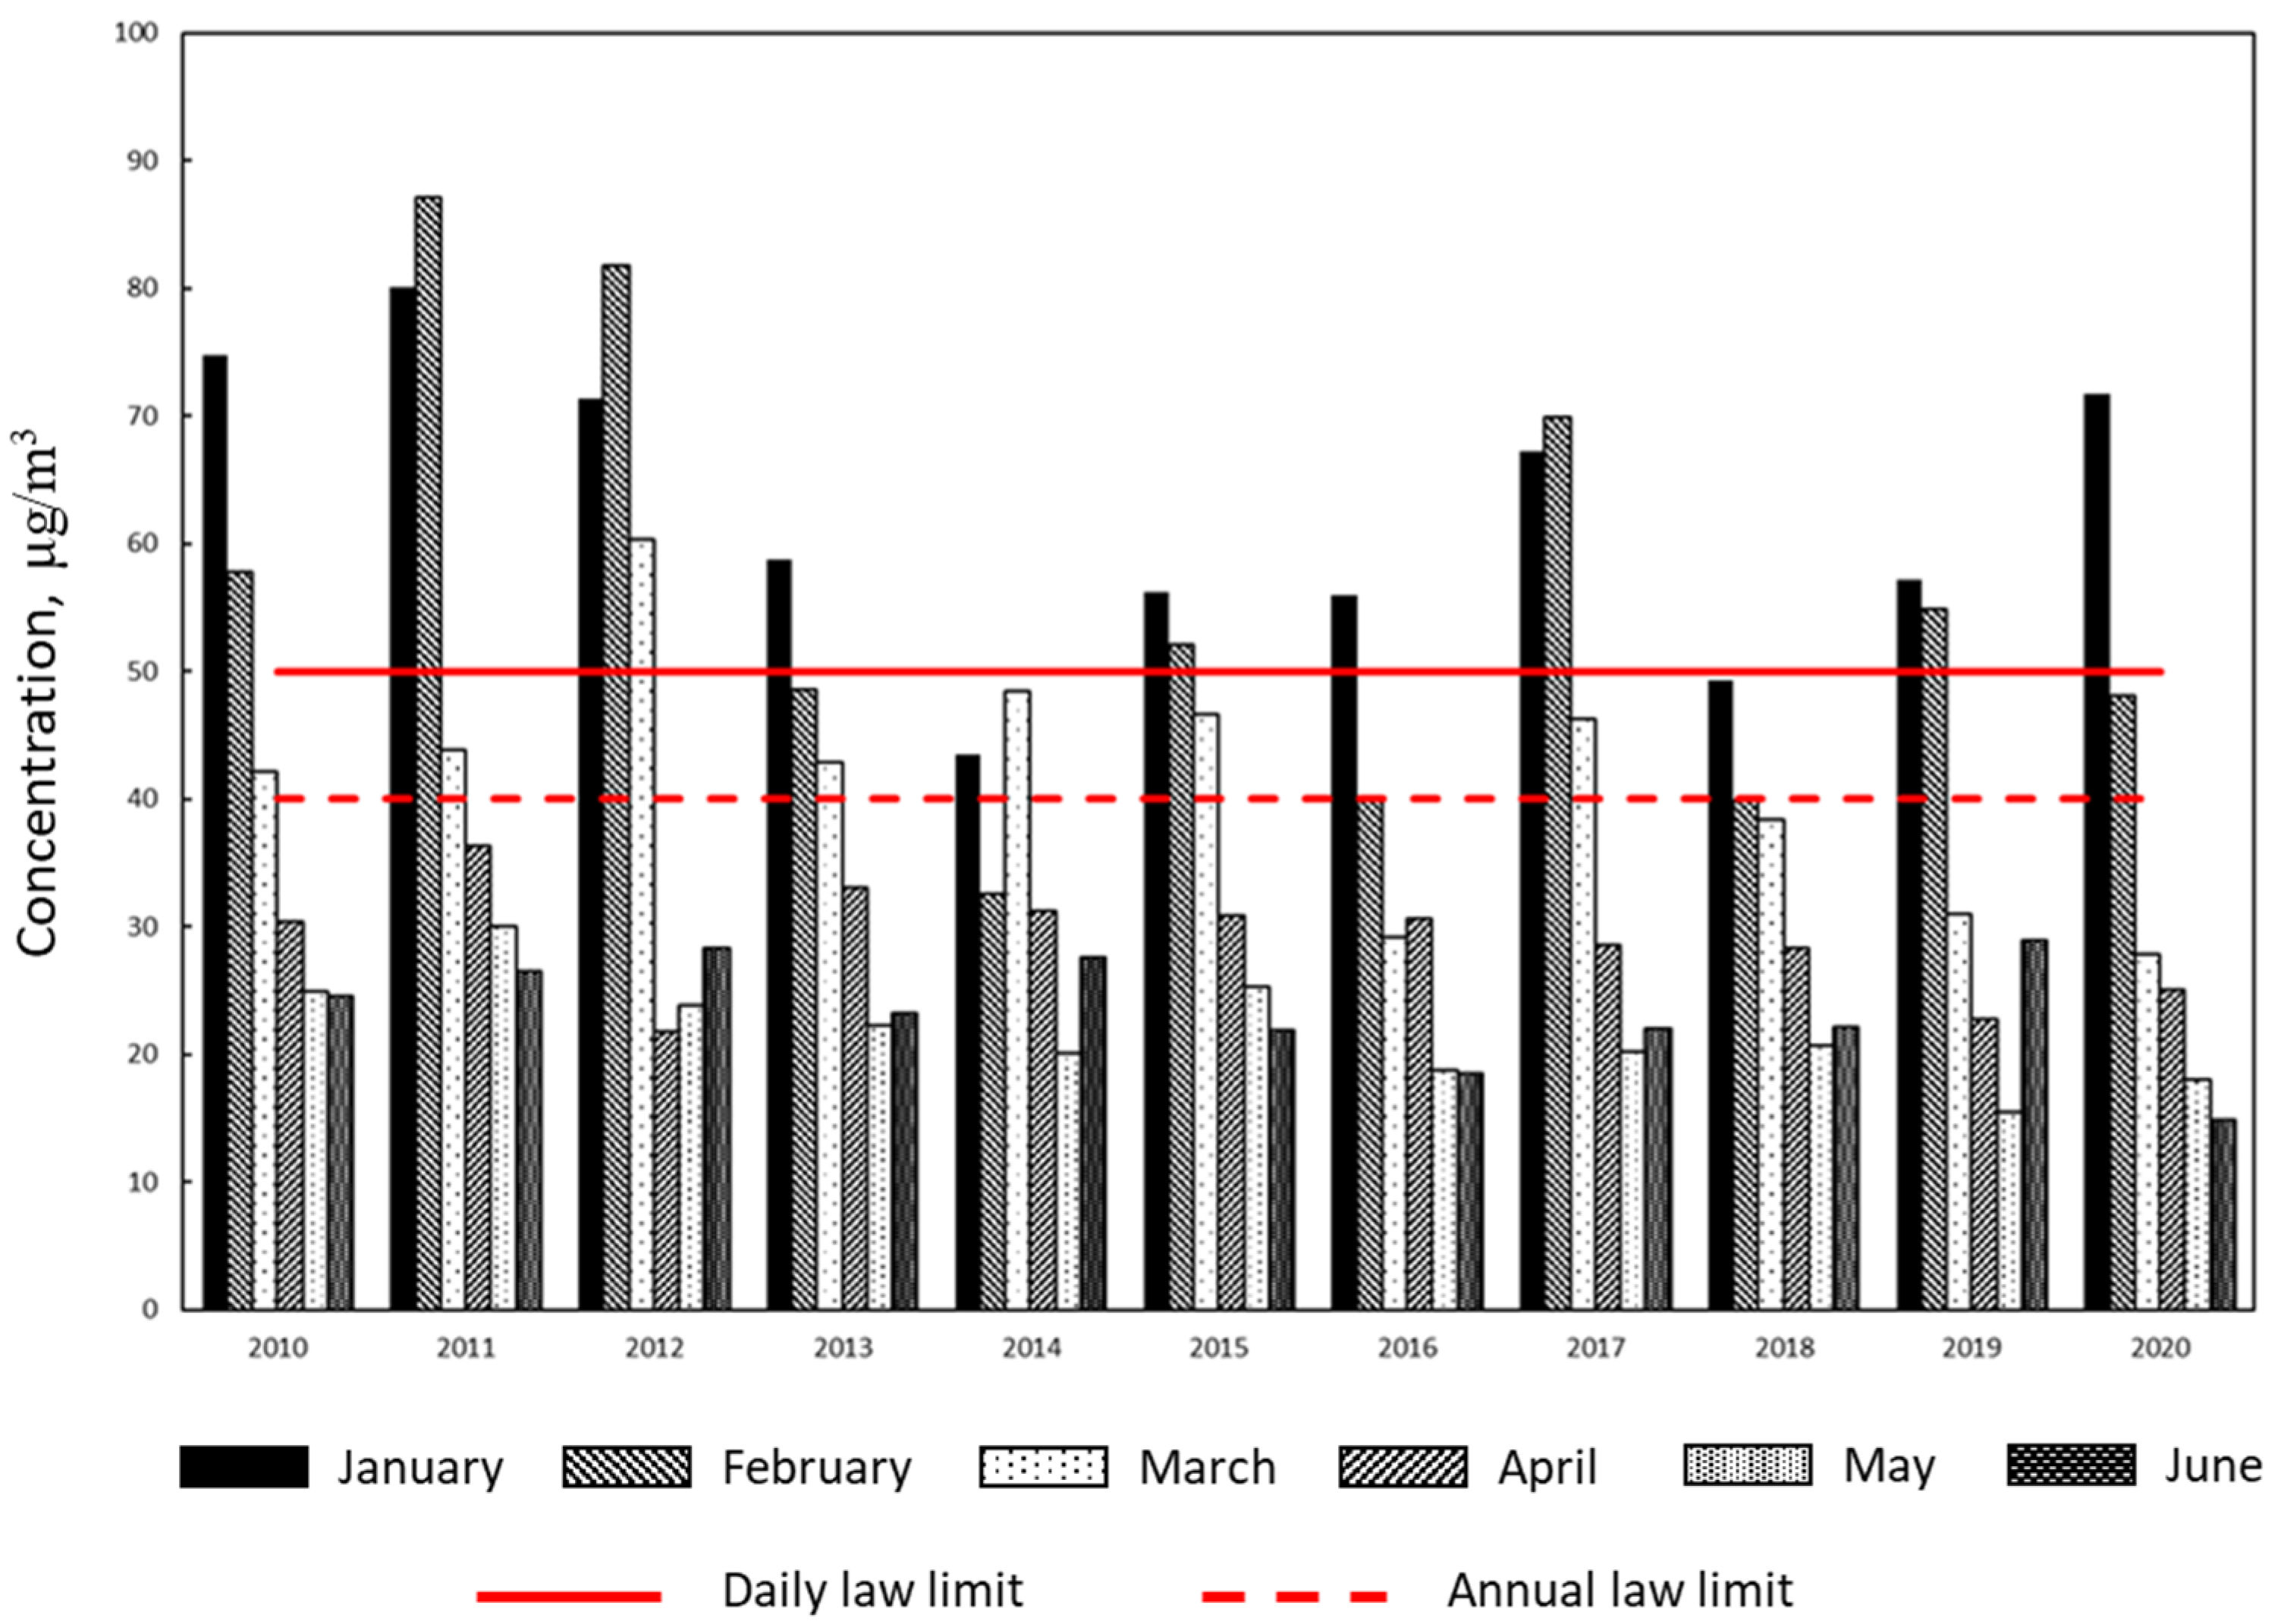
3.3. Trend Analysis of the First Six Months of the Years between 2010–2020
Provided that the data from March, without exceptional meteorological contributions, is useful to analyze, in detail, the differences in the 2010–2020 period, especially between the months of January, February, March, and April, which characterized the lockdown. From the values shown in Figure 7, it can be seen that, considering the month of March, years 2016 and 2020 showed the lowest concentration value of PM10. In particular, it appears that March 2020 was the month with the lowest pollution levels in the last ten years (net of Saharan dust contribute). The Figure also clearly shows the well-known seasonal nature of pollution, higher during the winter season, for the high emission from domestic heating. Coherently, during the spring/summer season, pollution levels decrease, and mostly, the contribution of vehicular traffic and industrial activities plays a role. The particulate matter concentration measured in January is generally greater than that measured in February. Only in 2011, 2012, and 2017, the concentrations measured in January were lower than in February. These inversions could be related to the well-known permanence phenomenon of particulates that can remain in the atmosphere for several weeks, accumulating and, therefore, showing a maximum in concentration shift forward, concerning the maximum the emission rates. April 2020 appears to have quite low values, similar to those recorded in 2012 and 2019. The month of June 2020 had the lowest concentration ever measured since 2010. Overall, considering that data in the period from March–June 2020, the generally very low values are evidence of the lockdown’s positive effect on the air quality.
3.4. Trend Analysis of March–April 2018/2020
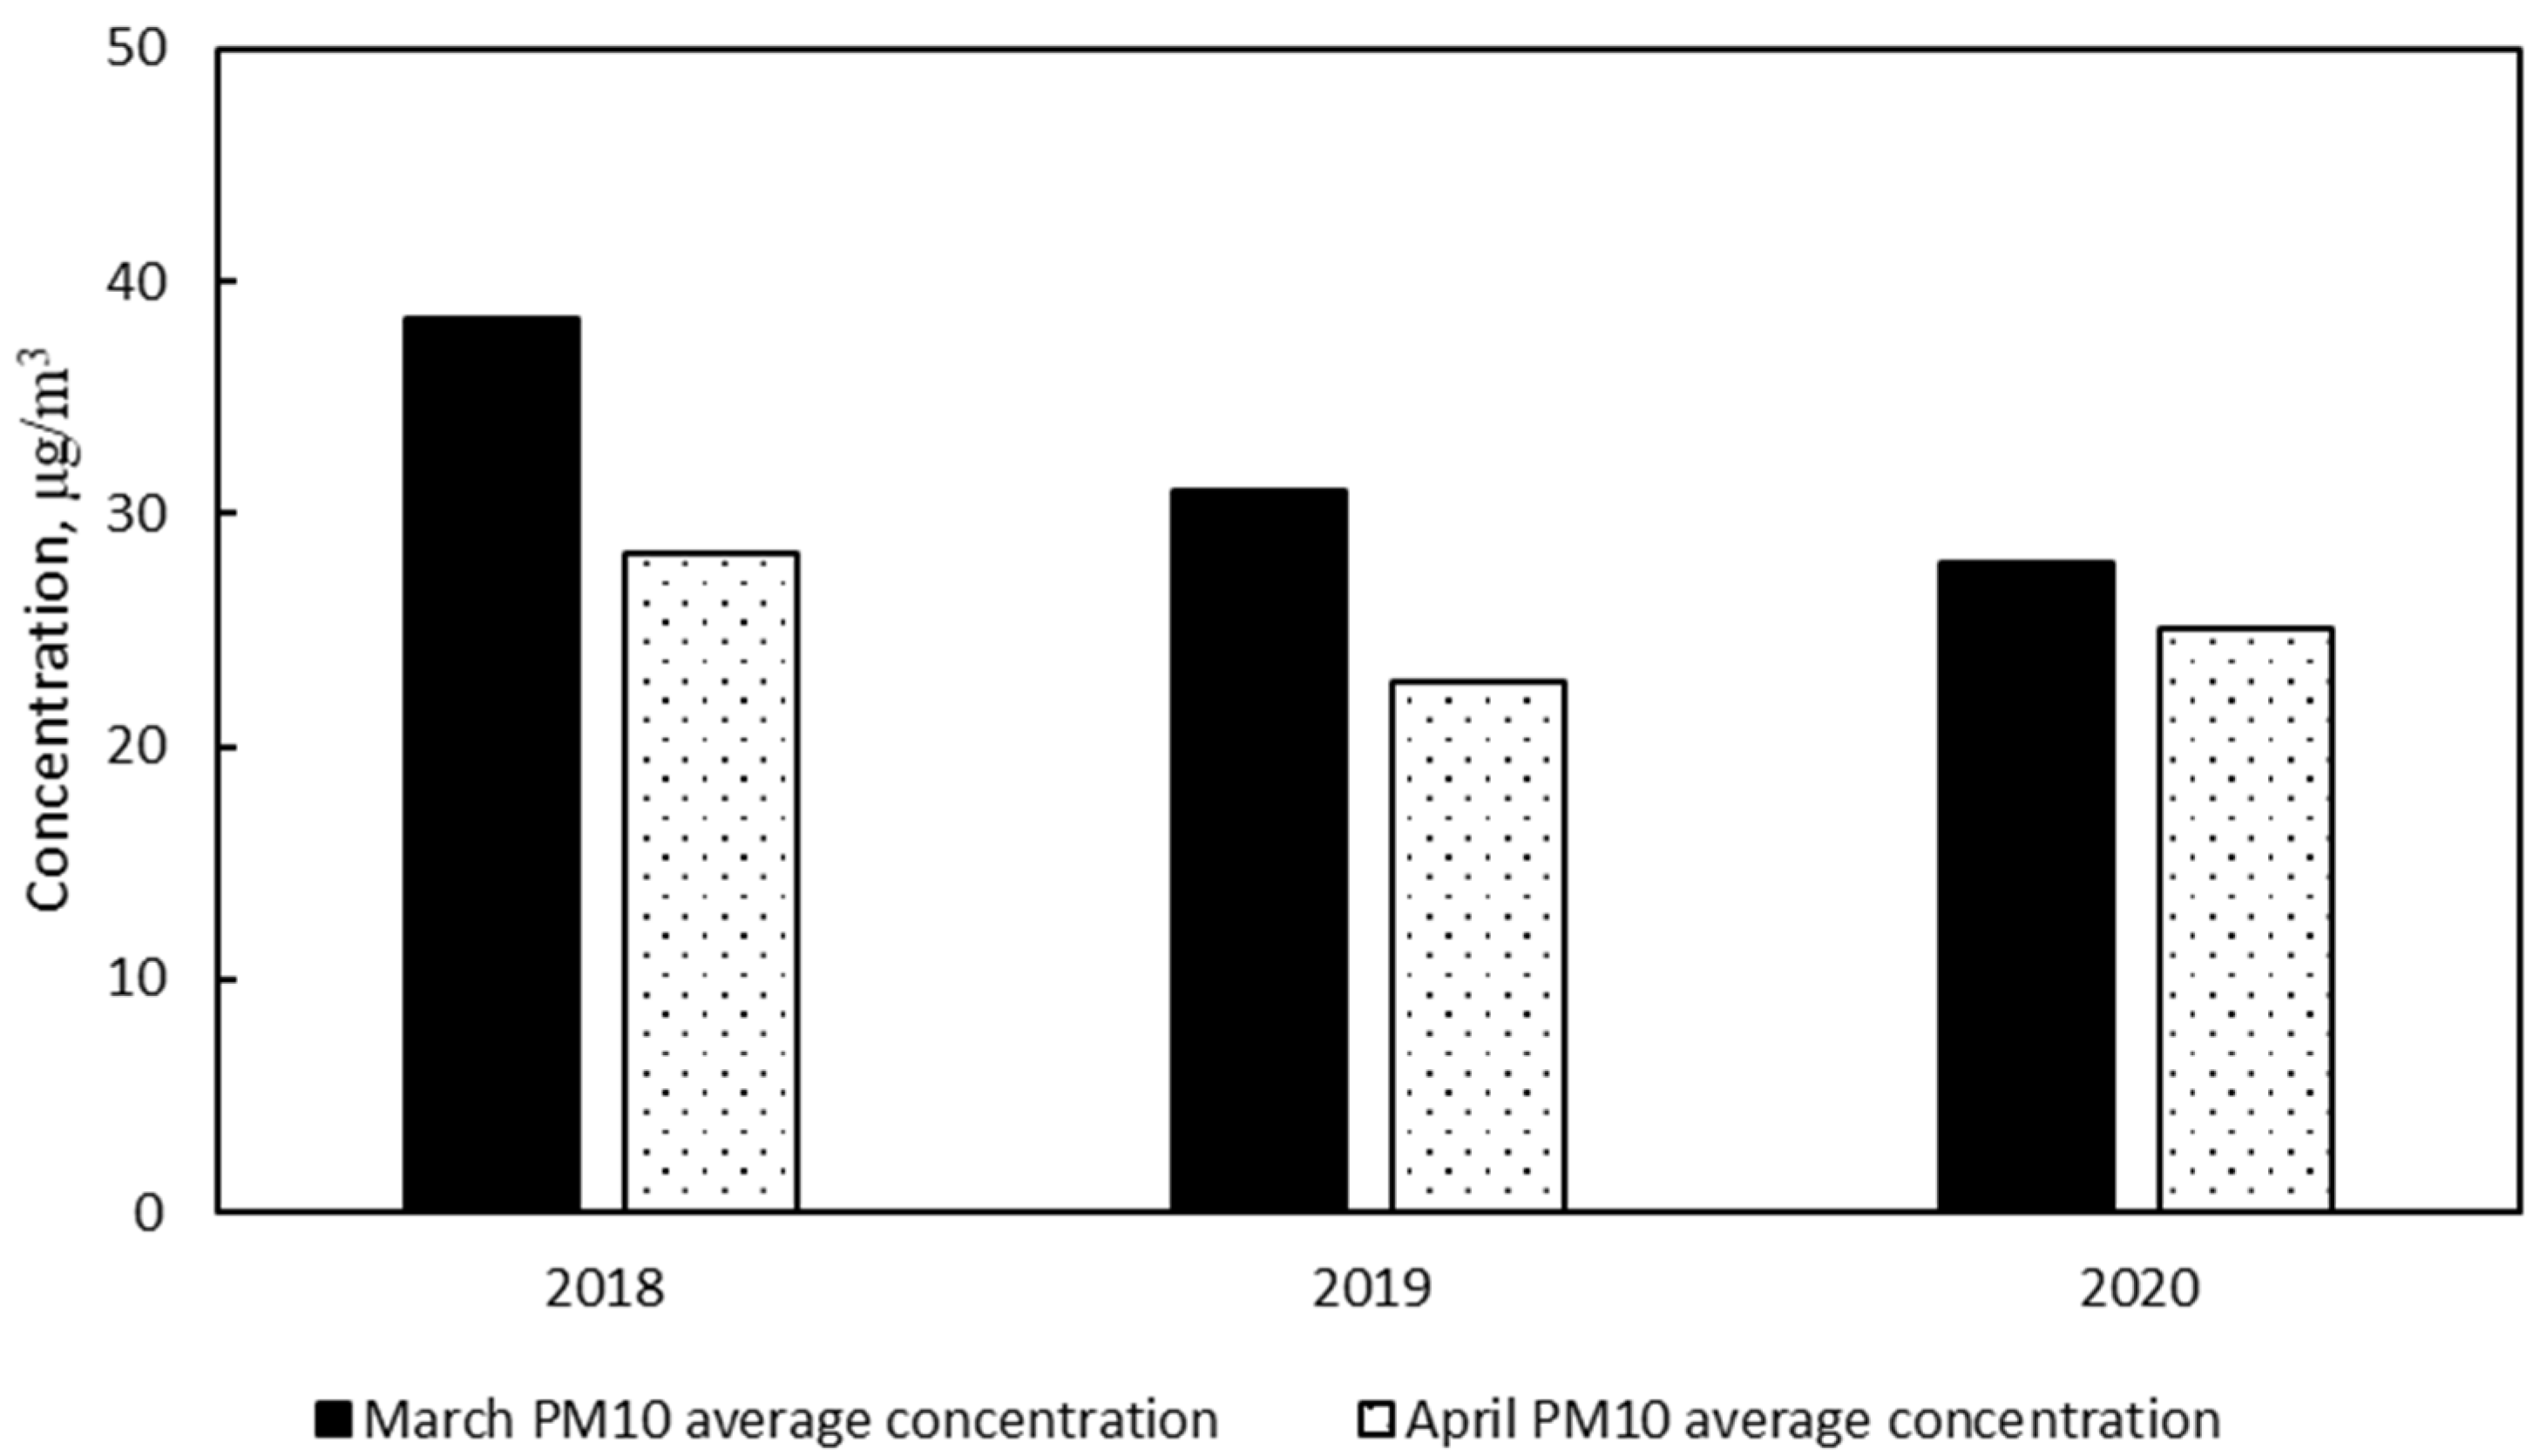
The evidence of the lockdown’s effects on the air quality and the PM10 data of the March and April period was aggregated for 2018–2020 and reported in Figure 8. Inspection of the Figure indicates that PM10 progressively decreased during the observed period, while the value of PM2.5 had a minimum in the year 2019.
3.5. Traffic Analysis
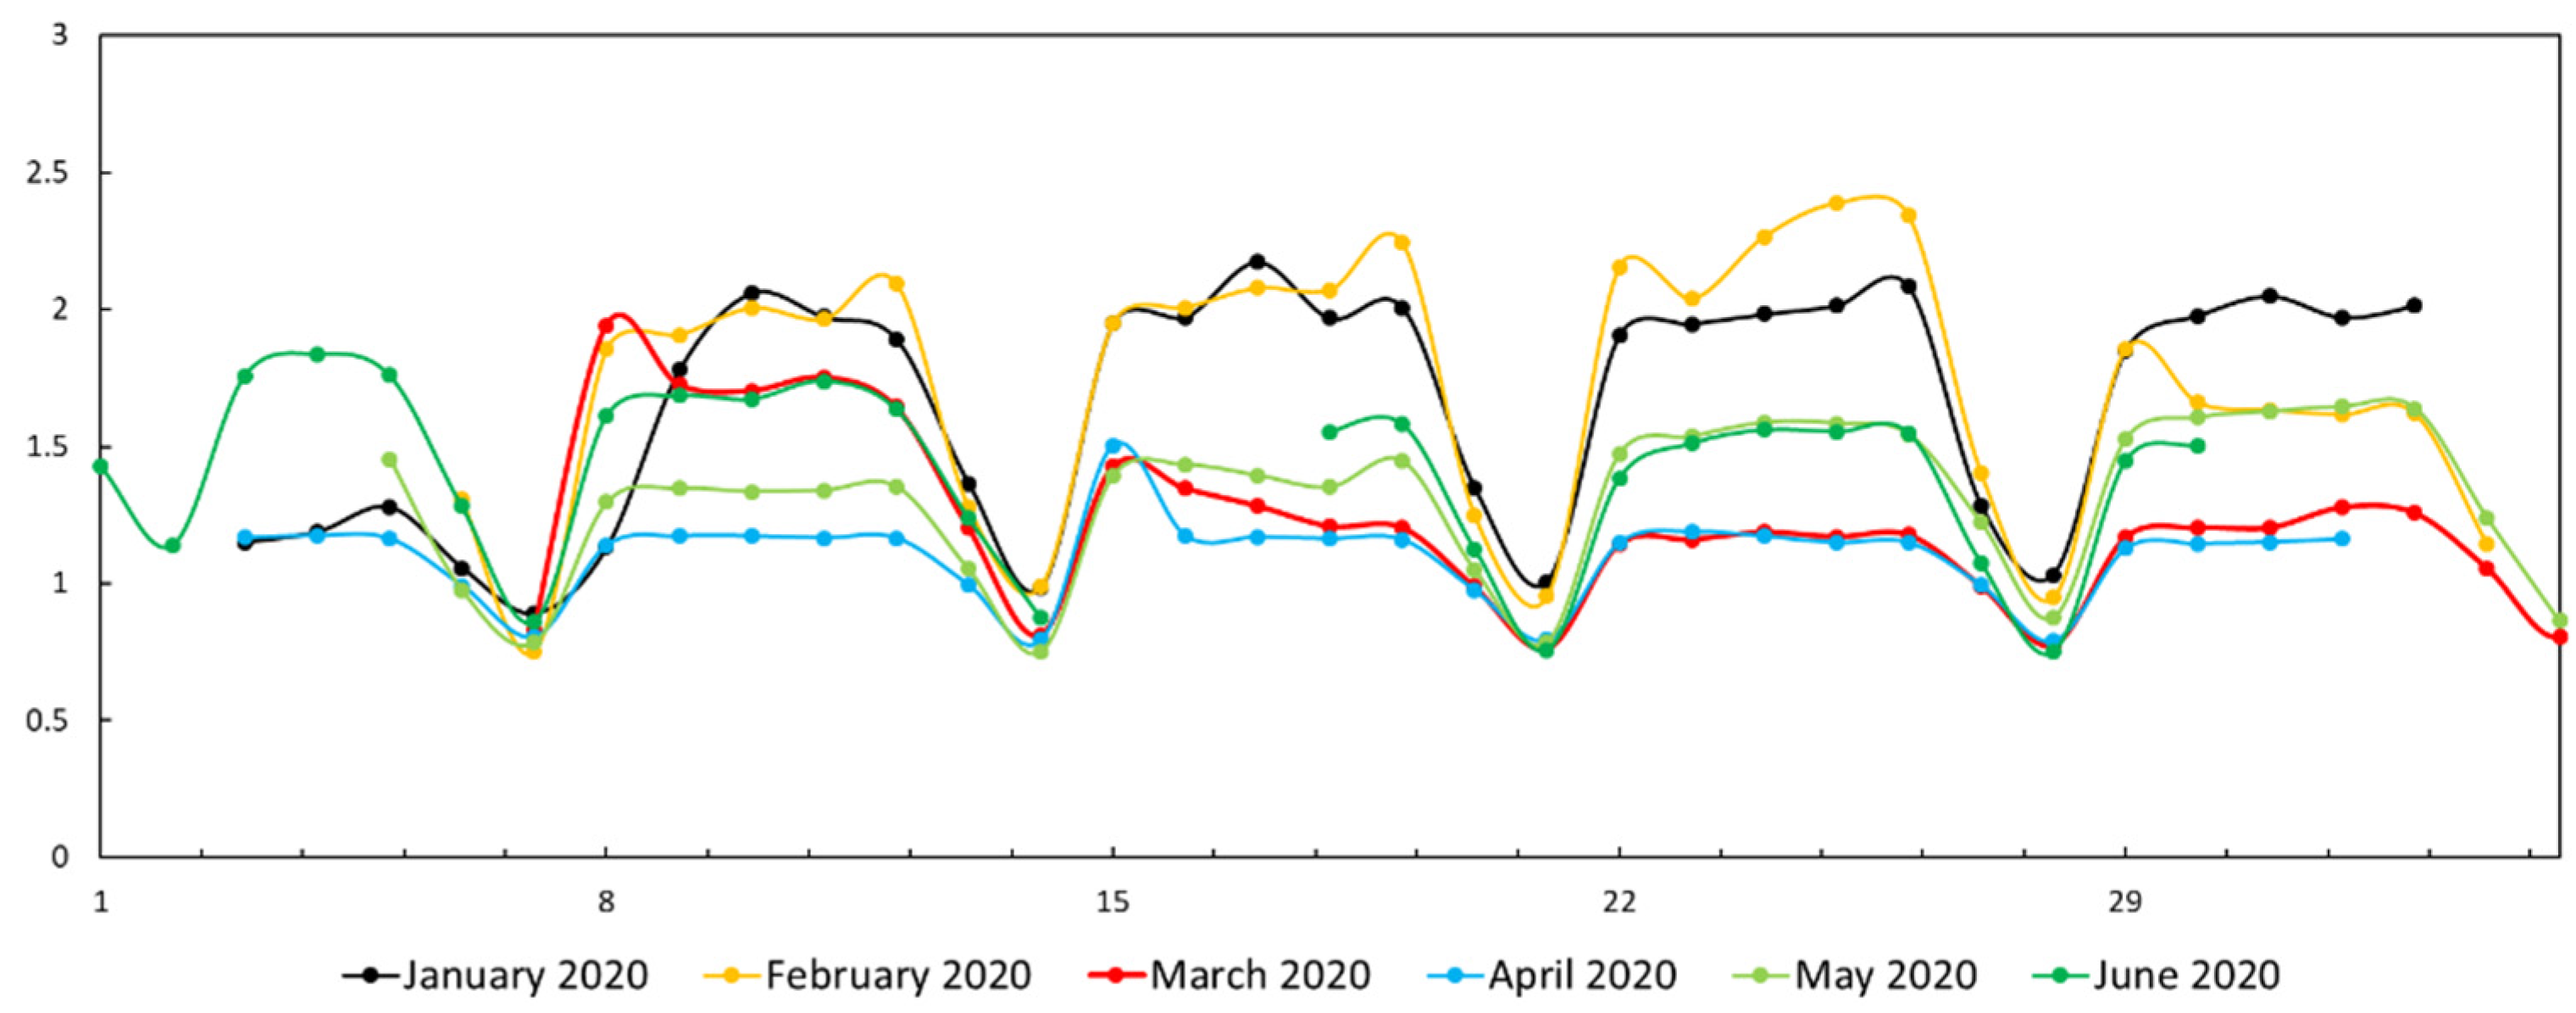
One of the variables that affects air particulates levels is vehicular traffic. In particular, it contributes both with the emissions (due to the fuels used) and the wear of the cars mechanical parts (coming from brakes and tires). The weekly traffic behaviour, with a minimum corresponding to Sundays, is evident from Figure 9, which shows the traffic flow recorded in the period January–June 2020. The figure shows that, since the start of the lockdown in March, there was a progressive reduction in traffic levels, reaching a minimum in the month of April. Even during the lockdown, finite levels of traffic flow were observed due to residual private traffic, public transport, couriers, and all other vehicles in service for public utility. The evident reduction of traffic during the lockdown was likely to have positively influenced the reduction of pollution. With the resumption of anthropic activities, traffic flow rose again (May and June); however, it did not reach January and February levels.
3.6. Meteorological Aspects
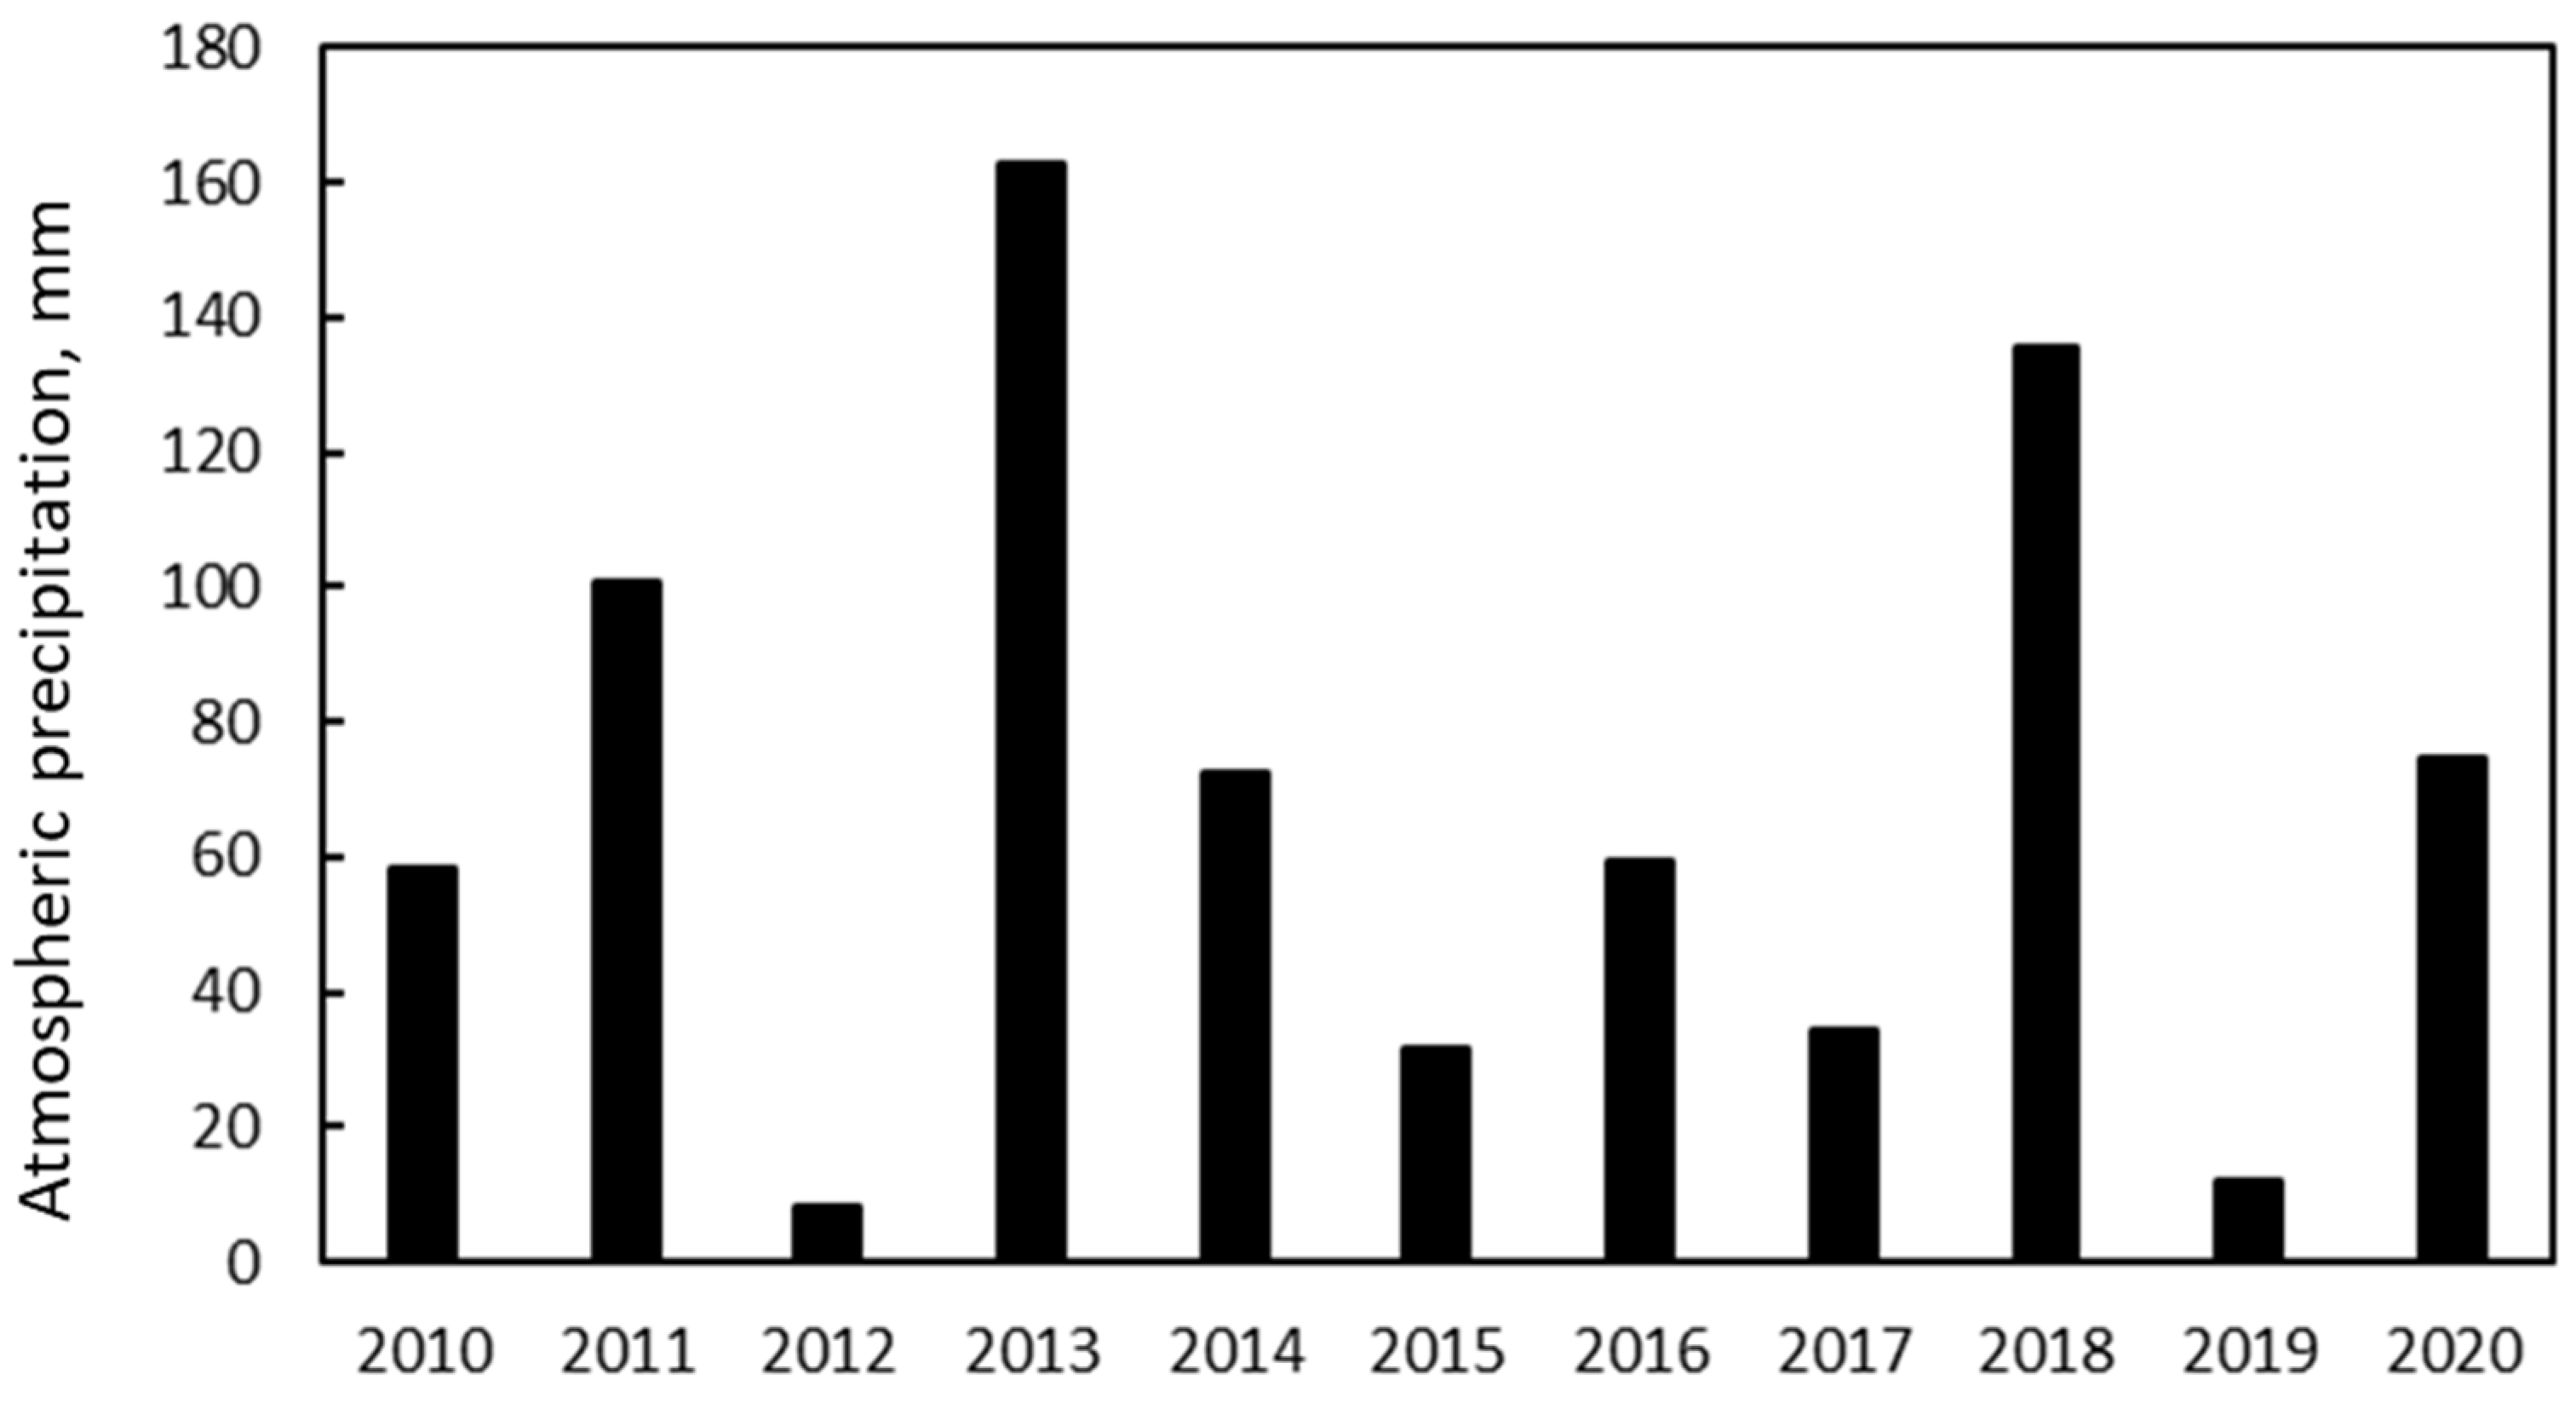
All of the 2020 measured data should be interpreted while also taking into account the meteorological variables that can affect pollution. Precipitations as the rainfall cumulative daily value (Figure 10), as well as the number of rainy days, together with the average monthly temperature (Figure 11) strongly influenced the pollution levels. The seasonality of pollution indicates the months of December to March as those when pollution levels are higher. Despite the high probability of rain, the high atmospheric pressure that characterizes the winter months favors the accumulation and stagnation of pollutants in the air. January 2020 was characterized by minimum temperatures close to the period average and maximum temperatures significantly above the average. This difference was determined by favourable conditions: despite a rather mild air mass, the minimum temperatures at the ground were affected by continuous thermal inversions, which kept the values rather low. The lowest temperature in January was recorded on day 13, with −3.6 °C, while the highest high was recorded on day 29, with 14.8 °C. There were 20 days with temperatures below zero degrees, compared to an average of 17 in the last decade. From the pluviometric point of view, the month of January 2020 recorded lower than average rainfall values, with almost all rainfall falling in a single event on day 18.
February 2020 was characterized by significantly higher than average temperatures and is considered the mildest February of the last 20 years. It was the ninth consecutive month showing temperatures above the average of the last decade. The lowest value in February was recorded on day 6, with −2.5 °C, while the highest temperature was recorded on day 11, with 19.3 °C. There were only five days with temperatures below zero degrees, compared to an average of 9 in the last decades and 13 in 1981–2010. From the pluviometric point of view, the month of February recorded much lower than average rainfall values, bringing the annual deficit to about 100 mm. In particular, the day 26 was characterized by a strong Föhn wind (about 31 km/h maximum), which massively affected the lowering of particulate concentrations.
March 2020 was characterized by temperatures very close to the averages: the recorded temperatures were slightly lower than what was typical of the last decades but still slightly higher than averages, in reference to the last century. The lowest temperature in March was recorded on 24, with −1.3 °C, while the highest on 19, with 20.7 °C. There was a single day with negative minimum temperatures, in line with the last decade and below 3 °C in the 1981–2010 period. From the pluviometric point of view, March recorded rainfall values in line with the averages.
The mild weather in the months of February and March certainly reduced the heating power of domestic heaters, but emission might have been compensated by a longer period of operation, due to the prolonged presence of people at home.
Figure 10 and Figure 11 show that March 2013 and 2018 were characterized by numerous rainy days and high atmospheric precipitations. This affects the quantity of particulate matter measured with low PM10 levels in those years.
High atmospheric precipitation favors pollution abatement. As seen in Figure 7, the years with high rainy days correspond to low PM10 concentrations. The temperature measured during March (Figure 11) indicates the characteristics of the season. It is logical to assume that the lower the temperatures, the higher the pollution, due to the intense utilization of domestic heating. Combining the effect of temperature and rain, new scenarios can be considered. A year with low temperature but with a high number of rainy days will reasonably show a low pollution level. The high pollution levels, reached by the intense usage of domestic heating, are compensated by the rain that decreases the pollution level. These conditions characterized March 2013 and 2018; Figure 7 shows low PM10 concentrations, despite the low temperature measured.
3.7. Comparison of Mobile Network Data with ARPA Lombardia Network
Data from ROMS are compared with those measured by the ARPA Lombardia air quality network in Figure 12. ARPA air quality data are taken from a single station. ROM network data are taken by averaging all the measured data coming from cells within the same NIL where the ARPA station is located. Data measured by both kinds of monitoring networks are in agreement if referred to the trends, even if reporting different absolute values. The differences between the values most certainly lie in the different measurement methods, which, therefore, lead to intrinsic variations of the measurements, but above all, of how data are aggregated. Moreover, ARPA values refer to point measurement, while ROM values are averages of data taken throughout the territory. From Figure 12, it is clear that from March to June the agreement between the two measurements was greater. The other months (Figure 12a,b) showed a reduction of PM10 pollution at the urban traffic station (VE), due to the traffic abatement. In Figure 12b,d, such reductions are not seen, mainly because of a minor traffic impact. The VP station is located in an area that was not busy (it was classified as an urban background station, as reported in Table 1), and the increase of PM2.5 concentrations probably results from the domestic heating increase.
3.8. ROM Data Analysis between January and June 2020
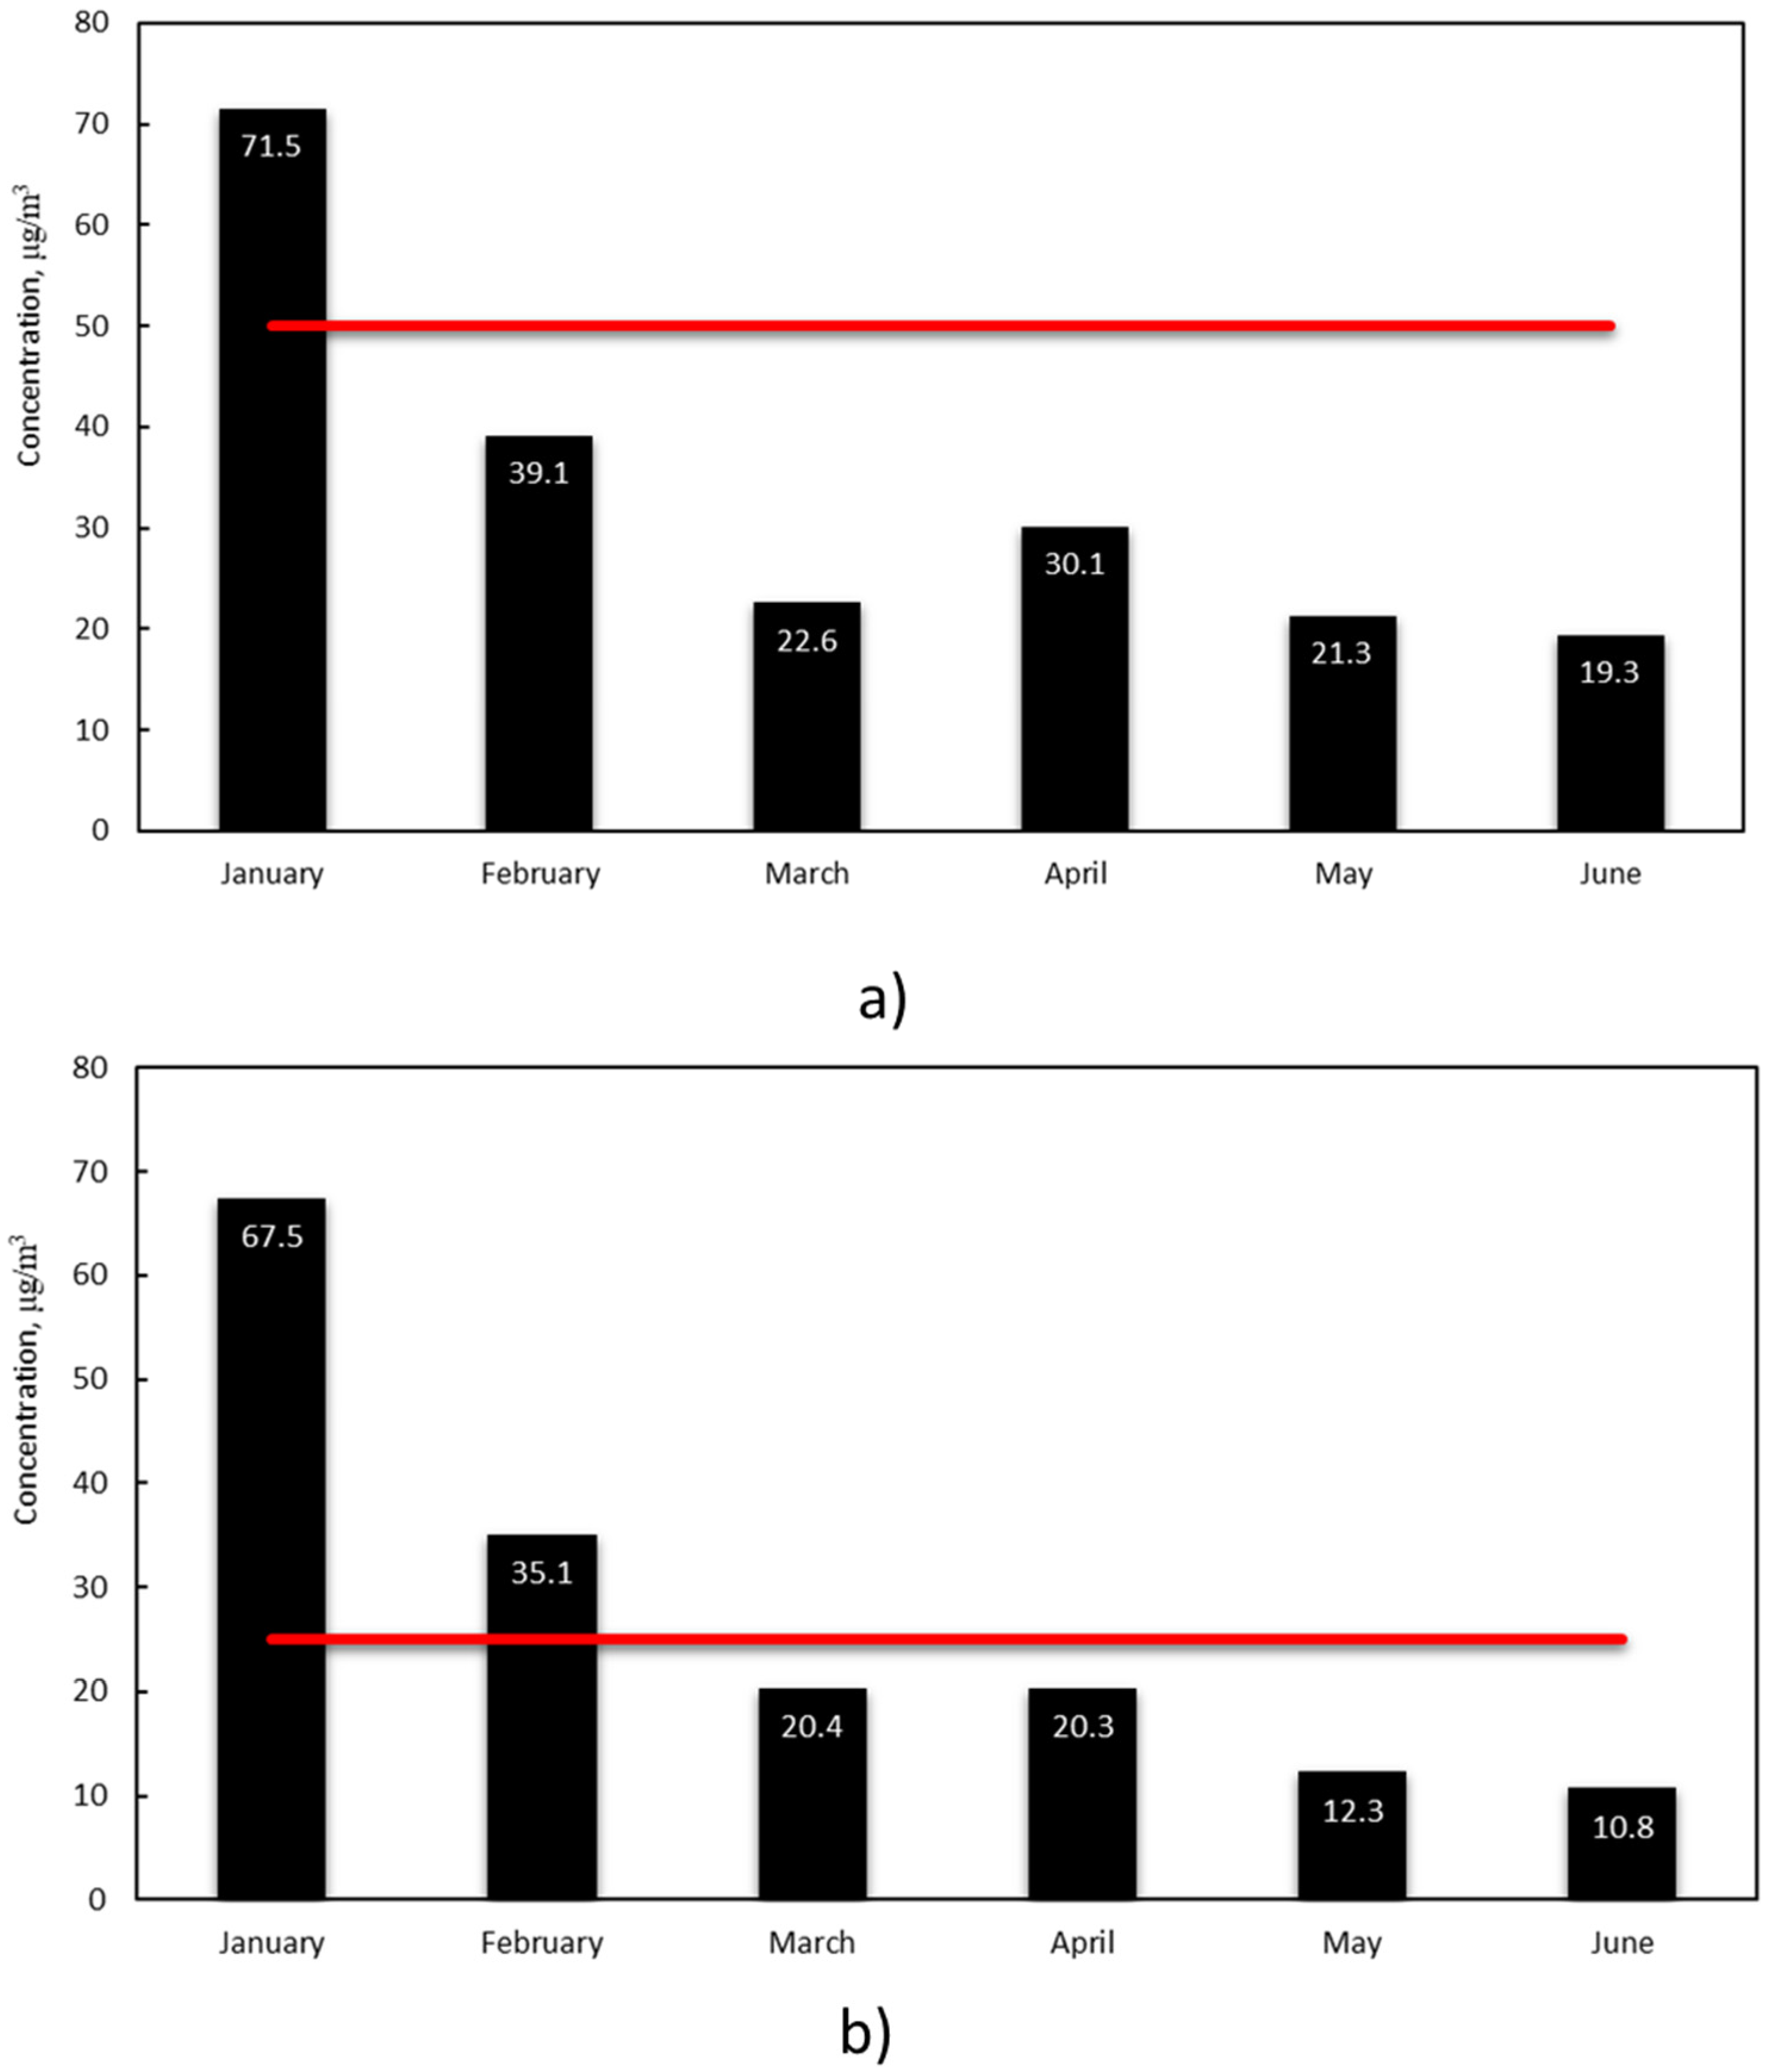
Data measured by the ROM network in Milan, in the months of January–June 2020, confirmed the previously analyzed data provided by ARPA Lombardia (Figure 13). It appears that a strong reduction in concentrations between January and March can be quantified in 68.4% for PM10 and 70% for PM2.5. Referring to February instead, the reduction, with respect to March, was 42.2% for PM10 and 42% for PM2.5. Milan pollution levels, due to particulate matter PM10 and PM2.5 between January and February, were already decreasing, but with the contribution of the lockdown, they dropped further. PM10 and PM2.5 monthly averages values measured during March and April were even below the law limit, according to D.Lgs, with 155/2010 of 50 μg/m3 and 25 μg/m3, respectively. May and June confirm the typical seasonal values; however, as previously mentioned, the month of June recorded the lowest pollution levels since 2010.
3.9. Pollution Analysis on a NIL Basis
The PM10 and PM2.5 pollution levels were calculated for NIL. For sake of brevity, the four most polluted NILs in the months January–April 2020 have been reported (Table 2). By comparing the average, monthly PM10 and PM2.5 values for each NIL, it can be observed that they have drastically decreased over the months. It is interesting to note that there are NILs that always maintain high values. For example, the NIL 23-Lambrate is always present among the worst four NILs of the month. Despite the high PM10 and PM2.5 values measured in January, this NIL is characterized by a reduction in pollution of 70% for PM10 and PM2.5 in March. The reduction between February and March was 25% for PM10 and 23% for PM2.5. The decrease in pollution, largely attributable to the reduction in activity during the lockdown in Milan was supported by favorable weather conditions.
An in-depth analysis of the Lambrate NIL, considering its urbanization characteristics, traffic, and public parks, is possible. Figure 14 reports daily values measured by the ROM.
Figure 14 allows the definition of local pollution and underlines the days with higher pollution levels. In particular, for the PM10, only had two days that were recorded concentration values over the law limit (Figure 14a), and for the PM2.5, seven days exceeded the law limit (Figure 14b).
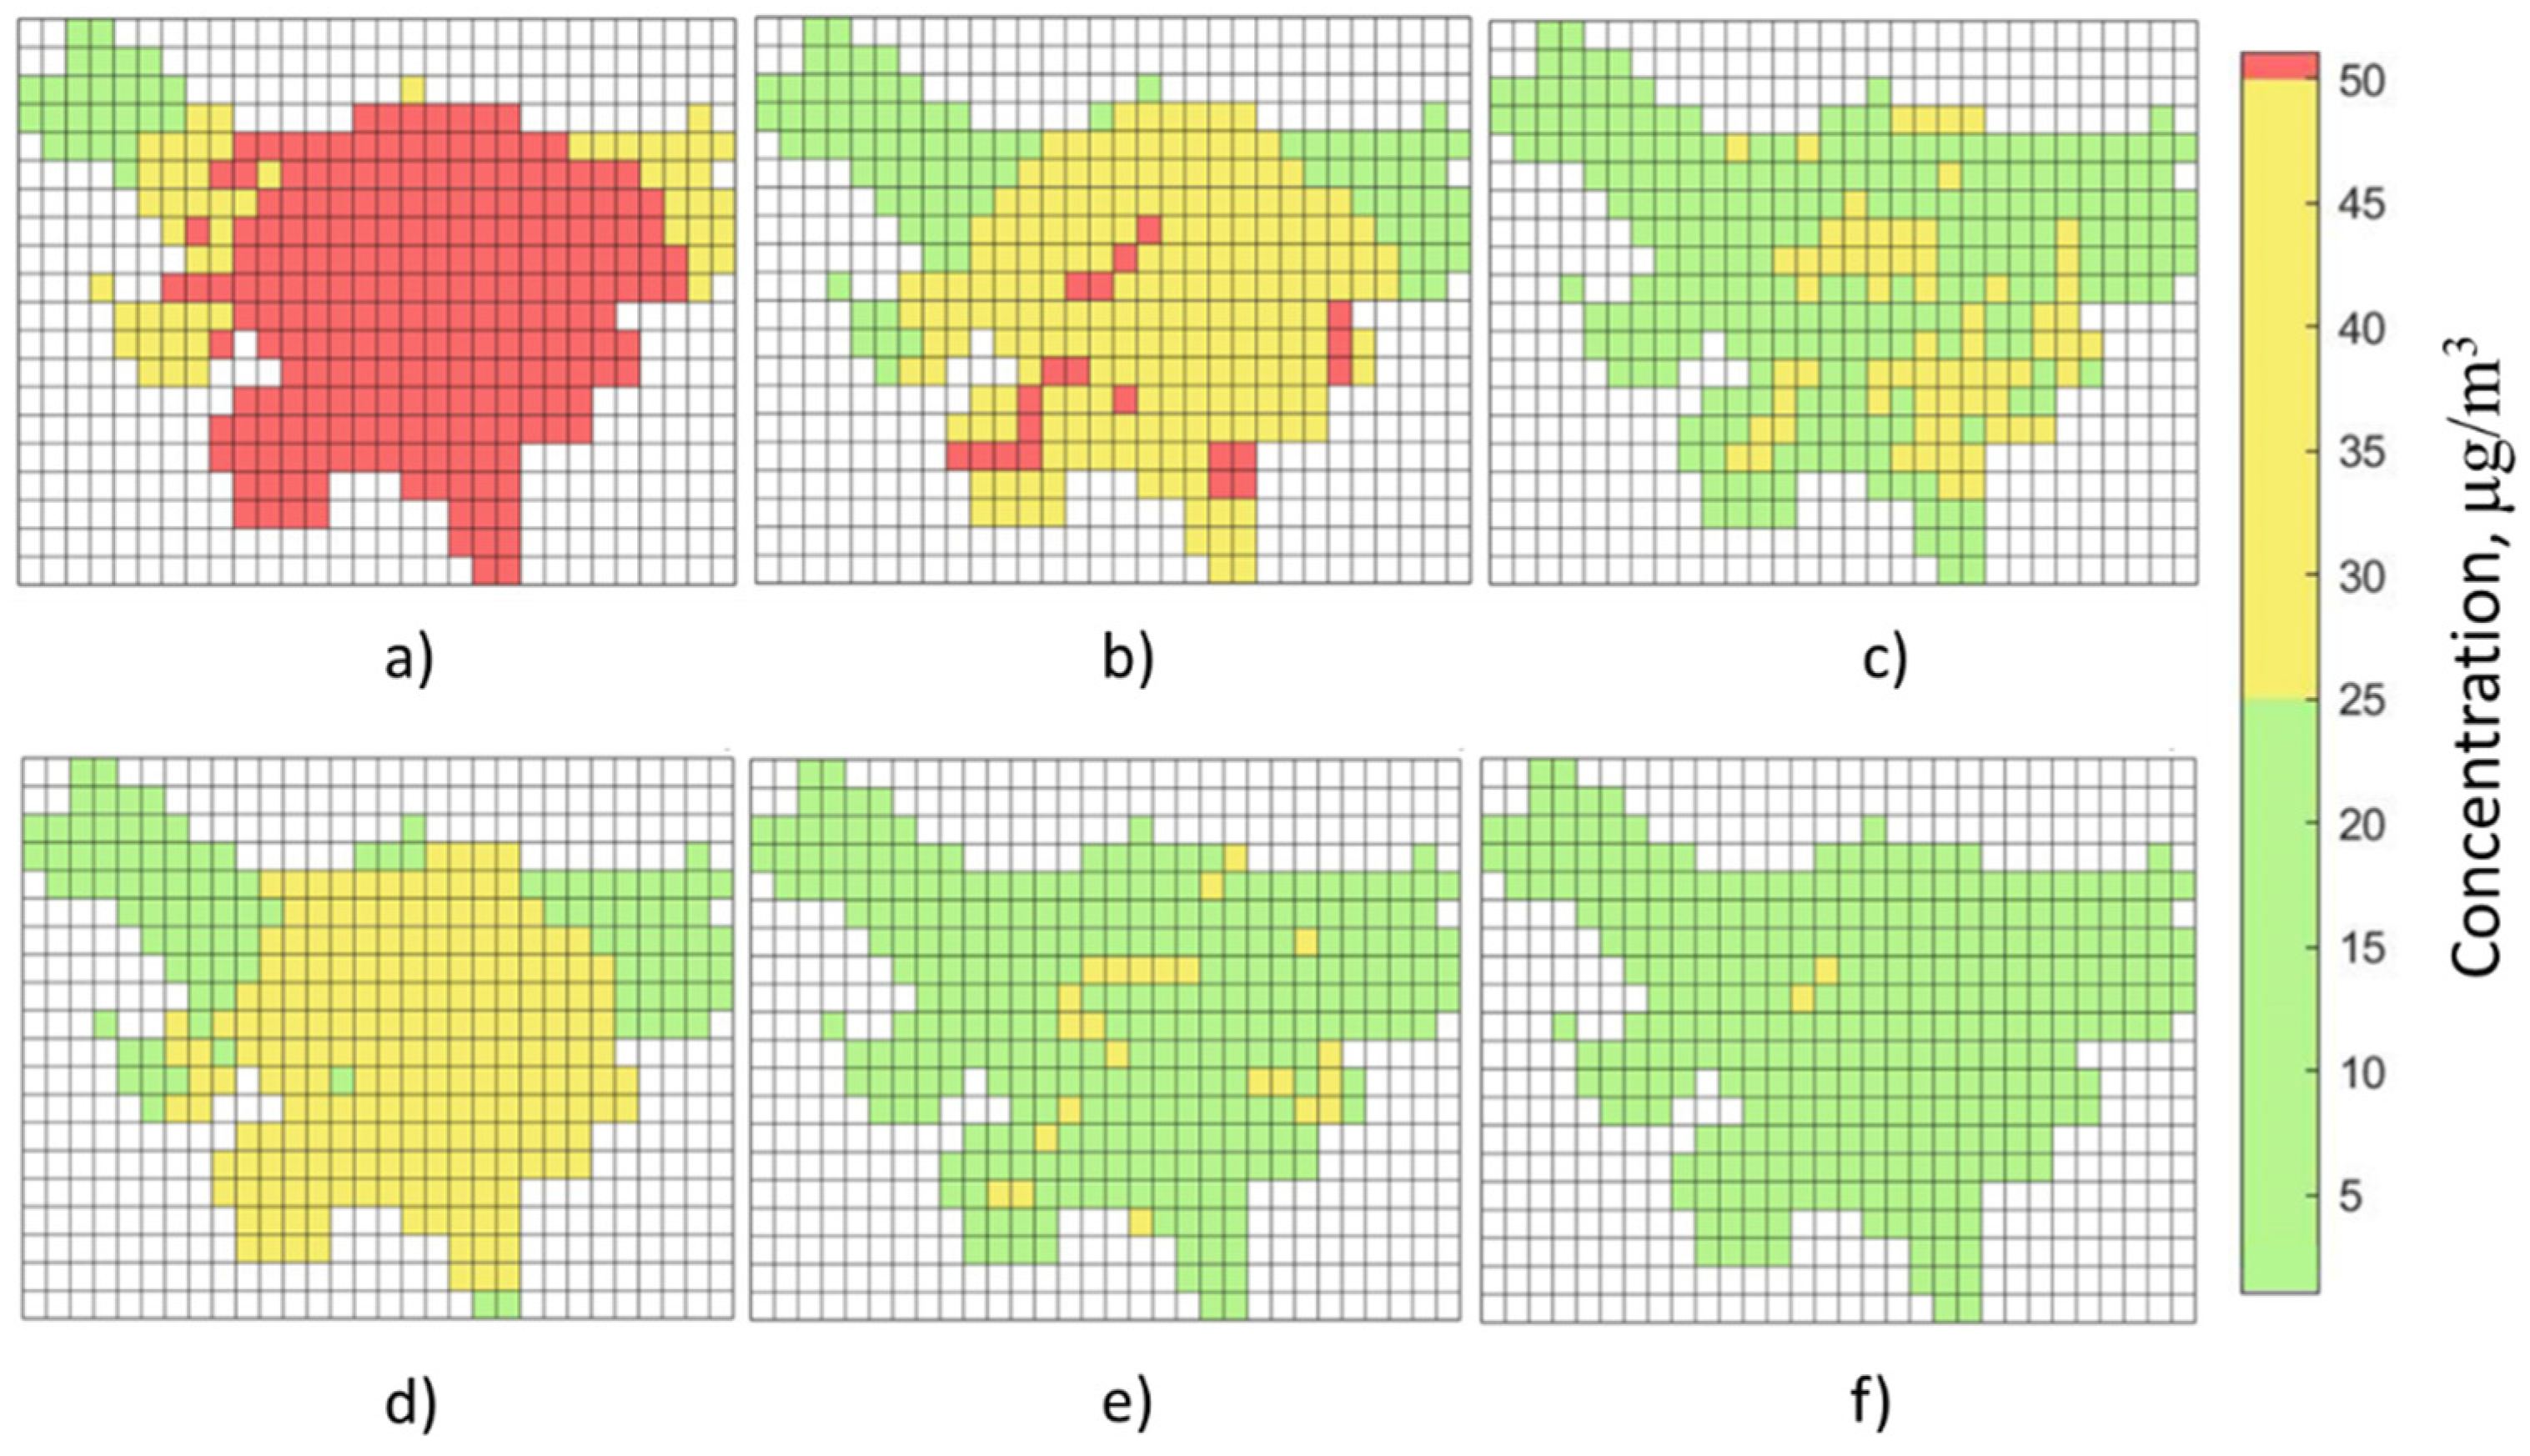
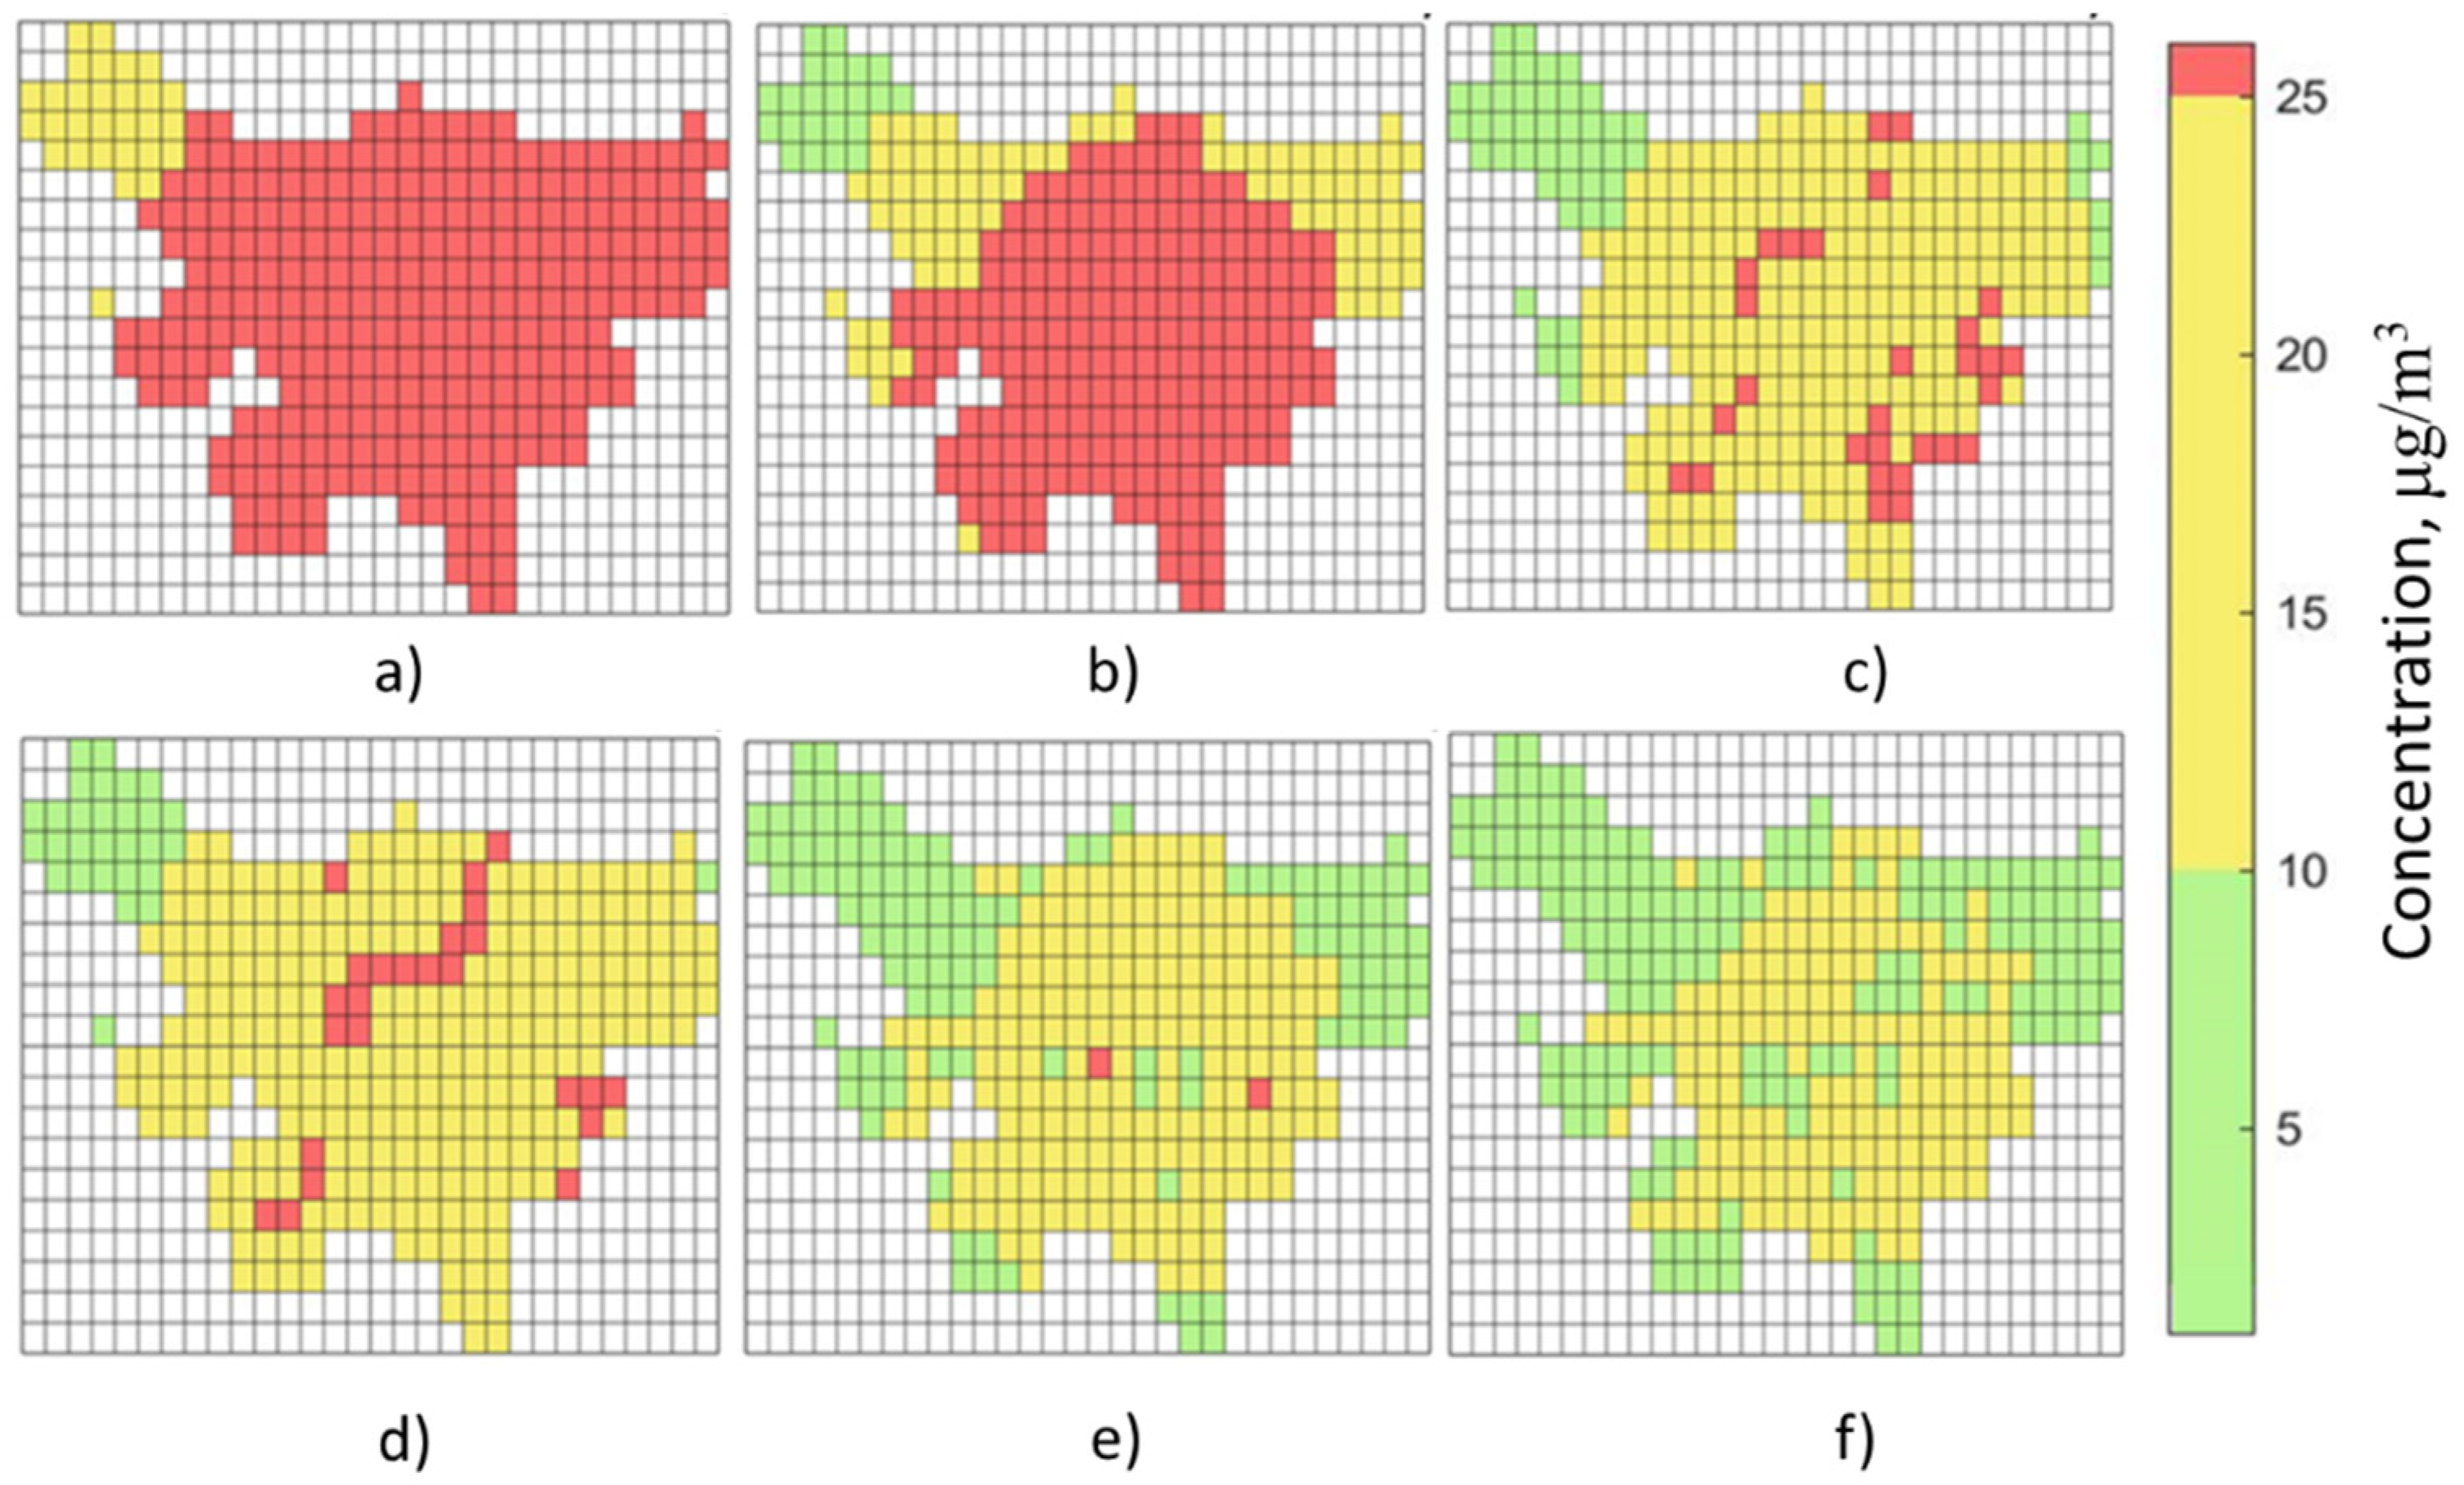
The high spatial resolution also allows for providing the pollution levels measurement to the detail of the 1 km2 cells. The pollution maps on a kilometric scale are shown in Figure 15 for the PM10 concentrations. The adopted chromatic scale uses a traffic light code; for PM10, green indicates the level of good air quality between 0 and 25 μg/m3, yellow indicates the alarm threshold with concentrations in the range 25–50 μg/m3, and red indicates that the limit value has exceeded that of the 50 μg/m3 defined by Legislative Decree 155/2010. For PM2.5, green indicates the level of good air quality between 0 and 10 μg/m3, yellow indicates the alarm threshold with concentrations in the range 10–25 μg/m3, and red indicates limit value of 25 μg/m3, as defined by Legislative Decree 155/2010.
As can be seen from Figure 15c and Figure 16c, March shows an improvement in air quality, with respect to January and February, especially in the city center. The city lockdown led to the gradual suspension of almost all of the city’s daily activities. In particular, the reduction in daily vehicular traffic was significant (reducing by 23% in just one week). This reduction contributed to the decrease in the PM10 and PM2.5 concentrations produced by cars. The concentration of particulate in urban areas was due to the 58% [6] emissions from domestic heating that, in any case, remained on during the lockdown period. In fact, constantly staying at home induces a greater use of heating. Despite this, the mitigating temperatures for a few weeks in March and the favorable weather conditions have greatly reduced their use and, consequently, the particulate matter associated with their operation.
Table 3, Table 4, Table 5 and Table 6 report PM10 and PM2.5 data for the NILs that registered the highest reduction measured between January and March, as well as between February and March. Some NILs, detailed in Table 3, reached a maximum reduction of 77% between January and March. In particular, if we consider the Milan city center, with reference to the NIL, it can be seen that in the NIL referred to the Duomo between January and March, and PM10 pollution decreased by 75%. Due to the lockdown, the major cities’ thoroughfares have slowed down and the associated NILs, such as Tibaldi, had a 75% reduction in pollution due to traffic, when compared to January. Furthermore, the north-western area of the city, which converges towards the Rho/Pero areas where many industrial activities have been progressively reduced, due to the city lockdown, appeared to be less affected by pollution in March, when compared to January and February. In detail, the NIL Sacco and Cascina Triulza-EXPO saw a decrease of PM10 concentrations of 76 and 74%, respectively, compared to January (Table 3).
For completeness, the list of 10 NILs, in which PM10 pollution decreased the most in March, compared to January and February, is shown (Table 3 and Table 4). Table 3 and Table 4 explain the improvement in air quality that followed the progressive blocking of activities in Milan.
PM2.5 concentrations show a drastic reduction, which reaches a maximum of 79% between January and March, as well as 75% (Table 5) between February and March (Table 6). The city center is confirmed to be among those that have undergone an improvement of air quality, with, for example, the NIL Duomo, where PM2.5 recorded a decrease of 75%, when compared to January.
The decreasing PM10 and PM2.5 monthly average concentrations measured in the months of January, February, and March (Figure 15a–c and Figure 16a–c) means a progressive improvement in air quality. Compared to the PM10 concentrations measured in the same period, the decrease in PM2.5 would seem slightly lower (Figure 16); considering that the PM2.5 has a greater variability and a lower law limit than PM10, and that only the 8% of PM2.5 is produced by vehicular traffic, it can be easily understood why the chromatic scale that represents it would contain some red cells. In particular, between January and March, there is a progressive movement of the pollution towards the city center-north/south, with an improvement in air quality, especially in the central area, as can be seen in Figure 15a,c and Figure 16a,c. A deep analysis of March PM10 and PM2.5 levels (Figure 15d and Figure 16d) revealed that the northeast area is characterized by low pollution levels. The city center has medium pollution levels and only in few cells, the pollution reaches high levels for PM2.5 (Figure 16d). This means that the red cells (Figure 16d) present some characteristics as intense traffic flow, high urbanization degree, and low green areas that favour the PM2.5 formation and accumulation.
3.10. Comparison of Significant Day Maps before and during the Lockdown by COVID-19
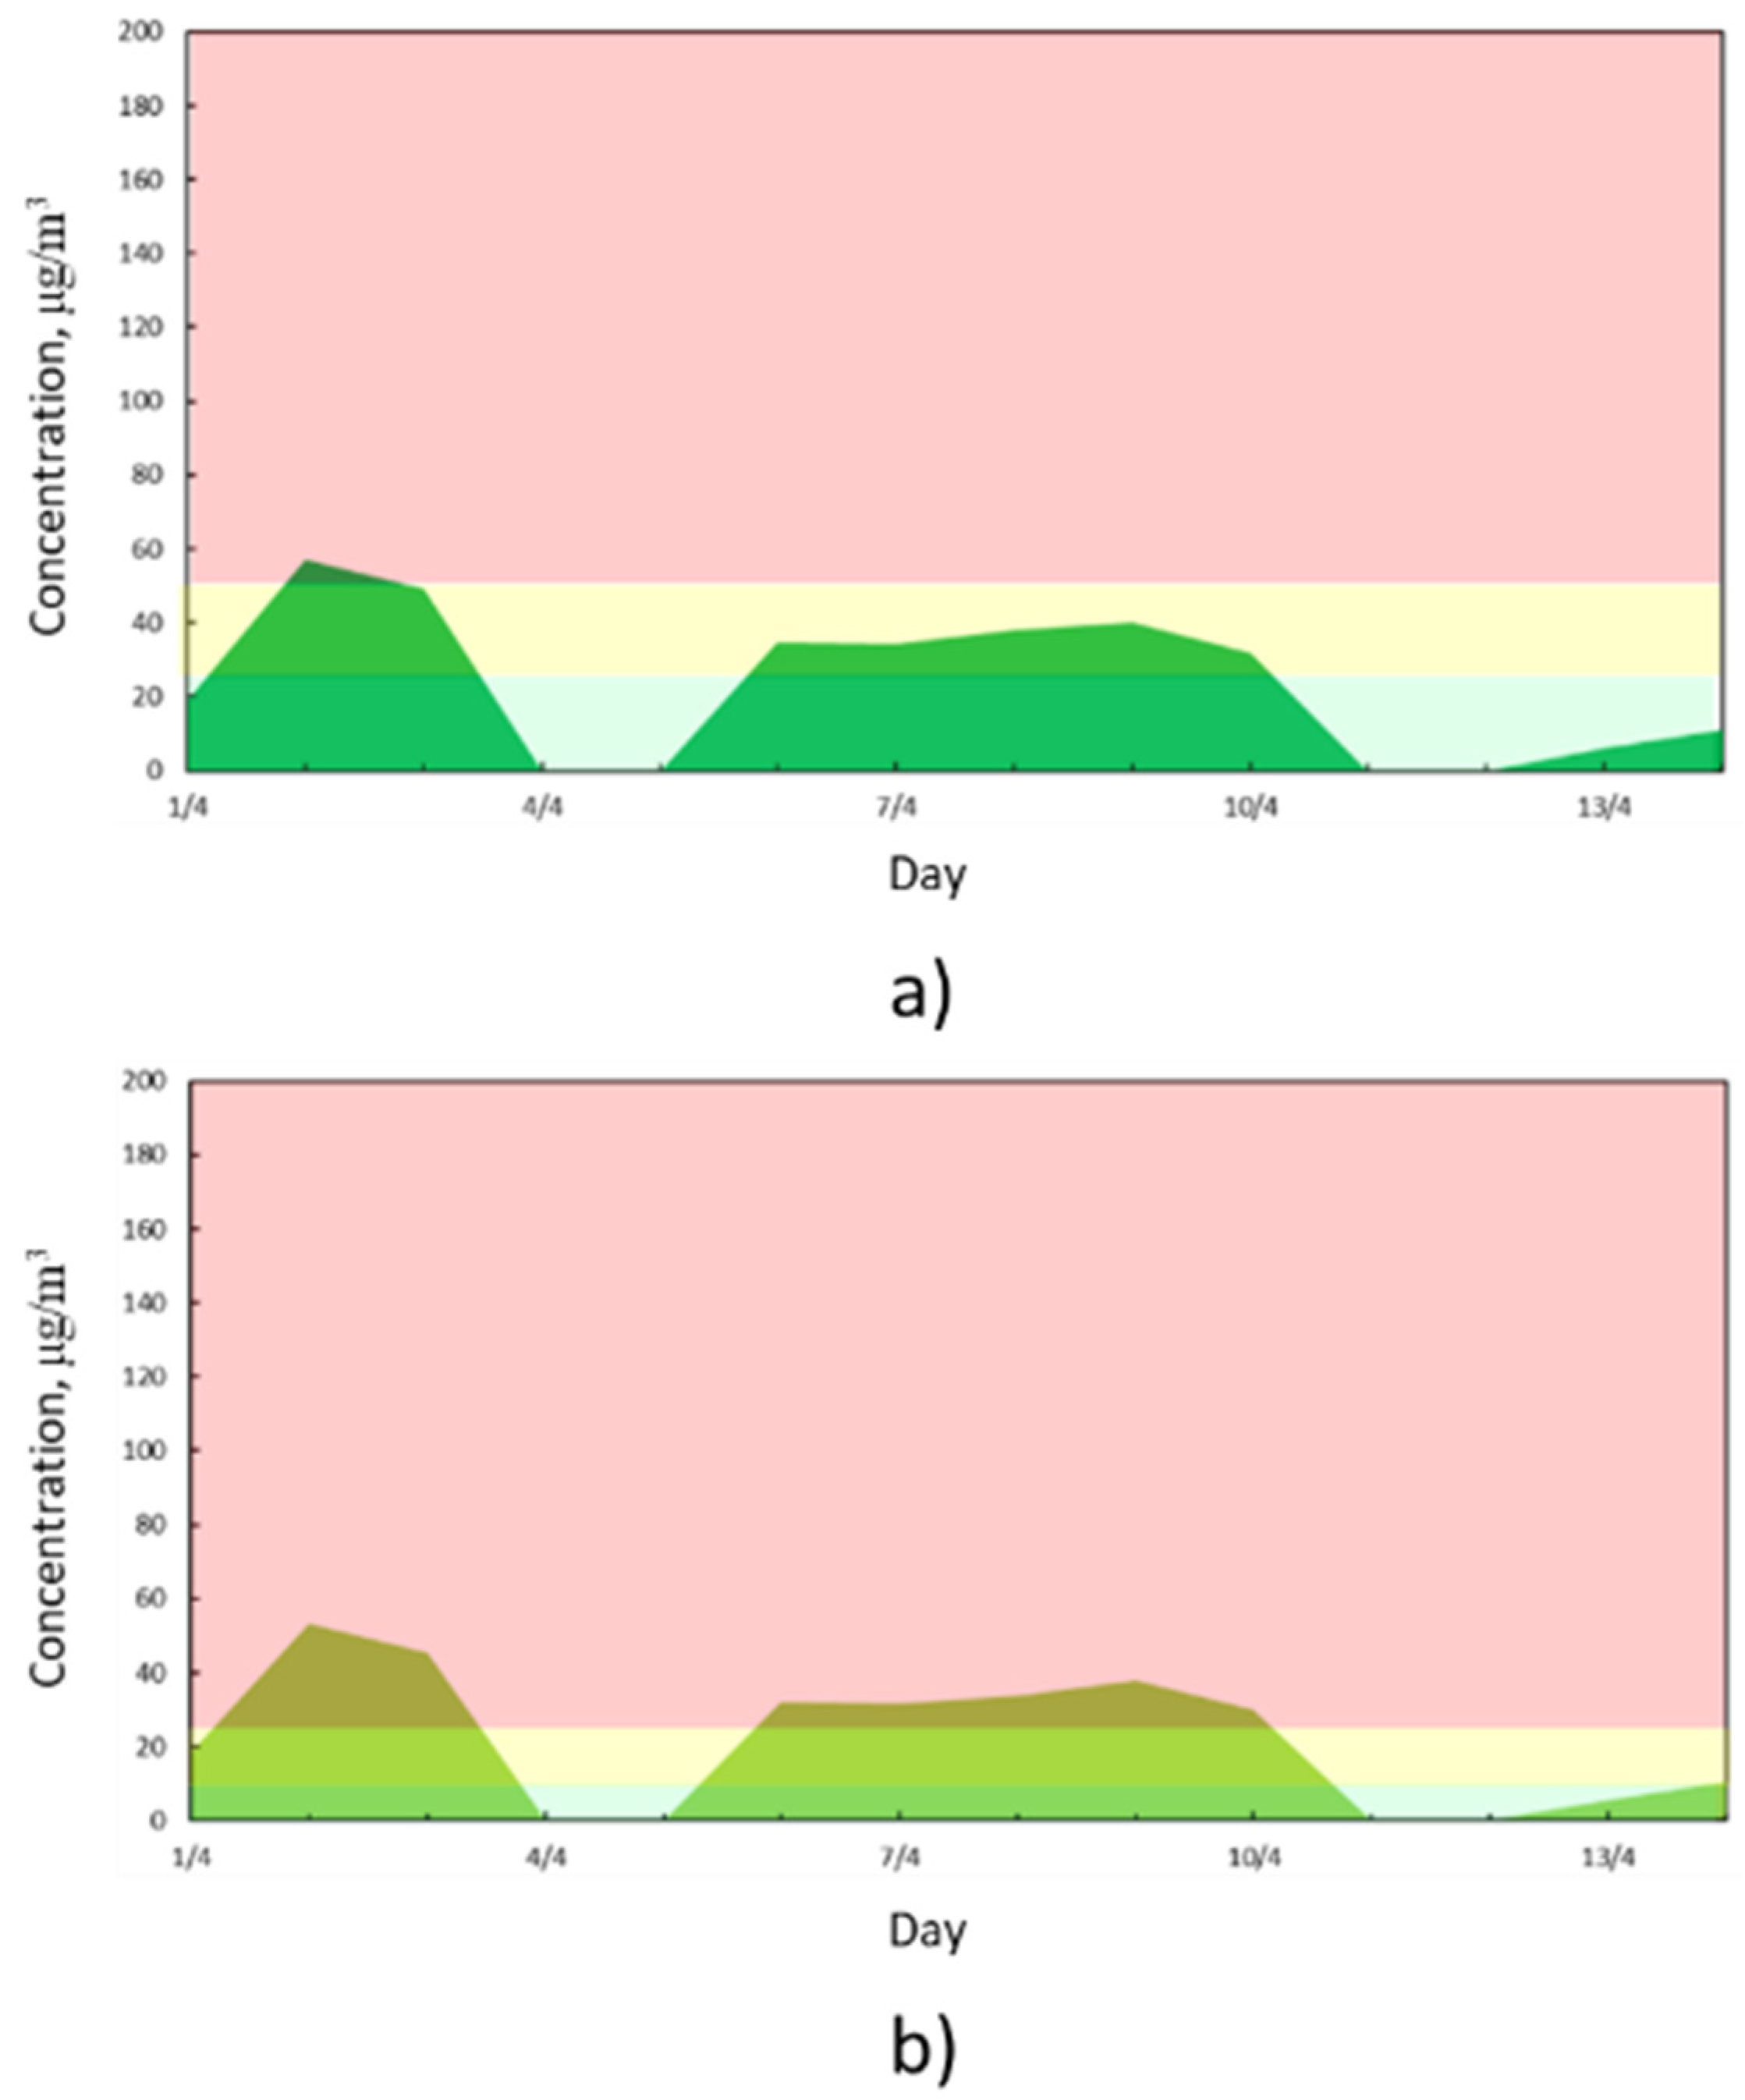
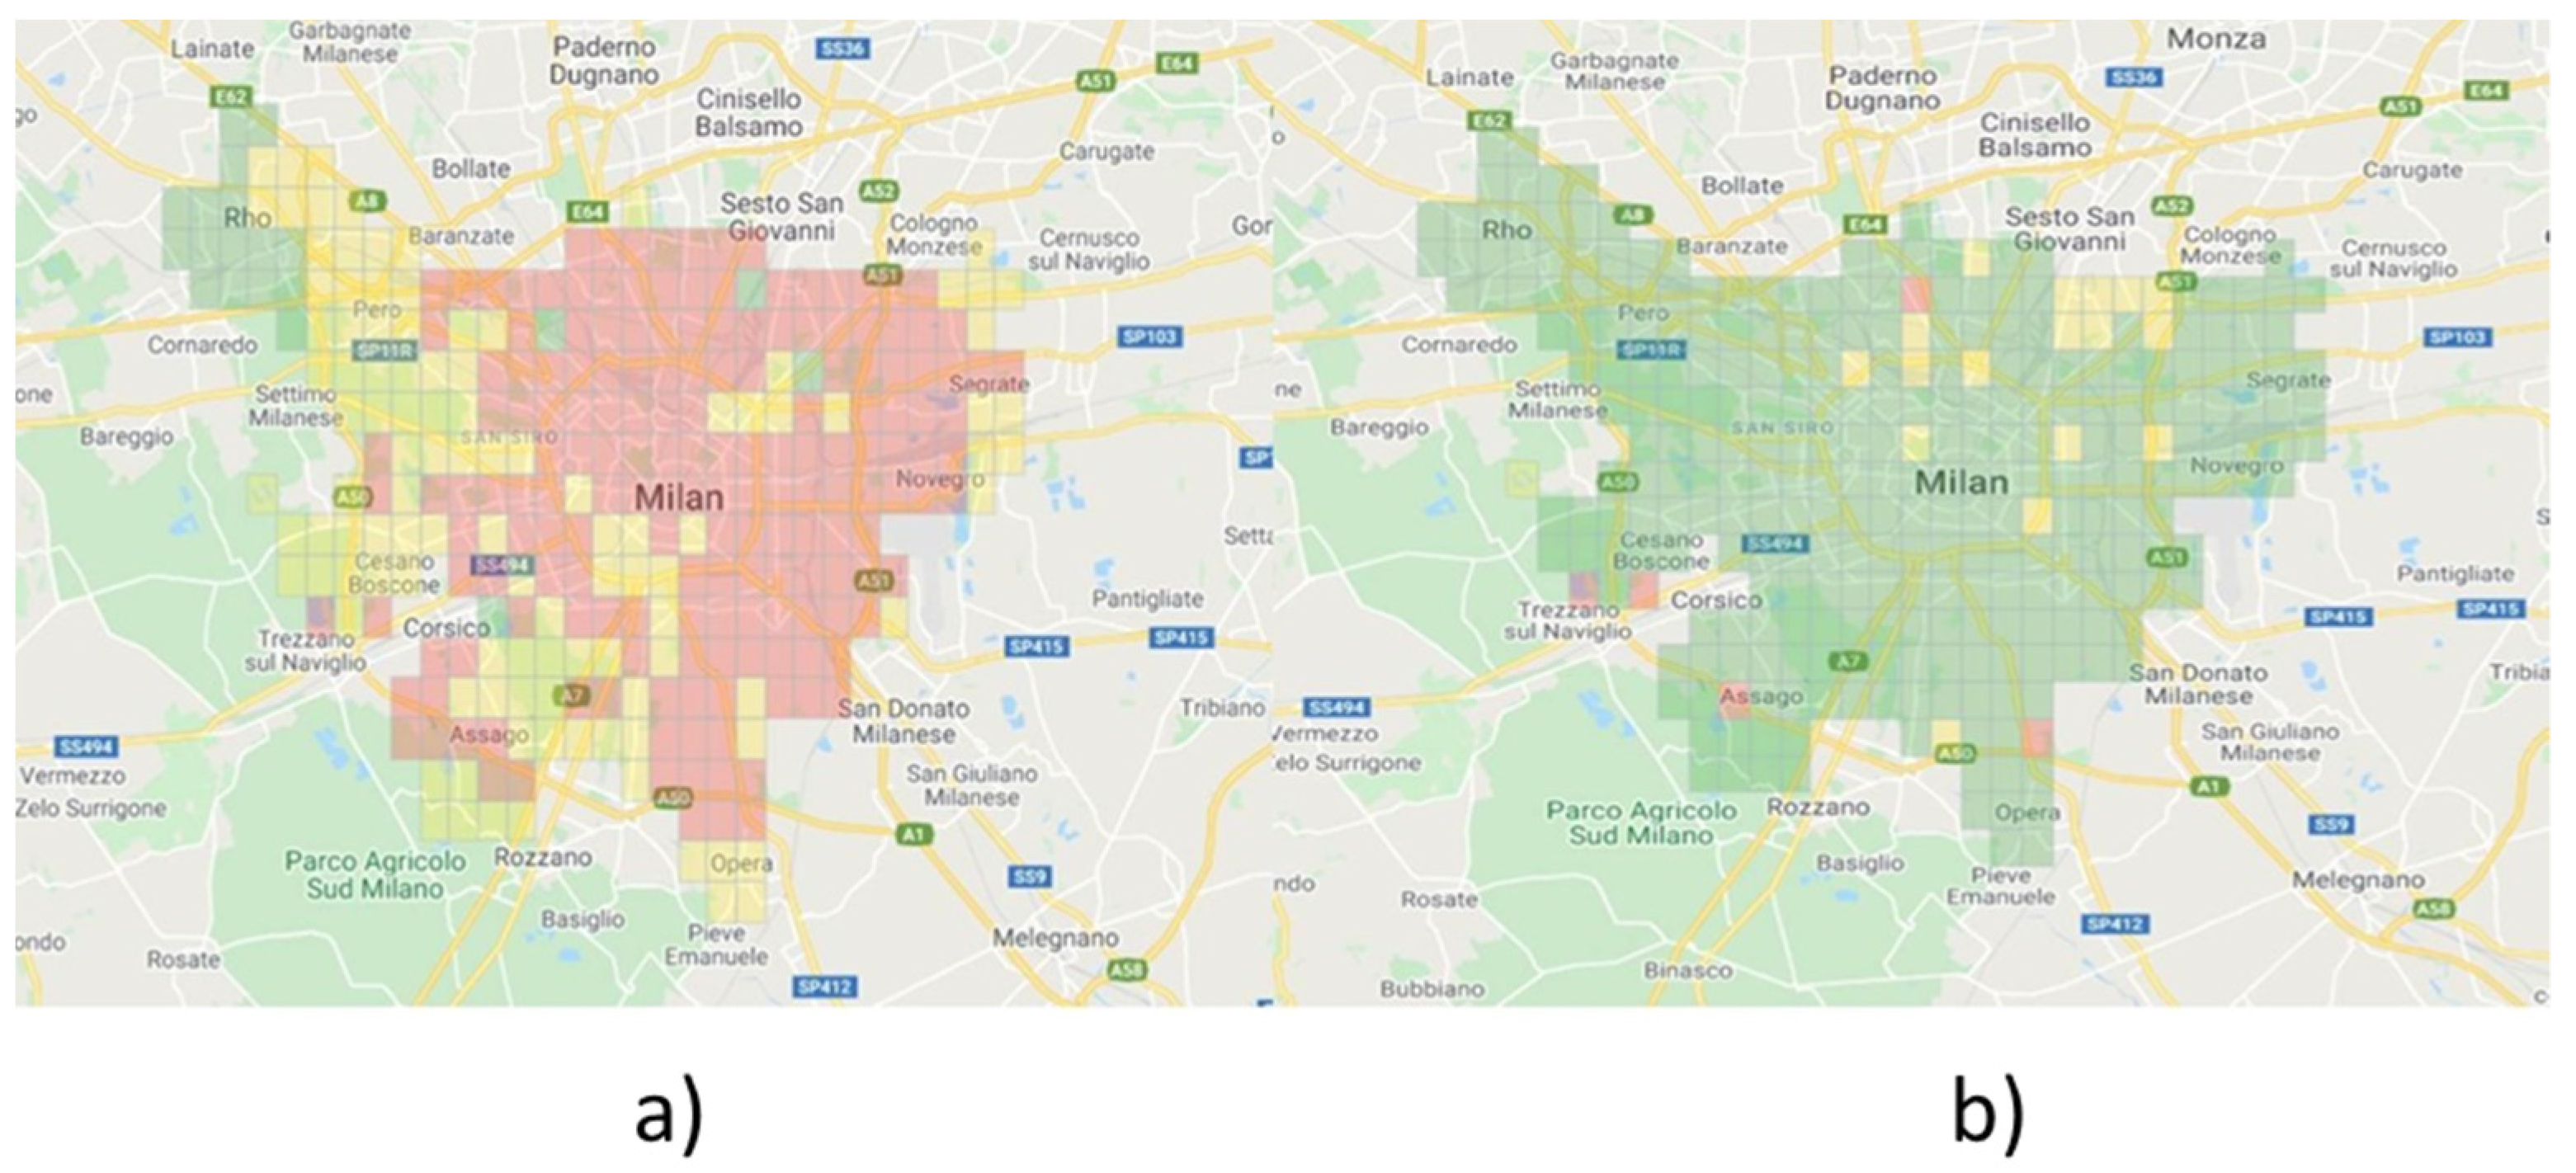
To complete the analysis made so far, the two most significant days of the February-March period were considered to appreciate the positive influence of the lockdown on air quality. Corresponding data are reported in Figure 17. It can be seen how, under the same meteorological conditions, the PM10 concentration measured by the ROM had drastically decreased, passing from a medium-high pollution level (Figure 17a) to a low level (Figure 17b). The days used as an example both presented the meteorological characteristics typical of a day favorable to the pollutants accumulation, i.e., high atmospheric pressure and low wind intensity.
4. Conclusions
The lockdown influence on air quality, due to the multiple influencing factors, is not simple to analyze. To correctly understand how the current situation has affected pollution, it is necessary to investigate these multiple factors. The analysis of pollution levels evolution in 2010–2020 highlighted the general trend of air quality improvement. In more detail, it was possible to define the PM10 specific trends for the years 2010–2020 from January to June, the period including the first lockdown of the city. Considering that February was partially involved by the 2020 lockdown, the last three years were analyzed in detail for the variations in particulate concentrations for March and April. From the analysis, is it clear that there was a progressive decrease in the PM10 average concentration of 8.15% in March, from 2019 to 2020, and 16%, compared to 2018. April, compared with 2018 and 2019, showed a reduction of 11%, with respect to 2018, but an increase of about 10%, compared to 2019. The analysis of vehicular traffic flows showed a decrease of 60%, in line with the measured particulate concentrations values, underlining the reduction of the contribution of vehicular traffic to pollution. ROM network data were used to define pollutant trends on a NIL basis, reporting the worst and identifying the km2 and NIL, where the greatest pollution reduction occurred. The maximum reduction measured in March, compared to January and February, is higher than 70% for both PM10 and PM2.5. Ultimately, the data from the ROM network were compared with the ARPA Lombardia air quality monitoring network data, showing a congruence between the datasets.
Supplementary Materials
The following is available online at https://0-www-mdpi-com.brum.beds.ac.uk/article/10.3390/pr9101692/s1, Figure S1: Dust aerosol optical depth at 550 nm (provided by CAMS, the Copernicus Atmosphere Monitoring Service, for 28 March 2020), accessed on 10 August 2020.
Author Contributions
Conceptualization, N.L., P.T. and D.S.; methodology, N.L. and D.S.; software, N.L. and D.S.; validation, N.L., P.T. and D.S.; formal analysis, N.L., P.T. and D.S.; writing—original draft preparation, N.L., P.T. and D.S.; writing—review and editing, N.L., P.T., D.S., D.B. and M.P.; supervision, D.S., D.B. and M.P. All authors have read and agreed to the published version of the manuscript.
Funding
This research received no external funding.
Institutional Review Board Statement
Not applicable.
Informed Consent Statement
Not applicable.
Data Availability Statement
Data are available at https://www.arpalombardia.it/Pages/Aria/Richiesta-Dati.aspx.
Conflicts of Interest
The authors declare no conflict of interest.
References
- Poli, P.; Boaga, J.; Molinari, I.; Cascone, V.; Boschi, L. The 2020 coronavirus lockdown and seismic monitoring of anthropic activities in Northern Italy. Sci. Rep. 2020, 10, 9404. [Google Scholar] [CrossRef]
- Piccinini, D.; Giunchi, C.; Olivieri, M.; Frattini, F.; Di Giovanni, M.; Prodi, G.; Chiarabba, C. COVID-19 lockdown and its latency in Northern Italy: Seismic evidence and socio-economic interpretation. Sci. Rep. 2020, 10, 16487. [Google Scholar] [CrossRef]
- IQAir and United Nations. 2020 World Air Quality Report. Available online: https://www.iqair.com/world-air-quality-report (accessed on 10 August 2020).
- Malpede, M.; Percoco, M. Lockdown measures and air quality: Evidence from Italian provinces. Lett. Spat. Resour. Sci. 2021, 14, 101–110. [Google Scholar] [CrossRef]
- Merico, E.; Grasso, F.M.; Cesari, D.; Decesari, S.; Belosi, F.; Manarini, F.; De Nuntiis, P.; Rinaldi, M.; Gambaro, A.; Morabito, E.; et al. Characterisation of atmospheric pollution near an industrial site with a biogas production and combustion plant in southern Italy. Sci. Total Environ. 2020, 717, 137220. [Google Scholar] [CrossRef]
- Istituto superiore per la protezione ambientale. La Qualità Dell’aria in Italia; Edizione 2020; Istituto Superiore Per la Protezione Ambientale: Ispra, Italy, 2020. [Google Scholar]
- Bassani, C.; Vichi, F.; Esposito, G.; Montagnoli, M.; Giusto, M.; Ianniello, A. Nitrogen dioxide reductions from satellite and surface observations during COVID-19 mitigation in Rome (Italy). Environ. Sci. Pollut. Res. 2021, 28, 22981–23004. [Google Scholar] [CrossRef]
- Scerri, M.M.; Kandler, K.; Weinbruch, S. Disentangling the contribution of Saharan dust and marine aerosol to PM10 levels in the Central Mediterranean. Atmos. Environ. 2016, 147, 395–408. [Google Scholar] [CrossRef]
- European Environmental Agency. Air Quality in Europe—2020 Report; European Environmental Agency: Luxembourg, 2020. [Google Scholar] [CrossRef]
- Rossi, R.; Ceccato, R.; Gastaldi, M. Effect of Road Traffic on Air Pollution. Experimental Evidence from COVID-19 Lockdown. Sustainability 2020, 12, 8984. [Google Scholar] [CrossRef]
- Piccoli, A.; Agresti, V.; Balzarini, A.; Bedogni, M.; Bonanno, R.; Collino, E.; Colzi, F.; Lacavalla, M.; Lanzani, G.; Pirovano, G.; et al. Modeling the Effect of COVID-19 Lockdown on Mobility and NO2 Concentration in the Lombardy Region. Atmosphere 2020, 11, 1319. [Google Scholar] [CrossRef]
- Sofia, D.; Giuliano, A.; Gioiella, F. Air quality monitoring network for tracking pollutants: The case study of salerno city center. Chem. Eng. Trans. 2018, 68, 67–72. [Google Scholar] [CrossRef]
- Sofia, D.; Lotrecchiano, N.; Giuliano, A.; Barletta, D.; Poletto, M. Optimization of number and location of sampling points of an air quality monitoring network in an urban contest. Chem. Eng. Trans. 2019, 74, 277–282. [Google Scholar] [CrossRef]
- Rovetta, A. The Impact of COVID-19 Lockdowns on Particulate Matter Emissions in Lombardy and Italian Citizens’ Consumption Habits. Front. Sustain. 2021, 2, 44. [Google Scholar] [CrossRef]
- Lotrecchiano, N.; Gioiella, F.; Giuliano, A.; Sofia, D. Forecasting Model Validation of Particulate Air Pollution by Low Cost Sensors Data. J. Model. Optim. 2019, 11, 63–68. [Google Scholar] [CrossRef] [Green Version]
- Sofia, D.; Lotrecchiano, N.; Cirillo, D.; Villetta, M.L.; Sofia, D. NO2 Dispersion model of emissions of a 20 kwe biomass gasifier. Chem. Eng. Trans. 2020, 82, 451–456. [Google Scholar] [CrossRef]
- Lotrecchiano, N.; Sofia, D.; Giuliano, A.; Barletta, D.; Poletto, M. Pollution dispersion from a fire using a Gaussian plume model. Int. J. Saf. Secur. Eng. 2020, 10, 431–439. [Google Scholar] [CrossRef]
- Sofia, D.; Lotrecchiano, N.; Trucillo, P.; Giuliano, A.; Terrone, L. Novel air pollution measurement system based on ethereum blockchain. J. Sens. Actuator Netw. 2020, 9, 49. [Google Scholar] [CrossRef]
- Sofia, D.; Gioiella, F.; Lotrecchiano, N.; Giuliano, A. Mitigation strategies for reducing air pollution. Environ. Sci. Pollut. Res. 2020, 27, 19226–19235. [Google Scholar] [CrossRef] [PubMed]
- Sofia, D.; Gioiella, F.; Lotrecchiano, N.; Giuliano, A. Cost-benefit analysis to support decarbonization scenario for 2030: A case study in Italy. Energy Policy 2020, 137, 111137. [Google Scholar] [CrossRef]
- Squizzato, S.; Masiol, M.; Brunelli, A.; Pistollato, S.; Tarabotti, E.; Rampazzo, G.; Pavoni, B. Factors determining the formation of secondary inorganic aerosol: A case study in the Po Valley (Italy). Atmos. Chem. Phys. 2013, 13, 1927–1939. [Google Scholar] [CrossRef] [Green Version]
- Pecorari, E.; Squizzato, S.; Masiol, M.; Radice, P.; Pavoni, B.; Rampazzo, G. Using a photochemical model to assess the horizontal, vertical and time distribution of PM2.5 in a complex area: Relationships between the regional and local sources and the meteorological conditions. Sci. Total Environ. 2012, 443C, 681–691. [Google Scholar] [CrossRef] [PubMed]
- Lotrecchiano, N.; Sofia, D.; Giuliano, A.; Barletta, D.; Poletto, M. Real-time on-road monitoring network of air quality. Chem. Eng. Trans. 2019, 74, 241–246. [Google Scholar] [CrossRef]
- Lotrecchiano, N.; Sofia, D.; Giuliano, A.; Barletta, D.; Poletto, M. Spatial Interpolation Techniques For innovative Air Quality Monitoring Systems. Chem. Eng. Trans. 2021, 86, 391–396. [Google Scholar] [CrossRef]
- Arnold, M.; Seghaier, A.; Martin, D.; Buat-Ménard, P.; Chesselet, R. Géochimie de L’aérosol Marin de la Méditerranée Occidentale; CIESM: Cannes, France, 1982; pp. 2–4. [Google Scholar]
- Bonasoni, P.; Cristofanelli, P.; Calzolari, F.; Bonafè, U.; Evangelisti, F.; Stohl, A.; Sajani, S.Z.; van Dingenen, R.; Colombo, T.; Balkanski, Y. Aerosol-ozone correlations during dust transport episodes. Atmos. Chem. Phys. Discuss. 2004, 4, 1201–1215. [Google Scholar] [CrossRef] [Green Version]
- Lotrecchiano, N.; Capozzi, V.; Sofia, D. An Innovative Approach to Determining the Contribution of Saharan Dust to Pollution. Int. J. Environ. Res. Public Health 2021, 18, 6100. [Google Scholar] [CrossRef] [PubMed]
Figure 1.
Location of ARPA Lombardia air quality monitoring stations in Milan urban area (Italy).

Figure 2.
(a) Territory division for the data aggregation into 9 municipalities. (b) Territory division for the data aggregation into 88 NIL. (c) Territory division for the data aggregation into 306 squares of 1 km2.
Figure 2.
(a) Territory division for the data aggregation into 9 municipalities. (b) Territory division for the data aggregation into 88 NIL. (c) Territory division for the data aggregation into 306 squares of 1 km2.

Figure 3.
The 2010–2020 PM10 annual averages in the Milan stations measured by ARPA Lombardia (black solid line), 25th and 75th percentile of the annual averages (black dashed line), and PM10 annual law limit of 40 μg/m3 according to Lgs. 155/2010 (red solid line).
Figure 3.
The 2010–2020 PM10 annual averages in the Milan stations measured by ARPA Lombardia (black solid line), 25th and 75th percentile of the annual averages (black dashed line), and PM10 annual law limit of 40 μg/m3 according to Lgs. 155/2010 (red solid line).

Figure 4.
PM10 five-year moving annual average concentrations measured in Milan by the ARPA Lombardia network and PM10 annual law limit of 40 μg/m3 according to Lgs. 155/2010 (red solid line).
Figure 4.
PM10 five-year moving annual average concentrations measured in Milan by the ARPA Lombardia network and PM10 annual law limit of 40 μg/m3 according to Lgs. 155/2010 (red solid line).

Figure 5.
PM10 daily average (dashed black line), PM2.5 daily average (dotted black line), ratio between PM2.5 and PM10 (solid black line) measured in Milan by ARPA Lombardia, March 2020.
Figure 5.
PM10 daily average (dashed black line), PM2.5 daily average (dotted black line), ratio between PM2.5 and PM10 (solid black line) measured in Milan by ARPA Lombardia, March 2020.

Figure 6.
PM10 daily average without saharan contribute estimated (dashed black line), PM2.5 daily average (dotted black line), ratio between PM2.5 and PM10 (solid black line) measured in Milan by ARPA Lombardia, March 2020.
Figure 6.
PM10 daily average without saharan contribute estimated (dashed black line), PM2.5 daily average (dotted black line), ratio between PM2.5 and PM10 (solid black line) measured in Milan by ARPA Lombardia, March 2020.

Figure 7.
PM10 average monthly concentration in the first six months of the year in the period 2010–2020, measured in Milan by ARPALombardia, without considering the contribution of Saharan dust in March 2020; daily law limit for PM10 according to Lgs. 155/2010 (red solid line) and annual law limit for PM10 according to Lgs. 155/2010 (red dashed line).

Figure 8.
Monthly average concentrations trends of March and April in the years 2018–2020, measured in Milan by ARPA Lombardia.
Figure 8.
Monthly average concentrations trends of March and April in the years 2018–2020, measured in Milan by ARPA Lombardia.

Figure 9.
Daily traffic flows recorded in the city of Milan in the months of January–June 2020.

Figure 10.
Cumulative daily value of rainfall measured in Milan by the ARPA Lombardia meteorological network in March.
Figure 10.
Cumulative daily value of rainfall measured in Milan by the ARPA Lombardia meteorological network in March.

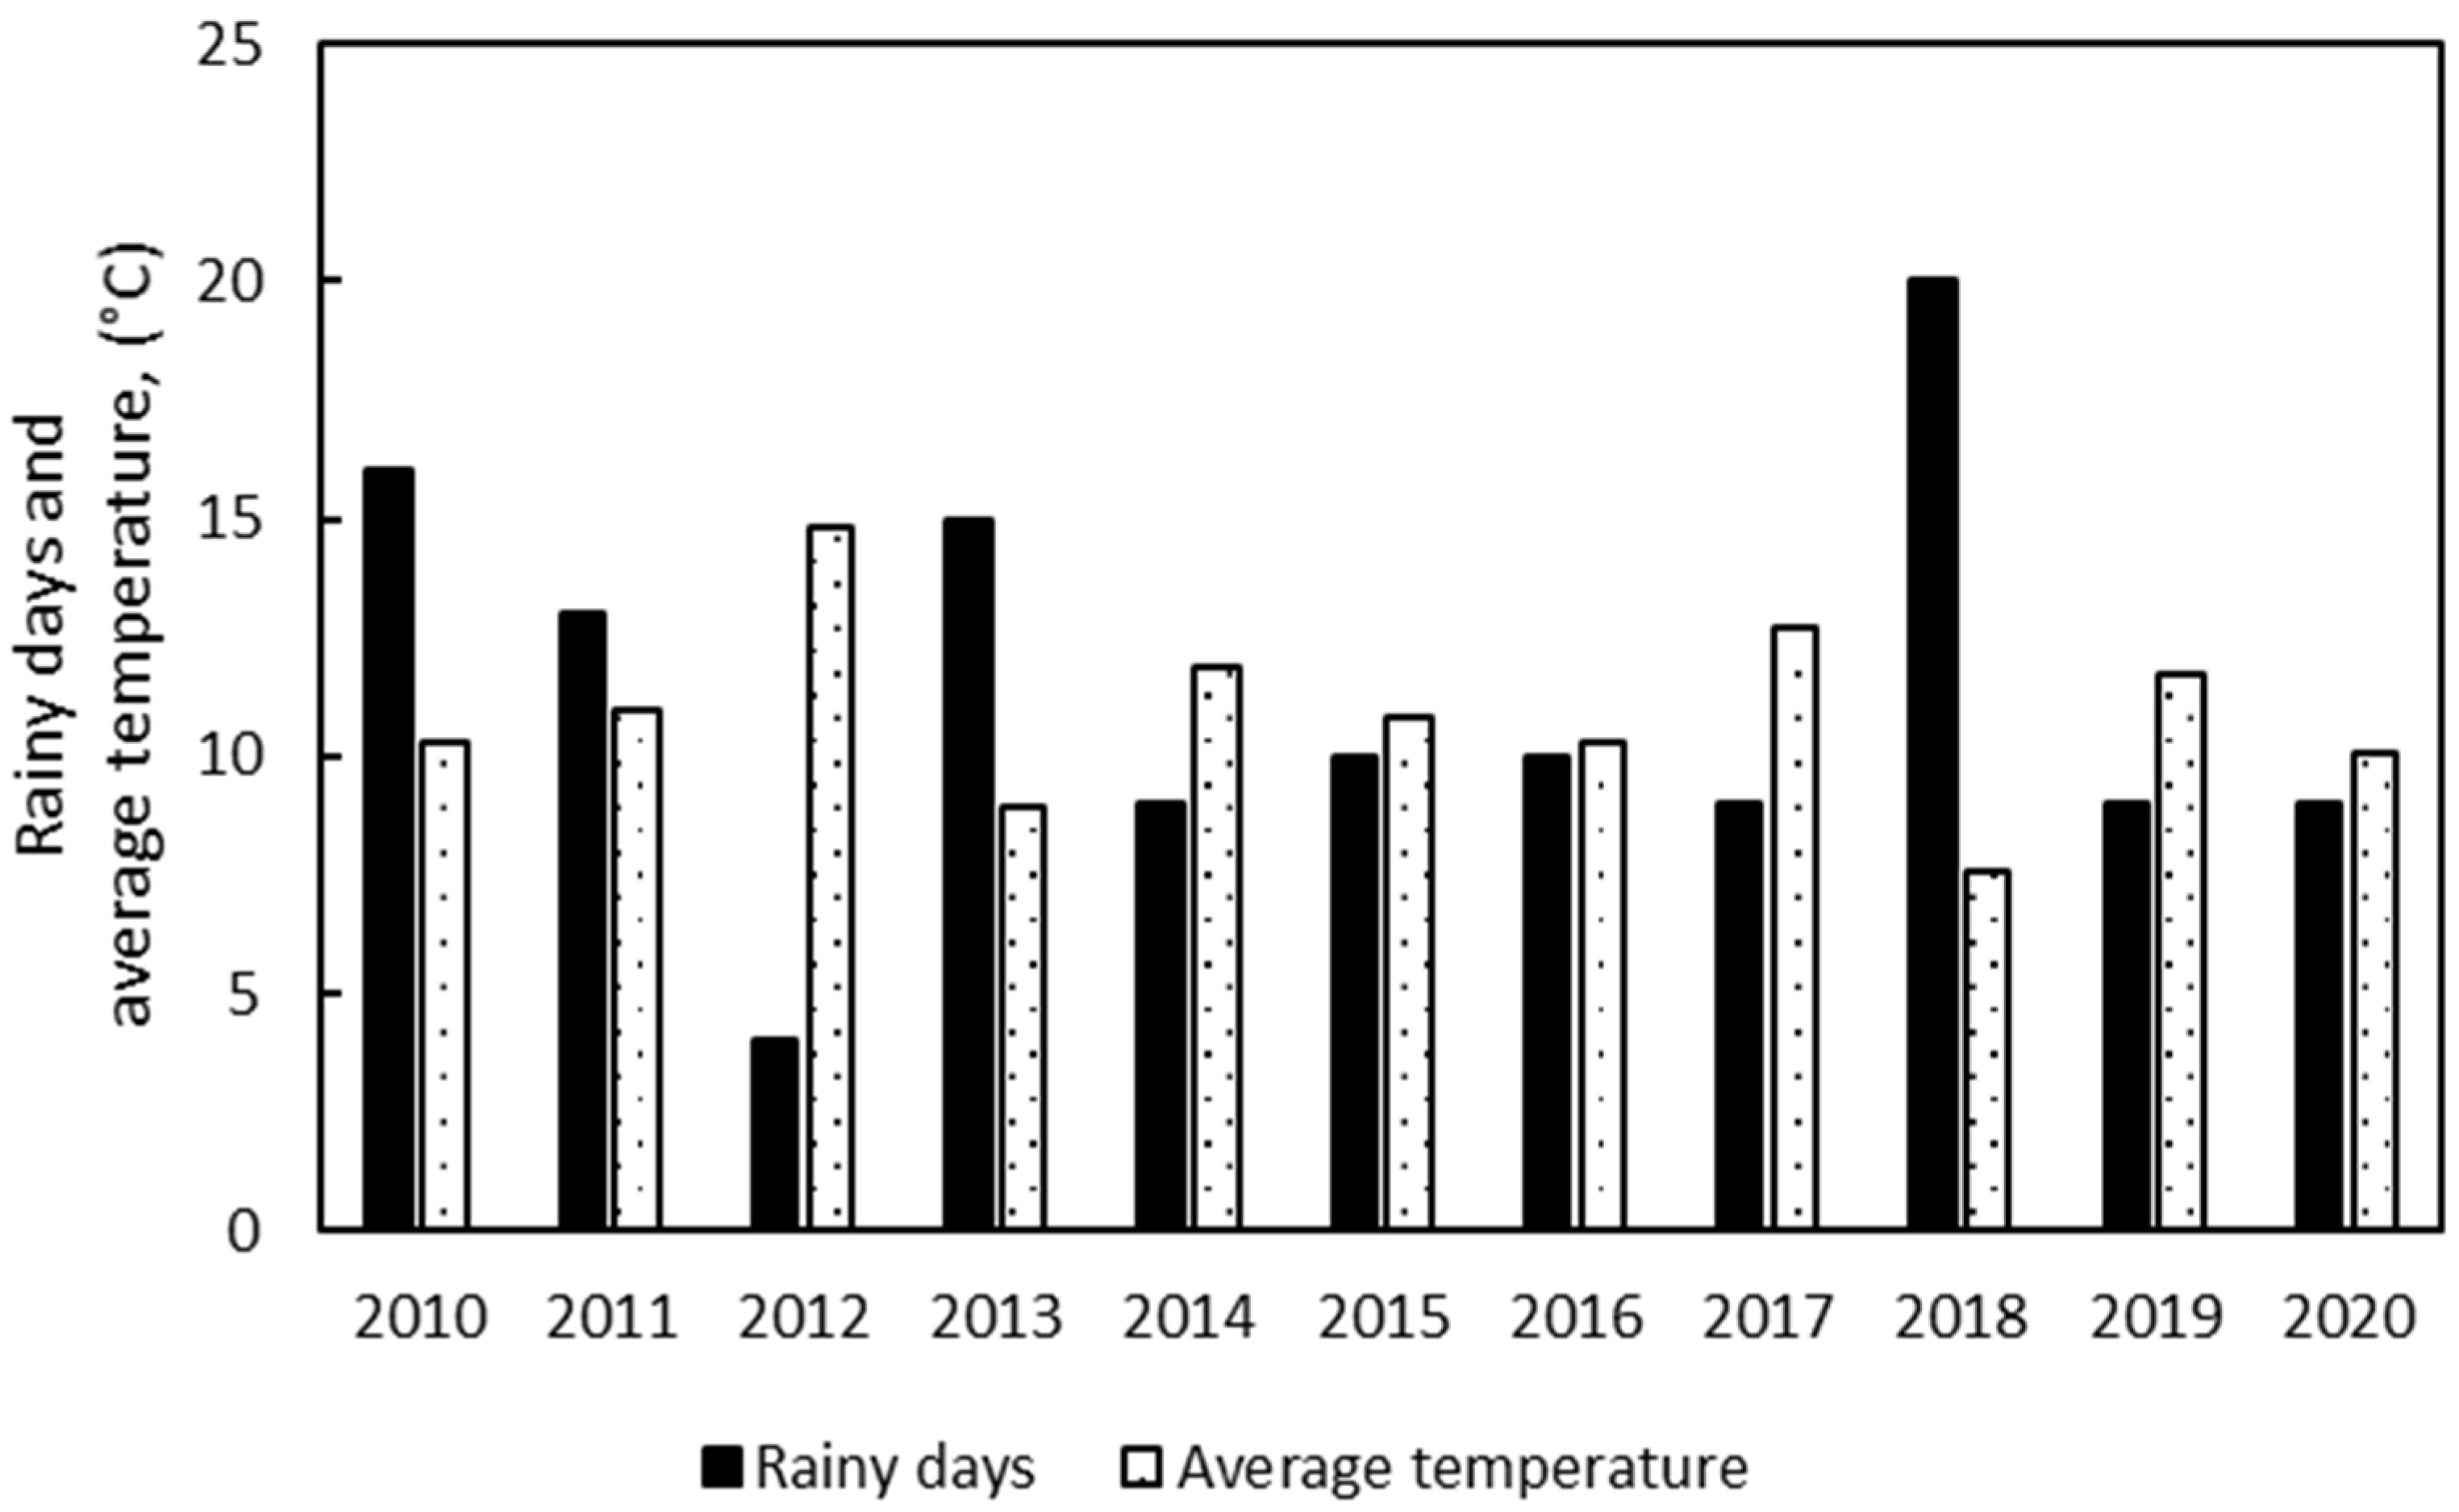
Figure 11.
Rainy days and average temperature measured in Milan by the ARPA Lombardia meteorological network in March.
Figure 11.
Rainy days and average temperature measured in Milan by the ARPA Lombardia meteorological network in March.

Figure 12.
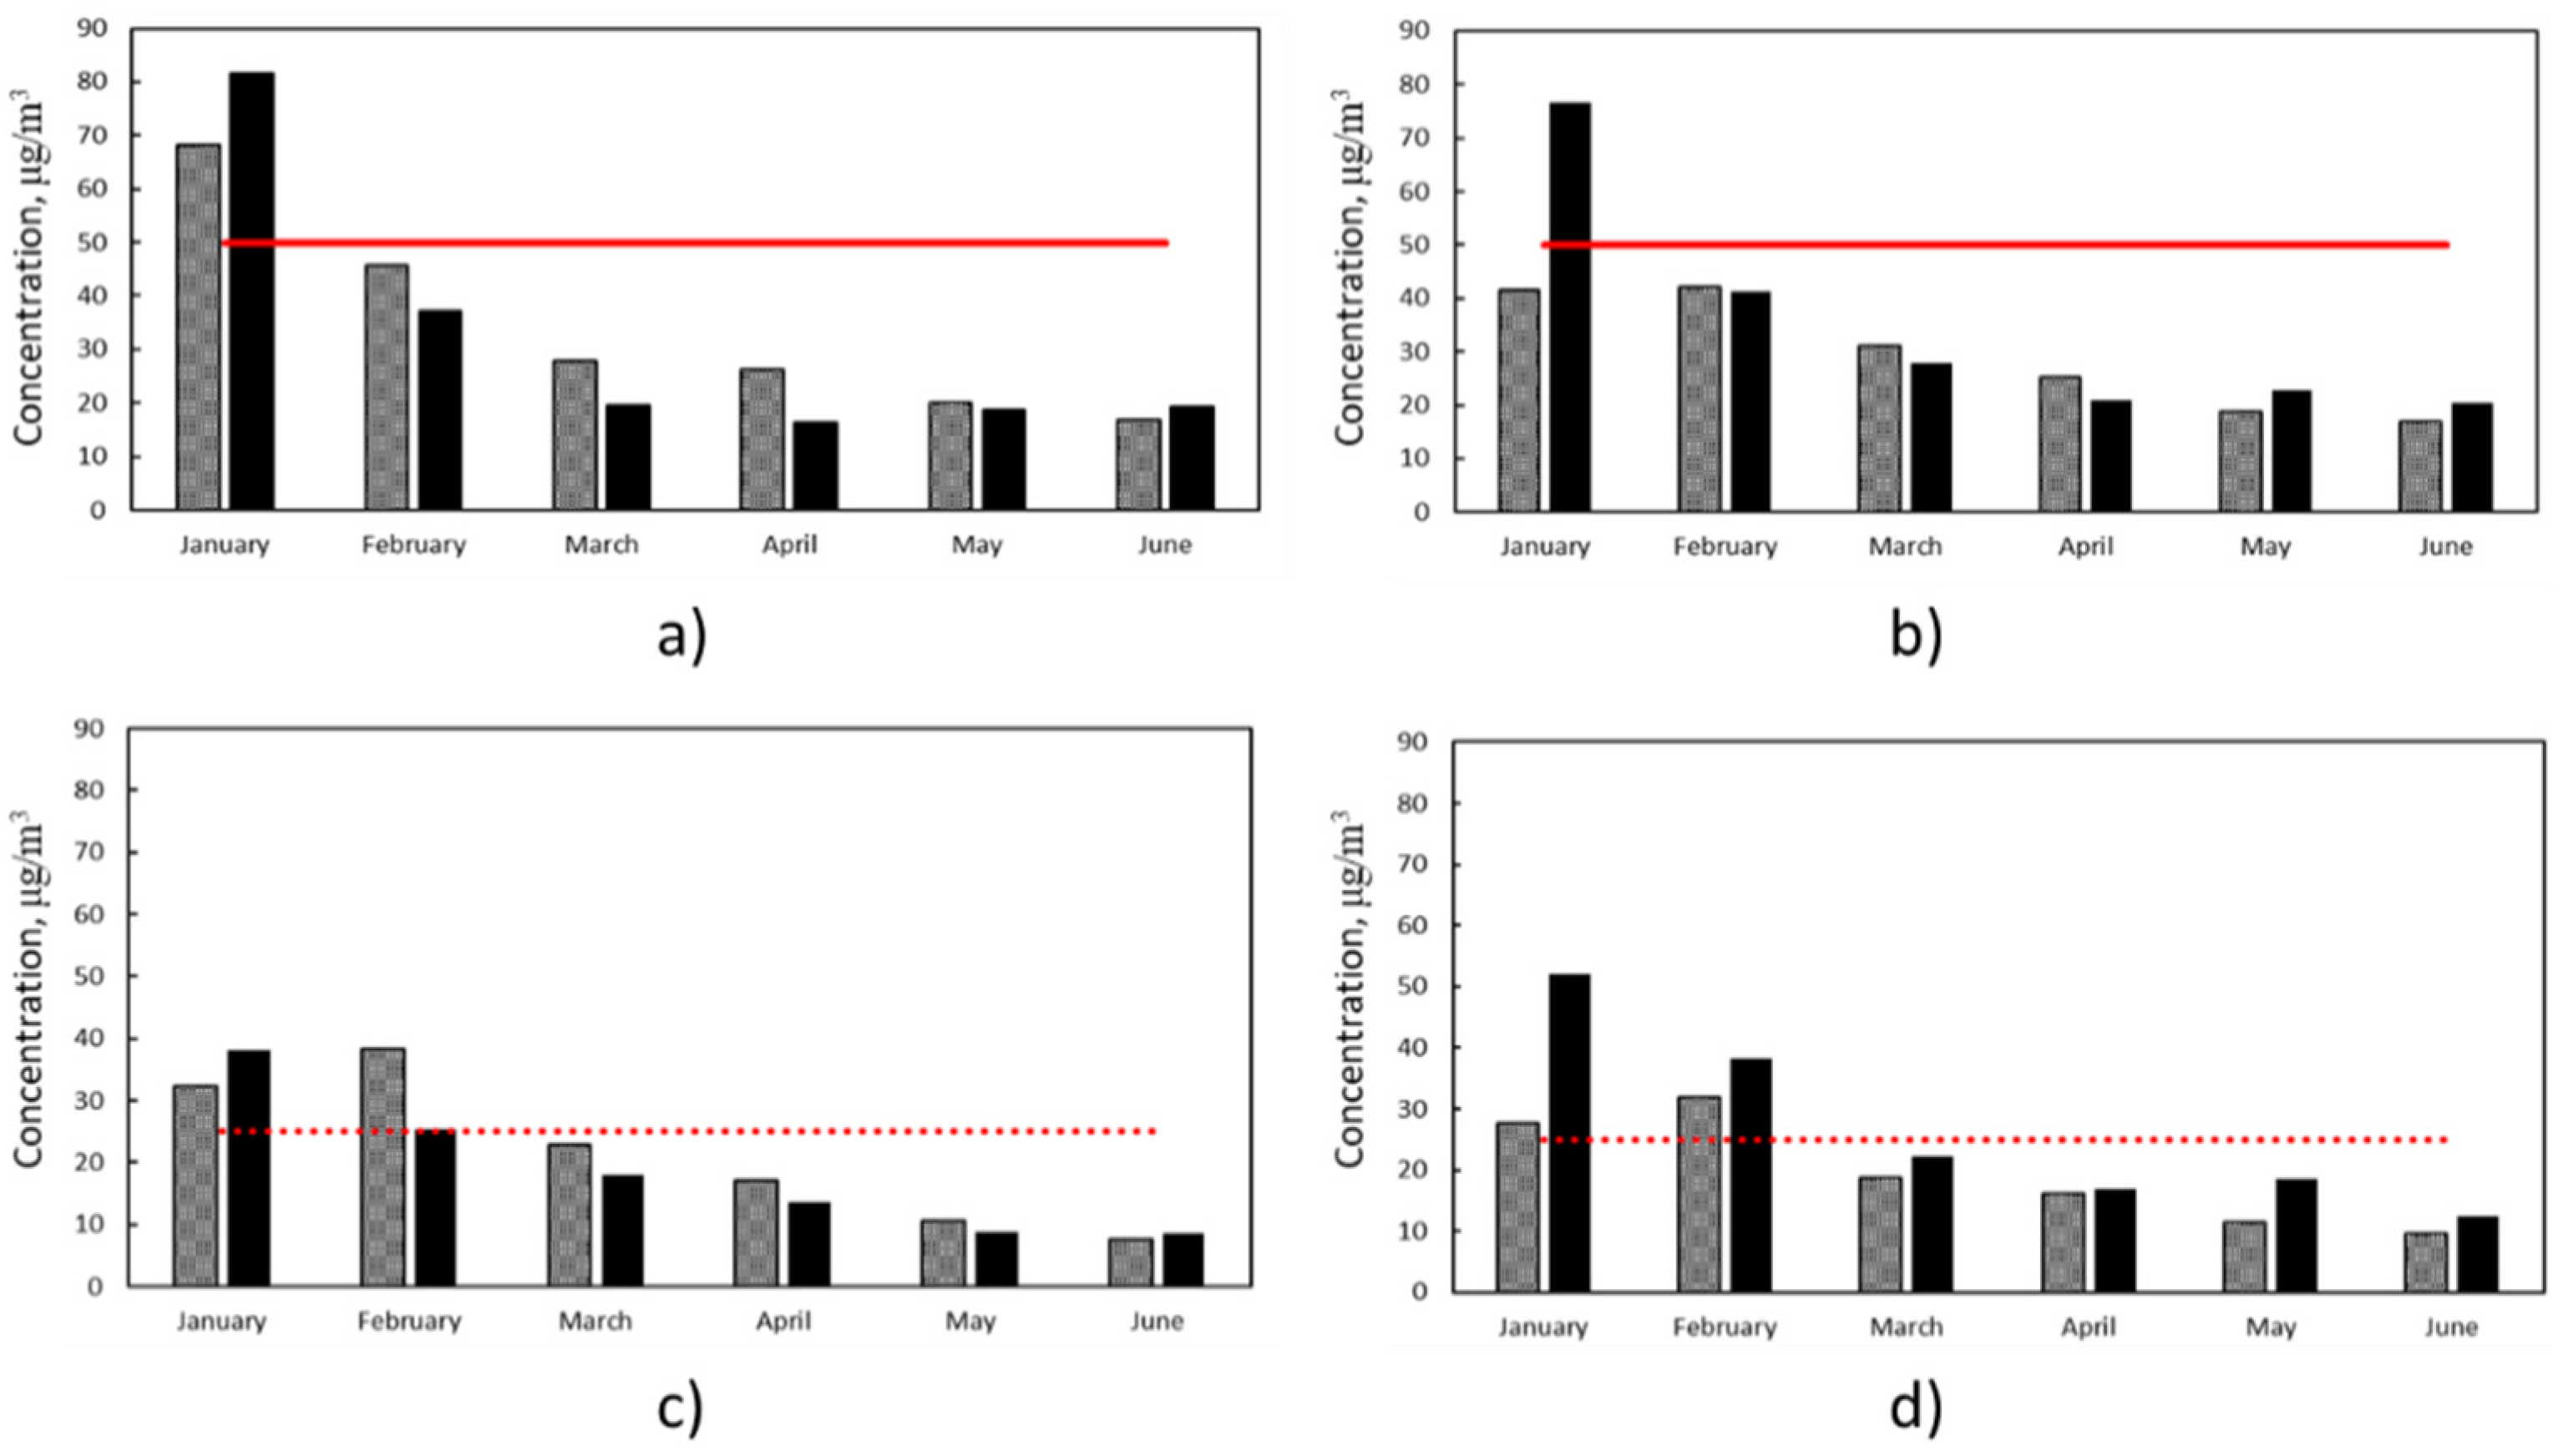
PM10 average monthly concentrations, measured by the ROM network (black) and the ARPALombardia (grey) in the months of January–April 2020 in Milan. Data for ARPA were taken from a single station, while data for the ROM network were taken by averaging all the data coming from all the cells within the same NIL, in which the ARPA station is located. The red solid line and the red dotted lines are the PM10 and PM2.5 daily law limits, according Lgs 155/2010, respectively. (a) PM10 monthly averages, relevant to the VE station; (b) PM10 monthly averages, relevant to the VP station; (c) PM2.5 monthly averages, relevant to the VE station; (d) PM2.5 monthly averages, relevant to the VP station.
Figure 12.
PM10 average monthly concentrations, measured by the ROM network (black) and the ARPALombardia (grey) in the months of January–April 2020 in Milan. Data for ARPA were taken from a single station, while data for the ROM network were taken by averaging all the data coming from all the cells within the same NIL, in which the ARPA station is located. The red solid line and the red dotted lines are the PM10 and PM2.5 daily law limits, according Lgs 155/2010, respectively. (a) PM10 monthly averages, relevant to the VE station; (b) PM10 monthly averages, relevant to the VP station; (c) PM2.5 monthly averages, relevant to the VE station; (d) PM2.5 monthly averages, relevant to the VP station.

Figure 13.
(a) PM10 average monthly concentrations measured by the ROM network in Milan in the months of January–June 2020. PM10 daily law limit according to D.Lgs 155/2010 (red solid line). (b) PM2.5 average monthly concentrations measured by the ROM network in Milan in the months of January–June 2020. PM2.5 daily law limit according to D.Lgs, 155/2010 (red solid line).

Figure 14.
(a) PM10 daily average concentration for NIL 23—Lambrate measured in April 2020 from the ROM network in Milan. (b) PM2.5 daily average concentration for NIL 23—Lambrate measured in April 2020 from the ROM network in Milan.
Figure 14.
(a) PM10 daily average concentration for NIL 23—Lambrate measured in April 2020 from the ROM network in Milan. (b) PM2.5 daily average concentration for NIL 23—Lambrate measured in April 2020 from the ROM network in Milan.

Figure 15.
PM10 monthly average measured by the ROM network in Milan: (a) January 2020; (b) February 2020; (c) March 2020; (d) April 2020; (e) May 2020; (f) June 2020.
Figure 15.
PM10 monthly average measured by the ROM network in Milan: (a) January 2020; (b) February 2020; (c) March 2020; (d) April 2020; (e) May 2020; (f) June 2020.

Figure 16.
PM2.5 monthly average measured by the ROM network in Milan: (a) January 2020; (b) February 2020; (c) March 2020; (d) April 2020; (e) May 2020; (f) June 2020.
Figure 16.
PM2.5 monthly average measured by the ROM network in Milan: (a) January 2020; (b) February 2020; (c) March 2020; (d) April 2020; (e) May 2020; (f) June 2020.

Figure 17.
Pollution levels (a) before and (b) during lockdown.


Table 1.
ARPA Lombardia air quality monitoring stations characteristics.
| Station | Acronym | Type | Pollutants Measured |
|---|---|---|---|
| Viale Liguria | VL | Urban Traffic | NO2, CO |
| Viale Marche | VM | Urban Traffic | PM10, NO2, CO |
| Via Pascal | VP | Urban Background | SO2, PM10, PM2.5, CO, O3, Benzene |
| Via Senato | VS | Urban Traffic | PM10, PM2.5, CO, Benzene |
| Verziere | VE | Urban Traffic | PM10, PM2.5, CO, O3 |
Table 2.
Ranking of the worst 4 NILs for the months January–April 2020.
| Month | NIL Name | PM10 Monthly Average, μg/m3 | PM2.5 Monthly Average, μg/m3 |
|---|---|---|---|
| January | 23 | 110 | 101 |
| 73 | 107 | 95 | |
| 17 | 101 | 94 | |
| 25 | 101 | 86 | |
| February | 44 | 65 | 60 |
| 73 | 65 | 58 | |
| 41 | 59 | 57 | |
| 63 | 58 | 54 | |
| March | 46 | 32 | 28 |
| 23 | 31 | 29 | |
| 17 | 30 | 28 | |
| 73 | 29 | 25 | |
| April | 38 | 39 | 35 |
| 42 | 37 | 32 | |
| 46 | 35 | 31 | |
| 23 | 32 | 30 |
Table 3.
Top 10 NILs with the highest PM10 reduction rate between March and January.
| Ranking | Nil Name | Best PM10 Daily Average Concentration, μg/m3 | Worst PM10 Daily Average Concentration, μg/m3 | PM10 Monthly Average Concentration, μg/m3 | Reduction % | |||
|---|---|---|---|---|---|---|---|---|
| January | March | January | March | January | March | |||
| 1 | 25 | 18 | 7 | 174 | 50 | 101 | 23 | 77 |
| 2 | 57 | 6 | <5 | 200 | 34 | 59 | 13 | 77 |
| 3 | 74 | 6 | <5 | 192 | 84 | 78 | 18 | 76 |
| 4 | 1 | 7 | 6 | 168 | 41 | 81 | 20 | 75 |
| 5 | 59 | 7 | 5 | 155 | 46 | 81 | 20 | 75 |
| 6 | 43 | 6 | <5 | 183 | 28 | 55 | 14 | 75 |
| 7 | 54 | 5 | <5 | 82 | 21 | 43 | 11 | 74 |
| 8 | 68 | 5 | 5 | 134 | 44 | 71 | 19 | 74 |
| 9 | 70 | 5 | <5 | 84 | 23 | 44 | 12 | 74 |
| 10 | 22 | 11 | 6 | 190 | 62 | 92 | 24 | 74 |
Table 4.
Top 10 NILs with the highest PM10 reduction rate between March and February.
| Ranking | Nil Name | Best PM10 Daily Average Concentration, μg/m3 | Worst PM10 Daily Average Concentration, μg/m3 | PM10 Monthly Average Concentration, μg/m3 | Reduction % | |||
|---|---|---|---|---|---|---|---|---|
| February | March | February | March | February | March | |||
| 1 | 57 | <5 | <5 | 136 | 34 | 48 | 13 | 72 |
| 2 | 41 | 6 | 5 | 162 | 39 | 59 | 19 | 67 |
| 3 | 65 | <5 | 5 | 149 | 33 | 54 | 19 | 65 |
| 4 | 44 | 5 | 6 | 169 | 52 | 65 | 26 | 60 |
| 5 | 63 | <5 | <5 | 195 | 101 | 58 | 23 | 60 |
| 6 | 73 | <5 | 9 | 166 | 60 | 65 | 29 | 56 |
| 7 | 62 | <5 | <5 | 140 | 44 | 39 | 18 | 54 |
| 8 | 55 | <5 | <5 | 123 | 36 | 36 | 17 | 52 |
| 9 | 77 | 5 | 6 | 139 | 47 | 49 | 24 | 51 |
| 10 | 43 | <5 | <5 | 71 | 28 | 28 | 14 | 50 |
Table 5.
Top 10 NILs with the highest PM2.5 reduction rate between March and January.
| Ranking | Nil Name | Best PM2.5 Daily Average Concentration, μg/m3 | Worst PM2.5 Daily Average Concentration, μg/m3 | PM2.5 Monthly Average Concentration, μg/m3 | Reduction % | |||
|---|---|---|---|---|---|---|---|---|
| January | March | January | March | January | March | |||
| 1 | 57 | 6 | <5 | 166 | 29 | 56 | 12 | 79 |
| 2 | 54 | 5 | <5 | 82 | 19 | 43 | 10 | 77 |
| 3 | 70 | 5 | <5 | 84 | 21 | 44 | 10 | 77 |
| 4 | 43 | 6 | <5 | 161 | 26 | 54 | 13 | 76 |
| 5 | 74 | 6 | <5 | 153 | 73 | 68 | 16 | 76 |
| 6 | 25 | 22 | 6 | 156 | 46 | 86 | 21 | 76 |
| 7 | 1 | 5 | 5 | 149 | 38 | 72 | 18 | 75 |
| 8 | 53 | 7 | <5 | 166 | 41 | 73 | 18 | 75 |
| 9 | 59 | 5 | <5 | 137 | 42 | 73 | 18 | 75 |
| 10 | 56 | 7 | <5 | 153 | 38 | 75 | 19 | 75 |
Table 6.
Top 10 NILs with the highest PM2.5 reduction rate between March and February.
| Ranking | Nil Name | Best PM2.5 Daily Average Concentration, μg/m3 | Worst PM2.5 Daily Average Concentration, μg/m3 | PM2.5 Monthly Average Concentration, μg/m3 | Reduction % | |||
|---|---|---|---|---|---|---|---|---|
| February | March | February | March | February | March | |||
| 1 | 57 | 5 | <5 | 137 | 29 | 48 | 12 | 75 |
| 2 | 41 | 6 | <5 | 155 | 36 | 57 | 17 | 69 |
| 3 | 65 | 4 | 4 | 141 | 30 | 53 | 17 | 68 |
| 4 | 63 | <5 | <5 | 164 | 90 | 54 | 20 | 63 |
| 5 | 44 | 5 | 5 | 155 | 47 | 60 | 23 | 62 |
| 6 | 77 | 5 | 5 | 157 | 43 | 55 | 22 | 61 |
| 7 | 62 | <5 | <5 | 119 | 38 | 35 | 15 | 56 |
| 8 | 43 | <5 | <5 | 76 | 26 | 29 | 13 | 56 |
| 9 | 73 | <5 | 8 | 146 | 50 | 58 | 25 | 56 |
| 10 | 55 | <5 | <5 | 109 | 32 | 34 | 17 | 51 |
Publisher’s Note: MDPI stays neutral with regard to jurisdictional claims in published maps and institutional affiliations. |
© 2021 by the authors. Licensee MDPI, Basel, Switzerland. This article is an open access article distributed under the terms and conditions of the Creative Commons Attribution (CC BY) license (https://creativecommons.org/licenses/by/4.0/).
Share and Cite
MDPI and ACS Style
Lotrecchiano, N.; Trucillo, P.; Barletta, D.; Poletto, M.; Sofia, D. Air Pollution Analysis during the Lockdown on the City of Milan. Processes 2021, 9, 1692. https://0-doi-org.brum.beds.ac.uk/10.3390/pr9101692
AMA Style
Lotrecchiano N, Trucillo P, Barletta D, Poletto M, Sofia D. Air Pollution Analysis during the Lockdown on the City of Milan. Processes. 2021; 9(10):1692. https://0-doi-org.brum.beds.ac.uk/10.3390/pr9101692
Chicago/Turabian StyleLotrecchiano, Nicoletta, Paolo Trucillo, Diego Barletta, Massimo Poletto, and Daniele Sofia. 2021. "Air Pollution Analysis during the Lockdown on the City of Milan" Processes 9, no. 10: 1692. https://0-doi-org.brum.beds.ac.uk/10.3390/pr9101692
Note that from the first issue of 2016, this journal uses article numbers instead of page numbers. See further details here.