Article

Poultry Slaughterhouse Wastewater Remediation Using a Bio-Delipidation Pre-Treatment Unit Coupled with an Expanded Granular Sludge Bed Reactor

by
Cebisa Thabo Mdladla
1,
Phumeza Akhona Dyosile
1,
Mahomet Njoya
1,
Moses Basitere
2,*,
Seteno Karabo Obed Ntwampe
3 and
Ephraim Kaskote
4
1
Bioresource Engineering Research Group (BioERG), Department of Chemical Engineering, Cape Peninsula University of Technology, P.O. Box 652, Cape Town 8000, South Africa
2
Academic Support Programme for Engineering in Cape Town (ASPECT) & Water Research Group, Department of Civil Engineering, University of Cape Town, Rondebosch, Cape Town 7700, South Africa
3
Centre of Excellence for Carbon-Based Fuels, School of Chemical and Minerals Engineering, North West University, Private BagX1290, Potchefstroom 2520, South Africa
4
Malutsa (Pty) Ltd., c/o Oude Pont and Meent Street (Malutsa House), Wellington Industrial Park, Wellington 7655, South Africa
*
Author to whom correspondence should be addressed.
Submission received: 15 September 2021 / Revised: 18 October 2021 / Accepted: 19 October 2021 / Published: 29 October 2021
(This article belongs to the Special Issue Applied Enzymology & Environmental Biotechnology)

Abstract

:
The treatment of poultry slaughterhouse wastewater (PSW) with an Expanded Granular Sludge-Bed Bioreactor (EGSB) is hindered by the washout of activated sludge, and difficulties associated with the operation of the three-phase separator and the determination of the optimum up-flow velocity for sludge-bed fluidization. This results in a poor reactor functionality, and thus a poor performance due to pollutants such as fats, oil and grease (FOG) in the PSW being treated. Hydrolyzing the FOG content with a bio-delipidation, enzyme-based agent in a pre-treatment unit would significantly improve the effectiveness of the primary PSW treating system, i.e., the EGSB. In this study, PSW was pre-treated for 48 h with a biological mixture containing bioflocculants and bio-delipidation constituents. The pre-treated PSW was further treated in an EGSB. The PSW FOG, total chemical oxygen demand (tCOD) and total suspended solids (TSS) content were determined to assess the effectiveness of the pre-treatment process as well as to observe the remedial action of the combined pre-treatment-EGSB system. An increased treatment efficacy was noted for the combined PSW treatment system, whereby the tCOD, FOG and TSS removal averaged 76%, 88% and 87%, respectively. The process developed is intended for micro, small and medium poultry slaughterhouses.

1. Introduction

Poultry slaughterhouse wastewater (PSW) contains a high concentration of organic matter and other pollutants such as fats, oils and grease (FOG), and colloidal particles, as well as soluble proteins from the slaughtering and cleaning activities from the poultry slaughterhouses. If the PSW is discharged into surface water sources, the nutrient-rich and high organic matter it contains could result in the pollution, eutrophication and deoxygenation of the water bodies it is discharged into [1,2]. The poultry industry is therefore mandated to reduce wastewater contaminant levels, as per the Department of Water Affairs and the City of Cape Town 2014 by-laws of South Africa (SA) [3], i.e., to reduce contaminants to specified levels prior to it’s release into receiving water bodies [4]. Over the years, several treatment processes have been employed by the poultry industry to meet the regulatory PSW discharge standards set by regulatory bodies. These treatment processes include biological, physical, and chemical treatment processes, with anaerobic digestion (AD) being the primary treatment technology of choice.
AD facilitates the reduction in solids as the sludge acts as a biofilter, provides effective pathogen destruction, reduces odor potential, and can also provide an energy source in the form of biogas being produced. Furthermore, AD is also a predominant organic matter removal process and conserves energy in comparison to aerobic digestion [1]. AD is noted to be suitable for effectively treating high-strength, industrial wastewater while providing energy generation, low sludge output and, when stabilized, provides an effluent with a consistent concentration of monitored parameters when compared with aerobic and physicochemical methods. The first stage of the degradation of organic matter is its solubilization and the hydrolysis of complex polymeric organic carbon structures in the wastewater being treated [5,6]. Hydrolysis is noted as one of the processes that limits the stages of wastewater treatment, resulting in the slow degradation rates by the sludge in an AD [7]. One of the main causes of slow sludge hydrolysis is the low biodegradability potential of the constituents in the sludge [8]. It is therefore important to improve the sludge hydrolysis potential by pre-treating wastewater before treating it in an AD. The introduction of hydrolytic bacteria and their constituents in the pre-treatment step, i.e., microorganisms or biomolecules which can convert carbohydrates even partially, hydrolyzing FOG, can improve the sludge performance for the treatment of wastewaters such as PSW [9].
Pre-treatment refers to the treatment of wastewater to enhance the availability of substrates to microorganisms in subsequent processes, thereby improving the removal of organics and enhancing the decomposition of any other pollutants [10]. The pre-treatment stage provides several advantages resulting in an improved AD system. These include, decreasing the viscosity of sludge which permits greater organic loading rates for the AD. An increase in non-hydrolyzed constituents and solids concentration in the wastewater feed, including their accumulation within an AD system, either culminates in a small digester volume capacity or reduces the hydraulic retention times of the digester [11]. Another advantage of pre-treating wastewater is that it increases the amount of released insoluble constituents significantly enhancing the generation of by-products such as volatile fatty acids (VFAs) for improved treatment of the wastewater and biogas production [12]. Overall, the pre-treatment methods have also achieved significant results in the lysis or disintegration of solids in wastewater, resulting in enhanced biogas production [7]. Table 1 consists of a list of pretreatment methods currently in use for reducing FOG, biological oxygen demand (BOD), total chemical oxygen demand (tCOD) and the total suspended solids (TSS) in PSW. Most of these methods are physico-chemical methods.
Compared to physico-chemical methods, biological pre-treatments are a preferred option due to their non-toxicity as they use biodegradable, extracellular, biopolymeric substances secreted by algae, yeast and bacteria. Due to this, secondary pollution is significantly reduced. Overall, a biological constituent-supported remediation technology has been identified as an eco-friendly alternative to chemical and physical treatment options, even for the pre-treatment of wastewater. Additionally, biological constituents have also been used to mimic the functions of chemicals, even for flocculation systems, whereby extracellular polymeric substances (EPS) in high concentrations are observed to impart charged amino groups resulting in stronger electrostatic interactions to support a desired function [7].
Previous studies have focused on identifying a bacterial culture from PSW which has the natural ability to dissolve FOG and tCOD removal [19,20]. There is little focus on currently commercially available products (many of which are readily available, albeit with different qualities) with these capabilities, which would invariantly reduce the need to find suitable organisms, optimize culture conditions to obtain the desired traits of the final product and develop new production systems to manufacture the desired product with an appropriate quality. This disincentivizes micro, small and medium poultry slaughterhouses to implement effective PSW treatment technology, as this requires additional capital investment. Therefore, in this study, a cheap commercially available product, i.e., Eco-Flush™, consisting of a bacterial enzyme blend used in the remediation of hydrocarbon-contaminated soil and which facilitates the decomposition of various forms of organic waste, was used. It catalyzes the decomposition of numerous types of waste and has the ability to provide a flocculation-hydrolysis function. The constituents include glaucids and essential amino acids, which can stimulate organisms in wastewater being pre-treated such that the proliferation of other bacterial species in the wastewater is supported, thus producing other enzymes capable of breaking down hydrocarbons in organic matter and providing a mixture of soluble fatty acids. This can lower tCOD, BOD, FOG, and odors and alleviate most challenges encountered in operating grease traps [21]. Using such a biological agent in a pre-treatment unit, prior to an AD system, could significantly improve the performance of any combined pre-treatment-AD system for effective PSW treatment. However, the choice of an appropriate AD system, which treats the wastewater post pre-treatment, is of paramount importance.
Studies by Bustillo-Lecompte and Mehrvar [22] revealed that the anaerobic process was economically more attractive for PSW treatment because it had low energy requirements and achieved a low sludge production. However, further treatment methods were required to fulfil wastewater discharge standards and reduce sludge washout and the accumulation of FOG within the AD, which resulted in the design of an Expanded Granular Sludge-Bed bioreactor (EGSB) as the preferred AD system for PSW treatment. However, Bustillo-Lecompte and Mehrvar [22], Kaskote et al. [23] and Njoya et al. [24] all recommended that a pre-treatment step would successfully facilitate the remediation of FOG, which resulted in sludge washout and the clogging of the EGSB. Therefore, this research aims to identify whether pre-treating PSW with a commercially available biological product containing essential constituents for the biological modification of colloidal particles, including tCOD and FOG removal, even in small quantities, followed by an EGSB, could result in the optimal treatment of PSW suitable for micro, small and medium poultry slaughterhouses. Furthermore, this study evaluated how this pre-treatment process, combined with an EGSB, could improve the overall efficiency of PSW treatment at a high throughput, small plant footprint, and low cost.

2. Materials and Methods

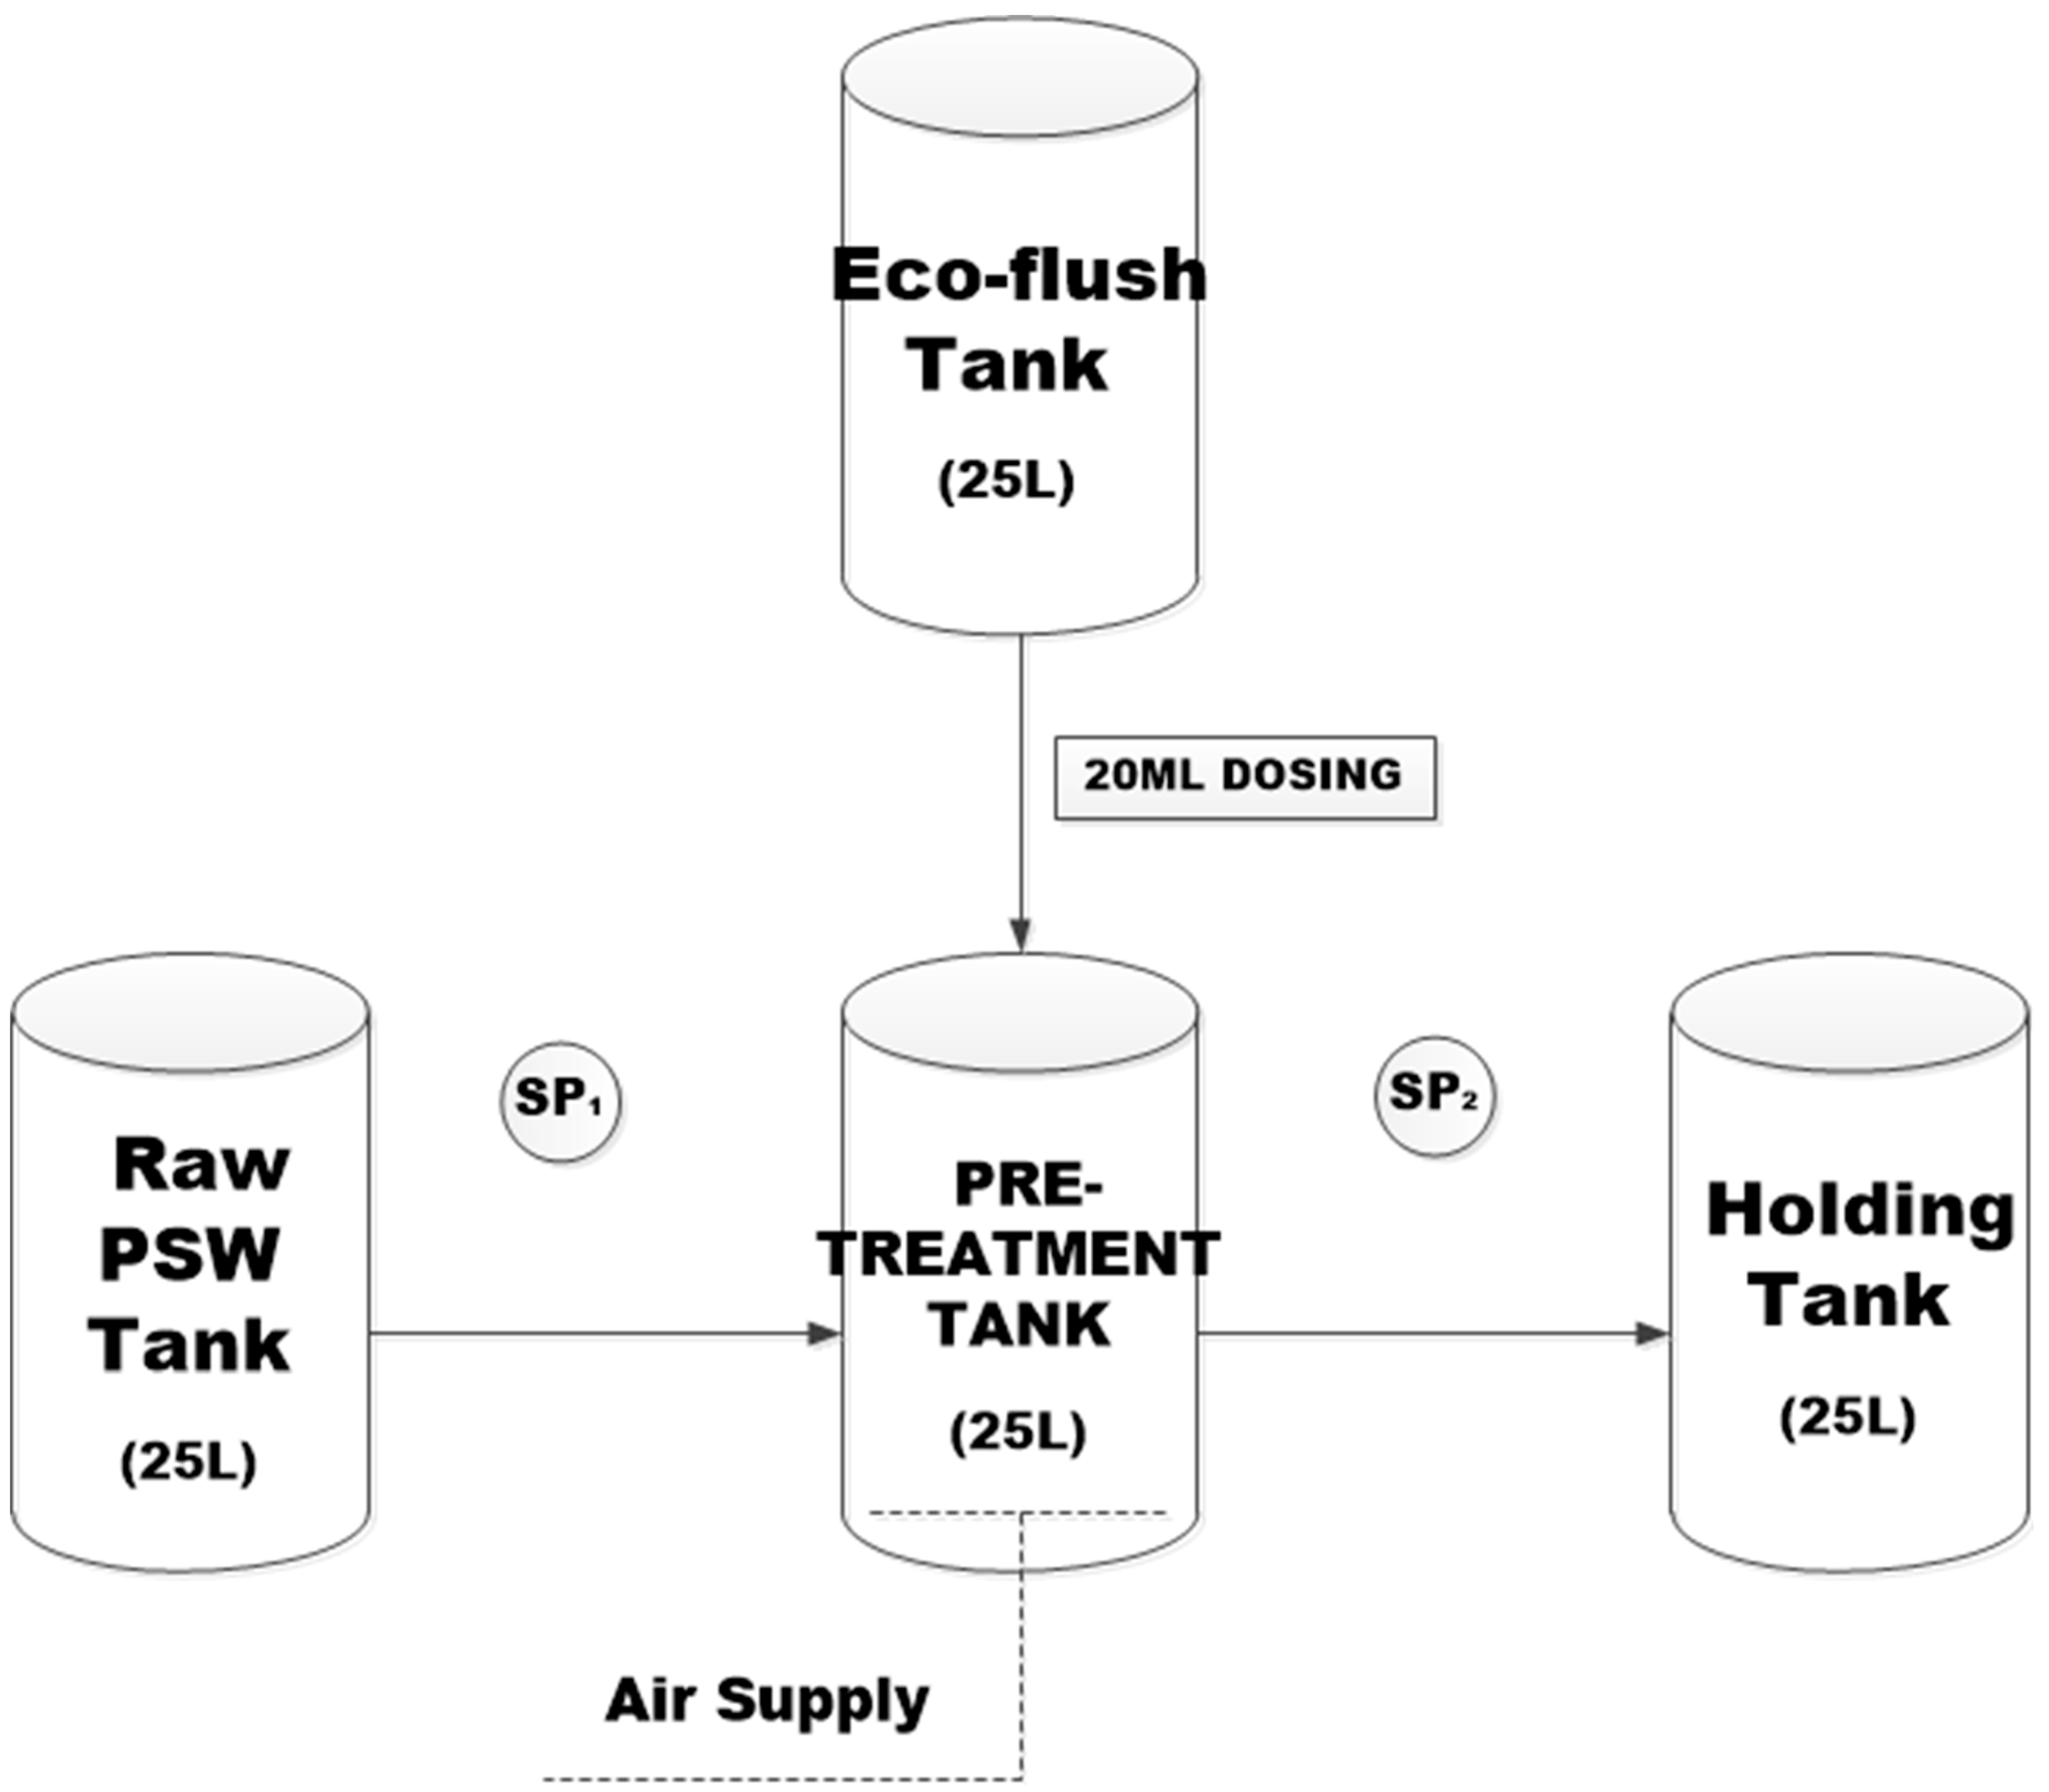
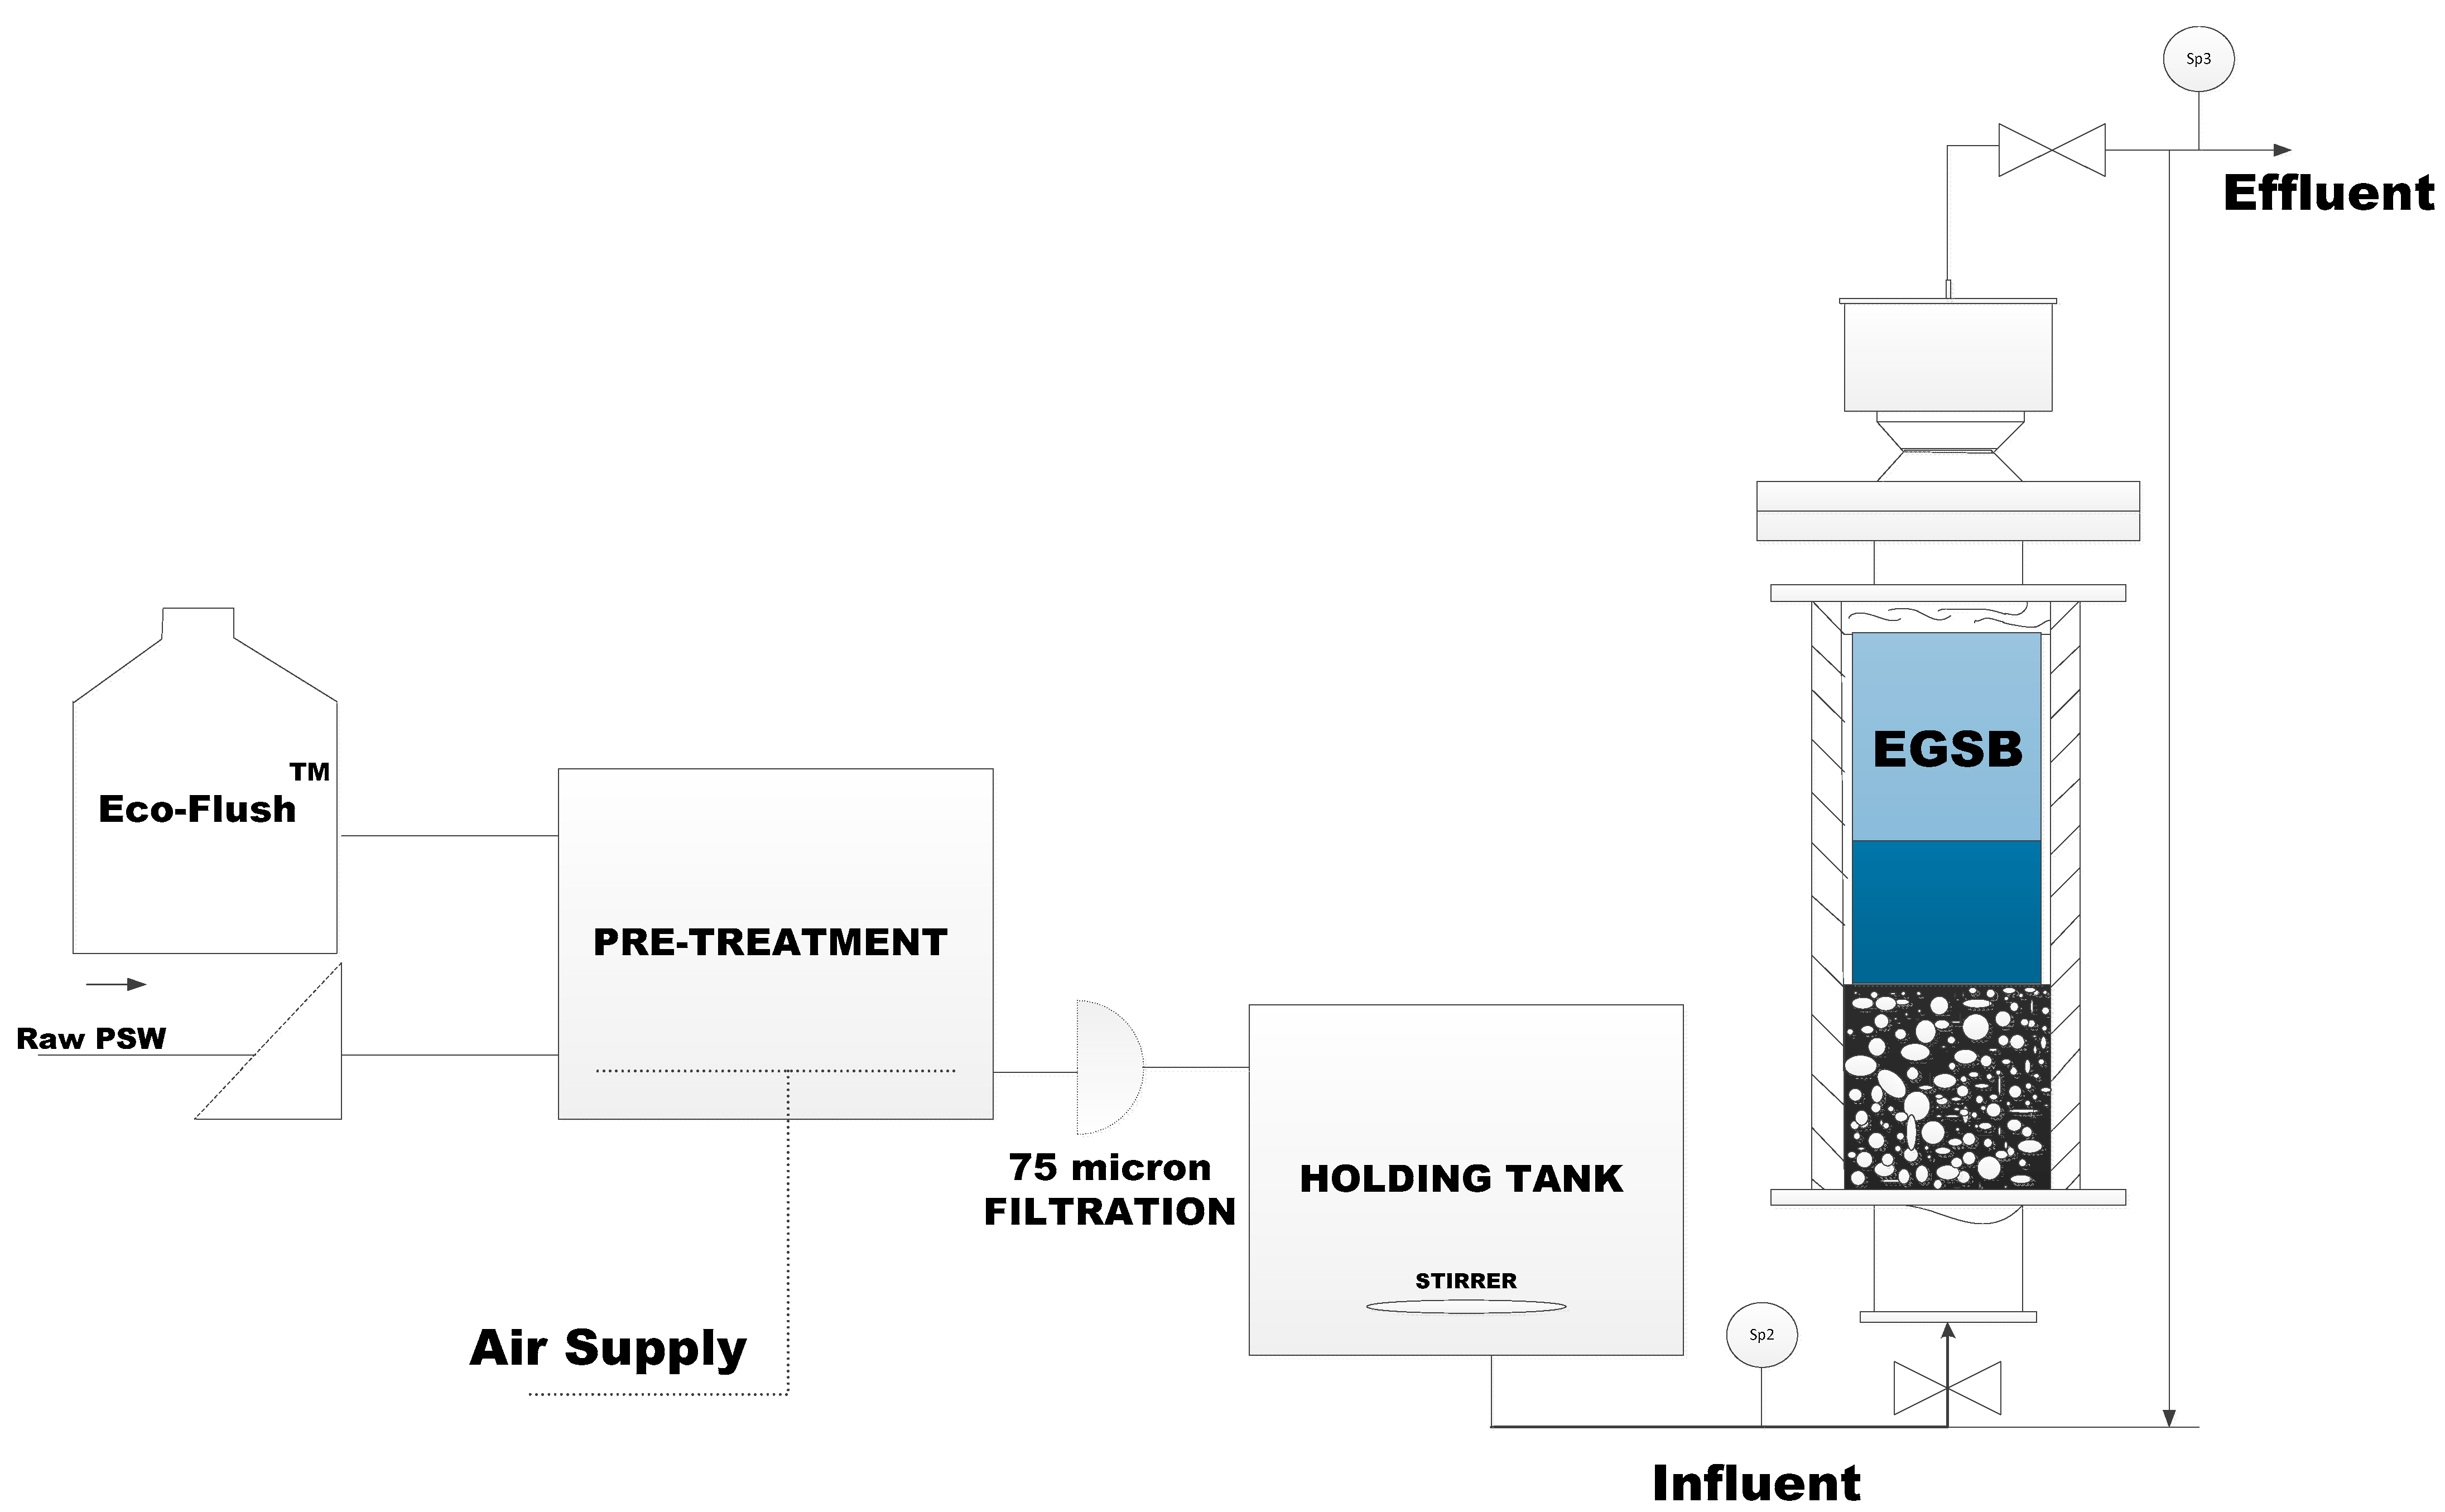
2.1. Poultry Slaughterhouse Wastewater Collection and Pre-Treatment Process Set-Up

PSW was collected from a local poultry abattoir situated in the Western Cape province of South Africa and stored at 4 °C over the duration of the experiment to minimize acidification. Eco-Flush™, a viscous brown liquid with delipidating properties, was procured in a 20 L bottle from Mavu Biotechnologies (Pty) Ltd. (Atlantis, SA), and used in a 25 L aerated pre-treat unit whereby the PSW was also fed. In the pre-treatment system, Eco-FlushTM was mixed fed-batch wise, i.e., by aeration, at an Eco-FlushTM-PSW ratio of 20 mL/20 L PSW with the mixture having a hydraulic retention time of 48 h. Subsequently, a 25 L post pre-treatment holding tank was used to settle the pre-treated sample and to reduce the dissolved oxygen levels in the PSW prior to it being fed to the EGSB, as illustrated in Figure 1.

Operating Conditions and Sample Preparation

To ensure that there was enough dissolved oxygen for the optimum proliferation of aerobic bacteria in the Eco-FlushTM-PSW mixture, the mixture was aerated for 24 h to promote the flocculation-coagulation of the colloidal particles, and in particular FOG. Furthermore, the flocs were removed using a 75 μm Madison test sieve while the cake attached to the inside walls of the pre-treatment tank was physically skimmed out, prior to the PSW transfer into a sealed holding tank with a purge port, whereby it was held for an additional 24 h under low stirring conditions using a magnetic stirrer to attain a homogeneous mixture, to allow further biological activity within the stored PSW and to reduce dissolved oxygen levels prior to the PSW being continuously suppled into the EGSB.

2.2. EGSB Operation

The EGSB consisted of a 2 L sized interior in which pumice stones were used as an underdrain to prevent granular sludge washout and feed (PSW) channeling at the feed port and to improve the distribution of the PSW to the anaerobic biomass. Surrounding the outer casing of the EGSB, temperature-regulated water, to maintain the reactor at a steady 37 °C, was used for optimum operation. The system was a modification of an Up-flow Anaerobic Sludge-Bed reactor with a recycle, as illustrated in Figure 2, to prevent the accumulation of a FOG-induced sludge cake forming within the bioreactor, resulting in a blockage. This lab-scale plant pre-treatment EGSB unit was designed and manufactured under Malutsa (Pty) Ltd., Western Cape, Wellington Industrial Park, SA.

Conditions, Sample Preparation and Analytical Methods
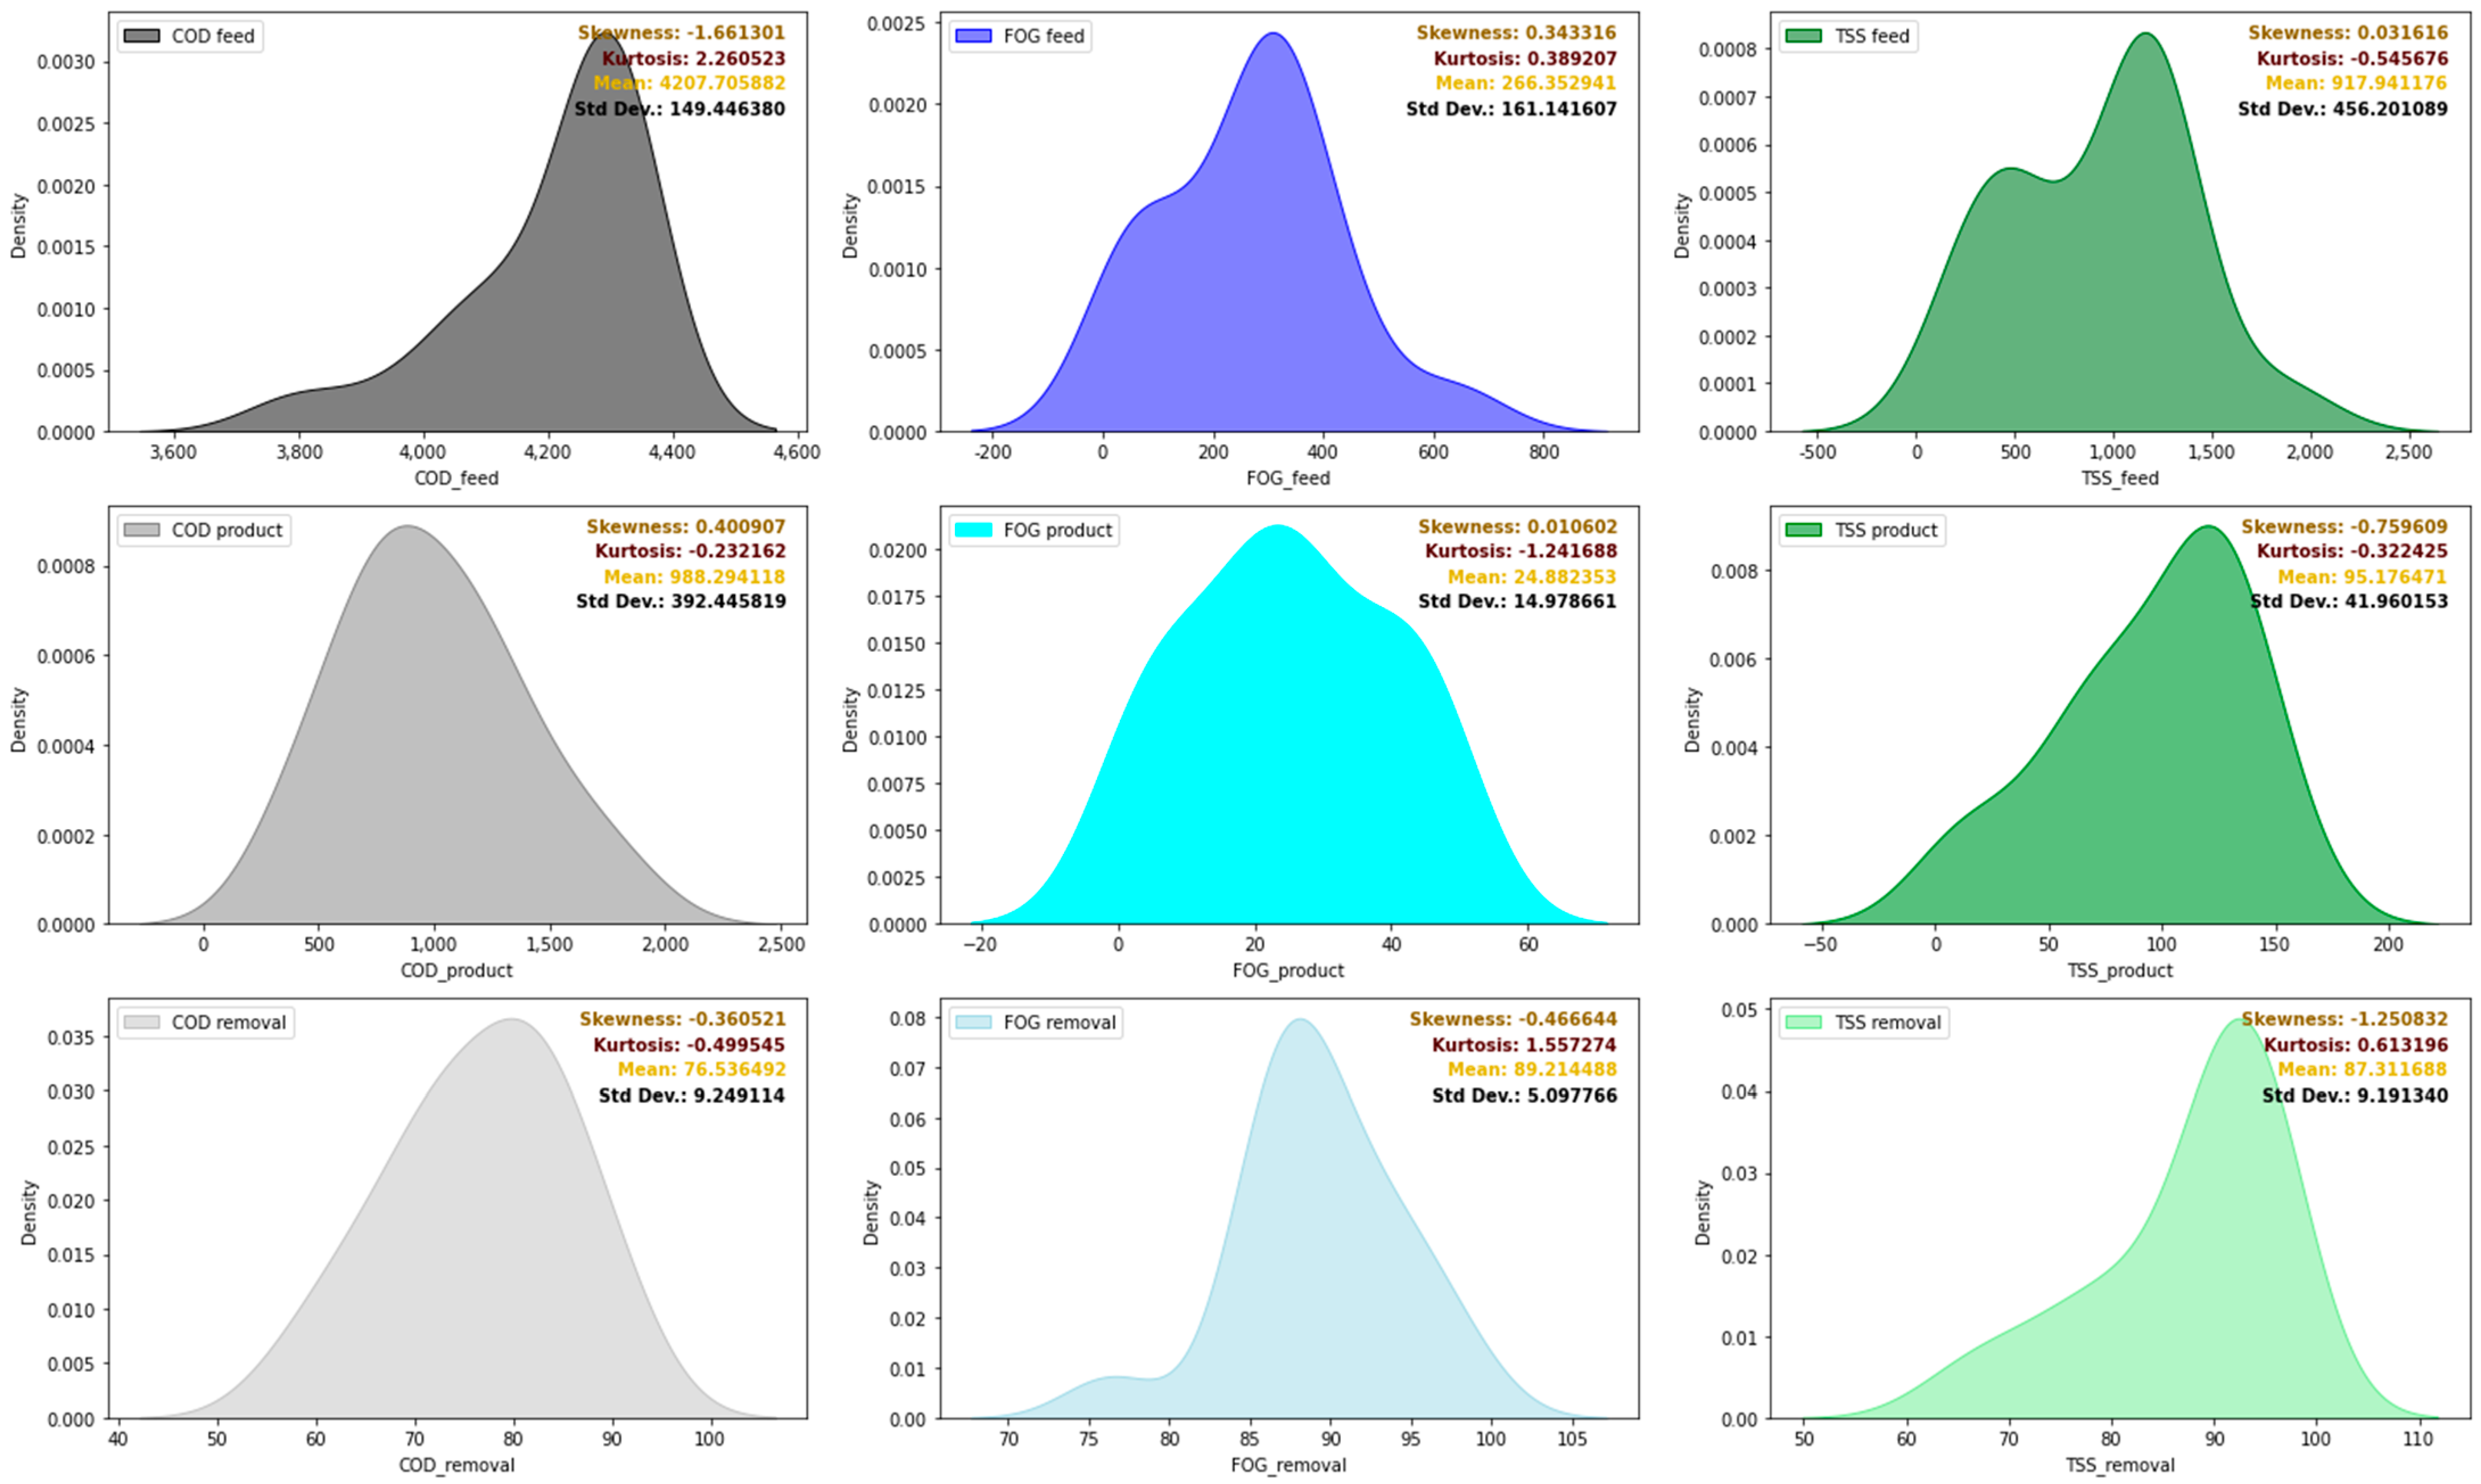
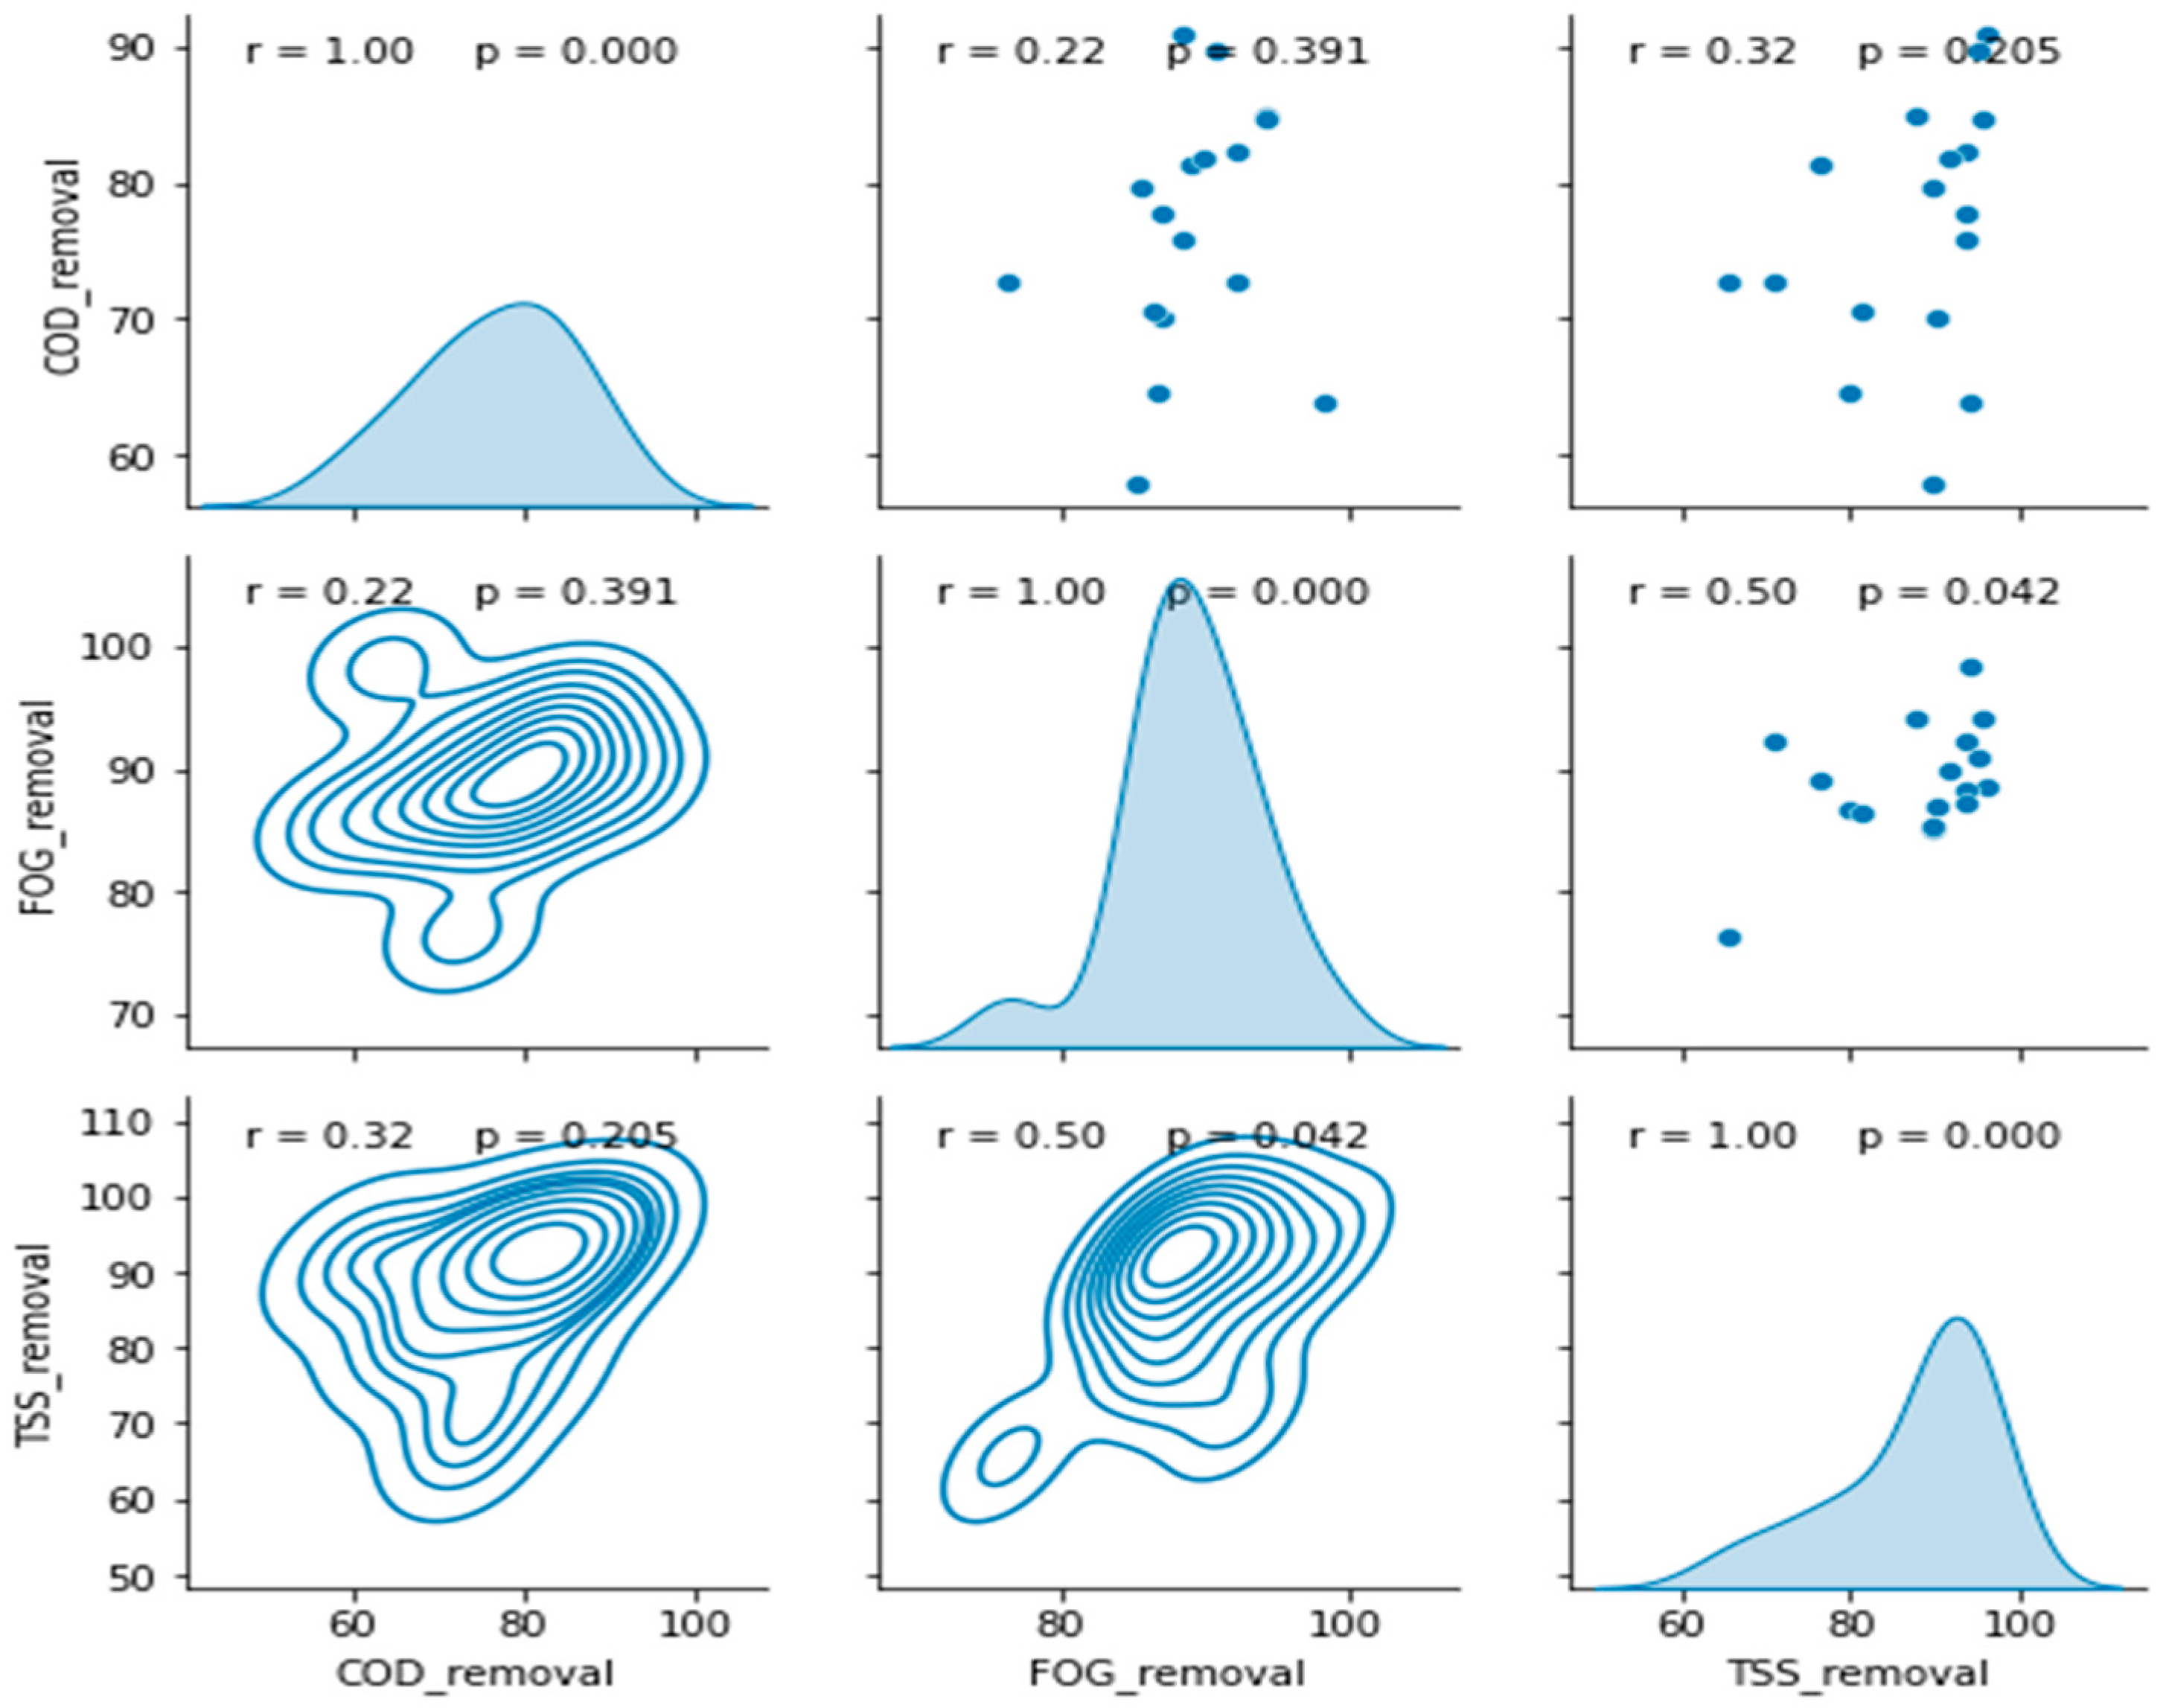
The EGSB containing a mixture of activated sludge, a milk solution as a substrate and PSW was allowed contact time for acclimatization prior to feeding the EGSB with the pre-treated wastewater. The EGSB was initially fed with pre-treated PSW for 16 h a day for two weeks to allow the activated sludge to adapt to the new feed and for the proper optimization of the plant’s parameters. The system was then run continuously, over a period of 100 days, 2 L samples were collected every 48 h from the pre-treated PSW and the effluent from the EGSB product port and the samples were taken to the City of Cape Town (CCT) for COD, FOG and TSS analyses. With reference to a representative sample taken prior to experimentation, a qualitative analysis was conducted by comparing the COD, TSS, as well as FOG levels, of the pre-treated PSW and the EGSB effluent. This assisted in identifying the efficacy of the Eco-Flush™ as a pre-treatment agent, the efficiency of the EGSB, as well as the combined treatment efficacy of the pre-treated EGSB system treating PSW. Table 2 represents the analytical methods used to measure the sample parameters. The data were analyzed using Python (programming language). Python libraries used to generate the figures included Matplotlib and Seaborn and each data point represented the average of the samples that were collected in triplicates.

3. Results

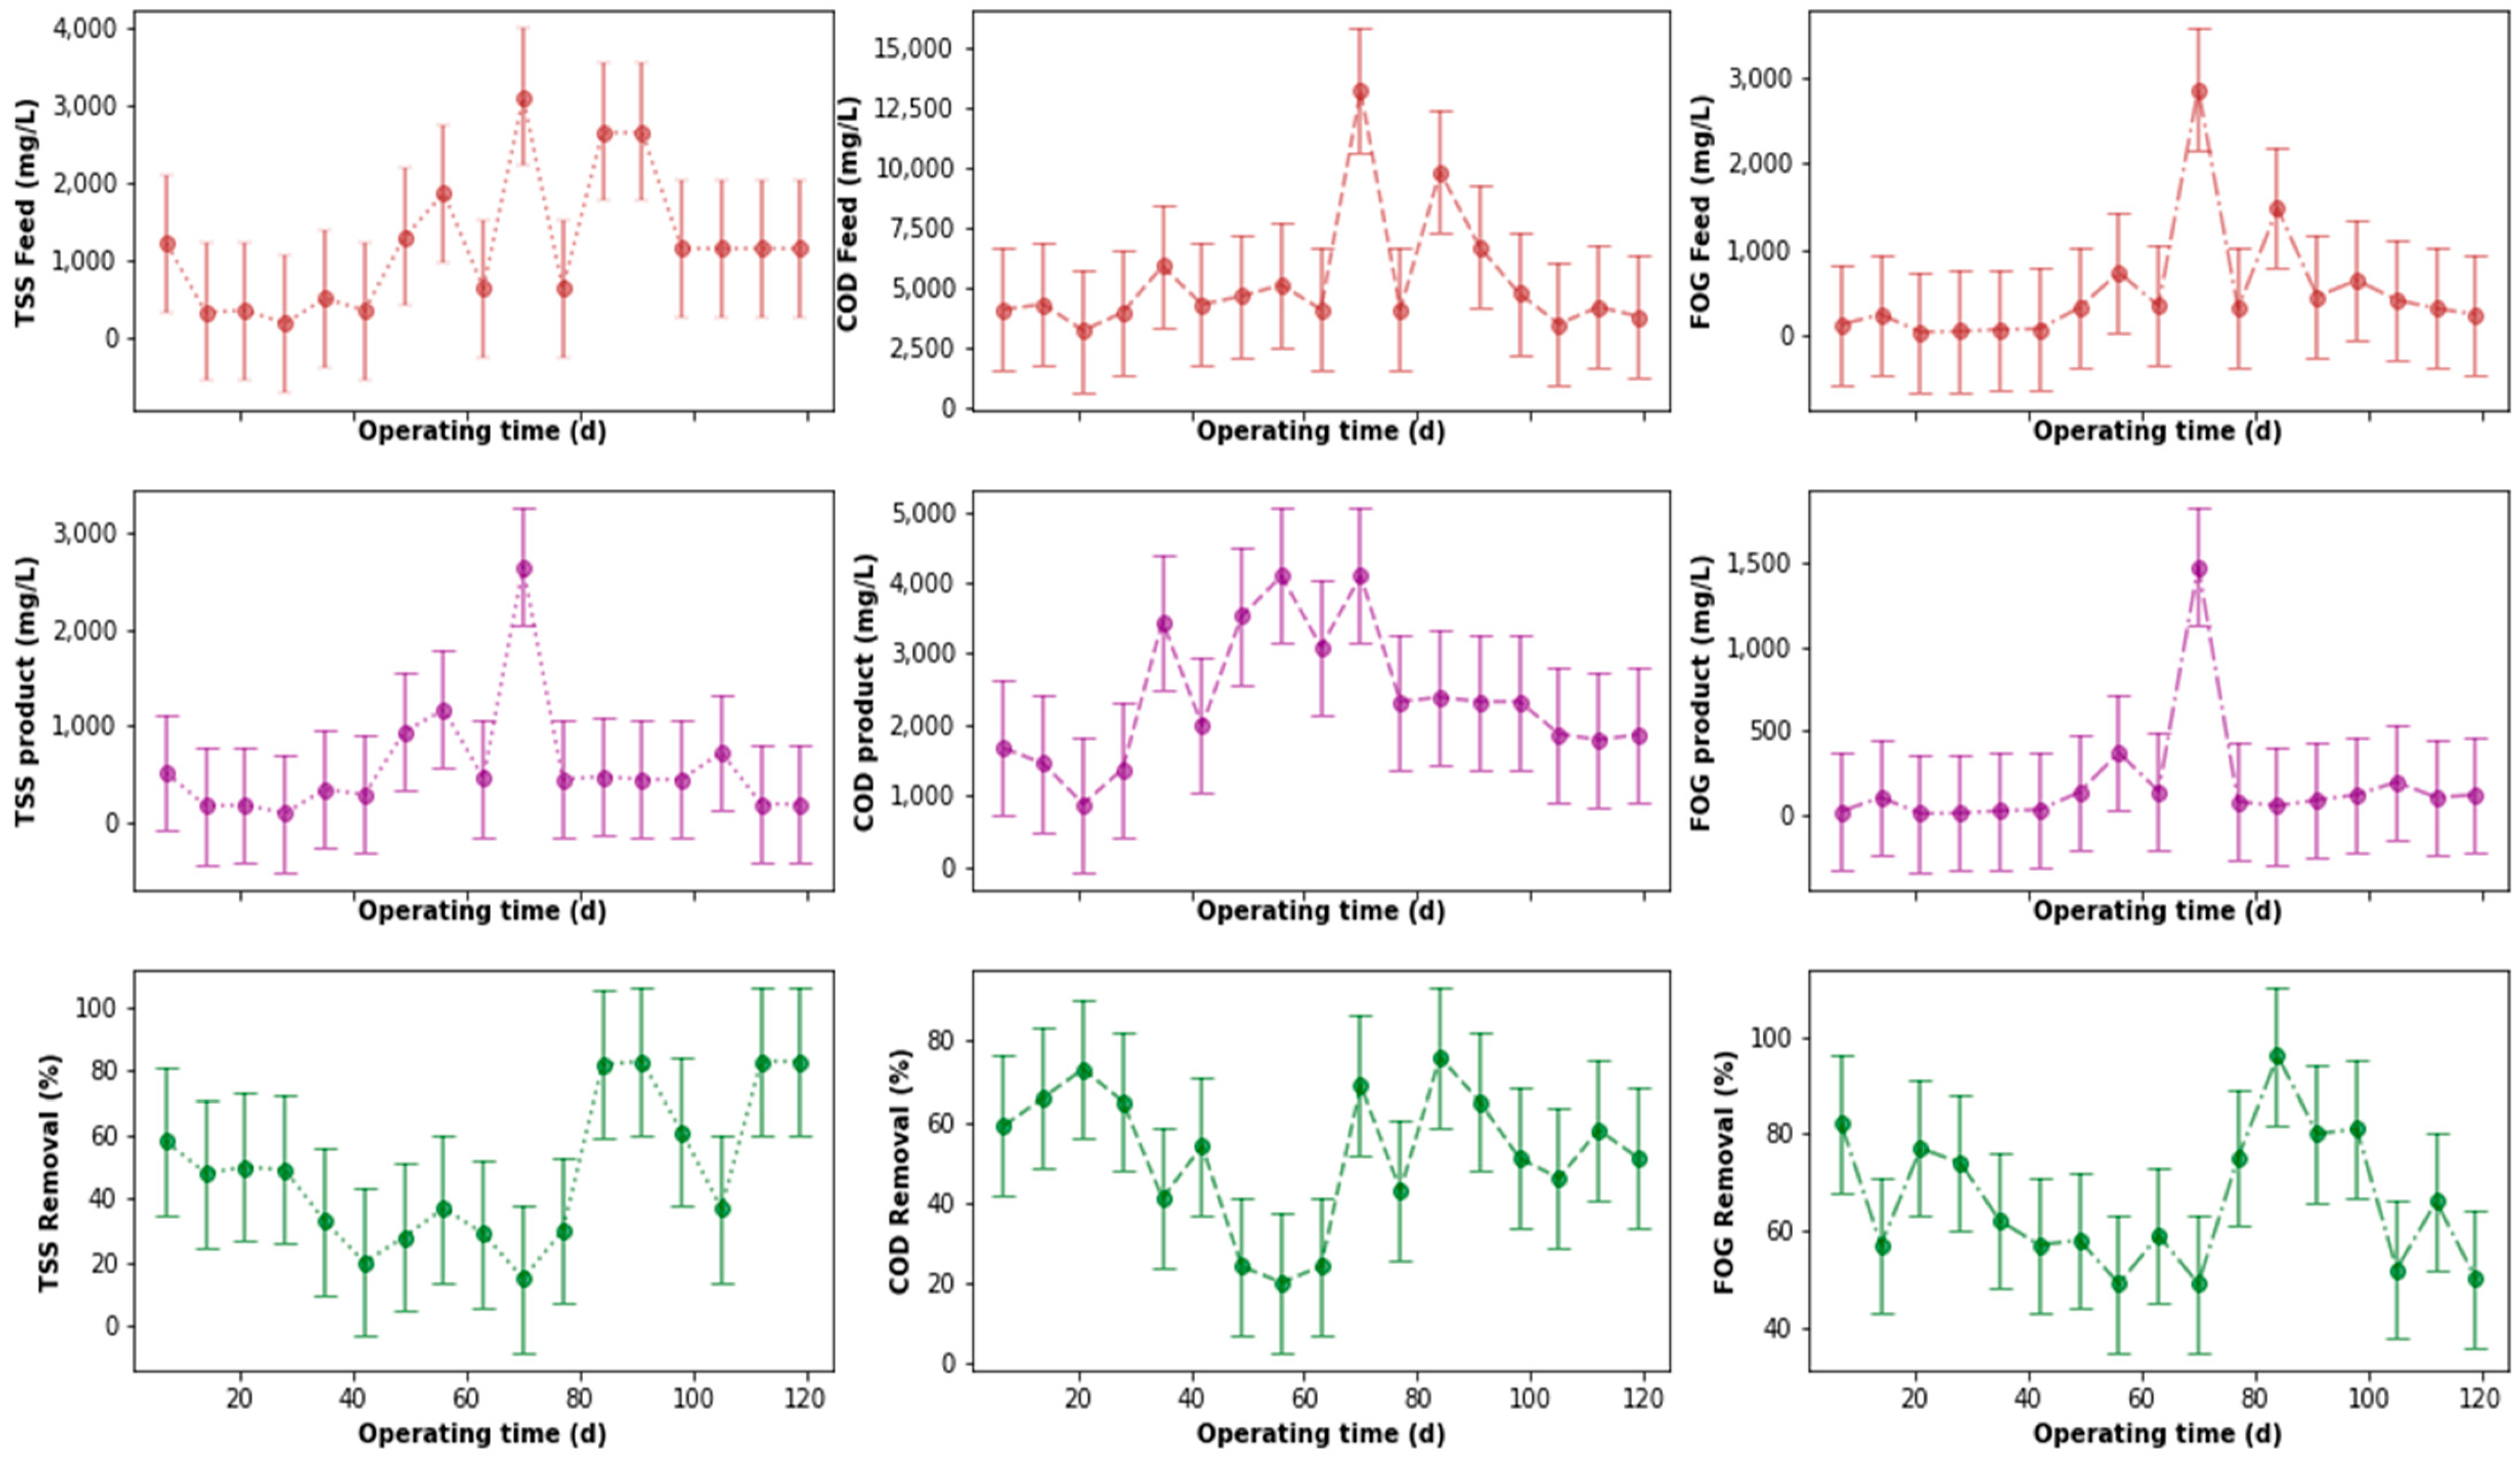
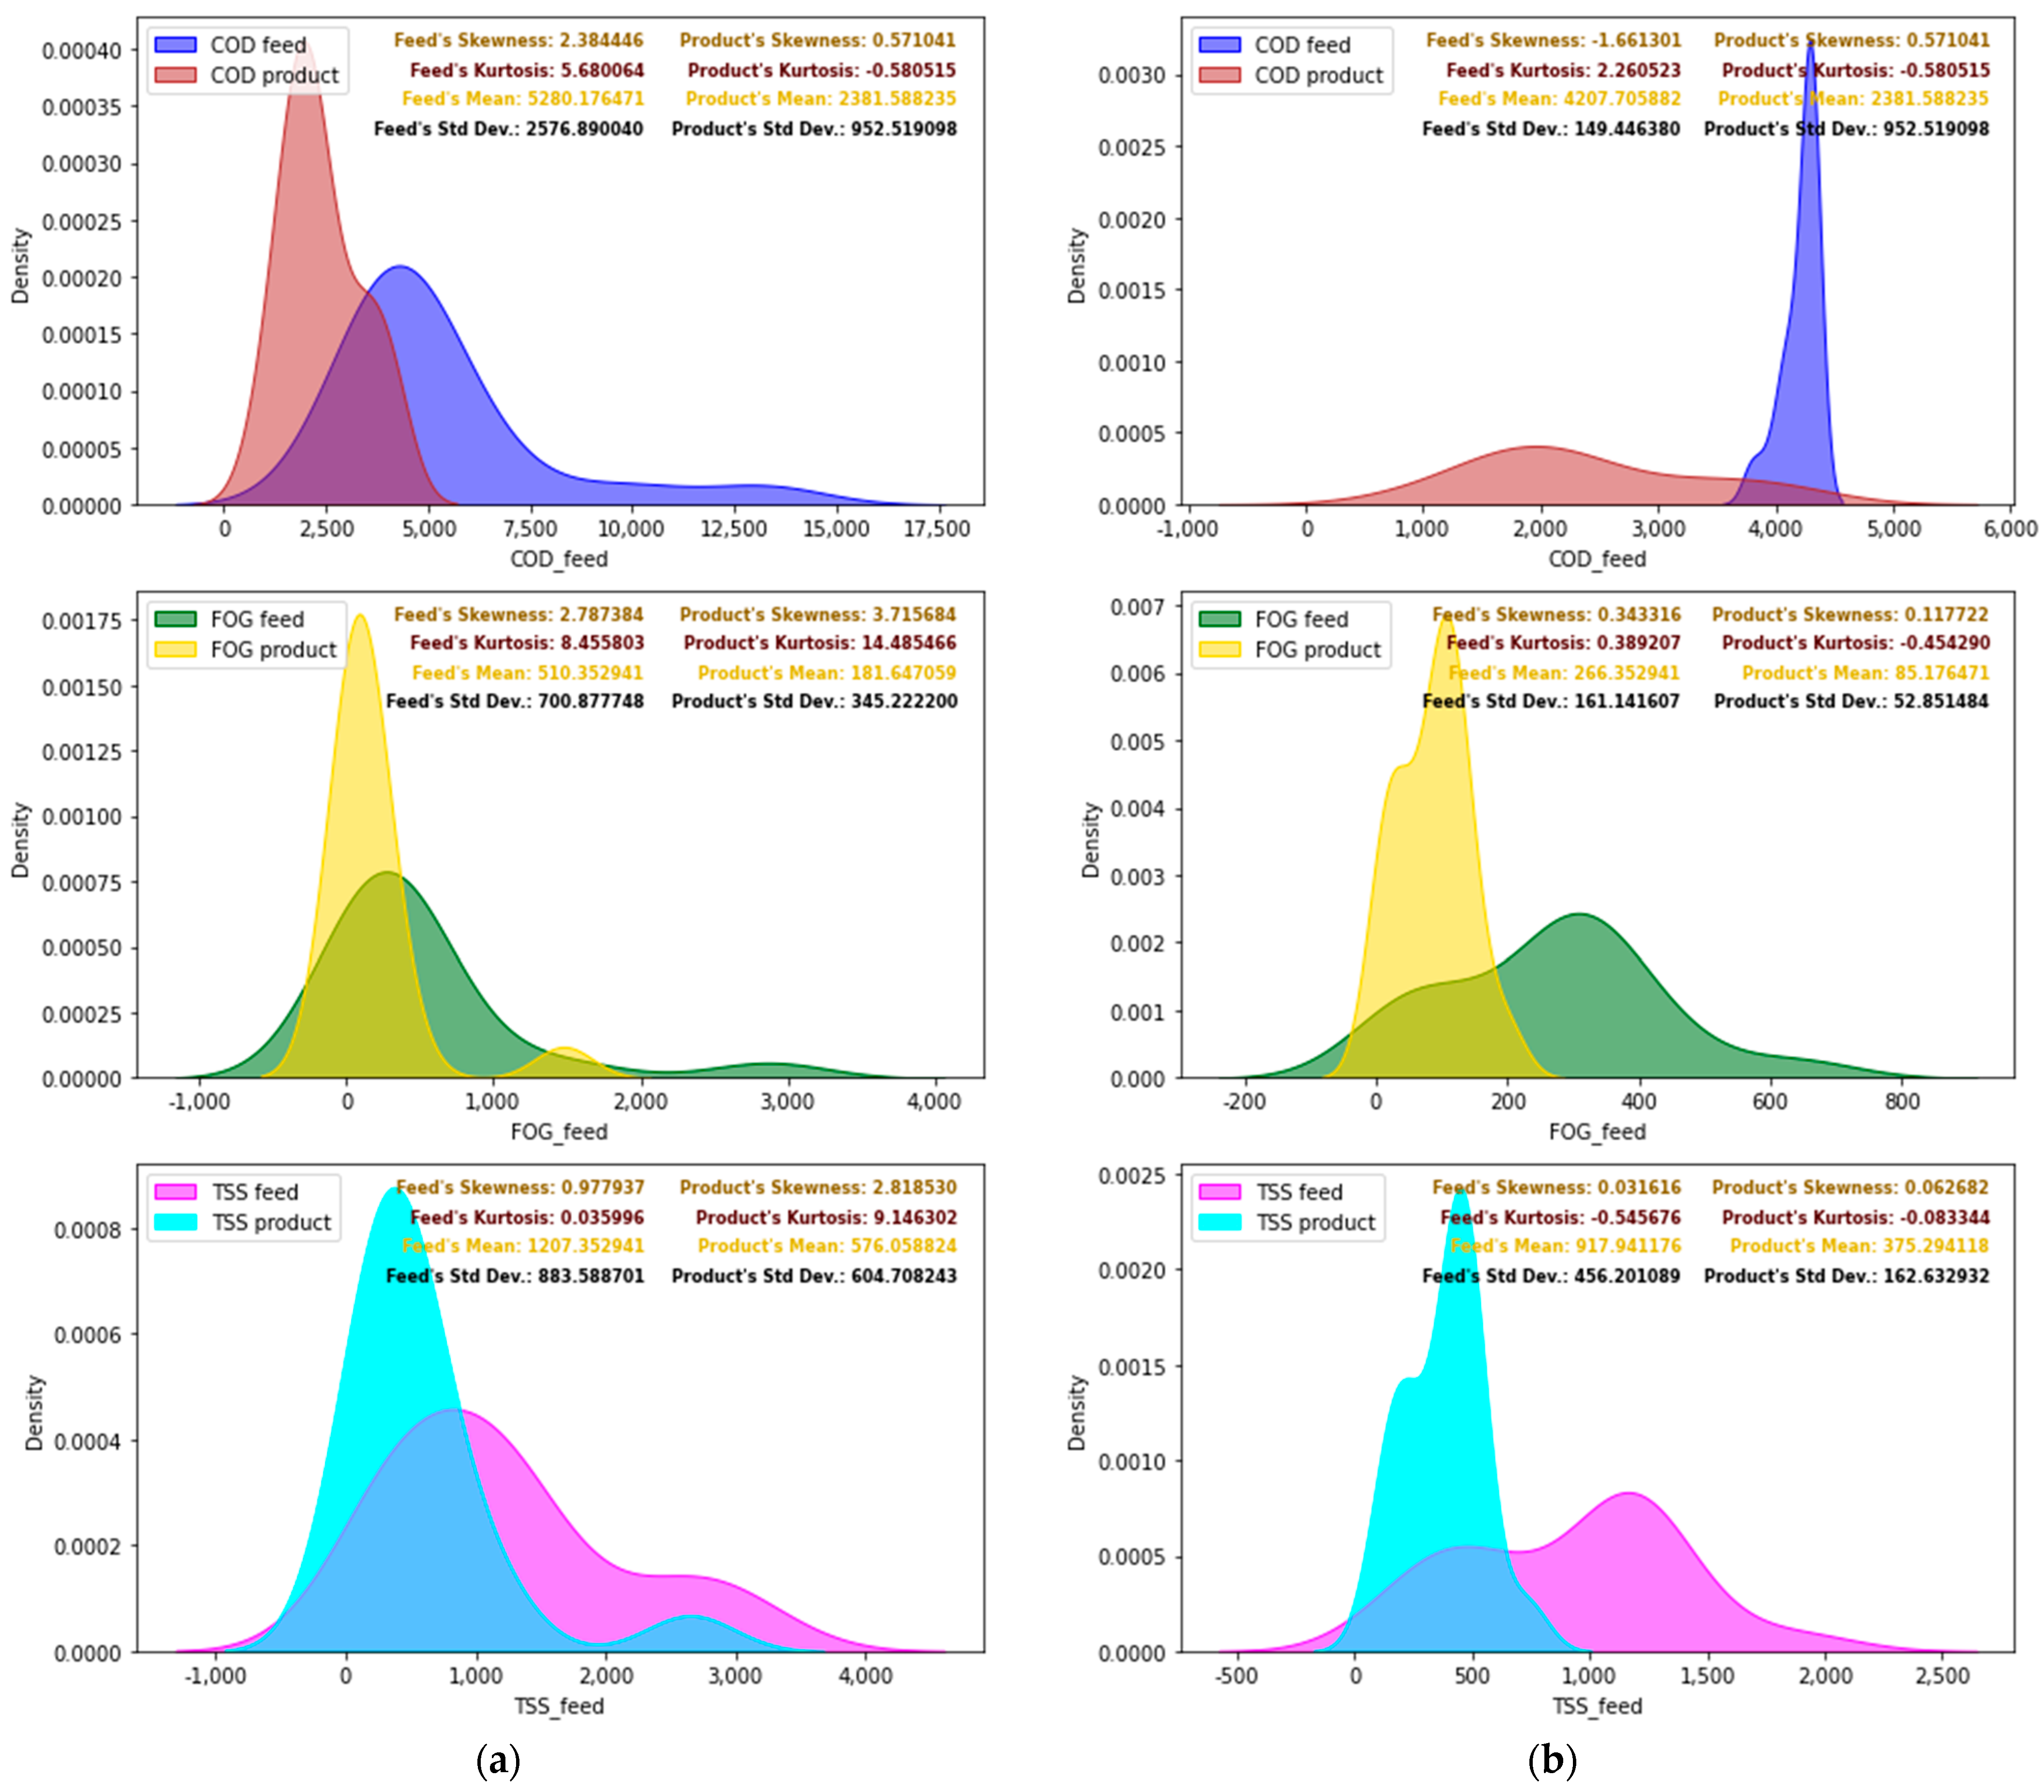
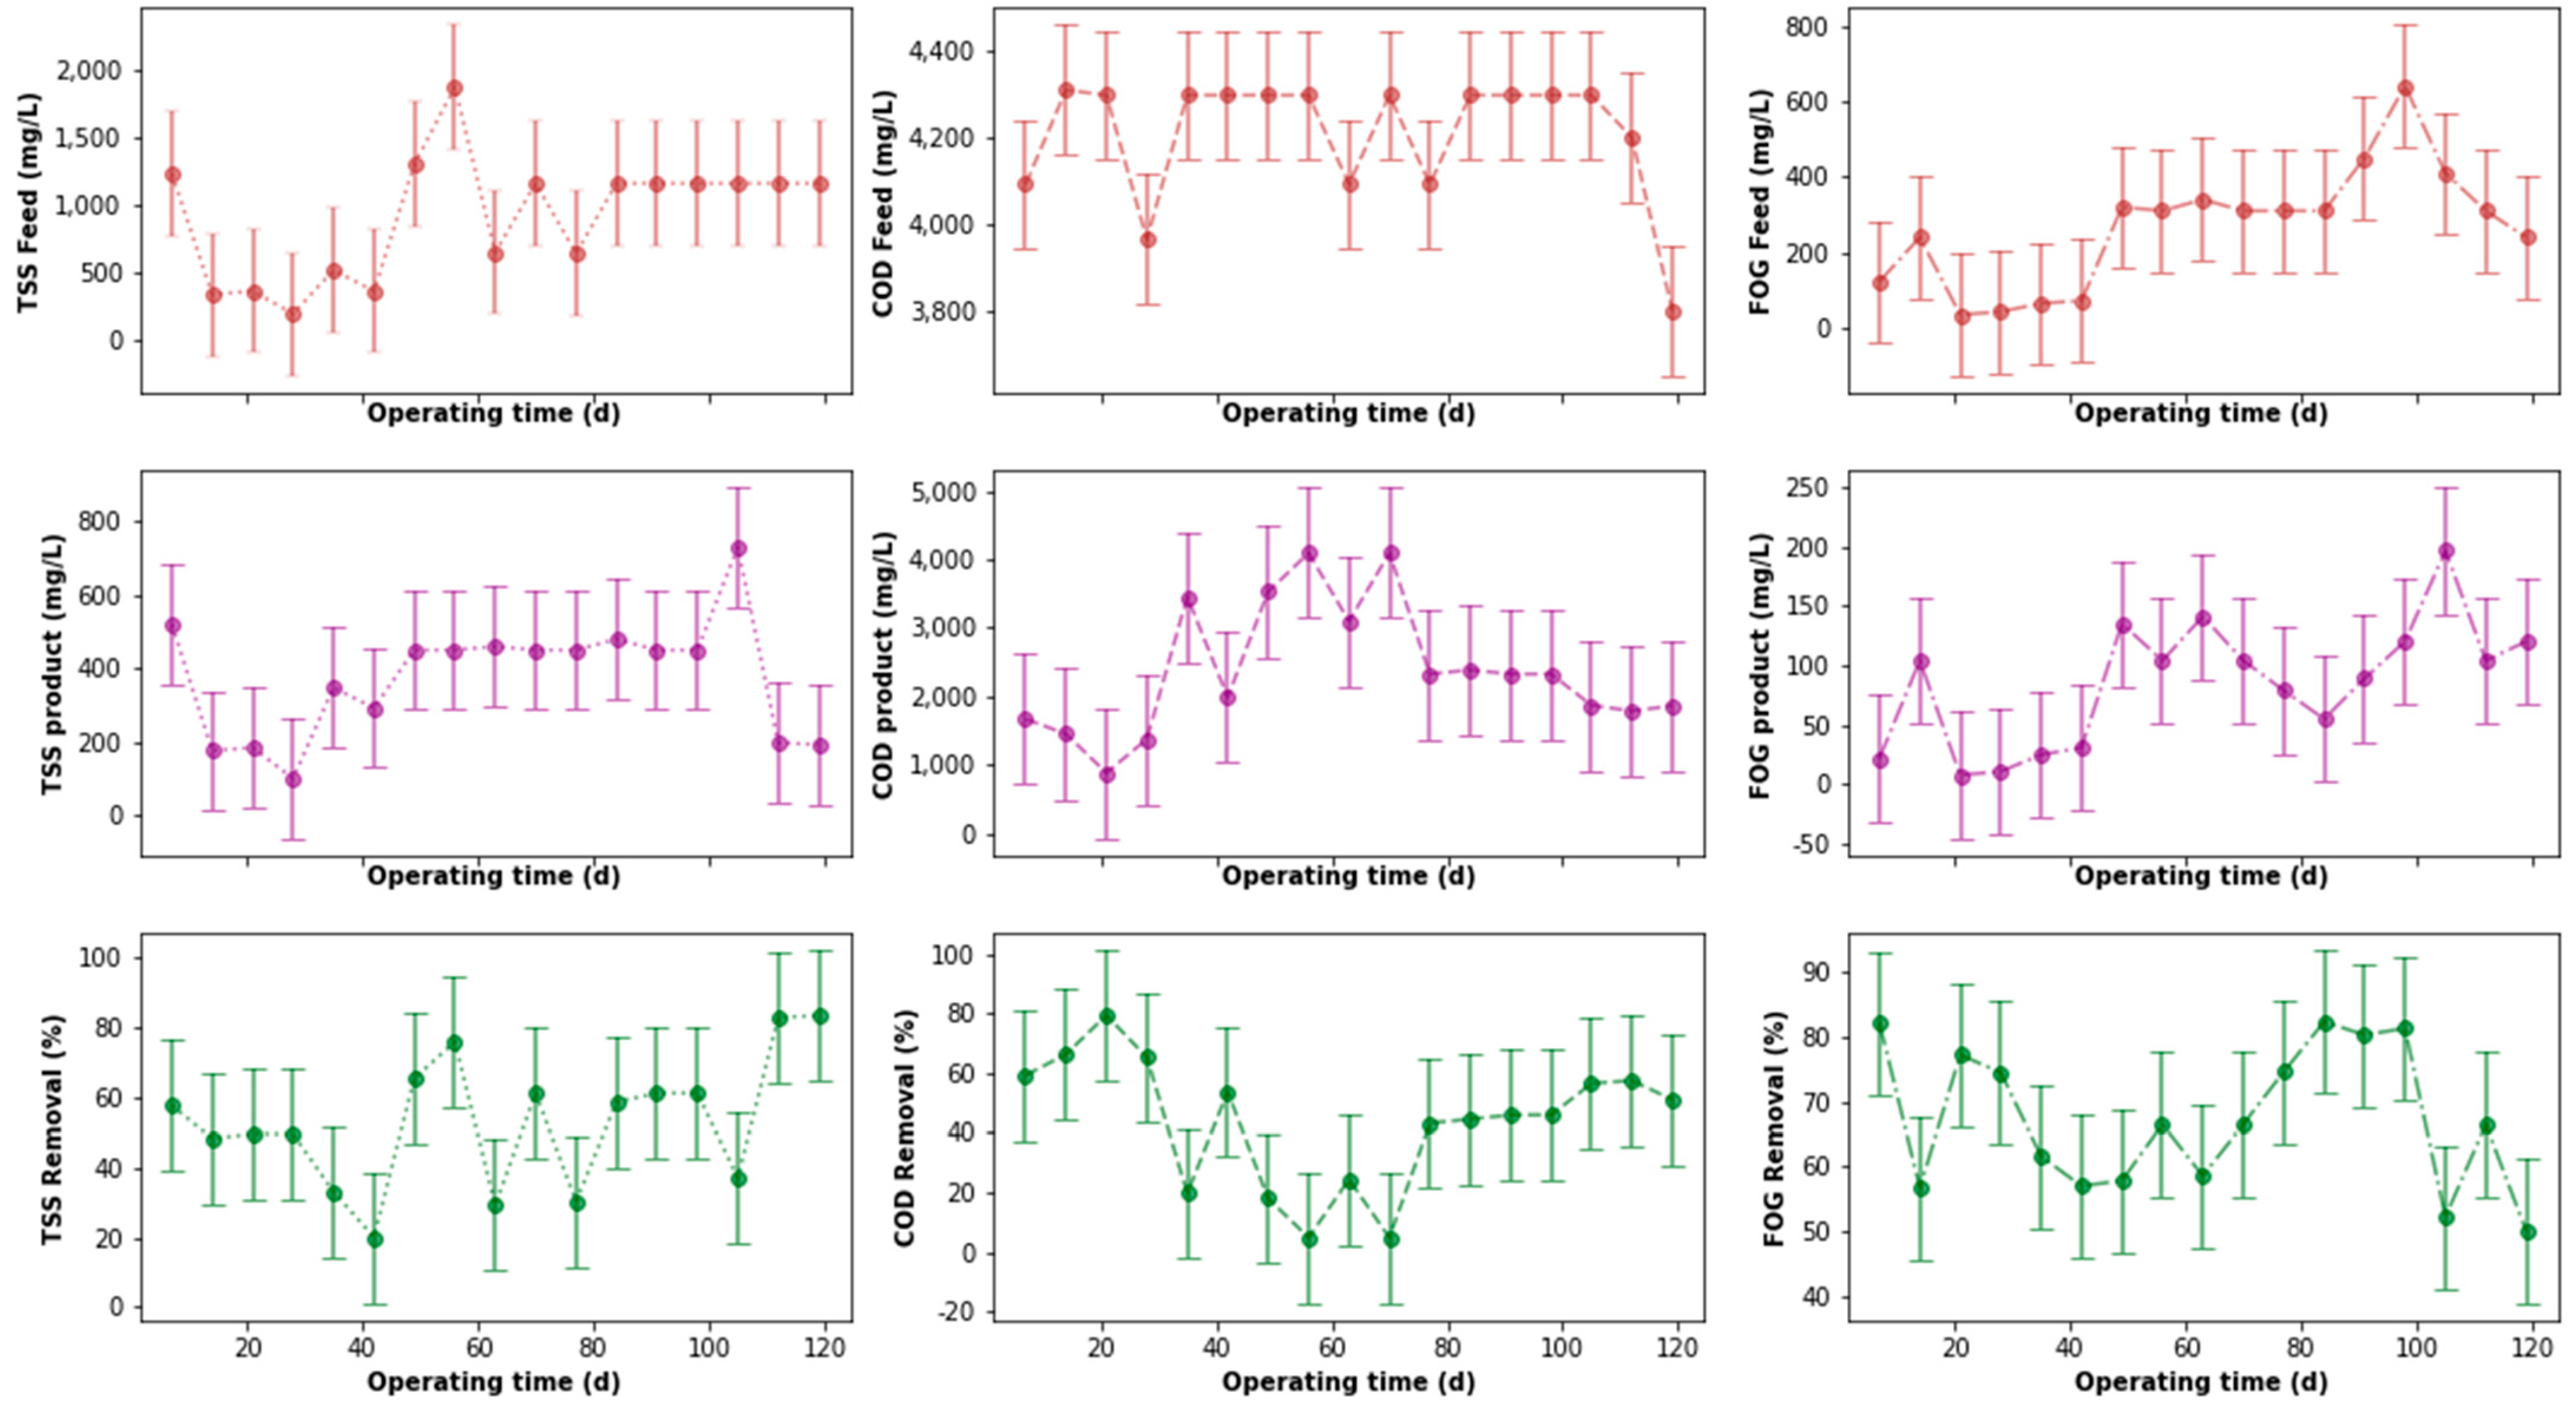
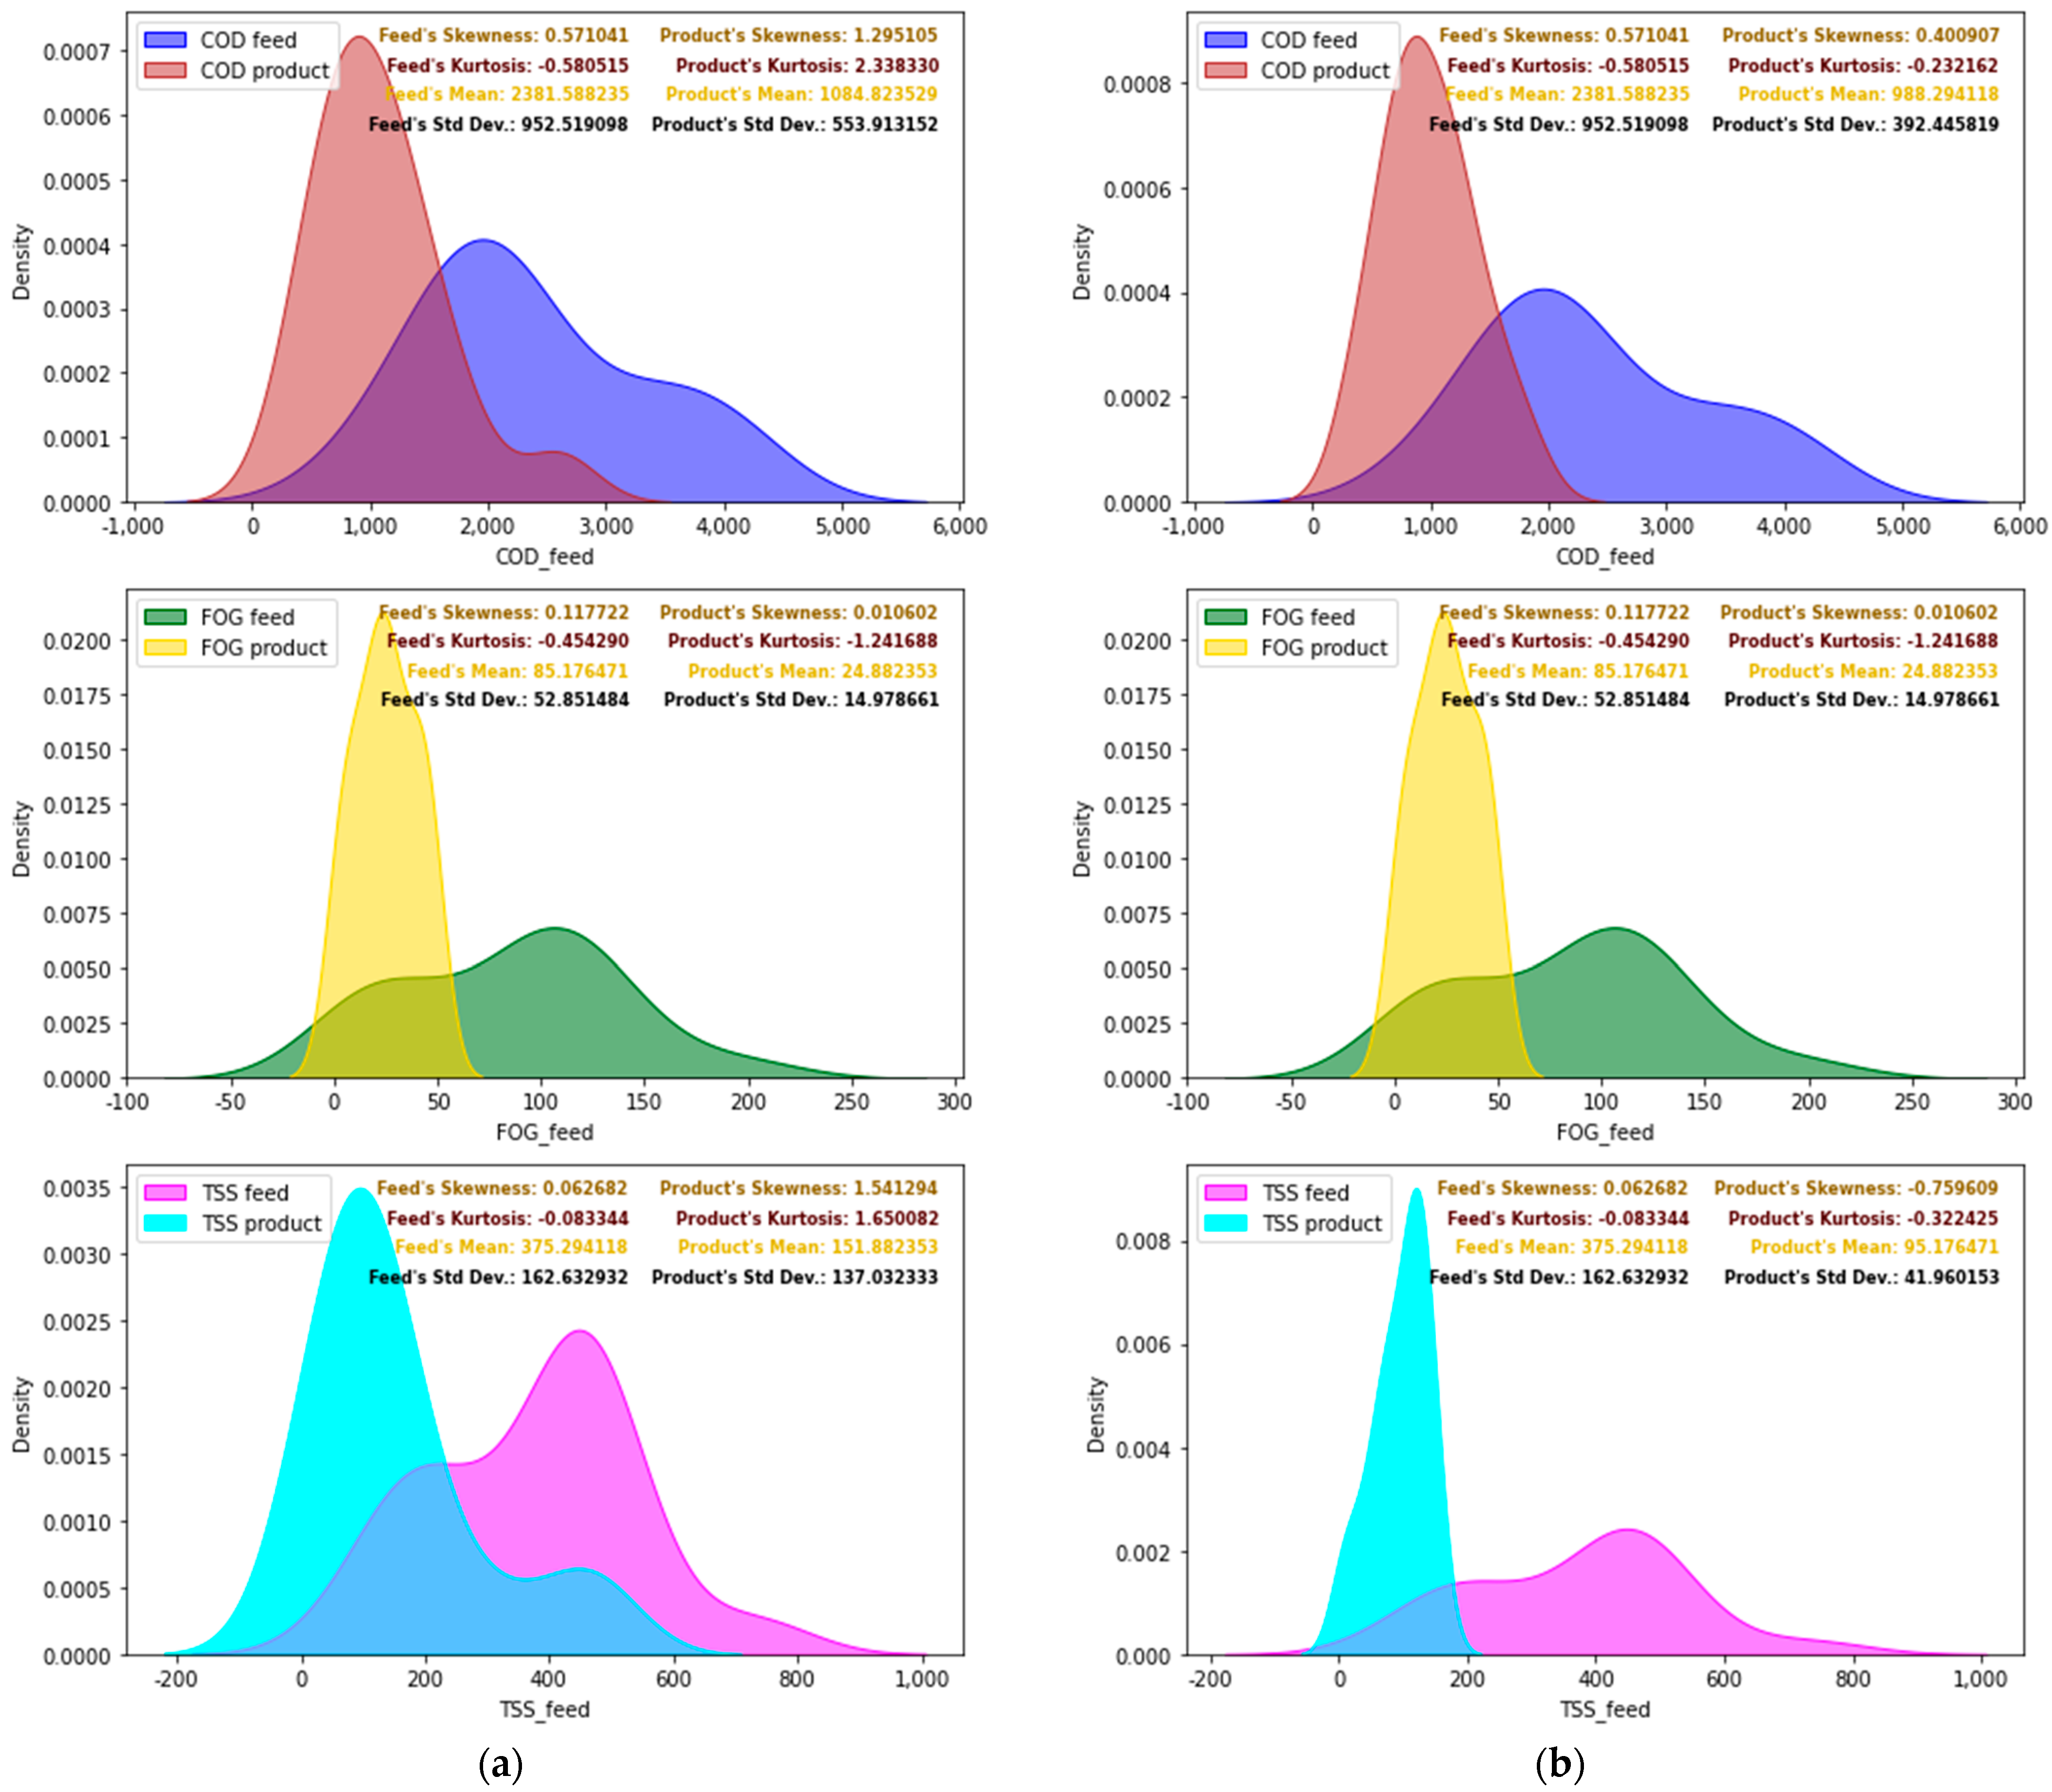
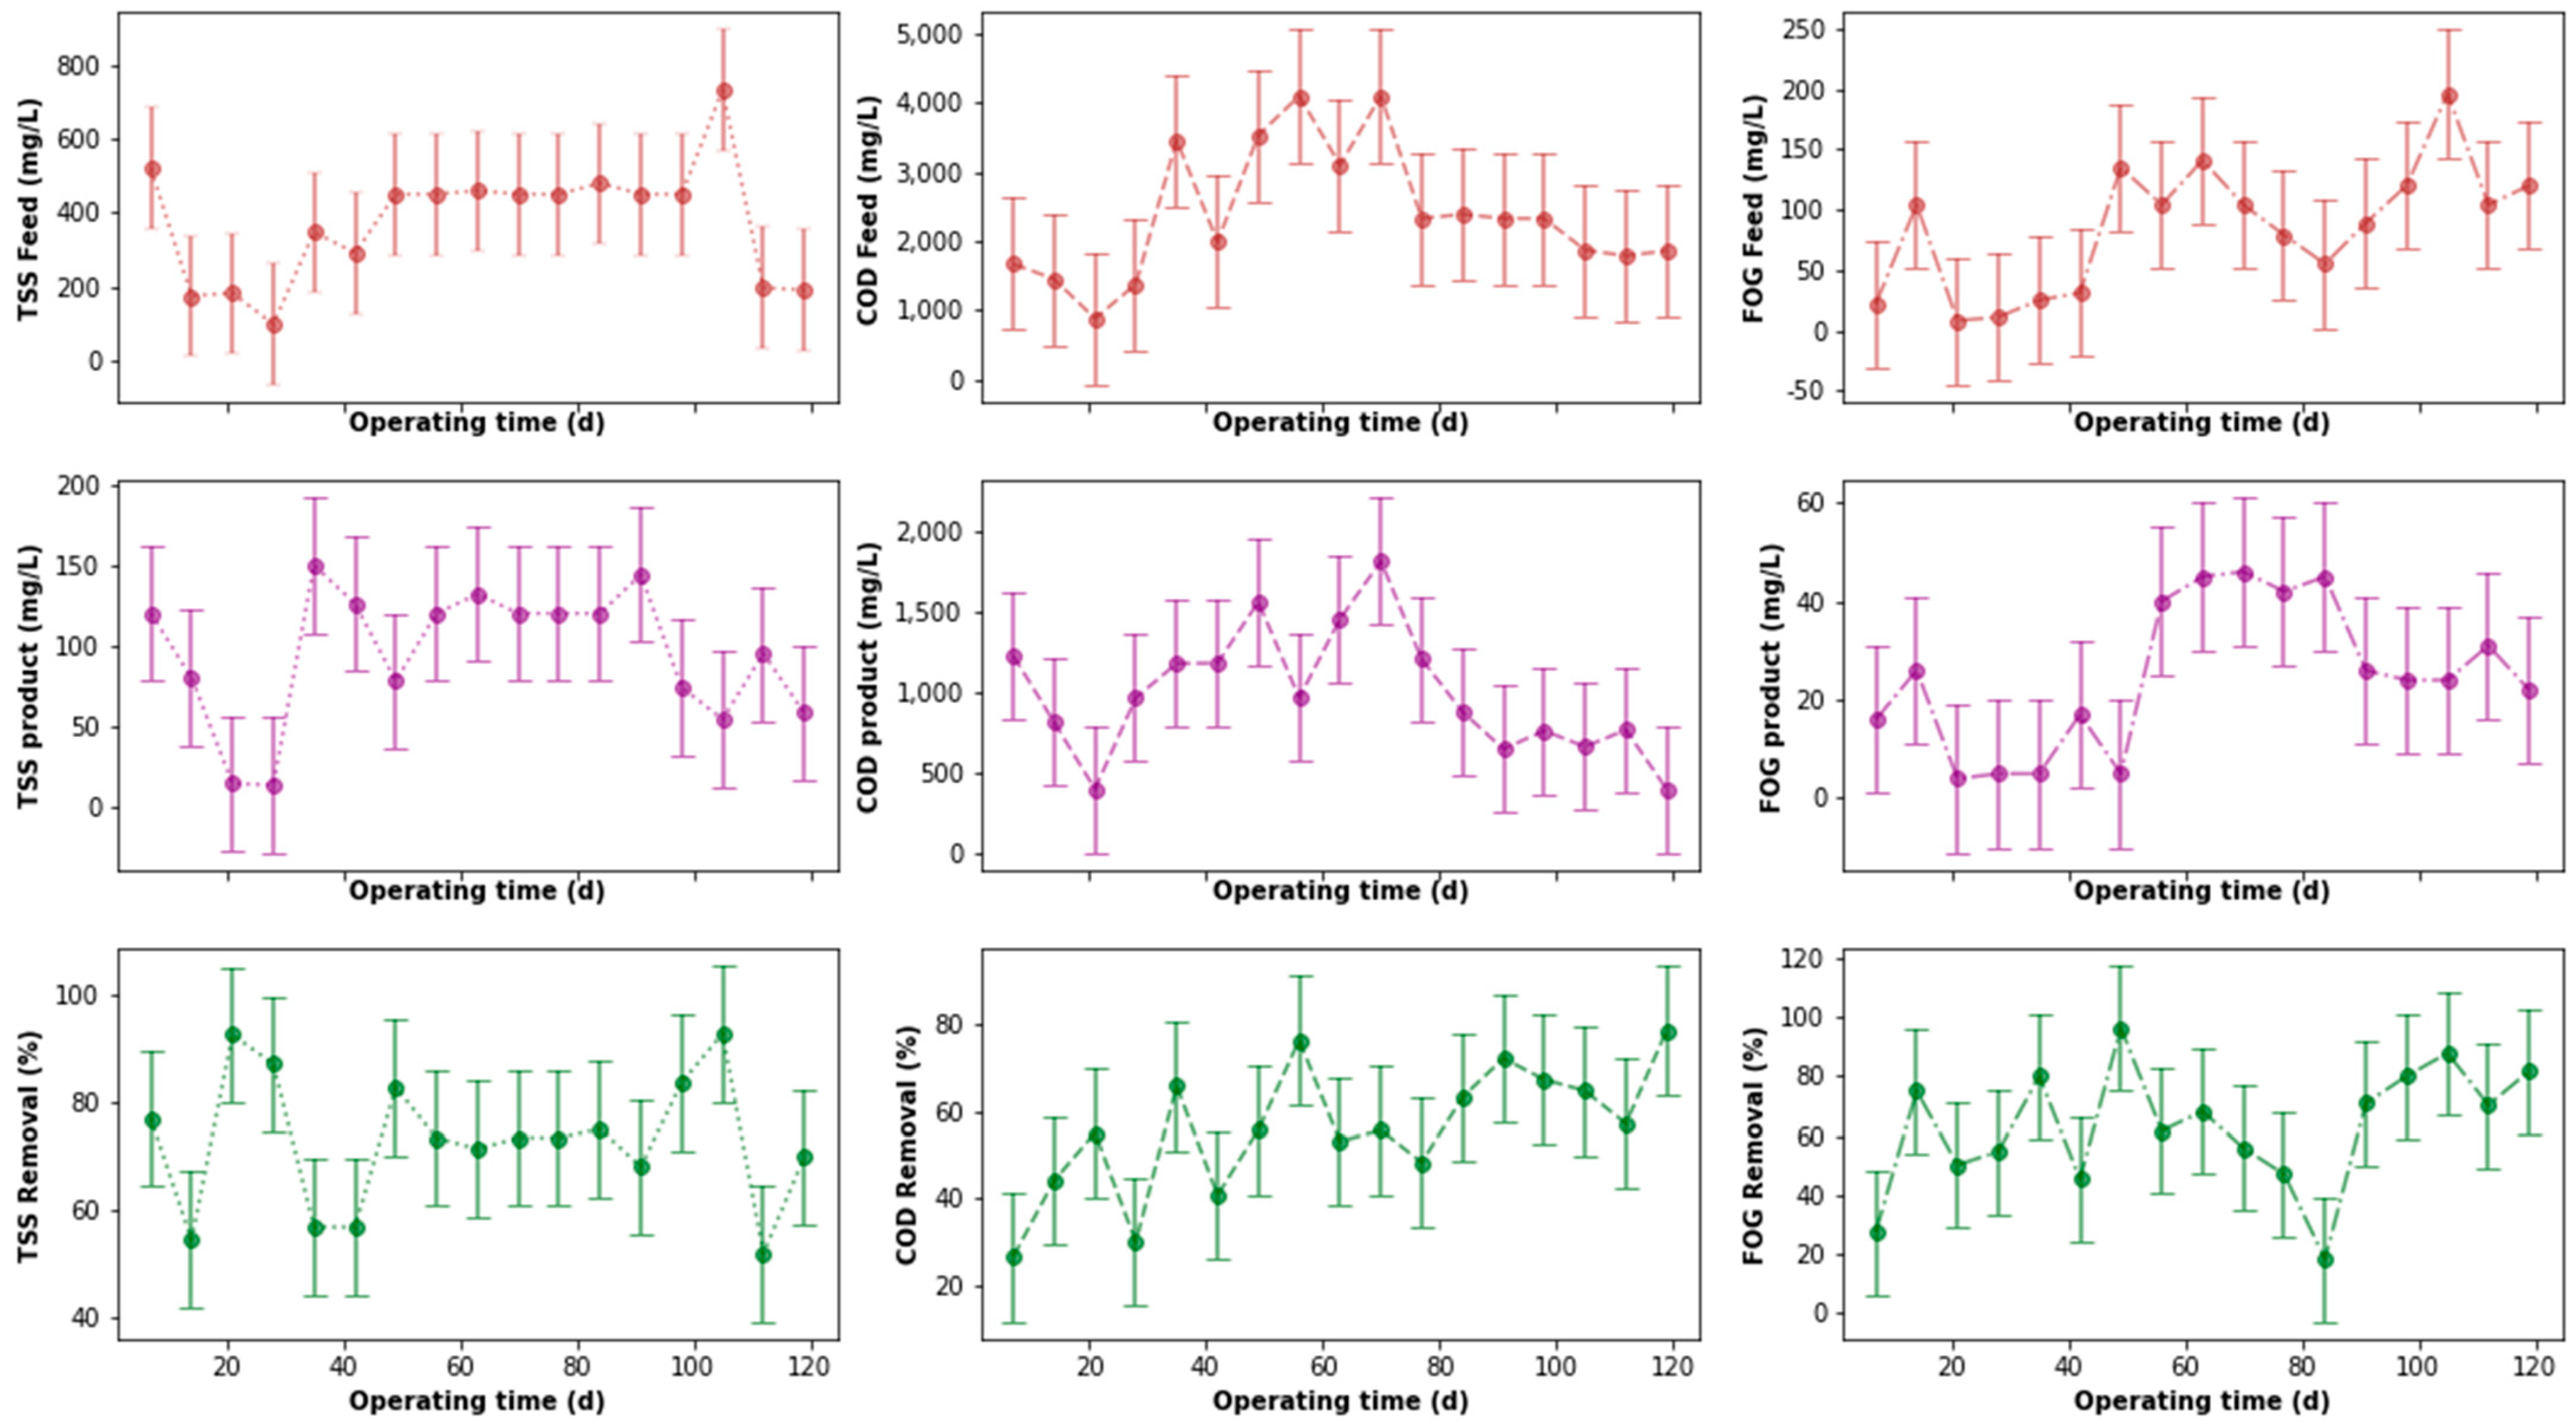
3.1. Pre-Treatment Tank

Figure 3 provides the variation of the concentrations of the tCOD, FOG, and TSS at the inlet and outlet of the pre-treatment process prior to anomaly detection and correction. Each parameter of the relevant distribution was evaluated using the inter-quartile range technique, which detected values that were far from the distribution range. The anomaly detection process was used to identify the outliers from their relevant distribution and to replace them by the median value of the corresponding distribution.
The tCOD influent and effluent revealed similar trends with the product consisting of far less tCOD when compared to the feed. There were peaks noted between day 40 and 80 for the tCOD product which could be attributed to higher tCOD content in the feed stream. This was further noted in the percentage removal of tCOD within that period, where the tCOD removal percentage was below 30%. The percentage tCOD removal peaked at 76% with an average of 43% in the pre-treatment tank. Research by Kundu et al. [25] observed that a higher percentage removal was achieved by increasing the aeration time, resulting in 77.7% COD removal. Similarly, TSS and FOG removal trends were observed, peaking after 40 days with the most successful removal being noted between day 80 and 100. The percentage of FOG removal was consistently above 50%, reaching a peak of 96% with a maintained average removal of 66%. These results are in line with the manufacturer’s observations that Eco-flush™ has an active affinity for FOG and tCOD removal [21]. On the other hand, de Nardi et al. [14] noted a 91.1% peak removal of FOG in the dissolved air floatation (DAF) system; therefore, by comparison, the biological pre-treatment tank dosed with Eco-FlushTM proved more effective than the DAF system.
The TSS fluctuated significantly at the beginning of the pre-treatment, resulting in its low removal (15%). However, the removal percentage increased towards the latter stages of the system operation. This may be due to more stabilized feed concentrations which resulted in a TSS removal of 59%. The studies by Dlangamandla et al. [26] on a bioflocculant-supported dissolved air floatation (Bio-DAF) system also achieved a low TSS removal of 56.5% in the initial stages of PSW treatment. However, the percentage removal improved to 91% once the Bio-DAF reached a steady state of operation. From this comparison, it can therefore be noted that pre-treating PSW with Eco-Flush™ is essential for the remediation of PSW. The treatment conditions do, however, need to be optimized to improve the efficacy of the Eco-Flush™ supplemented pre-treatment tank with regard to tCOD and TSS removal; although, its initial design intention was for FOG hydrolysis.
As the boxplots enable the visual detection of the outliers, as depicted in Figure 4a, the elimination of such outliers and their replacement with the median values for each distribution, can better describe the performance of the pre-treatment tank. After the replacement of these outliers by the median value of each distribution, the new distribution appears to better describe the performance of the pre-treatment tank, as depicted in Figure 4b. The error bars represent the standard deviation of the data distribution of the relevant parameters presented.
A further analysis of the effects of the outliers’ replacement is illustrated in Figure 5, from which a change in the value of the kurtosis, skewness, mean, and standard deviation of distribution, including one of several outliers, can be observed. One noticeable effect of the anomaly detection and correction is a distribution closer to normality with lower skewness and kurtosis values. Furthermore, this correction further dissociates the mode of each distribution.
Figure 6 depicts the variations in the concentrations of the tCOD, FOG, and TSS at the inlet and the outlet of the pre-treatment process, as well as the variation of the removal efficiencies of the listed water quality assessment parameters after each distribution anomaly detection and correction. Although, the replacement of outliers by the median value of respective distribution indicated a slight alteration of the performance of the pre-treatment stage. It was noticed that this processing stage yielded good results, particularly for the FOG removal.
Figure 7 provides the correlation matrix between the pre-treatment stage COD, FOG, and TSS removal efficiencies, where r is the Pearson correlation coefficient and p is the p-value to validate or reject a null-hypothesis. Typically, a p-value less than or equal to 0.05 shows that an observation is statistically significant. In this case, there was no significant correlation between the removal efficiencies for the parameters evaluated.

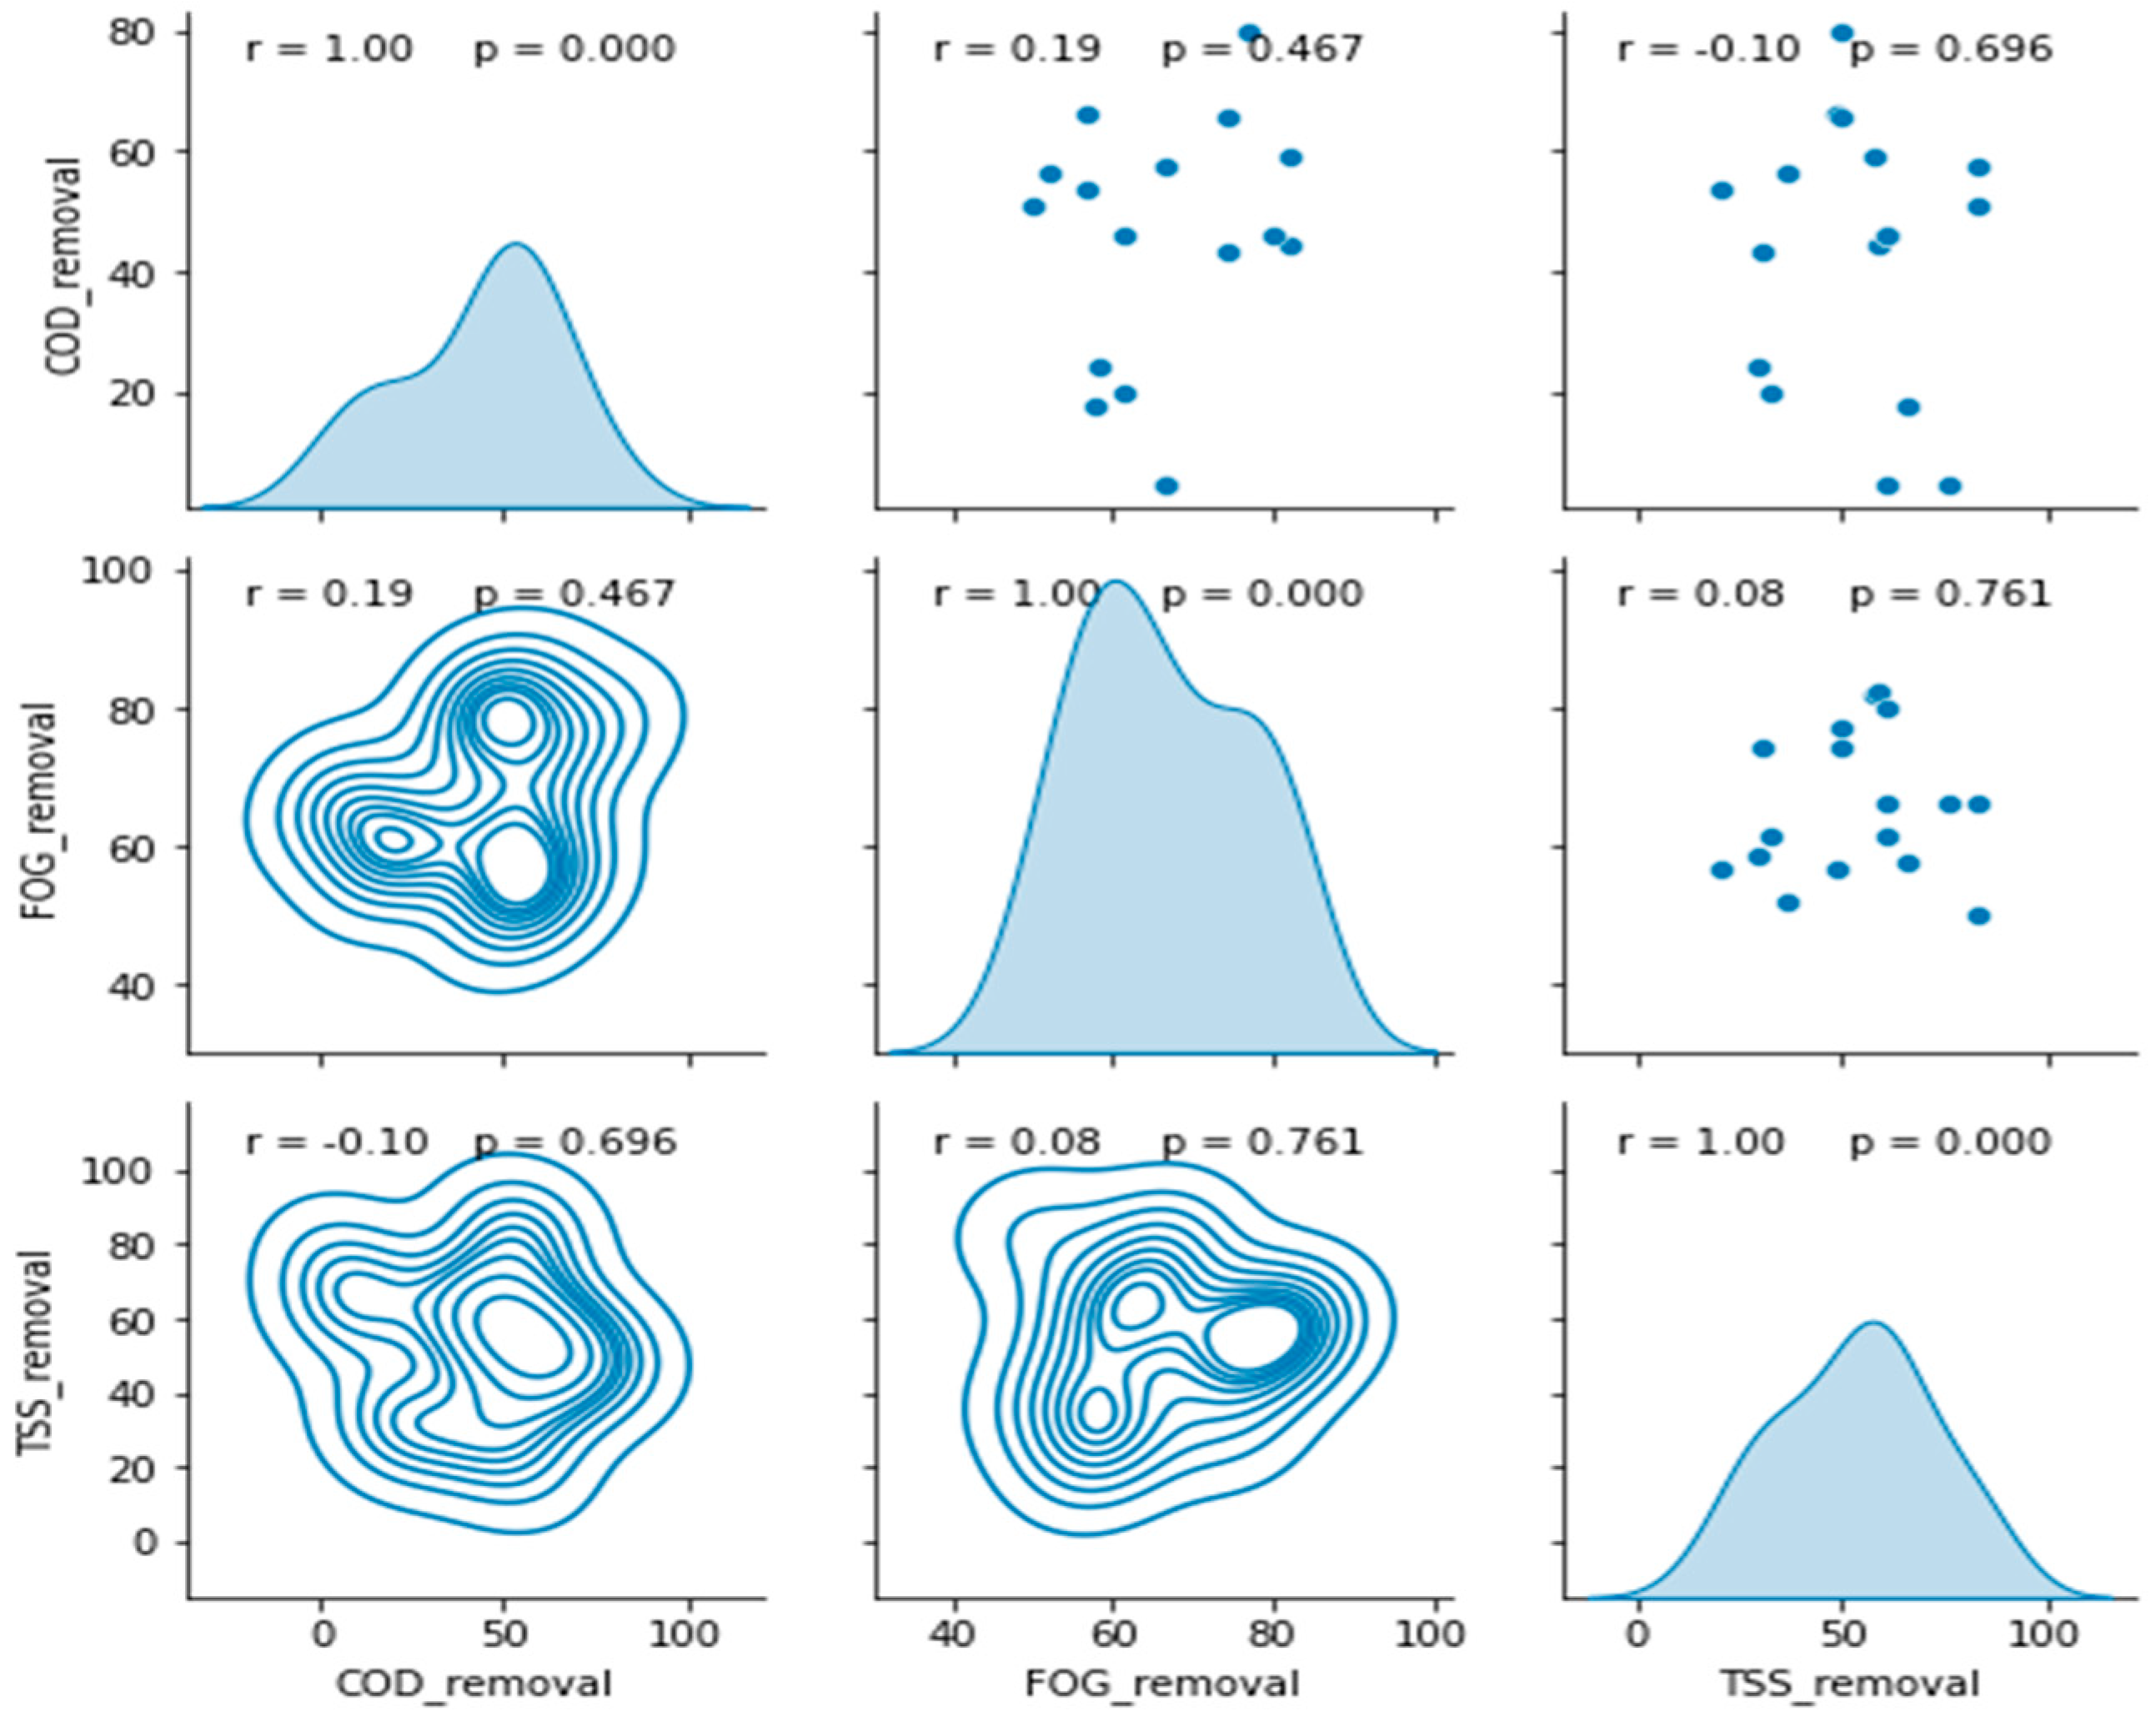
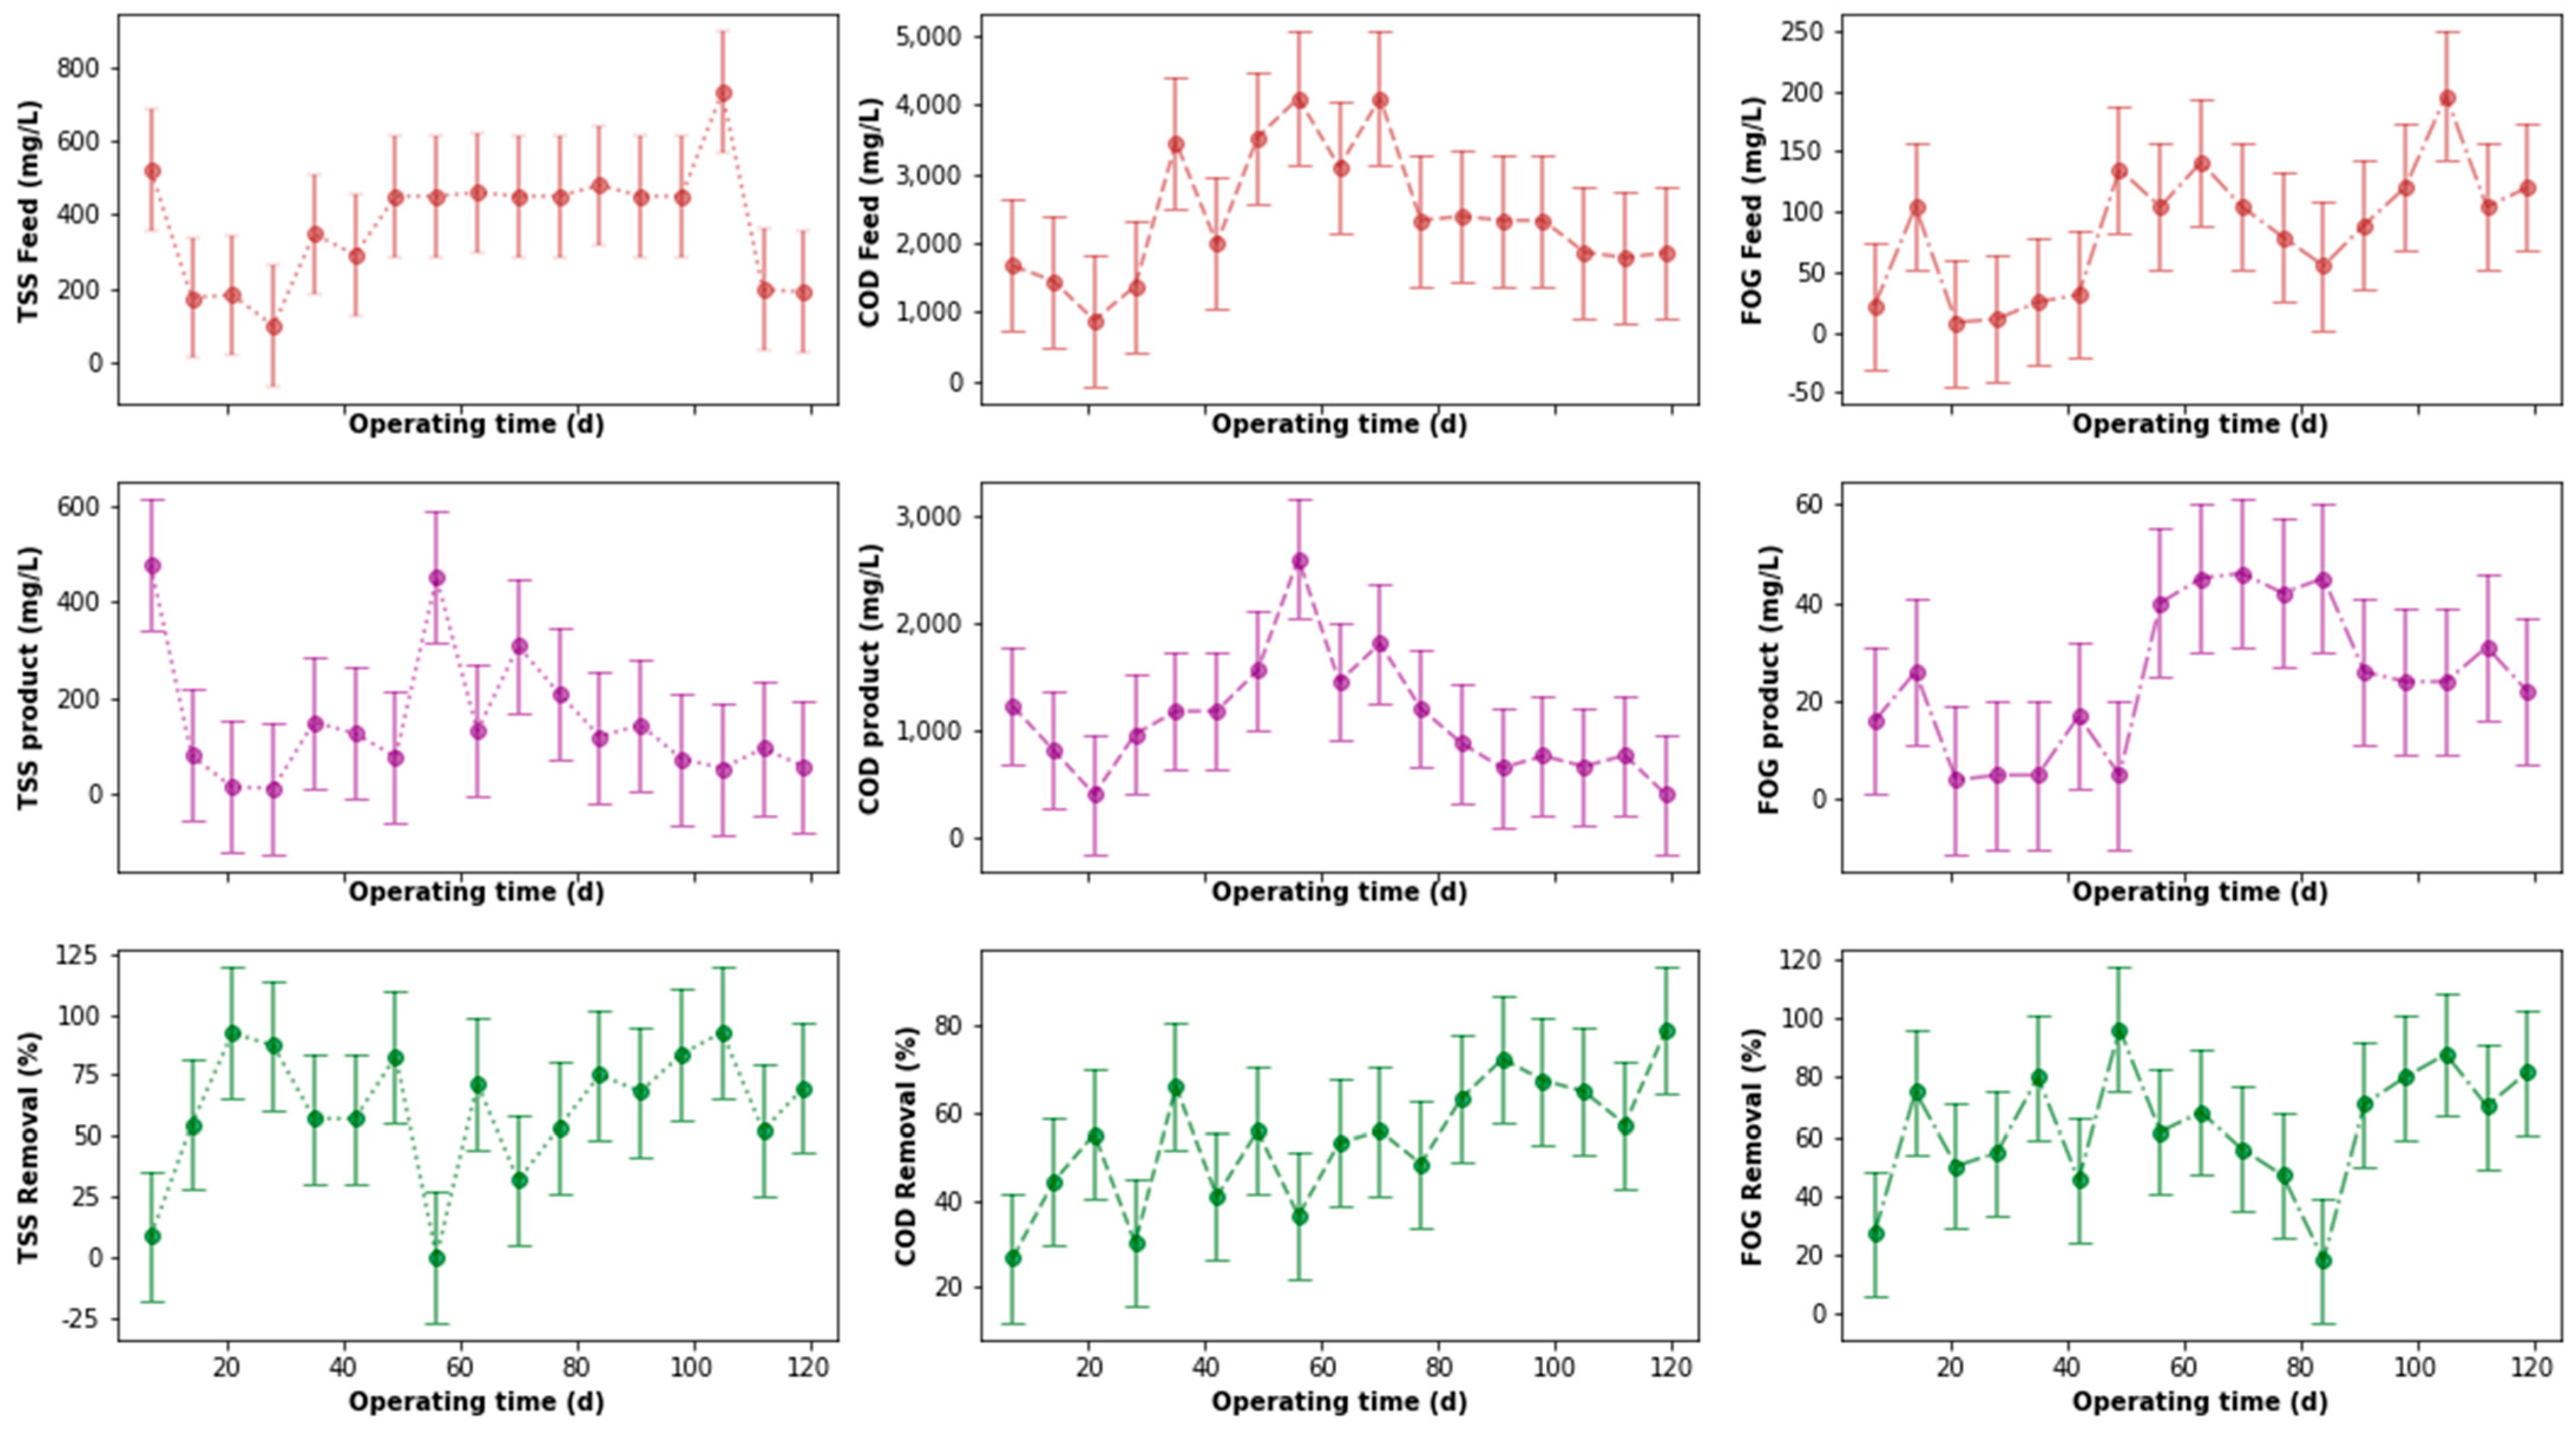
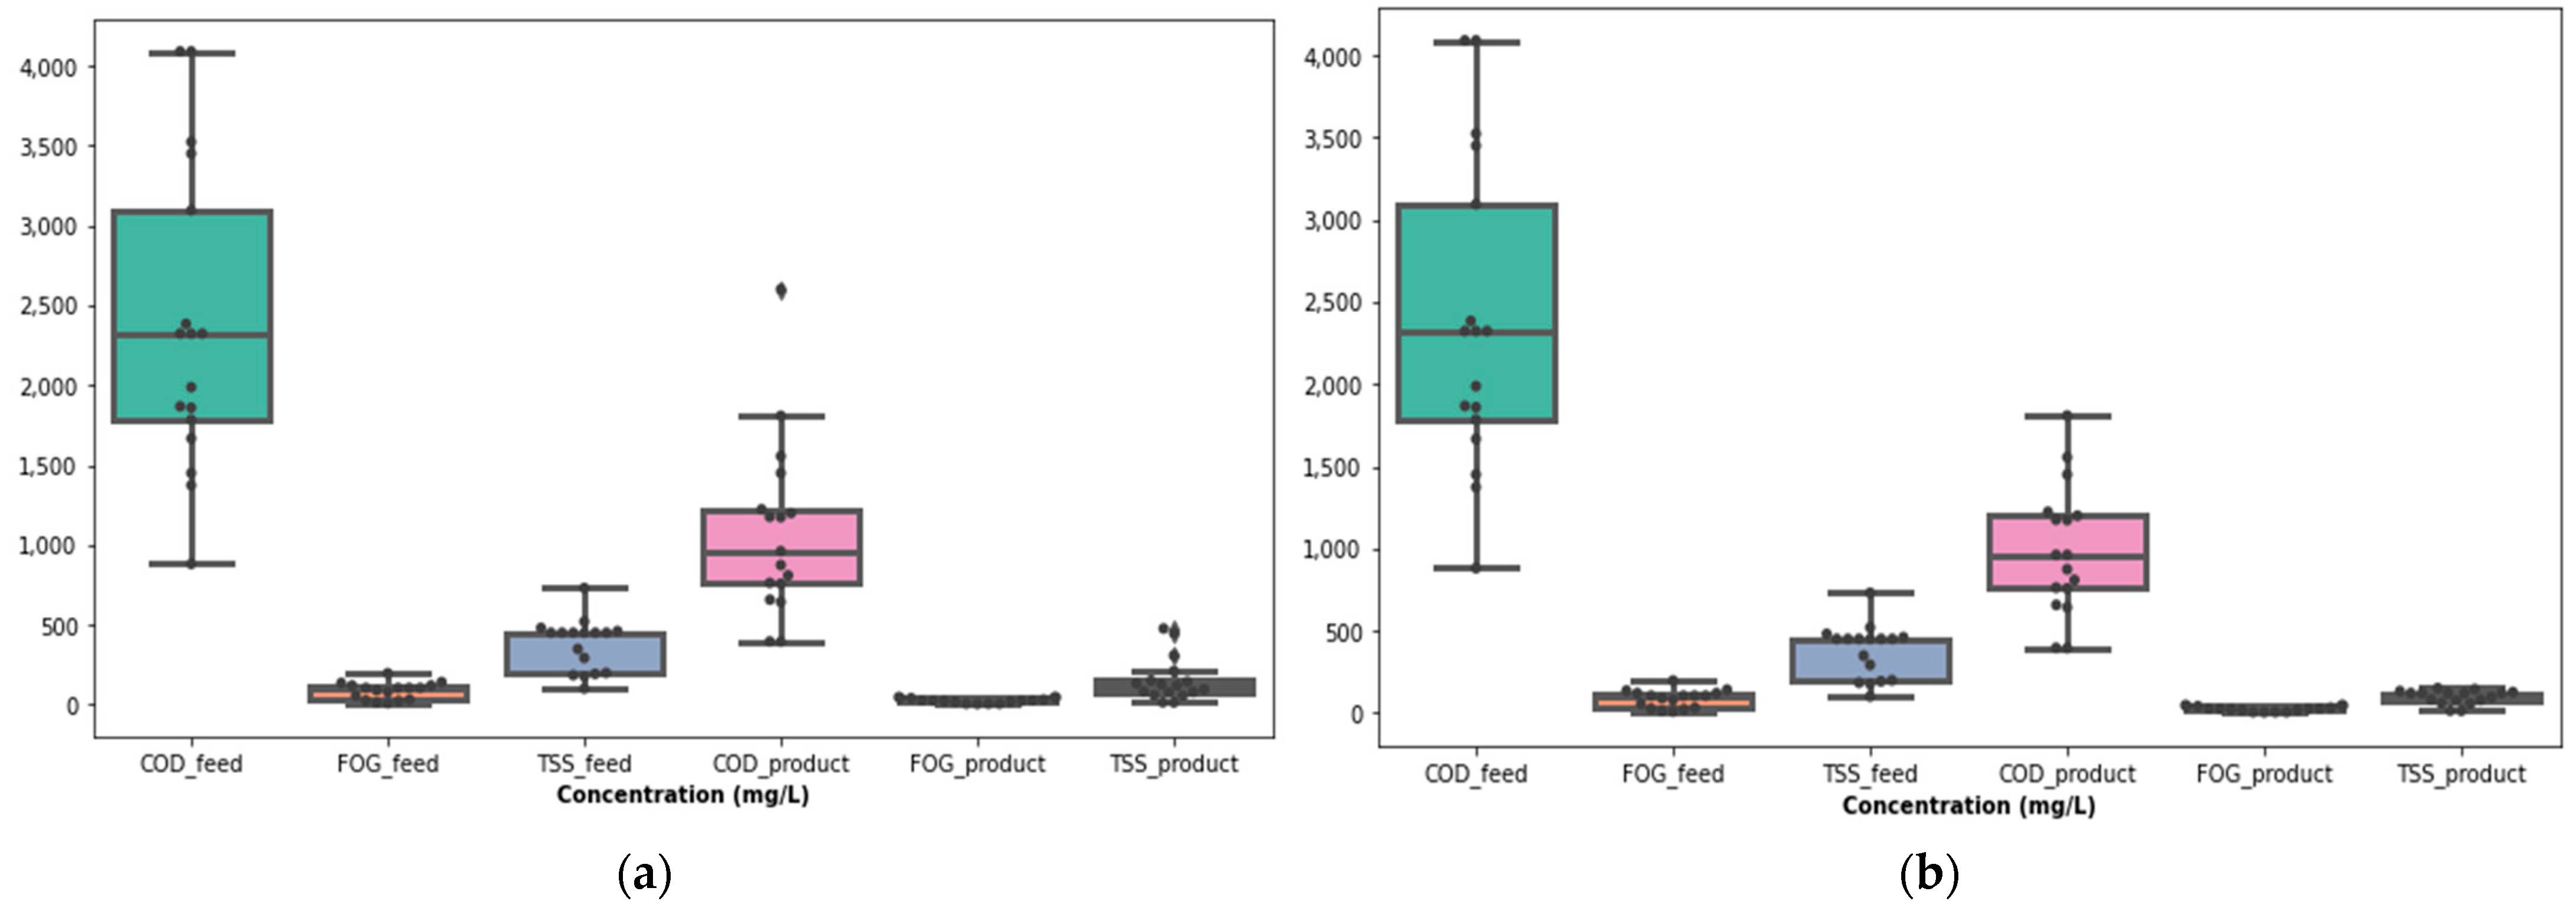
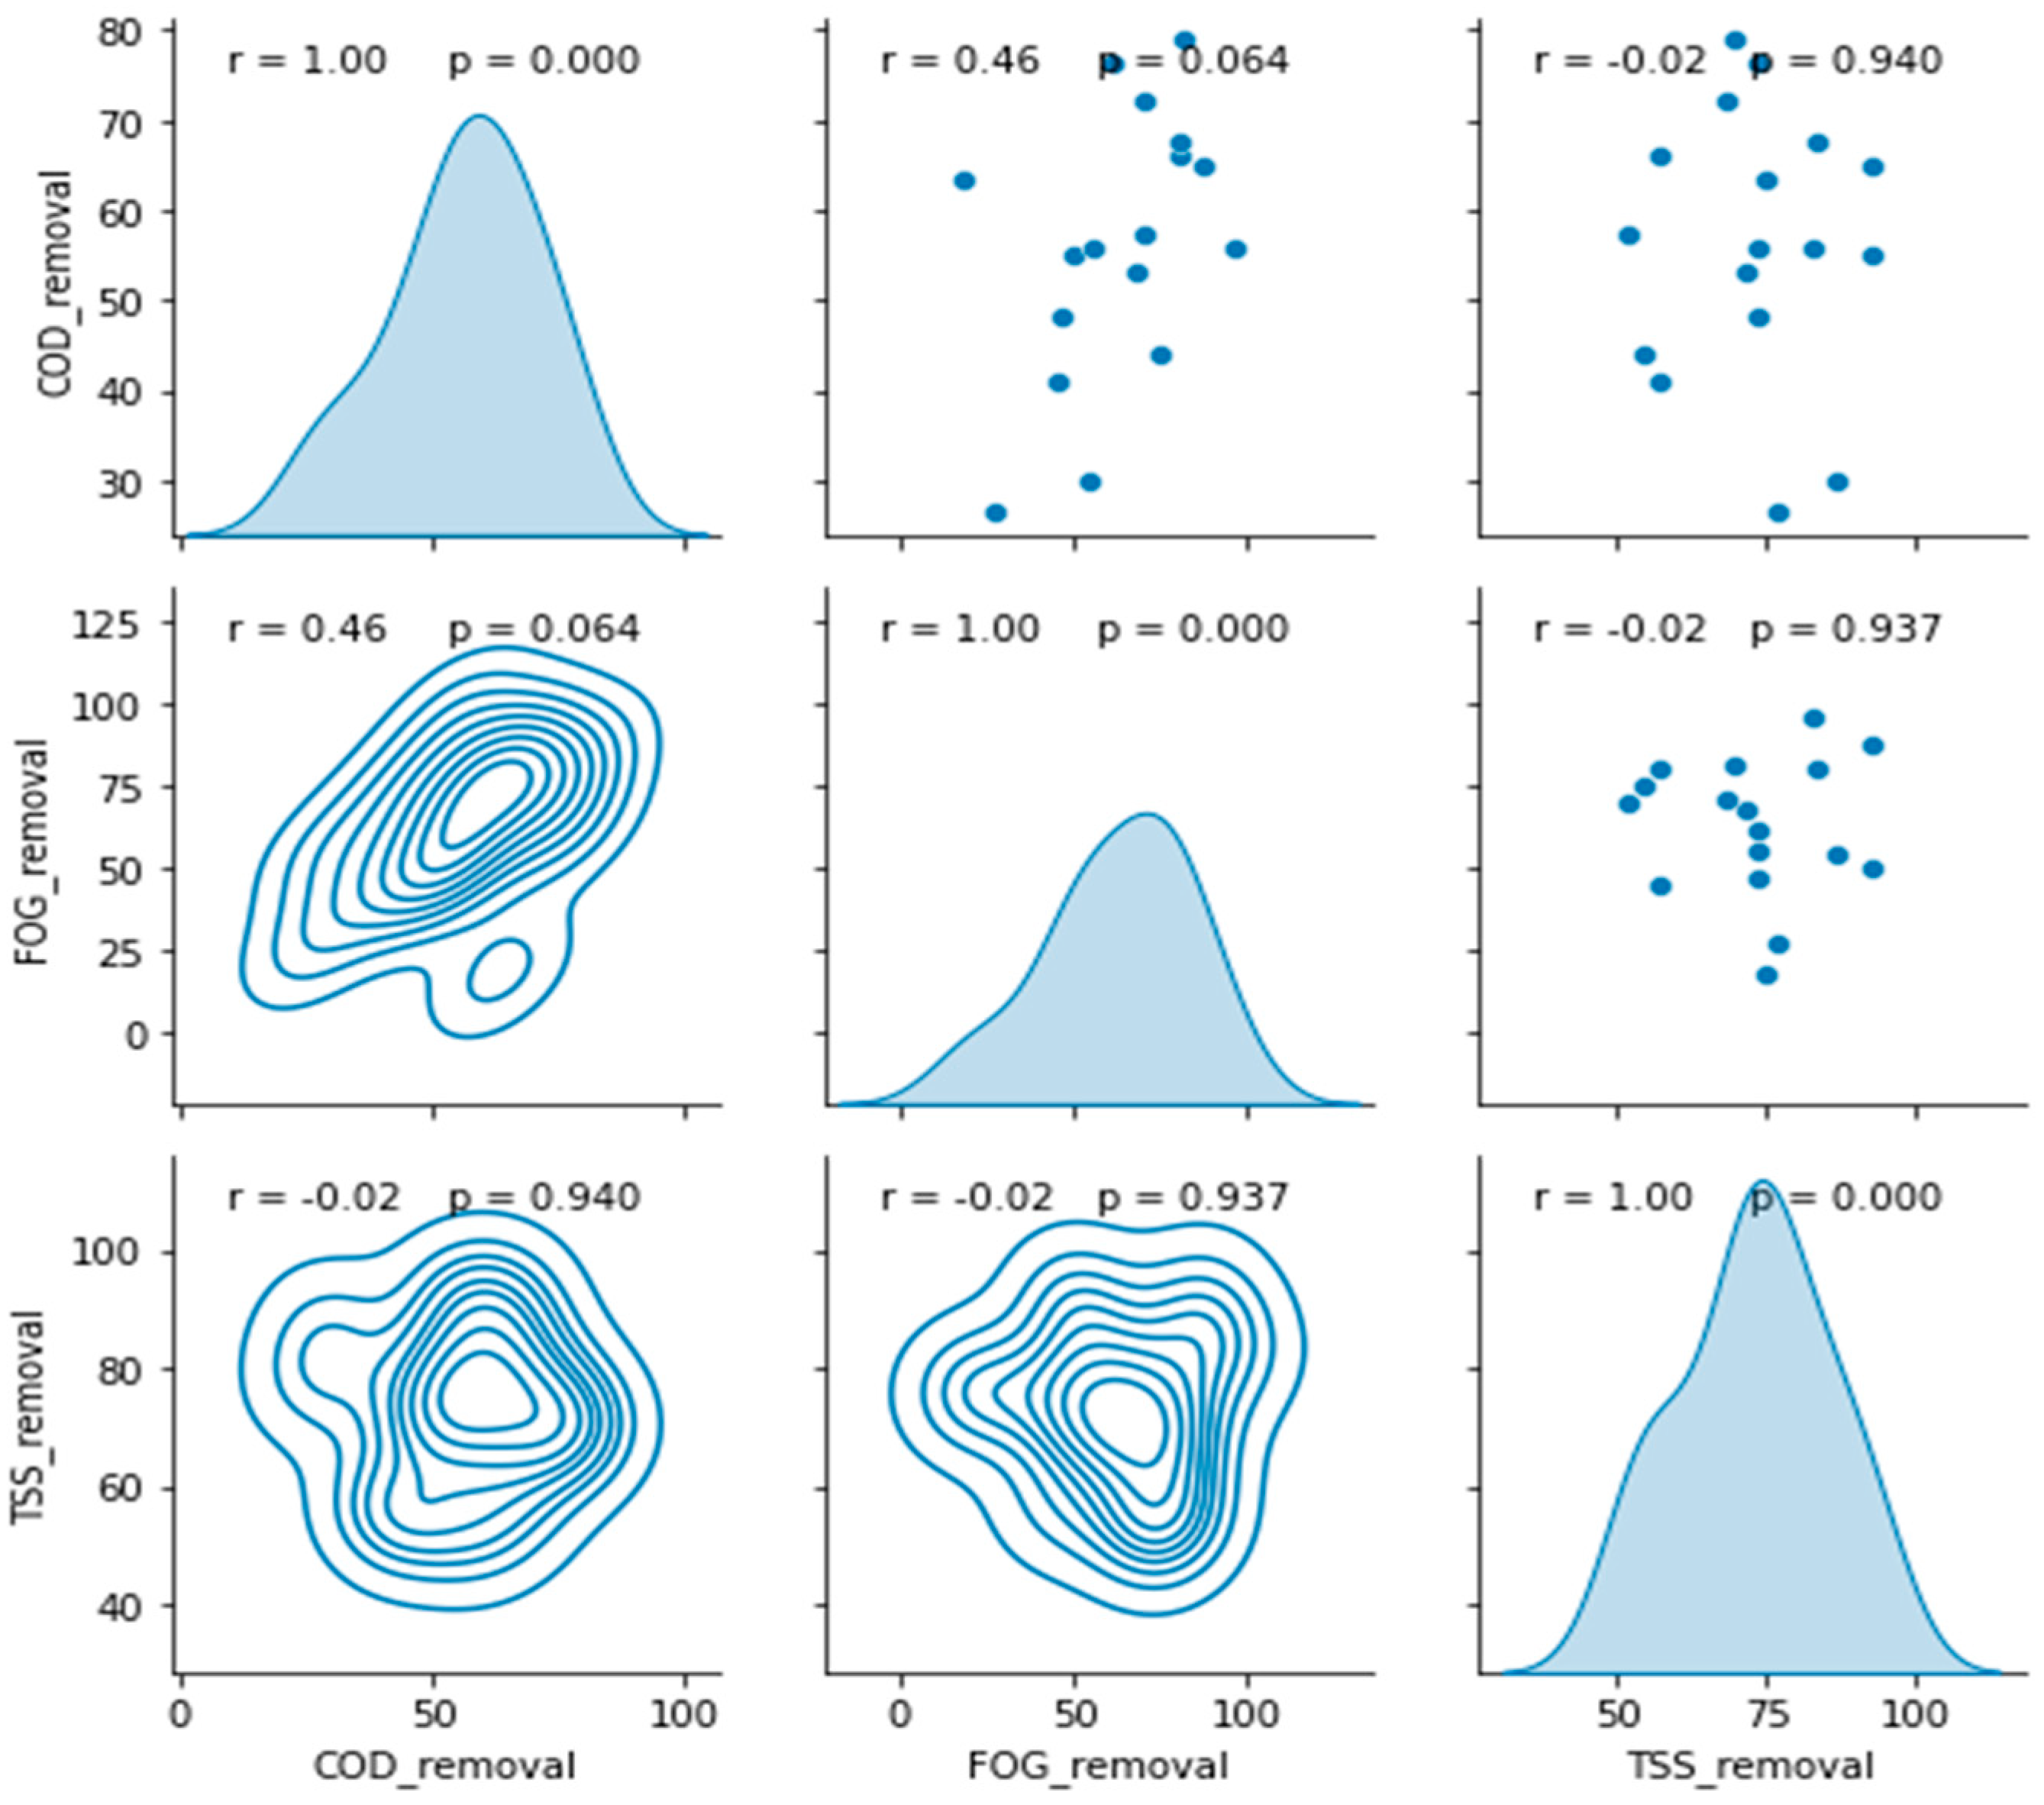
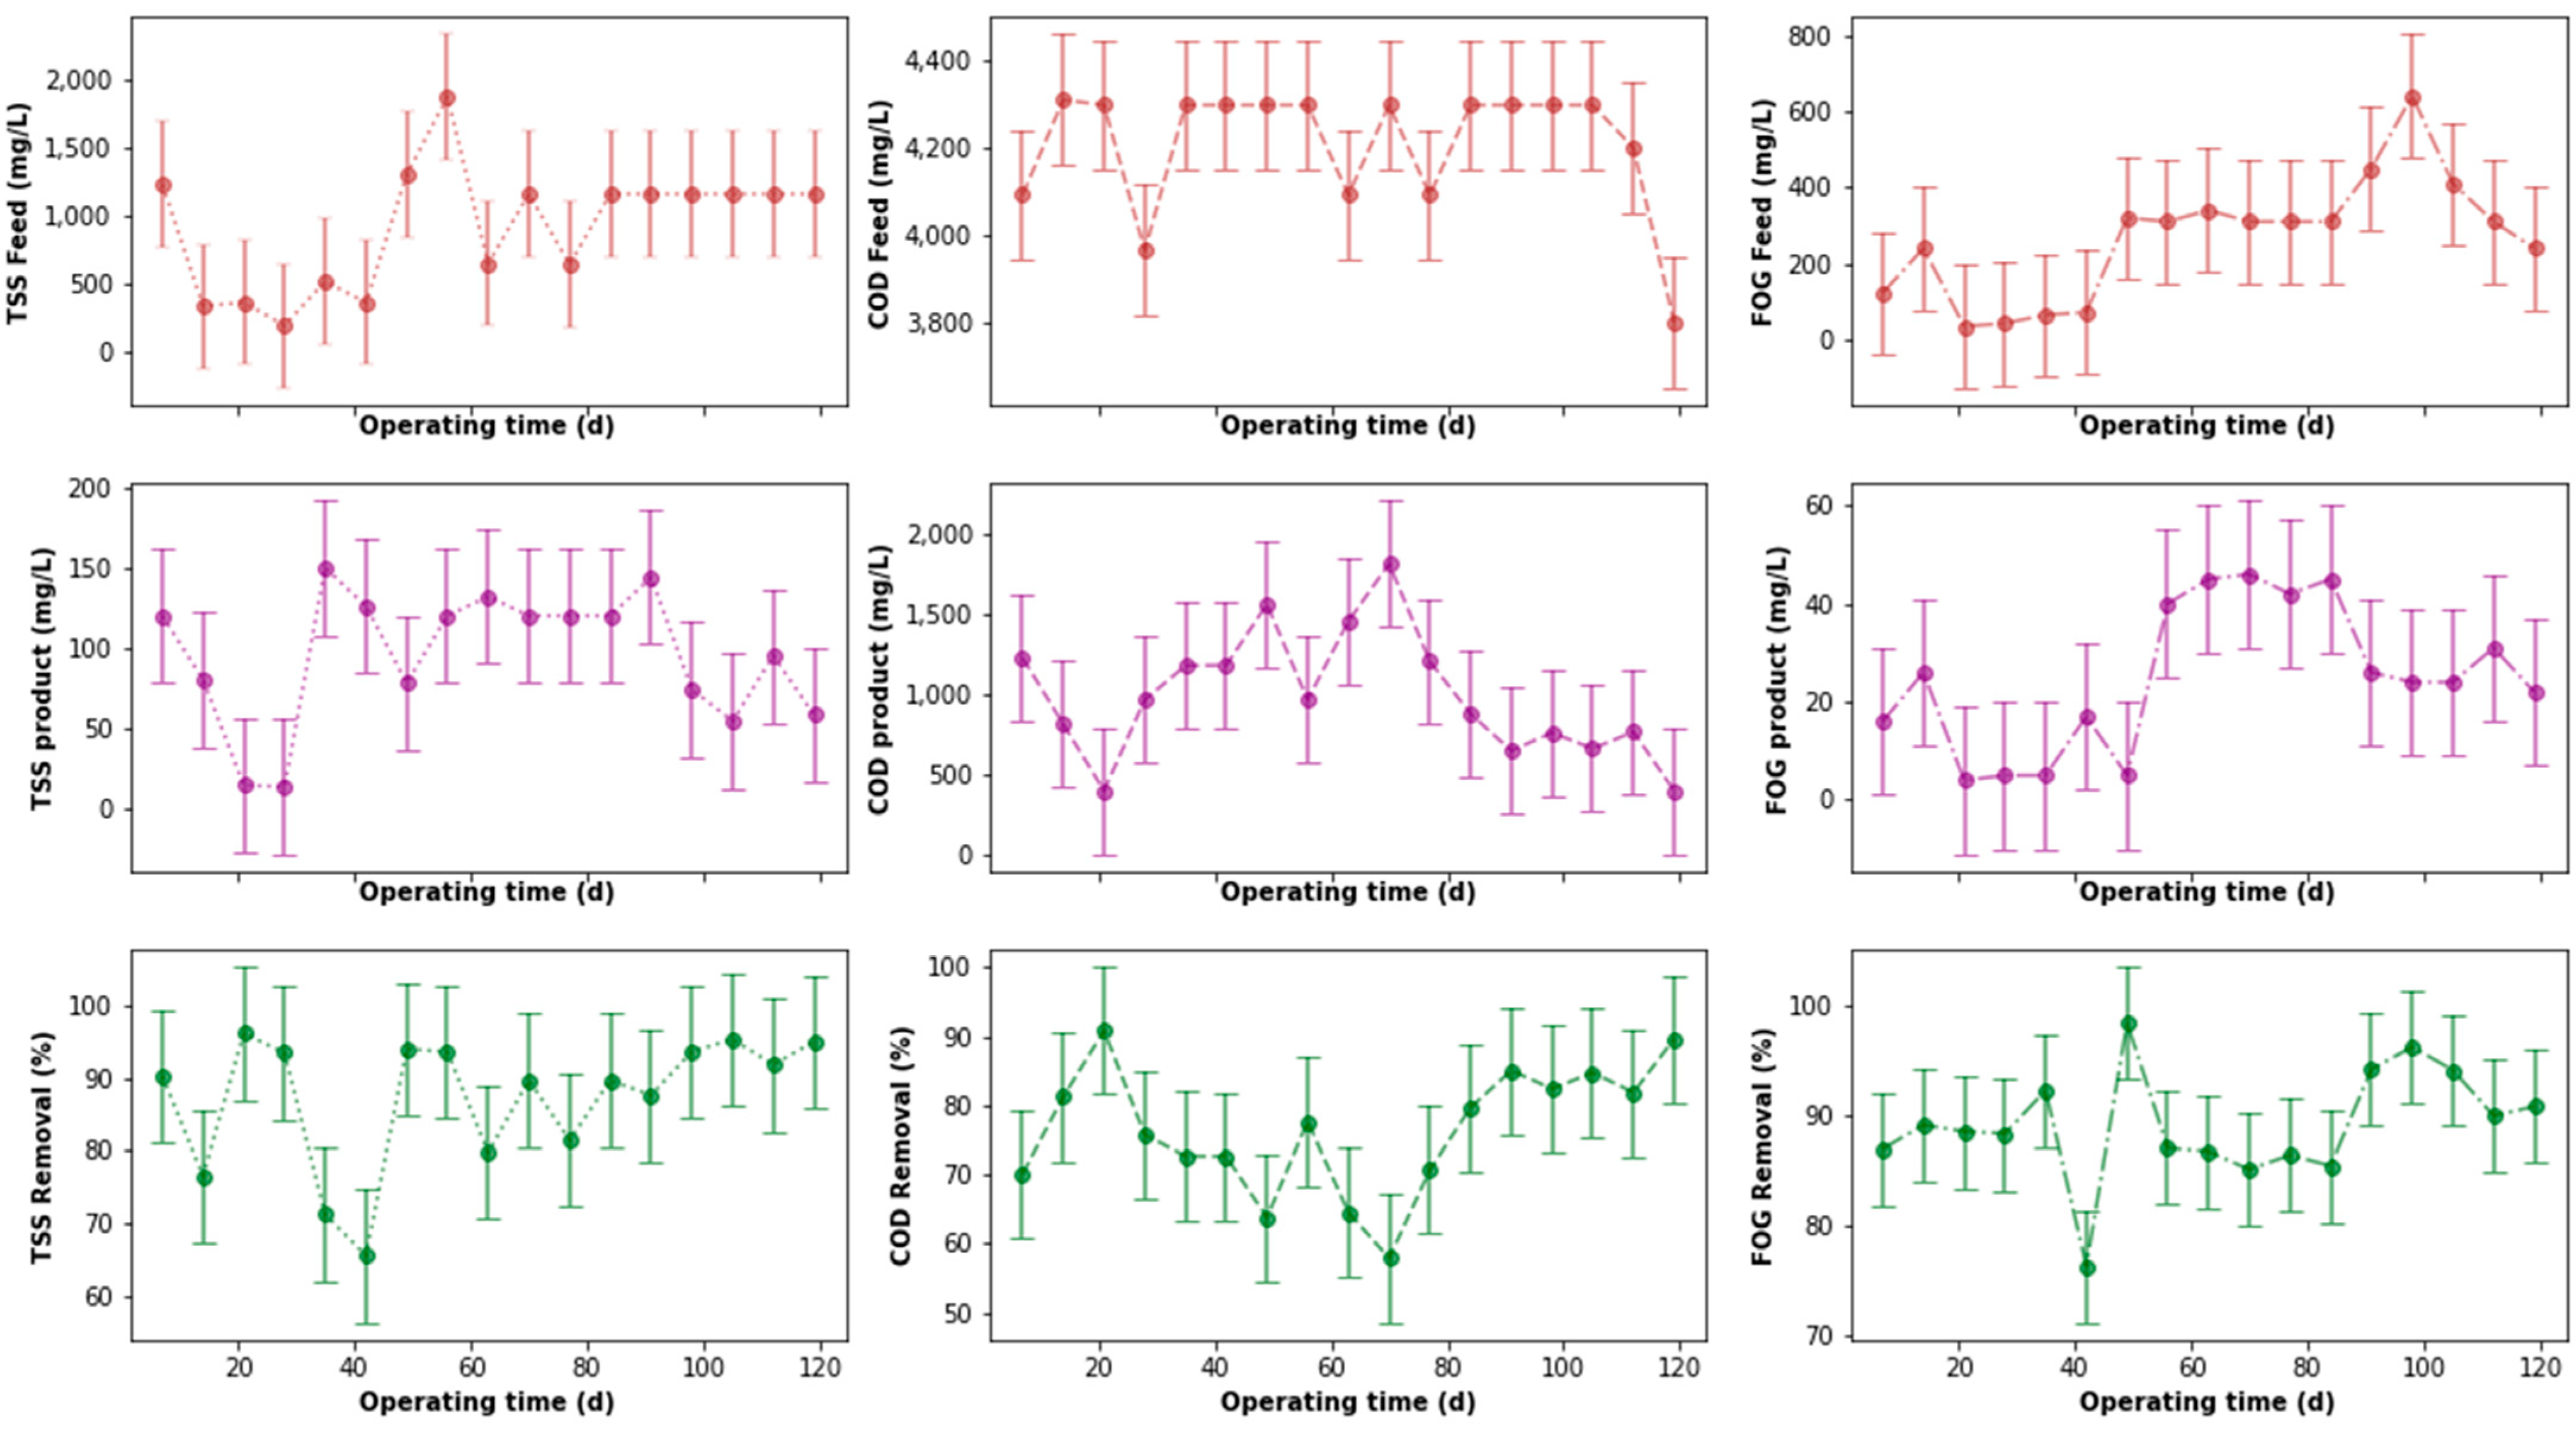
3.2. EGSB PSW Treatment Efficiency

Figure 8 provides the fluctuations of the PSW water quality parameters for the prior and post treatment by the EGSB. Furthermore, the same figure also depicts the fluctuations of the removal efficiencies of the tCOD, FOG, and TSS throughout the experiment. These are the raw values collected during the experiment, which may have erroneous in certain instances. Therefore, it was necessary to identify anomalies, i.e., identify and replace outliers, which might have had an influence on the distribution profile of the water quality parameters measured as this could affect the interpretation or the reproduction of an experiment. As previously alluded to, this outlier detection procedure could be achieved by boxplots, and was statistically interpretable using the inter-quartile range technique.
Previous studies on the EGSB reactor noted that it experiences clogging, sludge washout, and difficulties associated with the operation of the three-phase separator and the selection of the optimum up-flow velocity. These factors hinder the effectiveness of the EGSB, resulting in only a 65% treatment efficacy of the PSW [4]. In this study, the tCOD product concentrations from the EGSB fluctuated significantly in the early stages of PSW treatment, as expected. These results were consistent with the tCOD feed stream concentration, whereby during the initial stages of bioreactor operation, the feed contained higher concentrations of tCOD but gradually decreased towards the later stages of the treatment process. The highest percentage of tCOD removal was recorded at 76%, as shown in Figure 8. From these results it was noted that pretreating the PSW culminated in a significant increase in the treatment efficacy of the EGSB compared to the results from previous studies which only noted the upper limits of 65% tCOD removal without pretreatment.
Low concentrations of TSS were noted in the feed and product (Figure 8) and were consistently low throughout the experiment with spikes between day 20 and 40 which could be attributed to the fact that PSW samples were taken at a slightly different time to the previous batch. The percentage of TSS removal was also consistently above 50% and maintained above 90%, with the highest percentage removal recorded at 96%. The FOG feed concentrations were significantly lower due to the efficacy of the pretreatment tank, a clear indication of the impact of Eco-FlushTM in the hydrolysis of FOG. The FOG percentage removal fluctuated during the EGSB operation but was maintained above 50%. The average FOG removal was 66% with a maximum recorded at 97%. The study by Cruz-Salomon reported that the performance of the EGSB bioreactor was improved by reducing the particle size in wastewater [27]. Other studies noted that at undiluted PSW significantly hindered the hydrolysis of FOGs and tCOD due to the accumulation of long-chain fatty acids in anaerobic digestors [25,28]. These results further emphasize the importance of a pre-treatment step prior to the anaerobic digestion as the EGSB did not experience any instances of sludge washout or clogging during the experiment.
As depicted in Figure 9a, the outliers were identified in the tCOD and TSS outlet values. Their respective distributions were corrected by replacing the outliers with the median values of the relevant distributions, which are shown in Figure 9b where no outliers appear.
The effect of these outliers in each distribution before anomaly detection and correction is visualized by the comparison between their respective probability density functions, as depicted in Figure 10. The latter shows a clear reduction in the level of skewness of the parameters corrected, attaining a distribution closer to normality. This change was also noticed in the change in the values of the mean as well as the standard deviations of the corrected distributions.
Ultimately, this correction led to a more conducive analysis of the performance of the EGSB based on the variation of the change in the concentration of contaminants at the inlet and outlet of the EGSB, as depicted in Figure 11. From the latter, the variation in the removal efficiencies with respect to the tCOD, FOG, and TSS can also be observed, and show cases the good performance of the EGSB, particularly for the removal of TSS where the EGSB removal efficiency was maintained above 60% despite the various fluctuations of the organic loading rate (OLR).
A correlation matrix containing the Pearson correlation coefficient (r) and the p-value of each statistical analysis was used to correlate the performance of each of the evaluated removal efficiencies (see Figure 12). No correlation was found with the r values, which were relatively low when the two removal efficiencies were compared; the p-values were above 0.05 in each case.

3.3. PSW Pretreatment Process Coupled with an EGSB Reactor

Figure 13 provides the overall performance of the pre-treatment stage coupled with the EGSB for the distributions devoid of outliers. The analysis of the results focused on the impact of each individual treatment step, namely the pre-treatment step and the EGSB, as well as the combined uninterrupted treatment process characterized by comparing the feed before pre-treatment to the effluent collected at the end of the anaerobic treatment process. The combination used in the pre-treatment step achieved an average of 52% tCOD removal with the highest activity recorded at 76% in the pre-treatment tank alone. The percentage of tCOD removal in the EGSB alone was, on average, 53% with upper limits of 79%, as illustrated in Figure 8. This result was consistent with research by Basitere et al. [4], which noted an average of 57% tCOD removal for the EGSB reactor. These results showed that even though each stage achieved more than a 50% average removal efficiency individually for the measured parameters, running these steps individually might not yield the desired outcome in the remediation of PSW. This was further emphasized when assessing the combined treatment efficacy of the pre-treated PSW and the PSW effluent from the EGSB in Figure 13. The combination, as hypothesized, had a drastic improvement on the removal of tCOD, with an average percentage removal of 76% and upper limits of 91%. The study by Williams et al. [29] recorded upper limits of 93% COD removal at an optimized organic loading rate (OLR) and hydraulic retention time (HRT) in an EGSB reactor. Mbulawa [30] also noted a 66% COD removal by crude lipases of the Bacillus cereus CC-1 strain and recommended the use of this strain for pretreating PSW prior to AD. These results further emphasized the importance of a pre-treatment step for tCOD-FOG-laden wastewater prior to anaerobic digestion and the use of combinational treatment processes to remediate PSW.
Initially, low-percentage reductions were noted for TSS in the pre-treatment tank at an average of 48% which was not a significant reduction; however, it could be noted that there was no previous data on the activity of Eco-Flush™ on TSS removal in a pre-treatment tank for PSW remediation. Moreover, the percentage of TSS removal could, therefore, mostly be attributed to the flocculation activity and filtration which reduced the concentration of the suspended solids in the pre-treated PSW before feeding them into the EGSB. The EGSB had a much better impact in the remediation of TSS in the system. The average removal achieved was 68%, reaching a high of 93%, as seen in Figure 11. The high concentrations of TSS in the effluent were noted to cause a decrease in the working volume of the bioreactor. Such solids could also decrease the useful characteristics of the anaerobic granular sludge and this in turn reduced the bioreactor’s performance [25]. The combined remedial action of the pre-treatment step and the EGSB averaged 87% TSS removal with peaks of 96% TSS removal, showing an effective, combined, remedial performance as illustrated in Figure 14. This result further demonstrated that the combined treatment process enhanced the efficacy of the PSW treatment system.
Similarly, FOG removal levels in the pre-treatment tank for PSW averaged approximately 66% with an upper limit of 96% FOG removal, while the average for EGSB had an upper removal limit of 97%. The combined FOG treatment efficacy consisted of a mean of 88% with an upper limit of 98%, as depicted in Figure 14. From these results, it could be noted that the EGSB, coupled with a pre-treatment step, proved effective for reducing the FOG levels in PSW. This reduction was a result of bio-flocculation-coagulation caused by the Eco-Flush™. These results are in line with the manufacturer’s observation that Eco-Flush™ actively reduces the COD levels and remediates FOGs in organic waste [21]. Valladão et al. [31] also noted no clear reduction in the treatment efficiency of an unpretreated effluent containing FOG, whereas a pre-treated FOG effluent showed effective AD bioreactor performance results, emphasizing the need for pre-treatment to maintain the process efficiency. Commercially available FOG hydrolyzing agents with a flocculation-coagulation activity can be used in pretreatment systems for abattoir wastewater with a high FOG content to aid AD systems used as primary organic matter digesters. Such a strategy, as reported herein, resulted in the treatment efficiencies of 90% with upper limits of 98%.
The probability density function of the removal efficiencies and the water quality assessment parameters, both at the inlet and the outlet of the combined system are depicted in Figure 14, showing the mean and standard deviation of each distribution.
Lastly, the correlation matrix in Figure 15, between the COD, FOG, and TSS removal efficiencies showed no strong correlation between these parameters for the combined system. Therefore, the hypothesis of a possible similarity in the removal pattern of the respective water quality assessment parameters was rejected.

4. Conclusions

It was observed that the overall performance of a combined pre-treatment tank dosed with an eco-friendly, FOG-hydrolysing agent, in combination with an EGSB, performed satisfactorily for COD, TSS and particularly FOG removal. The removal efficiencies were consistently above 60%, with maximum values above 90% in certain cases for the individual parameters measured for the PSW. This performance highlights the importance of a pre-treatment stage prior to anaerobic digestion, as recommended by Bustillo-Lecompte and Mehrvar [23] and Njoya et al. [24], since this stage contributed to the precondition of FOG-laden PSW. However, further research should focus on (1) identifying the optimum conditions for FOG hydrolysis and agent-facilitated, pre-treatment tanks and (2) the optimum conditions for other commercially available flocculation-coagulation products, such as Eco-Flush™, that can be used by micro, small and medium poultry slaughterhouses in combination with an EGSB.

Author Contributions

C.T.M. is the author of the draft manuscript and was responsible for sample analysis, and initial data interpretation; P.A.D. assisted with designing the figures and reviewing the manuscript; M.N. checked the collated data, reanalyzed, reinterpreted the data and assisted in data presentation; M.B. and S.K.O.N. conceptualized the study, revised the manuscript and analyzed the data; E.K. designed and built the lab-scale plant under Malutsa Pty Ltd., Western Cape, Wellington Industrial Park, SA. All authors have read and agreed to the published version of the manuscript.

Funding

This study was funded by National Research Foundation of South Africa, Thuthuka Funding, R017. Furthermore, the Cape Peninsula University of technology (URF, cost centre: RK45 and the Bioresource Engineering Research Group, (BioERG)) contributed additional funding for the study.

Institutional Review Board Statement

Not applicable.

Informed Consent Statement

Not applicable.

Data Availability Statement

Not applicable.

Acknowledgments

Malutsa company, Western Cape, Wellington Industrial Park, SA for building the lab-scale plant and Mavu Biotechnologies (Pty) Ltd. for donating Eco-flushTM used for biological pre-treatment. Furthermore, acknowledgements go to NRF Thuthuka Grant R017 and Cape Peninsula University of Technology URF for funding the project under the following cost center ( RK45).

Conflicts of Interest

The authors declare no conflict of interest.

References

  1. Aziz, A.; Basheer, F.; Sengar, A.; Irfanullah; Khan, S.U.; Farooqi, I.H. Biological wastewater treatment (anaerobic-aerobic) technologies for safe discharge of treated slaughterhouse and meat processing wastewater. Sci. Total Environ. 2019, 686, 681–708. [Google Scholar] [CrossRef]
  2. Lu, W.-Y.; Zhang, T.; Zhang, D.-Y.; Li, C.-H.; Wen, J.-P.; Du, L.-X. A novel bioflocculant produced by Enterobacter aerogenes and its use in defecating the trona suspension. Biochem. Eng. J. 2005, 27, 1–7. [Google Scholar] [CrossRef]
  3. Western Cape Government. Wastewater and Industrial Effluent By-Law, 2013. Western Cape Provincial Gazette No. 7227; Western Cape Government: Cape Town, South Africa, 2014.
  4. Basitere, M.; Williams, Y.; Sheldon, M.S.; Ntwampe, S.K.O.; De Jager, D.; Dlangamandla, C. Performance of an expanded granular sludge bed (EGSB) reactor coupled with anoxic and aerobic bioreactors for treating poultry slaughterhouse wastewater. Water Pract. Technol. 2016, 11, 86–92. [Google Scholar] [CrossRef]
  5. Fu, Y.; Luo, T.; Mei, Z.; Li, J.; Qiu, K.; Ge, Y. Dry Anaerobic Digestion Technologies for Agricultural Straw and Acceptability in China. Sustainability 2018, 10, 4588. [Google Scholar] [CrossRef] [Green Version]
  6. Kim, K.-Y.; Yang, W.; Ye, Y.; LaBarge, N.; Logan, B.E. Performance of anaerobic fluidized membrane bioreactors using effluents of microbial fuel cells treating domestic wastewater. Bioresour. Technol. 2016, 208, 58–63. [Google Scholar] [CrossRef] [PubMed]
  7. Merrylin, J.; Kumar, S.A.; Kaliappan, S.; Yeom, I.-T.; Banu, J.R. Biological pretreatment of non-flocculated sludge augments the biogas production in the anaerobic digestion of the pretreated waste activated sludge. Environ. Technol. 2013, 34, 2113–2123. [Google Scholar] [CrossRef] [PubMed]
  8. Novak, J.T.; Sadler, M.E.; Murthy, S. Mechanisms of floc destruction during anaerobic and aerobic digestion and the effect on conditioning and dewatering of biosolids. Water Res. 2003, 37, 3136–3144. [Google Scholar] [CrossRef]
  9. Menzel, T.; Neubauer, P.; Junne, S. Role of Microbial Hydrolysis in Anaerobic Digestion. Energies 2020, 13, 5555. [Google Scholar] [CrossRef]
  10. Harris, P.W.; McCabe, B.K. Review of pre-treatments used in anaerobic digestion and their potential application in high-fat cattle slaughterhouse wastewater. Appl. Energy 2015, 155, 560–575. [Google Scholar] [CrossRef]
  11. Elliott, A.; Mahmood, T. Pretreatment technologies for advancing anaerobic digestion of pulp and paper biotreatment residues. Water Res. 2007, 41, 4273–4286. [Google Scholar] [CrossRef]
  12. Meegoda, J.N.; Li, B.S.-K.; Patel, K.; Wang, L.B. A Review of the Processes, Parameters, and Optimization of Anaerobic Digestion. Int. J. Environ. Res. Public Health 2018, 15, 2224. [Google Scholar] [CrossRef] [PubMed] [Green Version]
  13. Al-Mutairi, N.; Al-Sharifi, F.; Al-Shammari, S. Evaluation study of a slaughterhouse wastewater treatment plant including contact-assisted activated sludge and DAF. Desalination 2008, 225, 167–175. [Google Scholar] [CrossRef]
  14. de Nardi, I.; Fuzi, T.; Del Nery, V. Performance evaluation and operating strategies of dissolved-air flotation system treating poultry slaughterhouse wastewater. Resour. Conserv. Recycl. 2008, 52, 533–544. [Google Scholar] [CrossRef]
  15. de Sena, R.F.; Moreira, R.F.; José, H.J. Comparison of coagulants and coagulation aids for treatment of meat processing wastewater by column flotation. Bioresour. Technol. 2008, 99, 8221–8225. [Google Scholar] [CrossRef]
  16. Gürel, L.; Büyükgüngör, H. Treatment of slaughterhouse plant wastewater by using a membrane bioreactor. Water Sci. Technol. 2011, 64, 214–219. [Google Scholar] [CrossRef] [PubMed]
  17. Bayramoglu, M.; Kobya, M.; Eyvaz, M.; Senturk, E. Technical and economic analysis of electrocoagulation for the treatment of poultry slaughterhouse wastewater. Sep. Purif. Technol. 2006, 51, 404–408. [Google Scholar] [CrossRef]
  18. Kobya, M.; Senturk, E.; Bayramoglu, M. Treatment of poultry slaughterhouse wastewaters by electrocoagulation. J. Hazard. Mater. 2006, 133, 172–176. [Google Scholar] [CrossRef] [PubMed]
  19. Dlangamandla, C.; Dyantyi, S.A.; Mpentshu, Y.P.; Ntwampe, S.K.O.; Basitere, M. Optimisation of bioflocculant production by a biofilm forming microorganism from poultry slaughterhouse wastewater for use in poultry wastewater treatment. Water Sci. Technol. 2016, 73, 1963–1968. [Google Scholar] [CrossRef]
  20. Subramanian, S.B.; Yan, S.; Tyagi, R.; Surampalli, R. Extracellular polymeric substances (EPS) producing bacterial strains of municipal wastewater sludge: Isolation, molecular identification, EPS characterization and performance for sludge settling and dewatering. Water Res. 2010, 44, 2253–2266. [Google Scholar] [CrossRef]
  21. Ergofito Remediation of Grease Traps, Kitchen Floors and Drains. Available online: https://www.ergofito.co.za/application/Grease-Fats-Overview (accessed on 15 September 2021).
  22. Lecompte, C.F.B.; Mehrvar, M. Treatment of actual slaughterhouse wastewater by combined anaerobic–aerobic processes for biogas generation and removal of organics and nutrients: An optimization study towards a cleaner production in the meat processing industry. J. Clean. Prod. 2017, 141, 278–289. [Google Scholar] [CrossRef]
  23. Kaskote, E.; Rinquest, Z.; Williams, Y.; Njoya, M. Performance and Statistical Comparison of the Expanded and Static Granular Sludge Bed Reactors Treating Poultry Slaughterhouse Wastewater. In Proceedings of the 6th South Africa International Conference on Agricultural, Chemical, Biological & Environmental Sciences (ACBES-19), Johannesburg, South Africa, 18–19 November 2019. [Google Scholar] [CrossRef]
  24. Njoya, M.; Basitere, M.; Ntwampe, S.K.O. Treatment of poultry slaughterhouse wastewater using a down-flow expanded granular bed reactor. Water Pract. Technol. 2019, 14, 549–559. [Google Scholar] [CrossRef]
  25. Kundu, P.; Debsarkar, A.; Mukherjee, S. Treatment of Slaughter House Wastewater in a Sequencing Batch Reactor: Performance Evaluation and Biodegradation Kinetics. BioMed Res. Int. 2013, 2013, 1–11. [Google Scholar] [CrossRef] [PubMed] [Green Version]
  26. Dlangamandla, C.; Ntwampe, S.K.O.; Basitere, M. A bioflocculant-supported dissolved air flotation system for the removal of suspended solids, lipids and protein matter from poultry slaughterhouse wastewater. Water Sci. Technol. 2018, 78, 452–458. [Google Scholar] [CrossRef] [PubMed]
  27. Cruz-Salomón, A.; Ríos-Valdovinos, E.; Pola-Albores, F.; Lagunas-Rivera, S.; Meza-Gordillo, R.; Ruíz-Valdiviezo, V.; Cruz-Salomón, K. Expanded granular sludge bed bioreactor in wastewater treatment. Glob. J. Environ. Sci. Manag. 2019, 5, 119–138. [Google Scholar]
  28. Affes, M.; Aloui, F.; Hadrich, F.; Loukil, S.; Sayadi, S. Effect of bacterial lipase on anaerobic co-digestion of slaughterhouse wastewater and grease in batch condition and continuous fixed-bed reactor. Lipids Health Dis. 2017, 16, 195. [Google Scholar] [CrossRef] [Green Version]
  29. Williams, Y.; Basitere, M.; Ntwampe, S.K.O.; Ngongang, M.; Njoya, M.; Kaskote, E. Application of response surface methodology to optimize the COD removal efficiency of an EGSB reactor treating poultry slaughterhouse wastewater. Water Pract. Technol. 2019, 14, 507–514. [Google Scholar] [CrossRef]
  30. Mbulawa, S.; Ntwampe, S.K.O.; Basitere, M.; Mpentshu, Y.; Dlangamandla, C.; Chidi, B.S. Bio-delipidation of dissolved air flotation pre-treated poultry slaughterhouse wastewater. In Proceedings of the 10th International Conference on Advances in Science, Engineering, Technology & Healthcare (ASETH-18), Cape Town, South Africa, 19–20 November 2018. [Google Scholar]
  31. Valladão, A.B.G.; Sartore, P.E.; Freire, D.M.G.; Cammarota, M.C. Evaluation of different pre-hydrolysis times and enzyme pool concentrations on the biodegradability of poultry slaughterhouse wastewater with a high fat content. Water Sci. Technol. 2009, 60, 243–249. [Google Scholar] [CrossRef]
Figure 1. Pre-treatment Process Schematic Diagram.
Processes 09 01938 g001
Figure 2. The EGSB reactor treatment process.
Processes 09 01938 g002
Figure 3. Pre-treatment performance before anomaly detection and correction.
Processes 09 01938 g003
Figure 4. Boxplots of each pre-treatment parameter distribution before and after anomaly detection and correction.
Processes 09 01938 g004
Figure 5. Pre-treatment probability density functions before anomaly detection and correction. (a) Probability density functions before anomaly correction. (b) Probability density functions after anomaly detection.
Processes 09 01938 g005
Figure 6. Pre-treatment performance after anomaly detection and correction.
Processes 09 01938 g006
Figure 7. Correlation matrix between the pre-treatment removal efficiencies.
Processes 09 01938 g007
Figure 8. EGSB Treatment performance before anomaly detection and correction.
Processes 09 01938 g008
Figure 9. EGSB treatment parameters before and after anomaly detection. (a) Anomaly detection and correction. (b) After anomaly detection and correction.
Processes 09 01938 g009
Figure 10. Probability density functions of the EGSB before and after anomaly detection and correction. (a) Before anomaly detection and correction. (b) After anomaly detection and correction.
Processes 09 01938 g010
Figure 11. EGSB Treatment performance after anomaly detection and correction.
Processes 09 01938 g011
Figure 12. Correlation matrix between the EGSB removal efficiencies.
Processes 09 01938 g012
Figure 13. Performance of the pre-treatment stage coupled with the EGSB.
Processes 09 01938 g013
Figure 14. Probability density function of the inlet and outlet of the overall system, including their removal efficiencies.
Processes 09 01938 g014
Figure 15. Correlation matrix between the removal efficiencies of the pre-treatment stage coupled with the EGSB.
Processes 09 01938 g015
Table 1. List of pre-treatment methods used for the removal of COD, BOD and FOG.
Pre-Treatment MethodsPurposeEfficacyReferences
Dissolved air floatation (DAF)Uses liquid–solid separation by air introduction for floatation.75% removal for FOG, BOD and TSS.[13,14]
Coagulation-flocculation and sedimentationDestabilizes colloidal particles, form flocs and sediment-dense particles.Achieves up to 80% BOD, COD and TSS removal.[15]
Membrane processes (microfiltration, ultrafiltration, nanofiltration and reverse osmosis)Removes macromolecules, organic matter, pathogens and colloidal particles.Achieves up to 90% removal efficiency but requires further processing for nutrient removal.[16]
ElectrocoagulationUses electric current for the removal of organics, heavy metals and pathogens.Up to 80, 81 and 85% removal for BOD, TSS and COD, respectively.[17,18]
Table 2. Analytical methods used for measuring of the samples.
ParametersMethods
Total chemical oxygen demand (tCOD)EPA method 410.4
Fats, oils and grease (FOG)EPA method 10056
TemperatureEPA method 9040C
Total suspended solids (TSS)EPA method 160.2
Publisher’s Note: MDPI stays neutral with regard to jurisdictional claims in published maps and institutional affiliations.

