Urban Air Quality Monitoring with Networked Low-Cost Sensor-Systems †


ENEA—Italian National Agency for New Technologies, Energy and Sustainable Economic Development, Lab. Functional Materials and Technologies for Sustainable Applications, Brindisi Research Center, I-72100 Brindisi, Italy
*
Author to whom correspondence should be addressed.
†
Presented at the Eurosensors 2017 Conference, Paris, France, 3–6 September 2017.
Proceedings 2017, 1(4), 573; https://0-doi-org.brum.beds.ac.uk/10.3390/proceedings1040573
Published: 8 August 2017
(This article belongs to the Proceedings of Proceedings of Eurosensors 2017, Paris, France, 3–6 September 2017)
Abstract
:A sensors network based on 11 nodes (10 stationary and 1 mobile mounted on public bus) distributed in Bari (Italy) has been deployed for urban air quality (AQ) monitoring. The low-cost sensor-systems have been installed in specific sites (buildings, offices, schools, streets, port, airport) to enhance environmental awareness of the citizens and to supplement the expensive official air monitoring stations with cost-effective sensor-nodes at high spatial and temporal resolution. Continuous measurements were performed by low-cost electrochemical gas sensors (CO, NO2, O3, SO2), optical particle counter (PM1.0, PM2.5, PM10), NDIR infrared sensor (CO2), photo-ionisation detector (total VOCs), including microsensors for temperature and relative humidity. The sensors are running to assess the performance during a campaign (June 2015–December 2017) of several months for citizen science in sustainable smart cities. The air quality index (AQI) for a given pollutant has been measured and compared to the public reference environmental data. The results of the AQ monitoring long-term campaign for selected sensor-nodes are presented.
1. Introduction
Urban air quality is a major issue for public health, especially in cities and metropolises. Many worldwide cities do not meet the requirements for cleaner air (World Health Organization 2016 Report, UN Environment Programme Report) [1] including several European cities (European Environment Agency Report 2016) [2]. Moreover, climate change monitoring is crucial to implement abatement strategies of greenhouse gases and CO2 emissions for a low-carbon chemical footprint in the sustainable cities [3]. In this context, new sensing technologies at low-cost and low-power consumption for urban air quality monitoring [4,5,6] are extremely demanding for decision support and enhanced environmental awareness of the citizens. The sensors network with several sensor-nodes distributed in urban hot-spots can be a valid approach for air quality monitoring at high spatial and temporal resolution [5]. This cost-effective sensors network could supplement in the Indicative Measurements mode (EU Ambient Air Quality Directive, 2008/50/EC) the expensive air quality monitoring stations, used as mandatory reference methods for legislation surveillance when exceedances of a given air pollutant are measured in the urban agglomerates [3].
The deployment of a wireless sensors network for urban air quality monitoring is extremely important for environmental big data including both stationary nodes and mobile sensing in public transport to control in real time the city life and adopt remediation plans by energy managers for urban sustainable mobility plans.
In this paper, a Wireless Sensors Network (WSN) based on low-cost gas sensors (NO2, O3, CO, SO2), particulate matter (PM10), greenhouse gas (CO2) and meteorological parameters (temperature, relative humidity) has been deployed in the Bari (Italy) city for a long-term experimental campaign such as 30 months of continuous measurements in 10 stationary nodes and 1 mobile node on public bus. The WSN results are presented in terms of measured concentrations compared to reference official data of the air quality monitoring stations managed by the environmental local authority (ARPA-Puglia). Furthermore, Air Quality Index (AQI), calculated by deployed sensors, is compared to the related official data by ARPA-Puglia as well.
2. Materials and Methods
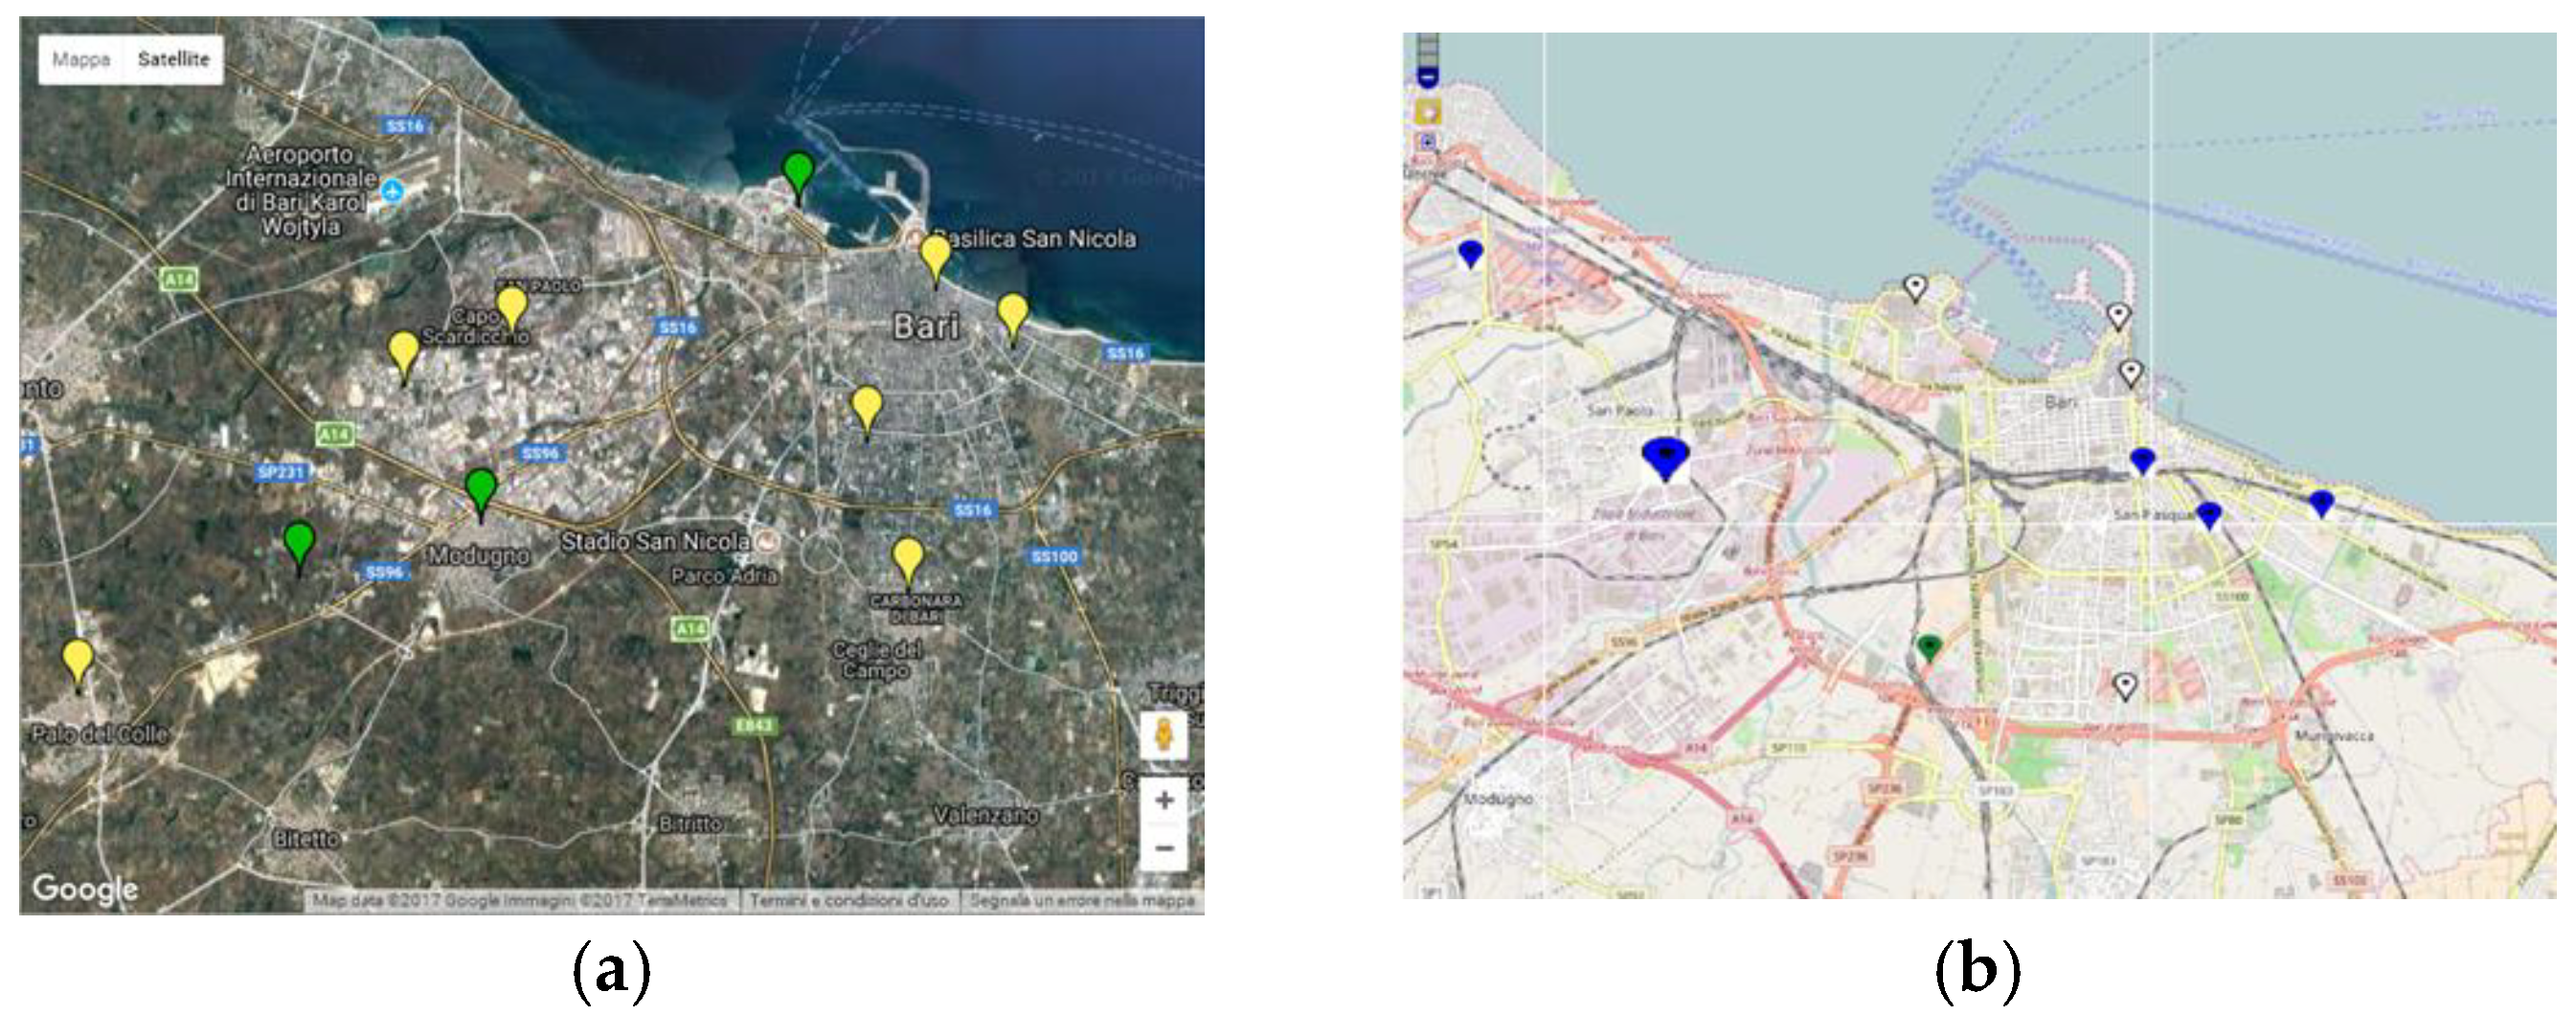
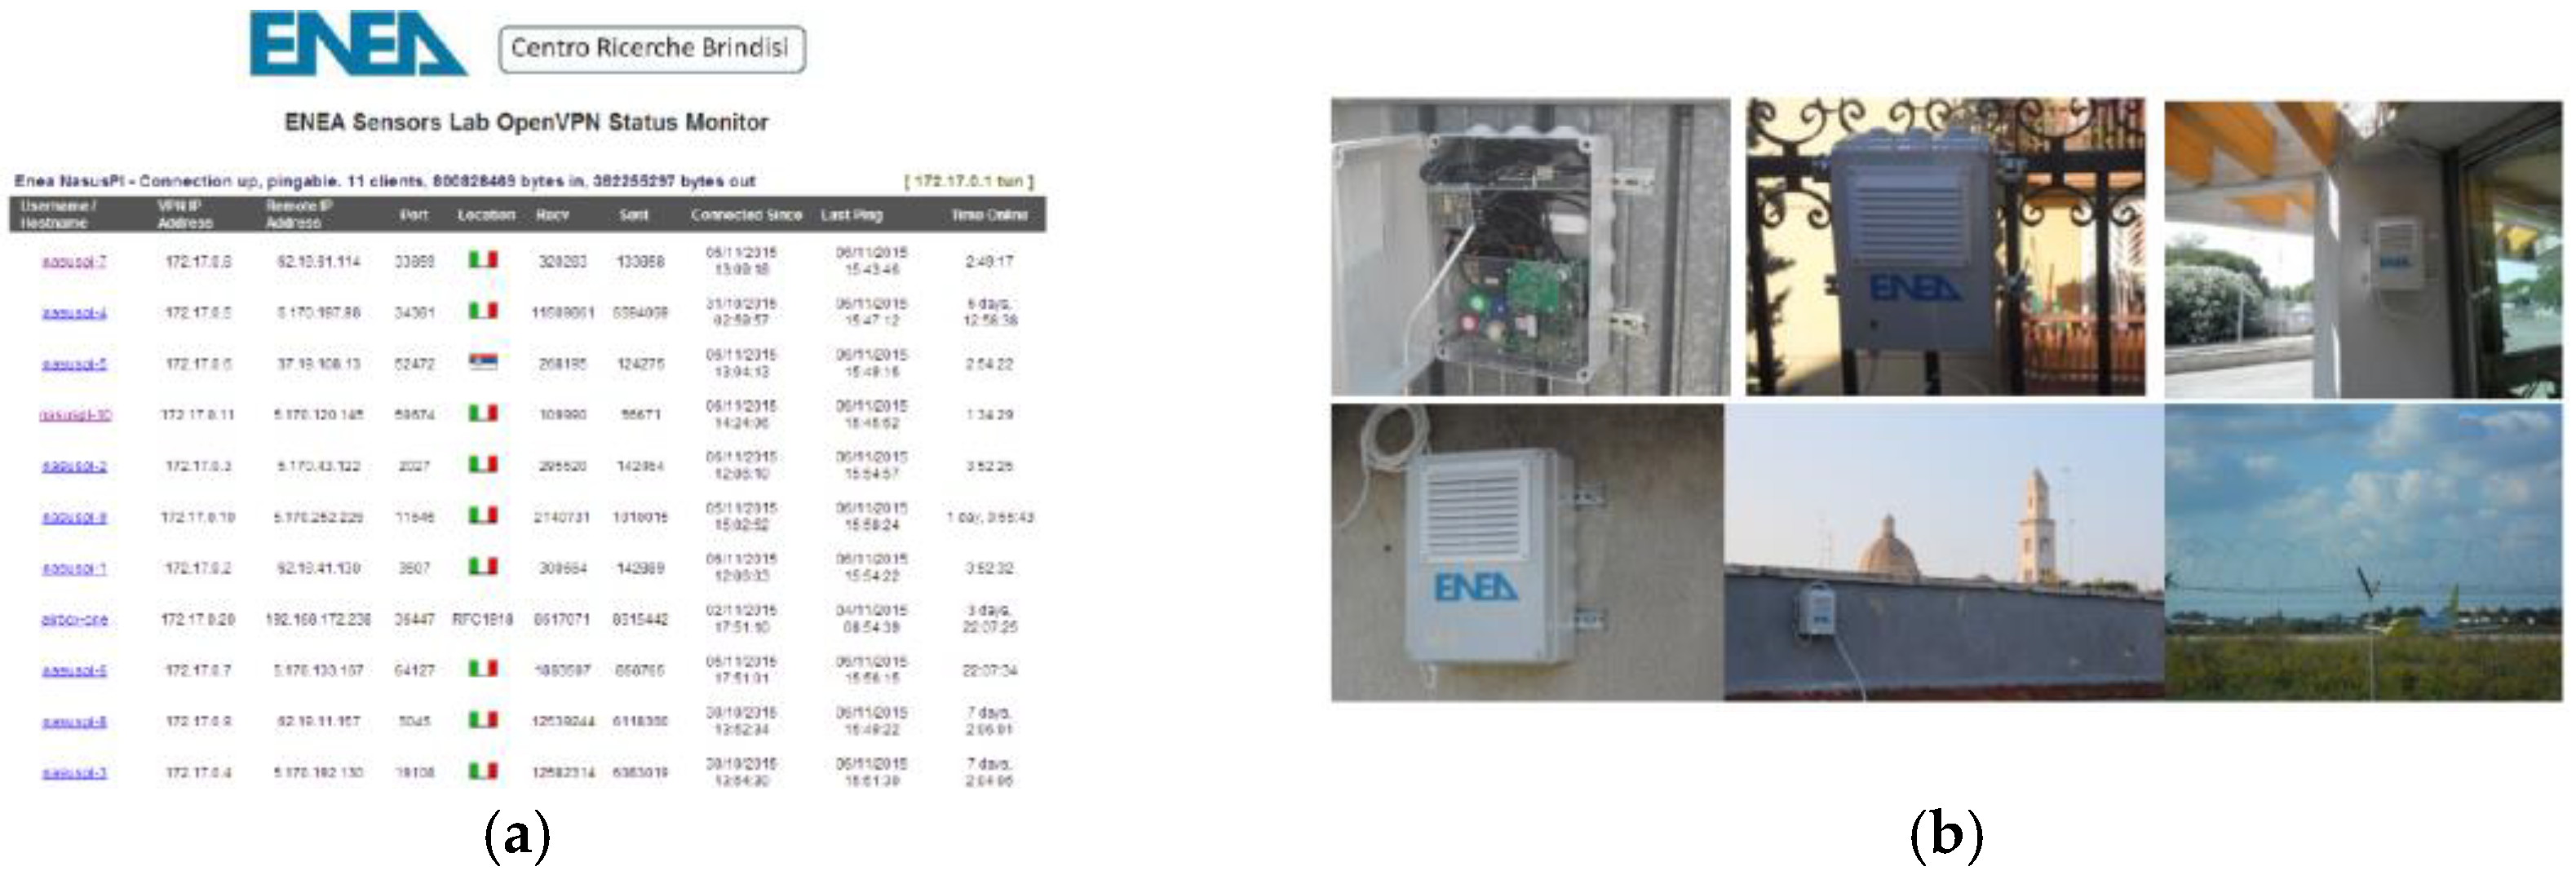
The Wireless Sensor Network based on AIRBOX sensor-nodes has been deployed in selected urban hot-spots in agreement with Bari energy manager, as shown in Figure 1. The sensor-node data are compared to the closest air quality monitoring station to assess the sensors performance in real scenario with official reference data. The AIRBOX sensor-nodes, distributed in hot-spots at Bari, deliver one-hour averaged data but can be configured to deliver 15 min averaged data. The sampling rate can be programmed in the range from 10 s to 60 min. An integrated General Packet Radio Service (GPRS) modem allows data transfer to a database server for post-processing. A Virtual Private Network (VPN) has been designed and implemented to monitor the remote nodes (see Figure 2). The recorded data can be downloaded and visualized from a Global Information System (GIS) dedicated website.
3. Results
3.1. Stationary Wireless Sensors Network: PM10
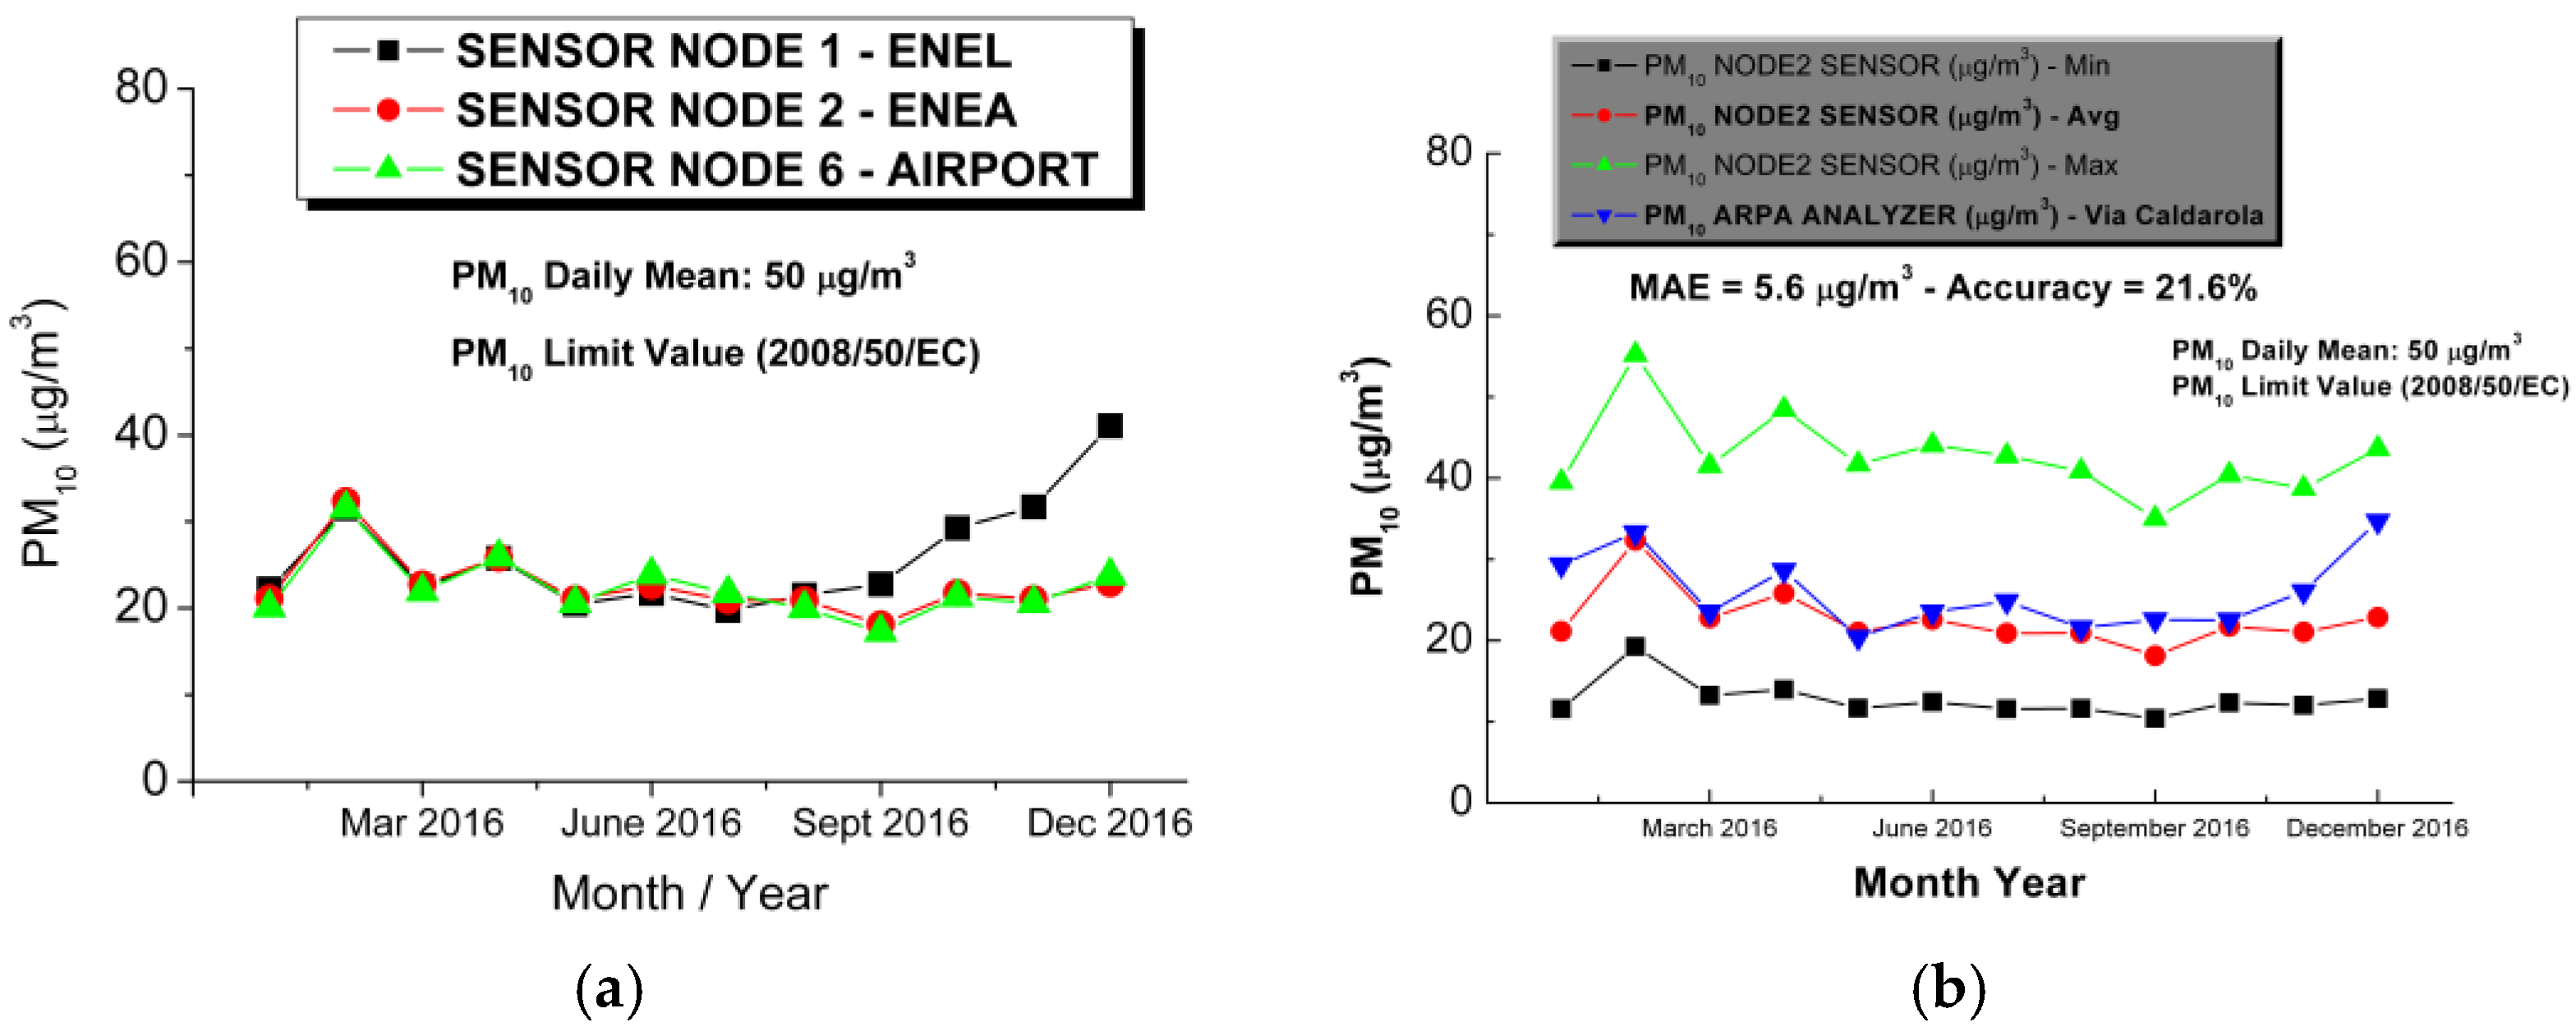
Figure 3 shows the monthly mean of the PM10 measured by AIRBOX sensor (PPD20V, Shinyei) in the Node 1 (ENEL—Longitude E: 16.87370, Latitude N: 41.11720), Node 2 (ENEA—Longitude E: 16.89963, Latitude N: 41.11259) and Node 6 (Airport—Longitude E: 16.77646, Latitude N: 41.13979) in the period January–December 2016. The trend of the PM10 in the three nodes under test exhibits a good overlapping (Figure 3a) and a very good correlation with reference data, as shown in Figure 3.b for Node 2 sensor compared to air quality monitoring station (Via Caldarola). The Mean Absolute Error (MAE) for three reported nodes is equal to 5.6 µg/m3, while the accuracy ranges from 24.8% (Node 1), 21.6% (Node 2) to 20.5% (Node 6), as reported in the Table 1.
3.2. PM10 Air Quality Index (AQI): Sensor versus Analyzer
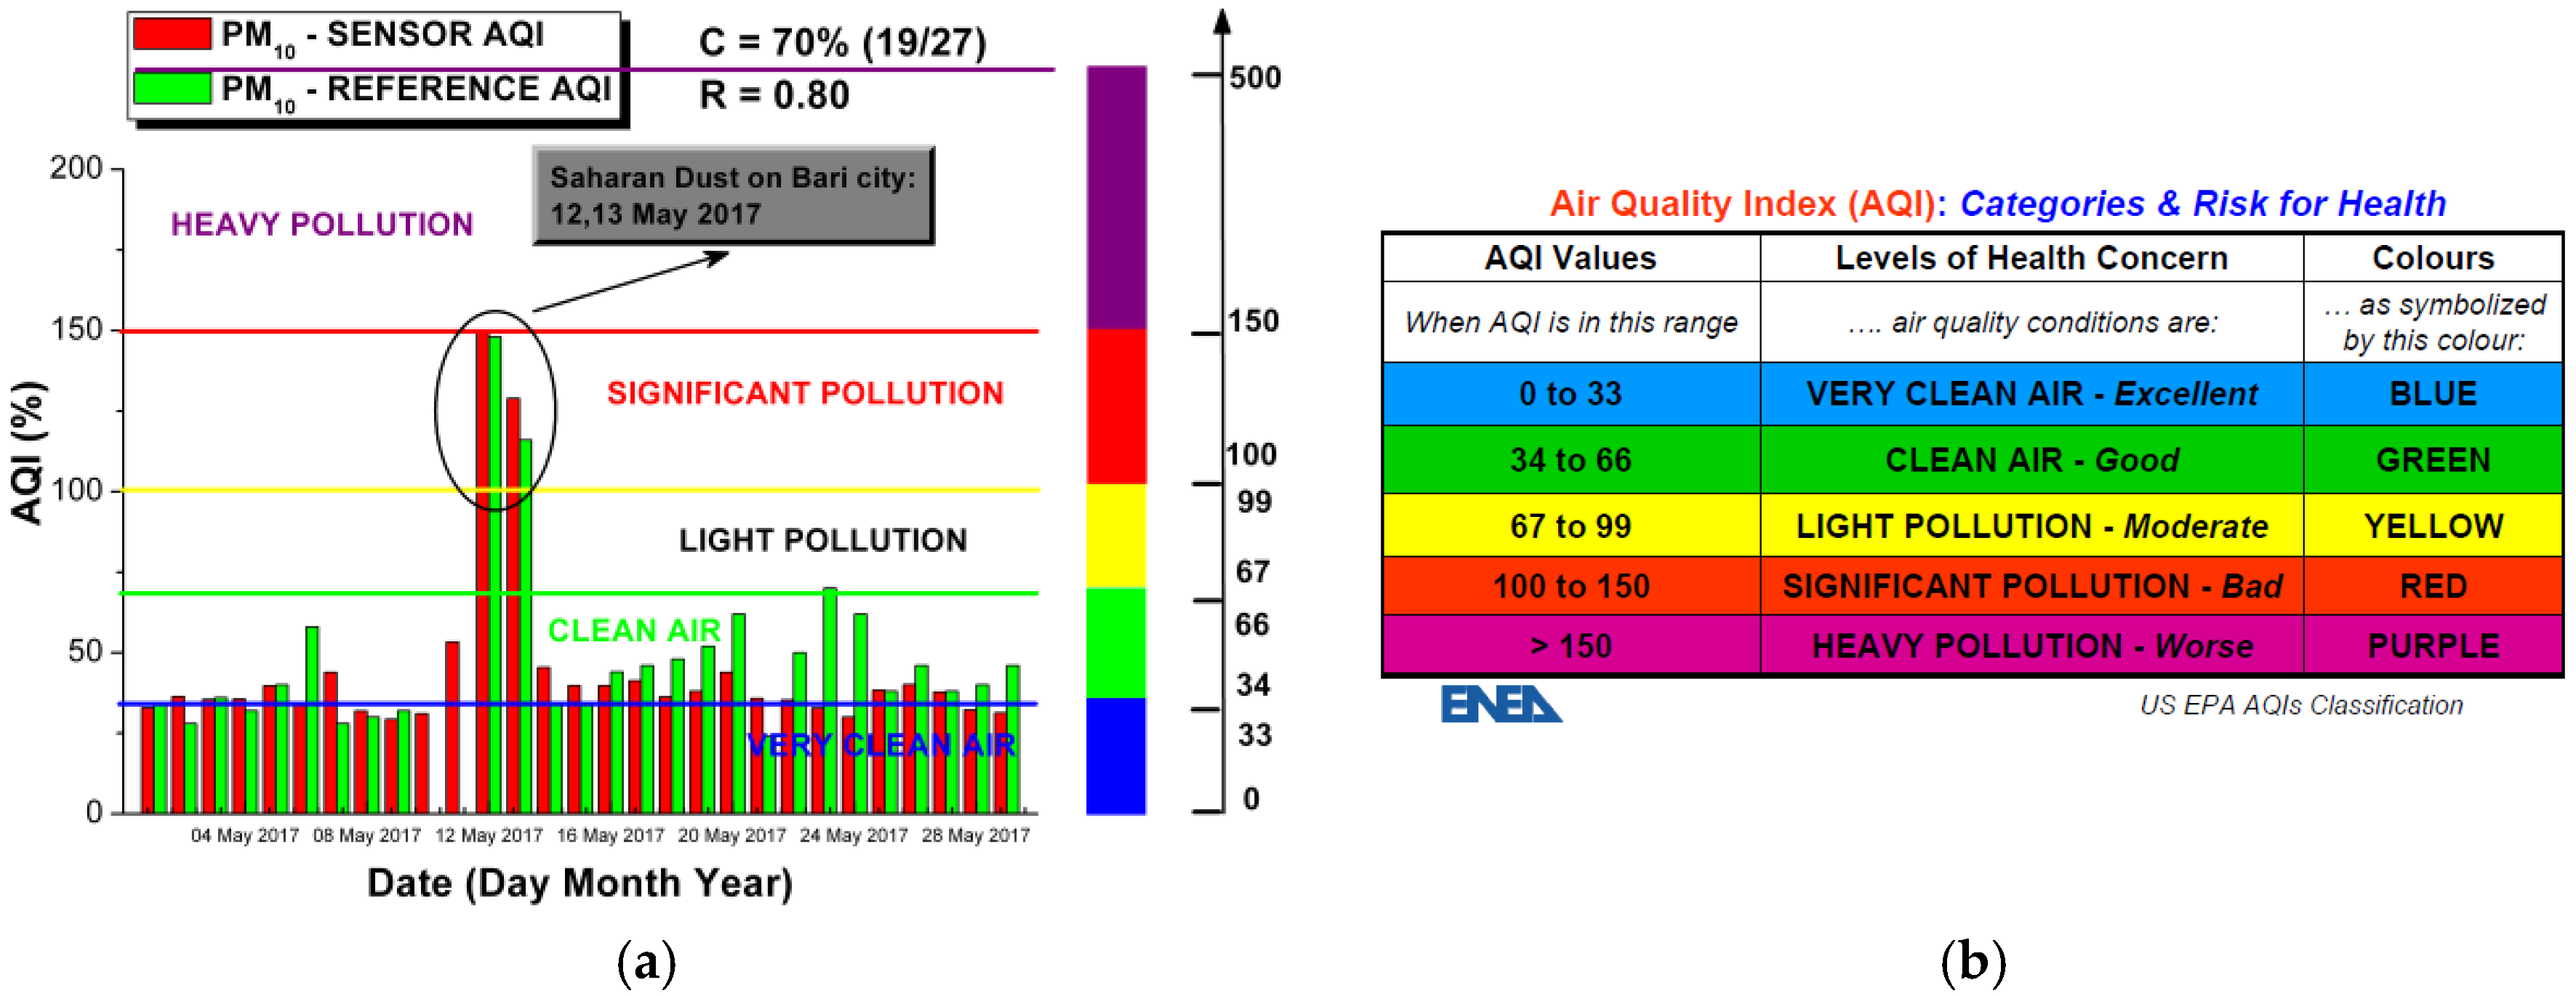
Figure 4 shows the PM10 AQI measured by sensor-node 6 (airport) and compared to closest air quality monitoring station (EN2 Modugno) on May 2017. A Saharan dust event at Bari city during 12 and 13 May 2017 has been detected by the sensors, as officially certified by ARPA-Puglia. A PM10 peak of significant pollution was detected by all network sensors deployed in the city. For sensor-node 6 (airport), a good correlation coefficient (R = 0.80) and a high classification coefficient (C = 70%) have been measured for AQI by comparison sensor-versus-analyzer, as shown in Figure 4.
3.3. Air Quality Mobile Sensing
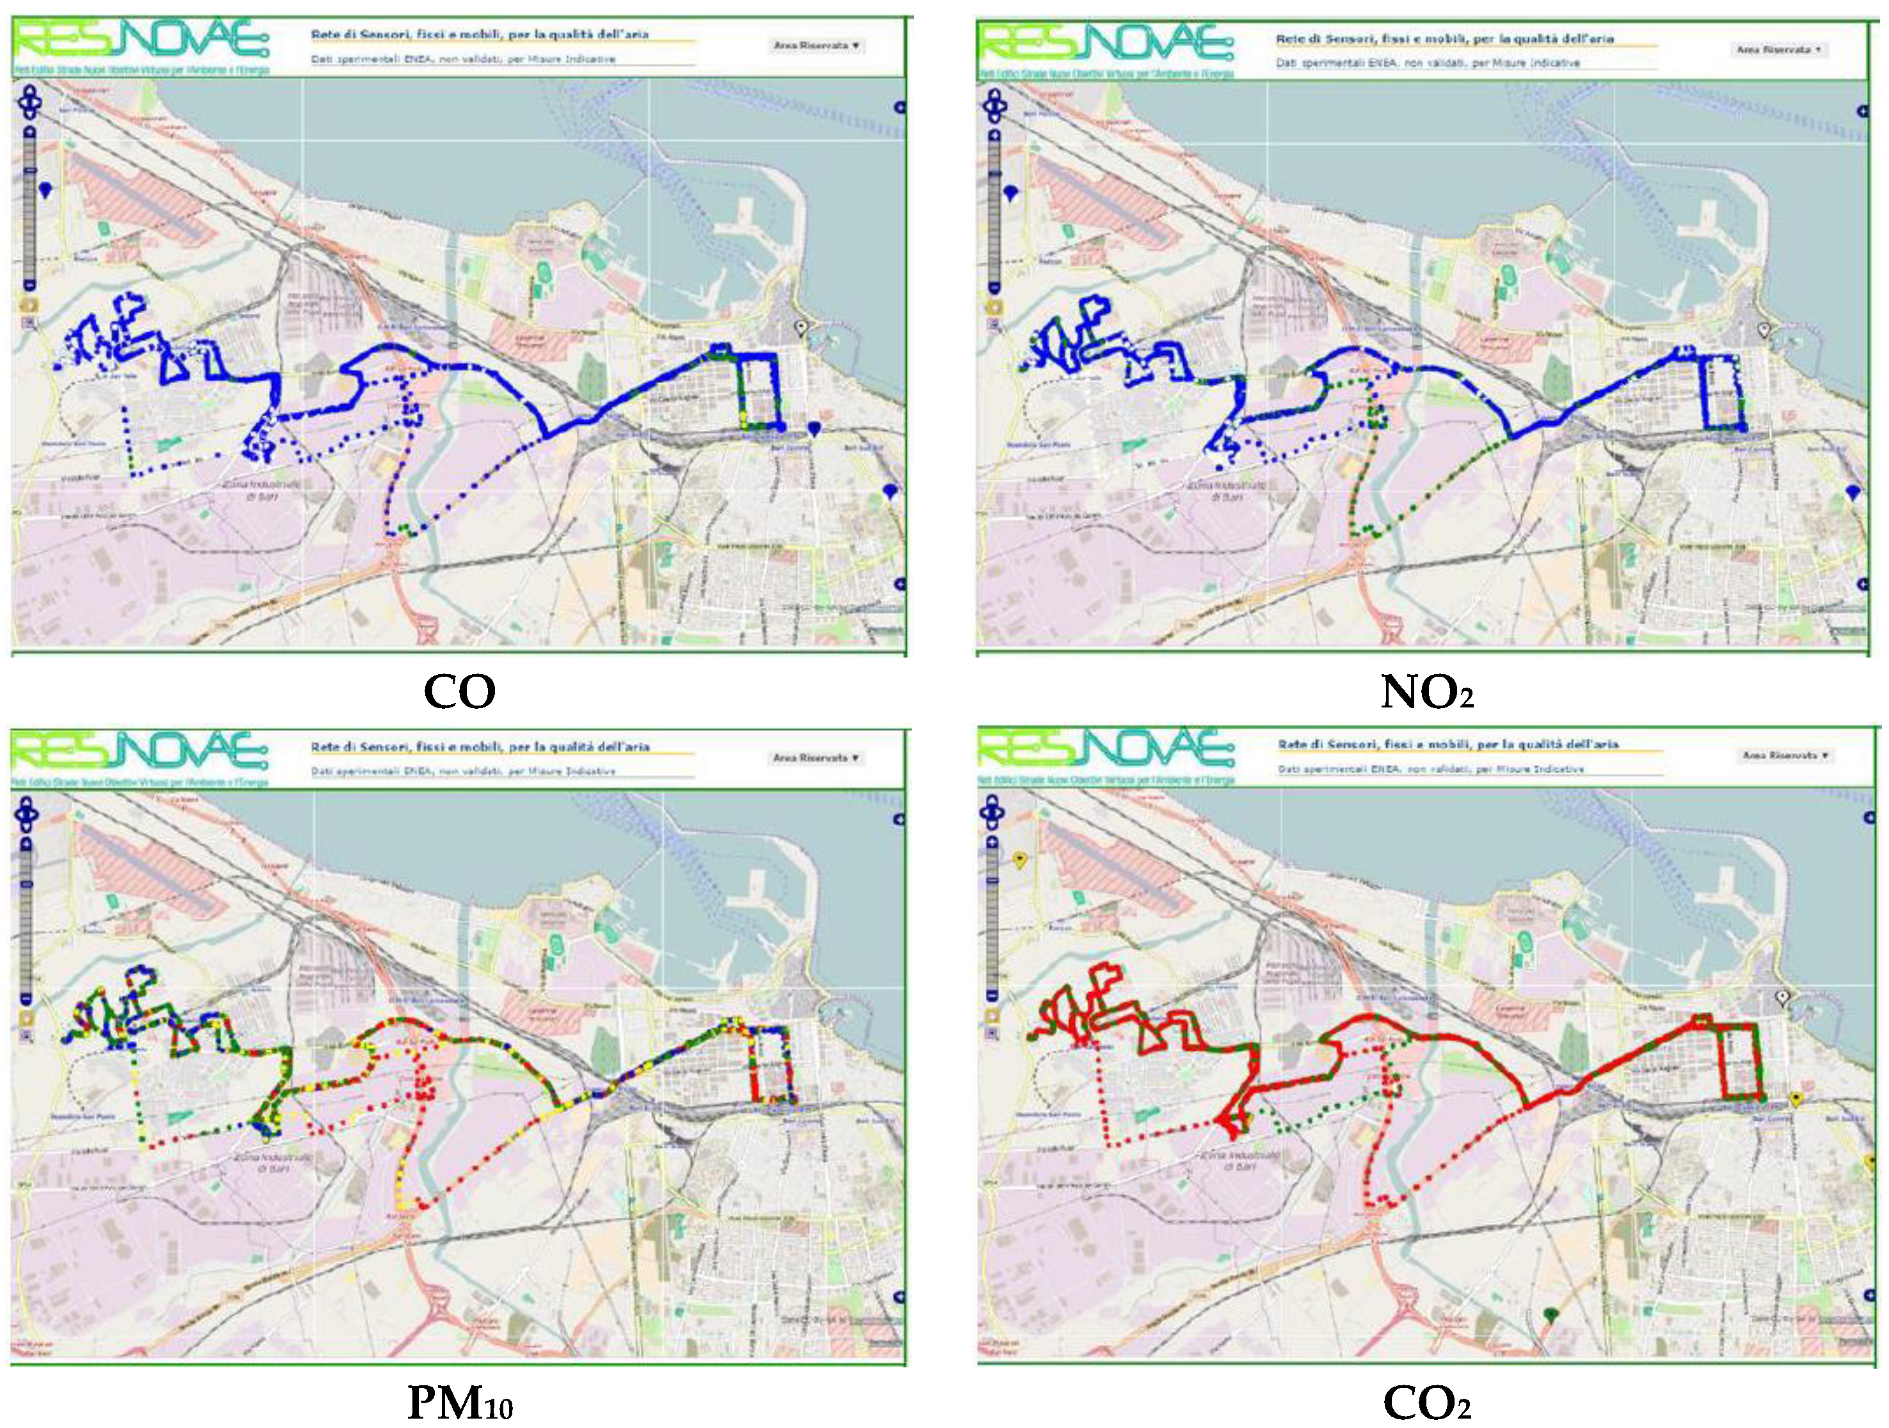
A mobile sensor-system AIRBOX based on low-cost sensors has been mounted on a public bus (AMTAB) running in Bari (Italy) for urban air quality monitoring. By exploiting this cost-effective sensor-system, it is possible to use a mobile node on public bus to achieve fine-grained monitoring, because when a public bus is moving, it could conduct environmental measurements at different locations in an urban micro-climate monitoring scenario to enhance environmental awareness of the citizens by mobile sensor-nodes at high spatial and temporal resolution. Figure 5 shows typical CO, NO2, PM10 and CO2 AQI trend measured on 9 November 2015 by a mobile sensor-node installed on a public bus circulating in the Bari city. The colors (blue, green, yellow, red, purple) of the marked positions are correlated to the risk classification of the air pollution for human health, as agreed in the EPA AQI standard for each pollutant. A global AQI including all pollutants should be defined.
4. Summary and Conclusions
The results indicate that these low-cost sensing solutions are promising for air quality monitoring in order to address the data quality objective (DQO) of the Indicative Measurements (Directive 2008/50/EC) [3] but intensive re-calibration in long-term operation is crucial for better accuracy. Co-location of low-cost sensors and reference instruments is a valid approach to improve data quality of the urban WSN. The use of the low-cost networked sensors for urban air quality monitoring is expected to grow with cloud data storage and IoT applications.
Acknowledgments
This work was financially supported by Italian project RES-NOVAE (PON04a2_E) Networks, Buildings, Streets—New Challenging Targets for Environment and Energy funded by the Italian Ministry of High Schools, University and Research (MIUR). The authors wish to thank ARPA-Puglia for official air quality public data and ENEL, AMTAB and Aeroporti di Puglia to host a sensor-node during the campaign.
Conflicts of Interest
The authors declare no conflict of interest. The founding sponsors had no role in the design of the study; in the collection, analyses, or interpretation of data; in the writing of the manuscript, and in the decision to publish the results.
References
- United Nations Environment Programme. UN Environment Program 2016 Report; United Nations Environment Programme: Nairobi, Kenya.
- European Environment Agency. Air Quality in Europe 2016 Report; European Environment Agency: Copenhagen, Denmark.
- EU Air Quality Directive 2008/50/EC. Available online: http://ec.europa.eu/environment/air/quality/legislation/existing_leg.htm (accessed on 1 August 2017).
- Penza, M. COST Action TD1105—European Network on New Sensing Technologies for Air Pollution Control and Environmental Sustainability—Overview & Plans. Procedia Eng. 2015, 120, 476–479. [Google Scholar]
- Borrego, C.; Costa, A.M.; Ginja, J.; Amorim, M.; Coutinho, M.; Karatzas, K.; Katsifarakis, N.; Konstantinidis, K.; De Vito, S.; Esposito, E.; et al. Assessment of air quality microsensors versus reference methods: The EuNetAir joint exercise. Atmos. Environ. 2016, 147, 246–263. [Google Scholar] [CrossRef]
- EuNetAir. Available online: www.cost.eunetair.it (accessed on 2 July 2017).
Figure 1.
Map of: (a) air quality monitoring stations (10 units) managed by ARPA-Puglia, environmental protection local authority, in the Bari city; (b) wireless sensors network based on 10 low-cost stationary nodes deployed for urban air quality monitoring and operated by ENEA.
Figure 1.
Map of: (a) air quality monitoring stations (10 units) managed by ARPA-Puglia, environmental protection local authority, in the Bari city; (b) wireless sensors network based on 10 low-cost stationary nodes deployed for urban air quality monitoring and operated by ENEA.

Figure 2.
(a) Virtual Private Network (VPN) by ENEA (Brindisi Research Center) to manage the deployed air quality sensor network; (b) Selected locations in Bari (Italy) of the installed stationary nodes AIRBOX for urban air quality monitoring operated by ENEA.
Figure 2.
(a) Virtual Private Network (VPN) by ENEA (Brindisi Research Center) to manage the deployed air quality sensor network; (b) Selected locations in Bari (Italy) of the installed stationary nodes AIRBOX for urban air quality monitoring operated by ENEA.

Figure 3.
(a) Trend of the PM10 monthly mean (January–December 2016) measured in the Node 1 (ENEL), Node 2 (ENEA) and Node 6 (Airport) by AIRBOX sensors deployed at Bari (Italy) for air quality monitoring; (b) Trend of the PM10 monthly mean (January–December 2016) measured in the Node 2 (ENEA) by AIRBOX sensor (PPD20V, Shinyei) compared to the official reference data of the air quality monitoring station (Via Caldarola) in Bari (Italy) managed by ARPA-Puglia.

Figure 4.
(a) PM10 AQI measured by AIRBOX sensor (PPD20V, Shinyei) in the Node 6 (Airport) versus analyzer (ARPA-Puglia—EN2 Modugno) in Bari on May 2017; (b) Classification US EPA for AQI standard to assign risk categories to human health due to personal exposure to air pollution.
Figure 4.
(a) PM10 AQI measured by AIRBOX sensor (PPD20V, Shinyei) in the Node 6 (Airport) versus analyzer (ARPA-Puglia—EN2 Modugno) in Bari on May 2017; (b) Classification US EPA for AQI standard to assign risk categories to human health due to personal exposure to air pollution.

Figure 5.
Typical CO, NO2, PM10 and CO2 air quality index (AQI) trend (1 min average on 9 November 2015) of the mobile sensor-node installed on the roof of a public bus (AMTAB) circulating in Bari (Italy).
Figure 5.
Typical CO, NO2, PM10 and CO2 air quality index (AQI) trend (1 min average on 9 November 2015) of the mobile sensor-node installed on the roof of a public bus (AMTAB) circulating in Bari (Italy).


Table 1.
MAE and accuracy of the PM10 AIRBOX Node 1 (ENEL), Node 2 (ENEA) and Node 6 (AIRPORT) of the ENEA WSN compared to the official reference data published by ARPA-Puglia.
Table 1.
MAE and accuracy of the PM10 AIRBOX Node 1 (ENEL), Node 2 (ENEA) and Node 6 (AIRPORT) of the ENEA WSN compared to the official reference data published by ARPA-Puglia.
| Node 1 | Node 2 | Node 6 | ||||
|---|---|---|---|---|---|---|
| MAE 1 (µg/m3) | Accuracy 2 (%) | MAE (µg/m3) | Accuracy (%) | MAE (µg/m3) | Accuracy (%) | |
| PM10—2016 | 5.6 | 24.8 | 5.6 | 21.6 | 5.6 | 20.5 |
1 MAE = Mean Absolute Error; 2 Accuracy is defined as percentage ratio MAE divided reference data mean.
© 2017 by the authors. Licensee MDPI, Basel, Switzerland. This article is an open access article distributed under the terms and conditions of the Creative Commons Attribution (CC BY) license (http://creativecommons.org/licenses/by/4.0/).
Share and Cite
MDPI and ACS Style
Penza, M.; Suriano, D.; Pfister, V.; Prato, M.; Cassano, G. Urban Air Quality Monitoring with Networked Low-Cost Sensor-Systems. Proceedings 2017, 1, 573. https://0-doi-org.brum.beds.ac.uk/10.3390/proceedings1040573
AMA Style
Penza M, Suriano D, Pfister V, Prato M, Cassano G. Urban Air Quality Monitoring with Networked Low-Cost Sensor-Systems. Proceedings. 2017; 1(4):573. https://0-doi-org.brum.beds.ac.uk/10.3390/proceedings1040573
Chicago/Turabian StylePenza, Michele, Domenico Suriano, Valerio Pfister, Mario Prato, and Gennaro Cassano. 2017. "Urban Air Quality Monitoring with Networked Low-Cost Sensor-Systems" Proceedings 1, no. 4: 573. https://0-doi-org.brum.beds.ac.uk/10.3390/proceedings1040573