Features Observed Using Multiple Inertial Sensors for Running Track and Hard-Soft Sand Running: A Comparison Study †

 , , ,
, , , 
Abstract
:1. Introduction
2. Materials and Methods
2.1. Materials
2.2. Methods
3. Results
3.1. Player Load
3.2. Gait Analysis
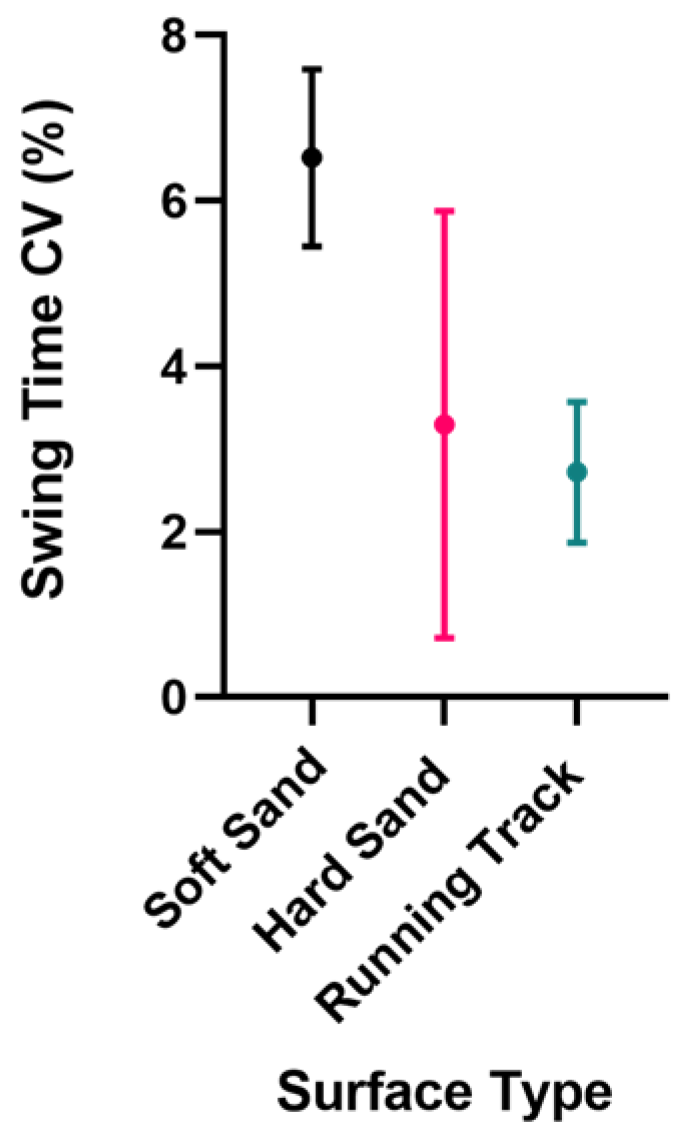
3.2.1. Swing Time
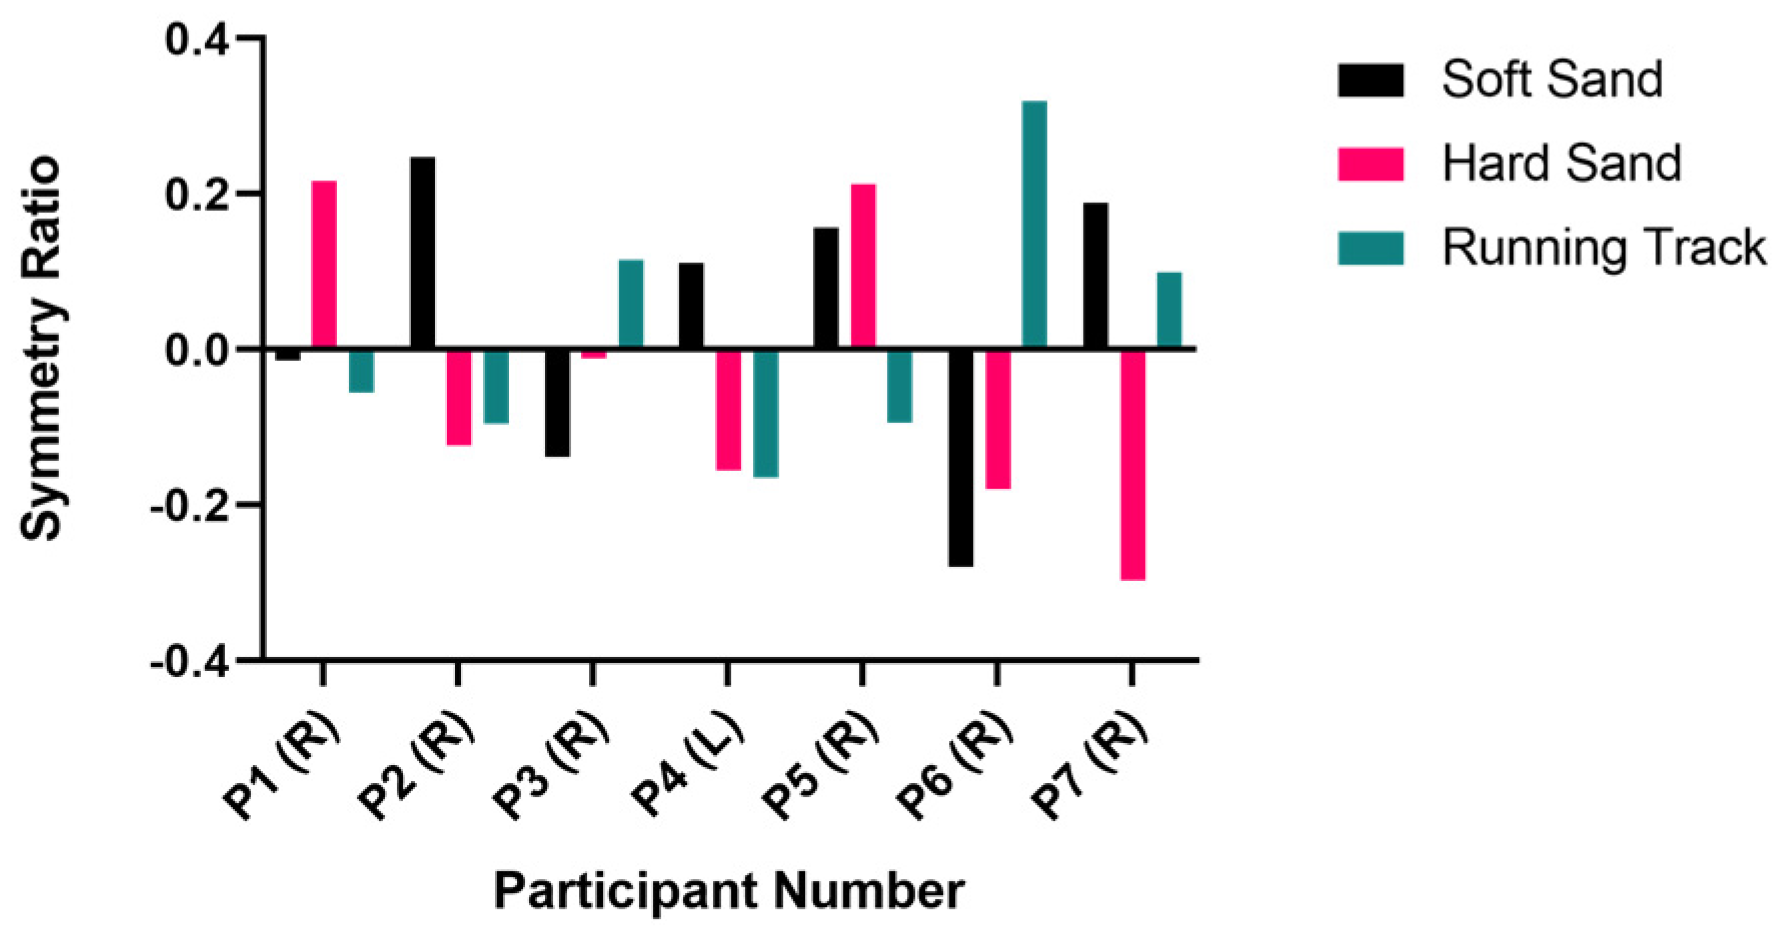
3.2.2. Symmetry
4. Discussion
5. Conclusions
Acknowledgments
Conflicts of Interest
References
- Dugan, S.A.; Bhat, K.P. Biomechanics and analysis of running gait. Phys. Med. Rehabil. Clin. N. Am. 2005, 16, 603–621. [Google Scholar] [CrossRef] [PubMed]
- Espinosa, H.G.; Shepherd, J.B.; Thiel, D.V.; Worsey, M.T.O. Anytime, anywhere! Inertial sensors monitor sports performance. IEEE Potentials 2019, 38, 11–16. [Google Scholar] [CrossRef]
- Worsey, M.T.O.; Pahl, R.; Thiel, D.V.; Milburn, P.D. A comparison of computational methods to determine intrastroke velocity in swimming using IMUs. IEEE Sens. Lett. 2018, 2, 1–4. [Google Scholar] [CrossRef]
- Worsey, M.; Espinosa, H.; Shepherd, J.; Thiel, D. Inertial sensors for performance analysis in combat sports: A systematic review. Sports 2019, 7, 28. [Google Scholar] [CrossRef] [PubMed]
- Lee, J.B.; Mellifont, R.B.; Burkett, B.J. The use of a single inertial sensor to identify stride, step, and stance durations of running gait. J. Sci. Med. Sport 2010, 13, 270–273. [Google Scholar] [CrossRef] [PubMed]
- Lee, J.B.; Sutter, K.J.; Askew, C.D.; Burkett, B.J. Identifying symmetry in running gait using a single inertial sensor. J. Sci. Med. Sport 2010, 13, 559–563. [Google Scholar] [CrossRef] [PubMed]
- Little, C.; Lee, J.B.; James, D.A.; Davison, K. An evaluation of inertial sensor technology in the discrimination of human gait. J. Sports Sci. 2013, 31, 1312–1318. [Google Scholar] [CrossRef] [PubMed]
- Thiel, D.V.; Shepherd, J.; Espinosa, H.G.; Kenny, M.; Fischer, K.; Worsey, M.; Matsuo, A.; Wada, T. Predicting ground reaction forces in sprint running using a shank mounted inertial measurement unit. Proceedings 2018, 2, 199. [Google Scholar]
- Einicke, G.A.; Sabti, H.A.; Thiel, D.V.; Fernandez, M. Maximum-entropy-rate selection of features for classifying changes in knee and ankle dynamics during running. IEEE J. Biomed. Health Inform. 2018, 22, 1097–1103. [Google Scholar] [CrossRef] [PubMed]
- Wixted, A.J.; Billing, D.C.; James, D.A. Validation of trunk mounted inertial sensors for analysing running biomechanics under field conditions, using synchronously collected foot contact data. Sports Eng. 2010, 12, 207–212. [Google Scholar] [CrossRef]
- Binnie, M.J.; Dawson, B.; Pinnington, H.; Landers, G.; Peeling, P. Sand training: A review of current research and practical applications. J. Sports Sci. 2014, 32, 8–15. [Google Scholar] [CrossRef] [PubMed]
- Chelius, G.; Braillon, C.; Pasquier, M.; Horvais, N.; Gibollet, R.P.; Espiau, B.; Azevedo Coste, C. A wearable sensor network for gait analysis: A six-day experiment of running through the desert. IEEEASME Trans. Mechatron. 2011, 16, 878–883. [Google Scholar] [CrossRef]
- Thiel, D.V.; Worsey, M.T.O.; Klodzinksi, F.; Emerson, N.; Espinosa, H.G. A penetrometer for quantifying the surface stiffness of sport sand surfaces. MDPI Proceedings 2020, 49. (accepted for publication). [Google Scholar]
- Lai, A.; James, D.A.; Hayes, J.P.; Harvey, E.C. Semi-Automatic Calibration Technique Using Six Inertial Frames of Reference; International Society for Optics and Photonics: Bellingham, WA, USA, 2004; pp. 531–542. [Google Scholar]
- Foster, C.; Hector, L.L.; Welsh, R.; Schrager, M.; Green, M.A.; Snyder, A.C. Effects of specific versus cross-training on running performance. Eur. J. Appl. Physiol. 1995, 70, 367–372. [Google Scholar] [CrossRef] [PubMed]
- Impellizzeri, F.M.; Rampinini, E.; Coutts, A.J.; Sassi, A.; Marcora, S.M. Use of RPE-based training load in soccer: Med. Sci. Sports Exerc. 2004, 36, 1042–1047. [Google Scholar] [CrossRef] [PubMed]
- Catapult Fundamentals: What Can PlayerLoad Tell Me about Athlete Work? Available online: https://www.catapultsports.com/blog/fundamentals-playerload-athlete-work (accessed on 3 October 2019).
- Fraccaro, P.; Walsh, L.; Doyle, J.; O’Sullivan, D. Real-world gyroscope-based gait event detection and gait feature extraction. In Proceedings of the 6th International Conference on eHealth, Telemedicine, and Social Medicine, Barcelona, Spain, 23–27 March 2014. [Google Scholar]
- Greene, B.R.; McGrath, D.; O’Neill, R.; O’Donovan, K.J.; Burns, A.; Caulfield, B. An adaptive gyroscope-based algorithm for temporal gait analysis. Med. Biol. Eng. Comput. 2010, 48, 1251–1260. [Google Scholar] [CrossRef] [PubMed]
- Vincent, H.K.; Herman, D.C.; Lear-Barnes, L.; Barnes, R.; Chen, C.; Greenberg, S.; Vincent, K.R. Setting standards for medically-based running analysis. Curr. Sports Med. Rep. 2014, 13, 275–283. [Google Scholar] [CrossRef] [PubMed]


| Participant | Gender | Age (Yrs) | Mass (Kg) | Height (cm) | Preferred Foot | Training Hours/Week | Current Injuries | Past Injuries That May Affect Performance | List of Physical Activity and Sport |
|---|---|---|---|---|---|---|---|---|---|
| 1 | F | 21 | 55.5 | 162 | R | 10 | No | No | Running/ Rugby/Strength and Conditioning |
| 2 | M | 69 | 91 | 183 | R | 4 | No | No | - |
| 3 | M | 22 | 61 | 173 | R | 3 | No | No | Running/Strength and Conditioning |
| 4 | M | 43 | 87 | 182 | L | 1 | No | No | Tennis |
| 5 | F | 22 | 64 | 167 | R | 1.5 | No | No | Strength and Conditioning/Boxing |
| 6 | M | 23 | 84 | 175 | R | 5 | No | No | Strength and Conditioning /Soccer |
| 7 | F | 27 | 51 | 161 | R | 4 | No | No | - |
Publisher’s Note: MDPI stays neutral with regard to jurisdictional claims in published maps and institutional affiliations. |
© 2020 by the authors. Licensee MDPI, Basel, Switzerland. This article is an open access article distributed under the terms and conditions of the Creative Commons Attribution (CC BY) license (https://creativecommons.org/licenses/by/4.0/).
Share and Cite
Worsey, M.T.O.; Espinosa, H.G.; Shepherd, J.B.; Lewerenz, J.; Klodzinski, F.S.M.; Thiel, D.V. Features Observed Using Multiple Inertial Sensors for Running Track and Hard-Soft Sand Running: A Comparison Study. Proceedings 2020, 49, 12. https://0-doi-org.brum.beds.ac.uk/10.3390/proceedings2020049012
Worsey MTO, Espinosa HG, Shepherd JB, Lewerenz J, Klodzinski FSM, Thiel DV. Features Observed Using Multiple Inertial Sensors for Running Track and Hard-Soft Sand Running: A Comparison Study. Proceedings. 2020; 49(1):12. https://0-doi-org.brum.beds.ac.uk/10.3390/proceedings2020049012
Chicago/Turabian StyleWorsey, Matthew T. O., Hugo G. Espinosa, Jonathan B. Shepherd, Julian Lewerenz, Florian S. M. Klodzinski, and David V. Thiel. 2020. "Features Observed Using Multiple Inertial Sensors for Running Track and Hard-Soft Sand Running: A Comparison Study" Proceedings 49, no. 1: 12. https://0-doi-org.brum.beds.ac.uk/10.3390/proceedings2020049012