1. Introduction
Chemical gas sensors are among the basic technologies for the detection of hazardous and pollutant gases. These electronic devices offer a wide variety of advantages over traditional analytical instruments such as small size, easy manipulation, low costs and low power consuming [
1].
Metal oxides represent a very promising material for such kind of applications; they possess a broad range of electronic, chemical, and physical properties that allow them to be widely used and investigated in the detection of volatiles and other gases [
2]. In this context, one of the most interesting metal oxide is tin oxide (SnO
2), a n-type semiconductor with a direct wide band gap 3.62 eV at 300 K, and a variety of potential applications such as transparent conducting electrodes, solar cells and most importantly in gas sensing technology [
3].
To develop a performing metal oxide gas sensor, it is essential to ensure a qualified sensor response measurement. Most of the chemical/physics processes occurring at the sensor surface are all influenced by the testing chamber design and so it is necessary to adjust it, in order to satisfy all sensor behavior needs. Most of the published works focused on the enhancement of a sensor response by using nanostructures, catalyst nanoparticles or by the miniaturization of the transducers [
4]. However, few of them addressed the attention to a testing chamber design. Consequently, we study the influence of the design of a testing chamber on the sensor response.
The novelty of this work is the fabrication, modeling, and simulation of a new chamber design which is compared to a classical one, used in our lab.
2. Experimental
Gas sensors: The microelectromechanical systems (MEMS) based microsensor platform was patented by our laboratory and fabricated using clean room facilities and various micro-fabrication steps including photolithography, metallization and backside etching (DRIE) of the substrate to define the membrane. This latter has a size of 400 μm × 400 μm. It contains interdigitated electrodes and two heaters (
Figure 1a). The gap between the electrodes is equal to 4 μm, the resistance of each heater is 100 Ω and the associated temperature coefficient is 3 × 10
−3/°C.
SnO2 sensing layers (50 nm in thickness) were directly deposited over the microsensor platform, by reactive radio frequency (rf) magnetron sputtering using Edwards sputtering system. The substrates were cleaned with acetone and then with ethanol, dried with air, and then placed inside the shadow mask. A metal target of 99.99% purity with a diameter of 76.2 mm and thickness of 3.18 mm was used. The distance between this later and the sensor substrate was set to 50 mm. The temperature of the substrates was kept constant during film deposition at room temperature. The sputtering atmosphere consisted of argon (Ar) and oxygen (O2) mixed gas and the RF sputtering power was fixed to 200 W.
Testing chambers: Gas-sensing tests were carried out in two different chambers. The first one (
Figure 1b) was made of stainless steel with a total volume of 0.3 L, with 4 mm diameter inlet and outlet pipes. The sensor is optimally placed at the center of the internal space, in front of the gas flow direction. The gas flow rate ranges from 0.1 L/min to 1.5 L/min.
The second chamber (the new one) is illustrated by
Figure 1c. It was designed via a 3D designer software and fabricated from polylactic acid (PLA) using a three-dimensional printer. The total volume was around 2.35 10
-3L and the gas flow rate ranges between 0.01 L/min and 0.5 L/min. It has a boat shape with the inlet and outlet pipes perpendicular to the boat’s deck, like two masts. Additionally, the optimal sensor position is at the center of the boat’s bilge, tangential to the gas flow direction.
Gas sensing tests: Gas-sensing tests were carried out in both testing chambers (
Figure 1b,c) using a same continuous flow rate of 0.1 L/min. The chambers were exposed during 1 min to a testing gas composed of air and ethanol of different concentrations (1, 5, 10, 50 ppm) and subsequently purged with air until initial baseline resistance of the sensor was recovered. The sensor heater power consumption was maintained to 53 mW as an optimal working temperature (T = 300 °C). The studied gas concentration was calibrated and delivered by using an autonomous mass flow system.
The sensor response was defined as R = Ra/Rg, where Ra is the sensor resistance in air at stationary state and Rg represents the sensor resistance after 1 min of the gas-mixture exposure.
It is worth noting that all the mathematical modeling was performed using Star CCM+ software.
3. Results and Discussion
SnO
2 thin film has been successfully deposited onto the sensor transducer, via RF magnetron sputtering technique. The layer is highly homogeneous with a thickness of 50 nm (see
Figure 1a).
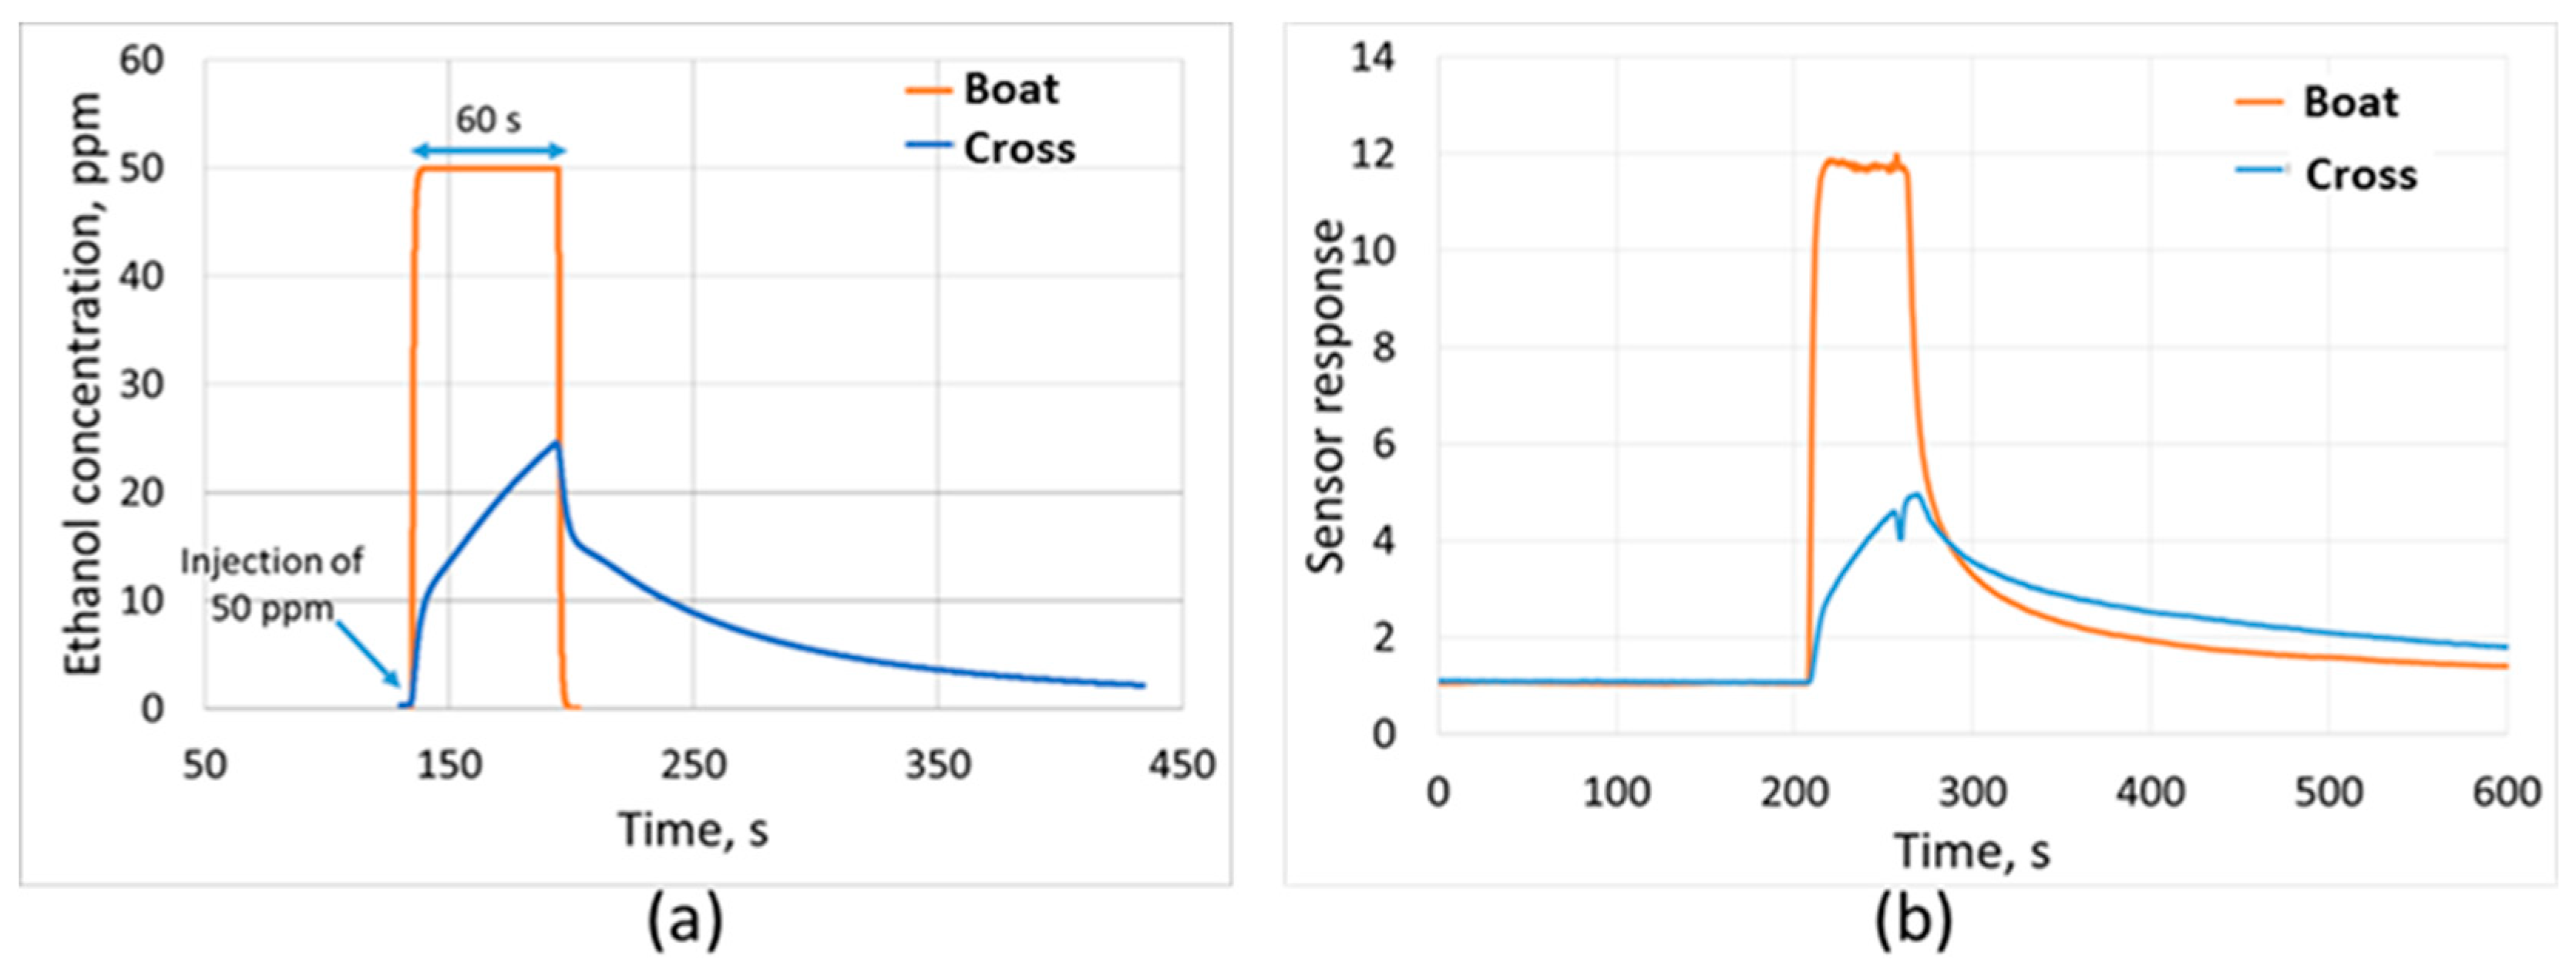
Gas concentration convection/diffusion is one of the most important parameter to be considered when designing the chamber.
Figure 2a shows the simulation results of the gas concentration convection/diffusion inside both chambers. As we can see, the speed of the filling and emptying of the boat chamber is much faster compared to the cross one. Additionally, the ethanol concentration simulated for the cross-chamber does not reach 50 ppm for an injection lasting 60 s. These results are validated by the real response of the sensor towards ethanol by using the same chambers (
Figure 2b). As a consequence, the volume and design of a testing chamber affect directly the homogeneity of the gas concentration and in turn the sensor response.
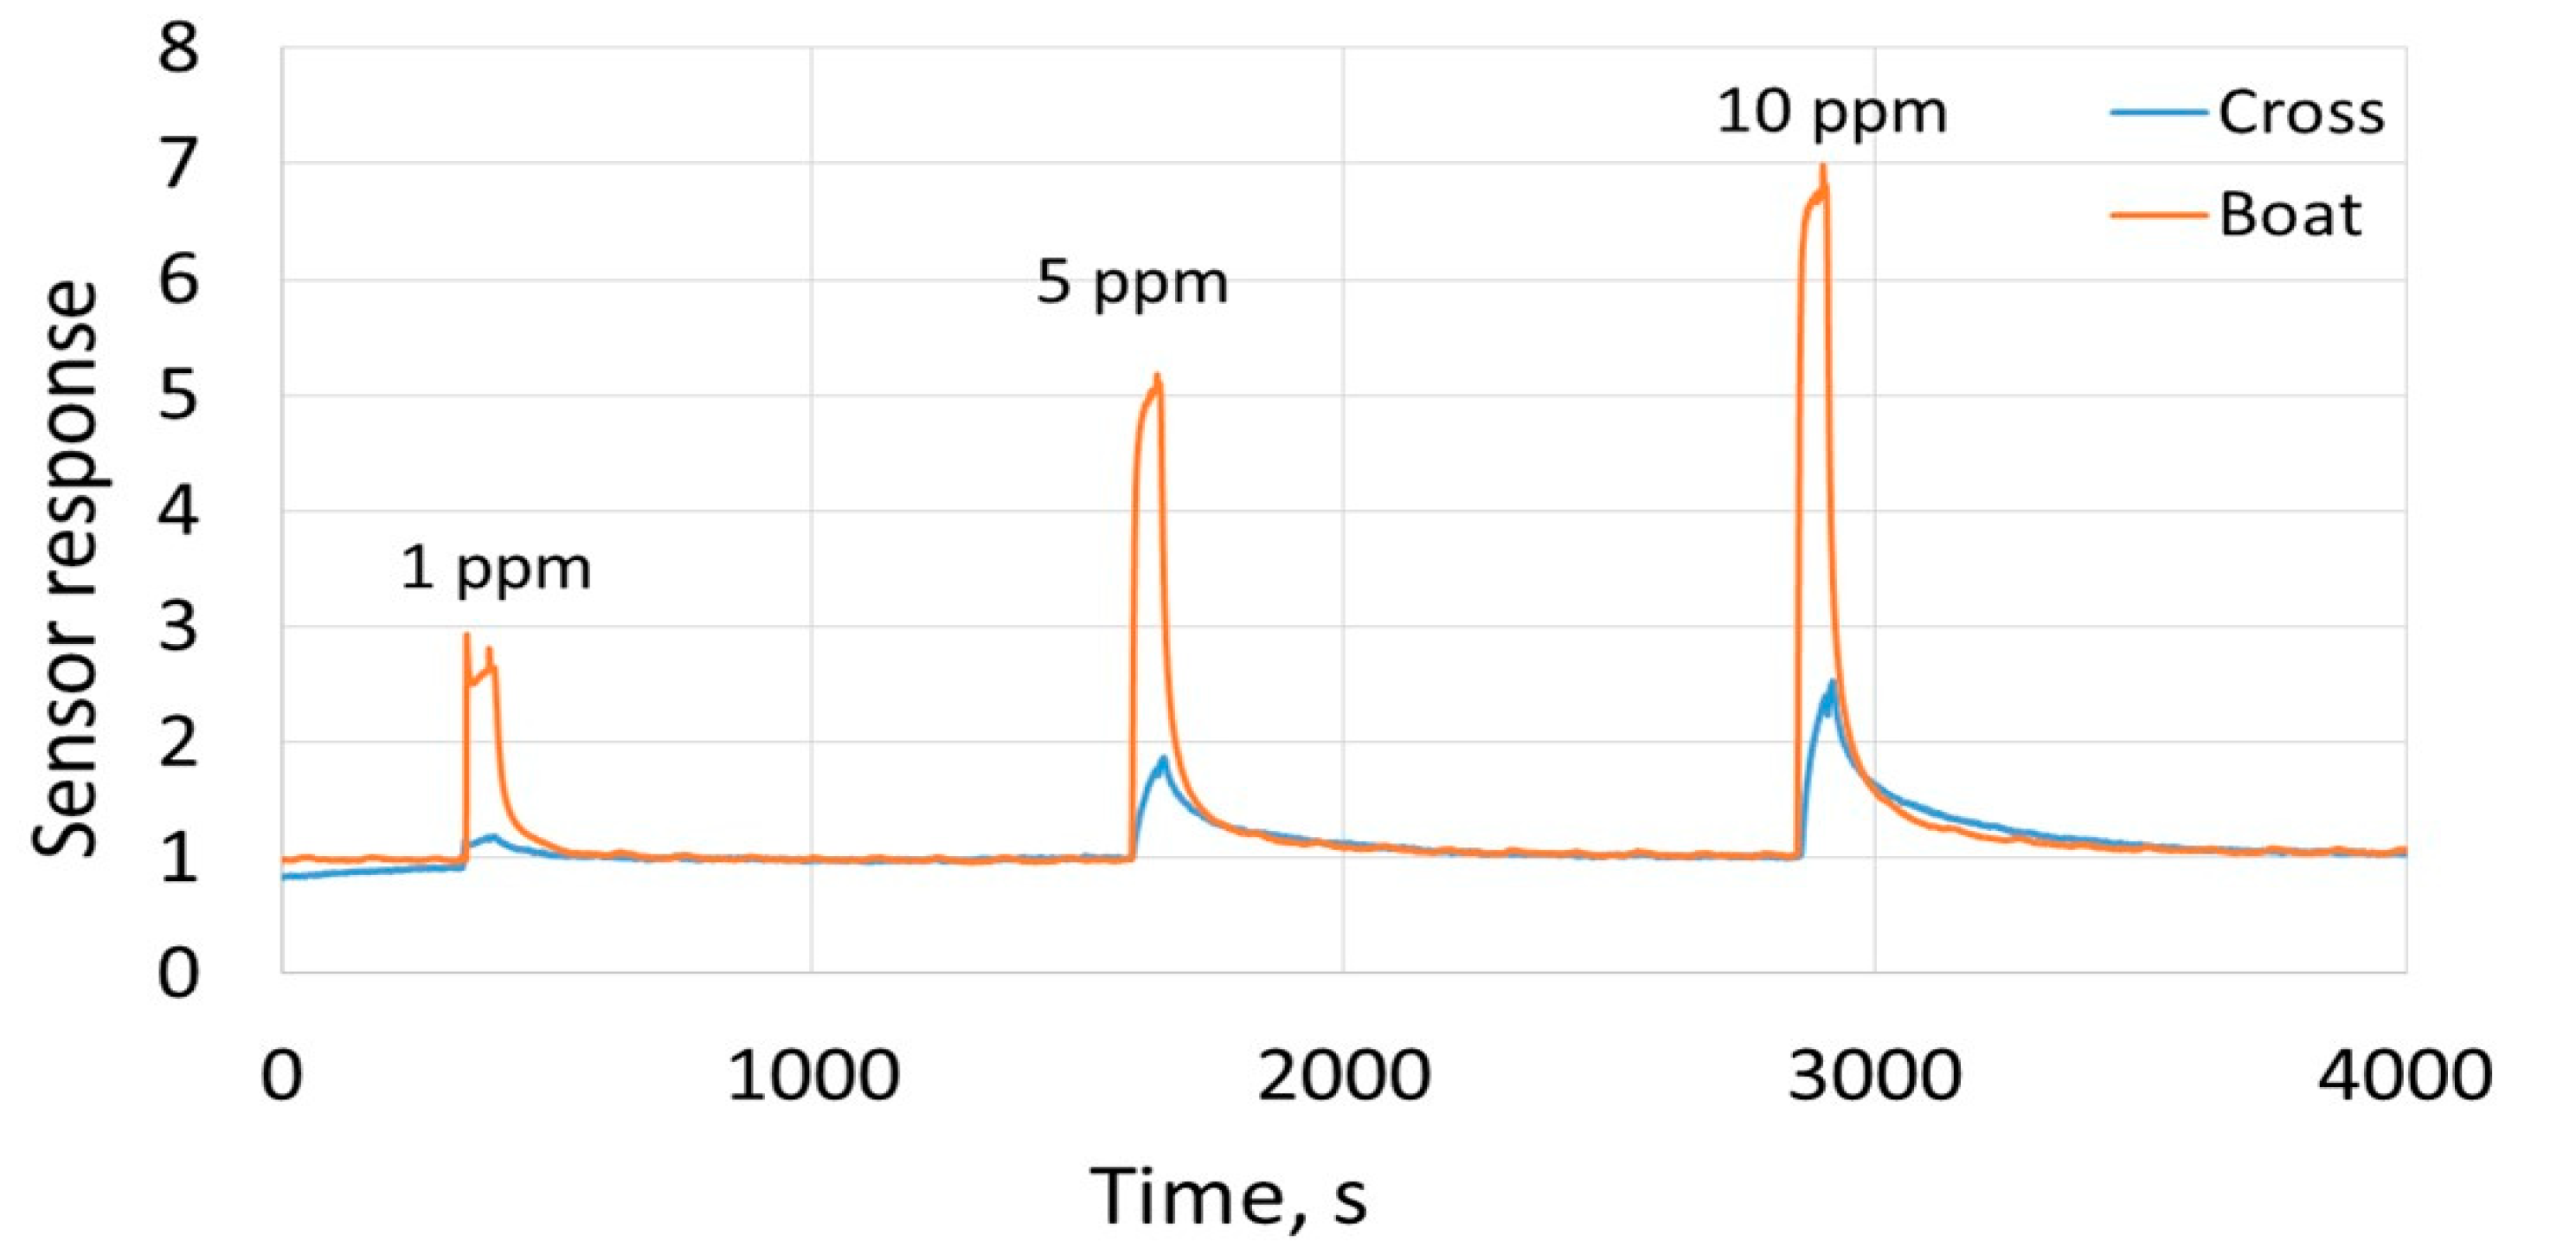
We have exposed our sensor to different concentrations of ethanol.
Figure 3 displayed the sensor response versus time. In the boat chamber, the sensor maintains a stable baseline resistance with fast and good responses. However, in the cross-chamber, a drift in the baseline resistance and lack of response to ethanol are observed, which is related to the big chamber volume.
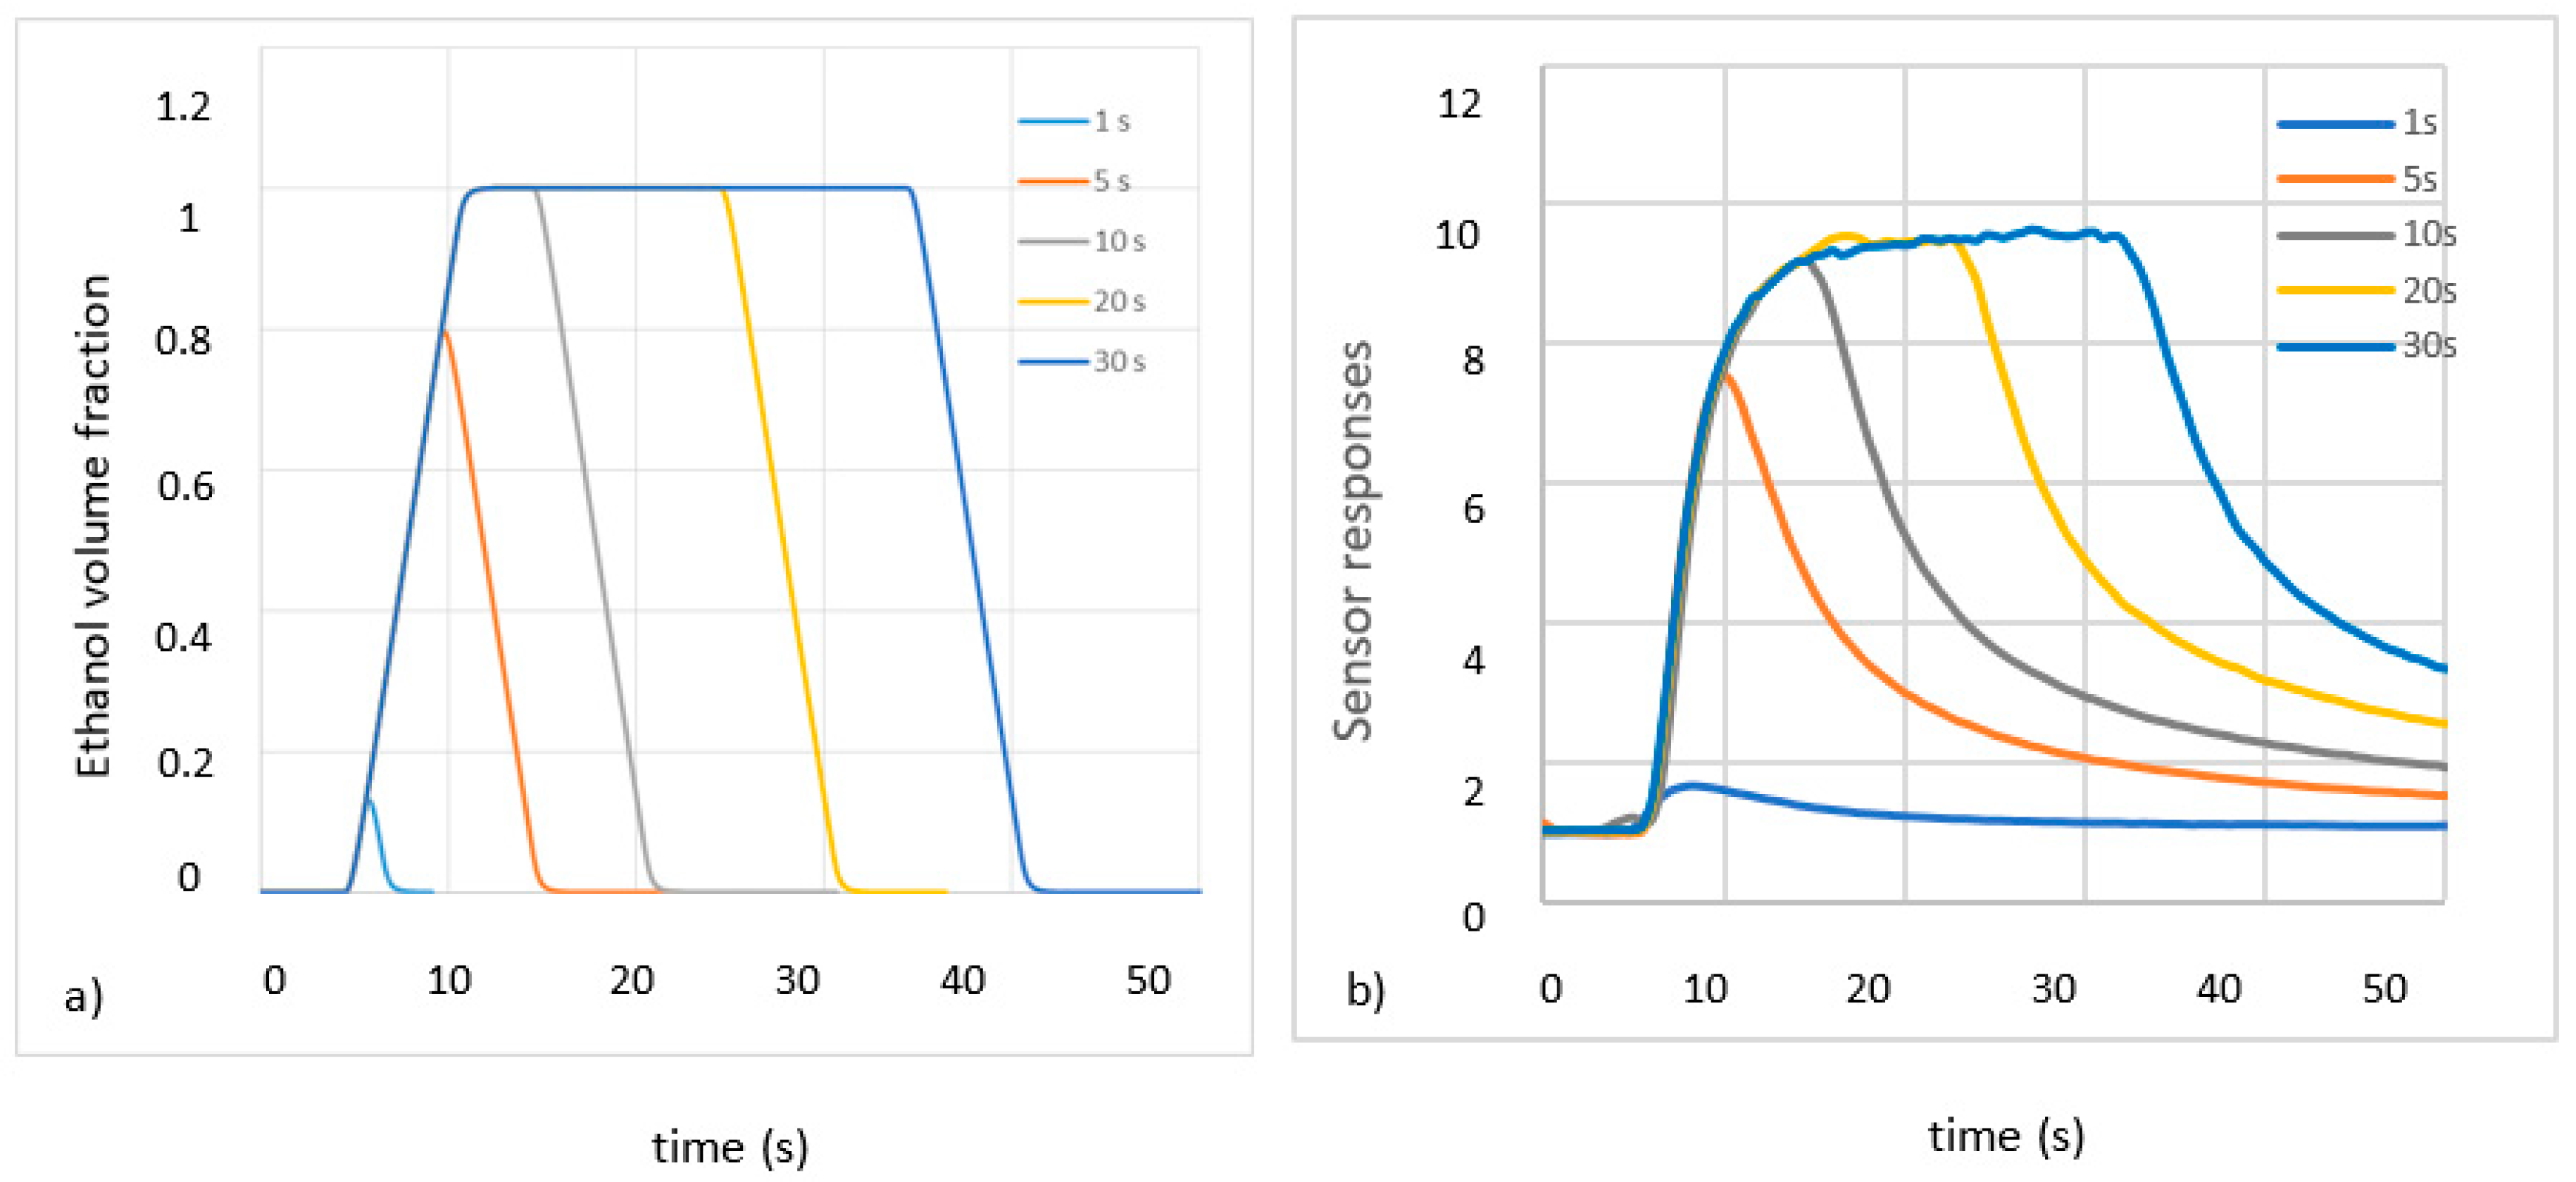
We have exposed our sensors towards 25 ppm of ethanol, using different injection times of 1 s, 5 s, 10 s, 20 s and 30 s. In parallel, we have modeled these injections using the new chamber model. The obtained results are depicted in
Figure 4. Clearly, there is a good agreement between the numerical results obtained with the proposed chamber model and the experimental sensor responses towards different ethanol exposure times. The dynamics of the gas diffusion coordinates very well with the real behavior of the sensor. It is worth noting that the sensor reaches the steady state after 10 s of exposure.
5. Conclusions
In this work, we have shown how the testing chamber design can affect the real behavior of the sensor regarding the target gas. The results indicate that with the proposed model we can ensure a qualified sensor measurement. Besides, the gas concentration is vastly homogenous and the set point is rapidly achieved. Additionally, the sensor responses are highly stable, fast and greater. The sensor reaches the steady state after 10 s of exposure.

 and
and 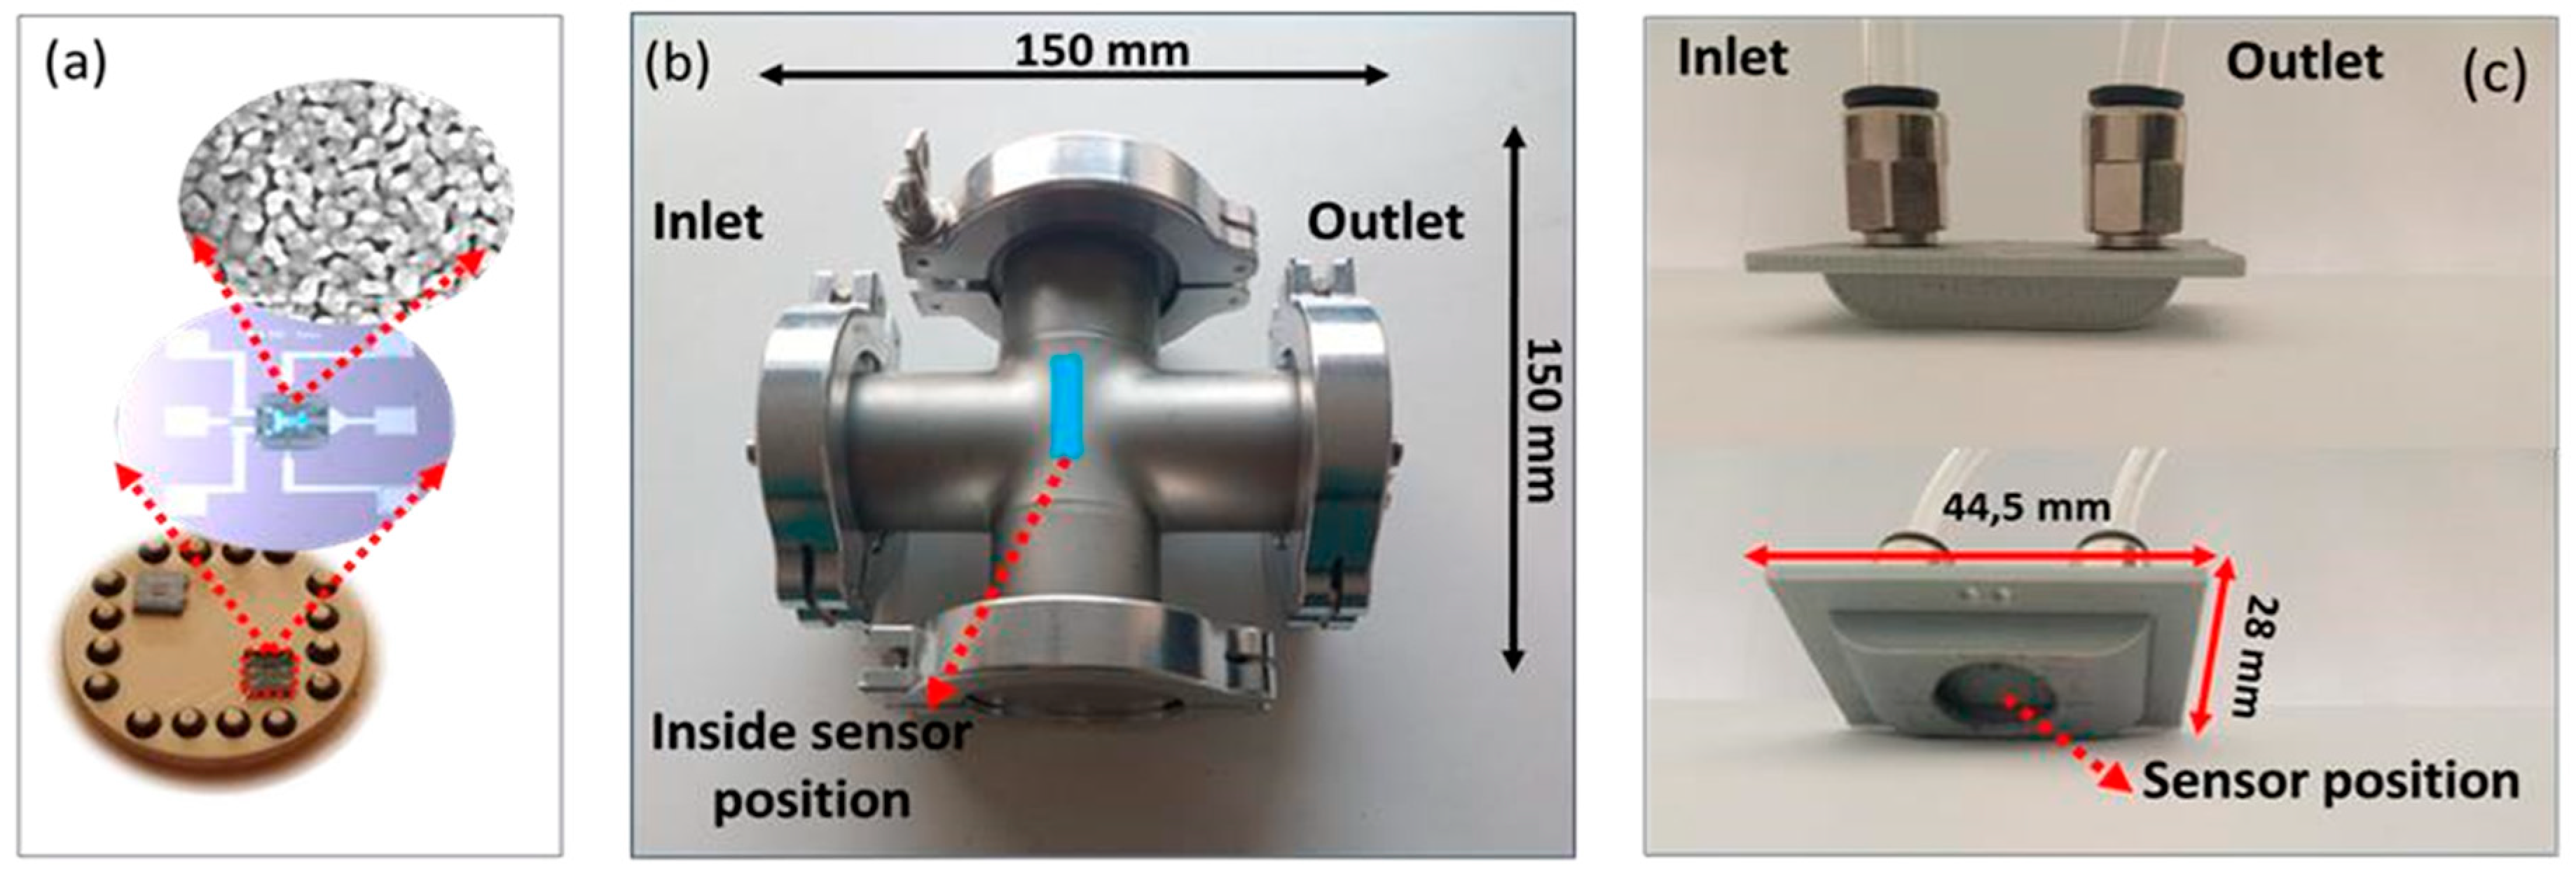


