Article

Extended Post-Curing Light Exposure and Sandblasting Effects on Surface Hydrophobicity of 3D-Printed Denture Base Resin

1
Department of Oral Biology and Pathology, School of Dental Medicine, Stony Brook University, Stony Brook, NY 11794, USA
2
Department of Periodontology, School of Dental Medicine, Stony Brook University, Stony Brook, NY 11794, USA
3
Department of Prosthodontics and Digital Technology, School of Dental Medicine, Stony Brook University, Stony Brook, NY 11794, USA
*
Author to whom correspondence should be addressed.
Submission received: 13 January 2022 / Revised: 8 February 2022 / Accepted: 10 February 2022 / Published: 16 February 2022

Abstract

:
This in vitro study evaluated the surface hydrophobicity of 3D-printed denture base resin exposed to either an extended post-curing light exposure time or a sandblasting procedure. MATERIALS AND METHODS: Disk-shaped samples (diameter × height: 10 mm × 3 mm) were 3D-printed with stereolithography SLA technology using the denture-base resin. Samples were divided into three groups: control, extended UV-post-curing, and sandblasted. The surface roughness parameters for each group were calculated, and the surface hydrophobicity was evaluated by measuring the drop contact angle. Analysis was done using the T-test; significance was when p < 0.05. RESULTS: The comparison of surface roughness parameters showed significant differences between the control group and the sandblasted group (Sa: p = 0.001, Sz: p < 0.001, Str: p < 0.001, Spc: p = 0.044) as well as between the extended-cure group and the sandblasted group (Sa: p = 0.006, Sz: p < 0.001, Str: p < 0.001, Spc: p = 0.036) except for the Sdr measures. The surface hydrophobicity was also statistically lower in the sandblasted group compared to both the control and extended curing groups (p < 0.001). CONCLUSION: The sandblasting procedure created a less hydrophobic surface of the 3D-printed denture base resin, and the altered surface roughness could be a contributor to this observation.

1. Introduction

Biofilms are defined as complex organized aggregates of microorganisms establishing themselves on surfaces within a matrix of their own extracellular matrix [1]. The path to ensure surface attachment encompasses multiple up and down regulations of gene expressions, and cellular communication [2].
The first step in establishing a biofilm is determined by the attraction or repulsion of the very first layer of microorganisms to the surface as per the rules of physics [3]. Initially, weak physical bonds (hydrogen bonds and van der Waals bonds) are established [4]. A firmer adhesion follows, enhanced by the proteins and polysaccharides in the extracellular matrix of the biofilm, according to their electrical charge [5].
Dental intraoral appliances (fixed and removable prostheses, orthodontic appliances, and dentures) are exposed continuously to conditions facilitating bacterial and biofilm attachment [6]. These microbial ecosystems growing on the appliances’ surfaces result in a wide range of esthetic and mechanical changes in the material, all the way to systemic diseases in the host [7,8,9].
Three main players determine the resultant infection; the microorganisms’ virulence, the medium characteristics offered by the host, and the surface of the medical or dental device where the biofilm is anchored [10].
Factors related to the microorganisms, like their types, their cometabolism, and the presence of oxygen, determine the biofilm’s characteristics [3]. The composition of a biofilm formed on a complete denture was found to possess similar composition to dental plaque formed on oral tissues with a few differences: the reduced detection of Streptococcus mutans on dentures, and the minimal presence of Candida albicans on teeth surfaces [11]. In addition, factors related to the medium properties (pH, temperature, and the presence of charge) will dictate the biofilm attachment strength [4]. The third factor affecting biofilm growth is the surface of the dental appliance. The dental appliance surface is not a homogenous surface. Some of its characteristics that affect biofilm bonding are the material’s porosity and the variable roughness, which alters the total area available for bonding with the biofilm [12]. Another surface characteristic is the charge at the interface of the appliance-biofilm zone. Hydrophobicity defines those charges’ interactions; it is the measure of the surface acceptance to bonding with a non-polar or slightly polar charge [13]. This has also been found to correlate to biofilm biomass and its metabolic activity [14]. Hydrophobicity relates to the surface pH and ionic strength, and those change the characteristics of the material–bacteria interactions [15]. All these surface characteristics determine the biofilm bonding to the appliance surface, and hence the different surfaces vary in the total biofilm accumulation [16].
A recent systematic review found that additive manufacturing (3D printing) from 2010 to 2020 was successfully used for the fabrication of custom trays, record bases, and denture bases whether trial, interim, or immediate [17]. There are several 3D-printing techniques; the ones mainly used in dentistry include stereolithography, selective laser sintering, and digital light processing, and each one utilizes a different way to polymerize or set the final product [18]. No matter which technique it is, a series of steps are required, starting with digital software to design the product or to upload its replica. This is saved as an STL file and transferred to a printer’s compatible software. The stereolithography printers, for example, have a range of resin materials suitable for different industrial and dental applications, like retainer and surgical guide clear resin, castable wax resin, and denture base pink resin.
The 3D-printed denture bases undergo multiple post-curing processing steps that can alter surface characteristics [17]. Two steps, an extended light treatment that is applied after the initial polymerization and sandblasting, vary in how much they are utilized depending on the intended use of the appliance [19,20]. However, their effect on surface characteristics has not been evaluated to date. Therefore, this study evaluated the change in the hydrophobicity and roughness of the 3D-printed denture-base resin surface when one of these two variables was applied: either an extended post curing or a sandblasting.

2. Results

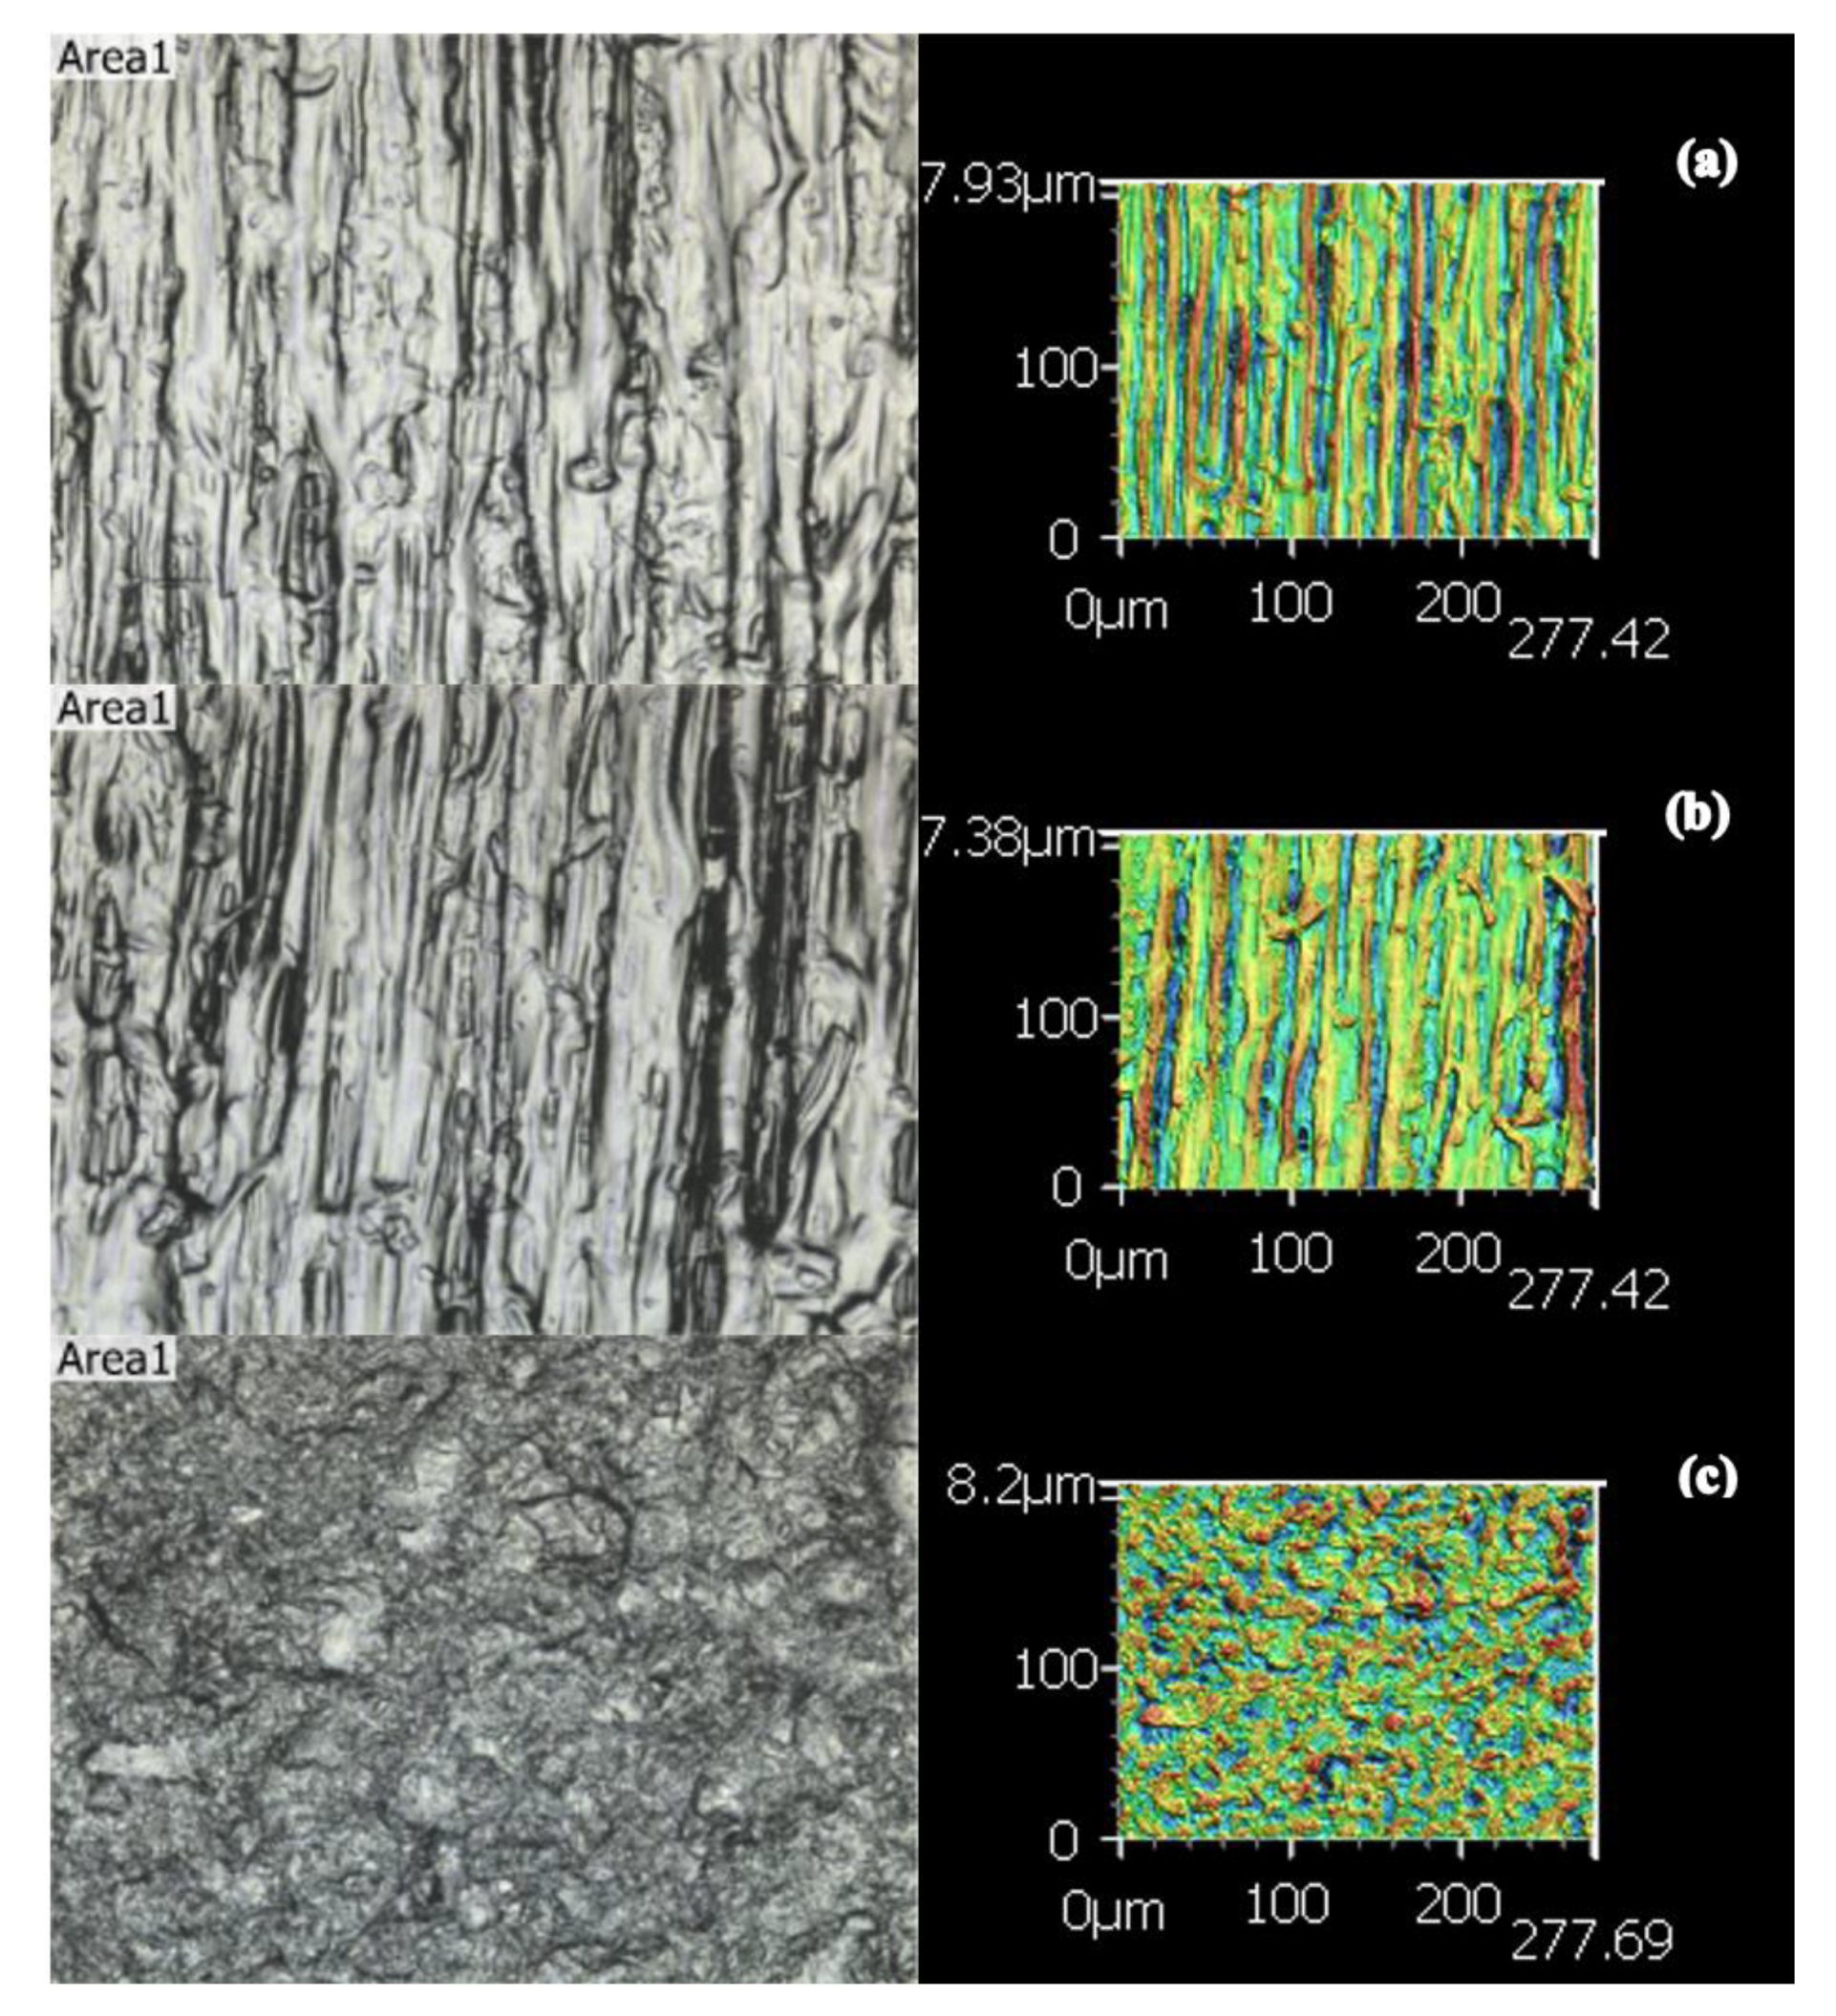
2.1. Surface Roughness
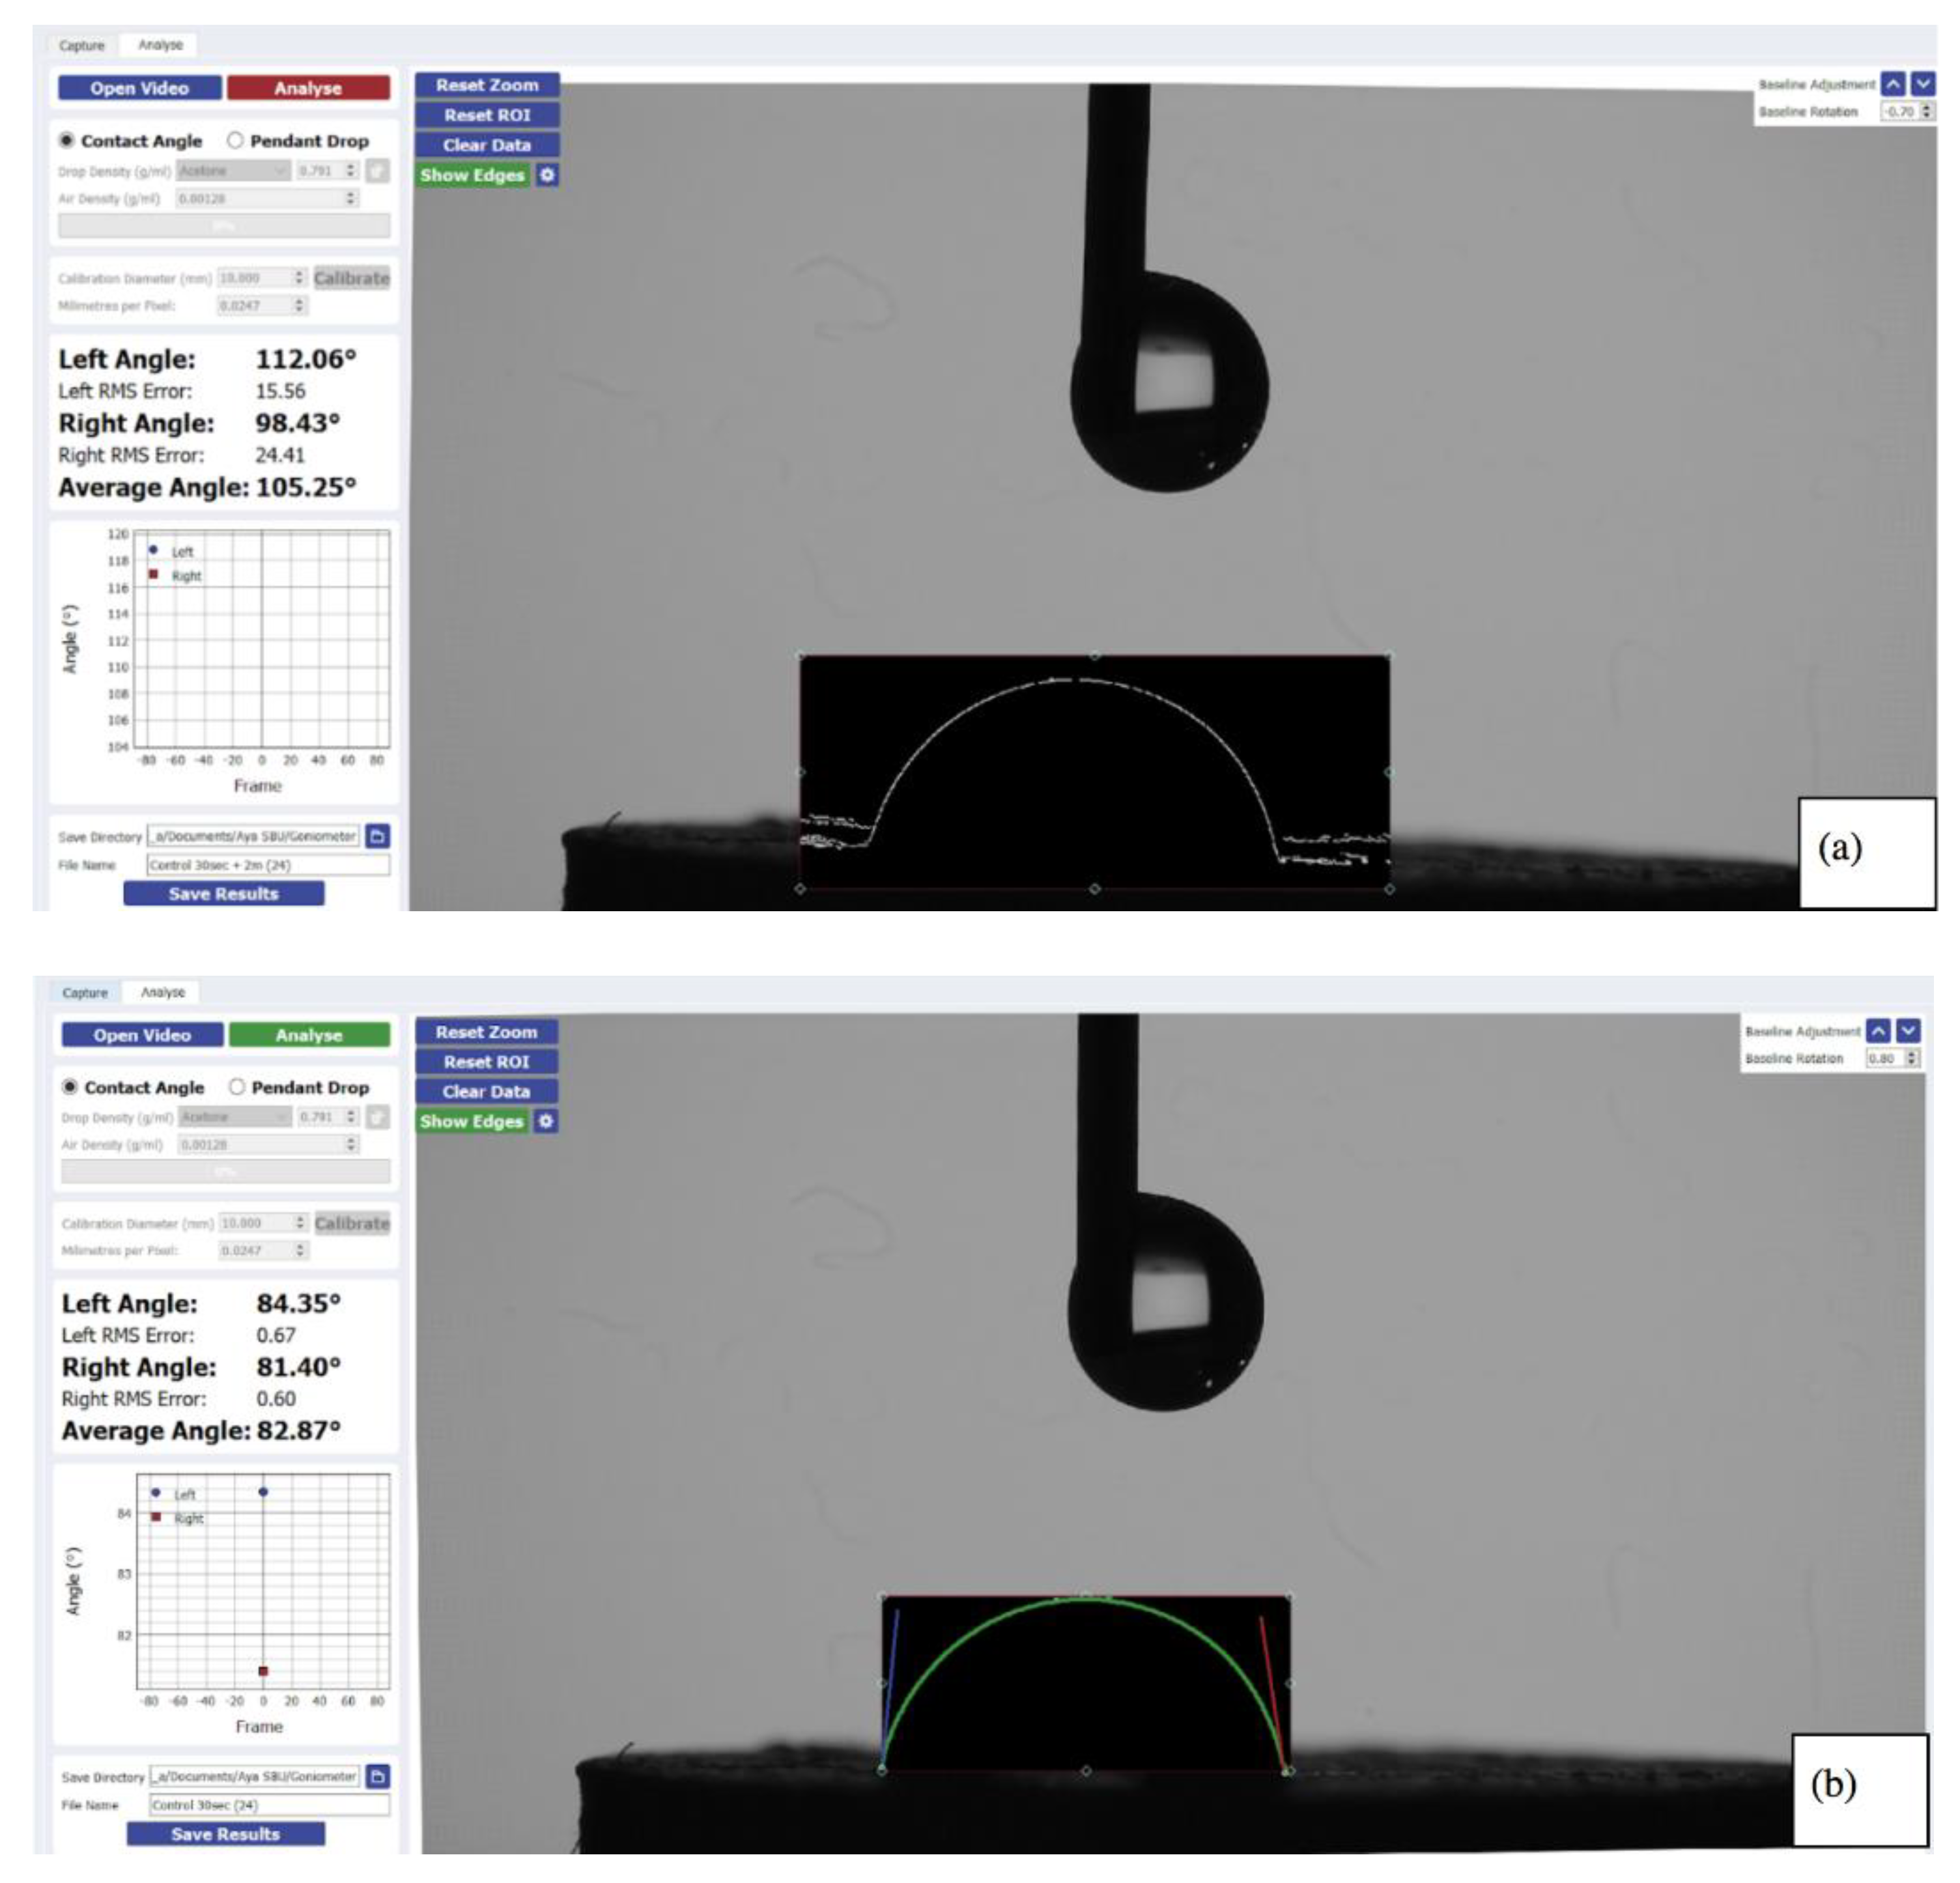
The surface roughness of the three groups were analyzed with a 3D laser scanning confocal microscope at 50×. Images in Figure 1 demonstrate each group’s detailed surface profile using optical and laser lenses. The roughness parameters were different in the sandblasted group compared to the controls and extended-cure measurements as can be seen in Table 1 using ANOVA and post hoc statistical analysis. Post hoc statistical comparison showed that the subset of the control group and the extended-cure group (paired together) have a significant difference from the sandblasted group in Sa, Sz, Str, and Spc, and there was no significant difference for the Sdr measures; significance is when p < 0.05.

2.2. Hydrophobicity

The initial contact angle of the sandblasted group (60.14 ± 10.51) was lower compared to both the control (81.91 ± 3.90) and to the extended-cure (80.25 ± 7.14) group. It showed a statistically significant decrease in the sandblasted group (p < 0.05) using the ANOVA and post hoc Tukey test. After two minutes, the contact angles of each group showed a significant decrease with time lapse using T-test statistics (Table 2).
The raw data are presented in the supplemental information. Table S1 includes the surface roughness measurements. Table S2 contains the contact angle measurements and includes the following information: the frame number, time (s), left and right angles (°), left and right root mean squared error (RMSE), left and right contact points (pixels), and droplet width (pixels). Table S3 shows the contact angles for each sample of the 3 groups and after the 2 min wait.

3. Discussion

The aims of this study were to evaluate the surface roughness and hydrophobicity of 3D-printed denture base resins, polymerized by SLA technology, after modifying the surface by two variables: applying an extended post-curing time and sandblasting. Our results showed that the surface roughness and the hydrophobicity changed significantly after sandblasting but not after extended post curing. The two-minute lapse measurement of the contact angle confirmed the continuity of each surface’s behavior regarding hydrophobicity.
In our experiment, the decrease in surface roughness, seen mainly in sandblasted samples, was captured as a decrease in the peaks and valleys (Sa and Sz), a change in the distribution of spatial parameters of the surface (Str, and Sdr), and a flattening of the pointed surface texture (Spc). Meanwhile, the hydrophobicity was judged by measuring the contact angle of a drop of water when it “wet” that surface. A greater angle measurement indicated a higher hydrophobicity as the drop of water did not desire to spread on that surface. Thus, the sandblasting process caused a markable decrease in hydrophobicity compared to the hydrophobicity of the surface resin even after exposure to extended light curing. This can be related to the presence of the hydrophilic aluminum oxide sandblasting particles remaining on the surface, and could also have contributed to the decrease in surface roughness that allowed a wider spread of the water drop as it landed on a smoother surface. Water was used as the source of the liquid drop for its ease of handling with the goniometer machine.
The new manufacturing of dental products using 3D printing is followed by many post-curing processes before reaching the clinical insertion stage; some of these are specific to the 3D printed products (like extended light curing) while others are shared with the traditional dental-lab manufacturing (like sandblasting). Our results aid the clinician in seeing the hygienic impact of procedures like these on appliance-wearing patients.
The following surface modifications of dental appliances can be used in clinical practice whether for enhancing its characteristics, applying coatings, or repairing fractured printed resins:
(a)
Changing the time or temperature will affect the polymerization level, which influences the product characteristics [21,22]. Increasing the post-curing time, by exposing the samples to the same laser used in polymerization for an additional two hours (120 min instead of only 60 min), would enhance the mechanical characteristics and alter the color [22]. It would also improve the accuracy (trueness and precision) [19]. For those reasons and others, the dentist might invest in the material quality by increasing the post curing time or temperature.
(b)
The sandblasting process results from an impact of aluminum oxide particles against the intaglio denture surface. There are different uses in dentistry for the sandblasting process, such as in bonding and resisting shear forces [20]. It is important when denture repairs or addition of new resin material are needed. The sandblasting process can create irregularities on the surface. This possibly increases the roughness of the polymer surfaces. A rougher surface increases the chances of biofilm colonization on different dental restorative materials [12]. The sandblasting process can also aim to assure removal of unwanted defects and smooth rough irregularities [23].
The changes that these two variables, post-curing time and sandblasting, have on the surface roughness and surface hydrophobicity affect the availability of surface molecules towards forming chemical and physical bonds [24,25]. This variation in bonding affects the adhesion of the microorganisms to the surface. Bonding starts with the weak physical attraction rules. In physics, the DLVO theory (named after Derjaguin, Landau, Verwey, and Overbeek) shows that the energy created at the substratum–bacteria interface can be the result of multiple types of bonds, like van der Waals forces, electrostatic interactions, and acid–base bonding [26,27]. After that preliminary layer, the cell–cell cohesion becomes easier, allowing the biofilm to grow.
By reviewing the literature, different factors appear to affect the adherence of the biofilm to the substratum. These include the microorganisms and extracellular matrix that make up the biofilm, and the surface substance where adherence is initiated [10].
The properties of the biofilm inhabitant play a role in the end-result adhesion. Panagoda et al. (2001) found the hydrophobicity of Candida relates positively with its adherence to buccal epithelial cells and acrylic surfaces [28]. A positive correlation was determined between Candida and hydrophobicity [29]. Candida albicans increases its hydrophobicity when it develops from yeast to hyphae to enhance the adhesion chances, and this is due to an increase in its surface compounds [30]. Candida may show different preferences than the bacteria that comprise the first plaque inhabitants [31]. Those first inhabitants of plaque must stand the supragingival shear forces that remove them. They show less retention on hydrophobic surfaces [32,33]. By the same token, when cleaning biomaterial surfaces with organic solvents, a hydrophilic biofilm resists the dissolution more than a hydrophobic buildup [34]. This shows how much different inhabitants of the oral microbiome can variate the resultant surface charge.
The other factor that the attached biofilm revolves around is the substance surface properties. Tanaka et al. (2019) distinguished the adherence on the hydrophobic and hydrophilic surfaces and postulated that surface wettability will be a promising detector for biofilm formation [35].
Three-dimensional printing, used in this work, employs a mix of polymers; polymethylmethacrylate (PMMA) is the main component in the denture base resin [36]. It is a monopolar polymer, with ester C=O, C-H bonds, and C-O-CH3 bonds sticking out from its outer surface [37]. This gives the PMMA surface a degree of polarity rather capable of forming more hydrophilic bonds, though still weak and thus perhaps not capable of forming a completely homogenous spread of the water drop [37]. However, we saw in this experiment how this bonding changes due to extra light curing did not affect the surface charge significantly, and that the presence of sandblasting is what showed a major change.
Some polymers’ surfaces were found to provide better adhesion if hydrophobicity decreased through changing the material properties, according to Webb et al. (1999) who investigated the addition of organic acids (plasticizers) to polyvinyl chloride on the fungus Aureobasidium pullulans’s adhesion by changing the electrostatic forces [38]. However, not all polymers’ surfaces behave the same. For polyethylene terephthalate (PET), the change in hydrophobicity did not affect the adherence of the biofilm within different manufactured types, while a different polymer, high-density polyethylene (HDPE), displayed different adherence levels and even different microhabitats when hydrophobicity changed. This corroborates with the idea that it is not necessary for a certain surface modification to result in the same adherence properties on different polymer surfaces [39]. Chandra et al. also experimented with modifications on polymers to reduce biofilm formation and concluded also that while some polymers’ surfaces, like PET, didn’t change biofilm growth even when the modification changed its hydrophobicity, other polymers correlated the two variables, biofilm and hydrophobicity, directly or inversely in polyetherurethane and polycarbonate polymers, respectively. This concluded that biofilm formation correlated with the surface type [40].
For some researchers, like Jones et al. (1999), neither the hydrophobicity nor the electrostatic charge modifications had an obvious effect on biofilm formation or adherence; however, the rough topography did [39]. A rougher surface provides a better niche for biofilm development [12,32]. Topographical properties can have a direct effect on the adhesion strength [41].
We created a less hydrophobic surface by sandblasting because we allowed a smaller contact angle when compared to the control. Meanwhile, the extended post curing did not alter the hydrophobicity. This decrease in hydrophobicity at the sandblasted surfaces can be related to the presence of aluminum oxide hydrophilic remnants on the surface. We also created a less rough surface by the sandblasting, which also could have contributed to the observed drop in hydrophobicity.
Further work is needed to specify the relationship between these surface changes and the growth of biofilm in vivo, as the judgment on utilizing surface modifications if any will vary along with the nature of the microbiome in the oral cavity.

4. Materials and Methods

The sample size for this experiment was determined using the online sample size calculator application G*Power Software 3.1.9.7. By performing a power analysis, a margin of error of 5% and a power level of 80% were selected as recommended by Babraham Bioinformatics [42]. The effect size chosen was according to Cohen’s Convention Method determined by G*Power; this effect size was following a previous study by Liber-Knec and Lagan (2021) in which the contact angles of water drops on heat-cured denture base resin were measured in different storage media [42]. By referring to Liber-Knec and Lagan’s study as a pilot study, the sample size for both a T-test and an ANOVA were calculated at an effect size of 0.7 and 0.4, respectively [43]. The sample size was determined and the total number of measurements for the contact angle tests was set to 90; this resulted in raising the actual power in the ANOVA to 93%, according to G*Power calculations. Three experimental groups, control (n = 30), sandblasted (n = 30), and extended post-cure treatment (n = 30), were created.

4.1. 3D-Printed Samples

A disk with a 10 mm diameter and 3 mm thickness was designed in a 3D modeling software platform (Autodesk® Fusion 360 software; Autodesk Inc. San Rafael, CA, USA). The design was exported as an STL file to a printing-compatible software (Freeform® software; Formlabs Inc., Somerville, MA, USA) where the disk was replicated until 90 disks were set in the printing layout. The disks were oriented at a 90-degree angle and 50 µm layer thickness, then printed with the denture base material LP Ref. PKG-RS-F2-DB (Formlabs Inc, Somerville, MA). The samples were 3D-printed using a Formlab2 SLA Printer (Formlabs Inc., Somerville, MA).
After printing, all the samples were removed and washed in 70% isopropyl alcohol (IPA) in an agitating wash (Form Wash; Formlabs Inc., Somerville, MA) for 20 min, followed by separation from the printing platform and removal of printing supports. Finally, the samples were post-cured using the 405 nm violet laser on a rotating table for 60 min at 60 °C (Form Cure; Formlabs Inc., Somerville, MA).

4.2. Experimental Groups

The 90 disks were divided into three groups. The control group (n = 30 disks) was formed without any additional modification. The second group (the extended cure, n = 30 disks) was exposed to light for an extra 120 min at 60 °C in the same post-cure chamber. The third group (n = 30 disks) was sandblasted with aluminum oxide (Al2O3) powder (particle size 300 μm) at an airflow speed of 56.89 psi for 10 s.

4.3. Surface Roughness Measurement

The surface roughness was evaluated for all three groups using a confocal laser scanning microscope (3D Laser Scanning Confocal Microscope VK-X150; Keyence®, Itasca, IL, USA). Ten samples were extracted from each group and evaluated at a magnification of 50×. Next, using the MultiFile Analyzer® software Version 2.5.0. (KEYENCE, Itasca, IL, USA), the following filtering processes were applied: Missing and weak data were removed using a signal filter, upper and lower height thresholds were determined by selecting the highest and the lowest intensity peaks manually. To eliminate the effect of the curvature of the surface, the automatic selection of a flat reference plane was selected. The same filters were applied to all the samples using the batch analysis criteria. The parameters Sa, Sz, Str, Spc, and Sdr were evaluated in a random zone of 276 μm × 276 μm in each disk. Mean scanning time was 2.5 to 3.0 min. An automatic Gaussian filter was selected to eliminate waviness from the samples’ surface.
Sa (arithmetical mean height): Sa expresses the difference in height of each point compared to the arithmetical mean of the surface. It is the general parameter for surface roughness. Expressed in micrometers
Sz (Maximum height): is defined as both the largest peak height and the largest pit depth totaled. Expressed in micrometers
Str (Texture aspect ratio): is a measure of surface texture uniformity. The values are expressed in the range from 0 to 1. Values close to 0 represent a uniform surface, values close to 1 represent a non-uniform surface
Spc (Arithmetic mean peak curvature): is the arithmetic mean of the curvature of the peaks on the surface. A smaller value means rounded shapes; a larger value means pointy shapes. Expressed in micrometers.
Sdr (Developed interfacial area ratio):This parameter is a percentage of the definition area’s additional textured area as compared to planar definition area. If the surface is perfectly flat the values are close to 0. If slopes exist on the surface the values are close to 1. The slope in the surface makes the Sdr value larger.

4.4. Hydrophobicity Measurement

The hydrophobicity was evaluated by the contact angle test, using a digital goniometer (Ossila Digital Goniometer; Ossila European Fulfilment, Sheffield, UK). The room temperature was 22 °C at the time of the measurements. In brief, the evaluation platform was set at 0 degrees verified with a level. Each disk was set in the middle of the evaluation platform and a drop of 10 ± 2.5 μL of deionized water was deposited. Two pictures were obtained, the first after 30 s, and the second after 2 extra minutes.
The images were analyzed using the goniometer’s software (Ossila Contact Angle v.3.1.2.2; Ossila European Fulfilment, Sheffield, UK) as follows:
First, the edges of the water drop were located using the edges of the sphere (edge tracing); afterward, the region of interest (ROI) was selected, and a rotation adjustment was applied (in case tilting occurred). Subsequently, the base of the drop was delineated where the drop contacted the surface (Figure 2a). Finally, an automatic contact angle analysis was done by fitting a polynomial to the edges of the drop. (Figure 2b). For each drop, the contact angle value was extracted by averaging the right and left contact angles.

4.5. Statistical Analysis

Statistical comparisons were completed for the three groups using one-way ANOVA and post hoc Tukey with Levene Statistics for the homogeneity of variances in the surface roughness and the surface hydrophobicity tests, while using a T-test when comparing first to second readings, considering 90% confidence interval for means.

5. Conclusions

In our experiment on SLA 3D printed resin, we created a less hydrophobic denture base resin surface by sandblasting, while extended exposure to heat and light displayed no such decrease compared with the control group. The altered roughness of the surface could be a contributing factor in the observed hydrophobicity.

Supplementary Materials

The following supporting information can be downloaded at: https://0-www-mdpi-com.brum.beds.ac.uk/article/10.3390/prosthesis4010009/s1, Table S1: Surface roughness parameters values for the three groups’ samples, averages, standard deviation, and T-test results. Table S2: The contact angle measurements for all three groups’ samples, including the following information: the frame number, time (s), left and right angles (°), left and right root mean squared error (RMSE), left and right contact points (pixels), and droplet width (pixels). Table S3: The contact angles for each sample of the three groups after the 2 min wait.

Author Contributions

Conceptualization and methodology, A.S., R.D.-R. and G.R.; software, A.S.; validation, R.D-R. and G.R.; formal analysis and investigation, A.S.; resources, R.D.-R.; data curation, A.S.; writing—original draft preparation, A.S.; writing—review and editing, A.S., R.D.-R. and G.R.; visualization, supervision, project administration, and funding acquisition, R.D.-R. and G.R. All authors have read and agreed to the published version of the manuscript.

Funding

The funding and support for this research came from the DIPRESLAB Laboratory (Digital Implant Prosthodontics Research Lab) and the Department of Prosthodontics and Digital Technology, and from the Laboratory of Periodontal-,Implant-,Phototherapy (La-PIP) at Stony Brook University, New York.

Institutional Review Board Statement

Not applicable.

Informed Consent Statement

Not applicable.

Data Availability Statement

Not applicable.

Conflicts of Interest

The authors declare no conflict of interest.

References

  1. Weiland-Bräuer, N. Friends or Foes-Microbial Interactions in Nature. Biology 2021, 10, 496. [Google Scholar] [CrossRef] [PubMed]
  2. Donlan, R.M. Biofilms: Microbial life on surfaces. Emerg. Infect. Dis. 2002, 8, 881–890. [Google Scholar] [CrossRef]
  3. Armbruster, C.R.; Parsek, M.R. New insight into the early stages of biofilm formation. Proc. Natl. Acad. Sci. USA 2018, 115, 4317. [Google Scholar] [CrossRef] [PubMed] [Green Version]
  4. Veerubhotla, R.; Varanasi, J.L.; Das, D. Chapter 12—Biofilm Formation within Microbial Fuel Cells. In Progress and Recent Trends in Microbial Fuel Cells; Kundu, P.P., Dutta, K., Eds.; Elsevier: Amsterdam, The Netherlands, 2018; pp. 231–242. [Google Scholar] [CrossRef]
  5. Almaguer-Flores, A. Biofilms in the oral environment. In Bio-Tribocorrosion in Biomaterials and Medical Implants; Yan, Y., Ed.; Woodhead Publishing: Cambridge, UK, 2013; pp. 169–186. [Google Scholar] [CrossRef]
  6. Monteiro, D.R.; de Souza Batista, V.E.; Caldeirão, A.C.M.; Jacinto, R.C.; Pessan, J.P. Oral prosthetic microbiology: Aspects related to the oral microbiome, surface properties, and strategies for controlling biofilms. Biofouling 2021, 37, 353–371. [Google Scholar] [CrossRef] [PubMed]
  7. Wady, A.F.; Machado, A.L.; Zucolotto, V.; Zamperini, C.A.; Berni, E.; Vergani, C.E. Evaluation of Candida albicans adhesion and biofilm formation on a denture base acrylic resin containing silver nanoparticles. J. Appl. Microbiol. 2012, 112, 1163–1172. [Google Scholar] [CrossRef] [Green Version]
  8. Wen, J.; Jiang, F.; Yeh, C.-K.; Sun, Y. Controlling fungal biofilms with functional drug delivery denture biomaterials. Colloids Surf. B Biointerfaces 2016, 140, 19–27. [Google Scholar] [CrossRef] [Green Version]
  9. Khatoon, Z.; McTiernan, C.D.; Suuronen, E.J.; Mah, T.-F.; Alarcon, E.I. Bacterial biofilm formation on implantable devices and approaches to its treatment and prevention. Heliyon 2018, 4, e01067. [Google Scholar] [CrossRef] [Green Version]
  10. Øilo, M.; Bakken, V. Biofilm and Dental Biomaterials. Materials 2015, 8, 2887–2900. [Google Scholar] [CrossRef]
  11. Coulthwaite, L.; Verran, J. Potential pathogenic aspects of denture plaque. Br. J. Biomed. Sci. 2007, 64, 180–189. [Google Scholar] [CrossRef]
  12. Teughels, W.; Van Assche, N.; Sliepen, I.; Quirynen, M. Effect of material characteristics and/or surface topography on biofilm development. Clin. Oral Implants Res. 2006, 17 (Suppl. 2), 68–81. [Google Scholar] [CrossRef]
  13. van Oss, C.J. Long-range and short-range mechanisms of hydrophobic attraction and hydrophilic repulsion in specific and aspecific interactions. J. Mol. Recognit. 2003, 16, 177–190. [Google Scholar] [CrossRef] [PubMed]
  14. Silva-Dias, A.; Miranda, I.M.; Branco, J.; Monteiro-Soares, M.; Pina-Vaz, C.; Rodrigues, A.G. Adhesion, biofilm formation, cell surface hydrophobicity, and antifungal planktonic susceptibility: Relationship among Candida spp. Front. Microbiol. 2015, 6, 205. [Google Scholar] [CrossRef] [PubMed] [Green Version]
  15. Katsikogianni, M.; Missirlis, Y.F. Concise review of mechanisms of bacterial adhesion to biomaterials and of techniques used in estimating bacteria-material interactions. Eur. Cells Mater. 2004, 8, 37–57. [Google Scholar] [CrossRef] [PubMed]
  16. Koodaryan, R.; Hafezeqoran, A. Effect of surface treatment methods on the shear bond strength of auto-polymerized resin to thermoplastic denture base polymer. J. Adv. Prosthodont. 2016, 8, 504–510. [Google Scholar] [CrossRef] [PubMed] [Green Version]
  17. Anadioti, E.; Musharbash, L.; Blatz, M.B.; Papavasiliou, G.; Kamposiora, P. 3D printed complete removable dental prostheses: A narrative review. BMC Oral Health 2020, 20, 343. [Google Scholar] [CrossRef] [PubMed]
  18. Pillai, S.; Upadhyay, A.; Khayambashi, P.; Farooq, I.; Sabri, H.; Tarar, M.; Lee, K.T.; Harb, I.; Zhou, S.; Wang, Y.; et al. Dental 3D-Printing: Transferring Art from the Laboratories to the Clinics. Polymers 2021, 13, 157. [Google Scholar] [CrossRef]
  19. Lee, B.I.; You, S.G.; You, S.M.; Kim, D.Y.; Kim, J.H. Evaluating the accuracy (trueness and precision) of interim crowns manufactured using digital light processing according to post-curing time: An In Vitro study. J. Adv. Prosthodont. 2021, 13, 89–99. [Google Scholar] [CrossRef]
  20. Nishigawa, G.; Maruo, Y.; Irie, M.; Maeda, N.; Yoshihara, K.; Nagaoka, N.; Matsumoto, T.; Minagi, S. Various Effects of Sandblasting of Dental Restorative Materials. PLoS ONE 2016, 11, e0147077. [Google Scholar] [CrossRef]
  21. Bayarsaikhan, E.; Lim, J.-H.; Shin, S.-H.; Park, K.-H.; Park, Y.-B.; Lee, J.-H.; Kim, J.-E. Effects of Postcuring Temperature on the Mechanical Properties and Biocompatibility of Three-Dimensional Printed Dental Resin Material. Polymers 2021, 13, 1180. [Google Scholar] [CrossRef]
  22. Kim, D.; Shim, J.S.; Lee, D.; Shin, S.H.; Nam, N.E.; Park, K.H.; Shim, J.S.; Kim, J.E. Effects of Post-Curing Time on the Mechanical and Color Properties of Three-Dimensional Printed Crown and Bridge Materials. Polymers 2020, 12, 2762. [Google Scholar] [CrossRef]
  23. Somers, N.; Lasgorceix, M. Surface Treatment of Bioceramics. In Encyclopedia of Materials: Technical Ceramics and Glasses; Pomeroy, M., Ed.; Elsevier: Oxford, UK, 2021; pp. 701–715. [Google Scholar] [CrossRef]
  24. De-la-Pinta, I.; Cobos, M.; Ibarretxe, J.; Montoya, E.; Eraso, E.; Guraya, T.; Quindós, G. Effect of biomaterials hydrophobicity and roughness on biofilm development. J. Mater. Sci. Mater. Med. 2019, 30, 1–11. [Google Scholar] [CrossRef] [PubMed]
  25. Sterzenbach, T.; Helbig, R.; Hannig, C.; Hannig, M. Bioadhesion in the oral cavity and approaches for biofilm management by surface modifications. Clin. Oral Investig. 2020, 24, 4237–4260. [Google Scholar] [CrossRef] [PubMed]
  26. Rimondini, L.; Cochis, A.; Varoni, E.; Azzimonti, B.; Carrassi, A. Biofilm Formation on Implants and Prosthetic Dental Materials. In Handbook of Bioceramics and Biocomposites; Antoniac, I.V., Ed.; Springer International Publishing: Cham, Switzerland, 2016; pp. 991–1027. [Google Scholar] [CrossRef]
  27. Busscher, H.J.; Rinastiti, M.; Siswomihardjo, W.; van der Mei, H.C. Biofilm formation on dental restorative and implant materials. J. Dent. Res. 2010, 89, 657–665. [Google Scholar] [CrossRef] [PubMed]
  28. Panagoda, G.J.; Ellepola, A.N.B.; Samaranayake, L.P. Adhesion of Candida parapsilosis to epithelial and acrylic surfaces correlates with cell surface hydrophobicity. Mycoses 2001, 44, 29–35. [Google Scholar] [CrossRef]
  29. Ellepola, A.N.B.; Samaranayake, L.P. The effect of limited exposure to antimycotics on the relative cell-surface hydrophobicity and the adhesion of oral Candida albicans to buccal epithelial cells. Arch. Oral Biol. 1998, 43, 879–887. [Google Scholar] [CrossRef]
  30. Beaussart, A.; Alsteens, D.; El-Kirat-Chatel, S.; Lipke, P.N.; Kucharíková, S.; Van Dijck, P.; Dufrene, Y.F. Single-Molecule Imaging and Functional Analysis of Als Adhesins and Mannans during Candida albicans Morphogenesis. ACS Nano 2012, 6, 10950–10964. [Google Scholar] [CrossRef] [Green Version]
  31. Lyons, K.M.; Cannon, R.D.; Beumer, J.; Bakr, M.M.; Love, R.M. The Role of Biofilms and Material Surface Characteristics in Microbial Adhesion to Maxillary Obturator Materials: A Literature Review. Cleft Palate-Craniofacial J. 2020, 57, 487–498. [Google Scholar] [CrossRef]
  32. Quirynen, M.; Marechal, M.; Busscher, H.J.; Weerkamp, A.H.; Darius, P.L.; van Steenberghe, D. The influence of surface free energy and surface roughness on early plaque formation. An in vivo study in man. J. Clin. Periodontol. 1990, 17, 138–144. [Google Scholar] [CrossRef]
  33. Everaert, E.P.; Mahieu, H.F.; Wong Chung, R.P.; Verkerke, G.J.; van der Mei, H.C.; Busscher, H.J. A new method for in vivo evaluation of biofilms on surface-modified silicone rubber voice prostheses. Eur. Arch. Otorhinolaryngol. 1997, 254, 261–263. [Google Scholar] [CrossRef]
  34. Krasowska, A.; Sigler, K. How microorganisms use hydrophobicity and what does this mean for human needs? Front. Cell. Infect. Microbiol. 2014, 4, 112. [Google Scholar] [CrossRef] [Green Version]
  35. Tanaka, N.; Kogo, T.; Hirai, N.; Ogawa, A.; Kanematsu, H.; Takahara, J.; Awazu, A.; Fujita, N.; Haruzono, Y.; Ichida, S.; et al. In-situ detection based on the biofilm hydrophilicity for environmental biofilm formation. Sci. Rep. 2019, 9, 8070. [Google Scholar] [CrossRef] [PubMed] [Green Version]
  36. Zdziennicka, A.; Krawczyk, J.; Jańczuk, B. Wettability and Adhesion Work Prediction in the Polymer–Aqueous Solution of Surface Active Agent Systems. Colloids Interfaces 2018, 2, 21. [Google Scholar] [CrossRef]
  37. Miyamae, T.; Nozoye, H. Morphology and chemical structure of poly(methyl methacrylate) surfaces and interfaces: Restructuring behavior induced by the deposition of SiO2. Surf. Sci. 2003, 532–535, 1045–1050. [Google Scholar] [CrossRef]
  38. Webb, J.S.; Mei, H.C.V.d.; Nixon, M.; Eastwood, I.M.; Greenhalgh, M.; Read, S.J.; Robson, G.D.; Handley, P.S. Plasticizers Increase Adhesion of the Deteriogenic Fungus Aureobasidium pullulans to Polyvinyl Chloride. Appl. Environ. Microbiol. 1999, 65, 3575–3581. [Google Scholar] [CrossRef] [Green Version]
  39. Jones, C.R.; Adams, M.R.; Zhdan, P.A.; Chamberlain, A.H. The role of surface physicochemical properties in determining the distribution of the autochthonous microflora in mineral water bottles. J. Appl. Microbiol. 1999, 86, 917–927. [Google Scholar] [CrossRef]
  40. Chandra, J.; Patel, J.D.; Li, J.; Zhou, G.; Mukherjee, P.K.; McCormick, T.S.; Anderson, J.M.; Ghannoum, M.A. Modification of surface properties of biomaterials influences the ability of Candida albicans to form biofilms. Appl. Environ. Microbiol. 2005, 71, 8795–8801. [Google Scholar] [CrossRef] [Green Version]
  41. Gingichashvili, S.; Feuerstein, O.; Steinberg, D. Topography and Expansion Patterns at the Biofilm-Agar Interface in Bacillus subtilis Biofilms. Microorganisms 2020, 9, 84. [Google Scholar] [CrossRef]
  42. Segonds-Pichon, A. Introduction to Sample Size Estimation. Introduction to Power Calculation 2015–2019. Available online: https://www.bioinformatics.babraham.ac.uk/training/Sample_Size_Estimation_and_Experimental_Design/Sample%20Size%20estimation%20Course%20manual.pdf (accessed on 24 November 2021).
  43. Liber-Kneć, A.; Łagan, S. Surface Testing of Dental Biomaterials-Determination of Contact Angle and Surface Free Energy. Materials 2021, 14, 2716. [Google Scholar] [CrossRef]
Figure 1. Surface roughness analysis by 3D laser scanning confocal microscope at 50× with optical and laser lenses in both grey shades and height-indicated colored images for: (a) Control, (b) Extra-cured, and (c) Sandblasted samples.
Prosthesis 04 00009 g001
Figure 2. Processing of the drop’s right and left contact angles after recording the picture using Ossila Software v.3.1.2.2 (Ossila European Fulfilment, Sheffield, UK) showing the delineation of the drop on the surface (a) then fitting a polynomial to analyze the angles (b).
Prosthesis 04 00009 g002
Table 1. Comparison of the surface parameter means for the three groups and the statistical significance (p < 0.05). STDEV: standard deviation.
Group’s Roughness Means ± STDEVSa (μm)Sz (μm)StrSpc (μm)Sdr
Control (A)4.64 ± 0.4899.97 ± 15.10.18 ± 0.144.43 × 108 ± 4.2 × 1074.65 × 105 ± 9.89 × 10⁴
Extended Cure (B)4.65 ± 0.83102.52 ± 23.20.31 ± 0.234.58 × 108 ± 5.13 × 1075.00 × 105 ± 1.27 × 10⁵
Sandblasted (C)3.43 ± 0.7846.06 ± 10.620.84 ± 0.213.64 × 108 ± 1.1 × 10⁸ 3.83 × 10⁵ ± 1.5 × 10⁵
ANOVA p Value<0.001 *<0.001 *<0.001 *0.027 *0.123
Tukey Post hoc Subset (paired groups)(Control, ExCure) and (Sandblast)(Control, ExCure) and (Sandblast)(Control, ExCure) and (Sandblast)(Control, ExCure) (Control, Sandblast)All in one subset
* indicates statistical significance.
Table 2. Comparison between the three groups’ contact angle measurements at first reading (30 s). Comparison of each group’s measurement after 2-min time lapse (comparing first to second readings).
Group’s Contact AngleFirst Reading (Mean ± STDEV) (o)Comparison between the 3 Groups 1st ReadingSecond Reading (Mean ± STDEV) (°)Comparison between 1st and 2nd Readings, T-test (p Value)
Control81.91 ± 3.90ANOVA p value < 0.001 *. Tukey post hoc subset: (Control, ExCure) and (Sandblast)78.02 ± 4.47<0.001 *
Extended cure80.25 ± 7.1472.65 ± 8.19<0.001 *
Sandblasted60.14 ± 10.5151.33 ± 10.57<0.001 *
* indicates statistical significance.
Publisher’s Note: MDPI stays neutral with regard to jurisdictional claims in published maps and institutional affiliations.

