A Critical Review of Bottom-Up Proteomics: The Good, the Bad, and the Future of This Field

 , and
, and 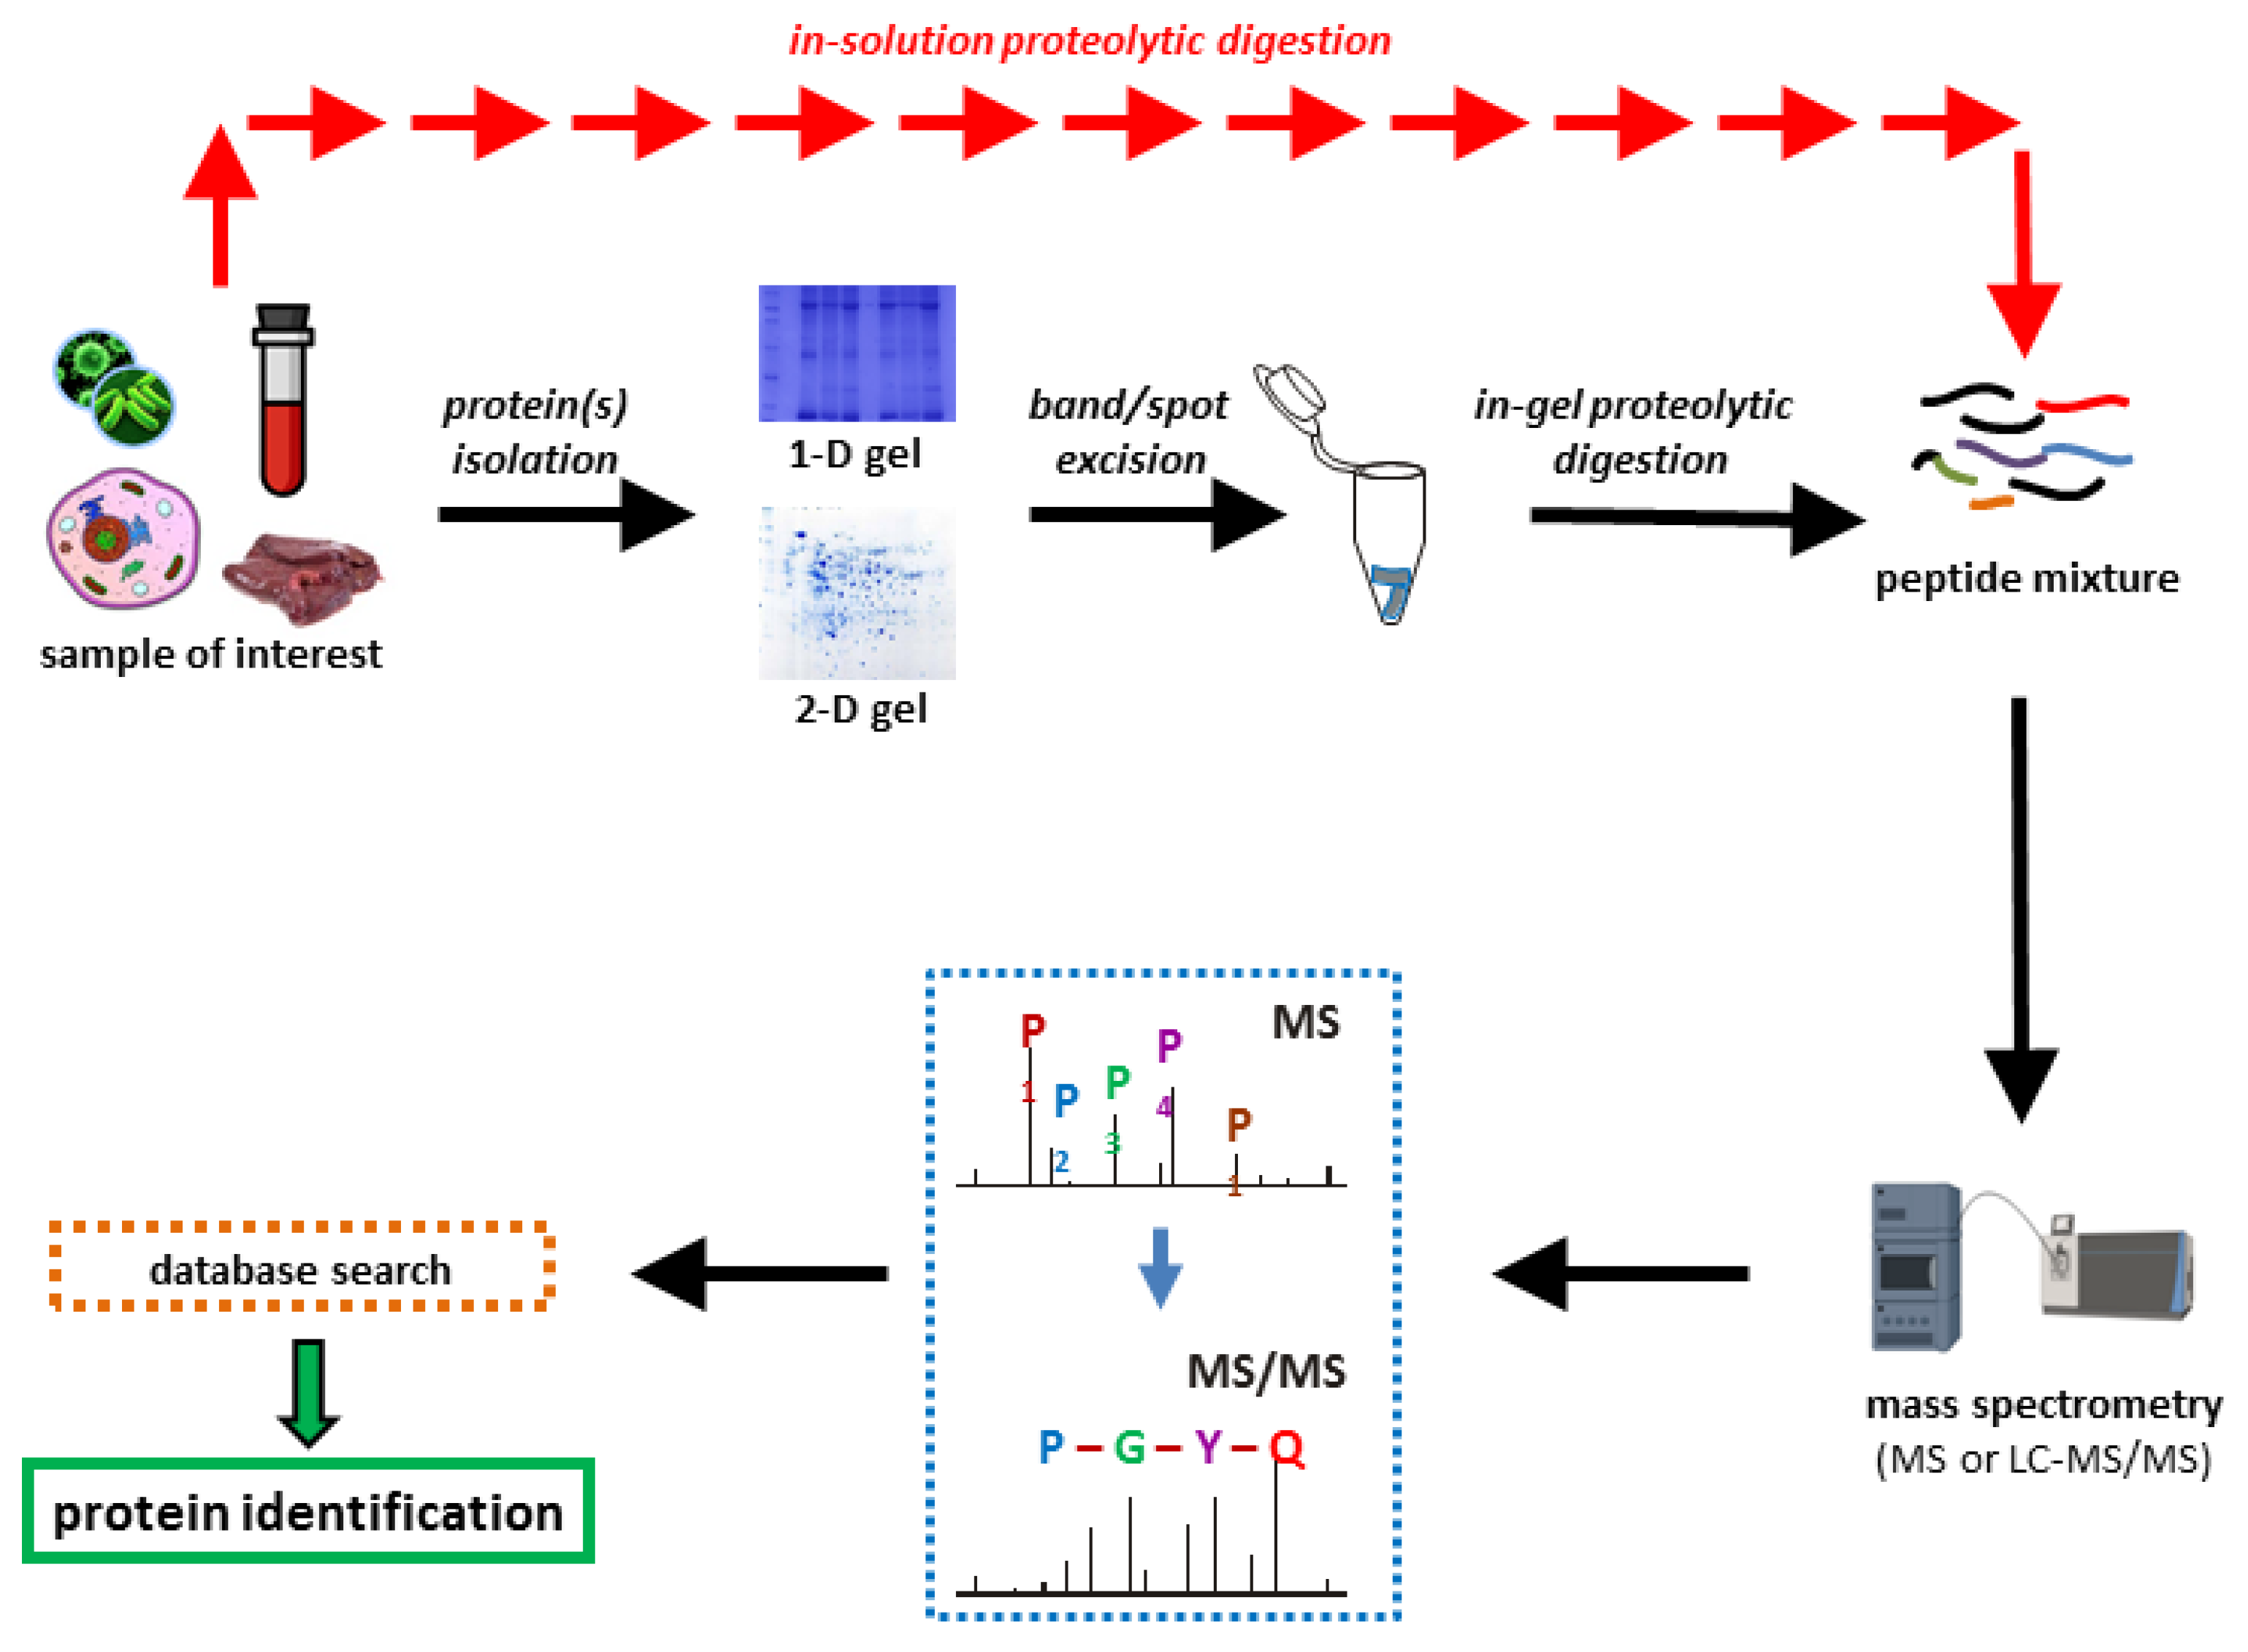
Abstract
:1. Proteomics
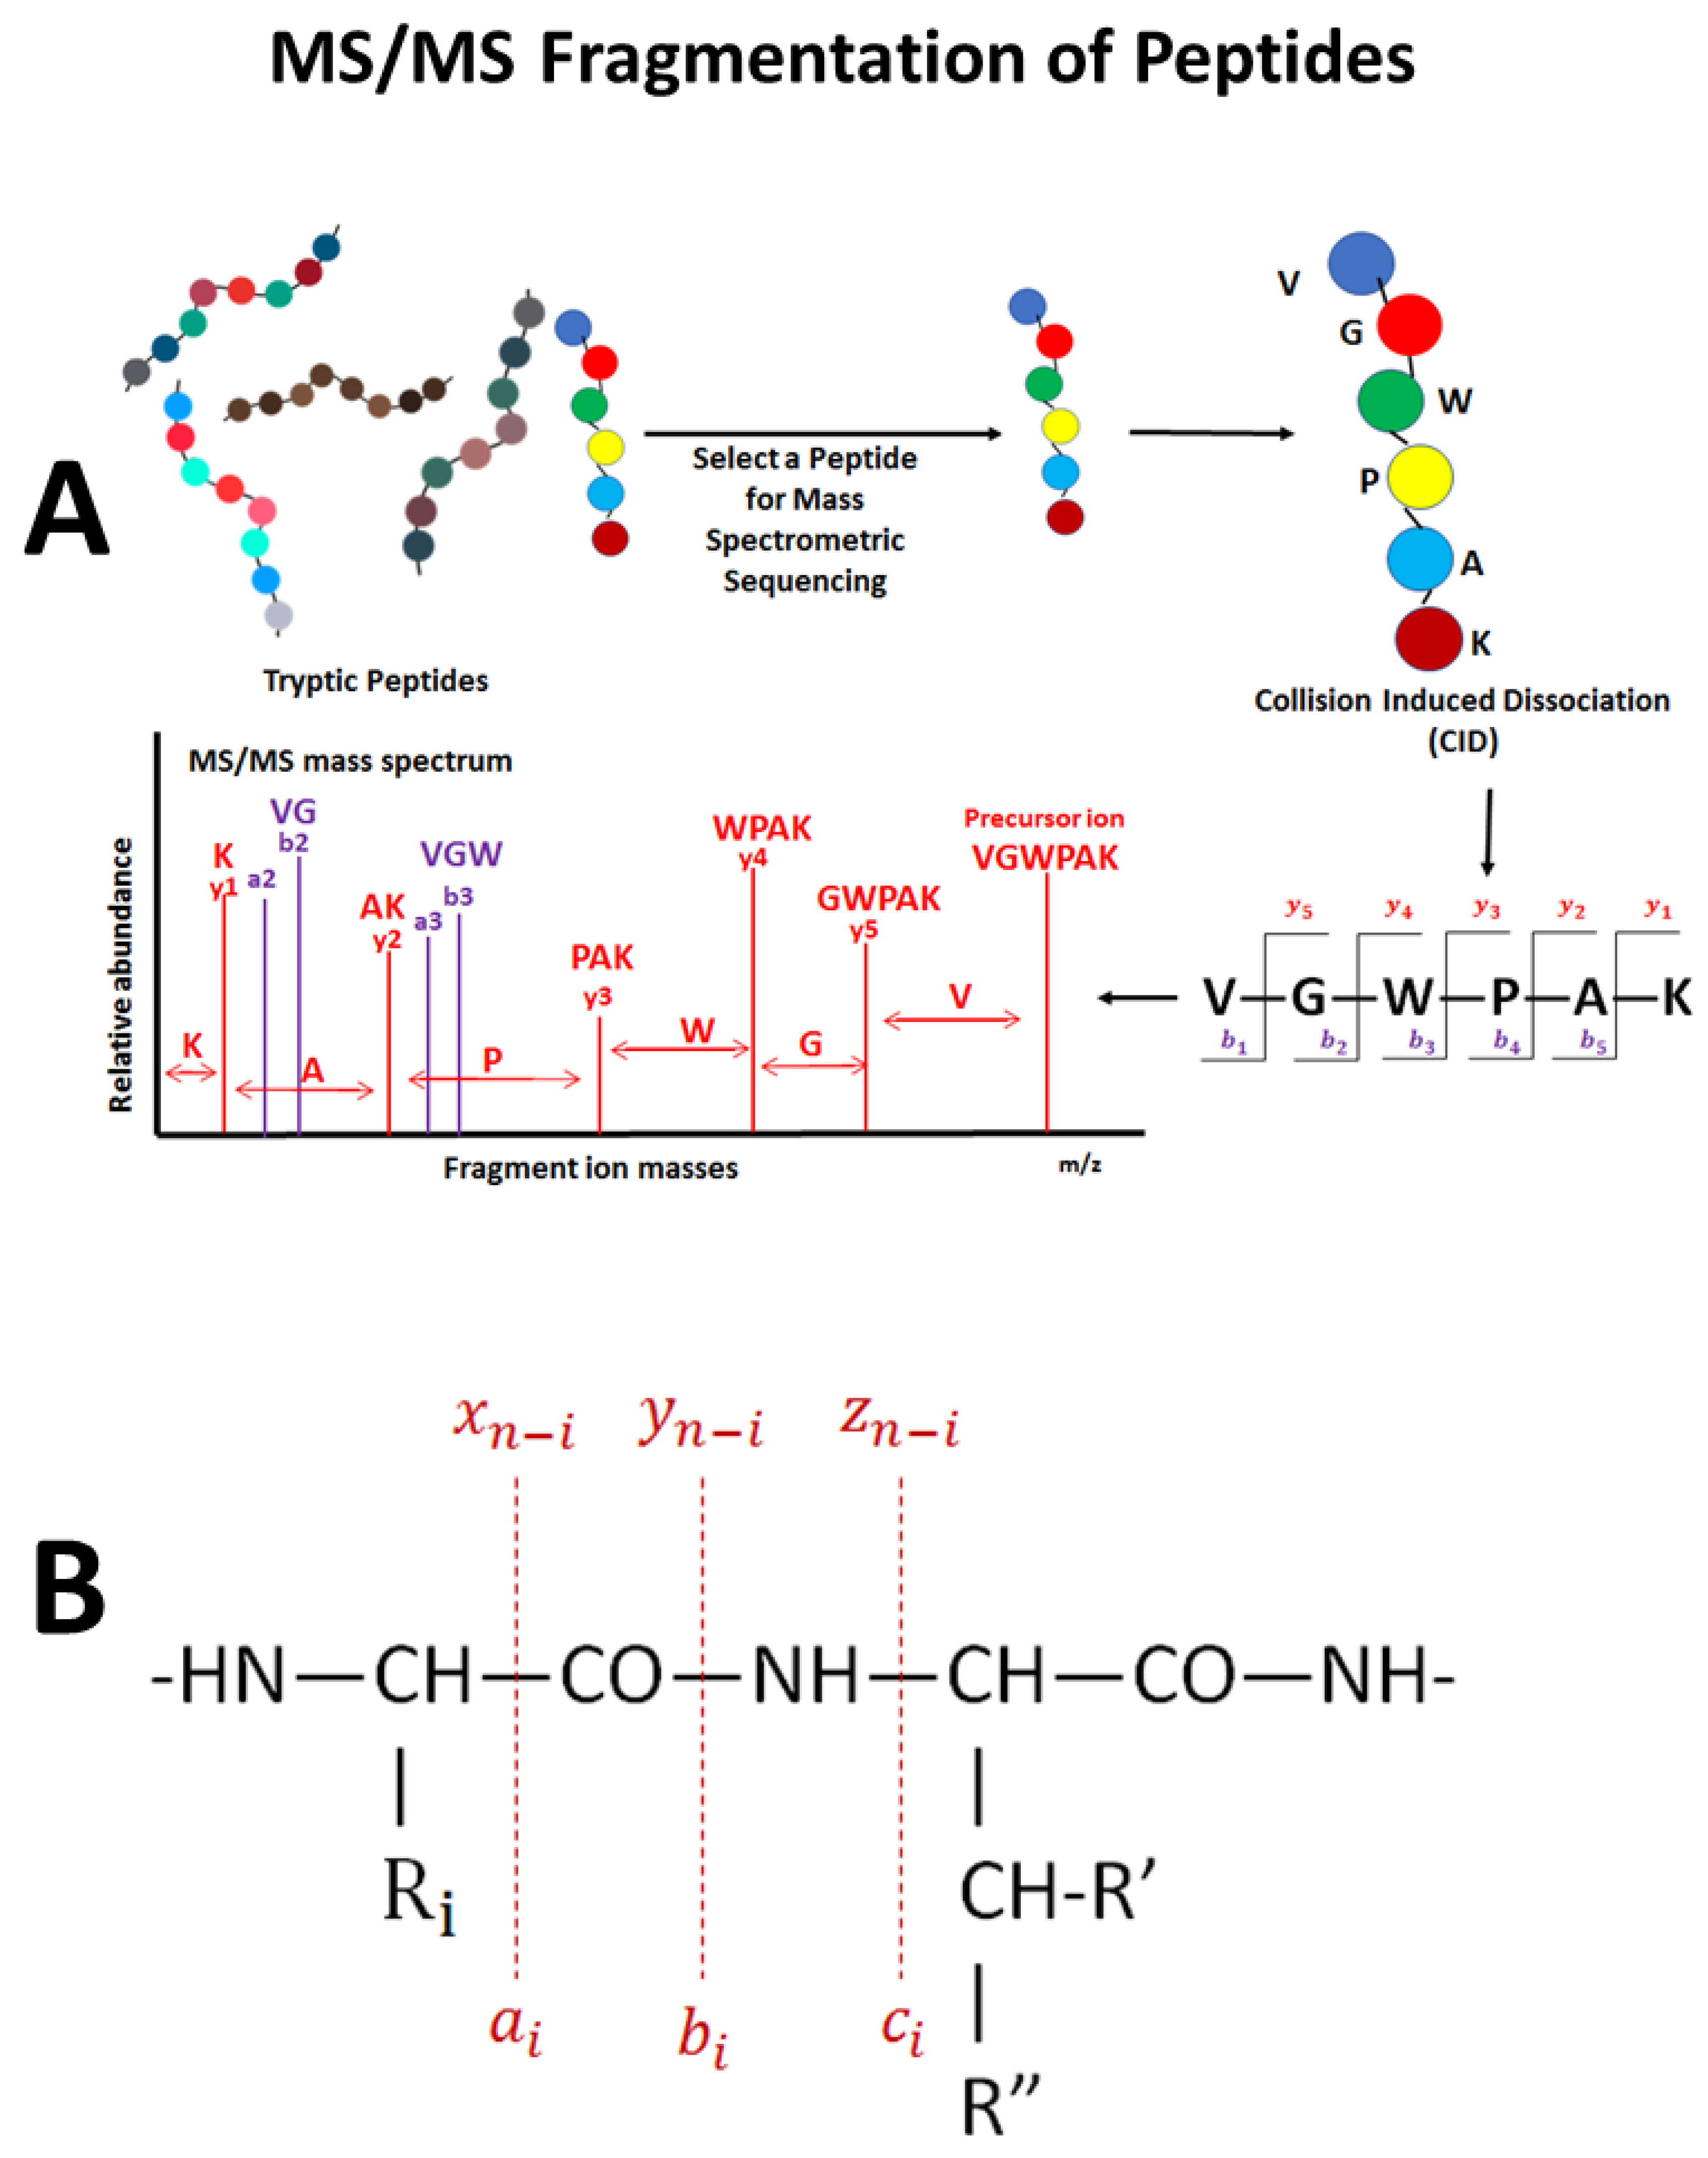
2. Bottom-Up Proteomics
3. Sample Preparation
3.1. The Good
3.2. The Bad
3.3. The Future
4. Conventional HPLC/Modern UHPLC Fractionation
4.1. The Good
4.2. The Bad
4.3. The Future
5. MS Analysis: Instrumentation
5.1. The Good
5.2. The Bad
5.3. The Future
6. Analysis of Mass Spectrometry Data
6.1. The Good
6.2. The Bad
6.3. The Future
7. False Positives, False Negatives, and Unassigned Spectra
7.1. The Good
7.2. The Bad
7.3. The Future
8. Conclusions
Funding
Acknowledgments
Conflicts of Interest
References
- Schwenk, J.M.; Omenn, G.S.; Sun, Z.; Campbell, D.S.; Baker, M.S.; Overall, C.M.; Aebersold, R.; Moritz, R.L.; Deutsch, E.W. The Human Plasma Proteome Draft of 2017: Building on the Human Plasma PeptideAtlas from Mass Spectrometry and Complementary Assays. J. Proteome Res. 2017, 16, 4299–4310. [Google Scholar] [CrossRef] [PubMed] [Green Version]
- Chen, D.; Li, X.Y.; Zhao, X.; Qin, Y.S.; Zhang, X.X.; Li, J.; Wang, J.M.; Wang, C.F. Proteomics and microstructure profiling of goat milk protein after homogenization. J. Dairy Sci. 2019, 102, 3839–3850. [Google Scholar] [CrossRef] [PubMed]
- Mohanta, T.K.; Khan, A.; Hashem, A.; Abd Allah, E.F.; Al-Harrasi, A. The molecular mass and isoelectric point of plant proteomes. BMC Genom. 2019, 20, 631. [Google Scholar] [CrossRef] [PubMed] [Green Version]
- Aslam, B.; Basit, M.; Nisar, M.A.; Khurshid, M.; Rasool, M.H. Proteomics: Technologies and Their Applications. J. Chromatogr. Sci. 2017, 55, 182–196. [Google Scholar] [CrossRef] [Green Version]
- Swinbanks, D. Australia Backs Innovation, Shuns Telescope. Nature 1995, 378, 653. [Google Scholar] [CrossRef]
- Corthals, G.L.; Wasinger, V.C.; Hochstrasser, D.F.; Sanchez, J.C. The dynamic range of protein expression: A challenge for proteomic research. Electrophoresis 2000, 21, 1104–1115. [Google Scholar] [CrossRef]
- Anderson, N.G.; Matheson, A.; Anderson, N.L. Back to the future: The human protein index (HPI) and the agenda for post-proteomic biology. Proteomics 2001, 1, 3–12. [Google Scholar] [CrossRef]
- Sperling, K. From proteomics to genomics. Electrophoresis 2001, 22, 2835–2837. [Google Scholar] [CrossRef]
- Loo, J.A.; DeJohn, D.E.; Du, P.; Stevenson, T.I.; Loo, R.R.O. Application of mass spectrometry for target identification and characterization. Med. Res. Rev. 1999, 19, 307–319. [Google Scholar] [CrossRef]
- Aicher, L.; Wahl, D.; Arce, A.; Grenet, O.; Steiner, S. New insights into cyclosporine A nephrotoxicity by proteome analysis. Electrophoresis 1998, 19, 1998–2003. [Google Scholar] [CrossRef]
- Zhang, N.; Aebersold, R.; Schwilkowski, B. ProbID: A probabilistic algorithm to identify peptides through sequence database searching using tandem mass spectral data. Proteomics 2002, 2, 1406–1412. [Google Scholar] [CrossRef]
- Tsai, P.L.; Chen, S.F. A Brief Review of Bioinformatics Tools for Glycosylation Analysis by Mass Spectrometry. Mass Spectrom 2017, 6, S0064. [Google Scholar] [CrossRef] [PubMed] [Green Version]
- Nefedov, A.V.; Gilski, M.J.; Sadygov, R.G. Bioinformatics Tools for Mass Spectrometry-Based High-Throughput Quantitative Proteomics Platforms. Curr. Proteom. 2011, 8, 125–137. [Google Scholar] [CrossRef]
- Woods, A.G.; Sokolowska, I.; Ngounou Wetie, A.G.; Channaveerappa, D.; Dupree, E.J.; Jayathirtha, M.; Aslebagh, R.; Wormwood, K.L.; Darie, C.C. Mass Spectrometry for Proteomics-Based Investigation. Adv. Exp. Med. Biol. 2019, 1140, 1–26. [Google Scholar] [PubMed]
- Schirle, M.; Bantscheff, M.; Kuster, B. Mass spectrometry-based proteomics in preclinical drug discovery. Chem. Biol. 2012, 19, 72–84. [Google Scholar] [CrossRef] [Green Version]
- Crutchfield, C.A.; Thomas, S.N.; Sokoll, L.J.; Chan, D.W. Advances in mass spectrometry-based clinical biomarker discovery. Clin. Proteom. 2016, 13, 1. [Google Scholar] [CrossRef] [Green Version]
- Tong, M.; Liu, H.; Hao, J.; Fan, D. Comparative pharmacoproteomics reveals potential targets for berberine, a promising therapy for colorectal cancer. Biochem. Biophys. Res. Commun. 2020, 525, 244–250. [Google Scholar] [CrossRef]
- Parsons, J.; Francavilla, C. ‘Omics Approaches to Explore the Breast Cancer Landscape. Front Cell Dev. Biol. 2019, 7, 395. [Google Scholar] [CrossRef]
- Saleem, S.; Tariq, S.; Aleem, I.; Sadr-Ul, S.; Tahseen, M.; Atiq, A.; Hassan, S.; Abu Bakar, M.; Khattak, S.; Syed, A.A.; et al. Proteomics analysis of colon cancer progression. Clin. Proteom. 2019, 16, 44. [Google Scholar] [CrossRef] [Green Version]
- Rogers, J.C.; Bomgarden, R.D. Sample preparation for mass spectrometry-based proteomics; from proteomes to peptides. In Advances in Experimental Medicine and Biology; Springer New York LLC: New York, NY, USA, 2016; Volume 919, pp. 43–62. [Google Scholar]
- Cristobal, A.; Marino, F.; Post, H.; Van Den Toorn, H.W.P.; Mohammed, S.; Heck, A.J.R. Toward an Optimized Workflow for Middle-Down Proteomics. Anal. Chem. 2017, 89, 3318–3325. [Google Scholar] [CrossRef] [Green Version]
- Kim, M.S.; Pinto, S.M.; Getnet, D.; Nirujogi, R.S.; Manda, S.S.; Chaerkady, R.; Madugundu, A.K.; Kelkar, D.S.; Isserlin, R.; Jain, S.; et al. A draft map of the human proteome. Nature 2014, 509, 575–581. [Google Scholar] [CrossRef] [PubMed] [Green Version]
- Wilhelm, M.; Schlegl, J.; Hahne, H.; Gholami, A.M.; Lieberenz, M.; Savitski, M.M.; Ziegler, E.; Butzmann, L.; Gessulat, S.; Marx, H.; et al. Mass-spectrometry-based draft of the human proteome. Nature 2014, 509, 582–587. [Google Scholar] [CrossRef] [PubMed]
- Addona, T.A.; Abbatiello, S.E.; Schilling, B.; Skates, S.J.; Mani, D.R.; Bunk, D.M.; Spiegelman, C.H.; Zimmerman, L.J.; Ham, A.J.L.; Keshishian, H.; et al. Multi-site assessment of the precision and reproducibility of multiple reaction monitoring-based measurements of proteins in plasma. Nat. Biotechnol. 2009, 27, 633–641. [Google Scholar] [CrossRef] [PubMed] [Green Version]
- Gillet, L.C.; Leitner, A.; Aebersold, R. Mass Spectrometry Applied to Bottom-Up Proteomics: Entering the High-Throughput Era for Hypothesis Testing. Annu. Rev. Anal. Chem. 2016, 9, 449–472. [Google Scholar] [CrossRef]
- Fenyö, D.; Beavis, R.C. The GPMDB REST interface. Bioinformatics 2015, 31, 2056–2058. [Google Scholar] [CrossRef] [Green Version]
- Kiser, J.Z.; Post, M.; Wang, B.; Miyagi, M. Streptomyces erythraeus trypsin for proteomics applications. J. Proteome Res. 2009, 8, 1810–1817. [Google Scholar] [CrossRef] [Green Version]
- Tsiatsiani, L.; Heck, A.J.R. Proteomics beyond trypsin. FEBS J. 2015, 282, 2612–2626. [Google Scholar] [CrossRef]
- Aebersold, R.; Mann, M. Mass spectrometry-based proteomics. Nature 2003, 422, 198–207. [Google Scholar] [CrossRef]
- Graves, P.R.; Haystead, T.A.J. Molecular Biologist’s Guide to Proteomics. Microbiol. Mol. Biol. Rev. 2002, 66, 39–63. [Google Scholar] [CrossRef] [Green Version]
- Lovrić, J. Introducing Proteomics: From Concepts to Sample Separation, Mass Spectrometry and Data Analysis; Wiley-Blackwell: Hoboken, NJ, USA, 2011; p. 283. [Google Scholar]
- Futcher, B.; Latter, G.I.; Monardo, P.; McLaughlin, C.S.; Garrels, J.I. A Sampling of the Yeast Proteome. Mol. Cell. Biol. 1999, 19, 7357–7368. [Google Scholar] [CrossRef] [Green Version]
- Kim, H.; Dan, K.; Shin, H.; Lee, J.; Wang, J.I.; Han, D. An efficient method for high-pH peptide fractionation based on C18 StageTips for in-depth proteome profiling. Anal. Methods 2019, 11, 4693–4698. [Google Scholar] [CrossRef]
- Feist, P.; Hummon, A.B. Proteomic challenges: Sample preparation techniques for Microgram-Quantity protein analysis from biological samples. Int. J. Mol. Sci. 2015, 16, 3537–3563. [Google Scholar] [CrossRef] [Green Version]
- Bandow, J.E. Comparison of protein enrichment strategies for proteome analysis of plasma. Proteomics 2010, 10, 1416–1425. [Google Scholar] [CrossRef] [PubMed]
- Polaskova, V.; Kapur, A.; Khan, A.; Molloy, M.P.; Baker, M.S. High-abundance protein depletion: Comparison of methods for human plasma biomarker discovery. Electrophoresis 2010, 31, 471–482. [Google Scholar] [CrossRef] [PubMed]
- Deeb, S.J.; Cox, J.; Schmidt-Supprian, M.; Mann, M. N-linked glycosylation enrichment for in-depth cell surface proteomics of diffuse large B-cell lymphoma subtypes. Mol. Cell. Proteom. 2014, 13, 240–251. [Google Scholar] [CrossRef] [PubMed] [Green Version]
- Nilsson, C.L.; Dillon, R.; Devakumar, A.; Shi, S.D.H.; Greig, M.; Rogers, J.C.; Krastins, B.; Rosenblatt, M.; Kilmer, G.; Major, M.; et al. Quantitative phosphoproteomic analysis of the STAT3/IL-6/HIF1α signaling network: An initial study in GSC11 glioblastoma stem cells. J. Proteome Res. 2010, 9, 430–443. [Google Scholar] [CrossRef] [PubMed]
- Adachi, J.; Kishida, M.; Watanabe, S.; Hashimoto, Y.; Fukamizu, K.; Tomonaga, T. Proteome-wide discovery of unknown ATP-binding proteins and kinase inhibitor target proteins using an ATP probe. J. Proteome Res. 2014, 13, 5461–5470. [Google Scholar] [CrossRef]
- Lemeer, S.; Zörgiebel, C.; Ruprecht, B.; Kohl, K.; Kuster, B. Comparing immobilized kinase inhibitors and covalent ATP probes for proteomic profiling of kinase expression and drug selectivity. J. Proteome Res. 2013, 12, 1723–1731. [Google Scholar] [CrossRef]
- Patricelli, M.P.; Szardenings, A.K.; Liyanage, M.; Nomanbhoy, T.K.; Wu, M.; Weissig, H.; Aban, A.; Chun, D.; Tanner, S.; Kozarich, J.W. Functional interrogation of the kinome using nucleotide acyl phosphates. Biochemistry 2007, 46, 350–358. [Google Scholar] [CrossRef]
- Kim, B.; Araujo, R.; Howard, M.; Magni, R.; Liotta, L.A.; Luchini, A. Affinity enrichment for mass spectrometry: Improving the yield of low abundance biomarkers. Expert Rev. Proteom. 2018, 15, 353–366. [Google Scholar] [CrossRef]
- Ten Have, S.; Boulon, S.; Ahmad, Y.; Lamond, A.I. Mass spectrometry-based immuno-precipitation proteomics—The user’s guide. Proteomics 2011, 11, 1153–1159. [Google Scholar] [CrossRef] [PubMed] [Green Version]
- Gundry, R.L.; White, M.Y.; Murray, C.I.; Kane, L.A.; Fu, Q.; Stanley, B.A.; Van Eyk, J.E. Preparation of proteins and peptides for mass spectrometry analysis in a bottom-up proteomics workflow. Curr. Protoc. Mol. Biol. 2009, 90, 10–25. [Google Scholar]
- Tubaon, R.M.; Haddad, P.R.; Quirino, J.P. Sample Clean-up Strategies for ESI Mass Spectrometry Applications in Bottom-up Proteomics: Trends from 2012 to 2016. Proteomics 2017, 17, 1700011. [Google Scholar] [CrossRef] [PubMed]
- Curreem, S.O.T.; Watt, R.M.; Lau, S.K.P.; Woo, P.C.Y. Two-dimensional gel electrophoresis in bacterial proteomics. Protein Cell 2012, 3, 346–363. [Google Scholar] [CrossRef] [PubMed] [Green Version]
- Kendrick, N.; Darie, C.C.; Hoelter, M.; Powers, G.; Johansen, J. 2D SDS PAGE in Combination with Western Blotting and Mass Spectrometry Is a Robust Method for Protein Analysis with Many Applications. Adv. Exp. Med. Biol. 2019, 1140, 563–574. [Google Scholar]
- Anguraj Vadivel, A.K. Gel-based proteomics in plants: Time to move on from the tradition. Front. Plant Sci. 2015, 6, 1–4. [Google Scholar] [CrossRef] [Green Version]
- Rogowska-Wrzesinska, A.; Le Bihan, M.C.; Thaysen-Andersen, M.; Roepstorff, P. 2D gels still have a niche in proteomics. J. Proteom. 2013, 88, 4–13. [Google Scholar] [CrossRef]
- Loo, R.R.O.; Dales, N.; Andrews, P.C. Surfactant effects on protein structure examined by electrospray ionization mass spectrometry. Protein Sci. 1994, 3, 1975–1983. [Google Scholar] [CrossRef] [Green Version]
- Loo, R.R.; Dales, N.; Andrews, P.C. The effect of detergents on proteins analyzed by electrospray ionization. Methods Mol. Biol. (Cliftonn. J.) 1996, 61, 141–160. [Google Scholar]
- Keller, B.O.; Sui, J.; Young, A.B.; Whittal, R.M. Interferences and contaminants encountered in modern mass spectrometry. Anal. Chim. Acta 2008, 627, 71–81. [Google Scholar] [CrossRef]
- Yocum, A.K.; Yu, K.; Oe, T.; Blair, I.A. Effect of immunoaffinity depletion of human serum during proteomic investigations. J. Proteome Res. 2005, 4, 1722–1731. [Google Scholar] [CrossRef] [PubMed]
- Xu, B.; Zhang, Y.; Zhao, Z.; Yoshida, Y.; Magdeldin, S.; Fujinaka, H.; Ismail, T.A.; Yaoita, E.; Yamamoto, T. Usage of electrostatic eliminator reduces human keratin contamination significantly in gel-based proteomics analysis. J. Proteom. 2011, 74, 1022–1029. [Google Scholar] [CrossRef] [PubMed]
- Hodge, K.; Have, S.T.; Hutton, L.; Lamond, A.I. Cleaning up the masses: Exclusion lists to reduce contamination with HPLC-MS/MS. J. Proteom. 2013, 88, 92–103. [Google Scholar] [CrossRef] [PubMed] [Green Version]
- Lyngholm, M.; Vorum, H.; Nielsen, K.; Ehlers, N.; Honoré, B. Attempting to distinguish between endogenous and contaminating cytokeratins in a corneal proteomic study. BMC Ophthalmol. 2011, 11, 3. [Google Scholar] [CrossRef] [Green Version]
- Rabilloud, T. Two-dimensional gel electrophoresis in proteomics: Old, old fashioned, but it still climbs up the mountains. Proteomics 2002, 2, 3–10. [Google Scholar] [CrossRef]
- Wilkins, M.R.; Gasteiger, E.; Sanchez, J.C.; Bairoch, A.; Hochstrasser, D.F. Two-dimensional gel electrophoresis for proteome projects: The effects of protein hydrophobicity and copy number. Electrophoresis 1998, 19, 1501–1505. [Google Scholar] [CrossRef] [PubMed]
- Doellinger, J.; Schneider, A.; Hoeller, M.; Lasch, P. Sample Preparation by Easy Extraction and Digestion (SPEED)—A Universal, Rapid, and Detergent-free Protocol for Proteomics Based on Acid Extraction. Mol. Cell. Proteom. 2020, 19, 209–222. [Google Scholar] [CrossRef] [PubMed]
- Ye, X.T.; Tang, J.; Mao, Y.H.; Lu, X.; Yang, Y.; Chen, W.D.; Zhang, X.Y.; Xu, R.L.; Tian, R.J. Integrated proteomics sample preparation and fractionation: Method development and applications. Trac-Trends Anal. Chem. 2019, 120, 115667. [Google Scholar] [CrossRef]
- Wiśniewski, J.R. Filter-Aided Sample Preparation: The Versatile and Efficient Method for Proteomic Analysis. In Methods in Enzymology; Academic Press Inc.: Cambridge, MA, USA, 2017; pp. 15–27. [Google Scholar]
- Wiśniewski, J.R. Filter-aided sample preparation for proteome analysis. In Methods in Molecular Biology; Humana Press Inc.: Totowa, NJ, USA, 2018; pp. 3–10. [Google Scholar]
- Kulak, N.A.; Pichler, G.; Paron, I.; Nagaraj, N.; Mann, M. Minimal, encapsulated proteomic-sample processing applied to copy-number estimation in eukaryotic cells. Nat. Methods 2014, 11, 319. [Google Scholar] [CrossRef]
- Zhu, Y.; Piehowski, P.D.; Zhao, R.; Chen, J.; Shen, Y.F.; Moore, R.J.; Shukla, A.K.; Petyuk, V.A.; Campbell-Thompson, M.; Mathews, C.E.; et al. Nanodroplet processing platform for deep and quantitative proteome profiling of 10–100 mammalian cells. Nat. Commun. 2018, 9, 1–10. [Google Scholar] [CrossRef] [Green Version]
- Yuan, H.M.; Zhang, S.; Zhao, B.F.; Weng, Y.J.; Zhu, X.D.; Li, S.W.; Zhang, L.H.; Zhang, Y.K. Enzymatic Reactor with Trypsin Immobilized on Graphene Oxide Modified Polymer Microspheres To Achieve Automated Proteome Quantification. Anal. Chem. 2017, 89, 6324–6329. [Google Scholar] [CrossRef] [PubMed]
- Zougman, A.; Selby, P.J.; Banks, R.E. Suspension trapping (STrap) sample preparation method for bottom- up proteomics analysis. Proteomics 2014, 14, 1006–1010. [Google Scholar] [CrossRef]
- Hughes, C.S.; Foehr, S.; Garfield, D.A.; Furlong, E.E.; Steinmetz, L.M.; Krijgsveld, J. Ultrasensitive proteome analysis using paramagnetic bead technology. Mol. Syst. Biol. 2014, 10, 757. [Google Scholar] [CrossRef]
- Muller, T.; Kalxdorf, M.; Longuespee, R.; Kazdal, D.N.; Stenzinger, A.; Krijgsveld, J. Automated sample preparation with SP3 for low-input clinical proteomics. Mol. Syst. Biol. 2020, 16, e9111. [Google Scholar] [CrossRef] [PubMed]
- Wolters, D.A.; Washburn, M.P.; Yates, J.R., 3rd. An automated multidimensional protein identification technology for shotgun proteomics. Anal. Chem. 2001, 73, 5683–5690. [Google Scholar] [CrossRef] [PubMed]
- Horning, E.C.; Carroll, D.I.; Dzidic, I.; Haegele, K.D.; Horning, M.G.; Stillwell, R.N. Atmospheric pressure ionization (API) mass spectrometry. Solvent-mediated ionization of samples introduced in solution and in a liquid chromatograph effluent stream. J. Chromatogr. Sci. 1974, 12, 725–729. [Google Scholar] [CrossRef]
- Blakley, C.R.; Carmody, J.J.; Vestal, M.L. A New Soft Ionization Technique for Mass-Spectrometry of Complex-Molecules. J. Am. Chem. Soc. 1980, 102, 5931–5933. [Google Scholar] [CrossRef]
- Blakley, C.R.; Carmody, J.C.; Vestal, M.L. Combined Liquid Chromatograph-Mass Spectrometer for Involatile Biological Samples. Clin. Chem. 1980, 26, 1467–1473. [Google Scholar] [CrossRef]
- Anderson, N.L.; Anderson, N.G. The human plasma proteome—History, character, and diagnostic prospects. Mol. Cell. Proteom. 2002, 1, 845–867. [Google Scholar] [CrossRef] [Green Version]
- Mant, C.T.; Chen, Y.; Yan, Z.; Popa, T.V.; Kovacs, J.M.; Mills, J.B.; Tripet, B.P.; Hodges, R.S. HPLC analysis and purification of peptides. Methods Mol. Biol. 2007, 386, 3–55. [Google Scholar]
- Neverova, I.; Van Eyk, J.E. Application of reversed phase high performance liquid chromatography for subproteomic analysis of cardiac muscle. Proteomics 2002, 2, 22–31. [Google Scholar] [CrossRef]
- Chait, B.T. Chemistry. Mass spectrometry: Bottom-up or top-down? Science 2006, 314, 65–66. [Google Scholar] [CrossRef] [PubMed]
- Duong-Ly, K.C.; Gabelli, S.B. Gel filtration chromatography (size exclusion chromatography) of proteins. Methods Enzym. 2014, 541, 105–114. [Google Scholar]
- Li, Y.; Gu, C.; Gruenhagen, J.; Zhang, K.; Yehl, P.; Chetwyn, N.P.; Medley, C.D. A size exclusion-reversed phase two dimensional-liquid chromatography methodology for stability and small molecule related species in antibody drug conjugates. J. Chromatogr. A 2015, 1393, 81–88. [Google Scholar] [CrossRef]
- Duong-Ly, K.C.; Gabelli, S.B. Using ion exchange chromatography to purify a recombinantly expressed protein. Methods Enzym. 2014, 541, 95–103. [Google Scholar]
- Cai, W.; Tucholski, T.; Chen, B.; Alpert, A.J.; McIlwain, S.; Kohmoto, T.; Jin, S.; Ge, Y. Top-Down Proteomics of Large Proteins up to 223 kDa Enabled by Serial Size Exclusion Chromatography Strategy. Anal. Chem. 2017, 89, 5467–5475. [Google Scholar] [CrossRef] [Green Version]
- Freeman, W.M.; Lull, M.E.; Guilford, M.T.; Vrana, K.E. Depletion of abundant proteins from non-human primate serum for biomarker studies. Proteomics 2006, 6, 3109–3113. [Google Scholar] [CrossRef]
- Kline, K.G.; Wu, C.C. MudPIT analysis: Application to human heart tissue. Methods Mol. Biol. 2009, 528, 281–293. [Google Scholar]
- Motoyama, A.; Venable, J.D.; Ruse, C.I.; Yates, J.R., 3rd. Automated ultra-high-pressure multidimensional protein identification technology (UHP-MudPIT) for improved peptide identification of proteomic samples. Anal. Chem. 2006, 78, 5109–5118. [Google Scholar] [CrossRef]
- Issaq, H.J.; Chan, K.C.; Janini, G.M.; Conrads, T.P.; Veenstra, T.D. Multidimensional separation of peptides for effective proteomic analysis. .J Chromatogr. B Anal. Technol. Biomed. Life Sci. 2005, 817, 35–47. [Google Scholar] [CrossRef]
- Washburn, M.P.; Wolters, D.; Yates, J.R., 3rd. Large-scale analysis of the yeast proteome by multidimensional protein identification technology. Nat. Biotechnol. 2001, 19, 242–247. [Google Scholar] [CrossRef] [PubMed]
- Lambert, J.P.; Ethier, M.; Smith, J.C.; Figeys, D. Proteomics: From gel based to gel free. Anal. Chem. 2005, 77, 3771–3787. [Google Scholar] [CrossRef] [PubMed]
- Yu, D.; Wang, Z.; Cupp-Sutton, K.A.; Liu, X.; Wu, S. Deep Intact Proteoform Characterization in Human Cell Lysate Using High-pH and Low-pH Reversed-Phase Liquid Chromatography. J. Am. Soc. Mass Spectrom. 2019, 30, 2502–2513. [Google Scholar] [CrossRef] [PubMed]
- Aguilar, M.I. Reversed-phase high-performance liquid chromatography. Methods Mol. Biol. 2004, 251, 9–22. [Google Scholar] [PubMed]
- Solovyeva, E.M.; Lobas, A.A.; Kopylov, A.T.; Ilina, I.Y.; Levitsky, L.I.; Moshkovskii, S.A.; Gorshkov, M.V. FractionOptimizer: A method for optimal peptide fractionation in bottom-up proteomics. Anal. Bioanal. Chem. 2018, 410, 3827–3833. [Google Scholar] [CrossRef]
- Nogueira, R.; Lammerhofer, M.; Lindner, W. Alternative high-performance liquid chromatographic peptide separation and purification concept using a new mixed-mode reversed-phase/weak anion-exchange type stationary phase. J. Chromatogr. A 2005, 1089, 158–169. [Google Scholar] [CrossRef]
- Phillips, H.L.; Williamson, J.C.; van Elburg, K.A.; Snijders, A.P.; Wright, P.C.; Dickman, M.J. Shotgun proteome analysis utilising mixed mode (reversed phase-anion exchange chromatography) in conjunction with reversed phase liquid chromatography mass spectrometry analysis. Proteomics 2010, 10, 2950–2960. [Google Scholar] [CrossRef]
- Vasconcelos Soares Maciel, E.; de Toffoli, A.L.; Sobieski, E.; Domingues Nazario, C.E.; Lancas, F.M. Miniaturized liquid chromatography focusing on analytical columns and mass spectrometry: A review. Anal. Chim. Acta 2020, 1103, 11–31. [Google Scholar] [CrossRef]
- Zuvela, P.; Skoczylas, M.; Jay Liu, J.; Ba Czek, T.; Kaliszan, R.; Wong, M.W.; Buszewski, B. Column Characterization and Selection Systems in Reversed-Phase High-Performance Liquid Chromatography. Chem. Rev. 2019, 119, 3674–3729. [Google Scholar] [CrossRef]
- Maya, F.; Paull, B. Recent strategies to enhance the performance of polymer monoliths for analytical separations. J. Sep. Sci. 2019, 42, 1564–1576. [Google Scholar] [CrossRef]
- Luo, Q.; Shen, Y.; Hixson, K.K.; Zhao, R.; Yang, F.; Moore, R.J.; Mottaz, H.M.; Smith, R.D. Preparation of 20-microm-i.d. silica-based monolithic columns and their performance for proteomics analyses. Anal. Chem. 2005, 77, 5028–5035. [Google Scholar] [CrossRef]
- Novotny, M.V. Capillary biomolecular separations. J. Chromatogr. B Biomed. Sci. Appl. 1997, 689, 55–70. [Google Scholar] [CrossRef]
- Premstaller, A.; Oberacher, H.; Walcher, W.; Timperio, A.M.; Zolla, L.; Chervet, J.P.; Cavusoglu, N.; van Dorsselaer, A.; Huber, C.G. High-performance liquid chromatography-electrospray ionization mass spectrometry using monolithic capillary columns for proteomic studies. Anal. Chem. 2001, 73, 2390–2396. [Google Scholar] [CrossRef] [PubMed]
- He, B.; Tait, N.; Regnier, F. Fabrication of nanocolumns for liquid chromatography. Anal. Chem. 1998, 70, 3790–3797. [Google Scholar] [CrossRef]
- Ion, L.; Petre, B.A. Immuno-Affinity Mass Spectrometry: A Novel Approaches with Biomedical Relevance. Adv. Exp. Med. Biol. 2019, 1140, 377–388. [Google Scholar] [PubMed]
- Yuan, X.; Oleschuk, R.D. Advances in Microchip Liquid Chromatography. Anal Chem 2018, 90, 283–301. [Google Scholar] [CrossRef] [PubMed]
- Andjelkovic, U.; Tufegdzic, S.; Popovic, M. Use of monolithic supports for high-throughput protein and peptide separation in proteomics. Electrophoresis 2017, 38, 2851–2869. [Google Scholar] [CrossRef]
- Thakur, S.S.; Geiger, T.; Chatterjee, B.; Bandilla, P.; Frohlich, F.; Cox, J.; Mann, M. Deep and highly sensitive proteome coverage by LC-MS/MS without prefractionation. Mol. Cell. Proteom. 2011, 10, M110.003699. [Google Scholar] [CrossRef] [Green Version]
- Van Eeckhaut, A.; Lanckmans, K.; Sarre, S.; Smolders, I.; Michotte, Y. Validation of bioanalytical LC-MS/MS assays: Evaluation of matrix effects. J. Chromatogr. B Anal. Technol. Biomed. Life Sci. 2009, 877, 2198–2207. [Google Scholar] [CrossRef]
- MacNair, J.E.; Lewis, K.C.; Jorgenson, J.W. Ultrahigh-pressure reversed-phase liquid chromatography in packed capillary columns. Anal. Chem. 1997, 69, 983–989. [Google Scholar] [CrossRef]
- Denoroy, L.; Zimmer, L.; Renaud, B.; Parrot, S. Ultra high performance liquid chromatography as a tool for the discovery and the analysis of biomarkers of diseases: A review. J. Chromatogr. B Anal. Technol. Biomed. Life Sci. 2013, 927, 37–53. [Google Scholar] [CrossRef] [PubMed]
- Wilson, I.D.; Nicholson, J.K.; Castro-Perez, J.; Granger, J.H.; Johnson, K.A.; Smith, B.W.; Plumb, R.S. High resolution “ultra performance” liquid chromatography coupled to oa-TOF mass spectrometry as a tool for differential metabolic pathway profiling in functional genomic studies. J. Proteome Res. 2005, 4, 591–598. [Google Scholar] [CrossRef] [PubMed]
- Neue, U.D.; Kele, M.; Bunner, B.; Kromidas, A.; Dourdeville, T.; Mazzeo, J.R.; Grumbach, E.S.; Serpa, S.; Wheat, T.E.; Hong, P.; et al. Ultra-performance liquid chromatography technology and applications. Adv. Chromatogr. 2010, 48, 99–143. [Google Scholar]
- Vuckovic, D.; Dagley, L.F.; Purcell, A.W.; Emili, A. Membrane proteomics by high performance liquid chromatography–tandem mass spectrometry: Analytical approaches and challenges. Proteomics 2013, 13, 404–423. [Google Scholar] [CrossRef] [PubMed]
- Fairchild, J.N.; Horvath, K.; Guiochon, G. Theoretical advantages and drawbacks of on-line, multidimensional liquid chromatography using multiple columns operated in parallel. J. Chromatogr. A 2009, 1216, 6210–6217. [Google Scholar] [CrossRef] [PubMed]
- Ball, C.H.; Roulhac, P.L. Multidimensional Techniques in Protein Separations for Neuroproteomics. In Neuroproteomics; Alzate, O., Ed.; CRC Press: Boca Raton, FL, USA, 2010. [Google Scholar]
- Kota, U.; Stolowitz, M.L. Improving Proteome Coverage by Reducing Sample Complexity via Chromatography. Adv. Exp. Med. Biol. 2016, 919, 83–143. [Google Scholar]
- Kocova Vlckova, H.; Pilarova, V.; Svobodova, P.; Plisek, J.; Svec, F.; Novakova, L. Current state of bioanalytical chromatography in clinical analysis. Analyst 2018, 143, 1305–1325. [Google Scholar] [CrossRef]
- Ucles Moreno, A.; Herrera Lopez, S.; Reichert, B.; Lozano Fernandez, A.; Hernando Guil, M.D.; Fernandez-Alba, A.R. Microflow liquid chromatography coupled to mass spectrometry--an approach to significantly increase sensitivity, decrease matrix effects, and reduce organic solvent usage in pesticide residue analysis. Anal. Chem. 2015, 87, 1018–1025. [Google Scholar] [CrossRef]
- Spicer, V.; Krokhin, O.V. Peptide retention time prediction in hydrophilic interaction liquid chromatography. Comparison of separation selectivity between bare silica and bonded stationary phases. J. Chromatogr. A 2018, 1534, 75–84. [Google Scholar] [CrossRef]
- Fenn, J.B.; Mann, M.; Meng, C.K.; Wong, S.F.; Whitehouse, C.M. Electrospray ionization for mass spectrometry of large biomolecules. Science 1989, 246, 64–71. [Google Scholar] [CrossRef]
- Strathmann, F.G.; Hoofnagle, A.N. Current and Future Applications of Mass Spectrometry to the Clinical Laboratory. Am. J. Clin. Pathol. 2011, 136, 609–616. [Google Scholar] [CrossRef] [PubMed]
- Chalmers, M.J.; Gaskell, S.J. Advances in mass spectrometry for proteome analysis. Curr. Opin. Biotechnol. 2000, 11, 384–390. [Google Scholar] [CrossRef]
- Bateman, N.W.; Goulding, S.P.; Shulman, N.J.; Gadok, A.K.; Szumlinski, K.K.; MacCoss, M.J.; Wu, C.C. Maximizing peptide identification events in proteomic workflows using data-dependent acquisition (DDA). Mol. Cell. Proteom. 2014, 13, 329–338. [Google Scholar] [CrossRef] [PubMed] [Green Version]
- Neilson, K.A.; Ali, N.A.; Muralidharan, S.; Mirzaei, M.; Mariani, M.; Assadourian, G.; Lee, A.; Van Sluyter, S.C.; Haynes, P.A. Less label, more free: Approaches in label-free quantitative mass spectrometry. Proteomics 2011, 11, 535–553. [Google Scholar] [CrossRef]
- Tabb, D.L.; Vega-Montoto, L.; Rudnick, P.A.; Variyath, A.M.; Ham, A.-J.L.; Bunk, D.M.; Kilpatrick, L.E.; Billheimer, D.D.; Blackman, R.K.; Cardasis, H.L. Repeatability and reproducibility in proteomic identifications by liquid chromatography-tandem mass spectrometry. J. Proteome Res. 2010, 9, 761–776. [Google Scholar] [CrossRef] [PubMed] [Green Version]
- Doerr, A. DIA mass spectrometry. Nat. Methods 2014, 12, 35. [Google Scholar] [CrossRef]
- Bilbao, A.; Varesio, E.; Luban, J.; Strambio-De-Castillia, C.; Hopfgartner, G.; Müller, M.; Lisacek, F. Processing strategies and software solutions for data-independent acquisition in mass spectrometry. Proteomics 2015, 15, 964–980. [Google Scholar] [CrossRef]
- Lange, V.; Picotti, P.; Domon, B.; Aebersold, R. Selected reaction monitoring for quantitative proteomics: A tutorial. Mol. Syst. Biol. 2008, 4, 14. [Google Scholar] [CrossRef]
- Maiolica, A.; Jünger, M.A.; Ezkurdia, I.; Aebersold, R. Targeted proteome investigation via selected reaction monitoring mass spectrometry. J. Proteom. 2012, 75, 3495–3513. [Google Scholar] [CrossRef]
- Stone, P.; Glauner, T.; Kuhlmann, F.; Schlabach, T.; Miller, K. New Dynamic MRM Mode Improves Data Quality and Triple Quad Quantification in Complex Analyses; Agilent Publication: Santa Clara, CA, USA, 2009. [Google Scholar]
- Rauniyar, N. Parallel reaction monitoring: A targeted experiment performed using high resolution and high mass accuracy mass spectrometry. Int. J. Mol. Sci. 2015, 16, 28566–28581. [Google Scholar] [CrossRef] [Green Version]
- Ronsein, G.E.; Pamir, N.; von Haller, P.D.; Kim, D.S.; Oda, M.N.; Jarvik, G.P.; Vaisar, T.; Heinecke, J.W. Parallel reaction monitoring (PRM) and selected reaction monitoring (SRM) exhibit comparable linearity, dynamic range and precision for targeted quantitative HDL proteomics. J. Proteom. 2015, 113, 388–399. [Google Scholar] [CrossRef] [Green Version]
- Gallien, S.; Duriez, E.; Crone, C.; Kellmann, M.; Moehring, T.; Domon, B. Targeted proteomic quantification on quadrupole-orbitrap mass spectrometer. Mol. Cell. Proteom. 2012, 11, 1709–1723. [Google Scholar] [CrossRef] [PubMed] [Green Version]
- Michalski, A.; Damoc, E.; Hauschild, J.-P.; Lange, O.; Wieghaus, A.; Makarov, A.; Nagaraj, N.; Cox, J.; Mann, M.; Horning, S. Mass Spectrometry-based Proteomics Using Q Exactive, a High-performance Benchtop Quadrupole Orbitrap Mass Spectrometer. Mol. Cell. Proteom. 2011, 10, M111.011015. [Google Scholar] [CrossRef] [PubMed] [Green Version]
- Bonner, R.; Hopfgartner, G. SWATH data independent acquisition mass spectrometry for metabolomics. Trac. Trends Anal. Chem. 2019, 120, 115278. [Google Scholar] [CrossRef]
- Lenz, E.; Bright, J.; Knight, R.; Westwood, F.; Davies, D.; Major, H.; Wilson, I. Metabonomics with 1H-NMR spectroscopy and liquid chromatography-mass spectrometry applied to the investigation of metabolic changes caused by gentamicin-induced nephrotoxicity in the rat. Biomark 2005, 10, 173–187. [Google Scholar] [CrossRef] [PubMed]
- Channaveerappa, D.; Ngounou Wetie, A.G.; Darie, C.C. Bottlenecks in Proteomics: An Update. Adv. Exp. Med. Biol. 2019, 1140, 753–769. [Google Scholar]
- Morris, C.B.; Poland, J.C.; May, J.C.; McLean, J.A. Fundamentals of Ion Mobility-Mass Spectrometry for the Analysis of Biomolecules. Methods Mol. Biol. 2020, 2084, 1–31. [Google Scholar]
- Distler, U.; Kuharev, J.; Navarro, P.; Tenzer, S. Label-free quantification in ion mobility-enhanced data-independent acquisition proteomics. Nat. Protoc. 2016, 11, 795–812. [Google Scholar] [CrossRef]
- Rifai, N.; Gillette, M.A.; Carr, S.A. Protein biomarker discovery and validation: The long and uncertain path to clinical utility. Nat. Biotechnol. 2006, 24, 971–983. [Google Scholar] [CrossRef]
- Han, X.; Aslanian, A.; Yates, J.R., 3rd. Mass spectrometry for proteomics. Curr. Opin. Chem. Biol. 2008, 12, 483–490. [Google Scholar] [CrossRef] [Green Version]
- Liu, Y.; Buil, A.; Collins, B.C.; Gillet, L.C.J.; Blum, L.C.; Cheng, L.-Y.; Vitek, O.; Mouritsen, J.; Lachance, G.; Spector, T.D.; et al. Quantitative variability of 342 plasma proteins in a human twin population. Mol. Syst. Biol. 2015, 11, 786. [Google Scholar] [CrossRef] [PubMed]
- Contino, N.C.; Pierson, E.E.; Keifer, D.Z.; Jarrold, M.F. Charge Detection Mass Spectrometry with Resolved Charge States. J. Am. Soc. Mass Spectrom. 2013, 24, 101–108. [Google Scholar] [CrossRef] [PubMed]
- Zubarev, R.A. Electron-capture dissociation tandem mass spectrometry. Curr. Opin. Biotechnol. 2004, 15, 12–16. [Google Scholar] [CrossRef]
- Mikesh, L.M.; Ueberheide, B.; Chi, A.; Coon, J.J.; Syka, J.E.; Shabanowitz, J.; Hunt, D.F. The utility of ETD mass spectrometry in proteomic analysis. Biochim. Biophys. Acta. 2006, 1764, 1811–1822. [Google Scholar] [CrossRef] [PubMed] [Green Version]
- Wu, G.Y.; Wan, X.; Xu, B.H. A new estimation of protein-level false discovery rate. BMC Genom. 2018, 19, 567. [Google Scholar] [CrossRef] [Green Version]
- Eng, J.K.; McCormack, A.L.; Yates, J.R. An approach to correlate tandem mass spectral data of peptides with amino acid sequences in a protein database. J. Am. Soc. Mass Spectrom. 1994, 5, 976–989. [Google Scholar] [CrossRef] [Green Version]
- Sadygov, R.G. Using SEQUEST with Theoretically Complete Sequence Databases. J. Am. Soc. Mass Spectrom. 2015, 26, 1858–1864. [Google Scholar] [CrossRef] [Green Version]
- Eng, J.K.; Hoopmann, M.R.; Jahan, T.A.; Egertson, J.D.; Noble, W.S.; MacCoss, M.J. A Deeper Look into Comet-Implementation and Features. J. Am. Soc. Mass Spectrom. 2015, 26, 1865–1874. [Google Scholar] [CrossRef] [Green Version]
- Tyanova, S.; Temu, T.; Cox, J. The MaxQuant computational platform for mass spectrometry-based shotgun proteomics. Nat. Protoc. 2016, 11, 2301–2319. [Google Scholar] [CrossRef]
- Webb-Robertson, B.J.M.; Cannon, W.R. Current trends in computational inference from mass spectrometry-based proteomics. Brief. Bioinform. 2007, 8, 304–317. [Google Scholar] [CrossRef] [Green Version]
- Ma, B.; Zhang, K.Z.; Hendrie, C.; Liang, C.Z.; Li, M.; Doherty-Kirby, A.; Lajoie, G. PEAKS: Powerful software for peptide de novo sequencing by tandem mass spectrometry. Rapid Commun. Mass Spectrom. 2003, 17, 2337–2342. [Google Scholar] [CrossRef] [PubMed]
- Taylor, J.A.; Johnson, R.S. Sequence database searches via de novo peptide sequencing by tandem mass spectrometry. Rapid Commun. Mass Spectrom. 1997, 11, 1067–1075. [Google Scholar] [CrossRef]
- Frank, A.; Pevzner, P. PepNovo: De novo peptide sequencing via probabilistic network modeling. Anal. Chem. 2005, 77, 964–973. [Google Scholar] [CrossRef] [PubMed]
- Kalb, S.R.; Baudys, J.; Rees, J.C.; Smith, T.J.; Smith, L.A.; Helma, C.H.; Hill, K.; Kull, S.; Kirchner, S.; Dorner, M.B.; et al. De novo subtype and strain identification of botulinum neurotoxin type B through toxin proteomics. Anal. Bioanal. Chem. 2012, 403, 215–226. [Google Scholar] [CrossRef] [Green Version]
- Medzihradszky, K.F.; Chalkley, R.J. Lessons in De Novo Peptide Sequencing by Tandem Mass Spectrometry. Mass Spectrom. Rev. 2015, 34, 43–63. [Google Scholar] [CrossRef] [Green Version]
- Ma, B. Novor: Real-Time Peptide de Novo Sequencing Software. J. Am. Soc. Mass Spectrom. 2015, 26, 1885–1894. [Google Scholar] [CrossRef] [PubMed] [Green Version]
- Jeong, K.; Kim, S.; Pevzner, P.A. UniNovo: A universal tool for de novo peptide sequencing. Bioinformatics 2013, 29, 1953–1962. [Google Scholar] [CrossRef] [Green Version]
- Keller, A.; Nesvizhskii, A.I.; Kolker, E.; Aebersold, R. Empirical statistical model to estimate the accuracy of peptide identifications made by MS/MS and database search. Anal. Chem. 2002, 74, 5383–5392. [Google Scholar] [CrossRef] [PubMed]
- Jaffe, J.D.; Berg, H.C.; Church, G.M. Proteogenomic mapping as a complementary method to perform genome annotation. Proteomics 2004, 4, 59–77. [Google Scholar] [CrossRef] [PubMed]
- Fertig, E.J.; Slebos, R.; Chung, C.H. Application of genomic and proteomic technologies in biomarker discovery. Am. Soc. Clin. Oncol. Educ. Book 2012, 1, 377–382. [Google Scholar] [CrossRef]
- Sheynkman, G.M.; Shortreed, M.R.; Cesnik, A.J.; Smith, L.M. Proteogenomics: Integrating Next-Generation Sequencing and Mass Spectrometry to Characterize Human Proteomic Variation. Annu. Rev. Anal. Chem. (Palo Alto. Calif.) 2016, 9, 521–545. [Google Scholar] [CrossRef] [PubMed] [Green Version]
- Lai, Y.J.; Yu, D.; Zhang, J.H.; Chen, G.J. Cooperation of Genomic and Rapid Nongenomic Actions of Estrogens in Synaptic Plasticity. Mol. Neurobiol. 2017, 54, 4113–4126. [Google Scholar] [CrossRef] [PubMed] [Green Version]
- Whiteaker, J.R.; Halusa, G.N.; Hoofnagle, A.N.; Sharma, V.; MacLean, B.; Yan, P.; Wrobel, J.A.; Kennedy, J.; Mani, D.R.; Zimmerman, L.J.; et al. CPTAC Assay Portal: A repository of targeted proteomic assays. Nat. Methods 2014, 11, 703–704. [Google Scholar] [CrossRef] [PubMed] [Green Version]
- Dupree, E.J.; Crimmins, B.S.; Holsen, T.M.; Darie, C.C. Developing Well-Annotated Species-Specific Protein Databases Using Comparative Proteogenomics. Adv. Exp. Med. Biol. 2019, 1140, 389–400. [Google Scholar] [PubMed]
- Dupree, E.J.; Crimmins, B.S.; Holsen, T.M.; Darie, C.C. Proteomic Analysis of the Lake Trout (Salvelinus namaycush) Liver Identifies Proteins from Evolutionarily Close and -Distant Fish Relatives. Proteomics 2019, 19, e1800429. [Google Scholar] [CrossRef]
- Mihasan, M.; Babii, C.; Aslebagh, R.; Channaveerappa, D.; Dupree, E.; Darie, C.C. Proteomics based analysis of the nicotine catabolism in Paenarthrobacter nicotinovorans pAO1. Sci. Rep. 2018, 8, 16239. [Google Scholar] [CrossRef]
- Aslebagh, R.; Channaveerappa, D.; Arcaro, K.F.; Darie, C.C. Proteomics analysis of human breast milk to assess breast cancer risk. Electrophoresis 2018, 39, 653–665. [Google Scholar] [CrossRef]
- Channaveerappa, D.; Lux, J.C.; Wormwood, K.L.; Heintz, T.A.; McLerie, M.; Treat, J.A.; King, H.; Alnasser, D.; Goodrow, R.J.; Ballard, G.; et al. Atrial electrophysiological and molecular remodelling induced by obstructive sleep apnoea. J. Cell. Mol. Med. 2017, 21, 2223–2235. [Google Scholar] [CrossRef] [Green Version]
- Ngounou Wetie, A.G.; Wormwood, K.L.; Russell, S.; Ryan, J.P.; Darie, C.C.; Woods, A.G. A Pilot Proteomic Analysis of Salivary Biomarkers in Autism Spectrum Disorder. Autism. Res. 2015, 8, 338–350. [Google Scholar] [CrossRef]
- Leptos, K.C.; Sarracino, D.A.; Jaffe, J.D.; Krastins, B.; Church, G.M. MapQuant: Open-source software for large-scale protein quantification. Proteomics 2006, 6, 1770–1782. [Google Scholar] [CrossRef]
- Pluskal, T.; Castillo, S.; Villar-Briones, A.; Oresic, M. MZmine 2: Modular framework for processing, visualizing, and analyzing mass spectrometry-based molecular profile data. BMC Bioinform. 2010, 11, 395. [Google Scholar] [CrossRef] [PubMed] [Green Version]
- Bellew, M.; Coram, M.; Fitzgibbon, M.; Igra, M.; Randolph, T.; Wang, P.; May, D.; Eng, J.; Fang, R.H.; Lin, C.W.; et al. A suite of algorithms for the comprehensive analysis of complex protein mixtures using high-resolution LC-MS. Bioinformatics 2006, 22, 1902–1909. [Google Scholar] [CrossRef] [PubMed]
- Sturm, M.; Bertsch, A.; Gropl, C.; Hildebrandt, A.; Hussong, R.; Lange, E.; Pfeifer, N.; Schulz-Trieglaff, O.; Zerck, A.; Reinert, K.; et al. OpenMS-An open-source software framework for mass spectrometry. BMC Bioinform. 2008, 9, 1–11. [Google Scholar] [CrossRef] [PubMed]
- Palagi, P.M.; Walther, D.; Quadroni, M.; Catherinet, S.; Burgess, J.; Zimmermann-Ivol, C.G.; Sanchez, J.C.; Binz, P.A.; Hochstrasser, D.F.; Appel, R.D. MSight: An image analysis software for liquid chromatography-mass spectrometry. Proteomics 2005, 5, 2381–2384. [Google Scholar] [CrossRef] [PubMed]
- Mueller, L.N.; Rinner, O.; Schmidt, A.; Letarte, S.; Bodenmiller, B.; Brusniak, M.Y.; Vitek, O.; Aebersold, R.; Muller, M. SuperHirn—A novel tool for high resolution LC-MS-based peptide/protein profiling. Proteomics 2007, 7, 3470–3480. [Google Scholar] [CrossRef] [PubMed]
- Cox, J.; Hein, M.Y.; Luber, C.A.; Paron, I.; Nagaraj, N.; Mann, M. Accurate Proteome-wide Label-free Quantification by Delayed Normalization and Maximal Peptide Ratio Extraction, Termed MaxLFQ. Mol. Cell. Proteom. 2014, 13, 2513–2526. [Google Scholar] [CrossRef] [PubMed] [Green Version]
- Zhu, W.H.; Smith, J.W.; Huang, C.M. Mass Spectrometry-Based Label-Free Quantitative Proteomics. J. Biomed. Biotechnol. 2010, 2010, 840518. [Google Scholar] [CrossRef]
- Kirkpatrick, D.S.; Gerber, S.A.; Gygi, S.P. The absolute quantification strategy: A general procedure for the quantification of proteins and post-translational modifications. Methods 2005, 35, 265–273. [Google Scholar] [CrossRef]
- Nesvizhskii, A.I. Proteogenomics: Concepts, applications and computational strategies. Nat. Methods 2014, 11, 1114–1125. [Google Scholar] [CrossRef]
- Matsuda, F.; Tsugawa, H.; Fukusaki, E. Method for Assessing the Statistical Significance of Mass Spectral Similarities Using Basic Local Alignment Search Tool Statistics. Anal. Chem. 2013, 85, 8291–8297. [Google Scholar] [CrossRef]
- Old, W.M.; Meyer-Arendt, K.; Aveline-Wolf, L.; Pierce, K.G.; Mendoza, A.; Sevinsky, J.R.; Resing, K.A.; Ahn, N.G. Comparison of label-free methods for quantifying human proteins by shotgun proteomics. Mol. Cell. Proteom. 2005, 4, 1487–1502. [Google Scholar] [CrossRef] [PubMed]
- Chen, X.L.; Wei, S.S.; Ji, Y.L.; Guo, X.J.; Yang, F.Q. Quantitative proteomics using SILAC: Principles, applications, and developments. Proteomics 2015, 15, 3175–3192. [Google Scholar] [CrossRef] [PubMed]
- Elias, J.E.; Gygi, S.P. Target-decoy search strategy for increased confidence in large-scale protein identifications by mass spectrometry. Nat. Methods 2007, 4, 207–214. [Google Scholar] [CrossRef] [PubMed]
- Choi, H.; Nesvizhskii, A.I. Semisupervised model-based validation of peptide identifications in mass spectrometry-based proteomics. J. Proteome Res. 2008, 7, 254–265. [Google Scholar] [CrossRef]
- Danilova, Y.; Voronkova, A.; Sulimov, P.; Kertesz-Farkas, A. Bias in False Discovery Rate Estimation in Mass-Spectrometry-Based Peptide Identification. J. Proteome Res. 2019, 18, 2354–2358. [Google Scholar] [CrossRef]
- Kim, H.; Lee, S.; Park, H. Target-small decoy search strategy for false discovery rate estimation. BMC Bioinform. 2019, 20, 438. [Google Scholar] [CrossRef] [Green Version]
- Gonnelli, G.; Stock, M.; Verwaeren, J.; Maddelein, D.; De Baets, B.; Martens, L.; Degroeve, S. A Decoy-Free Approach to the Identification of Peptides. J. Proteome Res. 2015, 14, 1792–1798. [Google Scholar] [CrossRef]
- Eng, J.K.; Searle, B.C.; Clauser, K.R.; Tabb, D.L. A face in the crowd: Recognizing peptides through database search. Mol. Cell. Proteomics 2011, 10. [Google Scholar] [CrossRef] [Green Version]
- Skinner, O.S.; Kelleher, N.L. Illuminating the dark matter of shotgun proteomics. Nat. Biotechnol. 2015, 33, 717. [Google Scholar] [CrossRef]
- Kong, A.T.; Leprevost, F.V.; Avtonomov, D.M.; Mellacheruvu, D.; Nesvizhskii, A.I. MSFragger: Ultrafast and comprehensive peptide identification in mass spectrometry–based proteomics. Nat. Methods 2017, 14, 513. [Google Scholar] [CrossRef] [Green Version]
- Meyer, J.G. Fast Proteome Identification and Quantification from Data-Dependent Acquisition-Tandem Mass Spectrometry using Free Software Tools. Methods Protoc. 2019, 2, 8. [Google Scholar] [CrossRef] [PubMed] [Green Version]
- Wormwood, K.L.; Ngounou Wetie, A.G.; Gomez, M.V.; Ju, Y.; Kowalski, P.; Mihasan, M.; Darie, C.C. Structural Characterization and Disulfide Assignment of Spider Peptide Phalpha1beta by Mass Spectrometry. J. Am. Soc. Mass Spectrom. 2018, 29, 827. [Google Scholar] [CrossRef] [PubMed]


© 2020 by the authors. Licensee MDPI, Basel, Switzerland. This article is an open access article distributed under the terms and conditions of the Creative Commons Attribution (CC BY) license (http://creativecommons.org/licenses/by/4.0/).
Share and Cite
Dupree, E.J.; Jayathirtha, M.; Yorkey, H.; Mihasan, M.; Petre, B.A.; Darie, C.C. A Critical Review of Bottom-Up Proteomics: The Good, the Bad, and the Future of This Field. Proteomes 2020, 8, 14. https://0-doi-org.brum.beds.ac.uk/10.3390/proteomes8030014
Dupree EJ, Jayathirtha M, Yorkey H, Mihasan M, Petre BA, Darie CC. A Critical Review of Bottom-Up Proteomics: The Good, the Bad, and the Future of This Field. Proteomes. 2020; 8(3):14. https://0-doi-org.brum.beds.ac.uk/10.3390/proteomes8030014
Chicago/Turabian StyleDupree, Emmalyn J., Madhuri Jayathirtha, Hannah Yorkey, Marius Mihasan, Brindusa Alina Petre, and Costel C. Darie. 2020. "A Critical Review of Bottom-Up Proteomics: The Good, the Bad, and the Future of This Field" Proteomes 8, no. 3: 14. https://0-doi-org.brum.beds.ac.uk/10.3390/proteomes8030014