1. Introduction
Social Sciences and Humanities (SSH) research is divided into several disciplines, sub-disciplines, and languages. While this specialization makes it possible to investigate a variety of topics, it also leads to fragmentation. Use and reuse of SSH publications is suboptimal, interdisciplinary collaborations are often missed, and as a result the societal, economic, and academic impacts of SSH are limited. Having SSH disciplines embrace Open Science more concretely can help in addressing some of these issues by breaking down barriers and supporting wider collaborations. In line with this, the Horizon 2020 TRIPLE project (
https://project.gotriple.eu/about/, accessed 7 August 2022) seeks to offer a contribution to address some of these issues and break down the siloed approach often common in SSH. It is trying to do so with the design, development, and dissemination of the GoTriple discovery platform (
https://www.gotriple.eu/). GoTriple is a digital solution based on cutting edge web technology and design which should facilitate better discovery for SSH and foster wider collaboration. With the term discovery we mean the capacity to find, expose, and display material such as literature, data, projects, people etc., that researchers would need for their work [
1].
The aim of GoTriple is to make it much easier for scientists, citizens, and business organizations to access scientific publications, data, data processing platforms, and data processing services, with a focus on SSH. This effort is equally linked with the development of Open Science as it is with the fostering of Open Access. The Organisation for Economic Co-operation and Development (OECD) provides the following definition of Open Science: “To make the primary outputs of publicly funded research results—publications and the research data—publicly accessible in digital format with no or minimal restriction” [
2] (p. 7). They add yet another important aspect: “Open Science is about extending the principles of openness to the whole research cycle, fostering sharing and collaboration as early as possible thus entailing a systemic change to the way science and research is done”. The TRIPLE project, via the development of GoTriple, shares the ambition to contribute to Open Science. The technical and philosophical work underpinning the development of GoTriple have been described in detail in the paper by Dumouchel et al. [
3], whilst the paper by Achenbach et al. [
1] discusses the differences between GoTriple and other mainstream discovery services and, in particular, Google Scholar. GoTriple had been initially conceived based on the results of the OPERAS design study which were presented in detail in a white paper [
4] and other studies, for instance, the “European survey on scholarly practices and digital needs in the arts and humanities”, conducted by the Digital Methods and Practices Observatory Working Group (DiMPO) [
5]. These publications identified two important gaps: the difficulty to find resources and researchers in SSH because of their huge fragmentation and the general difficulties that exist in their discovery. They highlighted the existence of a variety of diverse SSH digital repositories as well as the numerous small SSH units in Europe. It is this fragmentation of publications, projects, and people that requires efforts to be made to bring resources together and offer the SSH community digital tools and services that can act as single access points. The GoTriple platform therefore has the ambition to try to address some of the known barriers of interconnection and interoperability across SSH disciplines and communities. There is also a visible gap in the existing European Open Science Cloud service marketplace (
https://search.eosc-portal.eu/search/service?q=*, accessed 7 August 2022), which largely offers services for natural sciences, where on the contrary, SSH services are fairly limited in both numbers and scope. The GoTriple platform therefore is a next necessary step forward for value generation from the SSH community. By becoming an established European discovery platform for SSH resources, GoTriple aims to experiment with and develop new ways to conduct research and especially interdisciplinary research supporting SSH. It is then important to also reflect on what success for a project such as GoTriple could mean. Consequently, in this paper, we discuss the strategy which has been developed by the project for measuring the success of the platform. In doing so, the paper seeks to present an answer to the following practical research problem: when considering the success of an Open Science discovery platform, what should we measure and how? In particular, we aim to explore important aspects associated with the creation and nurturing of a healthy and varied user community of SSH scholars and other actors.
The TRIPLE project’s methodology is based on the combination of two interlinked pillars: the first is the adoption of Open Science practices for the design and development; and the second is a user-centered approach to design with a focus on understanding the researchers’ needs and co-designing core aspects of the platform with them. These two pillars have supported the creation of GoTriple as an innovative multilingual and multicultural discovery solution for SSH. GoTriple presently supports discovery in 10 languages (Italian, Spanish, Portuguese, German, French, Polish, Croatian, Slovene, Ukrainian, and English) and work is ongoing to include additional languages. The platform’s ambition is to provide a central access point that allows discovery at a European scale in the above languages. This is achieved through the harvesting of open repositories, archives, or other open publishing platforms, offering researchers access to publications and other resources. The platform technology is also based on the Isidore (
https://isidore.science/, accessed 8 August 2022) search engine [
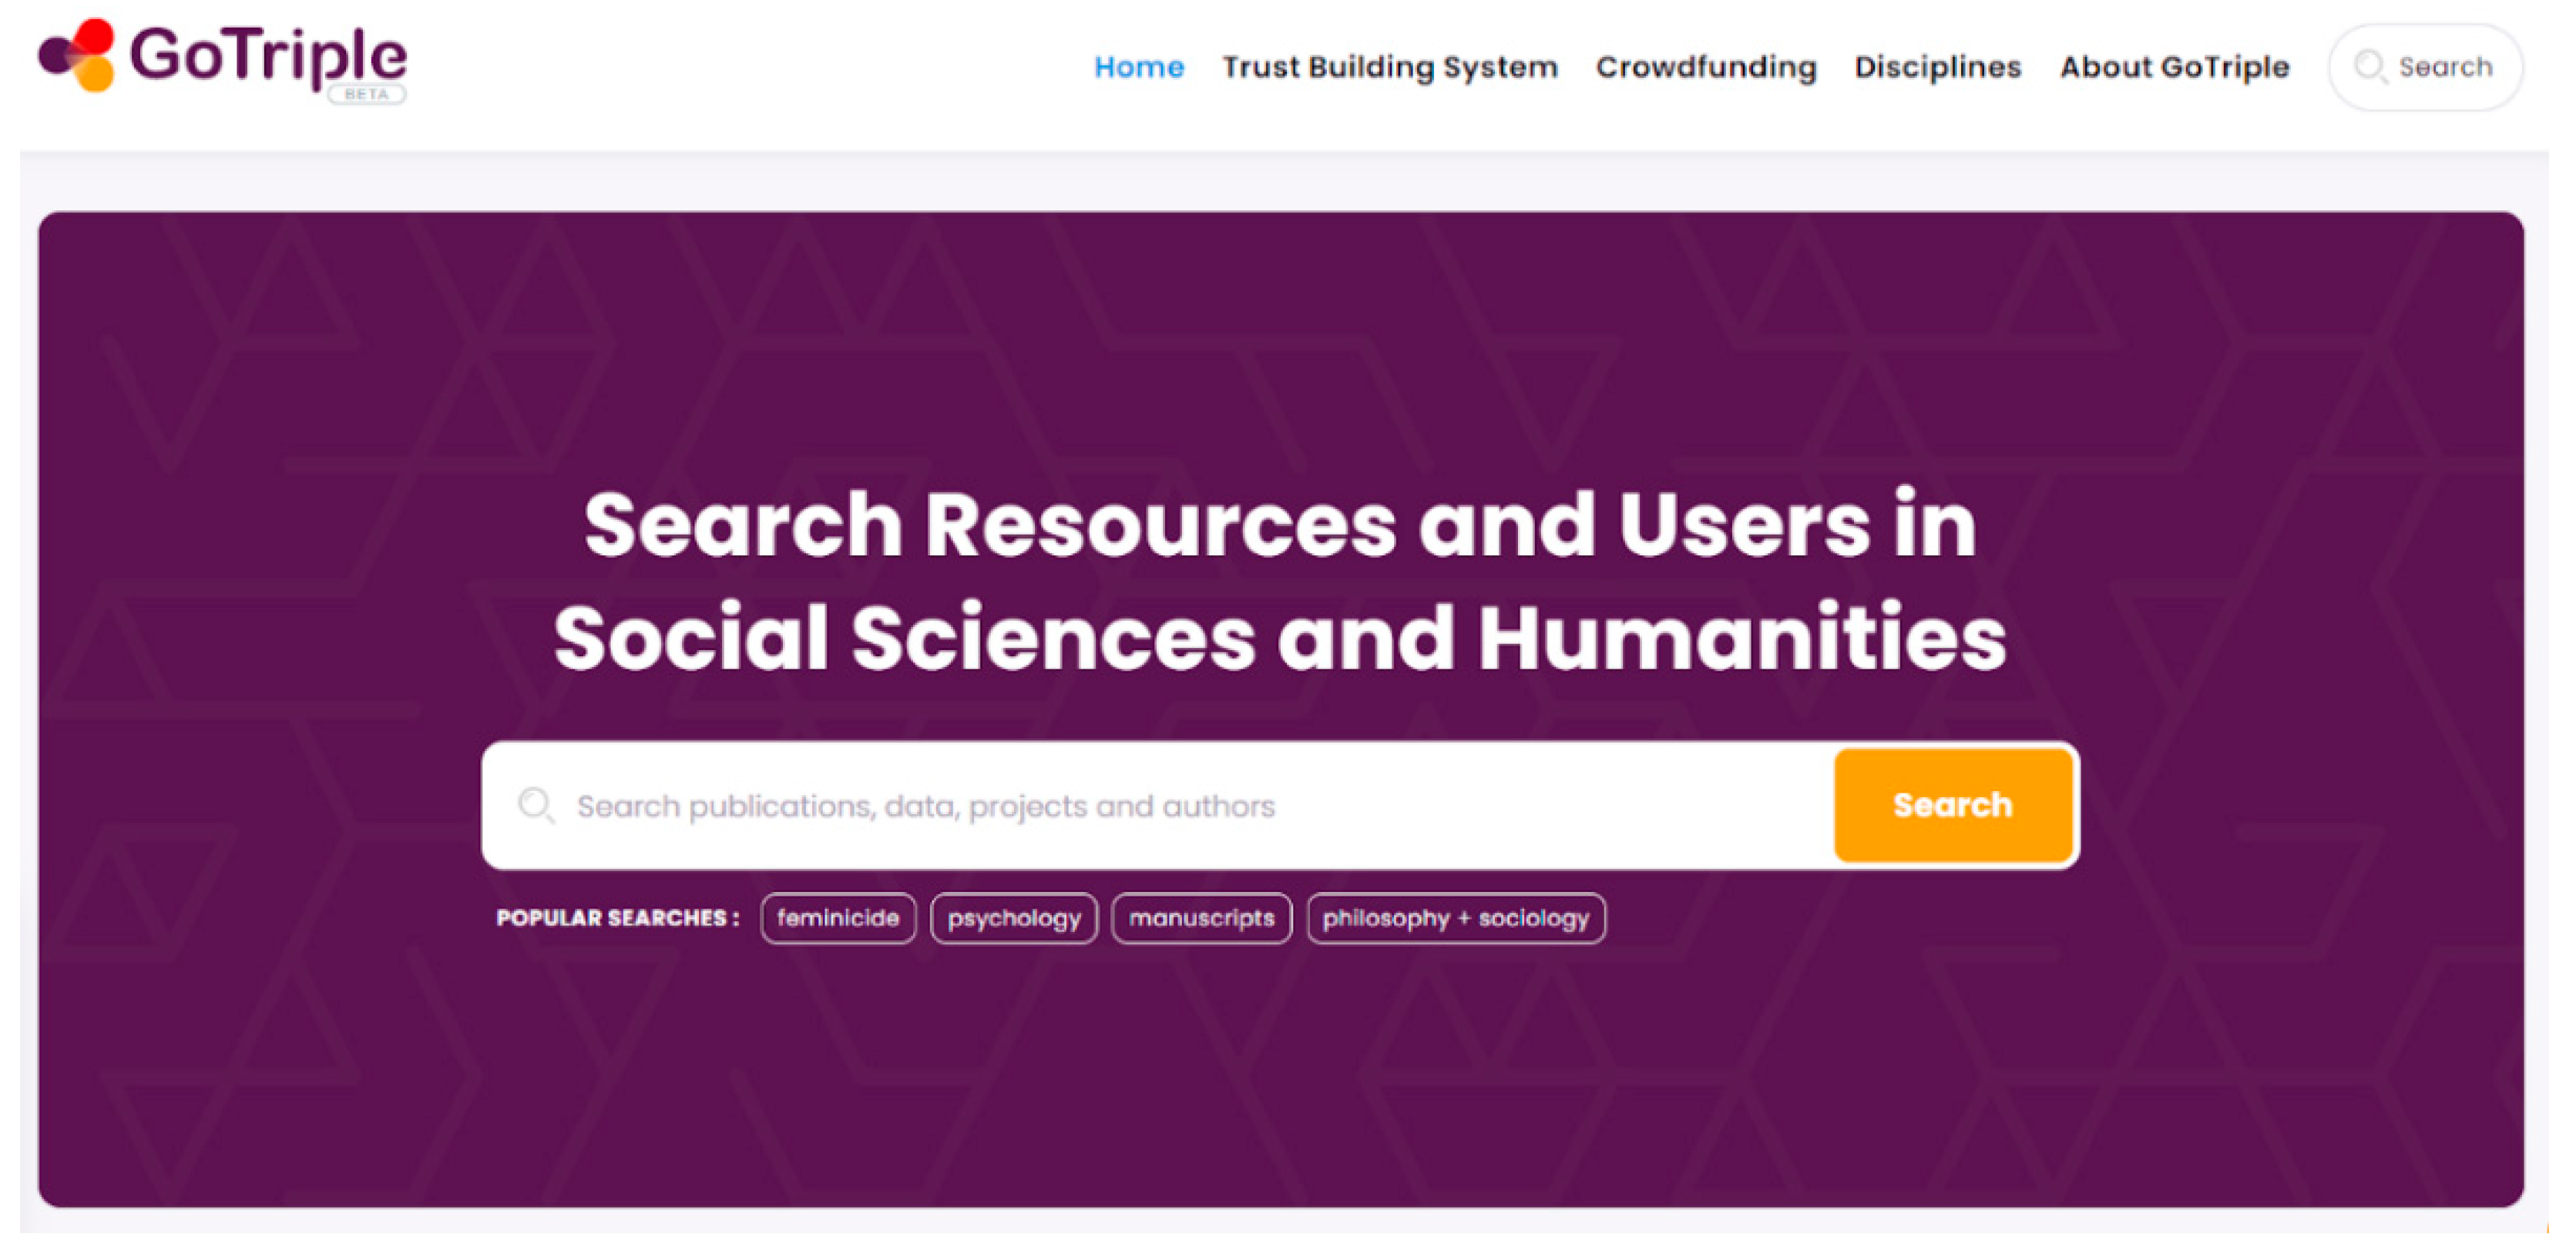
6]. Compared to Isidore, GoTriple additionally boosts several innovative services and specific tailored features (see
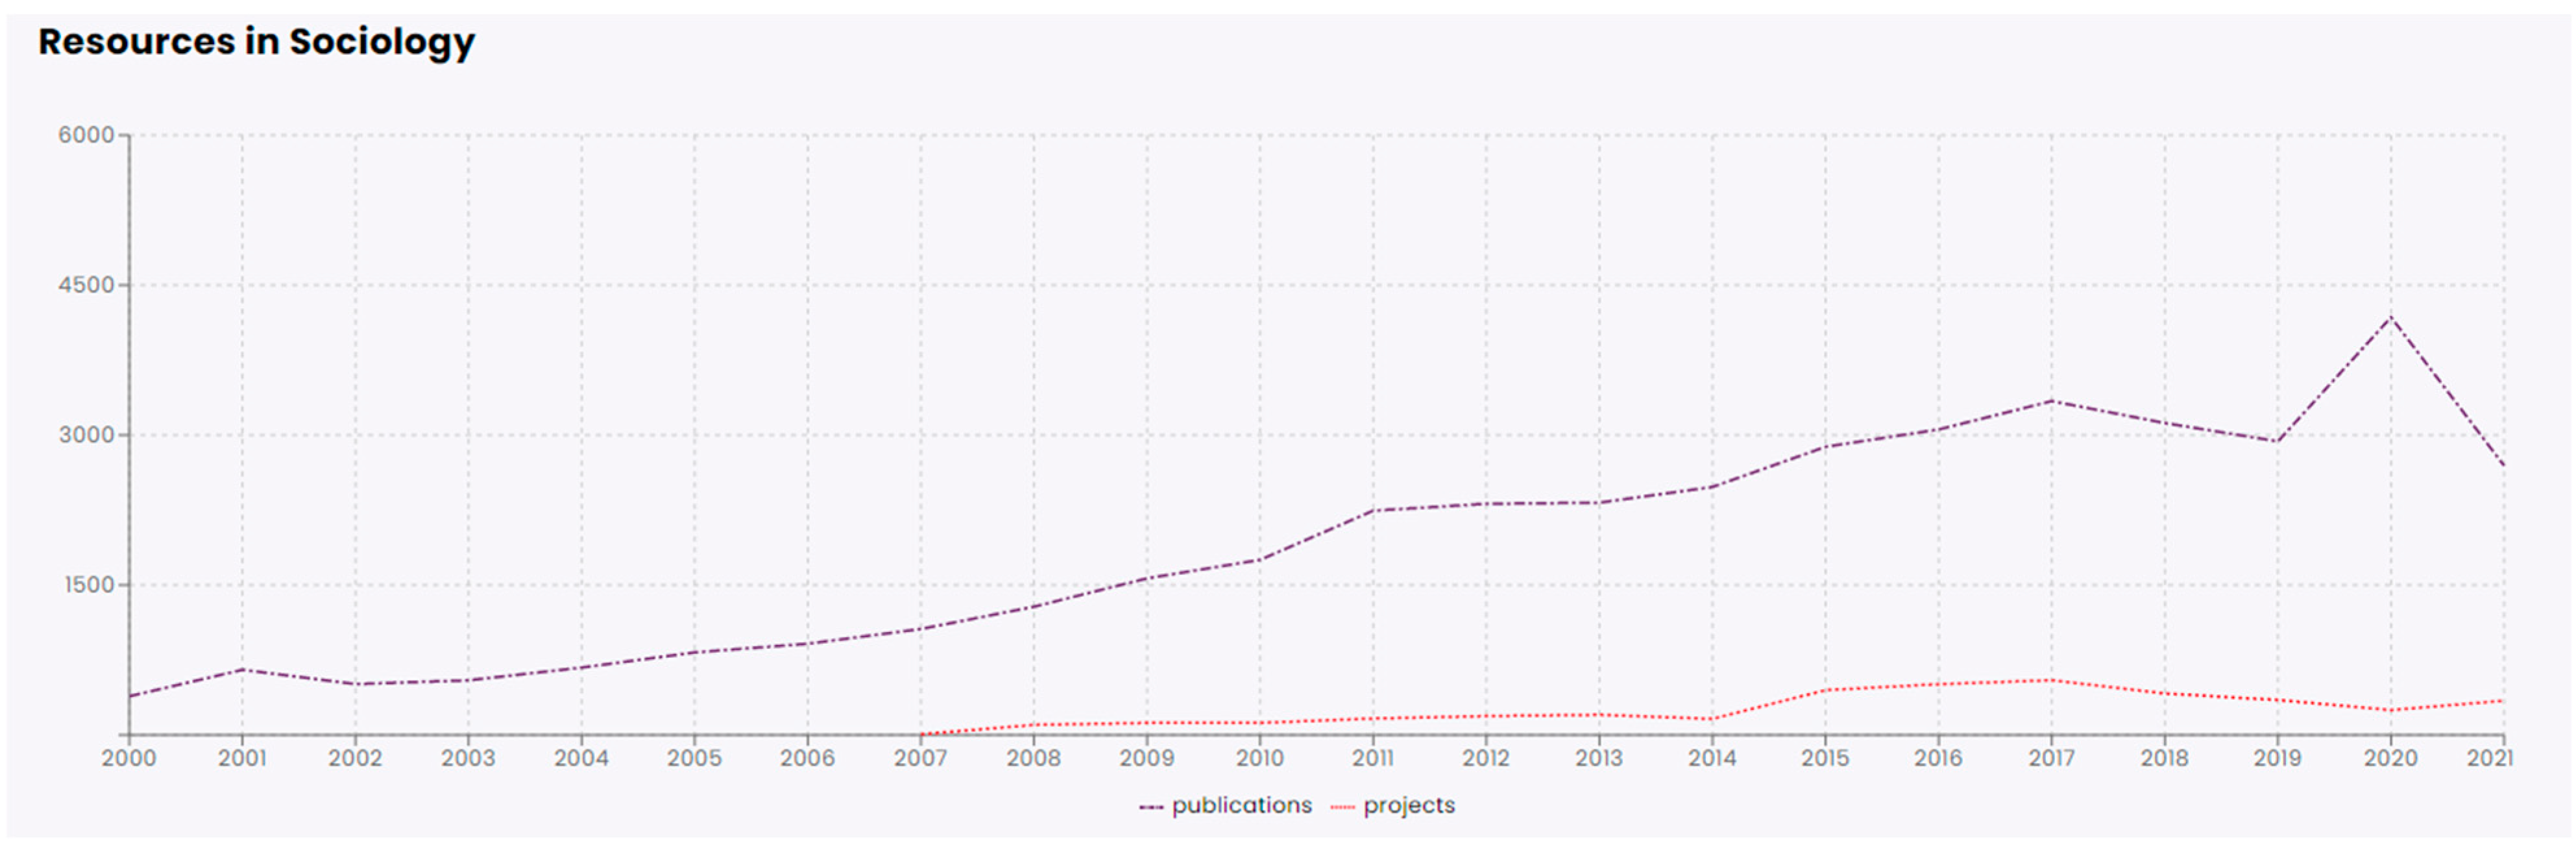
Figure 1 for the main home page). The innovative services include a trust building system, an annotation tool, a crowdfunding solution, and a recommender system, as well as a visual search interface. Tailored features include various dashboards which can be used by the user to explore publications, such as a dashboard related to publications in specific SSH disciplines (see
Figure 2), user profiles, and others.
One problem related not so much to the design but to the achievements of the GoTriple platform is being able to define a set of indicators that can be used to measure success. Obviously for TRIPLE, with it being a European Union funded project, the partners had to propose a set of key performance indicators (KPIs), to measure certain achievements related to the receipt of public funding and tied to the project objectives. These include the number of documents harvested or the number of users at the end of funding. A performance indicator is usually defined as “an item of information collected at regular intervals to track the performance of a system” [
8] (p. 1). Whilst KPIs have a role in assessing performance in achieving certain critical objectives for, e.g., an organization, and they should help to substantially increase a certain performance [
9], they are essentially tied with targets [
10] to be achieved over time. Not meeting a KPI is often synonymous of failure as the performance was not what was expected and the objectives were not met.
In our specific case, whilst meeting the funding KPIs is fundamental for measuring the achievement of high-level objectives, we also need to be mindful that the KPIs proposed at the time of submitting a project proposal are not necessarily a good representation of how the project has evolved over time and they are potentially obsolete after the end of the funding period. Moreover, it is the position of the authors that adopting strict KPIs may not be the only approach to measure the success of an Open Science platform such as GoTriple, as success should be seen as a journey which can go in very many directions more than as a performance target. Indeed, the creation of a new platform is a practical problem which requires reflection, discussion, user involvement, refinement, and further action. For this reason, the TRIPLE project partners have conducted work to define an alternative set of indicators to measure success for an Open Science community platform, based on a modest practice-led approach [
11,
12] rather than one of target achievements. There also is discussion of the importance of adopting both qualitative and quantitative indicators for measuring Open Science, e.g., [
13,
14]. For practical reasons which will be discussed later, the indicators we propose in this work are quantitative in nature, however they are not targets and are used consequently in an inductive manner as potential guides for further action based on our expert interpretation. The goal of this paper is then to present part of the practical work that was conducted to address the problem of “what and how” to measure success for GoTriple. As we will see later in the paper, we have defined the indicators for measuring success in GoTriple as
compass indicators. This specific name was adopted to move away from the idea of measuring success as a target to achieve and instead define success more as a journey where trajectories could be evaluated and actions taken.
2. State of the Art
Within the field of Open Science and Open Access publishing there is debate about the need to measure success in ways that differ from the closed model of publishing. See [
13,
14,
15,
16] for some contributions to this debate. Traditionally, bibliographic metrics have been used to measure the success of publications and their impact, and these include aspects such as the number of citations, the impact factor of a journal, or the H-index of a scholar. However, in time, the scientific community started to look at alternative metrics to assess the value of academic publishing and a debate on how to measure success ensued. This debate goes back more than ten years and is tied to the advent of the digitalization of publishing and social media [
17], which has shown the limits of measuring the impact of academic publishing based on only traditional bibliographic metrics (arguably originally developed before digital publishing). On one side, there has been a call to include metrics based on social media, for example the number of visualizations, downloads, or bookmarks for a publication. On the other hand, it is now recognized that there are a variety of outputs of science (beyond publications) which include, for example, datasets, but also self-publishing outputs (e.g., scientific blogs) and others. This has led to the definition of alternative metrics, or altmetrics, and the publication of a manifesto [
18]. Authors have noted how altmetrics can provide an important contribution to the development of Open Science [
18], for example, by widening the potential audiences or allowing the impact of a wider variety of outputs to be assessed. Authors have also pointed to the need to go beyond the idea of altmetrics, proposing concepts such as “open metrics” [
19] and “next-generation metrics” [
13]. This last proposition emphasizes that metrics cannot offer a “one size fits all solution” (p. 15) to measure the success of Open Science and offer a set of criteria for the development of responsible metrics for Open Science which include: (1) robustness (the use the best data available); (2) humility (quantitative measures should go alongside qualitative ones and expert judgements); (3) transparency (ensuring that transparency of the data collection process for stakeholders); (4) diversity (ensuring metrics support plurality), and (5) reflexivity (assume that metrics can impact a project and reflect on them and update them).
Several organizations have waded in on this debate, for example, UNESCO which has promoted a recommendation on open science [
20], with “a common definition, shared values, principles, and standards for open science at the international level and proposes a set of actions conducive to a fair and equitable operationalization of open science for all at the individual, institutional, national, regional, and international levels.” (p. 5). Shared values identified by UNESCO include quality and integrity, collective benefits, equity and fairness, and diversity and inclusiveness. The Open Science Leadership Forum has proposed a set of success factors of Open Science, which include, amongst others, increased equity in research, better recognition of early career researchers or increased accountability of the research enterprise [
21]. Similarly, the European Commission [
22] has established specific initiatives on Open Science, including work on indicators and alternative metrics [
23]. The document “Indicator frameworks for fostering open knowledge practices in science and scholarship” [
24] defines a set of frameworks for establishing relevant indicators for success in Open Science. This document offers recommendations at four levels and includes novel infrastructures, capabilities, best practices, and incentives systems. The document also provides a comprehensive table of potential indicators for each of these actions, based on analysis from the previous literature.
We can see in the first two examples above (UNESCO and the Open Science Leadership Forum) the importance which is given to diversity, inclusion, and the collective benefit that Open Science can bring. However, we need to remark again that these propositions are tied with measuring success at a rather macro or global level (e.g., in a country) and not at the level of a specific project. In the third example (from the EU Commission), there is an emphasis on the need to also operate at levels which are not necessarily global to capture the diverse contexts in which Open Science is achieved; the four actions offer different levels of analysis and vary from the EU-wide level to the level of a single research institute. However, they still are operationalized at a level which is higher than that of a single project (such as GoTriple).
Overall, it has been recently argued [
14] that “diversity, equity, and inclusion are key components of Open Science” and developing metrics for success must reflect this commitment. This surely also applies at the level of a single Open Science project. Indeed, all the above reflections and criteria are a useful frame for the definition of success metrics, and we will reflect on some of them later in the paper. Moreover, we need to remark that some of the propositions above (in particular altmetrics) are tied to Open Science related to publications and we should remember that GoTriple is not concerned with publishing. Nonetheless, what is relevant for us from the above discussion is: (1) the path to finding alternative approaches to measure success which are not necessarily hard-wired to KPIs as targets to meet and (2) that these measures should reflect, amongst others, issues such as equality, diversity, and inclusion. Moreover, it is clear that the importance of using available data and to reflect on the transparency of what is being measured at all levels (see in particular [
13]).
In an albeit tangential area to Open Science, Open Source Software (OSS) projects have also grappled with the issue of defining metrics for success for quite some time. Whilst in this paper we are not concerned directly with the problem of evaluating the success of the GoTriple as an OSS, there are interesting insights that can be derived from the literature. Willinsky [
25] noticed the potential convergence between Open Source and Open Science in several areas but especially “a common commitment to a larger public sphere”. Over time, OSS projects had to define metrics of success going beyond those of traditional information system development. Moreover, the OSS efforts are also generally operating at a project level rather than at a macro-global level. There is somehow a parallel here with Open Science in terms of proposing some alternative metrics, but this is often a localized endeavor. Whilst OSS has become more and more tied with corporate interests and managers still have to demonstrate things such as the return of investments [
26], OSS is also based on relatively large communities of contributors (often volunteers) attached to specific projects.
That of the measure of success of OSS projects is indeed a debate with an even longer standing than that on Open Science and it dates to at least the early 2000s. For example, Crowston et al. offered one of the earlier accounts [
27] recognizing that OSS is a form of software development which differs from traditional information system development. Therefore, “additional success measures that might be appropriate for OSS” (p. 1) need to be considered, alongside traditional metrics such as those proposed by, e.g., Seddon [
28]. In OSS, while some metrics clearly have to do with the quality of the code or with the management of risks of a project, some other metrics relate to the quality of the management of heterogeneous communities, whilst other metrics deal directly with the success of a community and with aspects such as diversity and inclusion [
29]. Diversity, inclusion, and collective action are therefore keywords that recur in both OSS and in Open Science. For example, the Linux Foundation has established a project called CHAOSS—Community Health Analytics Open Source Software [
30], which places emphasis on, e.g., more traditional metrics related indeed with development and risk management but it also has metrics with a strong focus on equality, inclusivity, and diversity. As has been argued by Goggins et al. [
31], this proposition supports a shift from looking at communities merely in terms of measures to considering instead what is defined as the “health” of a community and the related OSS project: “the potential of projects to continue developing and maintaining quality software” [
32] (p. 31).
Another set of contributions needs to be mentioned in the context of this review in relation to research assessment. There is a lively discussion on reforming the way research is assessed, and this also ties with the potential development of metrics. Our goal is not to assess research or evaluate researchers but rather to assess the success of a platform for Open Science in SSH. Nonetheless, we should also learn from t literature. Efforts for reforming research assessment are being promoted by the Coalition for Advancing Research Assessment, also in collaboration with the EU Commission, which culminated with the publication in 2022 of the Agreement on Reforming Research Assessment [
33]. The agreement includes high-level principles as well as practical commitments for reform. Amongst other things, the document emphasizes again a focus on diversity and inclusion, stresses the importance of also having also qualitative evaluation based on peer-review alongside quantitative indicators, and also to the need to limit the use of institutional rankings or measures such as the H-Index or impact factor alone. The document effectively traces a plan for the reform of research assessment and offers clear steps for this. Similar remarks were made by Gadd [
34] with particular emphasis on empowering researchers, at the expenses of rankings, strict evaluations, or the measurement of what is not necessary. In this context, it is also important to mention the work of the HuMetricHSS initiative which in a white paper [
35] has offered a set of recommendations to support a better alignment of institutional values (in, e.g., universities) with evaluation systems for researchers and impact, with a focus on reappointment, promotion, and tenure. This contribution is interesting because it focuses specifically on humanities and social sciences. The authors argue that “the values that institutions of higher education profess to care most deeply about—articulated through university mission statements, promotional materials, and talking points— are often not the values enacted in the policies and practices that shape academic life” [
35] (p. 10). This requires a better re-alignment of values with the evaluation of researchers. For example, many institutes claim to support equality, diversity, and inclusion however achieving this for, e.g., tenure is quite complex. For instance, the focus on research excellence fosters elitism which translates into the perpetuation of inequality. Hence the formulation of recommendations to realign institutional values with the evaluation of researchers. These contributions are an example of the debate around research evaluation, however this is an area which does not concern GoTriple directly, since what we are interested in here is identifying ways to measure success for an online platform and an online community. Research evaluation clearly is a task for institutes or specific national programs (such as the evaluation of universities carried out by ANVUR in Italy). Nonetheless this literature again points toward the importance of considering equality, diversity, and inclusion, whilst promoting the need for alternative forms of evaluation.
Lastly, it is also not surprising to see some overlap of what was mentioned earlier with the idea of responsible research and innovation (RRI). This is a policy and a framework of the EU Commission for the Horizon 2020 programme [
36] aimed at considering the potential effect of science and innovation and can be seen as “the ongoing process of aligning research and innovation to societal values, needs, and expectations” [
37] (p. 1). A common definition found on various European H2020 project websites states that RRI is “an approach that anticipates and assesses potential implications and societal expectations with regard to research and innovation, with the aim to foster the design of inclusive and sustainable research and innovation” [
36]. RRI is anticipated to have an immediate effect on key areas that promote and monitor both the sustainability and the social justice/inclusion of any research project undertaken as part of European research. RRI is based on six principles which include: (1) governance; (2) ethics; (3) gender equality; (4) public engagement; (5) open access; (6) science education. Open Access, as we can see, is one component of this policy. However, more relevant to our discussion is the focus on equality, diversity, and inclusion. The Commission has also offered a set of indicators to measure the above six principles in practice [
38]. These indicators operate at a high level, national, or supra-national (e.g., the European Union) and are not suitable to be adopted or adapted into metrics for any specific project. Some are also not relevant for our discussion. Nonetheless, these are examples of indicators that place emphasis on the gender balance or on the need to foster better social inclusion of a variety of stakeholders in science and innovation. Like in the previous discussion in Open Science, OSS, and research evaluation, diversity, inclusion, and equality recur as potential areas where success needs to be found—and somehow measured.
As is clear from the review of the literature, we are interested in the idea of embracing alternative ways of measuring success for an Open Science platform, looking at areas such as diversity, inclusion, or collaboration. Moreover, we are interested in moving away from hard-wired KPIs traditionally used to measure whether a project has met its objectives over time. We also need to identify measures that are modest and that can be located at the level of a single project rather than at a micro or even global level.
3. Materials and Methods
The approach and methodology we adopted to define the indicators of success for GoTriple can be seen as: (1) practice-led and (2) emergent. For Candy [
10], practice-led research is “concerned with the nature of practice and leads to new knowledge that has operational significance for that practice”. In practice-led approaches, artefacts play an important role in the creation of knowledge as they “function as a means of realizing a thing which has to be perceived, recognized and conceived, or understood” [
11] (p. 159). Practice-led research is normally associated with creative and artistic practice, but in fact it parallels action research in the field of design, where it is far more established as an approach [
39]. In practice-led research, new knowledge is generated through first the process of making things (e.g., a new design, a new creative artefact) and then second on reflecting on how these things should be, e.g., perceived or understood. It is therefore a two-pronged approach based on making first and reflecting second. Moreover, practice-led research can be, to an extent, distinguished from both the qualitative and quantitative research paradigms [
40], as it locates the main outputs not in written texts (i.e., the scientific papers) using either numerical of qualitative data, but in practical outcomes. This mirrors our own work for GoTriple; the project team engaged in the practice of designing and developing the platform (the making), and then with the artefact at hand there is a process of documenting and reflecting on how the artefact (which includes its ideal user community) could allow the generation of indicators to measure certain aspects of the artefact itself and what these indicators represent. The real output of this work therefore is not this manuscript per se, but it is the production of a set of indicators that can be used for the practical advancement of the platform. Therefore, the definition of the indicators follows the process of making the artefact (the platform in our case) and is the key output of the research presented here. In practice-led research, the role of reflection and documentation is fundamental [
41], where documents (of any sort, whether they be diaries, notes, or anything else) about the practice support further reflection on the construction of the artefact and the knowledge that was generated. Through the making of GoTriple, several documents have been produced including deliverables, for example, as well as specific documents related to the process of defining the indicators which played an important role in the decision-making.
Our approach to the definition of success indicators can also be seen as an emergent process. We did not start with a specific theory or view of the world from which we derived assumptions and deductions. Rather, as we will see later, the definition of success indicators emerged through the practice-led process of making GoTriple as well as from internal discussion. This aligns with the idea that phenomena are not fixed by their specific properties but rather emerge from various social and material practices as discussed by DeLanda [
42] (p. 4), according to whom “separate causes simply add or mix themselves in their joint effect, so that we can see their agency in action in that effect”. Indeed, the indicators for success defined for GoTriple emerged as an outcome of several elements mixing together: the creation of GoTriple itself, the availability of certain data via the platform, the internal discussion amongst the project partners, the reflection of what is being carried out in the area of Open Science metrics (i.e., the literature), the existing project documents, and so on. Thus, the practice-led process of creating a new discovery platform and the blending of various emergent factors coalesced together in the creation of the GoTriple indicators for success.
The material we propose here is tied to the use of various sources of knowledge related to the project as well as internal discussion and decision-making operated by the TRIPLE project team. If one wanted to formalize and summarize the material we used for defining the indicators, one could see this as composed of a mix of: (1) knowledge generated from the participatory research conducted for the GoTriple design; (2) existing assumptions on the basis of the TRIPLE project; and (3) actions and decisions taken directly by the project team during various sessions of discussion and debate on the indicators. Moreover, as a fourth relevant point, we were able to rely on insights driven by the actual development of GoTriple. This last point is especially important in relation to the knowledge of data that would become available from the platform.
As stated earlier, the design of GoTriple is based on a user-centered approach. During the earlier stages of the project, we conducted qualitative interviews (
n = 25) with SSH researchers across Europe (see [
43] for the data, which is currently restricted). These researchers were representative of different disciplines, career levels, ways of working, and so on. While these interviews were conducted to gather the user needs for the design and not directly for the purpose of building success indicators, the analysis of these data (see Forbes et al. [
44]) also offered some knowledge for fostering an internal discussion around the indicators. This includes, for example, observations around the struggle of early career scholars (for example in making their research emerge) or issues around the dominance of English as a publishing language at the expense of other languages. These interviews were conducted following ethical guidelines approved by the Ethical Committee of Abertay University in 2019. In any case, no excerpts of the interviews are shown in this paper, as the knowledge generated from the interviews served as basis for some decisions around the definition of the indicators.
The GoTriple platform has also been developed based on original assumptions. Some of these can be currently read on the project website (see
https://project.gotriple.eu/about/, accessed 12 August 2022). That is, when we proposed our project to the funding agency, we also offered a set of initial assumptions warranting funding support. For example, as stated earlier, GoTriple is a discovery platform for SSH. Much emphasis of the project has always been based on the multilingual aspects of the discovery. Moreover, the focus was on favoring a more collaborative approach amongst the SSH disciplines. Again, these assumptions have connections with inclusivity, diversity, and collaboration and have influenced the definition of our indicators.
The two above are elements of the materials that were given in a certain sense. In practical terms much of the work for the definition of the indicators has been the outcome of internal meetings of an ad hoc group of project partners. This group included amongst others, the project coordinator, the leaders of user research, the leader of communication and dissemination, the leader of the sustainability work. These discussions, specifically five meetings, took place online between March 2021 and June 2022 and an additional meeting took place in person, plus some one-to-one meetings between the coordinator and partners with specific knowledge, which ended with a final presentation of the indicators to the whole consortium in March 2022. A further three meetings took place afterwards to refine the indicators and evaluate their feasibility. Ad hoc discussions also took place with other partners, in particular with the technical team in order to assess the availability of the data and the definition of a long-term technical strategy (which could last beyond the project’s funding). Documentation played an important role during and for the meetings. In each meeting, we took comprehensive notes and minutes about the various options that were evaluated, the decisions that were taken, the reasons for these decisions, and how the work for the preparation of the indicators should have been organized.
4. Results
In this section, we report the decision-making process for the definition of the compass indicators of GoTriple, alongside our understanding of what it means to achieve success in an Open Science discovery platform. To understand the process and the results, we have to put things into context and present what was achieved in the different meetings conducted, as well as comments on the various routes that were evaluated, and the choices made during our practice-led activities.
4.1. The Vague Notion of “Compass Indicators”
The first meeting for the definition of the success indicators took place on 23 March 2021. When the partners participating in the work met for the first time, there were originally different ideas on what the challenge at hand was. We were tied with a specific task of the project stating that we would “evaluate the success of TRIPLE solution in an iterative process every 7 months”, but beyond this, the task description was not restricting us to a specific approach nor was it indicating specific measures or other metrics of sort to adopt. Whilst this loose definition of the task did not offer much guidance, it was also an opportunity to explore different options and ideas. Essentially the practical decision to be taken revolved around this simple question/problem: what to measure and how?
The first meeting took place as a form of brainstorming where different ideas and their merits were discussed among participants (seven in total from four different organizations, including the project coordinator, the lead of user research, the lead of platform sustainability, and the lead of platform interface design). In the beginning, two ideas were floating around on “what to measure”, as potential starting points; on one side evaluating whether people/users were happy with the actual GoTriple platform and on the other side defining a set of KPIs such as the number of users, the number of documents available, and so on.
Discussion ensued on different aspects of these two starting points. Evaluating whether users are happy with the platform is something more akin to evaluating the usability [
45] of the platform and not a measure of success as such. Moreover, in the project there was already work planned to conduct a full usability evaluation (also encompassing a final satisfaction questionnaire). Thus, we agreed that these were not the kind of success measures we were looking for and that this would lead to a duplication of work. On KPIs, discussion ensued on two problems: (1) how the definition of indicators for success would duplicate other KPIs which were required anyway for the funding agency and (2) whether KPIs (even if monitored over time) would indeed be the best way to capture the success of GoTriple. For example, while the overall number of users registered on the platform could be considered a good measure for success as well as a KPI, it is also a very generalist measure which tells little, for example, about the composition of the user base, and if the project is achieving success just beyond increasing numbers, for example, around diversity or collaboration. We started therefore reflecting on the need to have dynamic measures/indicators, the sort of compasses that would allow us to understand how the project was achieving success and also those that would serve as an indication of where we could take actions now and in the future.
This last consideration is connected with the practice-led approach of generating knowledge which has operational capacity for decision-making. For example, what if in building the user base we found that certain European countries are underrepresented or not represented at all? This would then arguably require the team to take some actions for promoting the platform more in the under-represented country. Then, we agreed to abandon the idea of KPIs as targets to meet and began to adopt this, a notion of “compass indicators”. That is, indicators whose main objective is to give us a sense of the direction of where the platform and its community are going, but also indicators that would help us take some actions to change the direction. Essentially the main achievement of the first meeting had been the proposition to adopt this, yet still vague, notion of compass indicators.
In parallel, we also discussed the problem of “how to measure”. At this stage we still were not in the position to have identified what to measure, and therefore the “how” problem was still very loosely approachable. However, something important was clarified. Since the work with the users for the design of GoTriple had been tied with conducting largely qualitative data collection (e.g., interviews, codesign), an initial proposition was to gather evidence for success again with a similar process. However, discussion ensued on whether this was the best approach. On one side, we had already been demanding a lot from our potential user base, and involving them in further interviews might just increase their burden. On the other side, gathering primary data in this way was seen as lacking sustainability. In other words, running questionnaires or interviews is time-consuming and requires significant resources, and in the long term (considering the potential end of funding), this was considered not sustainable. Thus, a proposition was discussed to try to obtain measures based on data generated directly by the GoTriple platform. For example, if we wanted to understand the representation in the user base of the different European countries, we could simply try to obtain this data directly from the GoTriple database if the information was available or use some proxy measures that could provide an indication of this. This proposition of reusing the platform data has some significant advantages, as it would: (1) reduce the burden on the collection of data; (2) allow the direct reuse of data already potentially held in our database; (3) support the process of automation of the measurements; and (4) facilitate the creation of visualization offering an immediate view, rather than waiting for the process of analysis of primary data. It is clear then that our decision to adopt quantitative measures of success over qualitative ones has been dictated by practical reasons tied with the availability of resources in the future, after the end of funding. Qualitative measures do require a lot of resources for data collection and analysis. Quantitative measures based on existing data from the platform do require an initial investment in automating the process, but then in the long term, they can be run with limited resources.
4.2. Preliminary Brainstorming on the Compass Indicators
A second meeting took place on the 11th of May 2021, with a restricted number of participants (three in total, with members from the coordinator team and the lead of user research present). At this stage, having agreed on the notion of “compass indicators”, the next task was to start defining what these compasses were in more detail.
The first part of the discussion concentrated on brainstorming about potential indicators and broad areas/categories of measure. A good discussion took place in relation to the diversity of the GoTriple user community, in particular with the proposal to consider the following indicators:
The balance of female/male users
Good coverage of all European countries in the user base
Good balance at career levels
Good balance of age levels
Good representation at discipline levels
Some of these indicators were inspired by the user research conducted in the early stages of the design. Through interviewing potential users, we often heard, for example, stories of the struggles that early career researchers face in order to emerge, the difficulties that older scholars face when dealing with new technologies and of the importance that the SSH scholars place on the definitions of disciplines. Here, we see a further clear connection between the practice-led approach of making a new artefact (i.e., the outcomes of the user-centered design of GoTriple) and the process of making sense of it. The discussion on diversity also clearly connects with what is seen in the literature review about alternative metrics for, e.g., Open Science, which have a strong focus on diversity and inclusivity.
The team agreed that the goal was not necessarily to achieve a certain balance or representation from the outset, for example a perfect balance between female and male users but to use the indicator to assess the current balance and take action in case of a clear unhealthy unbalance. The same goes for the other indicators. For example, GoTriple is aimed at all SSH scholars at all career levels. If for instance we had observed that we had a very low number, of e.g., PhD students enrolled versus people at the top of their career (e.g., professors), then this could give us a stimulus to look more into this, understand why, and then foster better and tailored communication for the under-represented category of users and achieve better diversity. It thus is clear that the “compass” is not a hard-wired KPI, where achieving a certain balance is a measurable objective of a performance in itself. Instead, it is a measure of the current situation, providing knowledge to the platform managers on where and potentially how to take actions.
Beyond diversity, during the second meeting, we also discussed other indicators, initially under the label of “technical indicators”; later (see next section) this label had been changed to better reflect our goals. The initial proposed indicators under this label included:
These two potential indicators are reflective of the multilingual nature of GoTriple. In addition, we did not speak of balance here, as clearly it is not possible to have a balance of documents in different languages. However, the idea was to have an indication of representation for each of the languages supported by the platform. Moreover, there is an emphasis on making sure that languages that perhaps have less strength in terms of, e.g., publications (e.g., Croatian), are represented sufficiently in the material discoverable through GoTriple.
A third area discussed was related to the label collaboration. Indeed, one of the goals of GoTriple is to foster collaboration across SSH and make sure that the users can do things together, across disciplines. The following potential indicators were initially discussed:
The number and types of interactions between users
Whether there is a dense relationship or not, based on a network analysis
The number of times the user looks at other profiles
The use of innovative services
Some of these indicators still appeared rather vague during the meeting’s discussion. For example, the number and types of interactions was just a signpost we could use to better figure out what kind of interactions are possible via GoTriple. For example, sending a direct message to another user could be considered as a meaningful type of collaboration, as a user is trying to contact another user for a purpose. The indicator of “dense relationships” instead represents a potential measure of whether interactions on the platform are sustained and happen frequently, or if they are instead just a one-off event. However, this indicator was later abandoned as it would require further analysis, and it is thus not currently included in the current indicators. The number of times users look at profiles is an indicator that there is interest in looking at other people and what they are doing. Finally, the fourth indicator is related to the use of the GoTriple innovative services. Some of these services have their own user registration (separated from the platform registration), whilst others are embedded directly in the platform (such as the recommender system) and thus measuring the use of the innovative services would tell us which services are providing added value to our user community.
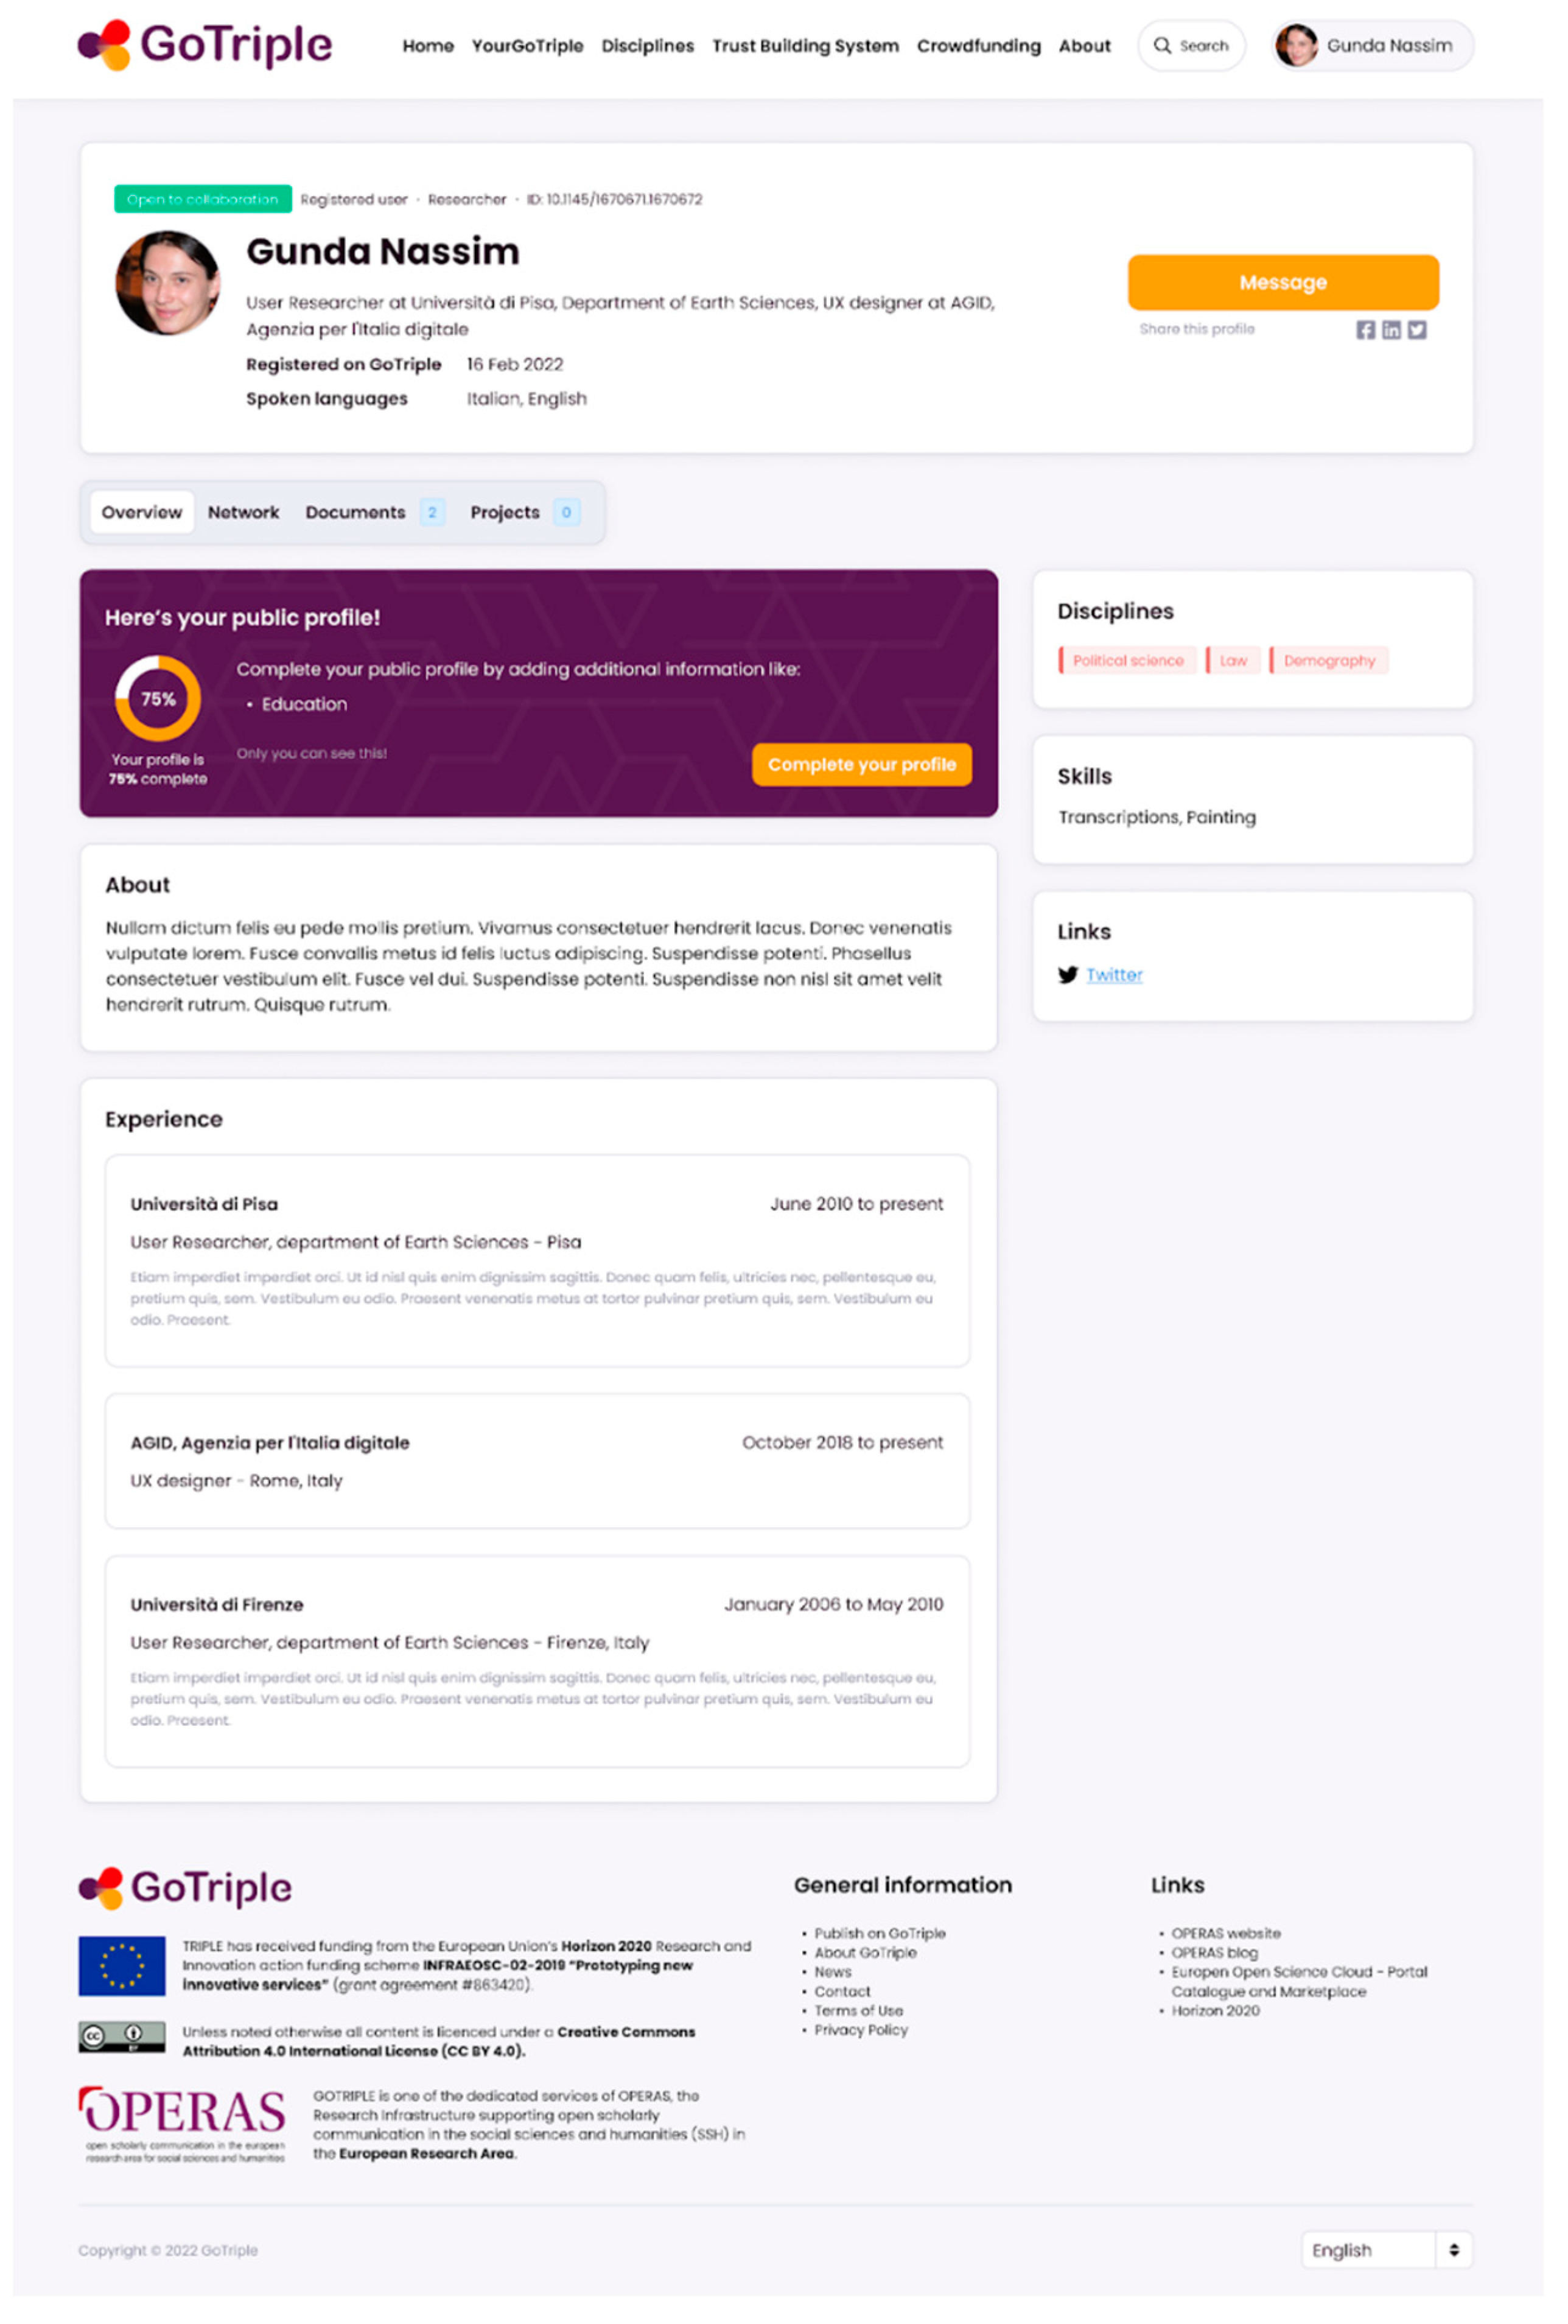
While much of this second meeting was devoted to fleshing out some initial potential indicators, a brief discussion also ensued on “how” to measure some of them. For example, some indicators could be measured through data collected at the moment of the user registration process or from information that could become available from the GoTriple user profiles. For example, through the completion of their GoTriple profiles (see an example in
Figure 3), users could insert information about themselves, including, e.g., their title, position, gender, and so on. Other indicators (in particular those related with publications) could be measured from the metadata available from the Isidore search engine, which include, e.g., the discipline or the language of a publication. Moreover, other information could be retrieved from the web analytics tools of GoTriple. These analytics tools have been set up for the traditional purposes of monitoring the use of the platform, but clearly, they can also provide data relevant for measuring the compass indicators.
4.3. Refining the Compassess and How to Take Action
Having provided an initial definition of potential compass indicators, the team started to reflect on how to improve them, if there were more indicators to consider and if some of the already proposed indicators could be abandoned (either because they were not very meaningful or too difficult to measure). Discussion in the subsequent three meetings allowed the team to refine the broad categories of the compass indicators. In particular, one of these meetings entailed an intense discussion with the platform developers in order to have a clear idea of what could and could not be measured.
The first essential outcome of these meeting has been the definition of the final four broad categories of the indicators, as follows:
The broad categories of “diversity and inclusivity” and “collaboration” were kept from the previous discussion. Moreover, the group decided that what were earlier defined as “technical indicators” were not reflective of the strong user dimension of GoTriple. A decision was taken to rename this as “platform usage”. A decision was further taken to include a fourth broad category, mostly to measure the user retention (that is a measure of the continued use of the platform), and this was called “User experience quality”.
With the broad categories at hand, detailed compass indicators have then been identified for each of them.
Table A1 in the
Appendix A shows all the compass indicators defined for GoTriple. Some indicators, as we have discussed previously, had already been defined in the initial meetings (and were at this stage refined); others were further proposed and accepted. We will comment now on some of these indicators, to give an idea of the underlying thinking. Readers can consult
Table A1 for the complete list.
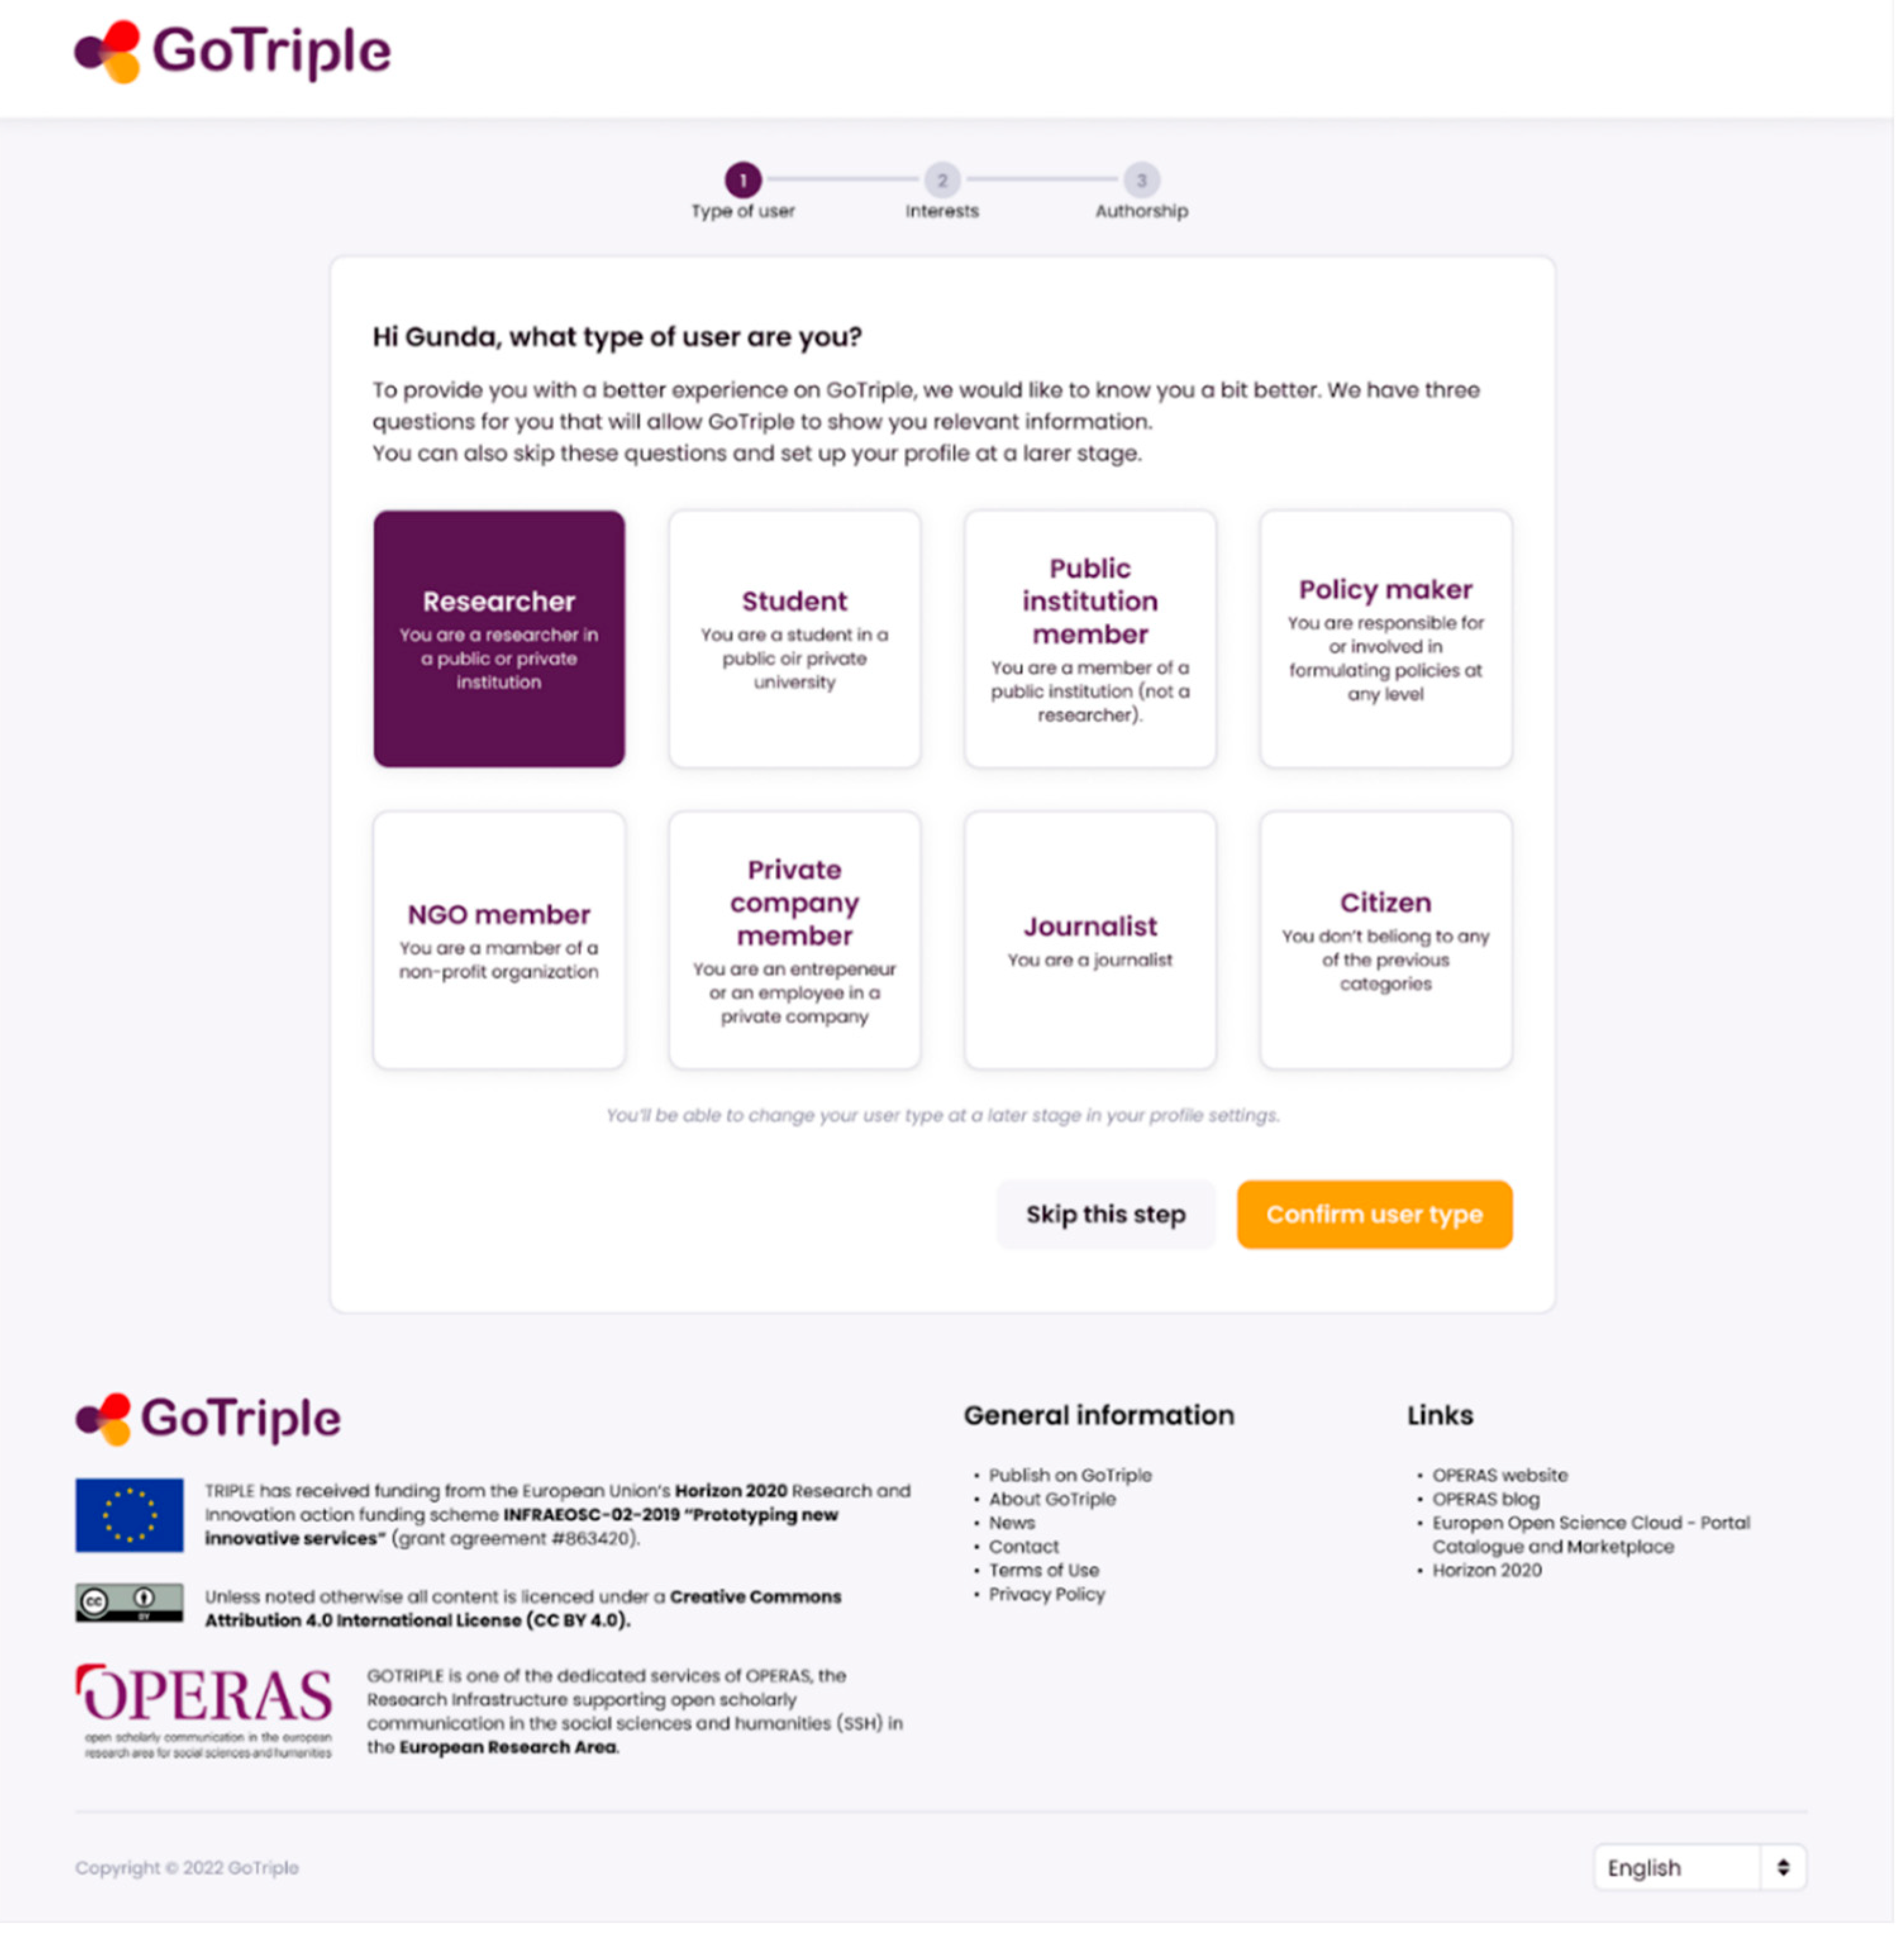
For example, the “user type” compass indicator under the “diversity and inclusivity” category captures whether the user is a researcher/academic or another category of user such as a journalist, an individual from the private sector, or an individual from an NGO, for example. This indicator could indeed further enhance the understanding of the diversity in the user base and tell us if GoTriple has managed to entice users beyond research and academia. This information (the type of user) is provided by the user at the time of registration (see
Figure 4). Additionally, for another example, we decided to adopt the indicator “number of followed/following” within the collaboration category. This can tell us something about how the network develops on the platform and how users are engaging with others. It indicates the activity of interaction among users.
Alongside the definition of the specific indicators, a discussion took place in relation to the “type of action” that could be taken based on the knowledge gathered from the compass indicators and also “how” actions could be taken to modify/improve the situation. We should remember again that these indicators were developed with the declared goal to tell us the “direction of travel” of GoTriple and to offer knowledge to take actions to steer this direction differently where necessary. It is worth commenting on some of these elements to provide clarity on the undying thinking.
For example, in the category of diversity and inclusivity, for the indicator “gender” what we are seeking to measure is the balance in the user base of female and male user. This ideally will be carried out using some baseline data to compare the data, i.e., by using baseline data of the gender balance of SSH in Europe. Should the indicator offer a picture of an imbalance, then direct action will be taken to promote the platform more to, e.g., male scholars, with targeted advertising on social media for example. Indeed, if the indicator is very different from the EU SSH gender balance, it means the platform is not inclusive enough on this specific aspect, and we should carry out some research to understand why, before acting. Similar to this is the plan for the indicator “location” (that is the location of the user, i.e., the city where the user is based). This is a proxy for us to understand in which country a user is based (e.g., a user with the location Rome could be assumed to be working in Italy) and this is information that the user could include in their profile. This information can tell us about the spread of the user base across Europe, if GoTriple has coverage of all the countries, and if there is reasonable representation. Again, this indicator could then be compared with a potential baseline (if available), e.g., the number of SSH scholars in each country, to better understand the representation. Should the indicator tell us that there are countries which are under-represented, then actions could be taken with promotional activities such as mailing lists or events in the local/national language. Variation in the time of the actions could also help the team understand the effect of the promotional activities.
In the category of “platform usage”, particular attention was applied to assess the multilingual aspect of GoTriple. For example, the “document language” indicator captures whether the search function facilitates discovery of documents in all the languages supported. If this is not the case (compared to what should be the expected numbers), then action could be taken, for example in the form of increasing the number of Open Access repositories harvested by GoTriple in the under-represented languages. The expected number is given by a measure of the languages of documents given by regular searches and the number of documents that the user clicks on (on this second aspect, it is possible with an analytics tool to track the language of the clicked document). This would then allow for better coverage of the under-represented languages and ideally increase the number of publications available in that said languages.
Similarly, for the category “collaboration”, the compass indicator “profiles clicks” measures the access of users to other users’ profiles. This is seen as a proxy to measure the fact that users are trying to establish potential connections, discover other people to collaborate with, and ideally decide to make contact with them. Through the platform analytics, it is possible to measure the number of profiles clicks and also see what kind of profiles are the most clicked. Should we assess that the profiles as not being used enough or that only some categories of users are receiving relevant clicks whilst others lag behind, then again, some forms of action could be taken. Possible actions include: (1) making the profiles more visible in the search results; (2) making the profiles stand out more on the home page; (3) improve the quality of the profile page and data; (4) and increase the number of profiles.
Overall, from these examples, we see the approach that was adopted: each compass indicator is accompanied by a definition of what kind of actions could/should be taken in order to improve the indicator, as well as how this will be achieved with a definition of activities.
4.4. Automation and Dashboard
During the last meetings, discussions also ensued on the actual process of gathering the measures (i.e., the data) for the compass indicators. The initial idea was to have an ad hoc process with the measures essentially collected manually from the GoTriple database (roughly every 7 months, as this was the period stipulated in the project task to report the results). Some participants at the meetings voiced, however, considerations on the lack of sustainability for this approach and they also drew attention to the labor intensity of a manual ad hoc process. The discussion then pivoted on the merits of instead having a fully automated process. Meanwhile, as we briefly discussed earlier, some indicators could be obtained directly through the GoTriple analytics tools (and could hence already be automated), while others would necessarily require access to information held in the GoTriple database. To make the measurement of compass indicators sustainable over time, the team therefore agreed to implement a process of automating the gathering of the indicator data, in particular, those outside the analytics and related to database information. Automating the process was seen as having some advantages. Firstly, whilst it would require an initial investment of time, this investment would however allow for the better sustainability of the compass indicators in the long term, since the process would then be in place and functioning with minimal maintenance and/or resources. Secondly, automating the process could allow the team to use these indicators to create visualizations. This would allow one or more dashboards to be built, all the indicators to be gathered in one place and for the use visualizations to derive potential insights for supporting decision-making. Moreover, the internal discussion also highlighted the potential opportunity to bring back some of these visualizations directly within the GoTriple platform and to the users. Indeed, a public dashboard with some relevant indicators could be realized showcasing how the platform is doing in certain areas, such as the country balance, or the balance of languages and so on. This will also have the advantage of sharing some of the compass indicators with the users and, as a consequence, potentially empower the user community to take direct action. Currently an initial version of the dashboard is available only for internal use (see
Figure 5), covering a limited set of indicators, in particular those gathering data that are available from the analytics tools. For building other indicators with the data from the GoTriple database, additional work will be necessary, with the need to create ad hoc Python scripts as well as tailored visualizations. At the time of writing, work has started to implement these scripts and we expect to have initial working versions of all these indicators by early 2023. Additionally of note is that the user engagement and onboarding of GoTriple are also planned to take place from December 2022 and therefore most of the defined indicators cannot be measured as of yet and require the building and presence of a community of registered users.
5. Discussion
There is consensus that measuring the success of Open Science initiatives and platforms requires moving away from traditional bibliographic metrics to embrace alternative metrics, encompassing aspects such as inclusivity or sustainability. There is indeed debate on how to develop metrics that are appropriate to capture the specific nature of Open Science, aimed at building better scientific cooperation and wider access to knowledge through digital technologies. In this paper, we proposed the concept of
compass indicators, as a potential avenue to understand success in a localized Open Science platform and community. This concept is the outcome of the practice-led work of designing and developing a discovery platform (GoTriple) for SSH in Europe. Compass indicators could be seen as modest indicators, as they do not seek to target performance necessarily, but rather offer insights into the direction of travel of a project. We also need to remember that in practice-led research, new knowledge is generated through the process of making things. We have been involved in the production of GoTriple and the need to measure its success connects to the task of reflecting on how GoTriple is used and understood. Therefore, the concept of compass indicators is not something derived from theory assumptions but is an emergent component of the practice of making GoTriple. Things come together (such as the interface design, the software, the data collection, the building of a user base, the meetings of the project team, etc.) whereby separate elements of the practice-led work for making a platform “mix themselves in their joint effect, so that we can see their agency in action in that effect”. [
42] (p. 4).
We can now formally define compass indicators as indicators that can tell the “direction of travel” of a project (in this case an Open Science discovery platform) and that allow the promoters of such a project to take actions in order to steer or change this direction. They are not therefore a measure of performance but a measure of direction. For instance, GoTriple is a European platform for SSH research and as such it strives to achieve diversity and inclusion which may require, for example, having a good balance of representation for scholars at different stages of their career, having a representation of all European countries in the user base or having a good representation of documents in the different languages supported by the platform. However, success is not in the achievement of, e.g., a target balance or representation, but rather on the understanding of how the project is doing and whether some actions need to be taken. A compass indicator effectively: (1) tells us what the current situation is (e.g., the current representation of countries in the user base); (2) signals the project team to whether some action may need to be taken (e.g., an assessment that there is under-representation of certain countries, based on existing knowledge about the number of SSH scholars in each country); (3) proposes some potential actions that can be taken to improve the situation and steer “the direction of travel” of the project (e.g., run communication campaigns aimed at the under-represented countries, for example in the national language, to enroll more users); and (4) allows to re-evaluate the effects of the action on the indicators after some time and assess if further actions are needed. Achieving, e.g., a balance or representation (of e.g., countries), is not therefore the ultimate goal; the goal is to travel toward that balance.
It has been a clear outcome of our practice to detach success from the idea of hard-wired targets that need to be achieved and met (such as KPIs). Of course, the aim is still to, e.g., achieve a good balance of inclusivity and diversity in several areas, or, e.g., have a balanced platform usage, but the direction of travel is more important than the achievement of a measure, even if there is an imbalance in the first place this is not seen as something unsuccessful. Success in itself is the realization that, in some areas, more work is required to improve things such as the platform inclusivity/diversity, the usage, the collaboration, or the user experience quality. Compass indicators therefore put a different light on the meaning of success and see this as something dynamic, subject to changes and ideally improvements. Therefore, the “compass” label in our concept offers a strong analogy which serves as a reminder that success is most likely a journey, and indicators are the signposts of this journey.
It is useful to remember that in their proposition for next-generation metrics for Open Science, Wildson et al. [
13] proposed a set of criteria for generating robust metrics: (1) robustness; (2) humility; (3) transparency; (4) diversity, and (5) reflexivity. Our proposition for compass indicators embraces most of these criteria. We have seen how we seek to obtain the data that are available directly from the platform in order to support a robust process of data gathering (via automation and visualization). Whilst the indicators we propose are largely quantitative, expert judgement will be exercised on them by the project team in order to make decisions for action. Moreover, initial knowledge for some indicators was derived by qualitative research conducted for the platform design. We plan to exercise transparency by bringing back the indicators to the GoTriple users via a public dashboard with the intent to empower the users in understanding how the project is doing in areas such as, e.g., inclusivity. Much emphasis on the definition of our indicators was placed on diversity and inclusion, especially around the composition of the user base and the language representation. Compass indicators more than targets are providing material to the project team as well as the platform users to reflect on the trajectory of the platform and to offer insights to take actions.
We have also seen that much of the existing propositions around metrics for Open Science take a rather global or macro approach for the definition of metrics (e.g., [
20,
24]). However, these propositions offer little insight on how to measure the success of Open Science at the level of a single, perhaps small, project, where the health of a user community is a primary concern and where the achievement of Open Science is a rather situated endeavor. Compass indicators have a localized nature and are again more modest than macro indicators. Nonetheless, they serve an important function, which is supporting project teams in their decision-making. In this sense, they are more similar to the processes of measuring the health of Open Source communities [
32], as they are targeted at a specific project/community and their merit exists within that context.
It is also important to recognize the debate about the adoption of qualitative indicators for Open Science, e.g., [
13,
14], alongside quantitative ones, which was briefly mentioned in the introduction. Small projects such as GoTriple have to consider the limits of their resources. Therefore, our position in this debate is that practical considerations should guide what kind of indicators should be adopted, rather than, e.g., epistemological reasons. In our case, we agreed for numerical/quantitative indicators as a way of offsetting the cost in terms of resources for maintaining our measures in the long term. The approach we propose has the advantage of allowing to us to conduct measures with very limited resources. On the other hand, maintaining qualitative indicators would require substantial research work for gathering the data on a continuous basis. This is something which was not seen as sustainable in the long term for us.
Overall, there are some lessons that can be learned from this experience for other Open Science digital platforms which focus on offering services to end-users. The first is to adopt a modest approach to measure success, looking at this as a journey and not as a hard measure to be achieved. It is therefore not a matter of performance but of reflection on the evolution of a project and its contribution to Open Science. The second lesson is to always keep the user at the center, seeking to develop measures that can support both an understanding of the user community and that can be brought back to the community to foster a dialogue with them. The third lesson is to reuse existing data as much as possible. This has advantages in terms of the sustainability of the process as well as supporting better reflexivity on the current evolution of the user community. The reuse of existing data allows further reflection but also restitution to the user for example with visualizations.


